Article

An Assessment of Drought Stress in Tea Estates Using Optical and Thermal Remote Sensing

1
Graduate School of Life and Environmental Sciences, University of Tsukuba, Ibaraki 305-8572, Japan
2
Faculty of Agriculture, Sylhet Agricultural University, Sylhet 3100, Bangladesh
3
Faculty of Life and Environmental Sciences, University of Tsukuba, Ibaraki 305-8572, Japan
*
Author to whom correspondence should be addressed.
Remote Sens. 2021, 13(14), 2730; https://doi.org/10.3390/rs13142730
Submission received: 9 June 2021 / Revised: 8 July 2021 / Accepted: 9 July 2021 / Published: 12 July 2021

Abstract

:
Drought is one of the detrimental climatic factors that affects the productivity and quality of tea by limiting the growth and development of the plants. The aim of this research was to determine drought stress in tea estates using a remote sensing technique with the standardized precipitation index (SPI). Landsat 8 OLI/TIRS images were processed to measure the land surface temperature (LST) and soil moisture index (SMI). Maps for the normalized difference moisture index (NDMI), normalized difference vegetation index (NDVI), and leaf area index (LAI), as well as yield maps, were developed from Sentinel-2 satellite images. The drought frequency was calculated from the classification of droughts utilizing the SPI. The results of this study show that the drought frequency for the Sylhet station was 38.46% for near-normal, 35.90% for normal, and 25.64% for moderately dry months. In contrast, the Sreemangal station demonstrated frequencies of 28.21%, 41.02%, and 30.77% for near-normal, normal, and moderately dry months, respectively. The correlation coefficients between the SMI and NDMI were 0.84, 0.77, and 0.79 for the drought periods of 2018–2019, 2019–2020 and 2020–2021, respectively, indicating a strong relationship between soil and plant canopy moisture. The results of yield prediction with respect to drought stress in tea estates demonstrate that 61%, 60%, and 60% of estates in the study area had lower yields than the actual yield during the drought period, which accounted for 7.72%, 11.92%, and 12.52% yield losses in 2018, 2019, and 2020, respectively. This research suggests that satellite remote sensing with the SPI could be a valuable tool for land use planners, policy makers, and scientists to measure drought stress in tea estates.

Graphical Abstract

1. Introduction

Drought is one of the most deleterious climatic factors with regard to the changing climate that influences the growth of plants and ultimately affects the sustainable production of tea [1,2]. Drought influences plant physiological processes more than other environmental factors, altering cellular mechanisms and finally affecting the crop growth, productivity, and quality of tea [3,4]. The duration and magnitude of drought severity affects the yield and quality of tea, and the losses of crop yield caused by drought stress are becoming frequent and unpredictable because of climate change and increasing water stress in tea estates [5]. Tea (Camellia sinensis (L) O. Kuntze) is an evergreen perennial shrub cultivated in a wide range of soil and climatic conditions across tropical, subtropical and Mediterranean regions [6,7]. Both the quality and yield of tea depend on several factors, such as cultivar, cultural practices, and growth stages of plants, along with climate and season. Tea is a rainfed plantation crop, and its productivity depends mainly on weather conditions for optimal growth. Therefore, changes in climate, especially a reduction in rainfall, cause drought that affects the production of tea [8]. Bangladesh is one of the major tea-producing countries, ranking 9th and producing 83 million kg of tea [9]. The tea industry of Bangladesh annually earns 20.90 million USD (0.81% of GDP), exporting approximately 18 million kilograms of tea (1.37% of the export of the global tea trade) [10]. One of the important reasons for the lower production of tea is adverse climatic conditions such as drought. The tea estates of Bangladesh primarily experience drought stress during the winter season from December to February [11]. It has been reported that drought stress causes yield loss in tea of 14–33%, and the rate of mortality, especially in young plants, ranges between 6 and 19% [6,12]. Hence, it is necessary to determine the drought severity in tea estates to take further initiatives to mitigate its adverse effects.
Droughts are predominantly classified into four categories: meteorological drought indicates a deficit in precipitation; agricultural drought denotes a deficit in soil moisture; hydrological drought implies a reduction in surface runoff, groundwater, and water storage; and socioeconomic drought involves supply and demand of economic goods with the elements of the other kinds of droughts as well as social responses. However, all types of droughts are associated with sustained precipitation deficits [13,14]. Several ground-based and remote sensing indicators with their advantages and limitations for drought monitoring and assessment are being used. Ground-based indicators incorporate information on precipitation, soil moisture status and water supply rather than emphasizing many spatial details. Furthermore, these drought indicators are measured for dispersed locations, and thus, the limitation of these indicators is that they are dependent on data collected from weather stations, resulting in sparsely distributed drought indicators, which affects the authenticity of the drought indices [15]. In contrast, remote sensing drought indicators are calculated using the surface reflectance of different bands derived from satellite data over the entire area and have been widely used for drought detection [16].
Historical drought indices are used to represent droughts in terms of duration, severity, and areal extent [17]. Several drought indicators, such as the standardized precipitation index (SPI), Palmer drought severity index (PDSI), standardized precipitation evapotranspiration index (SPEI), and effective drought index (EDI), have been derived and proposed to quantify the pattern and intensity of droughts. Among these indices, the SPI is the most widely used index with the advantages of its simplicity in use and spatial consistency in interpretation that can be used in drought risk assessment and decision analysis. Thus, the SPI can be used effectively for different time periods, from one month to several years, according to the user’s interest [18,19].
With advances in remote sensing technology, the use of historical drought indicators has been strengthened by newly developed remote sensing indicators with the advantage of real-time monitoring. Thus, the remote sensing technique is increasingly being considered a robust tool for drought stress assessment. From a climatological perspective, monitoring precipitation, soil moisture, ground and terrestrial water storage, evapotranspiration and snow are considered for both ground- and satellite-based drought monitoring; while from an ecological perspective, drought severity can be assessed by observing vegetation health and land cover using remote sensing data [13,20]. Different satellite-based drought indices, such as the normalized difference vegetation index (NDVI), soil-adjusted vegetation index (SAVI), enhanced vegetation index (EVI), normalized difference moisture index (NDMI), vegetation condition index (VCI), temperature condition index (TCI), perpendicular drought index (PDI), modified perpendicular drought index (MPDI), distance drought index (DDI), and soil moisture index (SMI), are widely used indicators for drought monitoring [13]. According to recent studies on drought monitoring, it is evident that vegetation water indices such as NDMI are more powerful than other vegetation indices, as they quantify the water content in the spongy mesophyll tissues of the plant canopy in higher-biomass ecosystems, which is directly related to the soil moisture status [21,22]. On the other hand, drought stress can be measured using surface brightness temperature derived from the thermal bands of various satellite instruments such as MODIS, AVHRR, VIIRS, TM, ETM+, and TIRS. Land surface temperature (LST) quantified from thermal infrared (TIR) channels has been observed to be a powerful index for providing valuable information on land surface moisture content, which is an indispensable tool to measure drought severity [23].
Multiple studies have been conducted for assessing and monitoring drought using remote sensing technology. A study on NDVI-based agricultural drought assessment was performed to measure drought severity in the Palar Basin in Tamil Nadu, India, using IRS (Indian Remote Sensing Satellites)-1C & 1D [24]. Another study was performed in the western tracts of Tamil Nadu using satellite datasets of the National Oceanic and Atmospheric Administration (NOAA) [25]. Drought assessment was performed for hickory plantations in western Zhejiang, China, using a change detection approach from multitemporal Landsat 8 imagery [26]. A study was performed to investigate vegetation droughts in natural forests and rubber and oil palm plantations in peninsular Malaysia using MODIS datasets [27]. Another study was carried out in South Africa to measure the influence of drought on forest plantations using MODIS time series and climate data, suggesting that the normalized difference moisture index (NDMI) is a robust indicator to understand the interactions among precipitation, soil moisture, and water content in the plant canopy [28]. A comprehensive study on the impacts of drought and other disturbances on forest landscapes in North Carolina, USA, was conducted using MODIS and Landsat datasets [29]. In addition to these, several studies have been conducted for small-scale drought monitoring in tea plantations using wireless sensor networks (WSNs) [30,31,32]. The WSN-based drought monitoring system is not suitable for large and remote areas in many developing countries, such as Bangladesh, due to the disruption in power supply and internet networks, which are the major obstructions in the sensor network system. These studies provide information regarding the research gap in measuring drought severity for tea plantations to a greater extent using satellite remote sensing techniques.
To the best of our knowledge, no studies regarding drought monitoring for tea plantations on a large scale have been performed to identify drought severity in tea estates using satellite remote sensing technology. Furthermore, no standard drought index method has been developed for assessing drought severity. Therefore, a comprehensive study utilizing weather station-based precipitation datasets and multisatellite remote sensing datasets to develop a drought classification system was undertaken. The aim of the present study was to characterize the spatiotemporal pattern of drought in tea estates and to develop a drought classification system for tea plantations to ensure early warning for risk mitigation and sustainable tea production in Bangladesh.

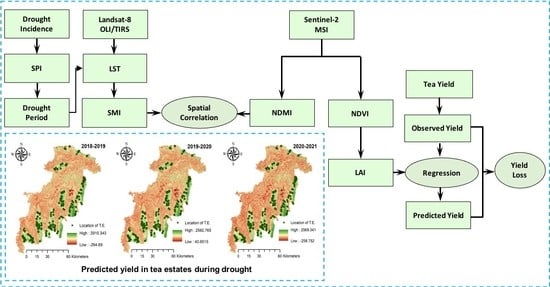
2. Materials and Methods
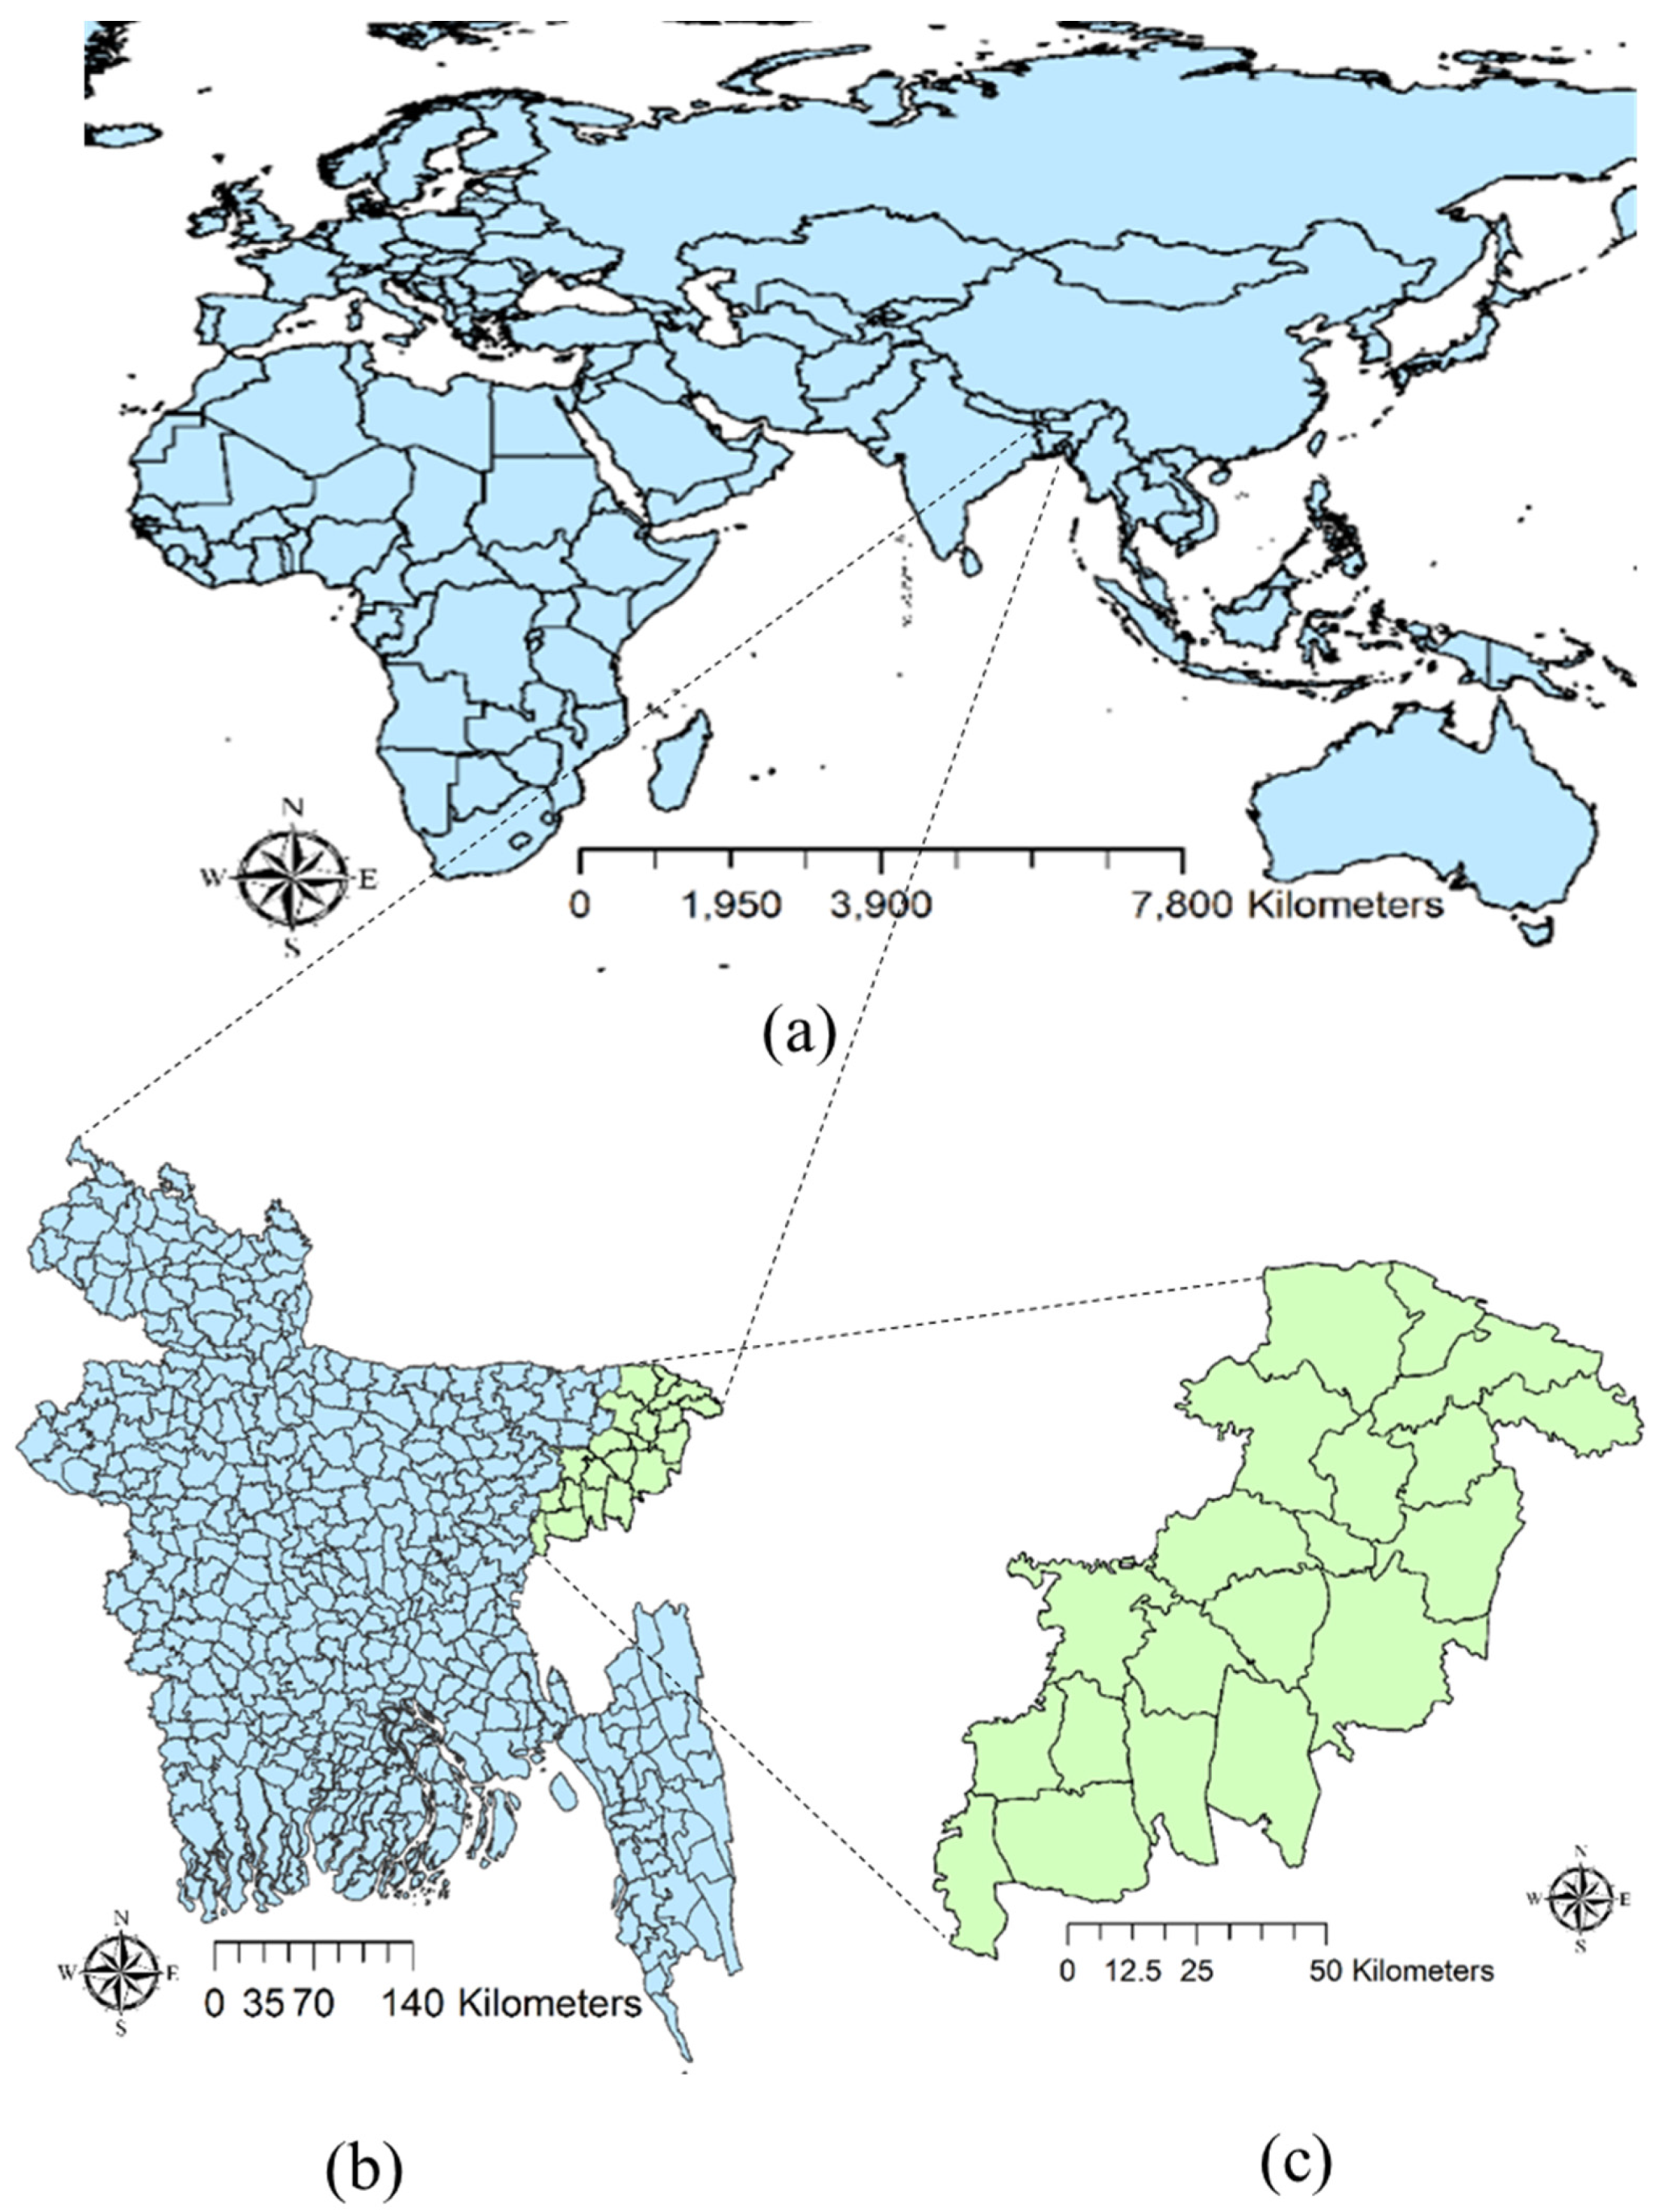
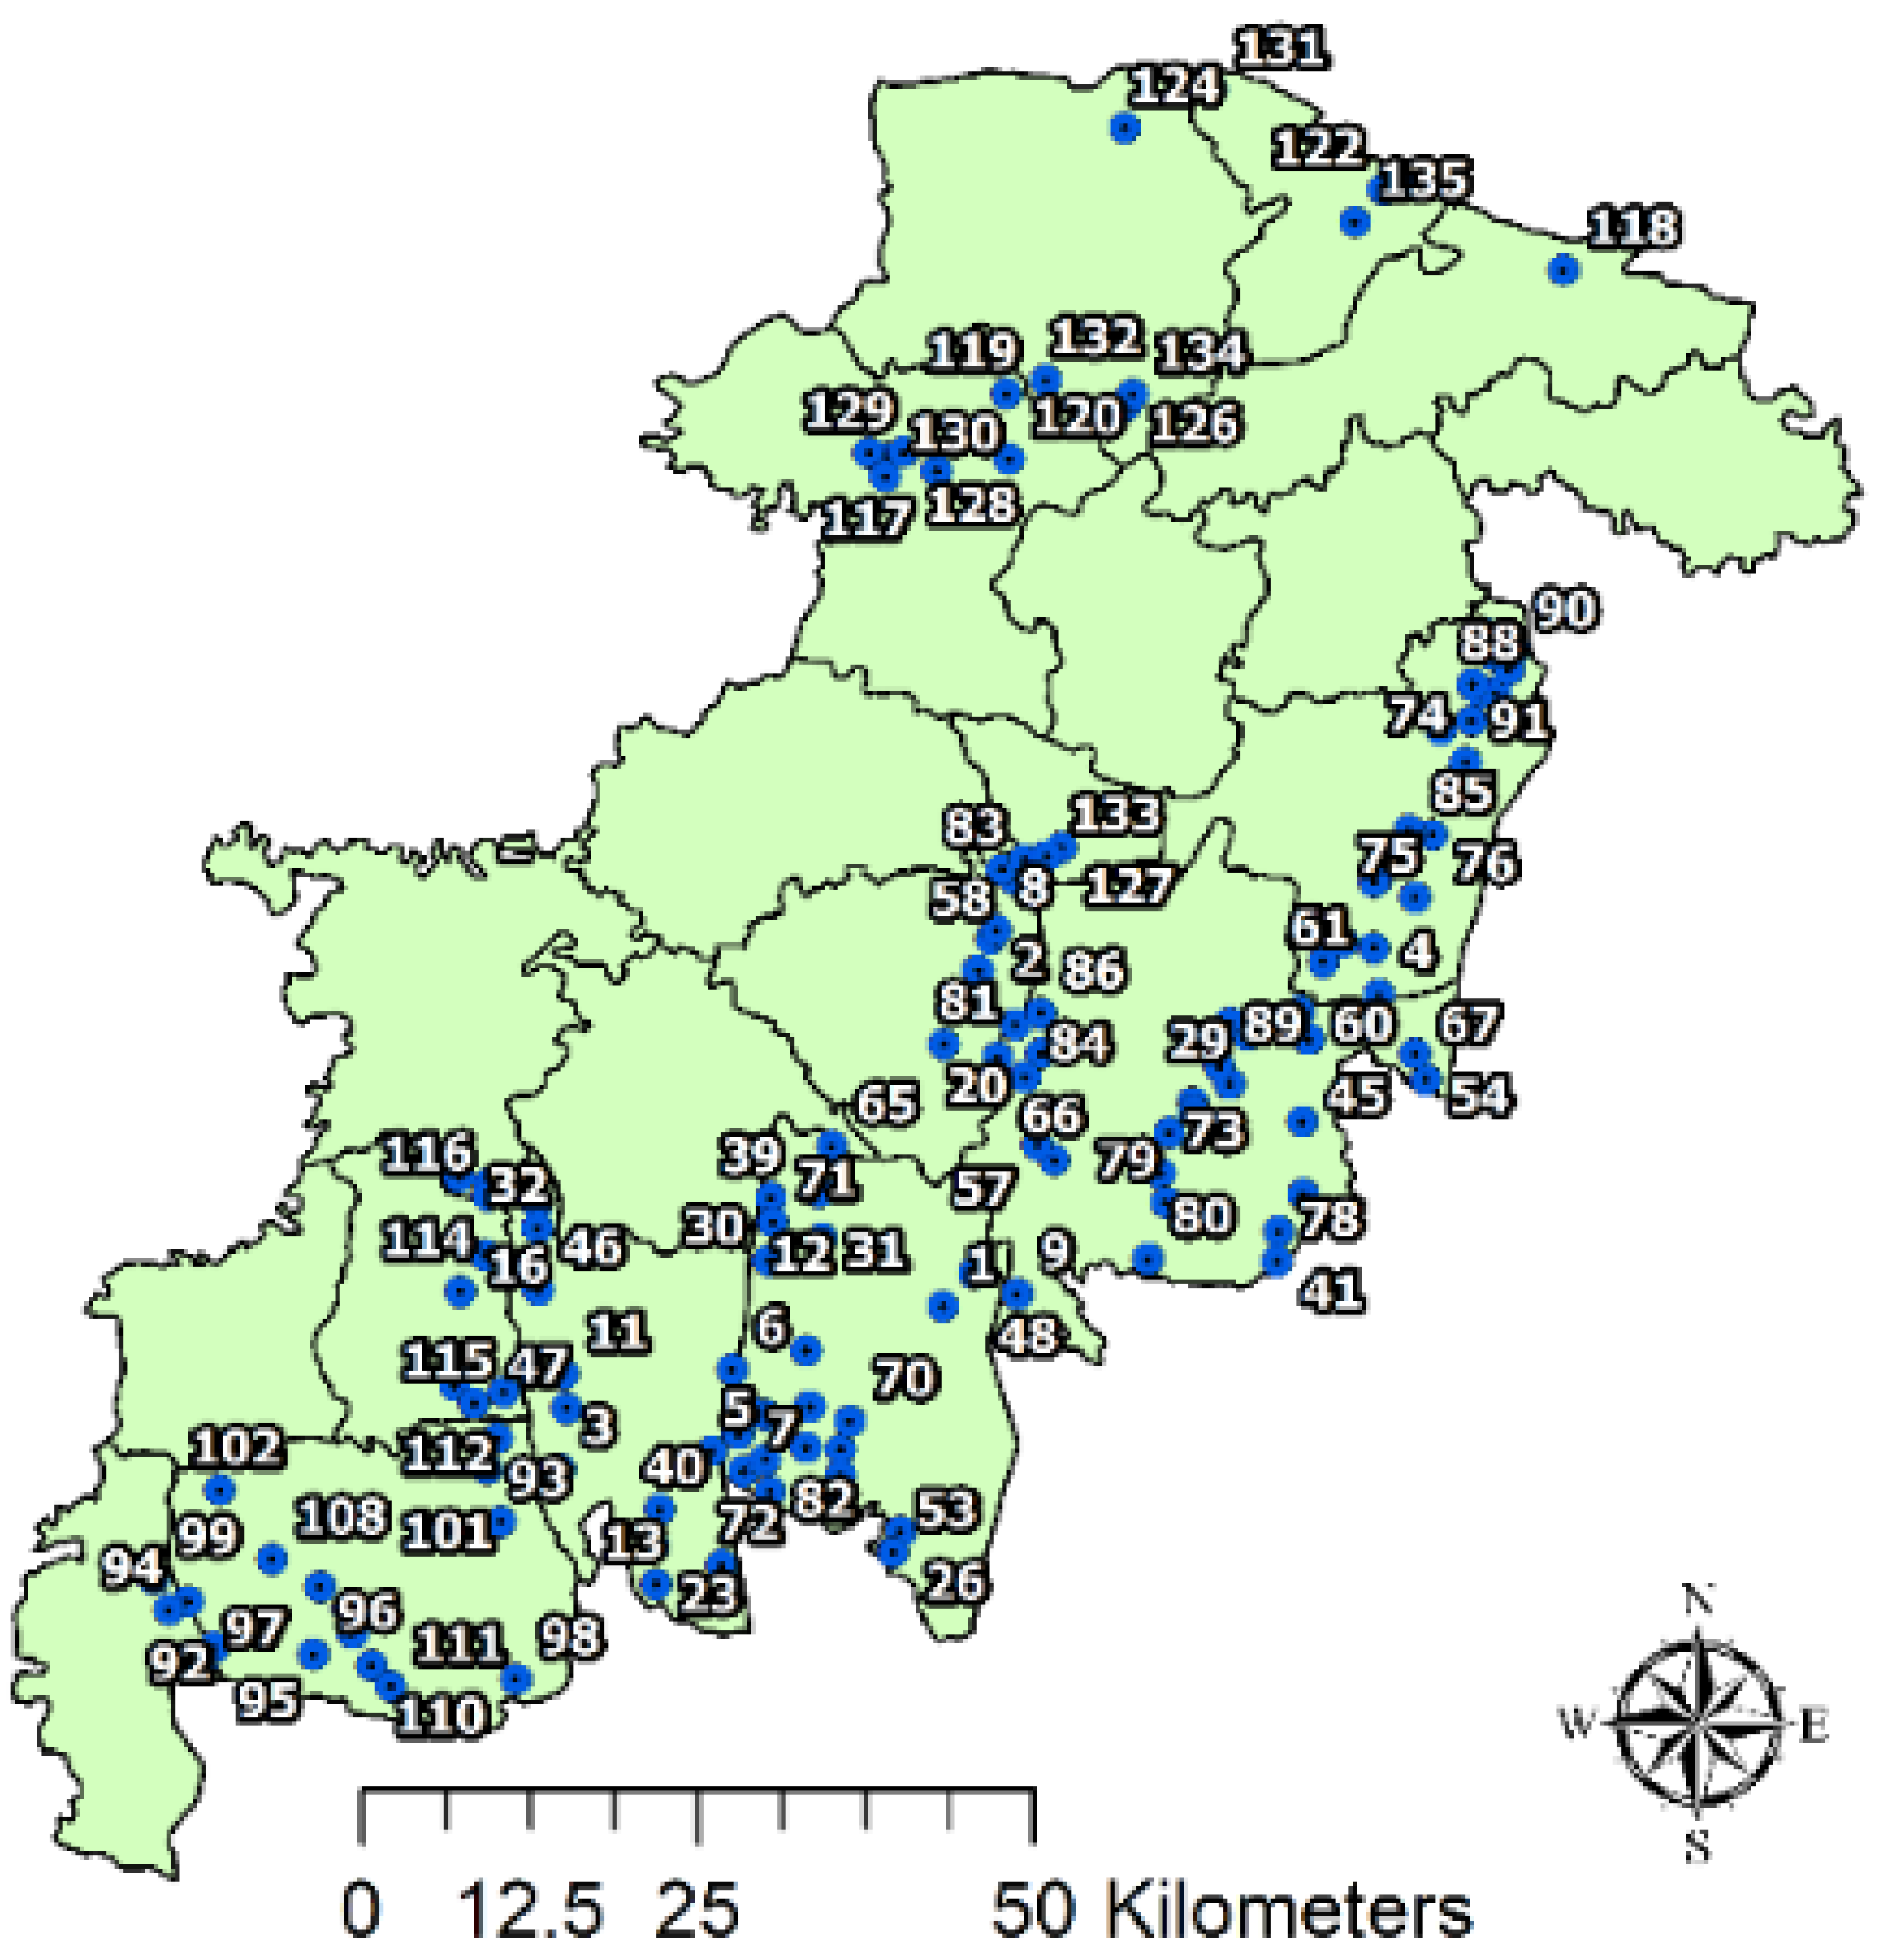
Precipitation data collected from the Bangladesh Meteorological Department (BMD) were utilized to calculate the SPI and drought frequency. Both Landsat 8 OLI/TIRS and Sentinel-2 MSI satellite imagery were used as remote sensing datasets. Ground reference geographic positioning system (GPS) information was gathered during the field survey to extract the points over tea plantation areas to quantify the SMI, NDMI, LAI, and predicted yields.

2.1. Study Area

The study area is considered to lie within the tea-growing zone between latitudes 23°58′40″ and 25°11′25″ north and longitudes 91°16′09″ and 92°30′17″ east, and is located in the northeastern part of Bangladesh and consists of 21 subdistricts in the Sylhet Division (Figure 1).
The subdistricts include Moulvibazar, Kamalganj, Kulaura, Rajnagar, Sreemangal, Barlekha and Juri in the Moulvibazar district; Habiganj, Bahubal, Chunarughat, Madhabpur and Nabiganj in the Habiganj district; and Sylhet, Balaganj, Beanibazar, Fenchuganj, Golapganj, Gowainghat, Jaintiapur, Kanaighat and Zakiganj in the Sylhet district. The area is bordered by the Indian provinces of Meghalaya, Assam, and Tripura to the north, east, and south, respectively, subdistricts of Companiganj, Chatak, Jagannathpur, Baniachung and Lakhai to the west, and the Division of Chattogram to the southwest. There are 135 tea estates in the study area with 98,413 hectares of land, contributing approximately 85% of the total tea production of the country (63.42 million kg, 2018) [33].
This area is characterized by a sufficient amount of rainfall and favorable temperatures during the monsoon season that are congenial for tea production, but experiences drought stress during the winter season (Figure 2).

2.2. Precipitation Data and the SPI Calculation

The daily precipitation data for the local weather stations, Sylhet and Sreemangal, which represent the rainfall scenario of the study area, were collected from the Bangladesh Meteorological Department to obtain the monthly precipitation sums. Drought monitoring was performed employing the monthly precipitation sums to calculate the standardized precipitation index (SPI) for January 2018 to March 2021. Positive SPI values indicate wet conditions, and negative values denote drought periods with less precipitation than normal [34]. The precipitation data gathered for the local weather stations were utilized to classify wet and dry conditions [35]. Drought characterization was performed using the SPI to measure the severity, duration, and monthly coverage of drought of each category [36]. The accumulated SPI values were utilized to classify the drought category. The SPI value, ≤−1, refers to SPI-1, SPI-3, SPI-6, and SPI-12. Thus, the negative SPI values represent the corresponding drought severity for quantitative assessment of drought [37,38,39]. The SPI-1 computation was performed for 2018–2019, 2019–2020, and 2020–2021 using monthly precipitation data to investigate future drought events. The monthly precipitation sums could be used further to calculate the SPI utilizing precipitation records of the Bangladesh Meteorological Department. Drought classification was performed according to Razali et al. 2016 [27].
The SPI in a cumulative distribution is expressed using the gamma function. The gamma distribution is used to define the probability density or the function of frequency [39]. The gamma distribution can be represented as follows:
G ( x i ) = 0 x i g ( x i ) d x i = 1 β α Γ ( α ) 0 x i t α 1 e x i β d x i
Here, α > 0 and β > 0 refer to the shape parameter and scale parameter, respectively [40].
x denotes the amount of precipitation in millimeters in consecutive months i, and Γ (α) is the gamma function. When xi = 0, the cumulative gamma distribution is unknown, and the cumulative probability is encountered. The SPI estimation also involves a matching density function of the gamma likelihood to the frequency distribution of precipitation.
α = 1 4 A ( 1 + 1 + 4 A 3 )
    β = x α
A = ln ( x )   ln ( x ) n
For an undefined gamma function, when x i = 0, the value of G ( x i ) is expressed as follows:
H ( x i ) = q + ( 1 q ) G ( x i )
where q is the probability of zero. Then, the cumulative probability H( x i ) is transformed to the standard normal distribution for the SPI value [39]. To calculate the SPI, the cumulative probability distribution is transformed into a normal distribution that can be expressed as follows:
z = S P I = ( t c 0 + c 1 t + c 2 t 2 1 + d 1 t + d 2 t 2 + d 3 t 3 )   ,     t = ln ( 1 ( H ( x ) ) 2 )
When 0 < H(x) < 0.5, the following expression is true.
z = S P I = + ( t c 0 + c 1 t + c 2 t 2 1 + d 1 t + d 2 t 2 + d 3 t 3 )   , t = ln ( 1 1 ( H ( x ) ) 2 )
The drought frequency was calculated according to the following formula:
Drought   frequency   ( % ) = Number   of   months   affected   by   drought Total   number   of   months × 100

2.3. Field Survey and Ground Reference Information

Ground reference information was collected during the 2019 field survey. GPS locations of tea estates were recorded around the study area using a handheld GPS locator (eTrex, Garmin, Olathe, AR, USA). Furthermore, this GPS information was used to extract point values from the remote sensing data employing the Spatial Analyst Tools in ArcGIS (Figure 3). According to the field survey, among the 135 tea estates in the study area, 91 were located in Moulvibazar, 25 in Habiganj and 19 in Sylhet District (Figure 4).

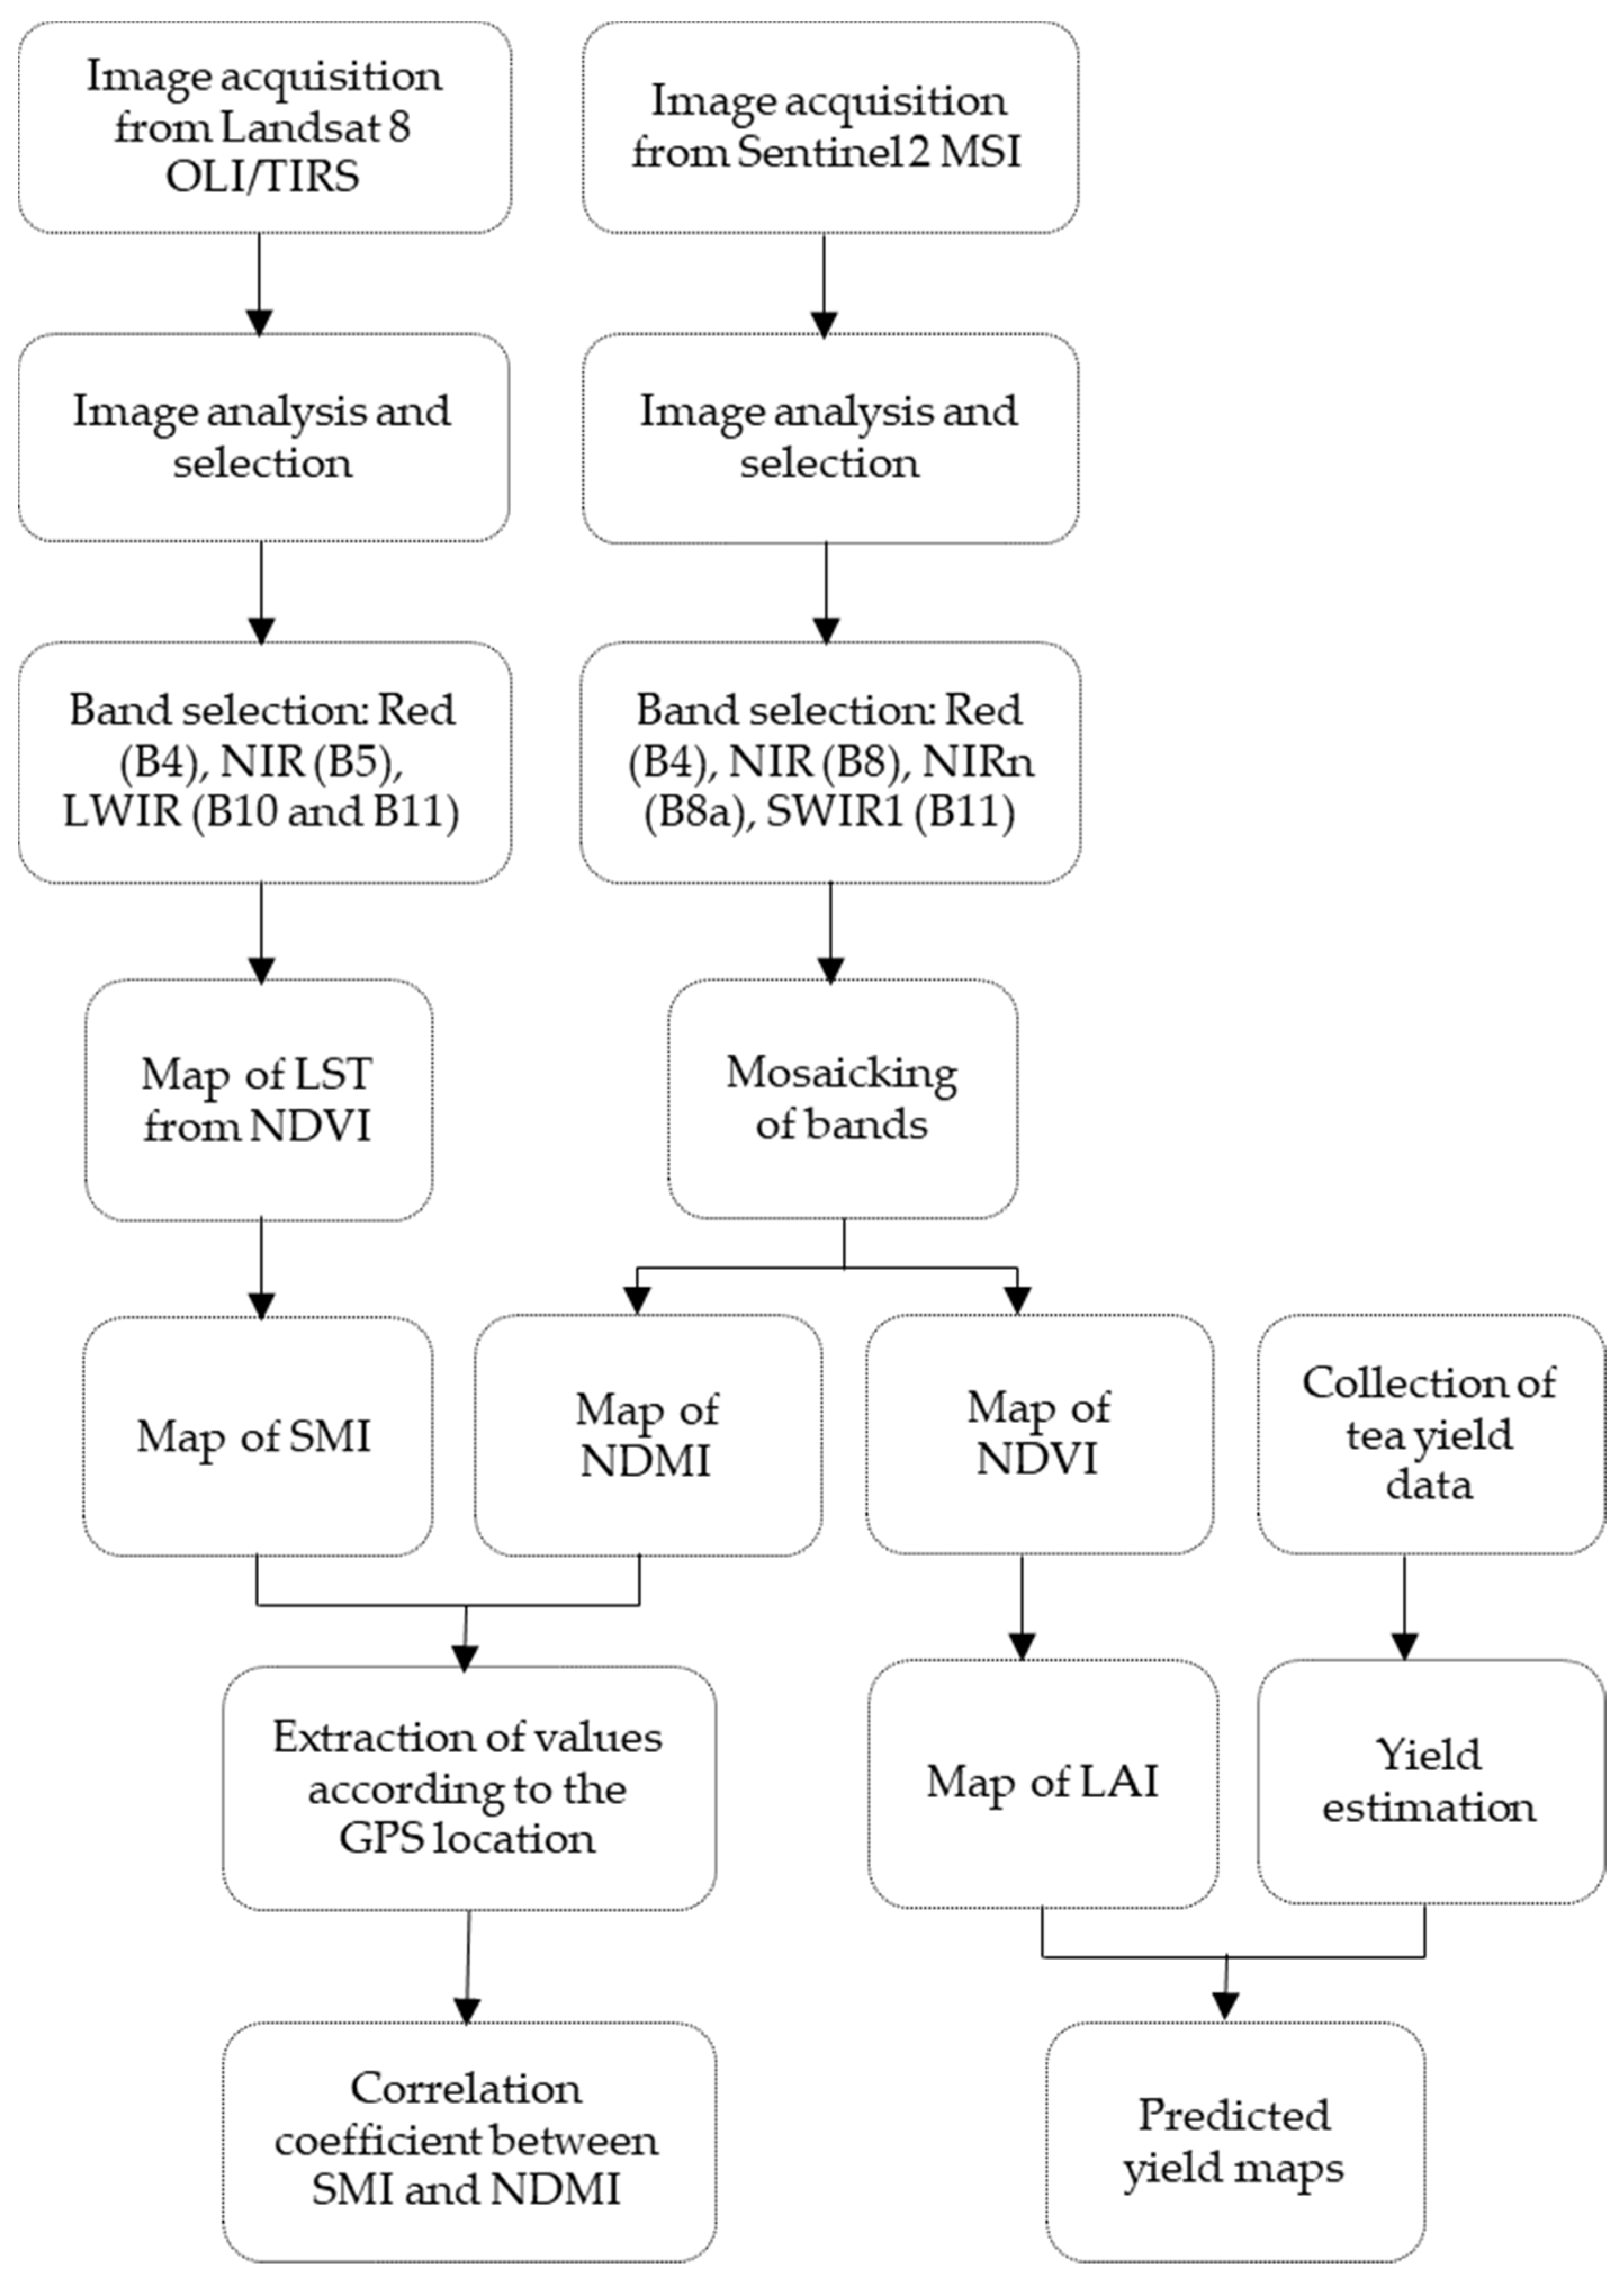
2.4. Remote Sensing Data

Multisatellite image data from the Landsat 8 OLI/TIRS and Sentinel-2 MSI were collected for drought estimation from December to February for the years 2018–2019, 2019–2020 and 2020–2021 (Figure 3). Landsat 8 is equipped with the OLI (Operational Land Imager) and TIRS (Thermal Infrared Sensor) instruments. The OLI sensor provides image data in the coastal aerosol, visible (blue, green and red), NIR (near-infrared), and SWIR (short-wave infrared) spectra with a spatial resolution of 30 m and in a panchromatic band with a spatial resolution of 15 m. The TIRS sensor provides image data in two thermal infrared bands with a spatial resolution of 100 m. The TIRS dataset, registered to the OLI data, consists of geometrically, radiometrically, and terrain-corrected 12-bit products. Landsat 8 C1 level-1 images with path 136 and row 43 were processed to develop LST and SMI maps. The collected Landsat 8 image data were processed at a resolution of 30 m using the resampling technique in ArcGIS followed by subsequent mosaicking and masking. All selected bands from Landsat 8 were resampled to a 30 m resolution for uniformity in cell size and data. Furthermore, an algebraic operation, radiometric calibration, and atmospheric and geometric corrections were performed on the raster images. The average reflectance for the raster images was calculated using the raster calculator tool to minimize the spatial variability. All selected bands from Sentinel-2 image data resampled to a 20 m resolution were used to develop NDMI, LAI, and yield maps. To calculate the LST, the NDVI was retrieved measuring the reflectance of near-infrared, and red bands from the data obtained from the optical sensors of Landsat 8 OLI, followed by the retrieval of the proportion vegetation (PV), as well as land surface emissivity (LSE). The spectral radiance was derived from the long-wave infrared (LWIR) bands obtained from the TIRS of Landsat 8, followed by measuring the brightness temperature (BT); and finally, the LST map was developed incorporating the values of PV and LSE with BT. On the other hand, the optical sensors from Sentinel-2 contributed to determining the NDMI and LAI, as well as predicted yield utilizing the visible (red), near-infrared, and short-wave infrared (SWIR) bands. All remote sensing indices were calculated from satellite data with less than 2% cloud cover for three consecutive years and analyzed in the ArcGIS® environment.

2.4.1. Estimation of Land Surface Temperature (LST)

Land surface temperature is a controlling parameter of canopy temperature and water content in vegetation that can be used effectively to monitor soil moisture in vegetated land [41]. LST was calculated for the tea estates using temporal information from the Landsat 8 OLI/TIRS dataset with less cloud coverage [42,43]. There were two steps involved in the estimation of the LST. First, the NDVI data were retrieved using two wave bands, near-infrared (B5) and red (B4), according to the following formula:
N D V I = R N I R R R E D R N I R + R R E D
PV was calculated using the NDVI, which can be expressed as follows:
P V = ( N D V I N D V I m i n N D V I m a x N D V I m i n ) 2
Here, NDVImin and NDVImax were obtained from the respective NDVI images. The LSE was retrieved from the PV and calculated according to the following expression [44]:
L S E = 0.004 P V + 0.986
In the second step, the thermal bands were transformed to digital numbers to calculate the radiance. The spectral radiance was calculated from the thermal bands (B10 and B11), which can be expressed as follows:
L λ = M L + Q C A L + A L L λ = 0.0003342 B a n d 10 + 0.1   a n d   L λ = 0.0003342 B a n d 11 + 0.1
where denotes the spectral radiance of the TOA (top of atmosphere) at the sensor aperture, ML is the multiplicative rescaling factor of the corresponding bands that were derived from the metadata, QCAL refers to the pixel values (DN) of the quantized and calibrated standard products, and AL is the additive rescaling factor of the specific band. The BT was calculated using the following expression:
B T = K 2 ln [ ( K 1 L λ ) + 1 ] 273.15
where BT denotes the satellite brightness temperature in Celsius. K1 and K2 refer to the calibration constants in Kelvin derived from the metadata of the thermal conversion constants of the respective bands. Finally, the LST was calculated using the following formula:
L S T = B T 1 + ( λ B T P V ) ln L S E

2.4.2. Estimation of Soil Moisture Index (SMI)

Soil moisture is a potential determinant to understand drought severity and is primarily driven by precipitation through the process of infiltration as well as evapotranspiration [45,46]. Soil moisture is variable both spatially and temporally due to differences in soil properties and drainage [47]. Among various indices, the LST-based SMI is a widely used index to monitor soil moisture in vegetated land. The SMI is the proportion of the difference between the current soil moisture and the permanent wilting point to the field capacity as well as the residual soil moisture [48]. The value of the SMI ranges between 0 and 1, where 0 refers to very dry conditions and 1 denotes extremely wet conditions. The SMI is associated with the derived LST of a particular area that can be calculated using the following expression:
S M I = L S T m a x L S T L S T m a x L S T m i n
where LSTmax and LSTmin refer to the maximum and minimum surface temperatures of the study area, respectively.

2.4.3. Estimation of Normalized Difference Moisture Index (NDMI)

The normalized difference moisture index determines the liquid water molecules in plant canopies that interact with solar radiation, and thus, water deficit results in a decrease in photosynthesis affecting the growth and development of plants [49]. The NDMI is a measure of water content in the spongy mesophyll tissues of vegetation canopies, which acts as a functioning indicator of climate and soil properties regulating water availability. The NDMI responds to variations in both water content (absorption of B8a) and spongy mesophyll tissues in plant canopies (reflectance of B11) [50,51]. The NDMI was calculated from Sentinel 2 satellite images using the following formula [52]:
N D M I = N I R n S W I R 1 N I R n + S W I R 1 = B 8 a B 11 B 8 a + B 11
where NIRn is the near-infrared (narrow) reflectance of B8a with wavelengths ranging from 855 to 875 nm and SWIR1 is the shortwave infrared reflectance of B11 with wavelengths of 1565–1655 nm.

2.5. Statistical Analysis

Mean values per pixel of individual estates were used for drought stress assessment in tea estates. Pearson correlation analyses were performed to assess the relationship between the soil moisture and vegetation canopy moisture. Simple Linear Regression analyses were also performed to show the association of the LAI and time-series yield information for yield prediction in the drought season.

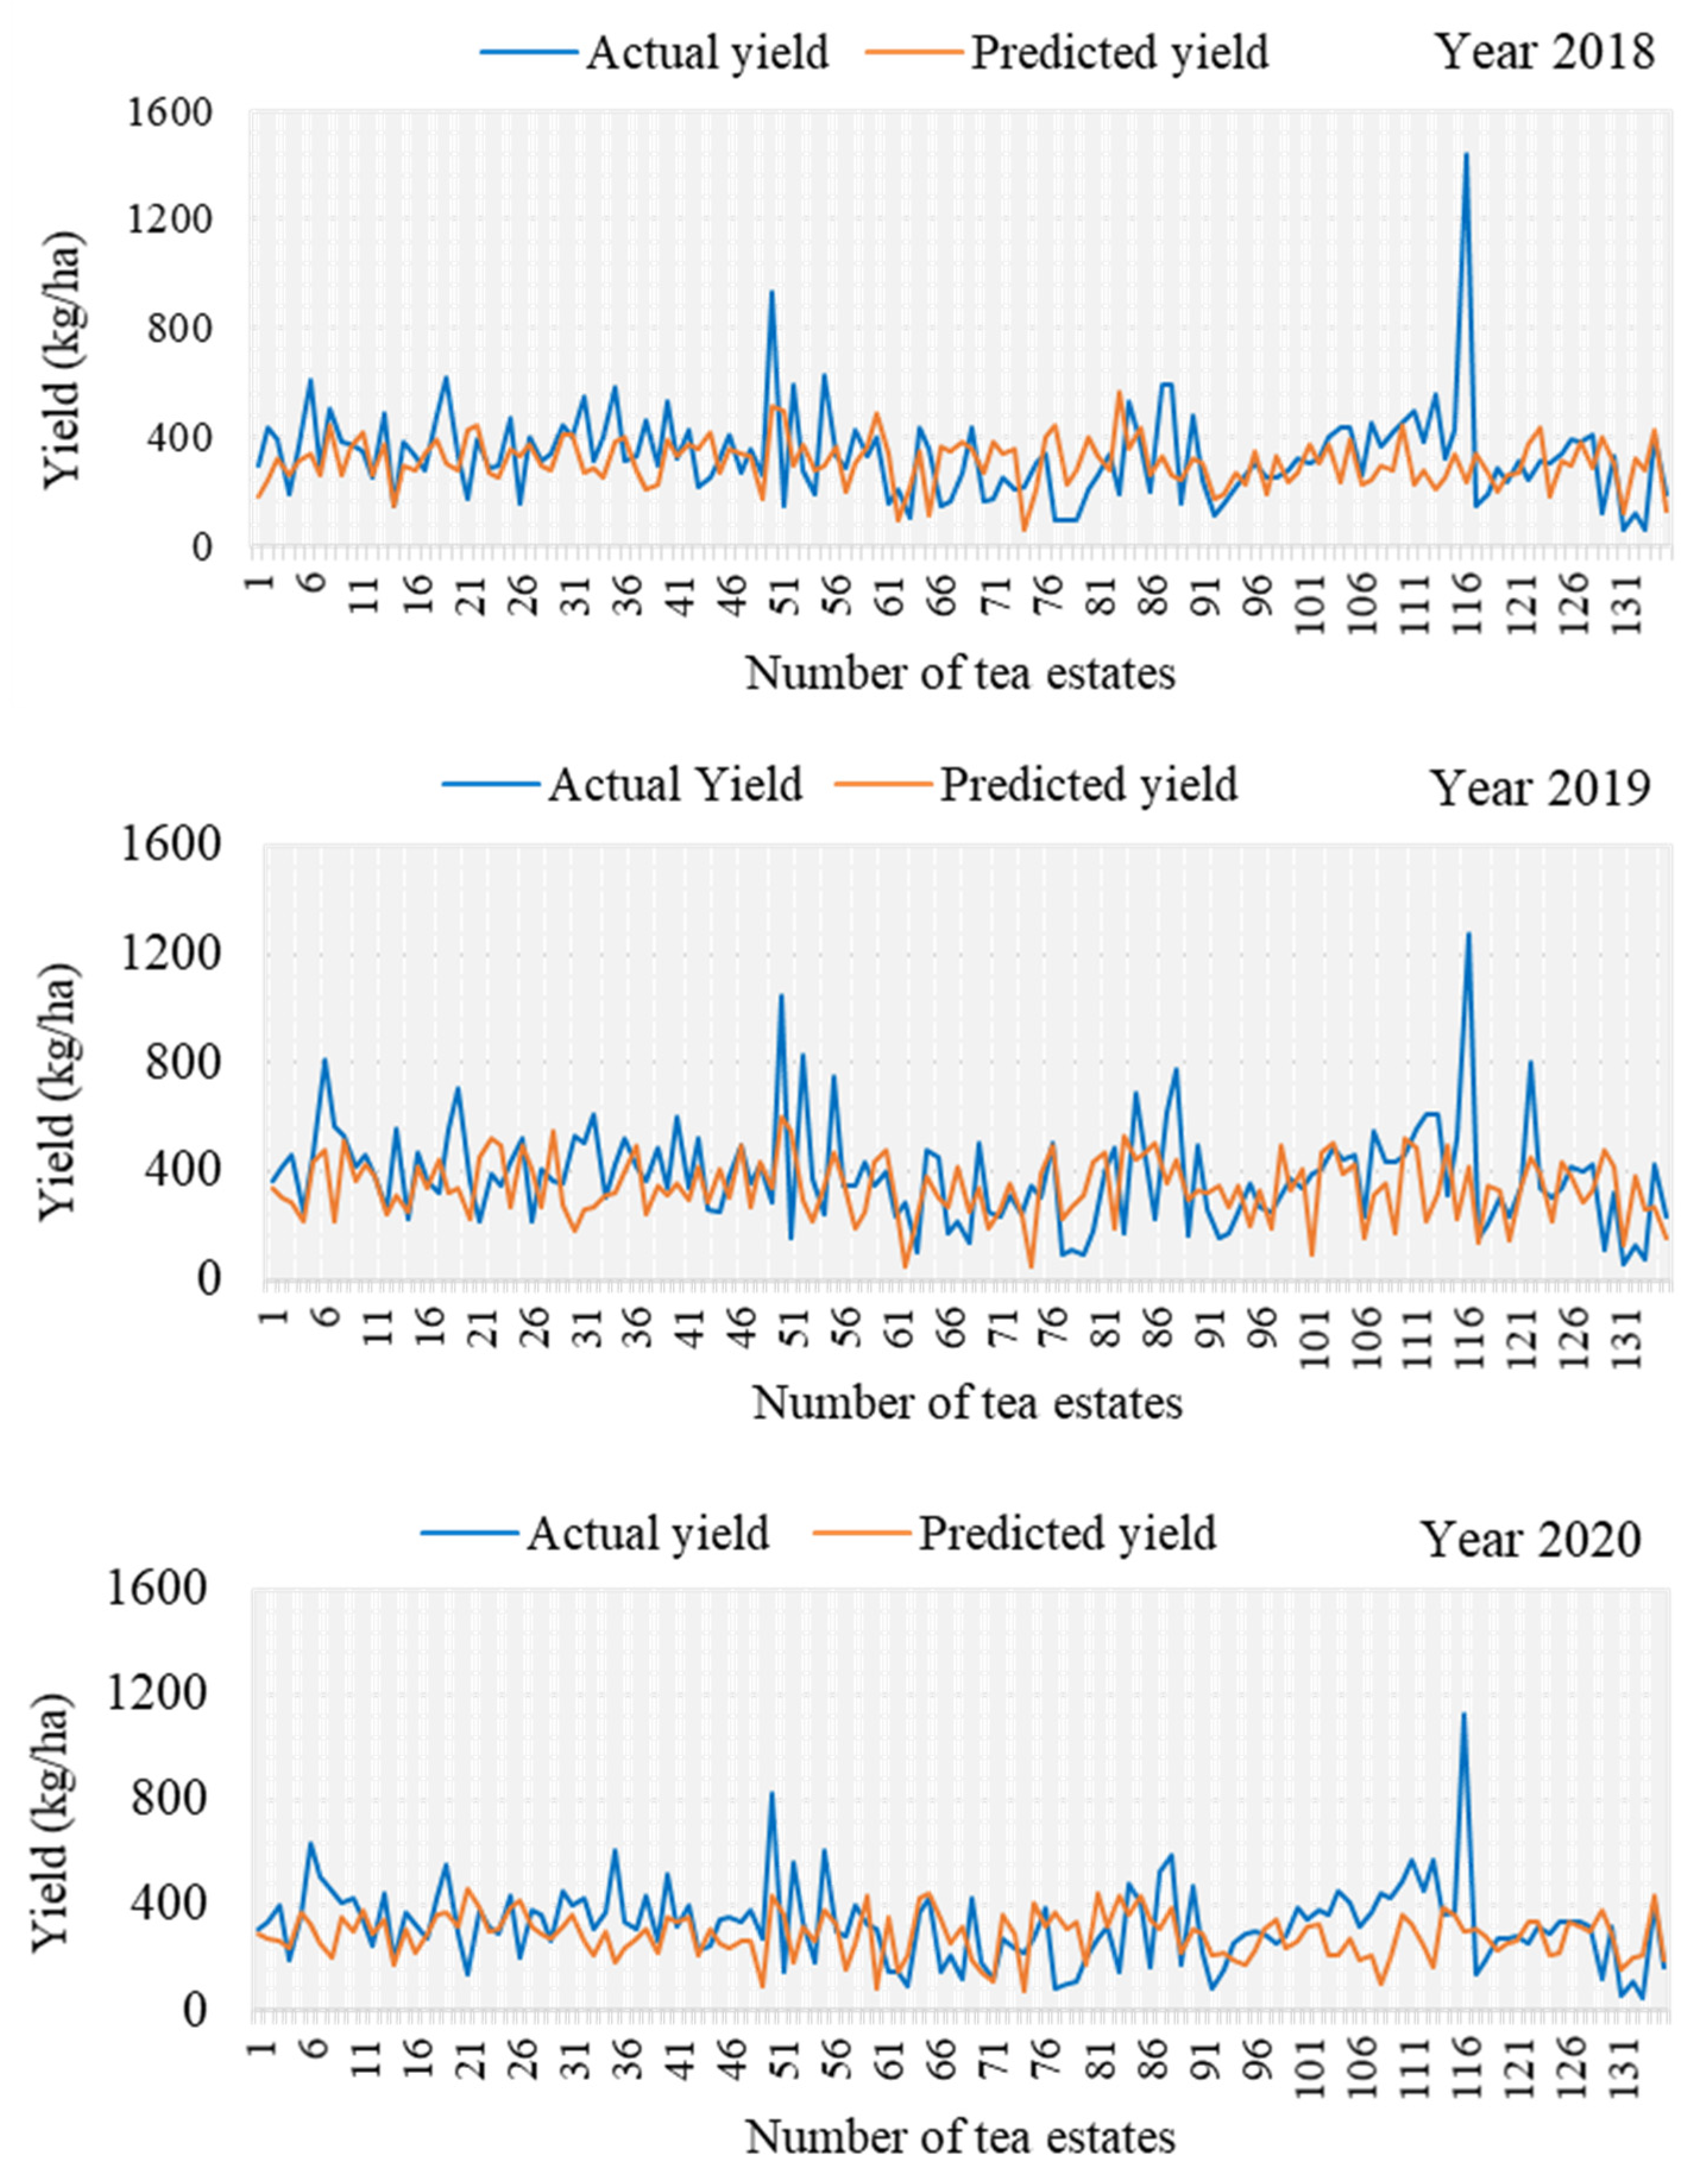
2.6. Validation of Yield in the Drought Period

Yield data for 2018, 2019, and 2020 were collected from the Bangladesh Tea Board. The normalized difference vegetation index (NDVI) for the drought period was calculated from the reflectance of B4 (red) and B8 (near-infrared) of Sentinel-2 satellite imagery using the following expression.
N D V I = N I R R N I R + R   =   B 8 B 4 B 8 + B 4
The leaf area index (LAI) is an important determinant of tea yield and was also calculated from the NDVI using geospatial techniques. The LAI was calculated according to the equation used in previous studies based on the correlation between the LAI and NDVI utilizing the least square method [53,54].
L A I = 0.57 × e x p ( 2.33 × N D V I )
Yield data were compared with the corresponding extracted LAI values in the scatter plot using regression analysis. The predicted yield maps in the drought period were developed using the linear regression equation in the ArcGIS environment. Finally, the extracted values from the yield maps were compared with the actual yield in the drought period to measure the yield loss in tea.

3. Result

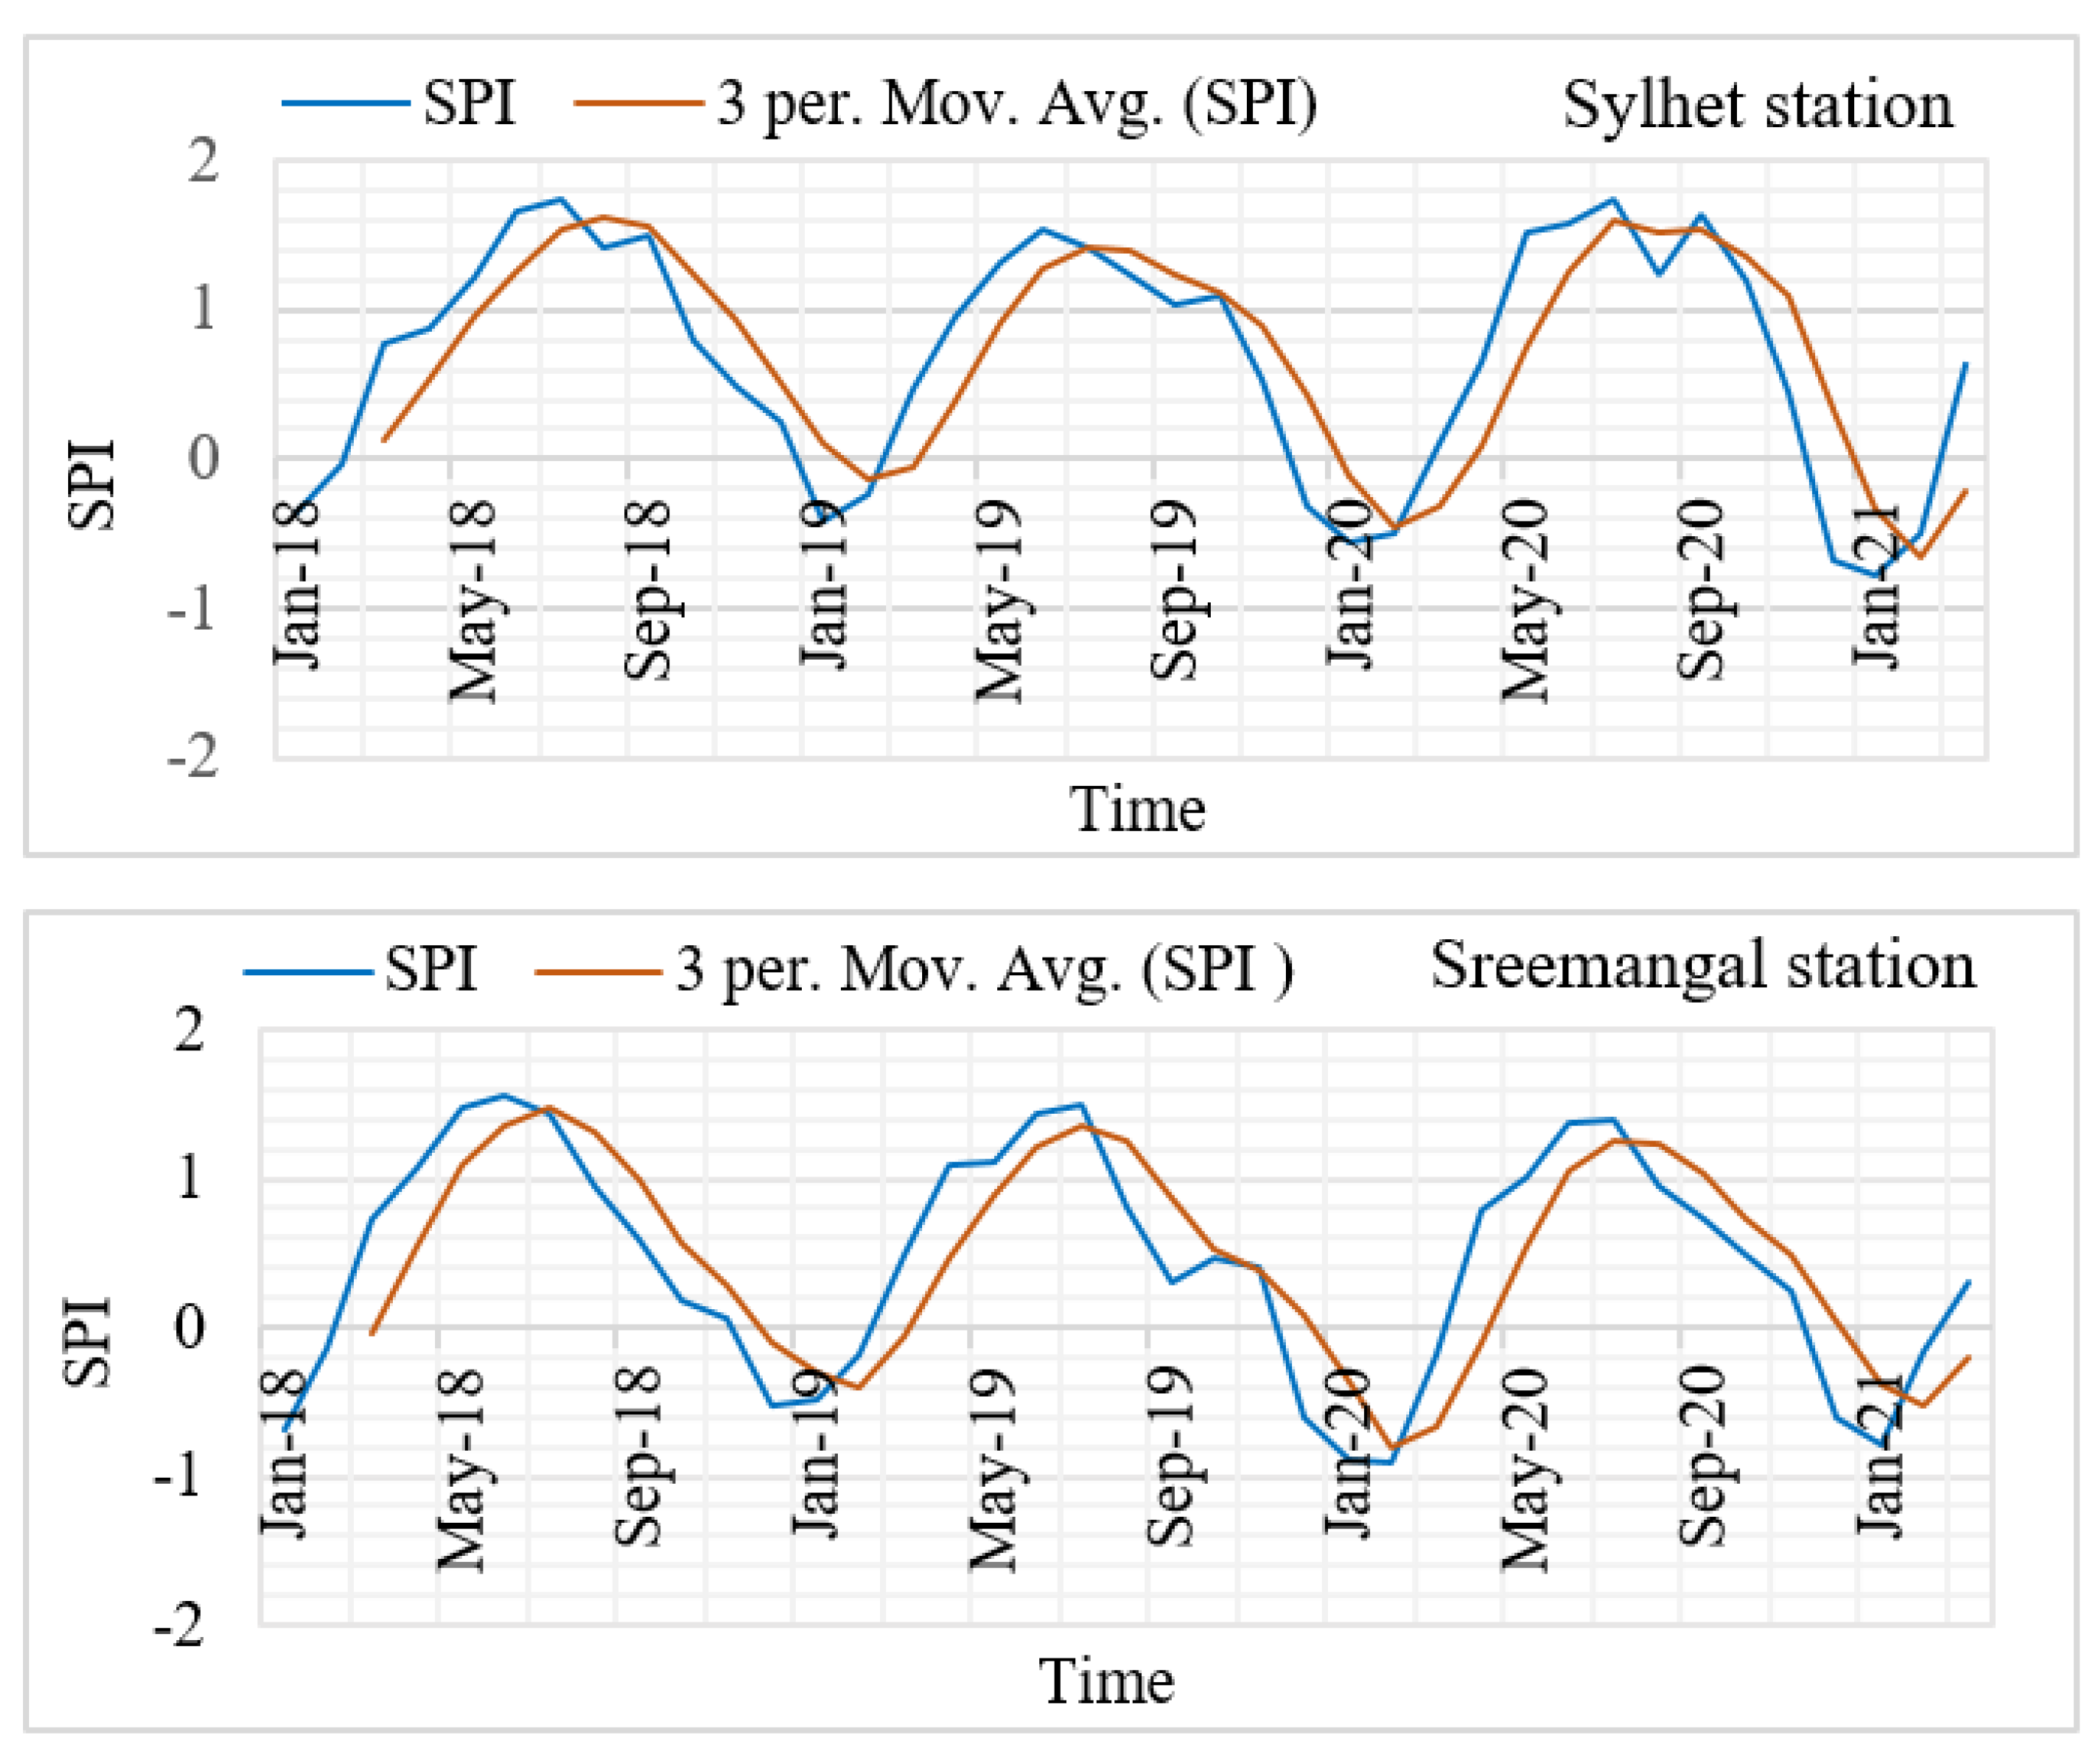
3.1. Standardized Precipitation Index (SPI) and Drought Classification

The results of drought frequency observed in the 39-month period for the Sylhet station demonstrated that 15 months belonged to the near-normal, 14 months normal, and 10 months moderately dry categories, which accounted for 38.46%, 35.90%, and 25.64%, respectively. In contrast, the Sreemangal station showed that the frequencies for near-normal, normal, and moderately dry conditions were 28.21%, 41.02%, and 30.77%, respectively (Figure 5 and Table 1).

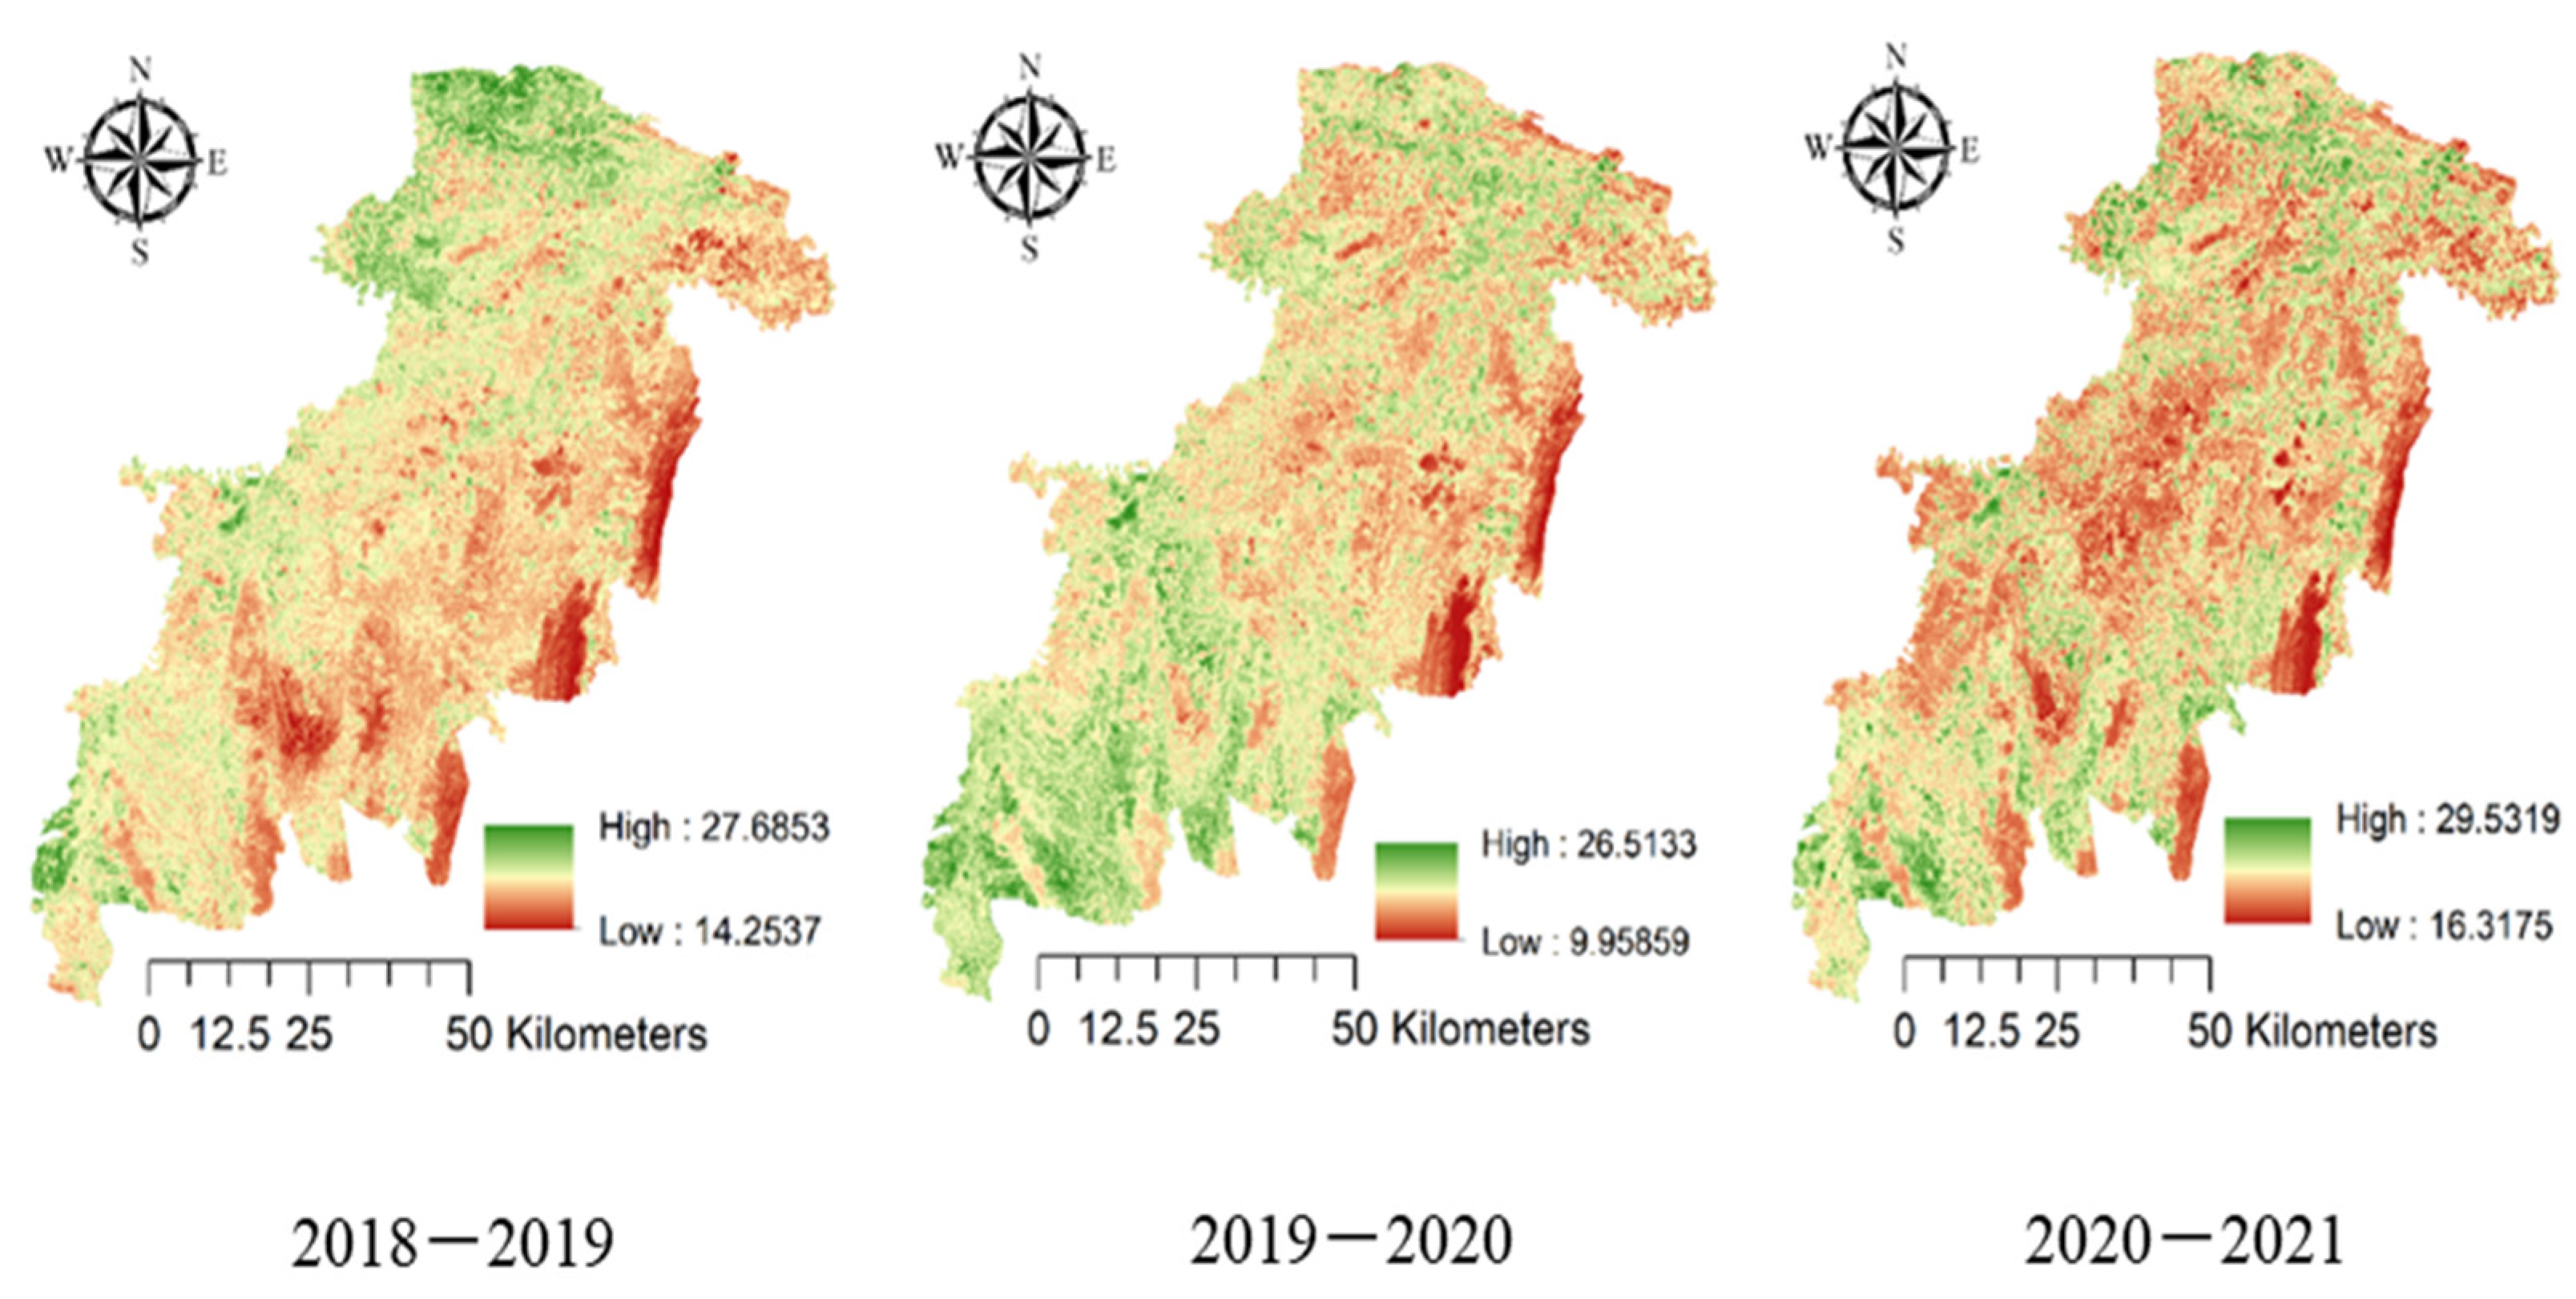
3.2. Land Surface Temperature (LST)

The average LST in the drought months (December to February) for the three consecutive years derived from the Landsat 8 remote sensing data showed that the surface temperature ranged between 14.25 and 27.68, 9.95 and 26.51, and 16.31 and 29.53, respectively (Figure 6).

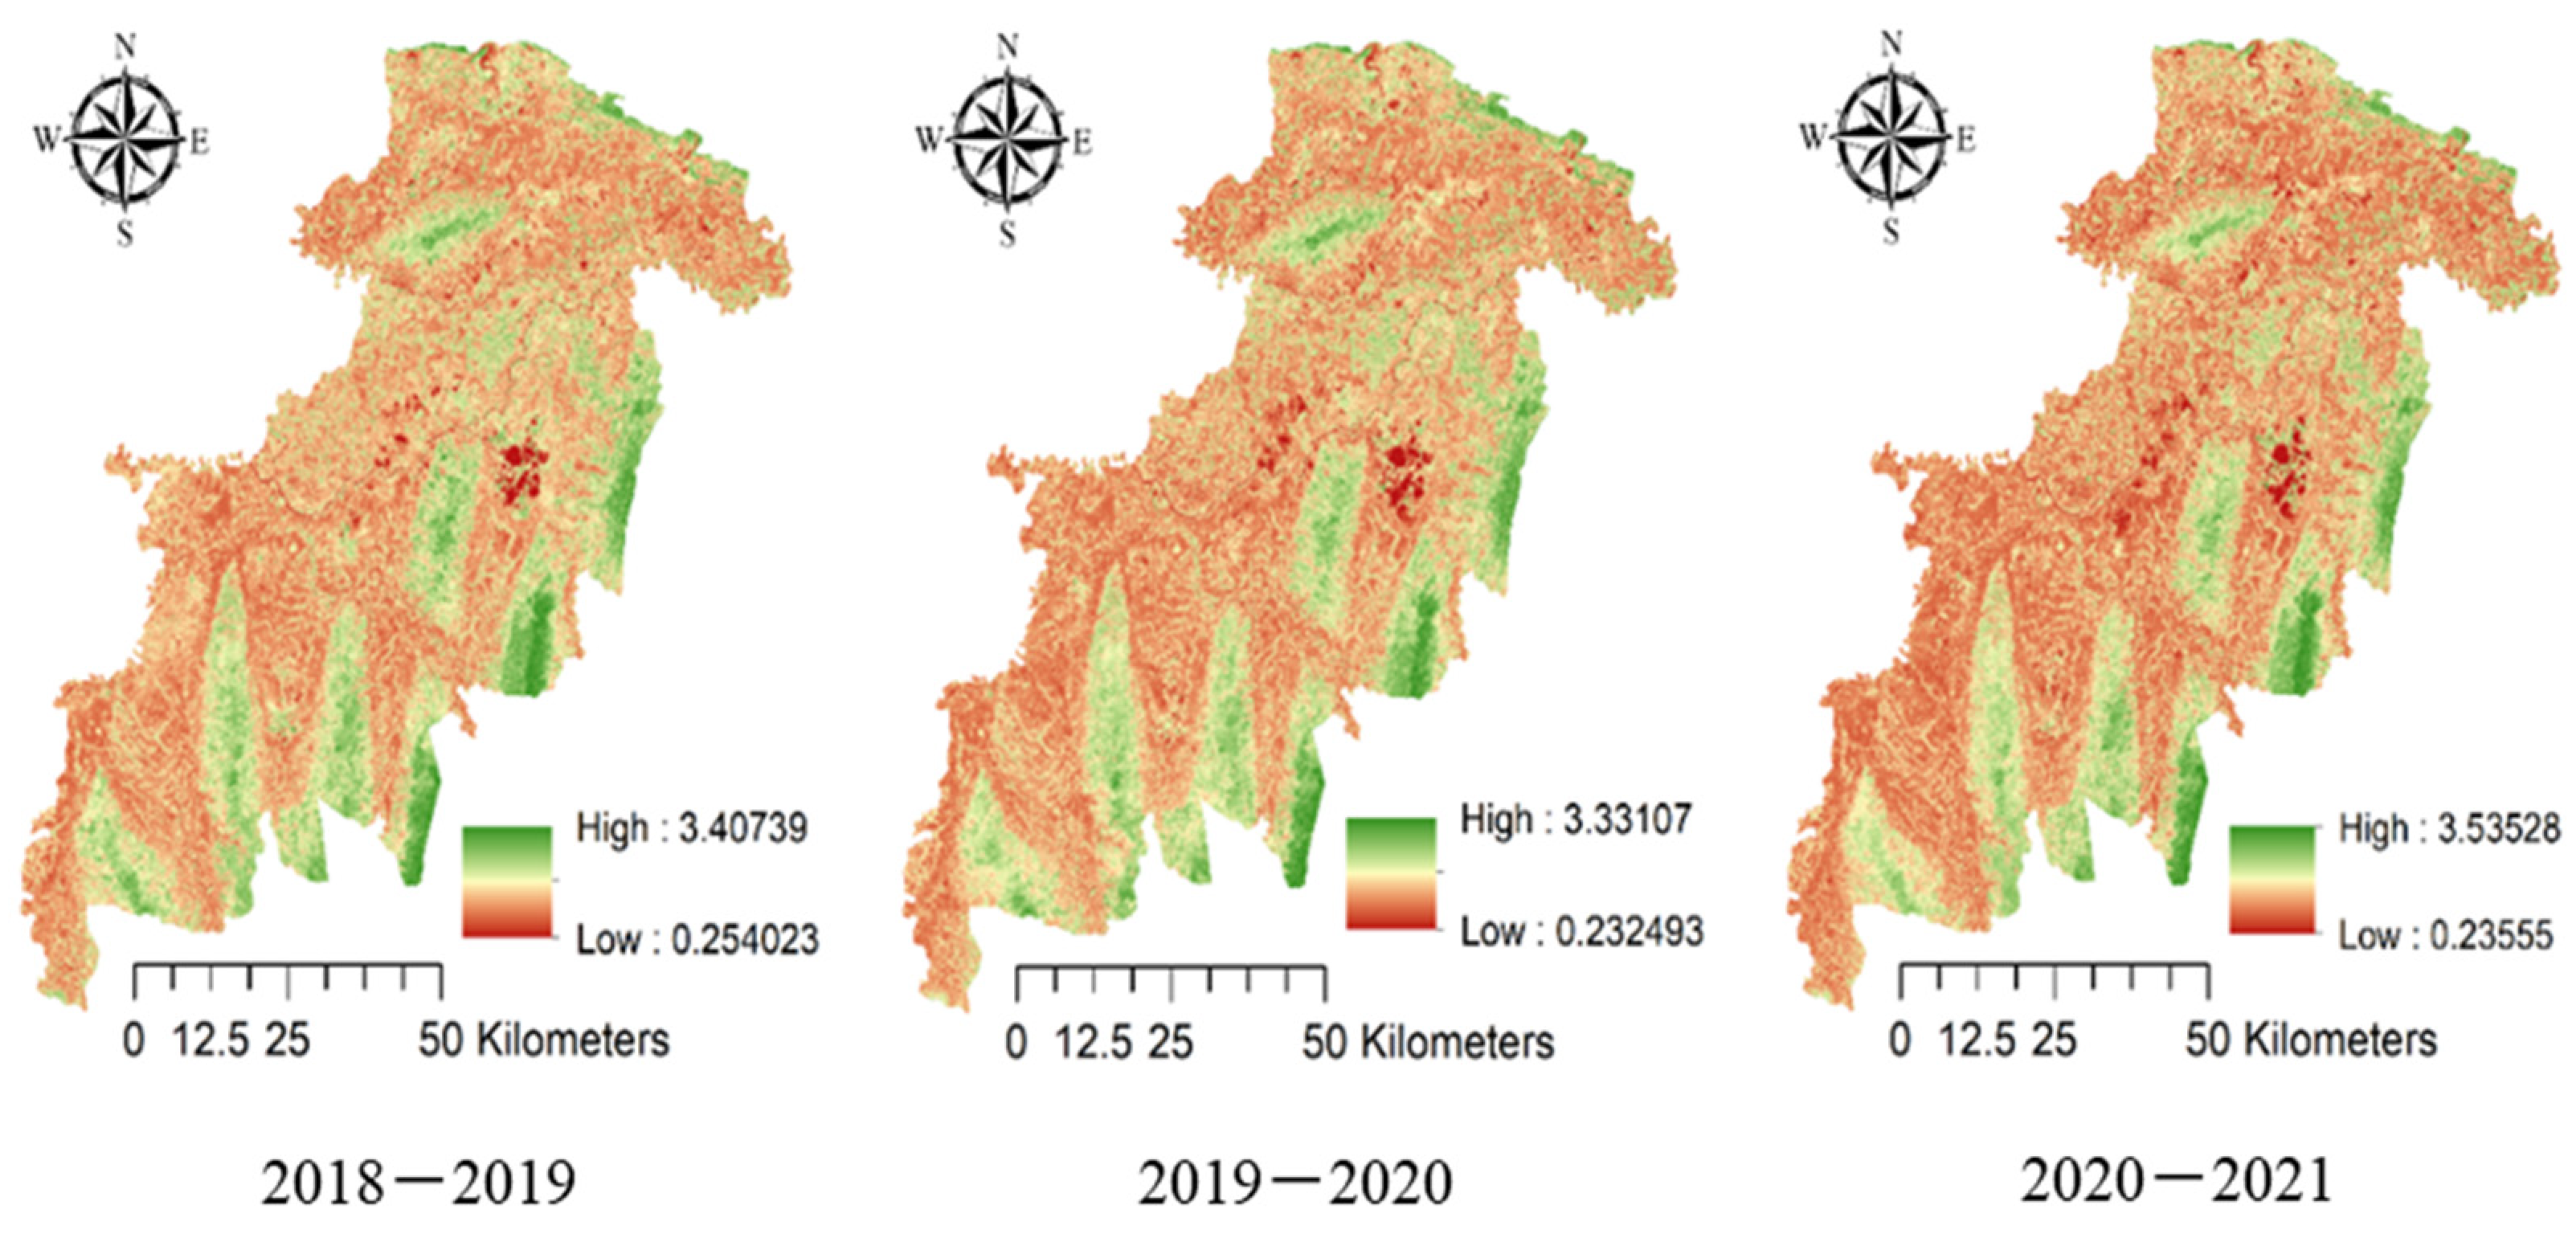
3.3. Soil Moisture Index (SMI)

The SMI in the drought period demonstrated that the status of soil moisture ranged between 0.02 and 1, 0.01 and 0.99, and 0.04 and 0.99 for 2018–2019, 2019–2020, and 2020–2021, respectively (Figure 7).

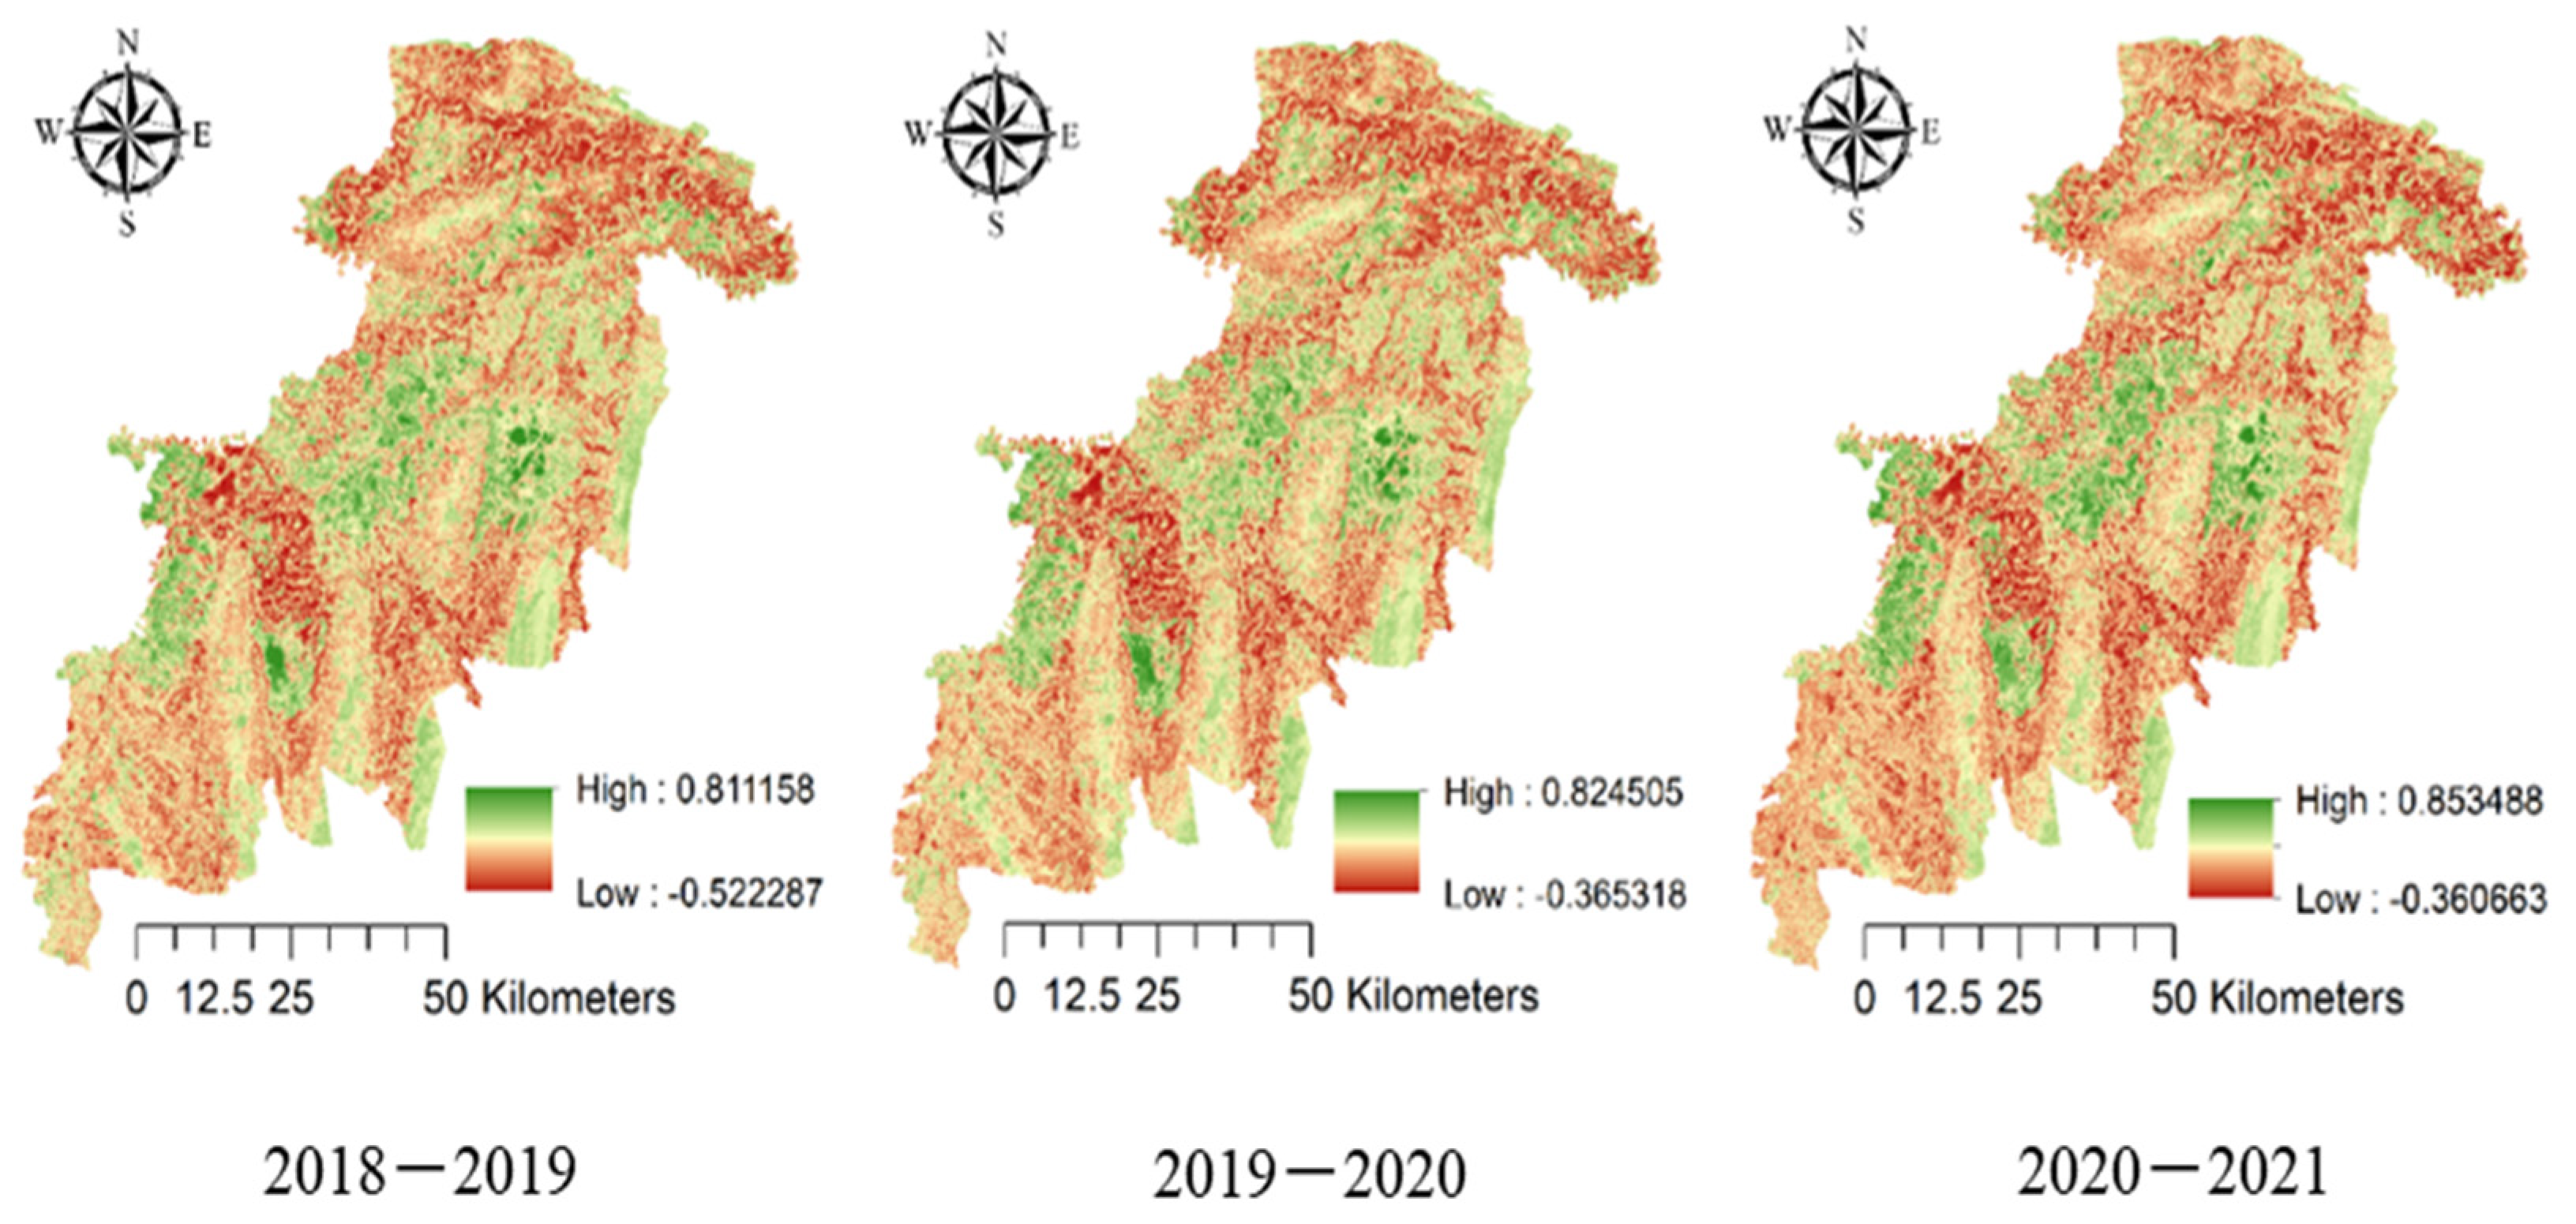
3.4. Normalized Difference Moisture Index (NDMI)

The average NDMI in plant canopies observed in the drought period ranged between −0.52 and 0.81, −0.36 and 0.82, and −0.36 and 0.85 in 2018–2019, 2019–2020, and 2020–2021, respectively (Figure 8). The red color in the NDMI maps indicates the plant biomass with a lower moisture level, and the green color denotes the high moisture content in canopies.

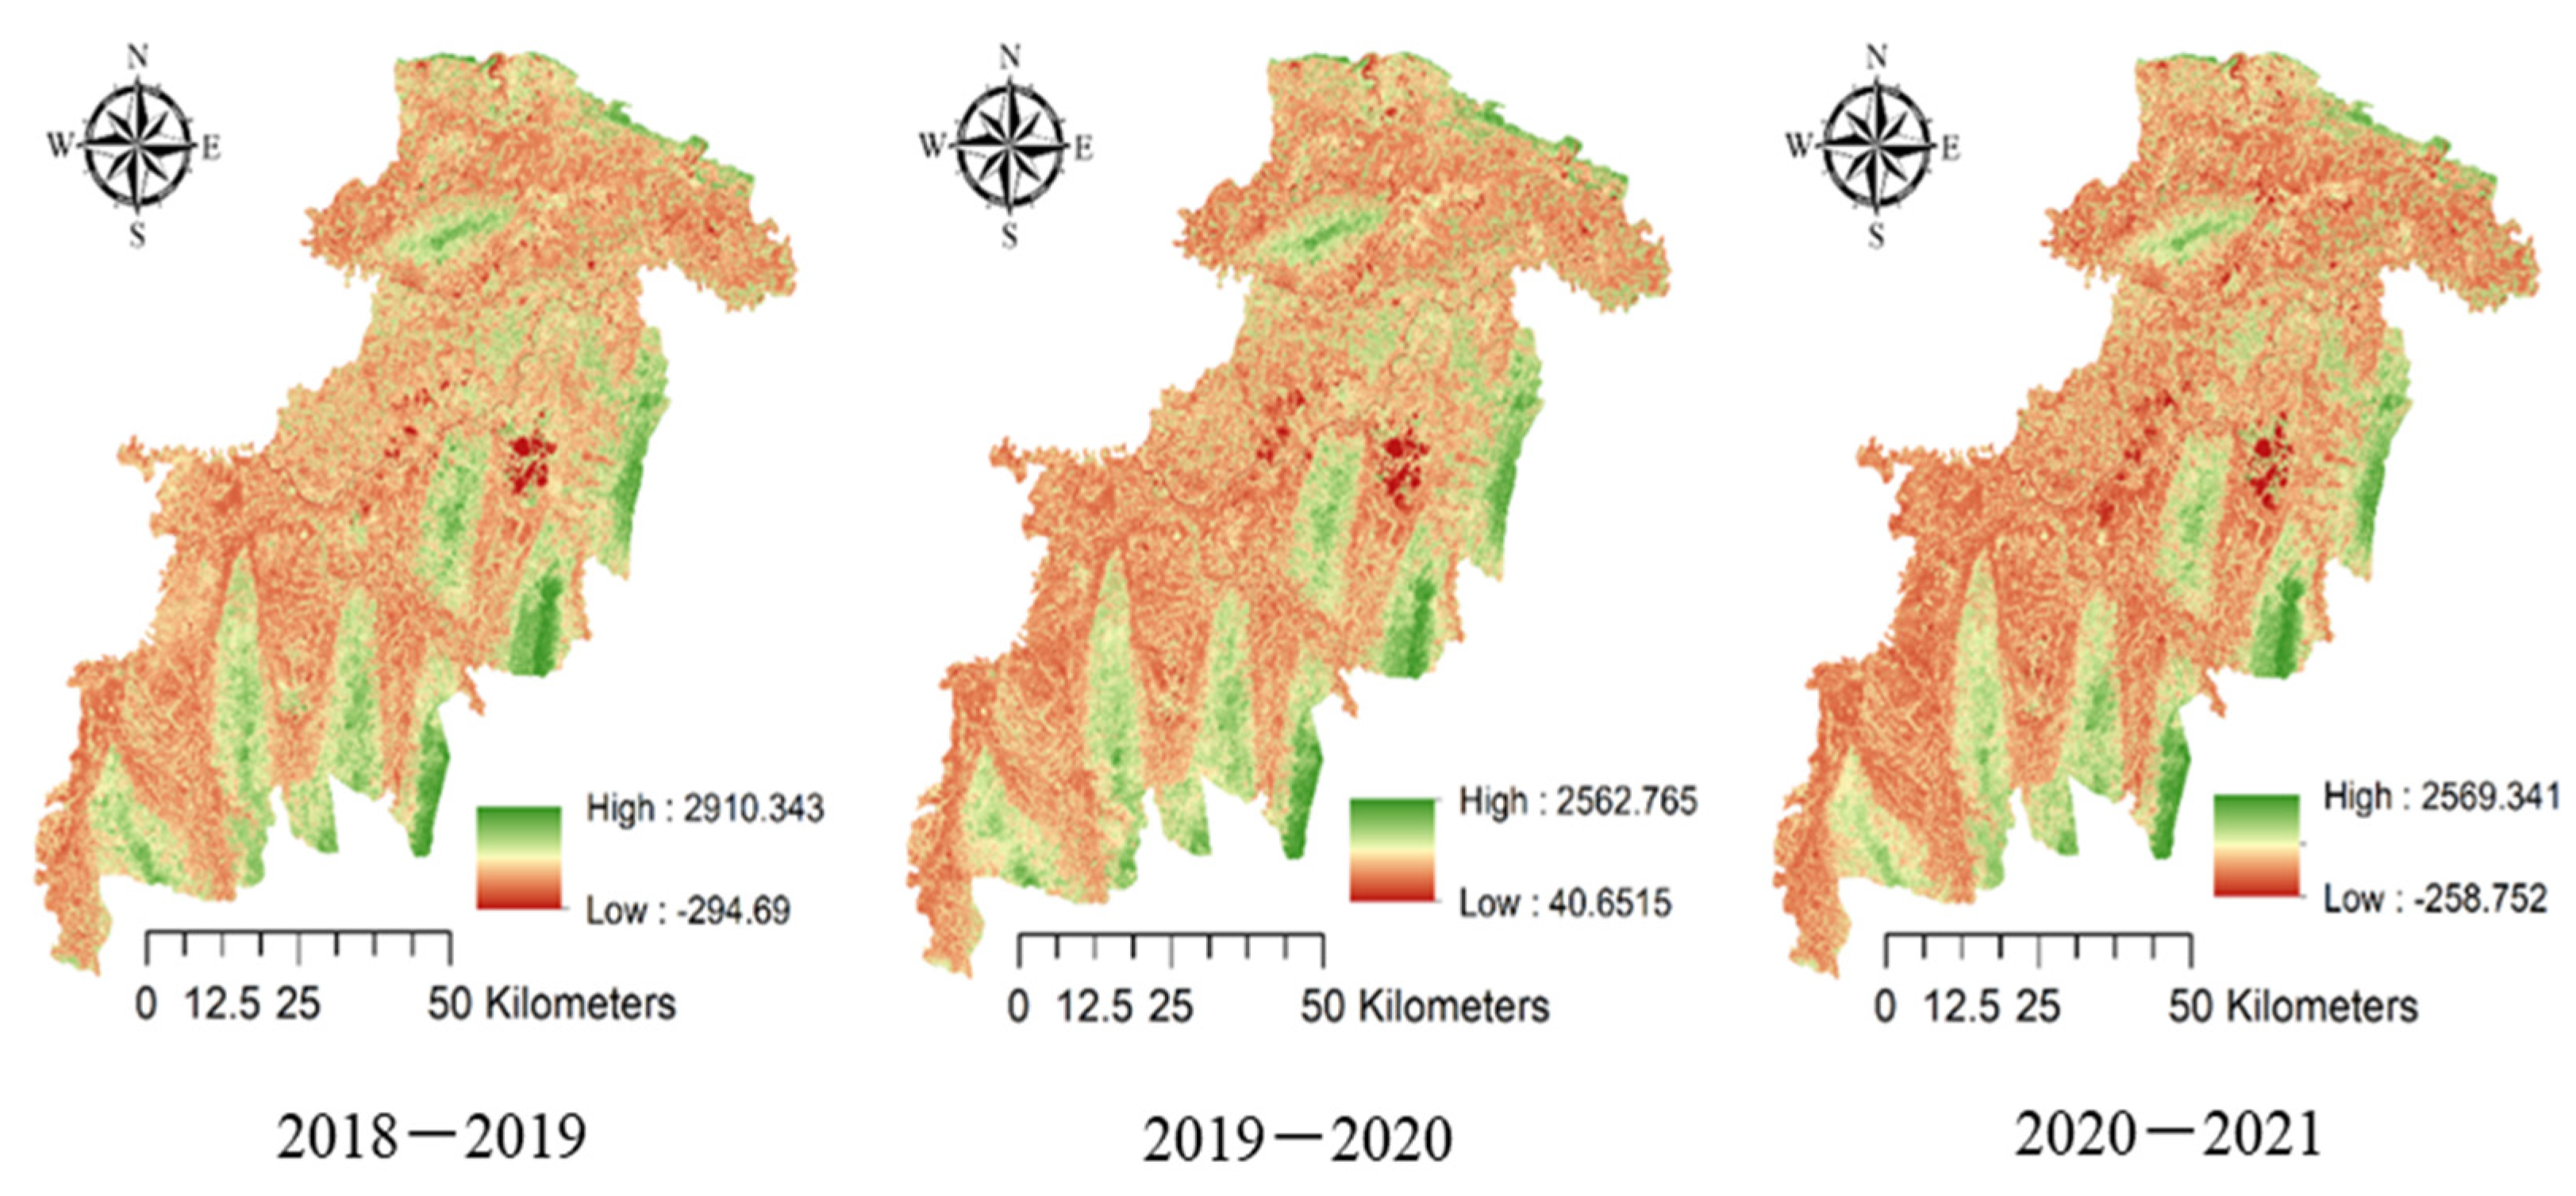
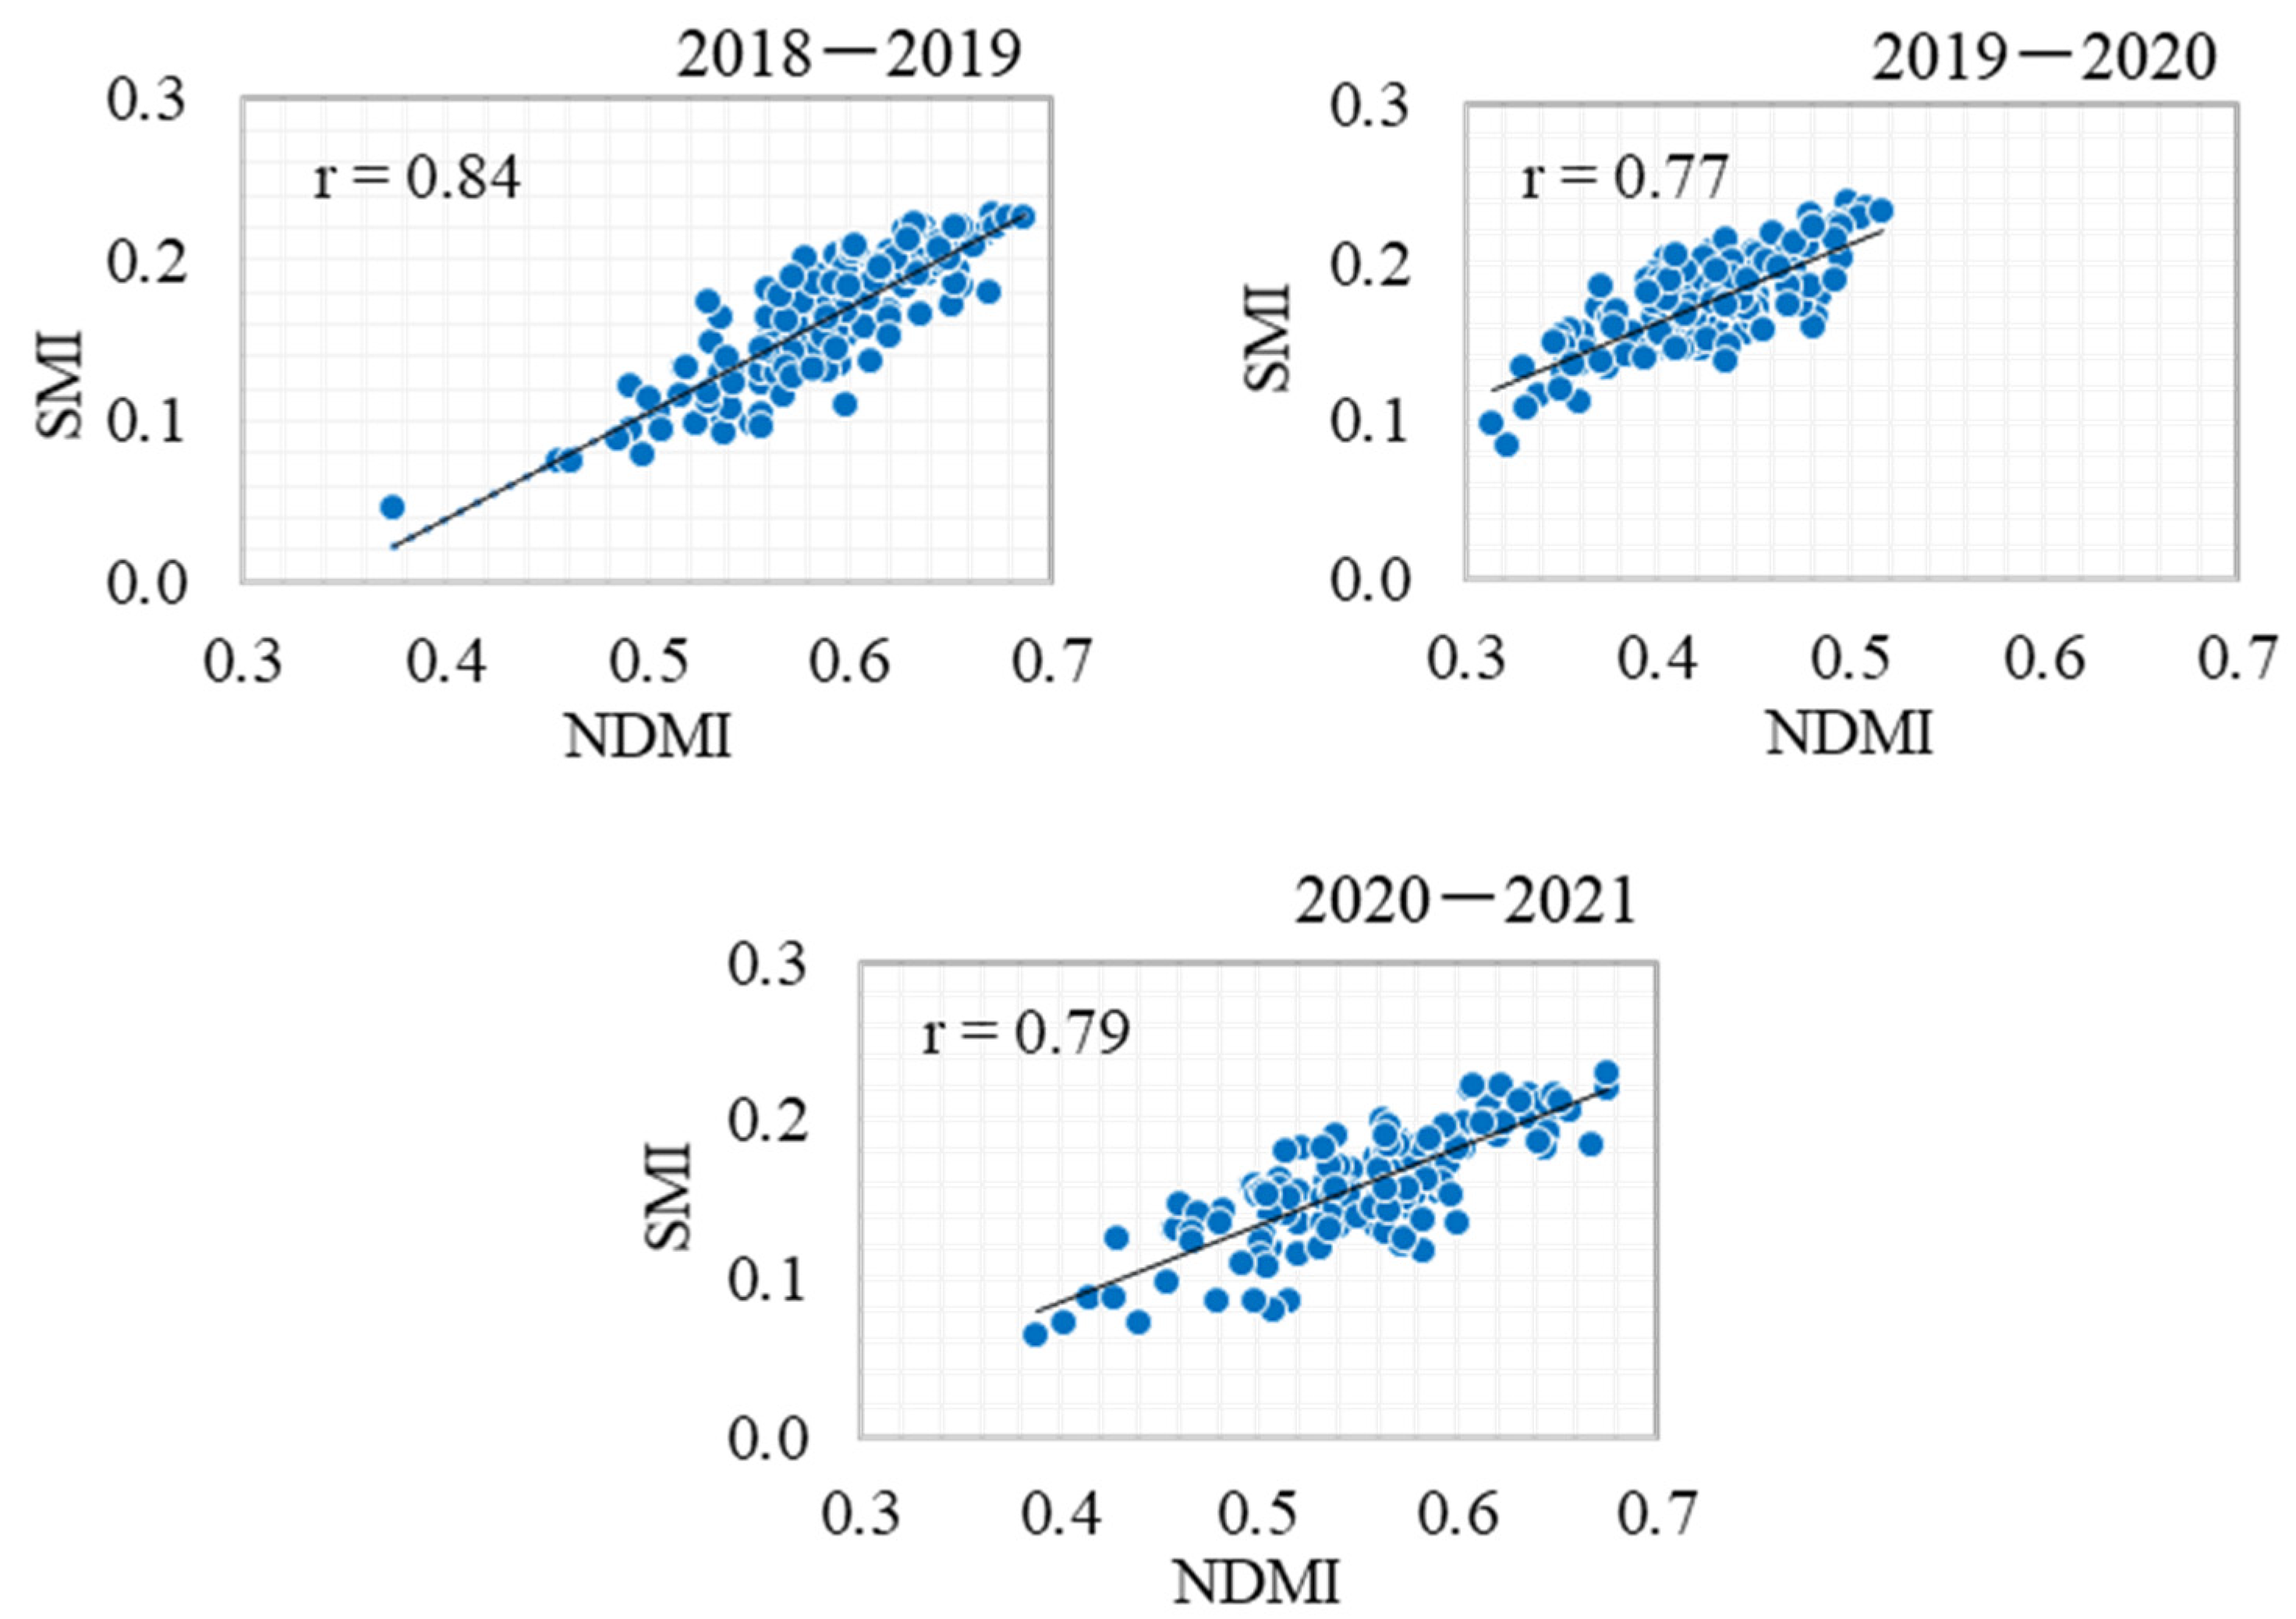
3.5. Spatial Correlation between the SMI and NDMI

The correlation coefficients between the SMI and NDMI were 0.84, 0.77, and 0.79 in the three consecutive years, respectively. This spatial correlation provides evidence that there is a strong interrelationship between moisture in soil and plant biomass during the drought period (Figure 9).

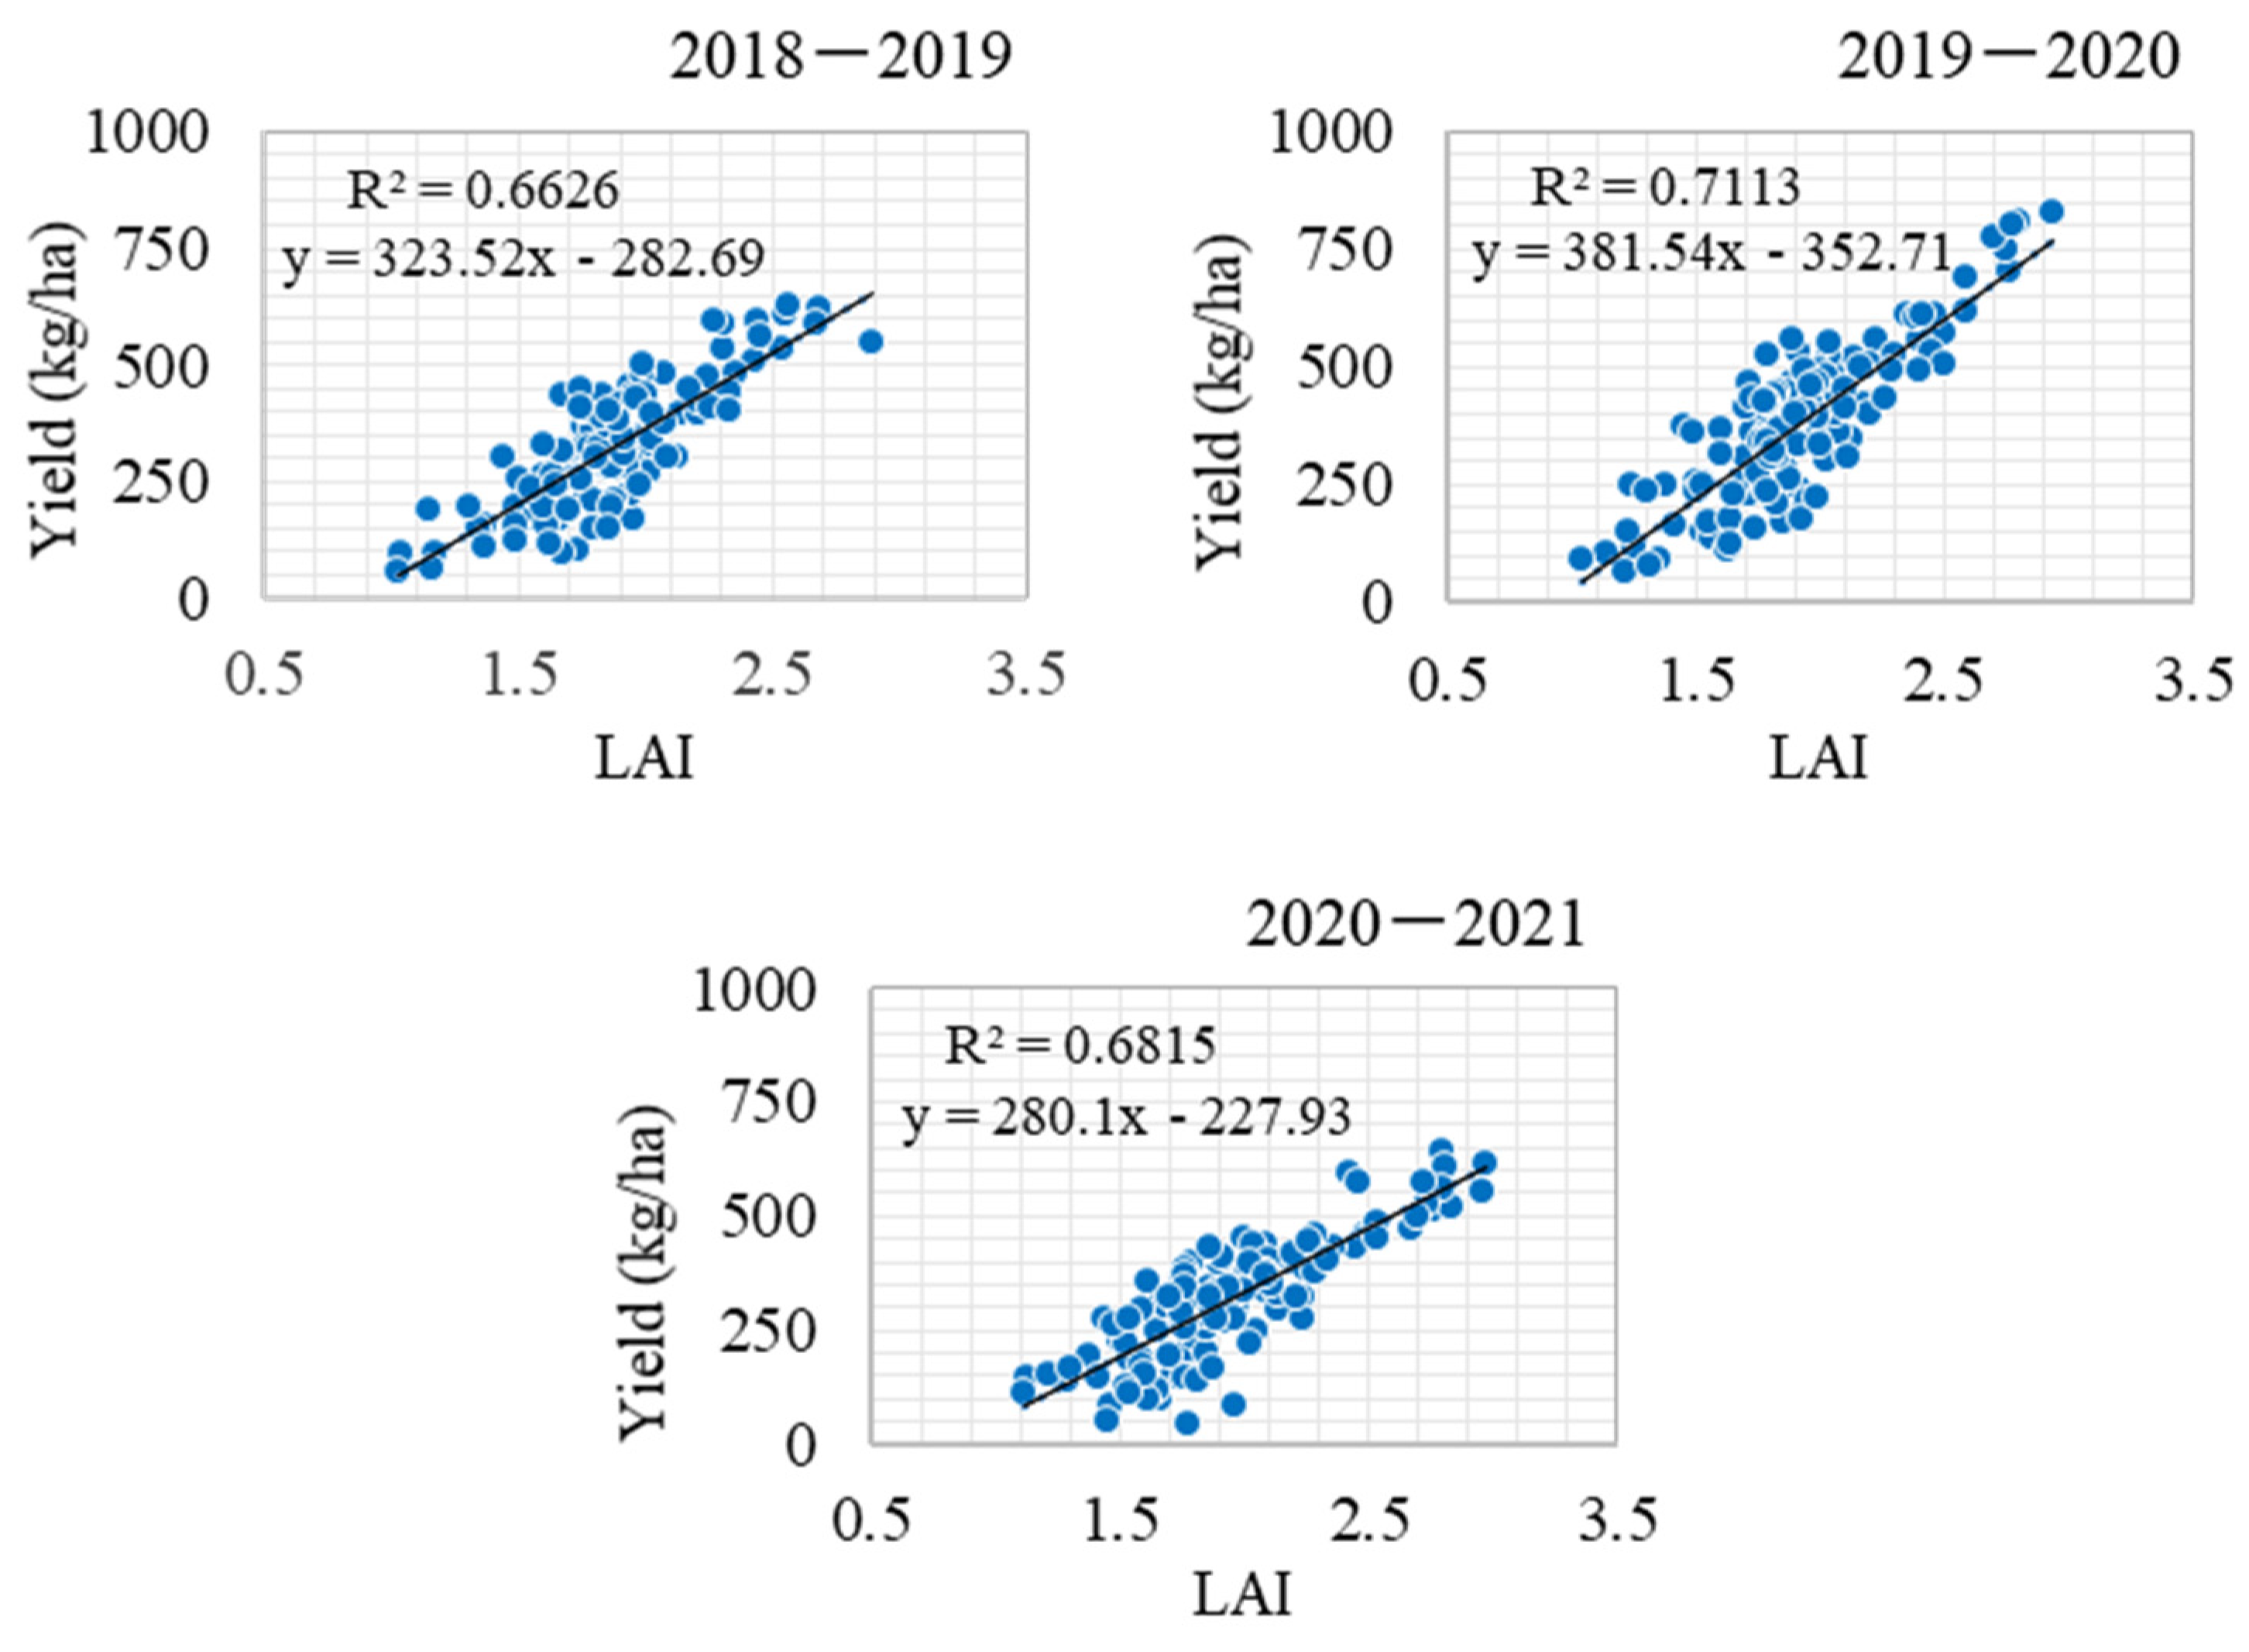
3.6. Validation of Tea Yield in the Drought Period

The validation of tea yield was performed using the NDVI- and LAI-based yield prediction technique (Figure 10, Figure 11, Figure 12, Figure 13 and Figure 14).
The trendline obtained from the regression analysis between the observed LAI and time-series yield information during the drought period in tea estates showed a strong relationship with R2 values, 0.66, 0.71, and 0.68, for the three consecutive years, respectively (Figure 12). The regression analysis between LAI and the corresponding yield in the drought period of the three consecutive years shows a strong relationship between LAI and tea yield. According to the trajectories of predicted yield during the drought period, a lower yield was observed than the actual yield for 83 estates in 2018, whereas the number of responsible estates was 81 each in 2019 and 2020. According to the predicted yield, it was also evident that the tea estates in the study area demonstrated yield losses of 7.72%, 11.92%, and 12.52% in the three consecutive years, respectively (Figure 14).

4. Discussion

The use of the standardized precipitation index (SPI) with remote sensing datasets for drought monitoring was important for this study [55]. The combined utilization of the optical and thermal infrared remote sensing technology from Landsat 8 OLI/TIRS and Sentinel-2 was useful to fulfill the aim of this study. The thermal infrared sensors along with the optical sensors from Landsat 8 were used to measure the land surface temperature, and soil moisture content. On the other hand, the optical remote sensing technology utilized visible (red), near-infrared, and short-wave infrared sensors to measure the NDMI, NDVI, and LAI from Sentinel-2. This study also focused on assessing the relationship between soil and plant canopy moisture during the drought season, where both the optical and thermal infrared sensors contributed. In addition to this, the optical sensors from Sentinel-2, which are considered robust tools for providing high resolution remote sensing data, were used to perform yield loss assessment for validation of drought.
The optical and thermal infrared bands of remote sensing satellite data are predominantly used to monitor soil moisture, despite their susceptibility to the influence of clouds [56]. In contrast, microwave satellite remote sensing data with a higher temporal resolution can be used to measure soil moisture, recognizing the changes in the dielectric properties of surface soil water; however, this is not reliable due to the lower spatial resolution [57]. Therefore, the optical and thermal remote sensing bands of Landsat 8 OLI/TIRS were used to monitor drought for the tea plantations during the cloud-free winter season. Land surface temperature and vegetation indices such as NDMI are important indicators to measure soil moisture [58]. The utilization of Sentinel-2 datasets for NDMI measurements was useful because of its higher spatial resolution to monitor plant water content by measuring the reflectance that served the aim of this study.
It is evident that the study area receives adequate rainfall in the active growing period during the monsoon season but faces drought after the monsoon season; thus, this hampers productivity in tea during the drought months in the winter season. According to the drought frequency classification, this area is characterized by normal and near-normal conditions for 8 to 9 months and moderate drought conditions for 3 to 4 months in a year. As tea is sensitive to soil moisture stress, drought for 3 to 4 months causes yield loss, affecting both tea production and quality [1,6]. To validate the drought for tea estates, the LAI-based yield prediction model was adopted using remote sensing technique. The growth and development of tea leaves are reduced in the drought season due to the reduction in soil moisture. Another important reason for the reduction in leaf area of tea is that the tea bushes are heavily pruned at this time. These might be the reasons for the large differences between the actual yield and the predicted yield of tea.
The SMI-NDMI model based on optical and thermal infrared remote sensing is efficient and easy to calculate; however, it is susceptible to adverse weather conditions and cannot provide valid data in the presence of clouds [59]. Therefore, it was not possible to obtain year-round cloud-free data, which was an obstacle to preparing the year-round trajectories. To overcome this situation, integrated optical and thermal infrared remote sensing, as well as microwave remote sensing techniques, should be adopted to obtain year-round land surface soil moisture and plant water content, which would be an indispensable tool for drought monitoring in tea estates. This study utilized the precipitation-based SPI, as well as the remote sensing-based SMI and NDMI, to understand the water relationships under drought conditions rather than considering evaporation and transpiration losses of water from vegetated land, as the surface soil moisture distribution depends on the soil-vegetation-atmosphere of drought conditions. These issues should be addressed in future studies for precise monitoring of drought in tea estates.

5. Conclusions

This study suggests a drought stress assessment and classification system for tea plantations in Bangladesh using a standardized precipitation index and optical and thermal infrared remote sensing techniques. According to the results of drought frequency, the ratios of near-normal, normal, and moderately dry months for the Sylhet station were 38.46%, 35.90%, and 25.64%, respectively. In contrast, the Sreemangal station showed frequencies of 28.21%, 41.02%, and 30.77% for near-normal, normal, and moderately dry conditions, respectively. The spatial correlations between the SMI and NDMI were 0.84, 0.77, and 0.79 in the three consecutive years, respectively, indicating that there was a strong interrelationship between soil and vegetation canopy moisture during the drought period. This study also predicts that 83, 81, and 81 tea estates among the 135 estates showed lower yields than the actual yield during the drought period; thus, they incurred yield losses, which accounted for 7.72%, 11.92%, and 12.52% in 2018, 2019, and 2020, respectively. The results of the drought stress assessment, as well as drought classification for tea plantations in Bangladesh, could be significant for policy makers, land use planners, and scientists in the decision-making process in ensuring the early warning of drought conditions and thus would help tea growers to understand future drought events and to take the necessary initiatives for increasing production.

Author Contributions

Research Investigation, Methodology, Data Curation, Analysis, Interpretation of Results, and Writing—Original Draft, A.C.D.; Resources and Editing, R.N.; Research Conceptualization, Editing and Supervision T.A. All authors have read and agreed to the published version of the manuscript.

Funding

This research received no external funding.

Data Availability Statement

Data presented in this study are available from the authors upon request.

Acknowledgments

We would like to thank the University of Tsukuba for supporting this research to develop a drought classification system for tea plantations in Bangladesh. We express our sincere thanks to the National Aeronautics and Space Administration (NASA), the European Space Agency (ESA), the Bangladesh Agricultural Research Council (BARC), the Bangladesh Meteorological Department (BMD), and the Bangladesh Tea Board (BTB) for geospatial, geographic, meteorological, and statistical data. We also express our sincere gratitude to the field enumerators involved in this research.

Conflicts of Interest

The authors declare no conflict of interest.

References

  1. Nalina, M.; Saroja, S.; Rajkumar, R.; Radhakrishnan, B.; Chandrashekara, K.N. Variations in quality constituents of green tea leaves in response to drought stress under south Indian condition. Sci. Hortic. 2018, 233, 359–369. [Google Scholar] [CrossRef]
  2. Ahmed, S.; Stepp, J.R.; Kapuscinski, A.R.; Méndez, E. Beyond yields: Climate change effects on specialty crop quality and agroecological management. Elem. Sci. Anthr. 2016, 4, 000092. [Google Scholar] [CrossRef] [Green Version]
  3. Anjum, S.A.; Xie, X.Y.; Wang, L.C.; Saleem, M.F.; Man, C.; Lei, W. Morphological, physiological, and biochemical responses of plants to drought stress. Afr. J. Agric. Res. 2011, 6, 2026–2032. [Google Scholar] [CrossRef]
  4. Shao, H.B.; Chu, L.Y.; Jaleel, C.A.; Manivannan, P.; Panneerselvam, R.; Shao, M.A. Understanding water deficit stress-induced changes in the basic metabolism of higher plants–biotechnologically and sustainably improving agriculture and the ecoenvironment in arid regions of the globe. Crit. Rev. Biotechnol. 2009, 29, 131–151. [Google Scholar] [CrossRef]
  5. Zhou, L.; Xu, H.; Mischke, S.; Meinhardt, L.W.; Zhang, D.; Zhu, X.; Li, X.; Fang, W. Exogenous abscisic acid significantly affects proteome in tea plant (Camellia sinensis) exposed to drought stress. Hortic. Res. 2014, 1, 14029. [Google Scholar] [CrossRef] [Green Version]
  6. Nalina, M.; Saroja, S.; Chakravarthi, M.; Rajkumar, R.; Radhakrishnan, B.; Chandrashekara, K.N. Water deficit-induced oxidative stress and differential response in antioxidant enzymes of tolerant and susceptible tea cultivars under field condition. Acta Physiol. Plant. 2021, 43, 10. [Google Scholar] [CrossRef]
  7. Hajiboland, R. Environmental and nutritional requirements for tea cultivation. Folia Hortic. 2017, 29, 199–220. [Google Scholar] [CrossRef] [Green Version]
  8. Wijeratne, M.A. Vulnerability of Sri Lanka tea production to global climate change. Water Air Soil Pollut. 1996, 92, 87–94. [Google Scholar] [CrossRef]
  9. International Tea Committee. Annual Bulletin of Statistics; International Tea Committee Ltd.: London, UK, 2017. [Google Scholar]
  10. Kamruzzaman, M.; Parveen, S.; Das, A.C. Livelihood improvement of tea garden workers: A scenario of marginalized women group in Bangladesh. Asian J. Agric. Ext. Econ. Soc. 2015, 7, 1–7. [Google Scholar] [CrossRef]
  11. Das, A.C.; Noguchi, R.; Ahamed, T. Integrating an expert system, GIS, and satellite remote sensing to evaluate land suitability for sustainable tea production in Bangladesh. Remote Sens. 2020, 12, 4136. [Google Scholar] [CrossRef]
  12. Guo, Y.; Zhao, S.; Zhu, C.; Chang, X.; Yue, C.; Wang, Z.; Lin, Y.; Lai, Z. Identification of drought-responsive miRNAs and physiological characterization of tea plant (Camellia sinensis L.) under drought stress. BMC Plant Biol. 2017, 17, 211. [Google Scholar] [CrossRef] [Green Version]
  13. AghaKouchak, A.; Farahmand, A.; Melton, F.S.; Teixeira, J.; Anderson, M.C.; Wardlow, B.D.; Hain, C.R. Remote sensing of drought: Progress, challenges, and opportunities. Rev. Geophys. 2015, 53, 452–480. [Google Scholar] [CrossRef] [Green Version]
  14. Wilhite, D.A. Drought and Water Crises: Science, Technology, and Management Issues; CRC Press, Taylor and Francis Group: Boca Raton, FL, USA, 2005; pp. 1–432. ISBN 978-1-4200-2838-6. [Google Scholar]
  15. Brown, J.F.; Reed, B.C.; Hyes, M.J.; Wilhite, A.D.; Hubbard, K. A prototype Drought Monitoring System Integrating Climate and Satellite Data, Pecora 15/Land Satellite Information IV/ ISPRS Commission I/FIEOS 2002. Available online: http://www.isprs.org/commission1/proceedings02/paper/00074 (accessed on 15 April 2021).
  16. Murad, H.; Islam, A.K.M.S. Drought assessment using remote sensing and GIS in north-west region of Bangladesh. In Proceedings of the 3rd International Conference on Water & Flood Management, Dhaka, Bangladesh, 8–10 January 2011; pp. 797–804. [Google Scholar]
  17. Mishra, A.K.; Singh, V.P. A review of drought concepts. J. Hydrol. 2010, 354, 202–216. [Google Scholar] [CrossRef]
  18. Kamruzzaman, M.; Hwang, S.; Cho, J.; Jang, M.W.; Jeong, H. Evaluating the spatiotemporal characteristics of agricultural drought in Bangladesh using effective drought index. Water 2019, 11, 2437. [Google Scholar] [CrossRef] [Green Version]
  19. Guttman, N.B. Comparing the palmer drought index and the standardized precipitation index. J. Am. Water Resour. Assoc. 1998, 34, 113–121. [Google Scholar] [CrossRef]
  20. Nemani, R.; Hashimoto, H.; Votava, P.; Melton, F.; Wang, W.; Michaelis, A.; Mutch, L.; Milesi, C.; Hiatt, S.; White, M. Monitoring and forecasting ecosystem dynamics using the terrestrial observation and prediction system (TOPS). Remote Sens. Environ. 2009, 113, 1497–1509. [Google Scholar] [CrossRef]
  21. Caccamo, G.; Chisholm, L.A.; Bradstock, R.A.; Puotinen, M.L. Assessing the sensitivity of MODIS to monitor drought in high biomass ecosystems. Remote Sens. Environ. 2011, 115, 2626–2639. [Google Scholar] [CrossRef]
  22. Van Niel, T.G.; McVicar, T.R.; Fang, H.; Liang, S. Calculating environmental moisture for per-field discrimination of rice crops. Int. J. Remote Sens. 2003, 24, 885–890. [Google Scholar] [CrossRef]
  23. Gutman, G.G. Towards monitoring droughts from space. J. Clim. 1990, 3, 282–295. [Google Scholar] [CrossRef] [Green Version]
  24. Krishna, T.M.; Ravikumar, G.; Krishnaveni, M. Remote sensing based agricultural drought assessment in Palar basin of Tamil Nadu state, India. J Indian Soc Remote Sens. 2009, 37, 9–20. [Google Scholar] [CrossRef]
  25. Muthumanickam, D.; Kannan, P.; Kumaraperumal, R.; Natarajan, S.; Sivasamy, R.; Poongodi, C. Drought assessment and monitoring through remote sensing and GIS in western tracts of Tamil Nadu, India. Int. J. Remote Sens. 2011, 32, 5157–5176. [Google Scholar] [CrossRef]
  26. Xi, Z.; Lu, D.; Liu, L.; Ge, H. Detection of drought-induced Hickory disturbances in western Lin An county, China, using multitemporal Landsat imagery. Remote Sens. 2016, 8, 345. [Google Scholar] [CrossRef] [Green Version]
  27. Razali, S.M.; Atucha, A.A.M.; Nuruddin, A.A.; Hamid, H.A.; Shafri, H.Z.M. Monitoring vegetation drought using MODIS remote sensing indices for natural forest and plantation areas. J. Spat. Sci. 2016, 61, 157–172. [Google Scholar] [CrossRef]
  28. Xulu, S.; Peerbhay, K.; Gebreslasie, M.; Ismail, R. Drought influence on forest plantations in Zululand, South Africa, using MODIS time-series and climate data. Forests 2018, 9, 528. [Google Scholar] [CrossRef] [Green Version]
  29. Yang, Y.; Anderson, M.; Gao, F.; Hain, C.; Noormets, A.; Sun, G.; Wynne, R.; Thomas, V.; Sun, L. Investigating impacts of drought and disturbance on evapotranspiration over a forested landscape in North Carolina, USA using high spatiotemporal resolution remotely sensed data. Remote Sens. Environ. 2020, 238, 111018. [Google Scholar] [CrossRef]
  30. Gupta, N.; Gupta, P.P.; Pramanik, P.; Saikia, A.; Sengupta, L.; Bhagat, R.M.; Bhattacharya, N. Integration of geoinformatics and wireless sensors for smart agriculture in tea. In Proceedings of the Second International Conference on Remote Sensing and Geoinformation of the Environment (RSCy2014), Paphos, Cyprus, 12 August 2014; SPIE: Bellingham, WA, USA, 2014; Volume 9229, p. 92290w. [Google Scholar] [CrossRef]
  31. Jiang, S.; Wang, W.; Xiao, G.; Li, Z. Design of wireless sensor node for drought monitoring in tea plantation. In Proceedings of the 2011 International Conference on Electric Information and Control Engineering, Wuhan, China, 15–17 April 2011; IEEE: New York, NY, USA, 2011; pp. 1328–1332. [Google Scholar] [CrossRef]
  32. Sun, D.; Jiang, S.; Wang, W.; Tang, J. WSN design and implementation in a tea plantation for drought monitoring. In Proceedings of the 2010 International Conference on Cyber-Enabled Distributed Computing and Knowledge Discovery, Huangshan, China, 10–12 October 2010; IEEE: New York, NY, USA, 2010; pp. 156–159. [Google Scholar] [CrossRef]
  33. Bangladesh Tea Board. Statistical Handbook on Bangladesh Tea Industry 2019; Project Development Unit; Bangladesh Tea Board: Sreemangal, Bangladesh, 2020; Volume 8, pp. 1–146.
  34. Habibie, M.I.; Noguchi, R.; Matsushita, S.; Ahamed, T. Development of micro-level classifiers from land suitability analysis for drought-prone areas in Indonesia. Remote Sens. Appl. Soc. Environ. 2020, 20, 100421. [Google Scholar] [CrossRef]
  35. Paulo, A.A.; Rosa, R.D.; Pereira, L.S. Climate trends and behaviour of drought indices based on precipitation and evapotranspiration in Portugal. Nat. Hazards Earth Syst. Sci. 2012, 12, 1481–1491. [Google Scholar] [CrossRef]
  36. Paulo, A.A.; Pereira, L.S. Drought concepts and characterization: Comparing drought indices applied at local and regional scales. Water Int. 2006, 31, 37–49. [Google Scholar] [CrossRef]
  37. World Meteorological Organization. Standardized Precipitation Index User Guide (WMO-No.1090); WMO: Geneva, Switzerland, 2012; Available online: https://wamis.org/agm/pubs/SPI/WMO_1090_EN.pdf (accessed on 15 April 2021).
  38. Peterson, T.C.; Vose, R.S. An overview of the global historical climatology network temperature database. Bull. Am. Meteorol. Soc. 1997, 78, 2837–2849. [Google Scholar] [CrossRef] [Green Version]
  39. McKee, T.B.; Doesken, N.J.; Kleist, J. The relationship of drought frequency and duration to time scale. In Proceedings of the 8th Conference on Applied Climatology, Anaheim, CA, USA, 17–22 January 1993; Volume 17, pp. 179–183. Available online: https://climate.colostate.edu/pdfs/relationshipofdroughtfrequency.pdf (accessed on 15 April 2021).
  40. Alam, A.T.M.J.; Rahman, M.S.; Saadat, A.H.M.; Huq, M.M. Gamma Distribution and its Application of Spatially Monitoring Meteorological Drought in Barind, Bangladesh. J. Environ. Sci. Nat. Resour. 2013, 5, 287–293. [Google Scholar] [CrossRef]
  41. Zhang, D.; Zhou, G. Estimation of soil moisture from optical and thermal remote sensing: A review. Sensors 2016, 16, 1308. [Google Scholar] [CrossRef] [PubMed] [Green Version]
  42. Binte Mostafiz, R.; Noguchi, R.; Ahamed, T. Agricultural land suitability assessment using satellite remote sensing-derived soil-vegetation indices. Land 2021, 10, 223. [Google Scholar] [CrossRef]
  43. Habibie, M.I.; Noguchi, R.; Shusuke, M.; Ahamed, T. Land suitability analysis for maize production in Indonesia using satellite remote sensing and GIS-based multicriteria decision support system. GeoJournal 2019, 1–31. [Google Scholar] [CrossRef]
  44. de Jesus, J.B.; Santana, I.D.M. Estimation of land surface temperature in caatinga area using Landsat 8 data. J. Hyperspectral Remote Sens. 2017, 7, 150–157. [Google Scholar] [CrossRef]
  45. Fang, B.; Kansara, P.; Dandridge, C.; Lakshmi, V. Drought monitoring using high spatial resolution soil moisture data over Australia in 2015–2019. J. Hydrol. 2021, 594, 125960. [Google Scholar] [CrossRef]
  46. Yin, J.; D’Odorico, P.; Porporato, A. Soil moisture dynamics in water-limited ecosystems. In Dryland Ecohydrology, 2nd ed.; D’Odorico, P., Porporato, A., Runyan, C.W., Eds.; Springer: Cham, Switzerland, 2019; pp. 31–48. ISBN 978-3-030-23269-6. [Google Scholar]
  47. Wang, L.; Qu, J.J. Satellite remote sensing applications for surface soil moisture monitoring: A review. Front. Earth Sci. China 2009, 3, 237–247. [Google Scholar] [CrossRef]
  48. Saha, A.; Patil, M.; Goyal, V.C.; Rathore, D.S. Assessment and impact of soil moisture index in agricultural drought estimation using remote sensing and GIS techniques. Proceedings 2019, 7, 2. [Google Scholar] [CrossRef] [Green Version]
  49. Enquist, B.J.; Ebersole, J.J. Effects of added water on photosynthesis of Bistorta vivipara: The importance of water relations and leaf nitrogen in two alpine communities, Pikes peak, Colorado, U.S.A. Arct. Alp. Res. 1994, 26, 29–34. [Google Scholar] [CrossRef]
  50. Serrano, J.; Shahidian, S.; Marques da Silva, J. Evaluation of Normalized Difference Water Index as a tool for monitoring pasture seasonal and inter-annual variability in a Mediterranean agro-silvo-pastoral system. Water 2019, 11, 62. [Google Scholar] [CrossRef] [Green Version]
  51. Gao, B.C. NDWI—A normalized difference water index for remote sensing of vegetation liquid water from space. Remote Sens. Environ. 1996, 58, 257–266. [Google Scholar] [CrossRef]
  52. Korhonen, L.; Packalen, P.; Rautiainen, M. Comparison of Sentinel-2 and Landsat 8 in the estimation of boreal forest canopy cover and leaf area index. Remote Sens. Environ. 2017, 195, 259–274. [Google Scholar] [CrossRef]
  53. Tewari, S.; Kulhavy, J.; Rock, B.N.; Hadas, P. Remote monitoring of forest response to changed soil moisture regime due to river regulation. J. For. Sci. 2003, 49, 429–438. [Google Scholar] [CrossRef] [Green Version]
  54. Tuvshinbayar, D.; Erdenetuya, B.; Erkhembayar, E.; Batbileg, B.; Sarangerel, J. Some Results of crop stress monitoring by remote sensing in northern Mongolia. Mong. J. Agric. Sci. 2017, 21, 59–63. [Google Scholar] [CrossRef] [Green Version]
  55. West, H.; Quinn, N.; Horswell, M. Remote sensing for drought monitoring & impact assessment: Progress, past challenges and future opportunities. Remote Sens. Environ. 2019, 232, 111291. [Google Scholar] [CrossRef]
  56. Chen, M.; Zhang, Y.; Yao, Y.; Lu, J.; Pu, X.; Hu, T.; Wang, P. Evaluation of the OPTRAM Model to retrieve soil moisture in the Sanjiang Plain of Northeast China. Earth Space Sci. 2020, 7, e2020EA001108. [Google Scholar] [CrossRef]
  57. Sabaghy, S.; Walker, J.P.; Renzullo, L.J.; Jackson, T.J. Spatially enhanced passive microwave derived soil moisture: Capabilities and opportunities. Remote Sens. Environ. 2018, 209, 551–580. [Google Scholar] [CrossRef]
  58. Rahimzadeh-Bajgiran, P.; Omasa, K.; Shimizu, Y. Comparative evaluation of the vegetation dryness index (VDI), the temperature vegetation dryness index (TVDI) and the improved TVDI (iTVDI) for water stress detection in semi-arid regions of Iran. ISPRS J. Photogramm. Remote Sens. 2012, 68, 1–12. [Google Scholar] [CrossRef]
  59. Wang, Z.; Guo, P.; Wan, H.; Tian, F.; Wang, L. Integration of microwave and optical / infrared derived datasets from multi-satellite products for drought monitoring. Water 2020, 12, 1504. [Google Scholar] [CrossRef]
Figure 1. Geographic location of the study area: (a) Bangladesh on the world map, (b) Bangladesh, and (c) tea cultivation area in the Sylhet Division.
Remotesensing 13 02730 g001
Figure 2. Climatogram showing the temporal distribution of precipitation and air temperature in the study area.
Remotesensing 13 02730 g002
Figure 3. Flowchart for drought stress assessment in tea estates from remote sensing data.
Remotesensing 13 02730 g003
Figure 4. GPS location of tea estates according to the field survey.
Remotesensing 13 02730 g004
Figure 5. SPI trajectories for drought stress assessment.
Remotesensing 13 02730 g005
Figure 6. Land surface temperature (LST) in the drought period.
Remotesensing 13 02730 g006
Figure 7. Soil moisture index (SMI) in the drought period.
Remotesensing 13 02730 g007
Figure 8. Normalized difference moisture index (NDMI) in the drought period.
Remotesensing 13 02730 g008
Figure 9. Correlation coefficient between the SMI and NDMI in the drought period.
Remotesensing 13 02730 g009
Figure 10. Normalized difference vegetation index (NDVI) in the drought period.
Remotesensing 13 02730 g010
Figure 11. Leaf area index (LAI) in the drought period.
Remotesensing 13 02730 g011
Figure 12. Regression analysis for yield prediction of tea during the drought period.
Remotesensing 13 02730 g012
Figure 13. Yield map of tea for the drought period.
Remotesensing 13 02730 g013
Figure 14. Predicted yield trajectories for tea estates during the drought period.
Remotesensing 13 02730 g014
Table 1. Drought frequency in different categories.
Drought ClassesSPI LevelNo. of Months AffectedFrequency (%)
SylhetSreemangalSylhetSreemangal
Extremely wet>3.0 to 3.0----
Moderately wet3.0 to 2.0----
Near-normal2.0 to 1.0151138.4628.21
Normal1.0 to 0141635.9041.02
Moderately dry0 to −1.0101225.6430.77
Severely dry−1.0 to −2.0----
Extremely dry−2.0 to −3.0----
Publisher’s Note: MDPI stays neutral with regard to jurisdictional claims in published maps and institutional affiliations.

