Technical Note

The Ground Deformation History of the Neapolitan Volcanic Area (Campi Flegrei Caldera, Somma–Vesuvius Volcano, and Ischia Island) from 20 Years of Continuous GPS Observations (2000–2019)

1
Istituto Nazionale di Geofisica e Vulcanologia, Sezione di Napoli Osservatorio Vesuviano, via Diocleziano 328, 80124 Napoli, Italy
2
Istituto per il Rilevamento Elettromagnetico dell’Ambiente, Consiglio Nazionale delle Ricerche, via Diocleziano 328, 80124 Napoli, Italy
*
Author to whom correspondence should be addressed.
Remote Sens. 2021, 13(14), 2725; https://doi.org/10.3390/rs13142725
Submission received: 1 June 2021 / Revised: 23 June 2021 / Accepted: 7 July 2021 / Published: 11 July 2021
(This article belongs to the Special Issue GNSS for Geosciences)

Abstract

:
The Neapolitan volcanic area includes three active and high-risk volcanoes: Campi Flegrei caldera, Somma–Vesuvius, and Ischia island. The Campi Flegrei volcanic area is a typical example of a resurgent caldera, characterized by intense uplift periods followed by subsidence phases (bradyseism). After about 21 years of subsidence following the 1982–1984 unrest, a new inflation period started in 2005 and, with increasing rates over time, is ongoing. The overall uplift from 2005 to December 2019 is about 65 cm. This paper provides the history of the recent Campi Flegrei caldera unrest and an overview of the ground deformation patterns of the Somma–Vesuvius and Ischia volcanoes from continuous GPS observations. In the 2000–2019 time span, the GPS time series allowed the continuous and accurate tracking of ground and seafloor deformation of the whole volcanic area. With the aim of improving the research on volcano dynamics and hazard assessment, the full dataset of the GPS time series from the Neapolitan volcanic area from January 2000 to December 2019 is presented and made available to the scientific community.

Graphical Abstract

1. Introduction

Two of the most famous and high-risk volcanoes in the world, the Somma–Vesuvius and the Campi Flegrei caldera, overlook the Gulfs of Naples and Pozzuoli. Ischia island, the third active volcano of the Neapolitan volcanic area, is located at the north of the Gulf of Naples and a short distance from the Procida island.
The Campi Flegrei caldera (CFc) is an active volcanic system located to the west of the city of Naples. This whole area, with about 1.5 million inhabitants, is considered to have a very high volcanic risk [1].
The caldera is thought to have been formed during two large ignimbrite eruptions, the Campania Ignimbrite (CI, 39 ka) and the Neapolitan Yellow Tuff (NYT, 15 ka) [2,3,4]. Following the NYT eruption, the volcanic activity became restricted to within the caldera [5,6,7,8]. The last eruptive event was the 1538 A.D. Mt. Nuovo eruption [9].
CFc is known for the occurrence of slow vertical ground movements (bradyseism). Subsidence has been the dominant process in the last 2000 years, but a fast uplift preceded the Mt. Nuovo eruption (1538), and episodes of uplift are also documented by the well-known evidence on the columns of the Roman Temple of Serapis [10,11,12,13,14] located near the Pozzuoli harbor.
The last important uplift episodes, accompanied by seismic crises, occurred in 1950–1952, 1969–1972, and 1982–1984 (Figure 1), resulting in a total vertical displacement of about 4.3 m in the town of Pozzuoli [15].
In 1985, an almost continuous subsidence phase started, interrupted only by mini-uplift in 1989, 1994, and 2000 (Figure 1), with small displacements ranging between 1 and 7 cm [15].
A new uplift phase started in late 2005 [16] and is ongoing. It is accompanied by increased seismicity, degassing activity, and compositional changes in the emitted fluids [17,18,19,20,21].
The island of Ischia has undergone a large resurgence process since about 56 ka, after a caldera forming eruption (Green Tuff eruption) [22]. The maximum uplift was of the order of 900 m with a rate of a few centimeters per year [23], forming the structural uplifted block of Mt. Epomeo. Effusive and explosive eruptions and avalanche processes accompanied the resurgence processes, and destructive earthquakes have characterized the most recent history of Ischia island [24,25,26,27]. The last eruption took place in 1302 AD. The southwestern part of the island is characterized by the presence of a high-temperature hydrothermal system, with geothermal gradients >150 °C [28]. The largest earthquakes occurred on 4 March 1881 and on 28 July 1883. The event of 1883 was characterized by an intensity Imax of XI MCS degree and a magnitude of 4.8 ≤ M ≤ 5.2 [26,27,28]. On 21 August 2017, an earthquake occurred in the area of Casamicciola Terme with a 2 km deep hypocenter and a magnitude of Md = 4.0 (Mw = 3.9) [29,30,31].
Somma–Vesuvius is a medium-sized strato-volcano located in the center of Campanian Plain. It consists of Mount Somma, an older volcano, whose summit part sank, generating a caldera, and the more recent Vesuvius, which grew inside this caldera. It is practically a symmetrical cone, whose maximum height is 1281 m a.s.l. In summary, the eruptive history of Somma–Vesuvius can be described as follows. About 37,000 years ago, the Phlegraean eruption of Ignimbrite Campana covered most of Campania with a layer of tuff. The stratigraphy of the Trecase 1 geothermal well shows [32] that on these deposits, due to effusive and explosive eruptions, the Somma volcano began to grow. This activity was interrupted around 22 ky BP by the Plinian eruption of the Pomici di Base [33]. After this event, the Somma caldera began to form [34]. Then, 3 ky later, there was the subplinian eruption of the Verdoline Pomici [35]. The following 15 ky were characterized by two Plinian eruptions, Mercato Pumice and Avellino Pumice, then at least eight explosive eruptions followed [36]. This period of activity ended in 217 BC [37], preceding the 79 AD Plinian eruption.
After the Plinian eruption of 79 AD, which destroyed Herculaneum and Pompei, a subplinian eruption occurred (472 AD). It was followed by a persistent activity of about 700 years [38,39]. From the 12th century, a period of low activity began, which ended with the subplinian eruption of 1631. Medium and small eruptions characterized the activity of Somma–Vesuvius until 1944, when the last eruption took place. Over the past eight decades, Somma–Vesuvius activity has been characterized by subsidence, low-temperature fumaroles, and hundreds of low-energy earthquakes per year. The seismic event of greatest energy occurred in October 1999 [40,41,42].
This paper presents and makes available to the scientific community the GPS time series of the north, east, and vertical components of the 41 stations monitoring ground deformation in the whole Neapolitan volcanic area. The time series of the CFc cover the period 2000–2019, and those of Ischia and Procida cover the period 2001–2019. These data provide a continuous and accurate history of the recent CFc unrest (Figure 1) and are a useful tool for the study of ground deformation patterns of the Somma–Vesuvius and Ischia volcanoes.

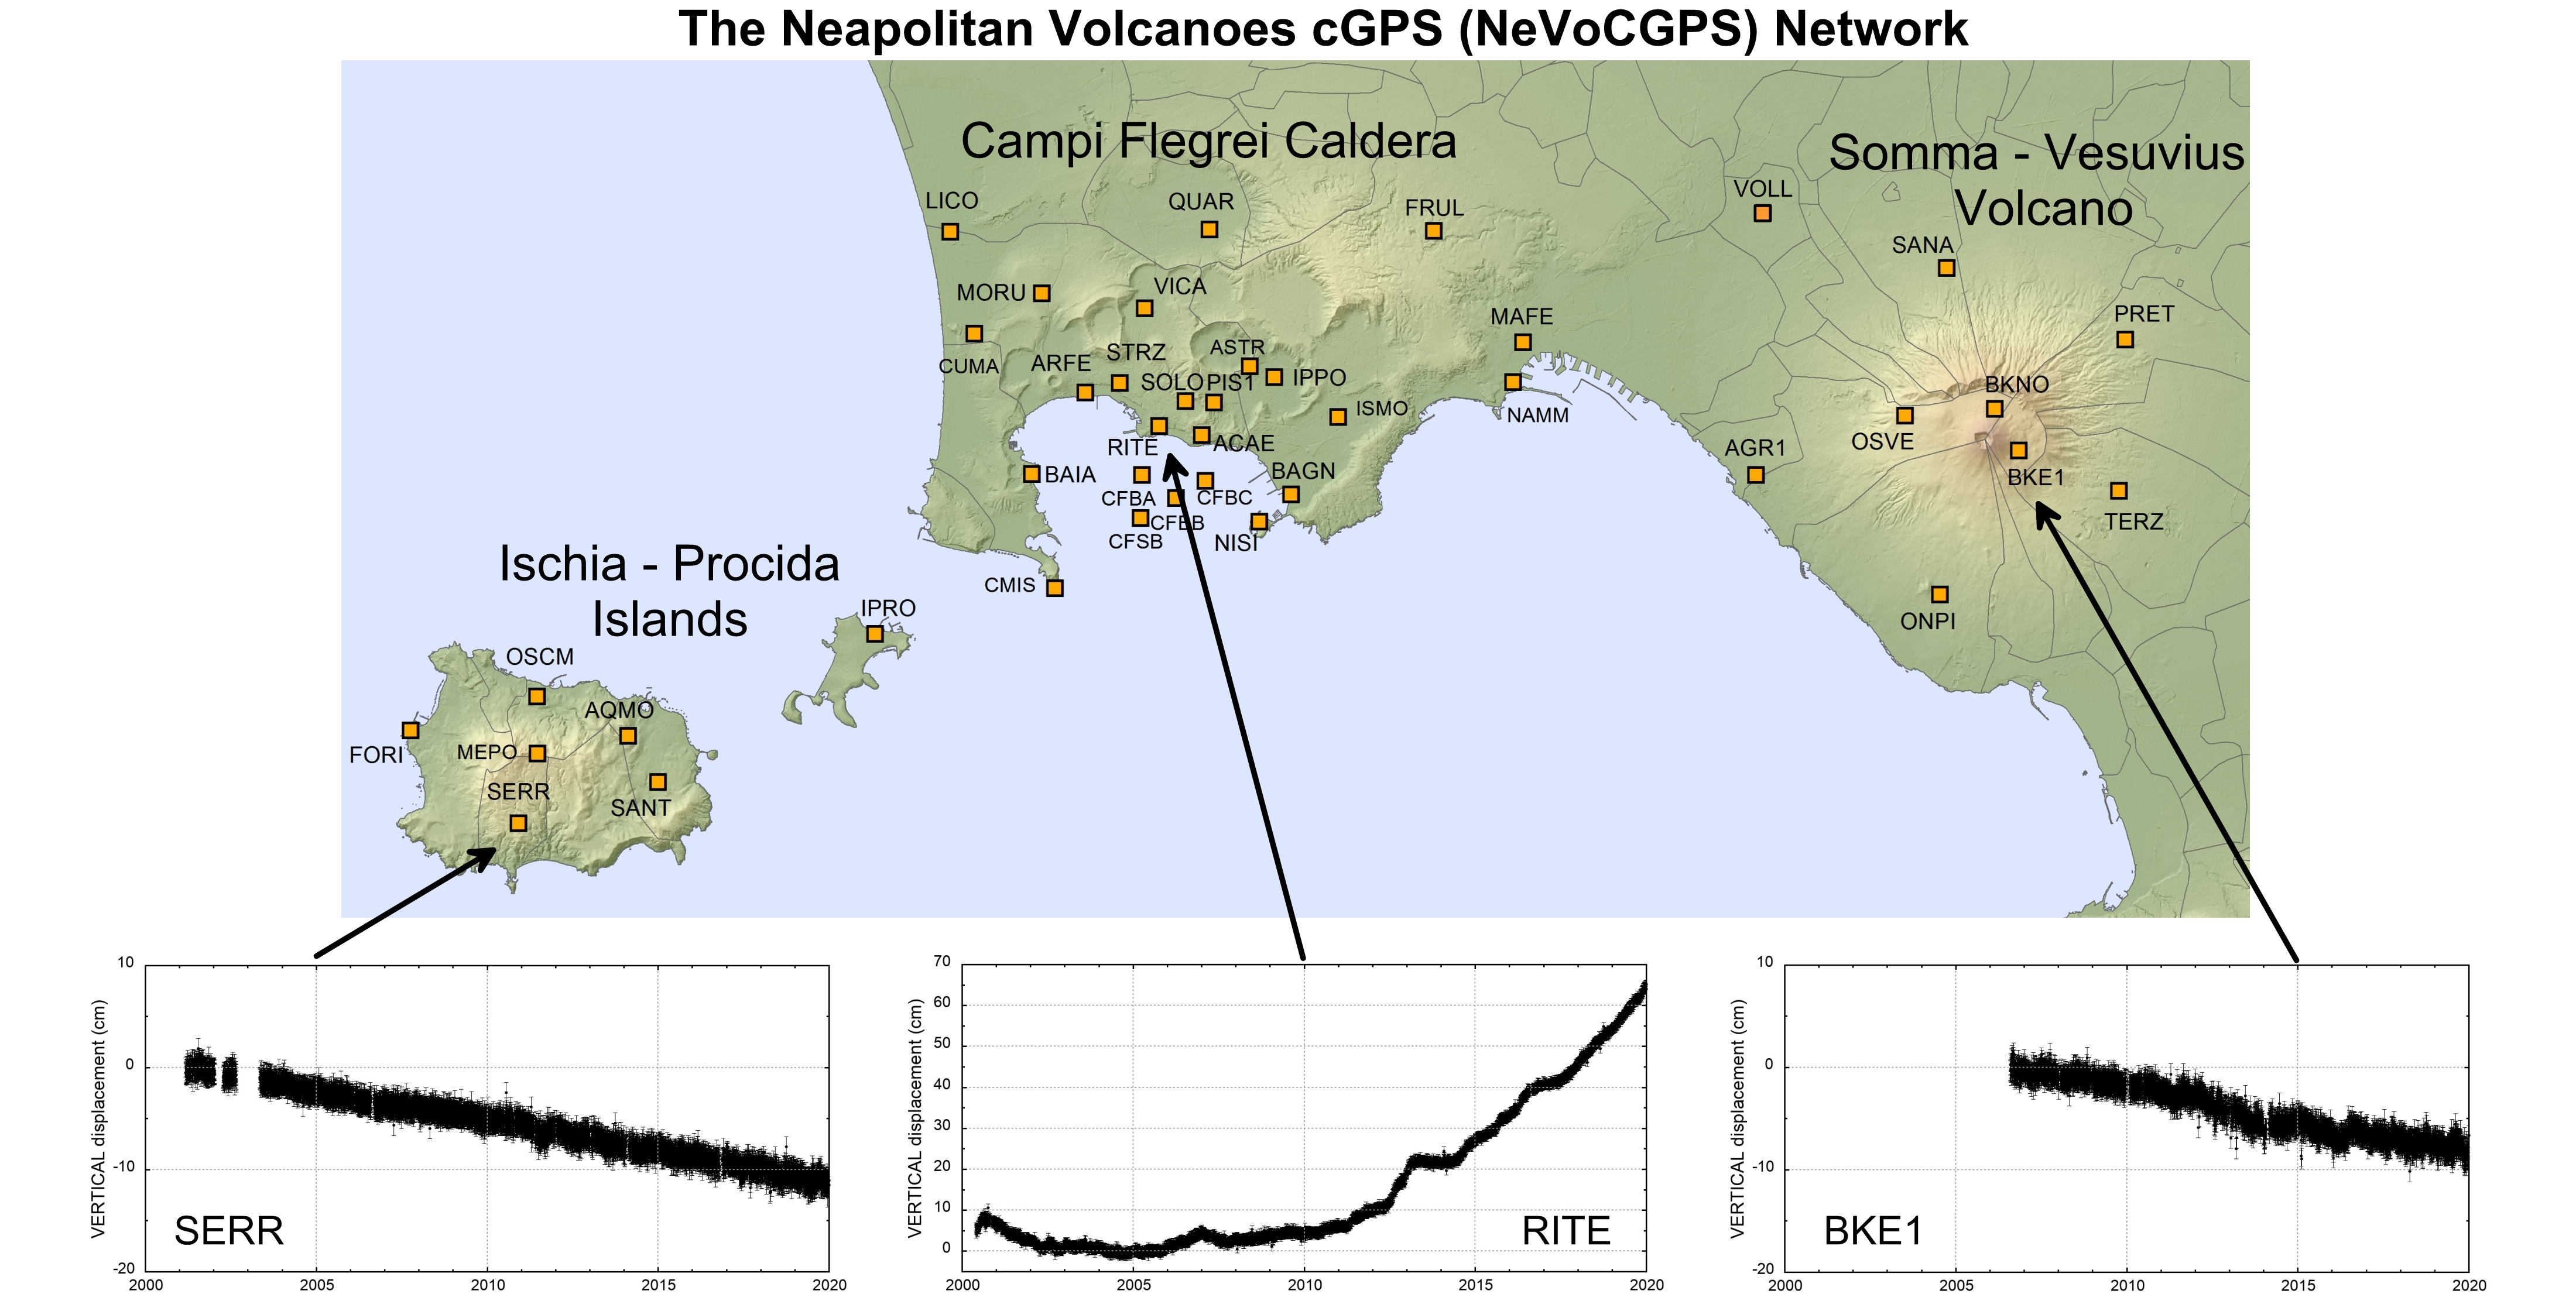
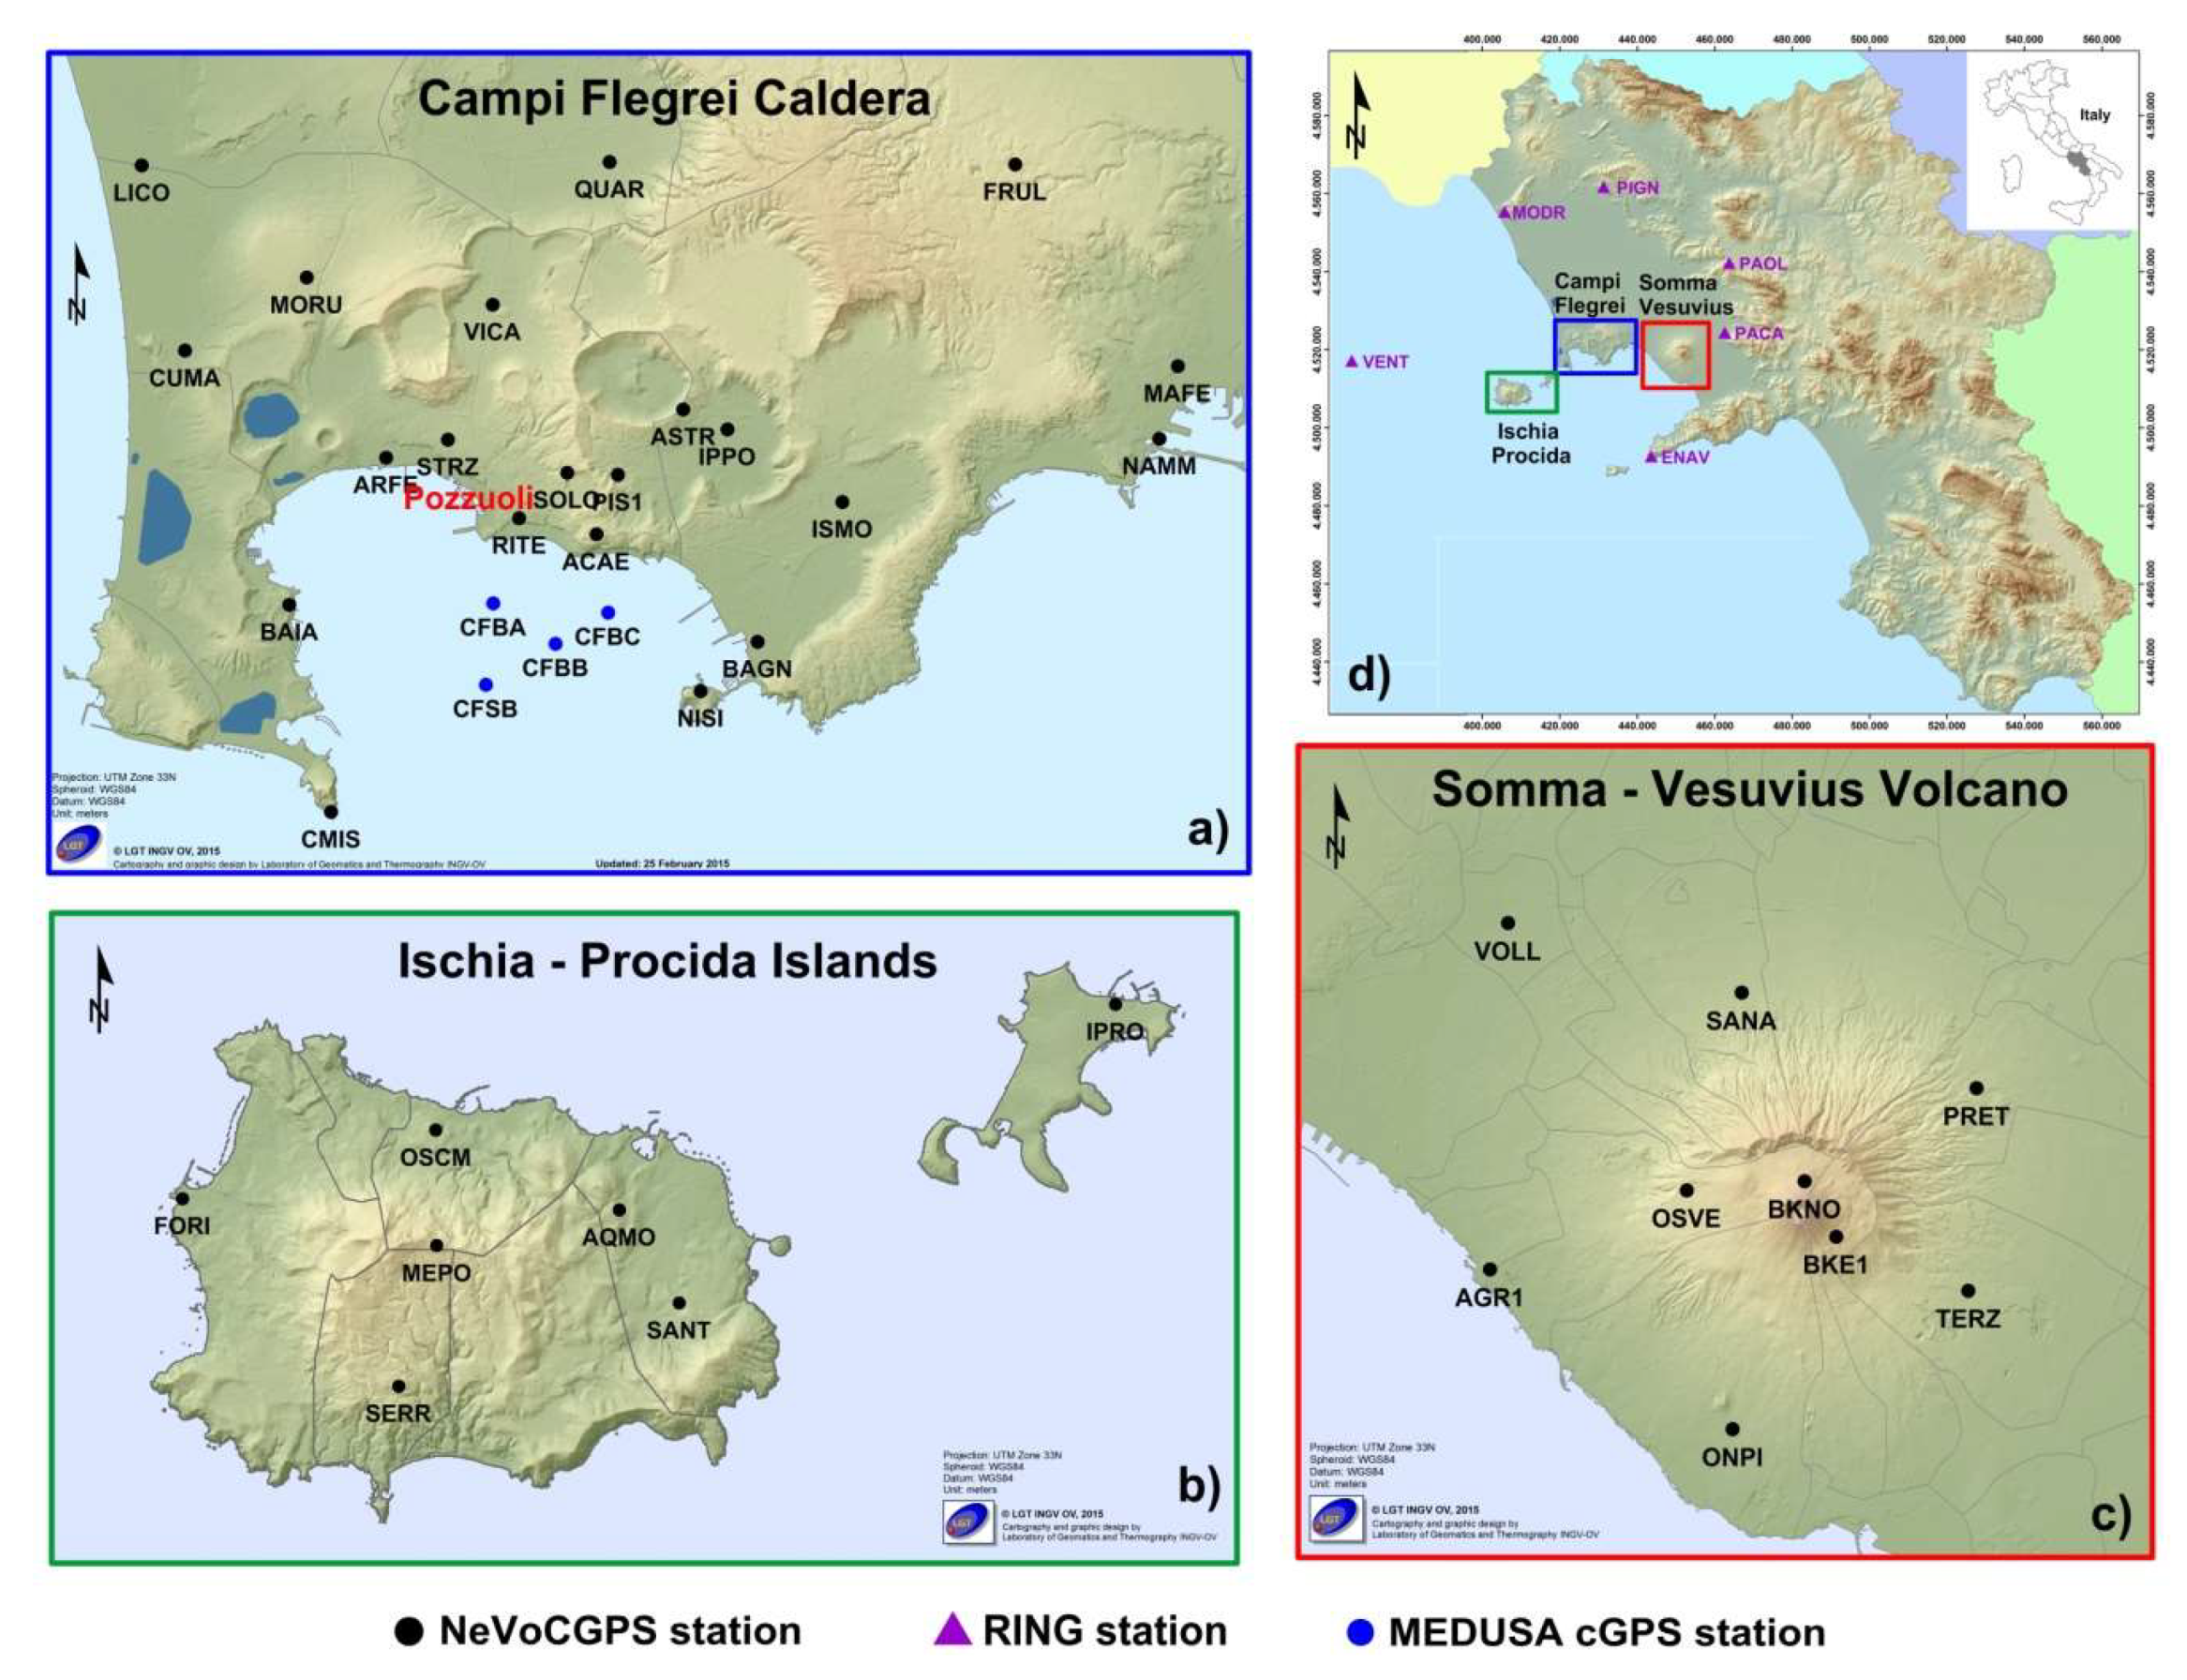
2. The Neapolitan Volcanoes Continuous GPS Network

The Neapolitan Volcanoes Continuous GPS (NeVoCGPS) network, operated by the Istituto Nazionale di Geofisica e Vulcanologia–Osservatorio Vesuviano (INGV-OV), was developed to monitor and quantify ground deformation due to volcanic and seismic activity at CFc, the Somma–Vesuvius volcano, and Ischia–Procida Islands [16,43,44]. The network comprises 37 continuous GPS (cGPS) stations (black dots in Figure 2a–c).
For further details on NeVoCGPS network design, instrumentation, and data management, the reader is referred to [16,43].
At present, 21 stations of the NeVoCGPS network are operating on land in the Campi Flegrei area, seven stations on Ischia and Procida islands, and nine stations on the Somma–Vesuvius volcanic complex (black dots in Figure 2a–c and Table 1). Some stations started operating as early as 2000.
The seafloor sector of the caldera is monitored by the MEDUSA (Multiparametric Elastic-beacon Devices and Underwater Sensor Acquisition system) marine infrastructure consisting of four instrumented buoys deployed in early 2016 in the Gulf of Pozzuoli [45]. A cGPS station was installed on top (blue dots in Figure 2a and Table 1) of each of the four elastic-beacon buoys, which in turn are rigidly connected by a steel cable or pole to the ballast on the sea bottom. This methodology is suitable for seafloor deformation measurements in shallow water (less than 100 m in depth) [45,46,47]. For more details on MEDUSA infrastructure, buoy design, and seafloor module equipment the reader is referred to [45,47].

3. Data Processing

The cGPS data of the NeVocGPS network were processed using the Bernese GPS software v. 5.0 [48] on a daily basis with the IGS final orbits and Earth rotation parameters (ERPs) [49].
The principal parameters and models used in GPS data processing strategy are reported in Table 2.
Since 2000, important updates in the processing strategies have been adopted by the IGS Analysis Centers and different reference frames have been realized [53,54,55]. Due to these changes, the resulting time series parameters and the combined IGS products are highly inhomogeneous and inconsistent over time [56].
Two reprocessing campaigns (repro1 and repro2) were performed by the IGS in 2008 [56,57] and in 2015 [53], respectively, to obtain homogeneous products.
To obtain high-precision results, all the cGPS data collected by the NeVoCGPS network during the full time period (2000–2019) were processed using the same processing strategies, the updated products, and the most recent models.
Station discontinuities due to antenna calibration file updates or associated with equipment changes were estimated and corrected in the time series. The geodetic datum was realized by three No-Net Translation conditions imposed on a set of eight IGb14 reference stations (Minimum Constraint Solution), which were included in the processing.
To highlight the volcanic deformation and remove the background regional tectonic pattern, the processing results (time series and velocity fields) were transformed into a local reference frame defined by six stations of the INGV RING (Rete Integrata Nazionale GNSS) network [58] located outside the Neapolitan volcanic area (purple triangles in Figure 2a) and also included in the cGPS data processing. The velocities of the selected RING stations reflect the tectonic motion of the area. The velocities, uncertainties, and noise properties of the six RING station were estimated using the Hector software package [59], based on the maximum likelihood estimation algorithm (MLE). A power law plus white noise model was assumed to take into account the temporal correlated noise in the time series and to compute more realistic uncertainties for the velocities [60,61]. An annual and semiannual seasonal signal were estimated and removed. The results of the RING time series analysis are presented in Table 3.
The local reference frame was realized by subtracting a mean horizontal velocity (17.1 mm/y and 21.5 mm/y, in the north and east component, respectively) of the six RING stations (Table 3) from the time series of the NeVoCGPS network. The tectonic contribution to the vertical component was assumed to be negligible and no correction was applied.
To take into account the motion of the buoys, the MEDUSA cGPS data were processed in kinematic mode with the RTKLIB ver. 2.4.2 software [62] to obtain positions of the buoys every 30 s. The cGPS station LICO (see Figure 2a) was the reference in data processing [45,46,47].
To reduce the noise due to weather and sea conditions on the horizontal components [45,46,47], we applied cleaning algorithms to outlier detection and removal, and weekly average to produce less frequent but more accurate positions (a full description of kinematic GPS time series analysis is reported in [47]).

4. Results

The positioning time series of all of the cGPS stations operating in the Neapolitan volcanic area from January 2000 to December 2019 are shown in Figure 3, Figure 4, Figure 5, Figure 6, Figure 7 and Figure 8. The data archive of values in ASCII format is available in the Supplementary Materials.
It is known that software-derived formal positioning errors are overly optimistic, and they should be rescaled by a scaling factor [63]. The mean values of the formal errors for the horizontal and vertical positions are 0.3 and 1 mm, respectively. We used a scaling factor of 10 to obtain a mean, and more realistic accuracies of 3 and 10 mm for the daily horizontal and vertical components, respectively, of the NeVoCGPS stations. For clarity, the rescaled errors are not shown in Figure 3, Figure 4 and Figure 5, Figure 7 and Figure 8, but are reported in data files in the Supplementary Materials.

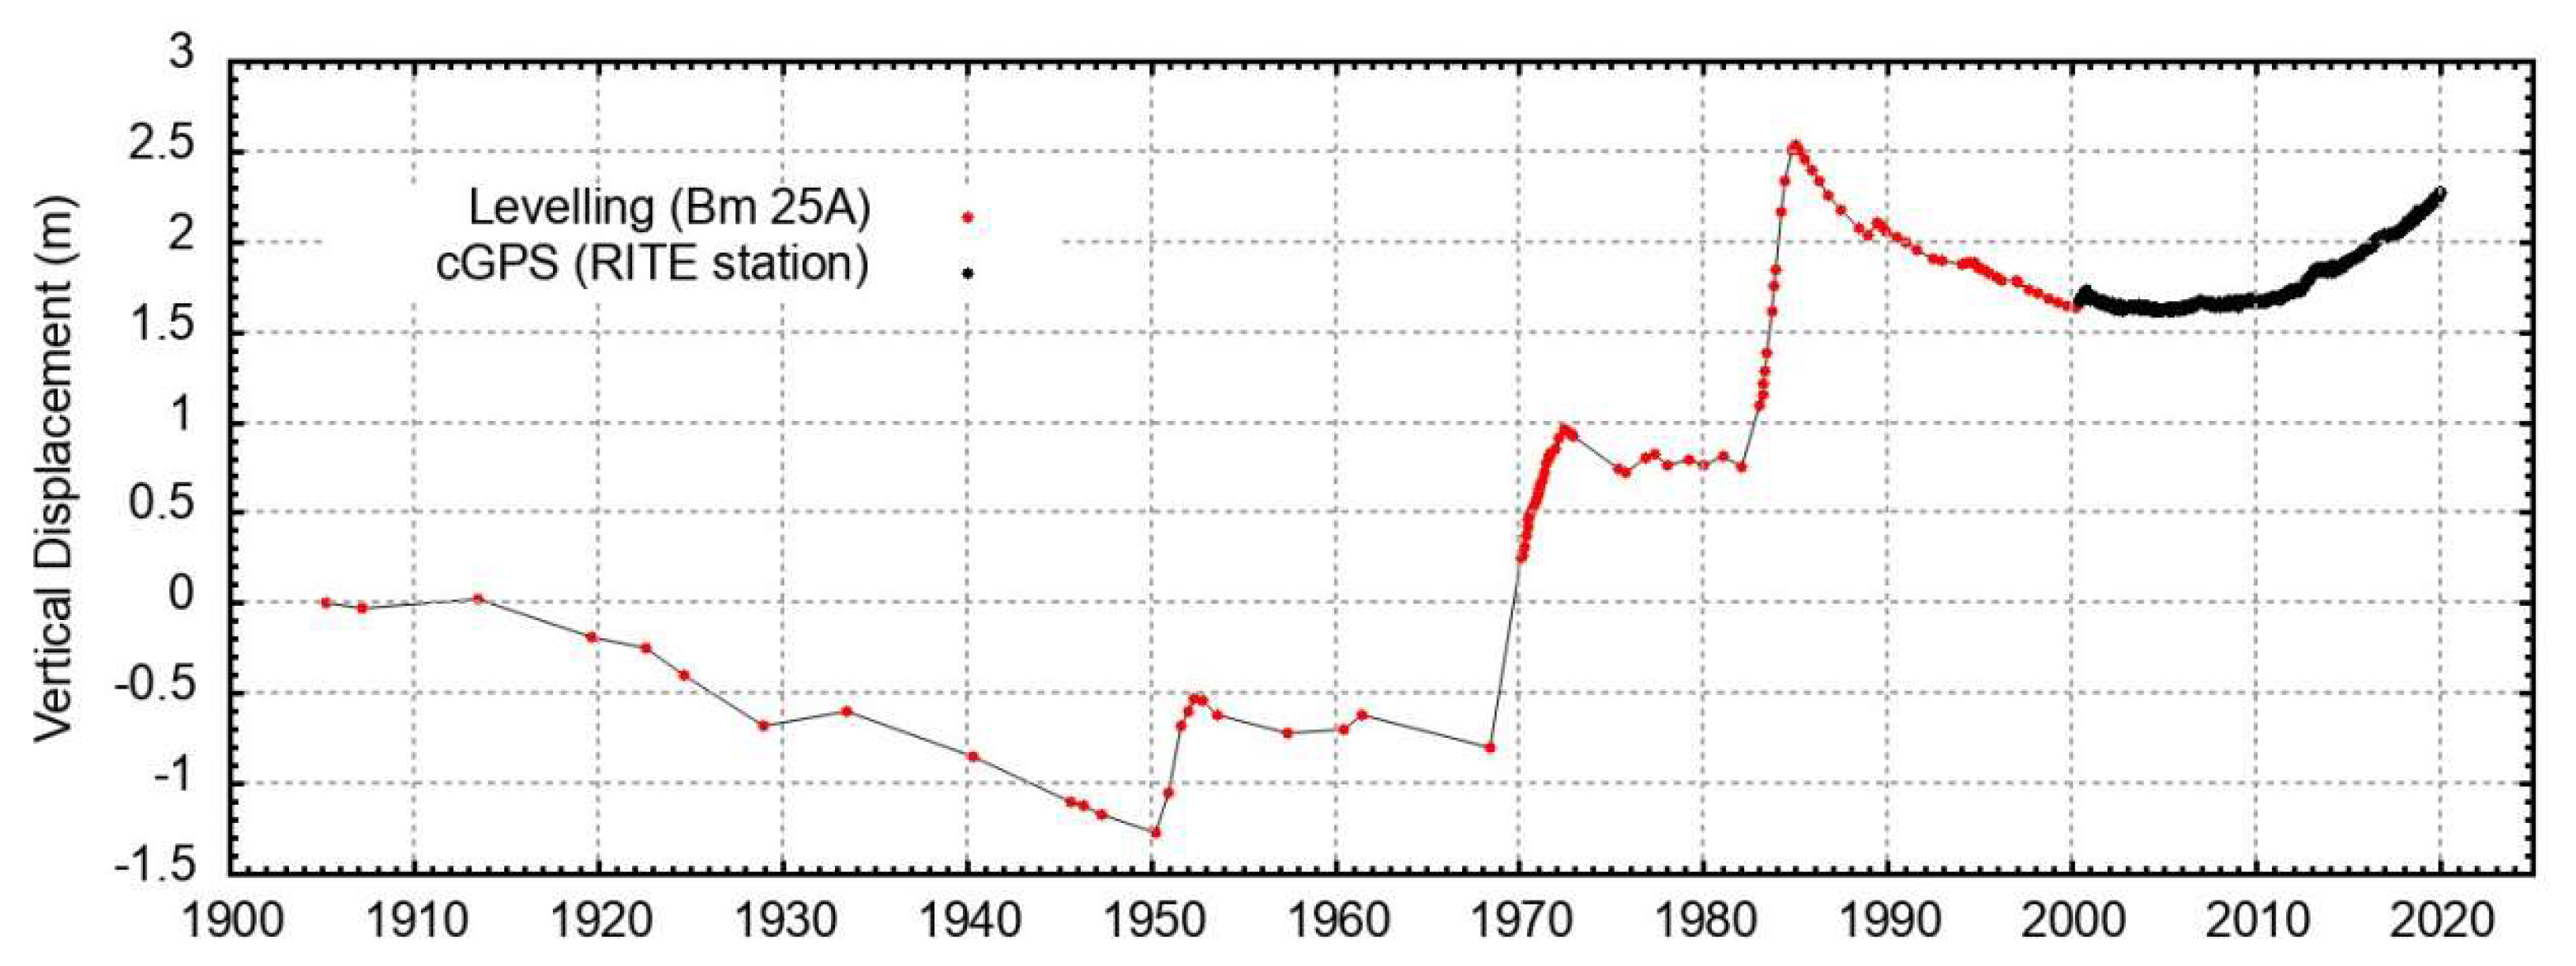
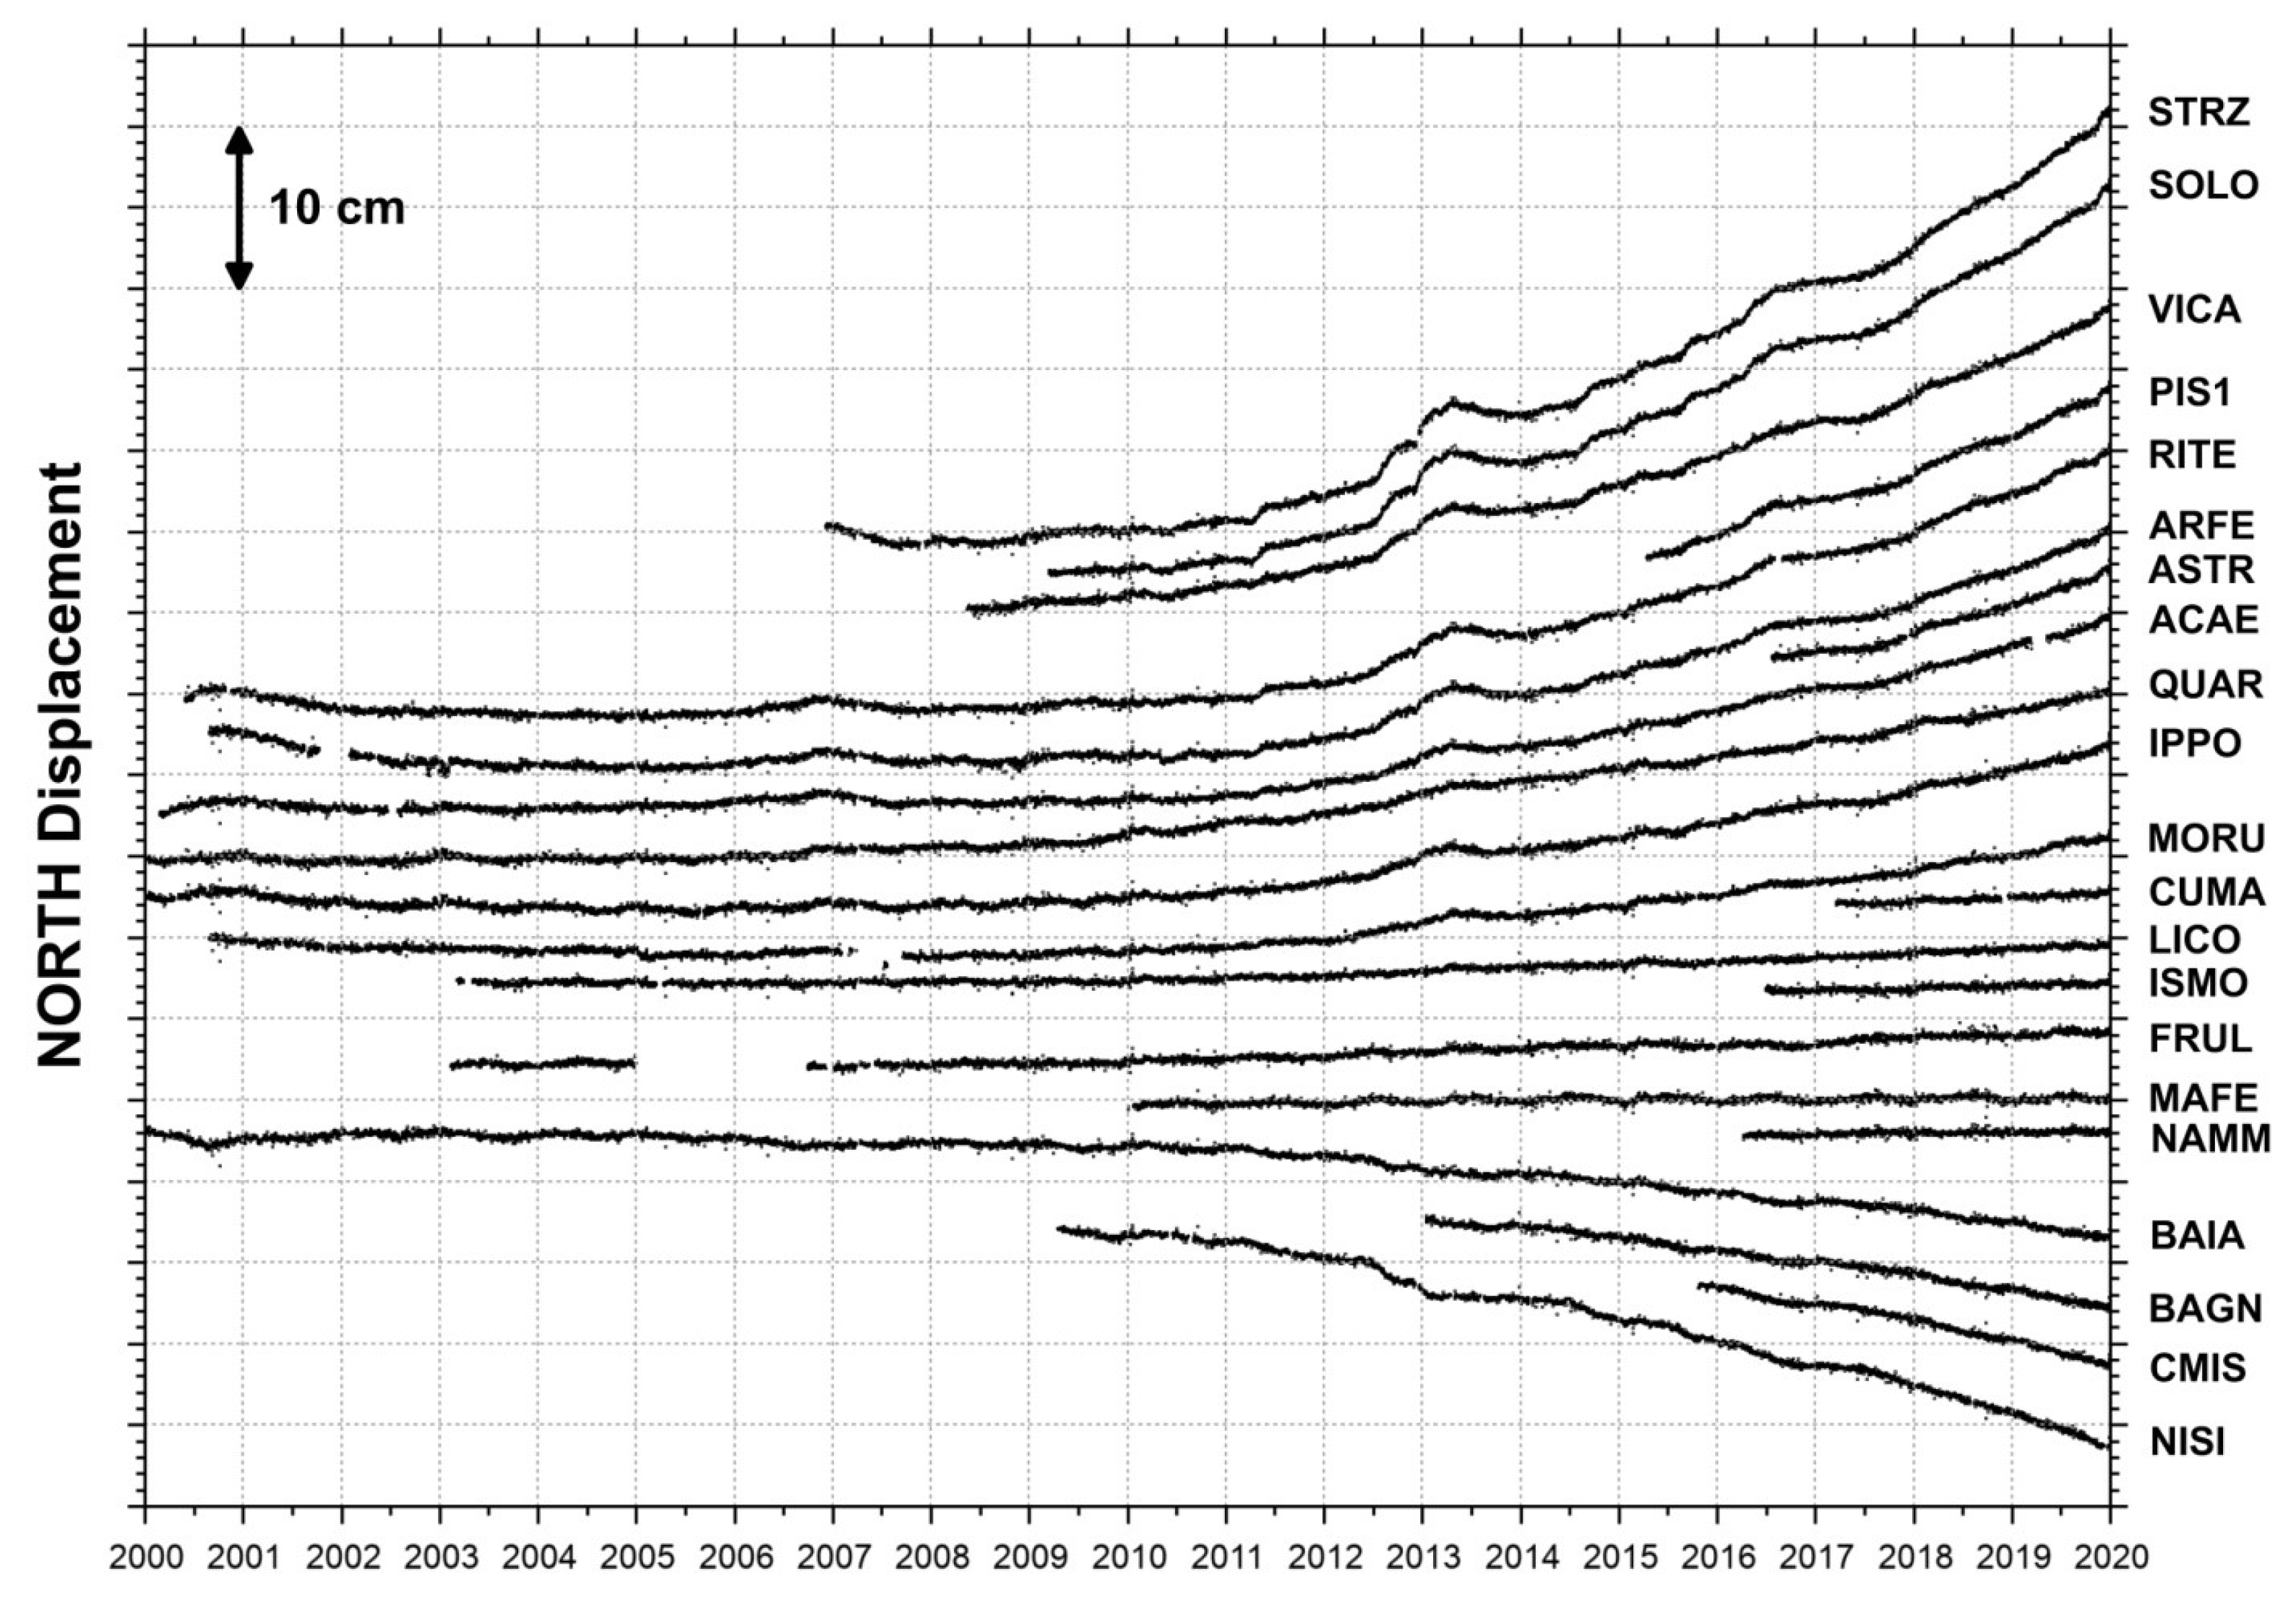
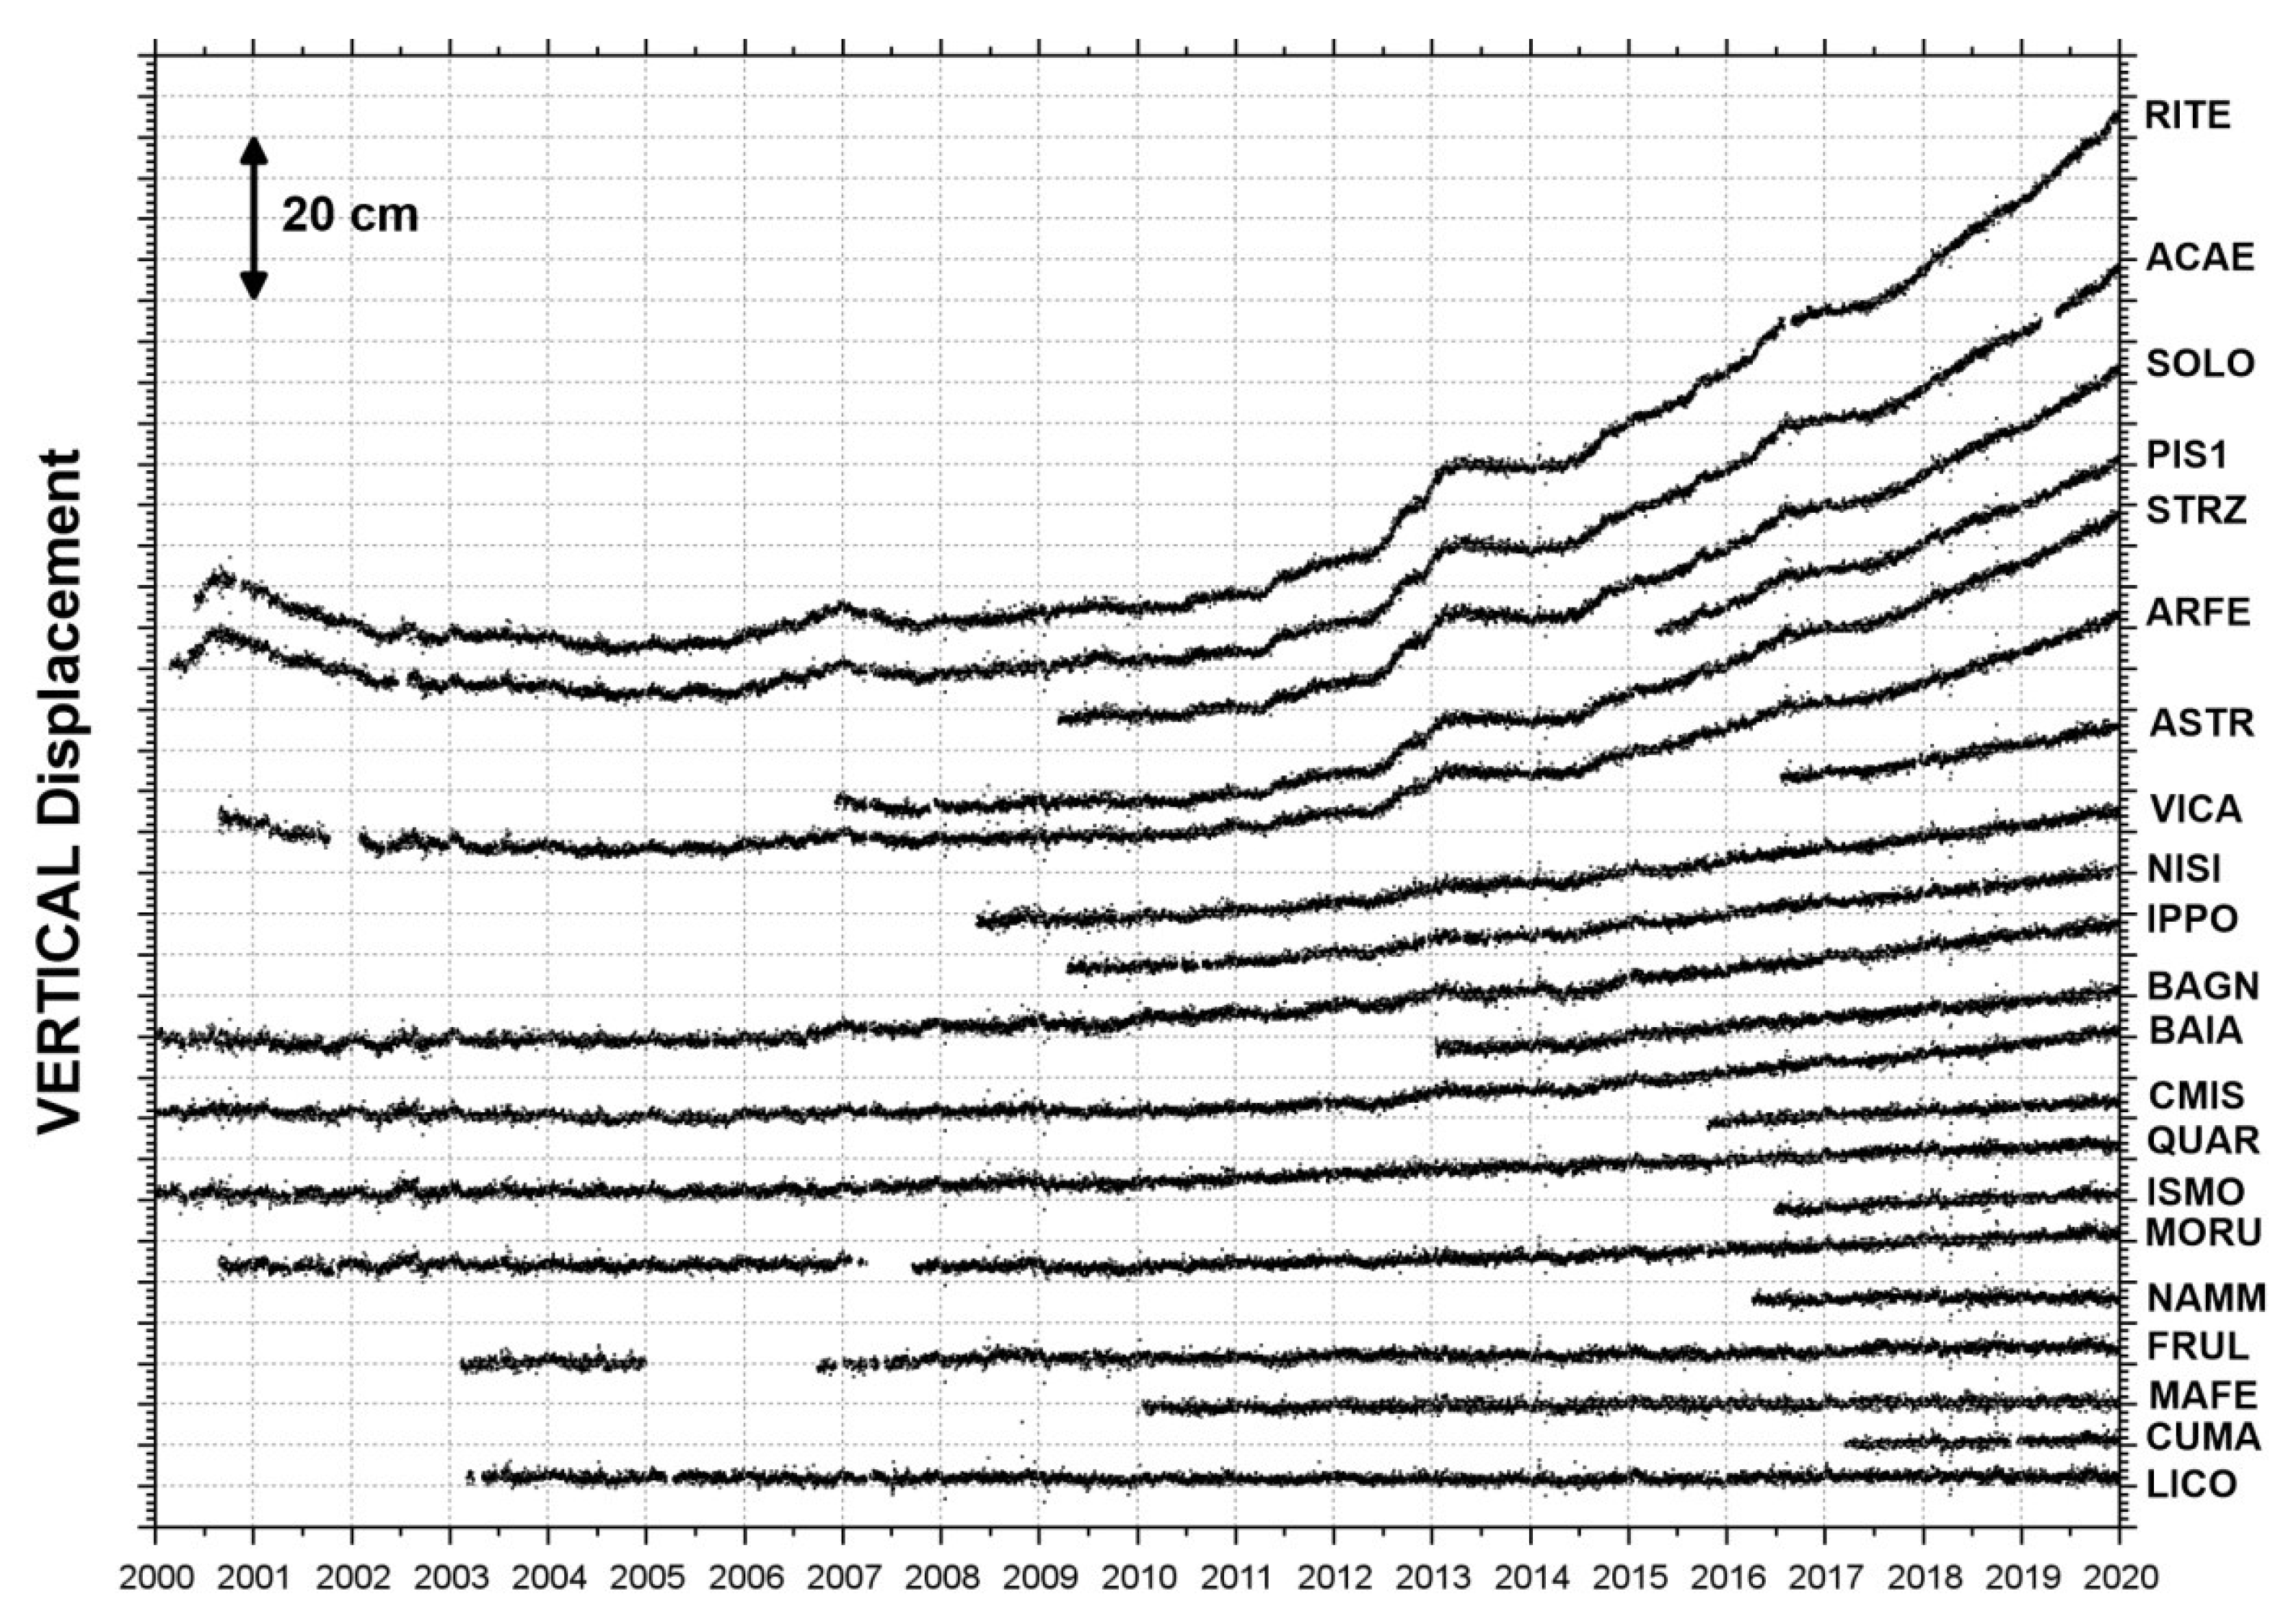
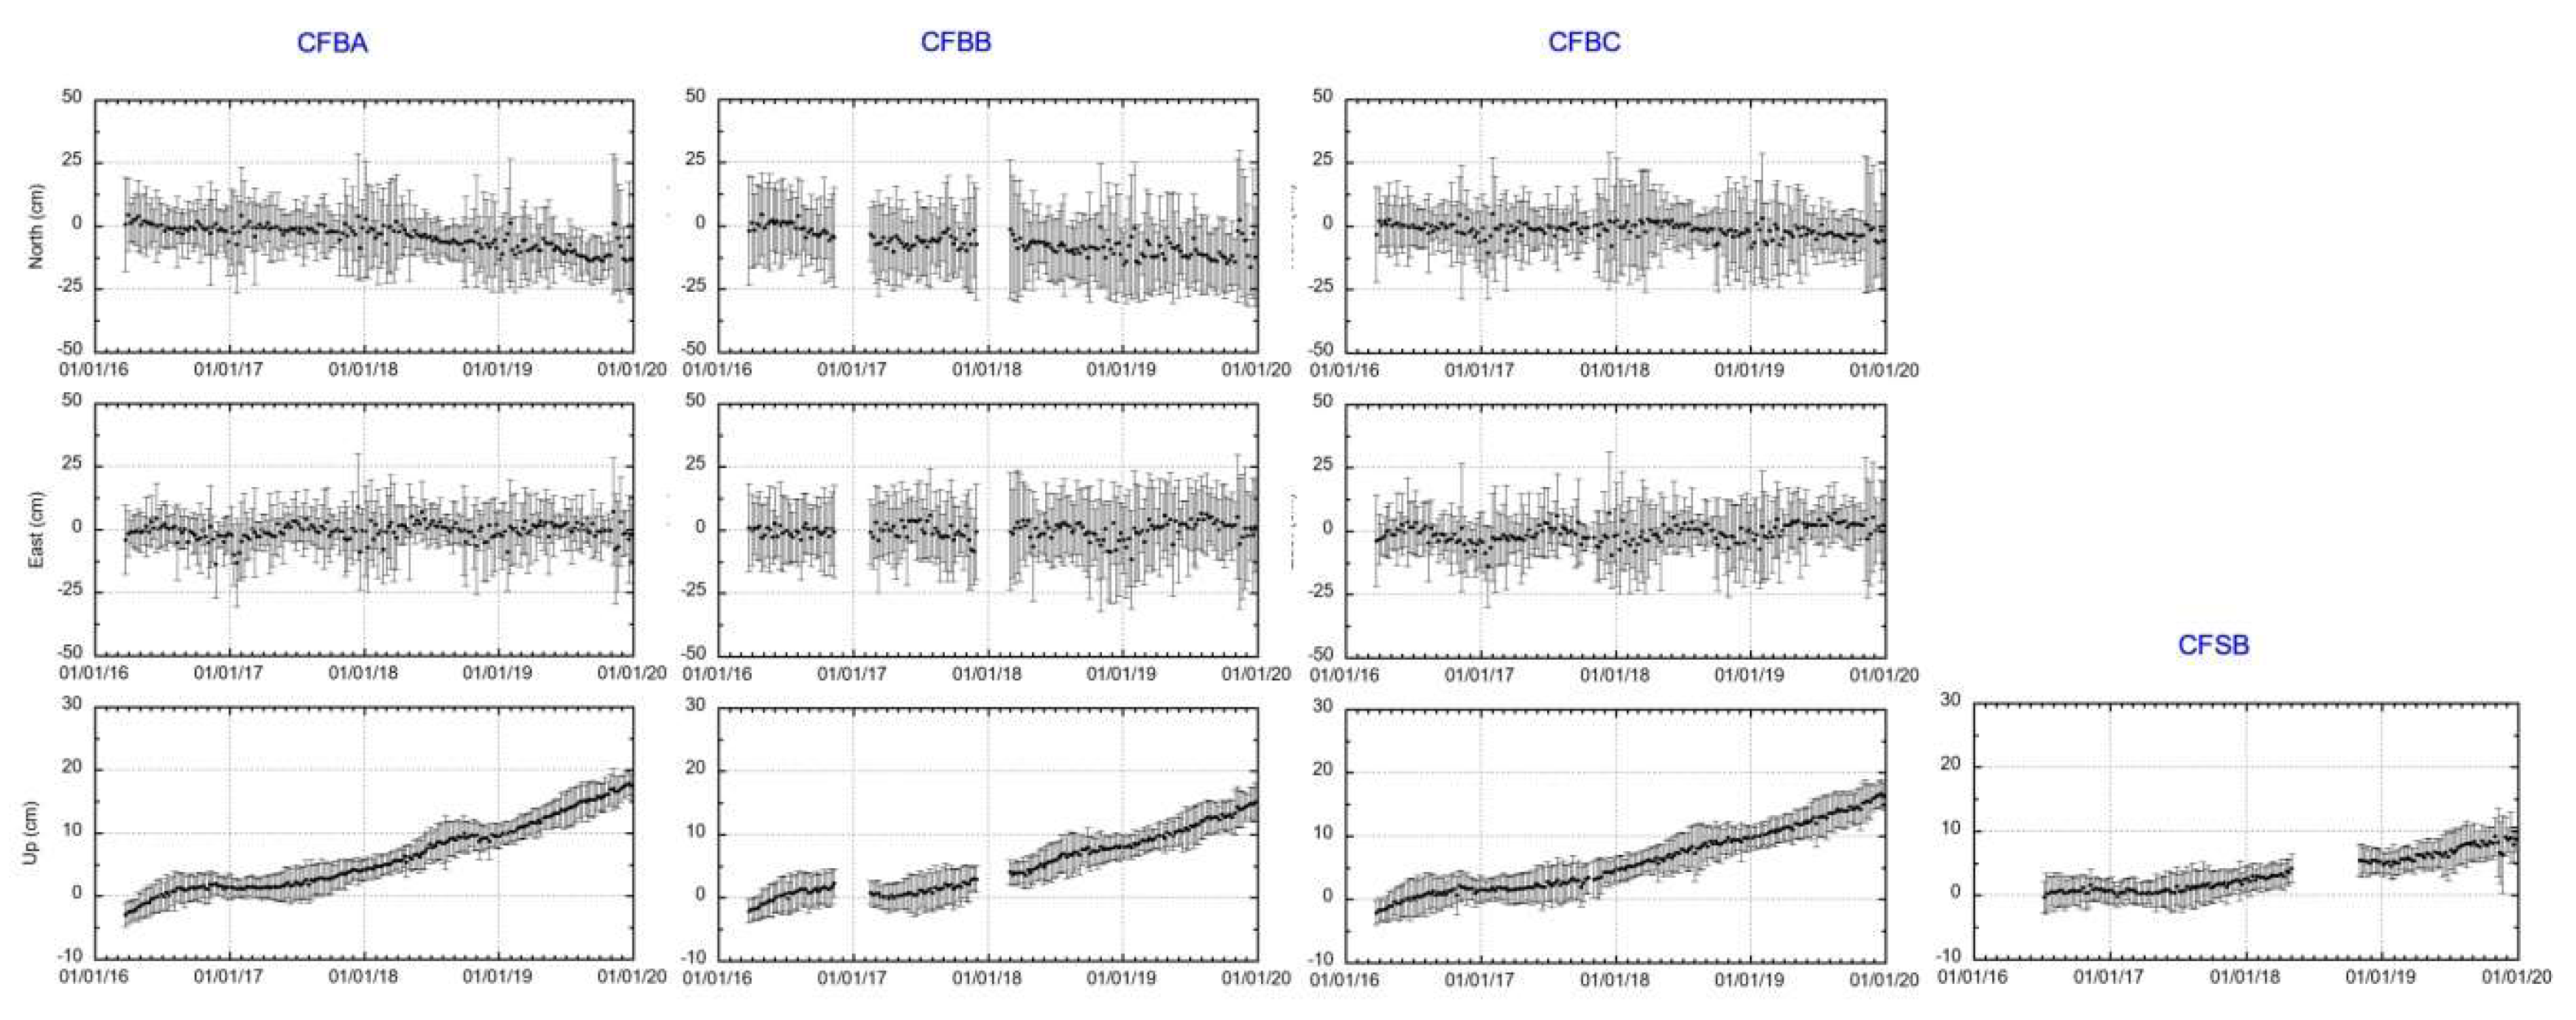
4.1. Campi Flegrei Caldera

The final daily position time series of the 21 stations of the NeVoCGPS network operating in the CF area are shown in Figure 3, Figure 4 and Figure 5, displaying the ground deformation history of the recent volcanic caldera unrest.
The first cGPS stations installed in the CF area detected the 2000 mini-uplift, recording a maximum vertical displacement of about 4 cm [64].
After this episode, the subsidence following the 1982–1984 unrest continued until 2005. Then, the uplift restarted and is ongoing, with different rates in time [16,65,66].
Starting from November 2005, the RITE cGPS station (Figure 2a) located at Rione Terra–Pozzuoli recorded the largest uplift, measuring about 65 cm (Figure 1 and Figure 5). The other cGPS stations show a decrease in the uplift displacement from the caldera center outwards (Figure 5). The horizontal displacements show a radial symmetry centered on Pozzuoli (Figure 3 and Figure 4).
Figure 6 shows the weekly filtered MEDUSA GPS time series that highlight the vertical and horizontal displacements of the CF marine sector since 2016 [47].
The seafloor deformation pattern is consistent with that observed by the on-land NeVoCGPS stations. The uplift ranges between 8 and 20 cm and the horizontal displacements show a radial trend, despite the data being affected by noise associated with meteorological conditions [47].

4.2. Ischia and Procida Islands

The final daily position time series of the seven stations of the NeVoCGPS network operating at Ischia and Procida islands are presented in Figure 7.
The vertical and horizontal components of the time series are characterized by constant trends. Following the Ischia earthquake, which occurred on 21 August 2017, some cGPS stations (MEPO and OSCM in Figure 2b) recorded detectable coseismic deformations [44,67]. The offsets in time series in Figure 7 have been corrected.
Table 4 shows the results in terms of horizontal and vertical velocities and uncertainties derived from the Ischia–Procida time series analysis with the Hector software package [59]. A power law plus white noise model was used to take into account the temporal correlated noise in the time series. An annual and semiannual seasonal signal were estimated and removed.
Regarding the north component (Figure 7a), the displacements of the SERR and MEPO stations are northward. The FORI, IPRO, OSCM, and AQMO stations have displacements southward, and SANT shows a negligible N–S trend.
Moreover, it is evident that for the east component (Figure 7b), the AQMO, SANT, and IPRO stations move westward. The displacements of OSCM, MEPO, and SERR are also westward, but at smaller rates. Only the FORI station seems to show a negligible E–W trend.
Regarding the vertical component (Figure 7c), all stations, except IPRO, show subsidence. In particular, the MEPO and SERR stations display a significant subsidence. The other sites also experience subsidence, but at a smaller rate.

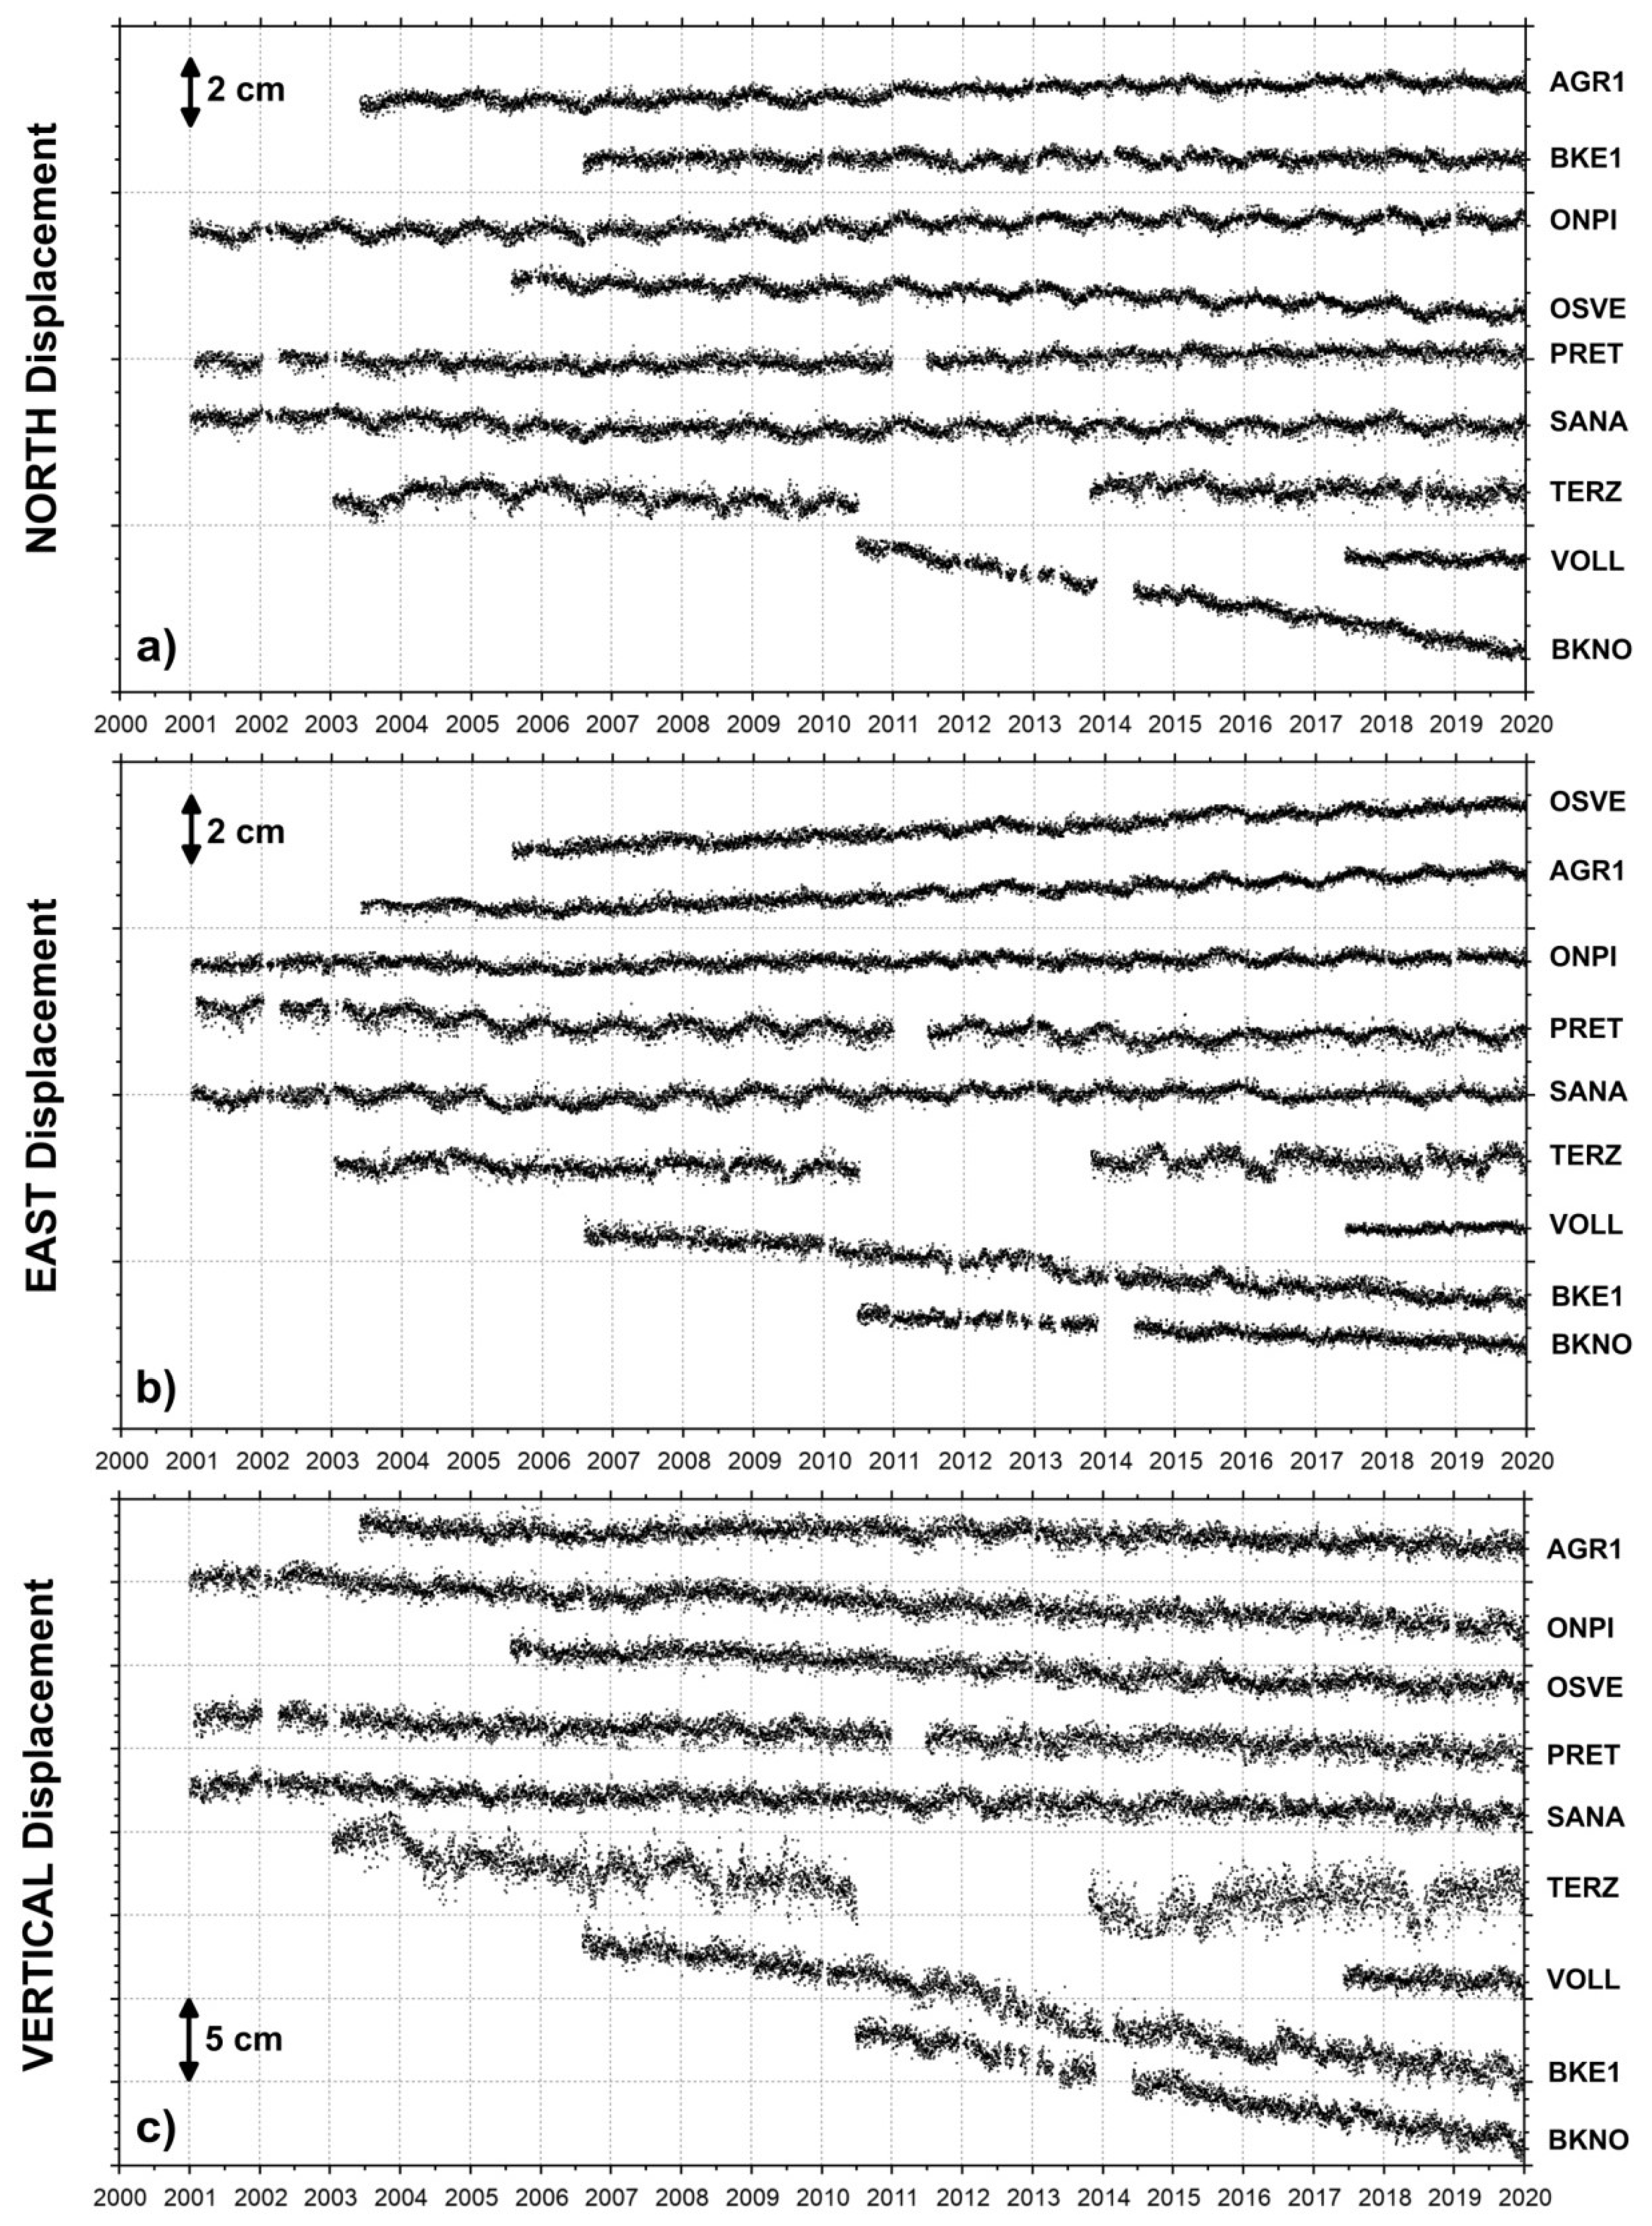
4.3. Somma–Vesuvius Volcano

The final daily position time series of the nine stations of the NeVoCGPS network operating at the Somma–Vesuvius volcano are shown in Figure 8. Additionally, these cGPS stations are characterized by constant and linear trends.
Table 5 shows station velocities and uncertainties derived from the Somma–Vesuvius time series analysis with the Hector software package [59]. A power law plus white noise model was used, and an annual and semiannual seasonal signal were estimated and removed.
All stations display a general subsidence, with higher values on the summit volcano edifice [43,68]. Only the BKNO, BKE1, and OSVE stations have significant horizontal displacements; the other stations show negligible horizontal trends.

5. Discussion and Conclusions

The ground and seafloor deformation pattern highlighted by the GPS time series at CFc in the last 20 years is characterized by the invariance of the uplifted area with the persistence of a bell-shaped geometry (Figure 9). The horizontal displacements show a radial pattern (i.e., axial symmetry) from the zone of maximum vertical deformation (Figure 9a) located at Pozzuoli town in the central part of the caldera (Figure 2a).
The shape of the vertical and horizontal ground deformation pattern is remarkably constant (Figure 9), and independent from the total amount of displacement, as noted in several papers referring to both uplift and subsidence episodes during the past 50 years ([69,70], and references therein).
This characteristic pattern seems to suggest a stable source location during the time interval from 2000 to 2019.
Acocella et al., 2015 [71], studying unrest episodes at calderas over an interval of 26 years (1988–2014), concluded that many unrest episodes do not lead to eruptions, but an eruption is always preceded by an unrest episode. Therefore, it is critically important to understand the source from which the uplift episodes at CFc are produced.
By mainly using leveling, GPS, and InSAR data, several authors have proposed different models to describe the source of the ground deformations at CFc ([72] and references therein).
Despite the large amount of deformation, geochemical, and geophysical data acquired in the last years, the magmatic versus hydrothermal origin of the unrest episodes at Campi CFc is still a matter of debate ([69,70,72], and references therein).
Several authors have interpreted uplift episodes as induced by a magmatic source [73] or as driven by hydrothermal system processes as deeper fluids released by the intruding magma affect the hydrothermal system [74,75,76,77].
Figure 10 shows the horizontal and vertical velocity field retrieved from the GPS time series at Ischia and Procida islands (Table 4). In the eastern part of Ischia island, the horizontal displacements are mainly westward with rates of 2.9 ± 0.1 mm/y in a SW direction (AQMO station) and 2.8 ± 0.1 mm/y in a W direction (SANT station). Procida island shows a horizontal displacement with rate of 3.7 ± 0.1 mm/y in a SW direction (IPRO station). The FORI station, located in western part of the island, displays a rate of 1.1 ± 0.1 mm/y in a S direction, indicating a condition of greater stability in this part of the island. The velocity vectors of MEPO station (2.6 ± 0.3 mm/y), located on summit of Mount Epomeo, and SERR station (3.6 ± 0.1 mm/y) on the central-western part of the island show velocity pointing towards N–NW, whereas OSCM station, in the north part of the island, has a rate of 3.1 ± 0.1 mm/y in a SW direction. It seems that the area between Monte Epomeo and Casamicciola is an area of accumulation of compressive strain [29,30]. This area is precisely the one affected by the earthquake of 21 August 2017 [29,30,44].
The vertical GPS velocity field (Figure 10) displays a general subsidence, with maximum rates recorded at the MEPO (−11.2 ± 1 mm/y) and SERR (−6.1 ± 0.1 mm/y) stations. The AQMO, FORI, and SANT stations also show subsidence, but at smaller rates. The minimum value is recorded at FORI with −1.3 ± 0.2 mm/y, whereas the IPRO station shows a negligible vertical trend.
Therefore, in the period 2001–2019, the vertical velocity field indicates the general subsidence of the island, whereas the horizontal field shows that the stations in the western part of island have displacement vectors pointing towards the central part, where the highest values of subsidence are recorded.
Figure 11 shows the horizontal and vertical GPS velocity field at the Somma–Vesuvius volcano in the time span of 2001–2019 (Table 5).
The dynamics of the volcano are characterized by a general subsidence with maximum rates recorded at the BKNO (7.2 ± 0.2 mm/y) and BKE1 (−6.2 ± 0.3) stations, located on Vesuvius, the younger part of the volcano. The stations installed on Somma, the oldest part of the volcano, also display subsidence, but at smaller rates (Table 5). The GPS stations with the highest rates are those installed at higher altitudes, i.e., those with highest potential energy [34]. From Vesuvius to Somma, the subsidence rate decreases until reaching the minimum values on the coast. These values are in agreement with data from the tide gauge network [78] and from the levelling measurements [68]. These last two considerations show how the vertical displacements are influenced by the topography of the volcano [79,80].
The presence of the volcano does not appear to affect the horizontal velocities of the GPS stations (Figure 11). In fact, as already mentioned, only the BKNO (3.4 ± 0.1 SW), BKE1 (1.6 ± 0.1 W), and OSVE (1.2 ± 0.1 SE) stations have horizontal velocities greater than 1 mm/y, whereas the other stations show a negligible horizontal trend.
The complete dataset of the GPS time series from January 2000 to December 2019 presented in this study is available in the Supplementary Materials. These data can be useful for the scientific community to improve the knowledge on volcano dynamics and volcanic and seismic source models, in addition to possibly discriminating a magmatic versus a hydrothermal origin of the uplift and subsidence episodes at Campi Flegrei caldera; the data can also provide useful information for volcanic hazard assessment of the Neapolitan area.

Supplementary Materials

The following are available online at https://www.mdpi.com/article/10.3390/rs13142725/s1, Dataset: NeVoCGPS_MEDUSA_timeseries_2000_2019.rar.

Author Contributions

Conceptualization, P.D.M. and U.T.; methodology, P.D.M., M.D., G.B., G.S., U.T.; software, P.D.M.; writing—original draft preparation, P.D.M. and U.T.; investigation, P.D.M., M.D., G.B., G.S., U.T.; writing—review and editing, P.D.M. and U.T. All authors have read and agreed to the published version of the manuscript.

Funding

This research benefited from founding provided by the Agreement between Istituto Nazionale di Geofisica e Vulcanologia and the Italian Presidenza del Consiglio dei Ministri, Dipartimento della Protezione Civile (DPC). This paper does not necessarily represent DPC official opinion and Policies.

Acknowledgments

Authors are strongly indebted to two anonymous reviewers, who contributed to improve the paper. We thank INGV-OV staff involved in the management and maintenance of the cGPS stations. We are grateful to Sergio Guardato and Giovanni Iannaccone for providing data from MEDUSA marine infrastructure. Finally, we thank G. Vilardo, E. Bellucci Sessa, and the INGV-OV Laboratorio di Geomatica e Cartografia for providing maps.

Conflicts of Interest

The authors declare no conflict of interest.

References

  1. Ricci, T.; Barberi, F.; Davis, M.S.; Isaia, R.; Nave, R. Volcanic risk perception in the Campi Flegrei area. J. Volcanol. Geotherm. Res. 2013, 254, 118–130. [Google Scholar] [CrossRef]
  2. Orsi, G.; de Vita, S.; Di Vito, M.A. The restless, resurgent Campi Flegrei nested caldera (Italy): Constraints on its evolution and configuration. J. Volcanol. Geotherm. Res. 1996, 74, 179–214. [Google Scholar] [CrossRef]
  3. Deino, A.L.; Orsi, G.; de Vita, S.; Piochi, M. The age of the Neapolitan Yellow Tuff caldera forming eruption (Campi Flegrei caldera–Italy) assessed by 40Ar/39Ar dating method. J. Volcanol. Geotherm. Res. 2004, 133, 157–170. [Google Scholar] [CrossRef]
  4. Vitale, S.; Isaia, R. Fractures and faults in volcanic rocks (Campi Flegrei, southern Italy): Insight into volcano-tectonic processes. Int. J. Earth Sci. 2014, 103, 801–819. [Google Scholar] [CrossRef]
  5. Di Vito, M.A.; Isaia, R.; Orsi, G.; Southon, J.; de Vita, S.; D’Antonio, M.; Pappalardo, L.; Piochi, M. Volcanism and deformation since 12,000 years at the Campi Flegrei caldera (Italy). J. Volcanol. Geotherm. Res. 1999, 91, 221–246. [Google Scholar] [CrossRef]
  6. Isaia, R.; Marianelli, P.; Sbrana, A. Caldera unrest prior to intense volcanism in Campi Flegrei (Italy) at 4.0 ka B.P.: Implications for caldera dynamics and future eruptive scenarios. Geophys. Res. Lett. 2009, 36, L21303. [Google Scholar] [CrossRef]
  7. Smith, V.C.; Isaia, R.; Pearce NJ, G. Tephrostratigraphy and glass compositions of post-15 kyr Campi Flegrei eruptions: Implications for eruption history and chronostratigraphic markers. Quat. Sci. Rev. 2011, 30, 3638–3660. [Google Scholar] [CrossRef]
  8. Di Renzo, V.; Arienzo, I.; Civetta, L.; D’Antonio, M.; Tonarini, S.; Di Vito, M.A.; Orsi, G. The magmatic feeding system of the Campi Flegrei caldera: Architecture andtemporal evolution. Chem. Geol. 2011, 281, 227–241. [Google Scholar] [CrossRef]
  9. Di Vito, M.; Acocella, V.; Aiello, G.; Barra, D.; Battaglia, M.; Carandente, A.; Del Gaudio, C.; de Vita, S.; Ricciardi, G.P.; Ricco, C.; et al. Magma transfer at Campi Flegrei caldera (Italy) before the 1538 AD eruption. Sci. Rep. 2016, 6, 32245. [Google Scholar] [CrossRef]
  10. Günther, R.T. Contribution to the Study of Earth Movements in the Bay of Naples; Parker and Son: Oxford, UK, 1903. [Google Scholar]
  11. Parascandola, A. I Fenomeni Bradisismici del Serapeo di Pozzuoli; Stabilimento Tipografico G. Genovese: Naples, Italy, 1947. [Google Scholar]
  12. Dvorak, J.J.; Mastrolorenzo, G. The mechanisms of recent vertical crustal movements in Campi Flegrei caldera, southernItaly. Geol. Soc. Am. 1991, 263, 1–47. [Google Scholar]
  13. Morhange, C.; Bourcier, M.; Laborel, J.; Giallanella, C.; Goiran, J.P.; Crimaco, L.; Vecchi, L. New data on historical relative sea level movements in Pozzuoli, Phlaegrean Fields, Southern Italy. Phys. Chem. Earth (Part A) 1999, 24, 349–354. [Google Scholar] [CrossRef]
  14. Morhange, C.; Marriner, N.; Laborel, J.; Todesco, M.; Oberlin, C. Rapid sea-level movements and non eruptive crustal deformations in the Phlegrean Fields caldera, Italy. Geology 2006, 34, 93–96. [Google Scholar] [CrossRef]
  15. Del Gaudio, C.; Aquino, I.; Ricciardi, G.P.; Ricco, C.; Scandone, R. Unrest episodes at Campi Flegrei: A reconstruction of vertical ground movements during 1905–2009. J. Volcanol. Geoth. Res. 2010, 185, 48–56. [Google Scholar] [CrossRef]
  16. De Martino, P.; Tammaro, U.; Obrizzo, F. GPS time series at Campi Flegrei caldera (2000–2013). Ann. Geophys. 2014, 57, S0213. [Google Scholar] [CrossRef]
  17. Chiodini, G.; Caliro, S.; De Martino, P.; Avino, R.; Ghepardi, F. Early signals of new volcanic unrest at Campi Flegrei caldera? Insights from geochemical data and physical simulations. Geology 2012, 40, 943–946. [Google Scholar] [CrossRef]
  18. Chiodini, G.; Vandemeulebrouck, J.; Caliro, S. Evidence of thermal-driven processes triggering the 2005–2014 unrest at Campi Flegrei caldera. Earth Planet. Sci. Lett. 2015, 414, 58–67. [Google Scholar] [CrossRef]
  19. Chiodini, G.; Paonita, A.; Aiuppa, A.; Costa, A.; Caliro, S.; De Martino, P.; Acocella, V.; Vandemeulebrouck, J. Magmas near the critical degassing pressure drive volcanic unrest towards a critical state. Nat. Commun. 2016, 7, 1–9. [Google Scholar] [CrossRef] [Green Version]
  20. Chiodini, G.; Selva, J.; Del Pezzo, E.; Marsan, D.; De Siena, L.; D’Auria, L.; Bianco, F.; Caliro, S.; De Martino, P.; Ricciolino, P.; et al. Clues on the origin of post-2000earthquakes at Campi Flegrei caldera (Italy). Sci. Rep. 2017, 7, 1–10. [Google Scholar] [CrossRef]
  21. Tamburello, G.; Caliro, S.; Chiodini, G.; De Martino, P.; Avino, R.; Minopoli, C.; Carandente, A.; Rouwet, D.; Aiuppa, A.; Costa, A.; et al. Escalating CO2 degassing at the Pisciarelli fumarolic system, and implications for the ongoing Campi Flegrei unrest. J. Volcanol. Geotherm. Res. 2019, 384, 151–157. [Google Scholar] [CrossRef]
  22. Sbrana, A.; Toccaceli, R.M. (Eds.) Carta Geologica Isola d’Ischia; Note illustrative, Regione Campania, Assessorato Difesa del Suolo; LAC: Firenze, Italy, 2011. [Google Scholar]
  23. Carlino, S. The process of resurgence for Ischia Island (southern Italy) since 55 ka: The laccolith model and implications for eruption forecasting. Bull. Volcanol. 2012, 74, 947–961. [Google Scholar] [CrossRef]
  24. Orsi, G.; Gallo, G.; Zanchi, A. Simple shearing block resurgence in caldera depressions. A model from Pantelleria and Ischia. J. Volcanol. Geotherm. Res. 1991, 47, 1–11. [Google Scholar] [CrossRef]
  25. Carlino, S.; Cubellis, E.; Luongo, G.; Obrizzo, F. On the mechanics of caldera resurgence of Ischia Island (Southern Italy). Geol. Soc. Lond. Spec. Publ. 2006, 269, 181–193. [Google Scholar] [CrossRef] [Green Version]
  26. De Vita, S.; Sansivero, F.; Orsi, G.; Marotta, E.; Piochi, M. Volcanological and structural evolution of the Ischia resurgent caldera (Italy) over the past 10 ky. Geol. Soc. Am. Spec. Pap. 2010, 464, 193–241. [Google Scholar] [CrossRef]
  27. Sbrana, A.; Marianelli, P.; Pasquini, G. Volcanology of Ischia (Italy). J. Maps 2018, 14, 494–503. [Google Scholar] [CrossRef]
  28. Di Giuseppe, M.G.; Troiano, A.; Carlino, S. Magnetotelluric imaging of the resurgent caldera on the island of Ischia (southern Italy): Inferences for its structure and activity. Bull. Volcanol. 2017, 79, 85. [Google Scholar] [CrossRef]
  29. Cubellis, E.; Luongo, G.; Obrizzo, F.; Sepe, V.; Tammaro, U. Contribution to knowledge regarding the sources of earthquakes on the island of Ischia (Southern Italy). Nat. Hazards 2020, 100, 955–994. [Google Scholar] [CrossRef]
  30. Carlino, S.; Pino, N.A.; Tramelli, A.; De Novellis, V.; Convertito, V. A common source for the destructive earthquakes in the volcanic island of Ischia (Southern Italy): Insights from historical and recent seismicity. Nat. Hazards 2021. [Google Scholar] [CrossRef]
  31. Selva, J.; Azzaro, R.; Taroni, M.; Tramelli, A.; Alessio, G.; Castellano, M.; Ciuccarelli, C.; Cubellis, E.; Lo Bascio, D.; Porfido, S.; et al. The Seismicity of Ischia Island, Italy: An Integrated Earthquake Catalogue From 8th Century BC to 2019 and Its Statistical Properties. Front. Earth Sci. 2021, 9, 629736. [Google Scholar] [CrossRef]
  32. Brocchini, D.; Principe, C.; Castradori, D.; Laurenzi, M.A.; Gorla, L. Quaternary evolution of the southern sector of the Campanian Plain and early Somma-Vesuvius activity: Insights from the Trecase 1 well. Mineral. Petrol. 2001, 73, 67–91. [Google Scholar] [CrossRef]
  33. Santacroce, R.; Cioni, R.; Marianelli, P.; Sbrana, A.; Sulpizio, R.; Zanchetta, G.; Joron, J.L. Age and whole rock–glass compositions of proximal pyroclastics from the major explosive eruptions of Somma-Vesuvius: A review as a tool for distal tephrostratigraphy. J. Volcanol. Geotherm. Res. 2008, 177, 1–18. [Google Scholar] [CrossRef]
  34. Cioni, R.; Santacroce, R.; Sbrana, A. Pyroclastic deposits as a guide for reconstructing the multi-stage evolution of the Somma-Vesuvius caldera. Bull. Volcanol. 1999, 61, 207–222. [Google Scholar] [CrossRef]
  35. Cioni, R.; Sulpizio, R.; Garruccio, N. Variability of the eruption dynamics during a subplinian event: The Greenish Pumice eruption of Somma-Vesuvius (Italy). J. Volcanol. Geotherm. Res. 2003, 124, 89–114. [Google Scholar] [CrossRef]
  36. Andronico, D.; Cioni, R. Contrasting styles of Mount Vesuvius activity in the period between the Avellino and Pompeii Plinian eruptions, and some implications for assessment of future hazards. Bull. Volcanol. 2002, 64, 372–391. [Google Scholar] [CrossRef] [Green Version]
  37. Stothers, R.B.; Rampino, M.R. Volcanic eruptions in the Mediterranean before A.D. 630 from written and archaeological sources. J. Geophys. Res. 1983, 88, 6357–6371. [Google Scholar] [CrossRef]
  38. Mastrolorenzo, G.; Palladino, D.; Vecchio, G.; Taddeucci, J. The 472 A.D. Pollena eruption of Somma-Vesuvius (Italy) and its environmental impact at the end of the Roman Empire. J. Volcanol. Geotherm. Res. 2002, 113, 19–36. [Google Scholar] [CrossRef]
  39. Rolandi, G.; Bellucci, F.; Cortini, M. A new model for formation of the Somma Caldera. Miner. Petrol. 2004, 80, 27–44. [Google Scholar] [CrossRef]
  40. Del Pezzo, E.; Bianco, F.; Saccorotti, G. Seismic Source Dynamics at Vesuvius Volcano, Italy. J. Volcanol. Geotherm. Res. 2004, 133, 23–39. [Google Scholar] [CrossRef]
  41. De Natale, G.; Troise, C.; Trigila, R.; Dolfi, D.; Chiarabba, C. Seismicity and 3D substructure at Somma-Vesuvius volcano: Evidence for magma quenching. Earth Plan. Sci. Lett. 2004, 221, 181–196. [Google Scholar] [CrossRef]
  42. Cubellis, E.; Luongo, G.; Marturano, A. Seismic hazard assessment at Mt. Vesuvius: The maximum magnitude expected. J. Volcanol. Geotherm. Res. 2007, 162, 139–149. [Google Scholar] [CrossRef]
  43. Tammaro, U.; De Martino, P.; Obrizzo, F.; Brandi, G.; D’Alessandro, A.; Dolce, M.; Malaspina, S.; Serio, C.; Pingue, F. Somma Vesuvius volcano: Ground deformations from CGPS observations (2001–2012). Ann. Geophys. 2013, 56, S0456. [Google Scholar] [CrossRef]
  44. Devoti, R.; De Martino, P.; Pietrantonio, G.; Dolce, M. Coseismic displacements on Ischia island, real-time GPS positioning constraints on earthquake source location. Ann. Geophys. 2018, 61, SE337. [Google Scholar] [CrossRef]
  45. Iannaccone, G.; Guardato, S.; Donnarumma, G.P.; De Martino, P.; Dolce, M.; Macedonio, G.; Chierici, F.; Beranzoli, L. Measurement of seafloor deformation in the marine sector of the Campi Flegrei caldera (italy). J. Geophys. Res. Solid Earth 2018, 123, 66–83. [Google Scholar] [CrossRef] [Green Version]
  46. De Martino, P.; Guardato, S.; Tammaro, U.; Vassallo, M.; Iannaccone, G. A first GPS measurement of vertical seafloor displacement in the Campi Flegrei caldera (Italy). J. Volcanol. Geotherm. Res. 2014, 276, 145–151. [Google Scholar] [CrossRef] [Green Version]
  47. De Martino, P.; Guardato, S.; Donnarumma, G.P.; Dolce, M.; Trombetti, T.; Chierici, F.; Macedonio, G.; Beranzoli, L.; Iannaccone, G. Four Years of Continuous Seafloor Displacement Measurements in the Campi Flegrei Caldera. Front. Earth Sci. 2020, 8, 615178. [Google Scholar] [CrossRef]
  48. Dach, R.; Hugentobler, U.; Fridez, P.; Meindl, M. Bernese GPS Software, version 5.0; Astronomical Institute, University of Bern: Bern, Switzerland, 2007. [Google Scholar]
  49. Dow, J.M.; Neilan, R.E.; Rizos, C. The International GNSS Service in a changing landscape of Global Navigation Satellite Systems. J. Geod. 2009, 83, 191–198. [Google Scholar] [CrossRef]
  50. Mervart, L.; Beutler, G.; Rothacher, M.; Wild, U. Ambiguity resolution strategies using the results of the International GPS Geodynamics Service (IGS). Bull. Geod. 1994, 68, 29–38. [Google Scholar] [CrossRef]
  51. Niell, A.E. Global mapping functions for the atmosphere delay at radio wavelength. J. Geophys. Res. Solid Earth 1996, 101, 3227–3246. [Google Scholar] [CrossRef]
  52. Lyard, F.; Lefevre, F.; Letellier, T.; Francis, O. Modelling the global ocean tides:modern insights from FES2004. Ocean. Dyn. 2006, 56. [Google Scholar] [CrossRef]
  53. Rebischung, P.; Altamimi, Z.; Ray, J.; Garayt, B. The IGS contribution to ITRF2014. J. Geod. 2016, 90, 611–630. [Google Scholar] [CrossRef]
  54. Rebischung, P.; Griffiths, J.; Ray, J.; Schmid, R.; Collilieux, X.; Garayt, B. IGS08: The IGS realization of ITRF2008. GPS Solut. 2012, 1–12. [Google Scholar] [CrossRef]
  55. Altamimi, Z.; Rebischung, P.; Métivier, L.; Collilieux, X. ITRF2014: A new release of the international terrestrial reference Frame modeling nonlinear station motions. J. Geophys. Res. Solid Earth 2016, 121, 6109–6131. [Google Scholar] [CrossRef] [Green Version]
  56. Steigenberger, P.; Rothacher, M.; Dietrich, R.; Fritsche, M.; Rulke, A.; Vey, S. Reprocessing of a global GPS network. J. Geophys. Res. 2006, 111, B050402. [Google Scholar] [CrossRef] [Green Version]
  57. Steigenberger, P.; Rothacher, M.; Fritsche, M.; Rülke, A.; Dietrich, R. Quality of reprocessed GPS satellite orbits. J. Geod. 2009, 83, 241–248. [Google Scholar] [CrossRef] [Green Version]
  58. INGV RING Working Group. Rete Integrata Nazionale GNSS; RING: Santa Monica, CA, USA, 2016. [Google Scholar] [CrossRef]
  59. Bos, M.S.; Fernandes, R.M.S.; Williams, S.D.P.; Bastos, L. Fast Error Analysis of Continuous GNSS Observations with Missing Data. J. Geod. 2013, 87, 351–360. [Google Scholar] [CrossRef] [Green Version]
  60. Williams, S.D.P. Cats: Gps coordinate time series analysis software. GPS Solut. 2008, 12, 147–153. [Google Scholar] [CrossRef]
  61. Mao, A.; Harrison, C.G.A.; Dixon, T.H. Noise in GPS coordinate time series. J. Geophys. Res. Solid Earth 1999, 104, 2797–2816. [Google Scholar] [CrossRef] [Green Version]
  62. RTKLIB: An Open Source Program Package for GNSS Positioning. Available online: www.rtklib.com (accessed on 9 November 2020).
  63. Kashani, I.; Wielgosz, P.; Grejner-Brzezinska, D.A. On the reliability of the VCV Matrix: A case study based on GAMIT and Bernese GPS Software. GPS Solut. 2004, 8, 193–199. [Google Scholar] [CrossRef]
  64. Lanari, R.; Berardino, P.; Borgström, S.; Gaudio, C.D.; Martino, P.D.; Fornaro, G.; Guarino, S.; Ricciardi, G.; Sansosti, E.; Lundgren, P. The use of IFSAR and classical geodetic techniques for caldera unrest episodes: Application to the Campi Flegrei uplift event of 2000. J. Volcanol. Geotherm. Res. 2004, 133, 247–260. [Google Scholar] [CrossRef]
  65. Troise, C.; de Natale, G.; Pingue, F.; Obrizzo, F.; de Martino, P.; Tammaro, U.; Boschi, E. Renewed ground uplift at Campi Flegrei caldera (Italy): New insight on magmatic processes and forecast. Geophys. Res. Lett. 2007, 34, L03301. [Google Scholar] [CrossRef] [Green Version]
  66. Amoruso, A.; Crescentini, L.; Sabbetta, I.; De Martino, P.; Obrizzo, F.; Tammaro, U. Clues to the cause of the 2011–2013 Campi Flegrei caldera unrest, Italy, from continuous GPS data. Geophys. Res. Lett. 2014, 41, 3081–3088. [Google Scholar] [CrossRef]
  67. De Novellis, V.; Carlino, S.; Castaldo, R.; Tramelli, A.; De Luca, C.; Pino, N.A.; Pepe, S.; Convertito, V.; Zinno, I.; De Martino, P.; et al. The 21 August 2017 Ischia (Italy) earthquake source model inferred from seismological, GPS, and DInSAR measurements. Geophys. Res. Lett. 2018, 45, 2193–2202. [Google Scholar] [CrossRef]
  68. Pingue, F.; Bottiglieri, M.; Godano, C.; Obrizzo, F.; Tammaro, U.; Esposito, T.; Serio, C. Spatial and temporal distribution of vertical ground movements at Mt. Vesuvius in the period 1973–2009. Ann. Geophys. Italy 2013, S0451. [Google Scholar] [CrossRef]
  69. Bevilacqua, A.; Neri, A.; De Martino, P.; Isaia, R.; Novellino, A.; Tramparulo, F.D.A.; Vitale, S. Radial interpolation of GPS and leveling data of ground deformation in a resurgent caldera: Application to Campi Flegrei (Italy). J. Geod. 2020, 94, 24. [Google Scholar] [CrossRef] [Green Version]
  70. Troise, C.; De Natale, G.; Schiavone, R.; Somma, R.; Moretti, R. The Campi Flegrei caldera unrest: Discriminating magma intrusions from hydrothermal effects and implications for possible evolution. Earth Sci. Rev. 2019, 188, 108–122. [Google Scholar] [CrossRef]
  71. Acocella, V.; di Lorenzo, R.; Newhall, C.; Scandone, R. An overview of recent (1988 to 2014) caldera unrest: Knowledge and perspectives. Rev. Geophys. 2015, 53, 896–955. [Google Scholar] [CrossRef]
  72. Cannatelli, C.; Spera, F.J.; Bodnar, R.J.; Lima, A.; De Vivo, B. Ground movement (bradyseism) in the Campi Flegrei volcanic area: A review. Vesuvius Campi Flegrei Campanian Volcanism 2020, 407–433. [Google Scholar] [CrossRef]
  73. Macedonio, G.; Giudicepietro, F.; D’Auria, L.; Martini, M. Sill intrusion as a source mechanism of unrest at volcanic calderas. J. Geophys. Res. Solid Earth 2014, 119, 3986–4000. [Google Scholar] [CrossRef]
  74. Chiodini, G.; Todesco, M.; Caliro, S.; Del Gaudio, C.; Macedonio, G.; Massimo, R. Magma degassing as a trigger of bradyseismic events: The case of Phlegraean Fields (Italy). Geophys. Res. Lett. 2003, 30, 1434. [Google Scholar] [CrossRef] [Green Version]
  75. Todesco, M. Signals from the Campi Flegrei hydrothermal system: Role of a “magmatic” source of fluids. J. Geophys. Res. 2009, 114, B05201. [Google Scholar] [CrossRef] [Green Version]
  76. Romano, V.; Tammaro, U.; Capuano, P. A 2-D FEM thermal model to simulate water flow in a porous media: Campi Flegrei caldera case study. Nonlinear Process. Geophys. 2012, 19, 323–333. [Google Scholar] [CrossRef] [Green Version]
  77. Romano, V.; Tammaro, U.; Riccardi, U.; Capuano, P. Non-isothermal momentum transfer and ground displacements rate at Campi Flegrei caldera (Southern Italy). Phys. Earth Planet. Inter. 2018, 283, 131–139. [Google Scholar] [CrossRef]
  78. Tammaro, U.; Obrizzo, F.; Riccardi, U.; La Rocca, A.; Pinto, S.; Brandi, G.; Vertechi, E.; Capuano, P. Neapolitan volcanic area Tide Gauge Network (Southern Italy): Ground Displacements and Sea-Level Oscillations. Adv. Geosci. 2021, 52, 105–118. [Google Scholar] [CrossRef]
  79. Meo, M.; Tammaro, U.; Capuano, P. Influence of topography on ground deformation at Mt. Vesuvius (Italy) by finite element modelling. Int. J. Nonlinear Mech. 2008, 43, 178–186. [Google Scholar] [CrossRef] [Green Version]
  80. Tammaro, U.; Riccardi, U.; Romano, V.; Meo, M.; Capuano, C. Topography and structural heterogeneities in surface ground deformation: A simulation test for Somma-Vesuvius volcano. Adv. Geosci. 2021, 52, 145–152. [Google Scholar] [CrossRef]
Figure 1. Vertical displacement at CFc from 1905 to December 2019. Red dots are levelling data (from Del Gaudio et al., 2010), and black dots are GPS measurements at RITE (Rione Terra–Pozzuoli) station taken since 2000.
Remotesensing 13 02725 g001
Figure 2. Map of the cGPS stations (black dots) at Campi Flegrei caldera (a), Ischia and Procida islands (b), and Somma–Vesuvius volcanic complex (c). The blue dots in (a) indicate the cGPS stations of the MEDUSA infrastructure. (d) Map of the Campania region with volcanic areas. Purple triangles indicate some RING cGPS stations.
Remotesensing 13 02725 g002
Figure 3. Daily north displacements (in a local reference frame) for the Campi Flegrei cGPS stations (black dots in Figure 2a) from January 2000 to December 2019.
Remotesensing 13 02725 g003
Figure 4. Daily east displacements (in a local reference frame) for the Campi Flegrei cGPS stations (black dots in Figure 2a) from January 2000 to December 2019.
Remotesensing 13 02725 g004
Figure 5. Daily vertical displacements for the Campi Flegrei cGPS stations (black dots in Figure 2a) from January 2000 to December 2019.
Remotesensing 13 02725 g005
Figure 6. Weekly filtered GPS time series of MEDUSA stations CFBA, CFBB, and CFBC (north, east, and up components) and CFSB (up component only) from January 2016 to December 2019. The error bars represent the interquartile range (IQR) of each weekly median solution [47]. See Figure 2a for the location of the stations (blue dots).
Remotesensing 13 02725 g006
Figure 7. Daily north (a), east (b), and vertical (c) displacements for the Ischia–Procida cGPS stations (black dots in Figure 2b) from January 2001 to December 2019. The horizontal components (a,b) are in a local reference frame.
Remotesensing 13 02725 g007
Figure 8. Daily north (a), east (b), and vertical (c) displacements for the Somma–Vesuvius cGPS stations (black dots in Figure 2c) from January 2001 to December 2019. The horizontal components (a,b) are in a local reference frame.
Remotesensing 13 02725 g008
Figure 9. (a) Horizontal deformation pattern from 2006 to 2019 (21 cGPS stations). (b) Vertical deformation pattern from 2006 to 2019 (9 cGPS stations). (c) Vertical deformation pattern from 2011 to 2019 (14 cGPS stations). (d) Vertical deformation pattern from 2017 to 2019 (25 cGPS stations).
Remotesensing 13 02725 g009
Figure 10. Horizontal (blue arrows) and vertical GPS velocity field (red arrows) for Ischia–Procida islands in the time span of 2001–2019. The black dots indicate the cGPS stations. For clarity, the error ellipses are not shown.
Remotesensing 13 02725 g010
Figure 11. Horizontal (blue arrows) and vertical GPS velocity field (red arrows) for the Somma–Vesuvius volcano in the time span of 2001–2019. The black dots indicate the cGPS stations. For clarity, the error ellipses are not shown.
Remotesensing 13 02725 g011
Table 1. Station name, location, first observation, and time span interval (to December 2019) of the cGPS stations of the NeVoCGPS network and MEDUSA marine infrastructure (*).
StationLat N
(°)
Long E
(°)
First Observation
(Decimal Year)
Time Span
(Years)
Campi Flegrei Caldera
ACAE40.82014.1412000.119.9
ARFE40.83214.0992000.619.4
ASTR40.84014.1592016.53.5
BAGN40.80414.1742013.07.0
BAIA40.80914.0802000.119.9
CMIS40.77814.0892015.84.2
CUMA40.84814.0582017.22.8
FRUL40.87714.2252008.111.9
IPPO40.83714.1672000.020.0
ISMO40.82614.1912016.53.5
LICO40.87614.0492003.216.8
MAFE40.84714.2582010.010.0
MORU40.85914.0822000.619.4
NAMM40.83614.2542016.23.8
NISI40.79714.1632009.310.7
PIS140.83014.1452015.34.7
QUAR40.87714.1432000.020.0
RITE40.82314.1262000.419.6
SOLO40.83014.1352009.210.8
STRZ40.83514.1112006.913.1
VICA40.85514.1202008.311.7
* CFBA40.81014.1212016.33.7
* CFBB40.80414.1342016.33.7
* CFBC40.80914.1442016.33.7
* CFSB40.79814.1202016.53.5
Ischia–Procida Islands
AQMO40.73613.9352001.118.9
FORI40.73713.8562005.414.6
IPRO40.76514.0242004.215.8
MEPO40.73113.9022017.12.9
OSCM40.74713.9012011.09.0
SANT40.72313.9462013.46.6
SERR40.71213.8952001.118.9
Somma–Vesuvius Volcano
AGR140.81114.3432003.416.6
BKE140.81914.4392006.613.4
BKNO40.83014.4302010.59.5
ONPI40.77914.4112001.019.0
OSVE40.82814.3972005.514.5
PRET40.84914.4772001.019.0
SANA40.86914.4122001.019.0
TERZ40.80814.4752003.017.0
VOLL40.88314.3482017.42.6
Table 2. GPS data processing parameters and models.
ObservationsDouble differences
Antenna modelIGS absolute phase center corrections
Cut-off15°
AmbiguitiesQuasi Ionosphere Free (QIF) strategy [50]
IonosphereIono-free L3 solution
TroposphereDry-Niell a priori model for the hydrostatic troposphere and estimating the troposphere zenith delay parameters every hour at each site using the wet-Niell mapping function [51]
Reference systemIGb14
Ocean tidal loadingFES2004 model [52]
Table 3. RING station name; location; north, east and up component velocity and uncertainty.
STAZLat N
(°)
Lon E
(°)
North vel
(mm/yr)
North err
(mm/yr)
East vel
(mm/yr)
East err
(mm/yr)
Up vel
(mm/yr)
Up err
(mm/yr)
ENAV40.58214.33516.60.121.80.1−0.50.2
MODR41.14613.88117.10.121.00.10.30.2
PACA40.87014.55616.90.121.30.1−1.30.1
PAOL41.03214.56717.40.121.90.10.10.2
PIGN41.20014.18018.00.121.80.10.30.2
VENT40.79513.42216.80.121.40.1−0.90.1
Mean 17.1 Mean 21.5
Table 4. Ischia–Procida cGPS station name; north, east, and up component velocity and uncertainty.
STAZNorth vel
(mm/yr)
North err
(mm/yr)
East vel
(mm/yr)
East err
(mm/yr)
Up vel
(mm/yr)
Up err
(mm/yr)
AQMO−1.60.1−2.40.1−3.10.2
FORI−1.10.1−0.20.1−1.30.2
IPRO−1.70.1−3.30.10.00.1
MEPO2.30.2−1.30.2−11.21.0
OSCM−2.90.1−1.10.1−3.60.1
SANT−0.20.1−2.80.1−3.20.2
SERR3.60.1−0.20.1−6.10.1
Table 5. Somma–Vesuvius cGPS station name; north, east, and up component velocity and uncertainty.
STAZNorth vel
(mm/yr)
North err
(mm/yr)
East vel
(mm/yr)
East err
(mm/yr)
Up vel
(mm/yr)
Up err
(mm/yr)
AGR10.40.10.70.1−0.80.1
BKE10.00.1−1.60.1−6.20.3
BKNO−3.30.1−1.00.1−7.20.2
ONPI0.30.10.10.1−1.70.1
OSVE−0.70.11.00.1−1.70.1
PRET0.20.1−0.40.1−1.20.1
SANA−0.10.10.10.1−1.00.1
TERZ0.10.20.10.2−2.30.5
VOLL0.00.10.30.1−1.80.3
Publisher’s Note: MDPI stays neutral with regard to jurisdictional claims in published maps and institutional affiliations.

