Article

Improved Hydrological Loading Models in South America: Analysis of GPS Displacements Using M-SSA

1
Laboratoire Géomatique et Foncier (EA 4630), Conservatoire National des Arts et Métiers, École Supérieure d’ingénieurs Géomètres Topographes, 1 Boulevard Pythagore, 72000 Le Mans, France
2
School of Engineering, Newcastle University, Newcastle upon Tyne NE1 7RU, UK
3
EOST-ITES (UMR 7063—Université de Strasbourg, CNRS, ENGEES), 5 Rue René Descartes, 67084 Strasbourg, France
*
Author to whom correspondence should be addressed.
Remote Sens. 2021, 13(9), 1605; https://doi.org/10.3390/rs13091605
Submission received: 19 March 2021 / Revised: 13 April 2021 / Accepted: 16 April 2021 / Published: 21 April 2021
(This article belongs to the Special Issue GNSS for Geosciences)

Abstract

:
Environmental loading, in particular from continental water storage changes, induces geodetic station displacements up to several centimeters for the vertical components. We investigate surface deformation due to loading processes in South America using a set of 247 permanent GPS (Global Positioning System) stations for the 2003–2016 period and compare them to loading estimates from global circulation models. Unfortunately, some of the hydrological components, and in particular surface waters, may be missing in hydrological models. This is especially an issue in South America where almost half of the seasonal water storage variations are due to surface water changes, e.g., rivers and floodplains. We derive river storage variations by rerouting runoffs of global hydrology models, allowing a better agreement with the mass variations observed from GRACE (Gravity Recovery and Climate Experiment) mission. We extract coherent seasonal GPS displacements using Multichannel Singular Spectrum Analysis (M-SSA) and show that modeling the river storage induced loading effects significantly improve the agreement between observed vertical and horizontal displacements and loading models. Such an agreement has been markedly achieved in the Amazon basin. Whilst the initial models only explained half of the amplitude of GPS, the new ones compensate for these gaps and remain consistent with GRACE.

Graphical Abstract

1. Introduction

Earth’s crustal deformations, such as tectonic plate motions, volcanism, and landslides, arise at a range of scales in space and time ranging from local to continental scale and from seconds to millions of years, respectively. In addition, detectable changes in the shape of the solid Earth and its gravity field arise due to the varying mass distribution of the surface fluids (oceans, atmosphere, groundwater, soil moisture, lakes, snow and ice) [1]. The loading signals appear mainly seasonally but there are also higher frequency signals including ocean tidal loading (primarily semidiurnal and diurnal). Furthermore, a secular signal (Glacial Isostatic Adjustment) is induced by the Earth’s response to past fluctuations of ice sheets, comprising large, measurable changes in sea level, 3D crustal motion, the gravity field, and Earth’s rotation [2]. Beside global climate changes, loads exhibit regional variations over all time scales and the different physical processes contributing to loading effects are not globally uniform.
Analysis of loading signal provides a better understanding of the interaction between the solid Earth and the mass redistributions at its surface linked to natural climate variability and human activities. Better understanding of these interactions is essential for applications such as how coasts react to relative sea level change and storms as well as natural hazard mitigation. The spatial and temporal pattern analysis of the loading signal helps to separate and quantify the different sources and frequencies from daily to decadal time scales and to infer hydrologic local/regional signals linked to recent climate change. Nevertheless, climate driven changes in water storage can have non-negligible contribution to decadal sea level changes [3]. Moreover, accurate crustal deformation modelling is required to measure sea level rise, which is not spatially uniform and is a complex function of different parameters including local land movement [4,5].
Space geodesy provides unprecedented coverage of the Earth’s surface and can contribute to monitoring the interactions between climate change and Earth’s time-dependent shape and gravity field. Precise geodetic techniques enable ground- and space-based observations that are critical to a wide array of scientific disciplines, including seismology, geodynamics, and meteorology. The Global Navigation Satellite System (GNSS), and in particular the Global Positioning System (GPS), have become essential tools for the mm- to cm-level positioning requirements within geosciences. GPS has already been used for measuring 3-D surface loading deformations of different natures: tidal and nontidal ocean, atmosphere and hydrology [6,7,8,9]. GPS’s high temporal resolution was also used for studying transient loading signals induced by storm surge [10]. Nontidal loading effects are generally not taken into account during GNSS data processing and analysis for geophysical studies requiring high precision, although these can have non-negligible impact on geodynamical interpretation [11,12,13]. Discriminating the seasonal signals from other sources of deformation in geodetic measurements is essential to isolate tectonic signals and to monitor spatiotemporal variations in continental water storage. Most of the vertical displacement variability can be explained by atmospheric, oceanic and hydrological loading effects for periods ranging from a few days to decades [14].
Gravity satellite missions such as the Gravity Recovery and Climate Experiment (GRACE) can also observe the movement of environmental fluids since a change in surface or underground water storage implies a mass change and corresponding gravity field change [15]. Therefore, the total water mass change, both in liquid and ice forms, can be estimated by measuring the gravity change. Satellite gravimetry missions as GRACE showed great success for climate research studies and other geophysical and geodetic applications. Since its launch in 2002, followed by GRACE Follow-On in 2018, the GRACE mission has mapped the time-variable and mean gravity field of the Earth at typically monthly temporal resolution. It provides estimates of seasonal, yearly, and long-term hydrological, cryospheric and oceanic mass variations at spatial scales of a few hundred km and greater, to accuracies approaching 1 cm water thickness. The results can be used to monitor water storage and improve hydrological models [16]. They also help to determine the role of continental water variability in global mean sea level change, to better understand the water transfer between the land and atmosphere (precipitation and evaporation) at regional scales [17], and to climate change impact [18].
GPS and GRACE provide very long time series of observations (20 years or more), that are extremely complementary in terms of spatial and temporal resolutions, for monitoring loading effects and enhancing global understanding of the mass transport at the Earth’s surface. The time series observed by these two techniques are useful to study hydrological loading signals and to infer change in terrestrial water storage. Combining GPS and GRACE observations allows discriminating regional and local signals. For instance, recent studies demonstrated that dense GPS networks could provide quantitative estimates of water storage variations [19] or give insights of drought events [20,21,22]. Separating GPS observations into regional and local surface mass loading contributions can provide an independent measure of total water storage at the watershed scale [23]. Studies also evidenced that fast water storage changes contribute to daily GPS height time series and that a GRACE-assimilating hydrological model would provide a promising option for removing hydrology-induced vertical deformation from GPS time series [24]. Others try to improve the understanding of nontectonic stress and forces that modulate seismicity in California from loading signal analysis [25].
Loading effects can explain large parts of the annual signal in position time series. Nevertheless, the errors in the geophysical models are still significant and discrepancies exist between models and observations. For instance, in most global hydrology models, only vertical fluxes are modelled and they are not realistic in frozen areas (e.g., snow underestimation). Seasonal variations shown by GRACE and GNSS may significantly differ from the different global hydrological models, which may be partly due to the noninclusion of river runoff and water reservoirs in the models. Moreover, mismodelled subdaily periodic signals can induce station-dependent GNSS systematic errors affecting the vertical rate, for instance, used in sea level studies. Contrary to ocean tides and their corresponding loading effects, hydrology is less known, allowing large error sources. It is particularly fundamental to model rapid loading effects that could be aliased into the solutions masking some of the long period contribution of climate change. River storage is important at low latitudes such as evidenced in the case of the Mekong [26], Amazon [27], or Niger [28]. Strong signals with high amplitudes can be observed along the major river channels and river storage models using relocation procedure significantly improve the hydrological loading estimates [29].
Having the world’s largest continental seasonal water variations, the Amazon area has a very strong hydrological signal (both spatially and in amplitude) and exhibits inter-annual anomalies linked to extreme event of drought and floods. This area is of great interest concerning the Earth’s hydrological system understanding, including the exchange of the water between the river, rainforest, ocean and atmosphere. Seasonal patterns of water circulation and inundation duration exhibit strong interannual variations in Amazonian floodplains [30]. This area is therefore well suited for hydrological loading studies and South America is equipped with a large number of long-term running GPS stations, although these are sparsely distributed.
Previous studies analyzed the loading signal in South America using space geodesy time series. It has been demonstrated that GRACE signal is consistent with in situ water level and discharge data [31] and that GRACE and GPS give complementary estimates of vertical displacement in the Amazon basin [32]. The observed displacement includes seasonal, interannual and secular variations in mass loading. Despite the GRACE hydrological signal being dominated by seasonal and long-term variability, recent changes in terrestrial water storage in South American river basins have been evidenced [33]. In particular it concerns drought in 2010 in the Amazon area, in 2012–2014 in the Sao Paulo region [34] or the 2015–2016 severe drought, as well as extreme floods in 2011–2012 and 2013–2014 [32]. GPS time series analysis is also useful to monitor hydrological hazard, as it was performed on the vertical loading signal induced by drought in Brazil [35]. Some studies also used geodetic observation to infer the terrestrial water storage and evidenced some extreme anomalies [36]. Most of these studies focus on the vertical component.
In general, there is a good agreement between GPS and GRACE observation of the hydrological signal. Nevertheless, some studies exhibited significant discrepancies between GPS observations and the loading deformation models. For instance, at NAUS (Manaus, Brazil), GRACE and GPS are close in phase and amplitude, but hydrological models underestimate the vertical displacement amplitude [34,36]. From 20 to 70% of the GPS vertical signal can be explained by hydrological loading, but about 50% of the GPS signal remained unexplained by the models, while GRACE systematically agrees better with the GPS time series [37,38]. The mean annual amplitude of the vertical loading inferred from GRACE reached 85% of the GPS signal, whereas it is only 46–48% for the hydrological models [35]. Discrepancies also exist in the decadal trend between GRACE and global models over river basins. For instance, in Amazon, GRACE shows a large increasing trend whereas most models estimate decreasing trends [39]. They highlighted potential areas of future model development, particularly simulated water storage. A better insight on land-surface processes is requested to improve terrestrial water storage and regional climate models over South America [40]. All these studies confirm the importance of considering more complex modelling able to represent the main hydrological processes. In this context, GPS, GRACE, and more accurate hydrological models are essential to improve our understanding of the water cycle and impact of climate change over this area. One way we investigate in this study is to include surface waters (rivers) that are usually absent in the most hydrological models. Indeed, it is usually assumed that only soil moisture, snow/ice cover and canopy storage describe the continental water storage.
In this study, we assess new hydrological models that we have produced to include river runoff in the three larger river basins of South America: the Amazon, Orinoco and Parana. For this, we use the M-SSA (Multichannel Singular Spectrum Analysis) approach, a data-adaptive, multivariate and nonparametric method that simultaneously exploits the spatial and temporal correlations of time series to extract common modes. This allows consideration of the full 3D signal at the same time, whereas most of previous studies in this area focused on the vertical displacement. The SSA (Singular Spectrum Analysis) has already been used to analyze loading signals [40,41,42] for the vertical component and the effectiveness of the M-SSA method has been demonstrated for GRACE data analysis [43]. After generating the signal induced by the rivers, we added this contribution to the MERRA-land [44] and GLDAS/Noah [45] models to generate the full hydrological loading signal. We considered these two models since they employ different forcing data and snow models that vary considerably. We apply M-SSA to compare GPS time series to the modelled time series computed using classical hydrological models, our new models including the river contribution and the loading signal inferred from GRACE observations. In Section 2, we present the atmospheric, oceanic and hydrological general circulation models used for the loading computations, as well as the river modelling (Section 2.1); we describe also the GPS time series used to assess these loading models (Section 2.2). We explain the M-SSA methodology and the Taylor diagram approach in Section 2.3. Our analysis results are shown and described in Section 3. Section 4 is devoted to the discussion and concluding remarks.

2. Materials and Methods

In this Section, we first present the loading models used for the comparison with the GPS observations, with a particular emphasis on the modeling of the river storage, as the MERRA-land [44] and GLDAS/Noah [45] models do not include the surface water component. We then describe the GPS solution used in this study. Finally, we explain the M-SSA technique used to extract the spatially and temporally coherent signals.

2.1. Loading Models

2.1.1. General Circulation Models

We computed surface deformation due to atmospheric and induced oceanic loads using surface pressure from the operational ECMWF (European Centre for Medium-Range Weather Forecasts) with the TUGO-m [46] barotropic ocean model forced by ECMWF pressure and winds (ATMMO). Hydrological loading effects were computed using total land water storage from GLDAS/Noah [45] or MERRA-land [44]. We also used the v2.4 version of the global iterated GRACE mascon solutions (update of [47]). More details regarding the loading computations can be found in [14,48].

2.1.2. River Modelling

As the two hydrology models used here, e.g. GLDAS/Noah [45] and MERRA-land [44], do not take into account the surface water storage (lakes, rivers, etc.), we developed a similar approach to [27] to model the surface water storage for the Amazon, Orinoco and Parana Rivers. The water balance equation in hydrology models is equal to:
s t t = p t e t q t
where s t , p t , e t and q t are respectively the total water storage (soil moisture, snow, canopy water), the total precipitation (rain and snow fall), the evapotranspiration and the total runoff (surface and subsurface).
The river water storage was estimated by rerouting the runoff on the TRIP [49,50] river model at 0.5° resolution, and computed using the continuity equation [7,9]:
h t t + u L h t i u i L i h i t = q t
where h t , u and L are respectively the river equivalent water height, the flow velocity and the distance to the downstream cell.
The terms u L h t and i u i L i h i t are respectively the downstream flow and the flow from all upstream river cells.

2.1.3. Flow Velocity

The only unknown variable in the previous equation is the flow velocity u . We chose to adjust it individually for each river basin by fitting the equivalent water height h t from the model to water elevation from ENVISAT radar altimetry [51] and surface extent from MODIS (Moderate Resolution Imaging Spectroradiometer) [52] NDVI (Normalized Difference Vegetation Index) MOD13Q1 products [53]. Our river model was then validated by comparing the modeled discharge to observations from the Global Runoff Data Center (GRDC, https://www.bafg.de/GRDC/ accessed on 1 March 2021) and comparing total water storage (river and hydrology model) to GRACE mass changes for each individual basin.
Figure 1 shows the TRIP routing scheme for the three major river basins in South America, as well as the localization of the 182 virtual stations where radar altimetry from ENVISAT satellite covering the 2002–2010 period are available (89 for the Amazon, 33 for the Orinoco and 62 for the Parana) which were used to estimate the mean river flow and the 14 discharge stations (ten for the Amazon, two for the Orinoco and two for the Parana) used for validation.
We used altimetry measurements from the ENVISAT satellite, covering the 2002–2010 period. As each 0.5° TRIP cell is not fully covered by water, h t in Equation (2) is an equivalent water height which cannot be directly compared to the radar altimetry measurements. We need to determine the variable surface water extent of each TRIP cell corresponding to the altimetric datasets. We adopt the methodology developed in [54] to derive lake water extent from 16-day MODIS/NDVI imagery [53]. We define water when NDVI values are lower than 0.1 and NIR (near infrared) reflectance is lower than 0.2.
The measured equivalent water height derived from radar altimetry and MODIS measurements over each 0.5° cell is defined as:
h M e a s u r e d t = 1 S t o t h 0 h A L T I t S M O D I S h d h
where h A L T I t ,   h 0 , S M O D I S and S t o t are respectively the altimetric water height measurements, a reference altitude, the surface water extent over the TRIP cell and its total surface. For each hydrology model, we ran the river model using the continuity equation for different velocities. We then correlated the modeled h t (Equation (2)) to the measured h M e a s u r e d t   (Equation (3)) equivalent water heights and chose the optimal constant flow velocity u for each individual water basin. We found u equal to 30 cm/s for both GLDAS/Noah and MERRA-land for the Amazon River, 64 cm/s for both hydrology models for the Parana River. For the Orinoco River, the velocity was equal to 27 cm/s for GLDAS/Noah and 23 cm/s for MERRA-land. It is important to notice that the optimal flow velocity for the Amazon River was the same as in [27], in spite of different optimization methodology, as they correlated the total water storage of the entire basin with GRACE observed mass variations.

2.1.4. Validation of the River Models

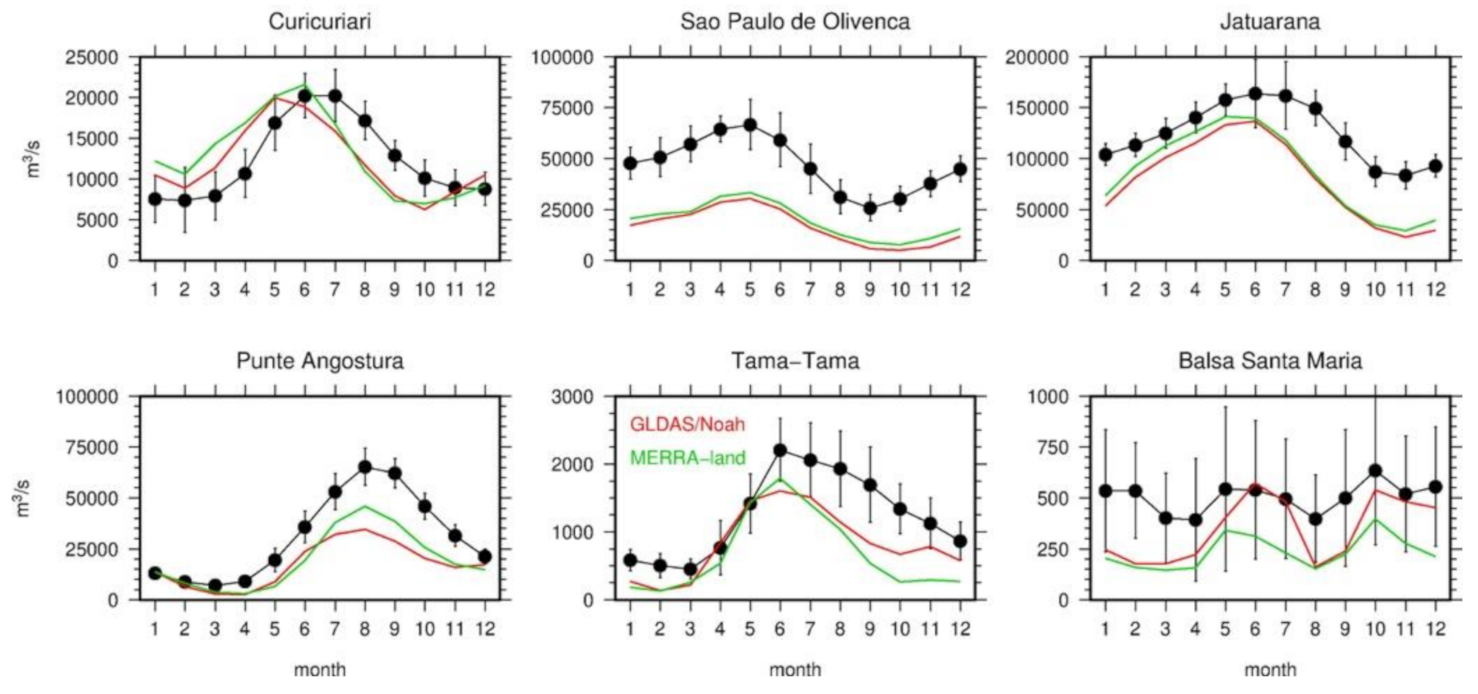
We validated our river models by comparing them to independent datasets: (1) mean annual river discharge gauges from GRDC, and (2) total mass variations over each individual basin with GRACE estimates. Figure 2 shows the comparison between the mean annual modeled discharge for a selection of six gauges in the Amazon, Orinoco and Parana River basins and gauge measurements from the GRDC. Although our river modeling is rather simple, there is a significant good agreement between our optimal river model and the discharge data, both in terms of amplitude and phase.
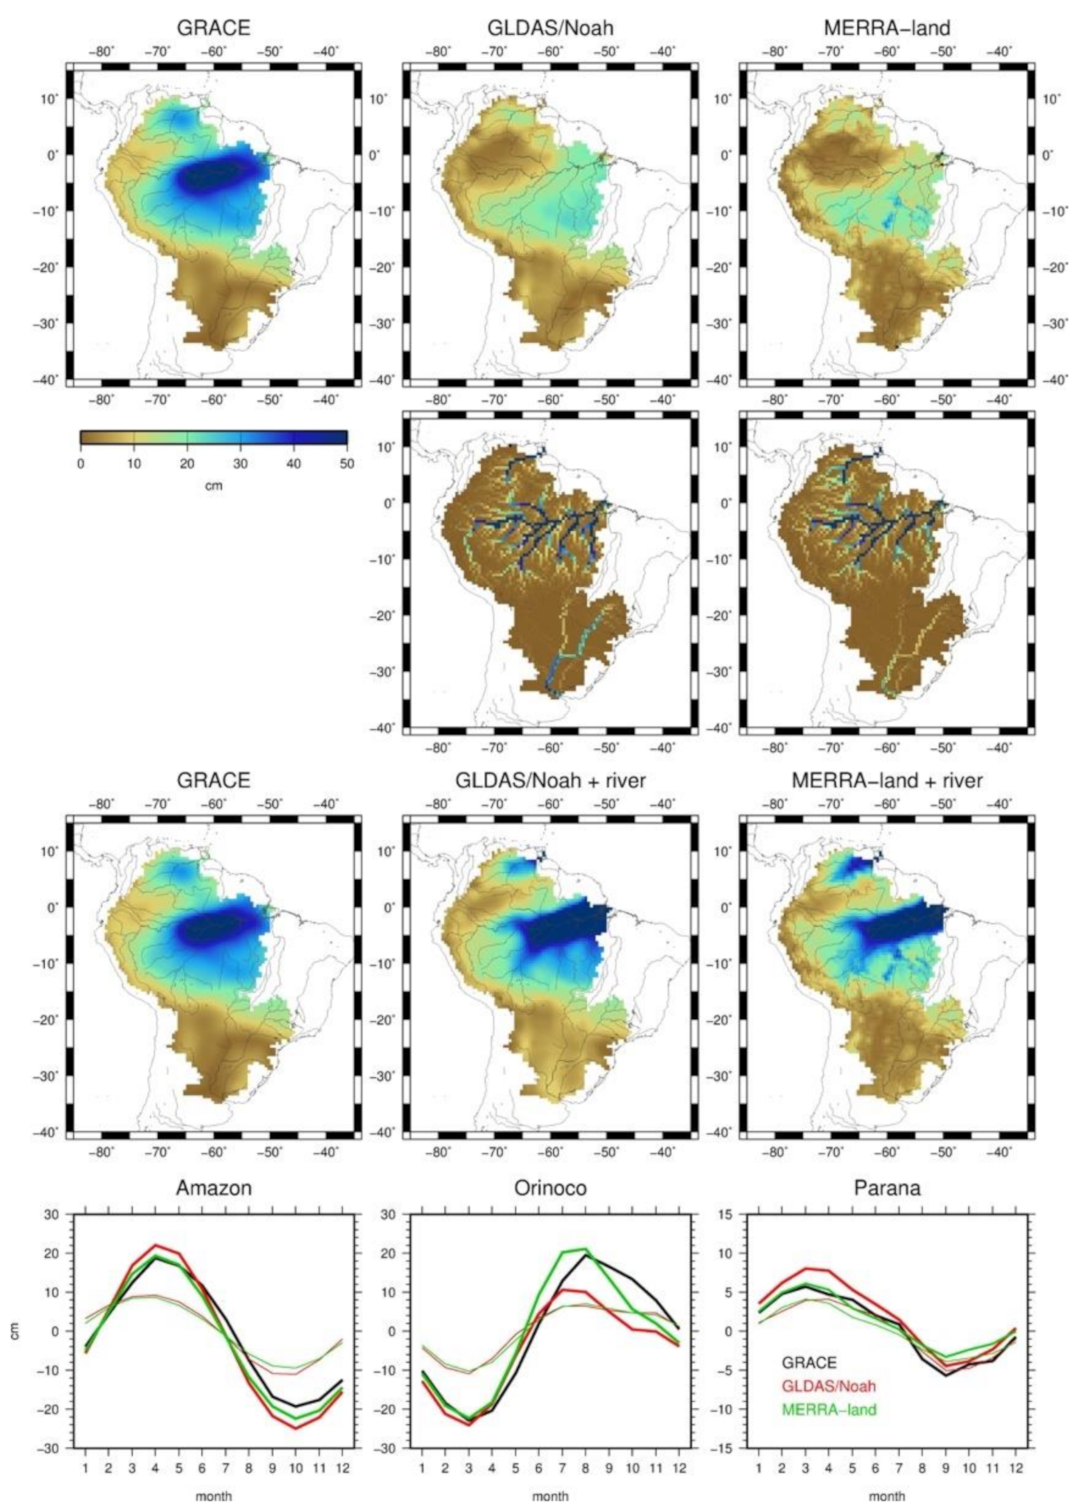
A perfect match between the modeled and the measured discharge cannot be expected, as real discharge can vary significantly along the river whereas our model has a low resolution (0.5°) and a constant flow velocity. Some of the gauges (for example Balsa Santa Maria on the Parana River) show strong interannual variability, represented by the error bars on Figure 2, which may not be computed on the same time period than our model. Improving the discharge modeling would require the use of Manning’s equation and the full knowledge of the geometry of each river (cross section area, hydraulic radius and channel slope), variable in time (flooding seasons) and space. This is far beyond the scope of this paper, as we only want to model the surface water storage with sufficient accuracy to compute the induced loading effects. Our second validation technique was the comparison between the total mass storage, e.g., the sum of the land-water storage from the hydrology model and the corresponding river storage, to GRACE estimates. Figure 3 shows the mean seasonal storage variations for each individual river basin compared to the GRACE iterated global mascons (v02.4, update of [47]) for the period 2003–2016. As also shown by [27], a simple rerouting of the runoff from the hydrology model, added to their modeled land water storage, allows a good agreement with the modeled storage from the GRACE mission at seasonal timescales.
GLDAS/Noah and MERRA-land hydrology models only explain half of the seasonal mass variations deduced from GRACE, in particular for the Amazon and Orinoco river basins. When we added the river storage, filtered at GRACE resolution, the agreement between the models and GRACE significantly improved spatially and temporally. As the surface water component was not negligible, we chose to improve our hydrological loading estimates, and the comparison with geodetic observations, by adding the surface displacements due to the river loading to the loading due to the soil-moisture, snow and eventually canopy water of the GLDAS/Noah or MERRA-land models, using the same methodology [5,6]. This modelled total hydrological loading signal could also be compared to the loading estimates using GRACE derived equivalent water height. We also computed the atmospheric and induced oceanic loading effects using ECMWF with TUGOm (ATMMO) dynamic ocean response to pressure and winds. Adding this contribution to the hydrological loading should explain most of the observed displacements.

2.2. GNSS Time Series

In this paper, we used the GPS daily Precise Point Positioning (PPP) 3D coordinate time series of continuous stations processed by the Nevada Geodetic Laboratory (NGL) [55]. These solutions were generated using GipsyX (version 1.0) [56] with the Jet Propulsion Laboratory (JPL) final Repro3.0 products, IERS 2010 Conventions [57] for solid Earth tides, pole tides and for Earth Orientation Parameters as well as FES2004 ocean tide model [58]. No nontidal loading effect was applied in the GPS data processing. The daily position estimates are expressed in the IGS14 reference frame [59].
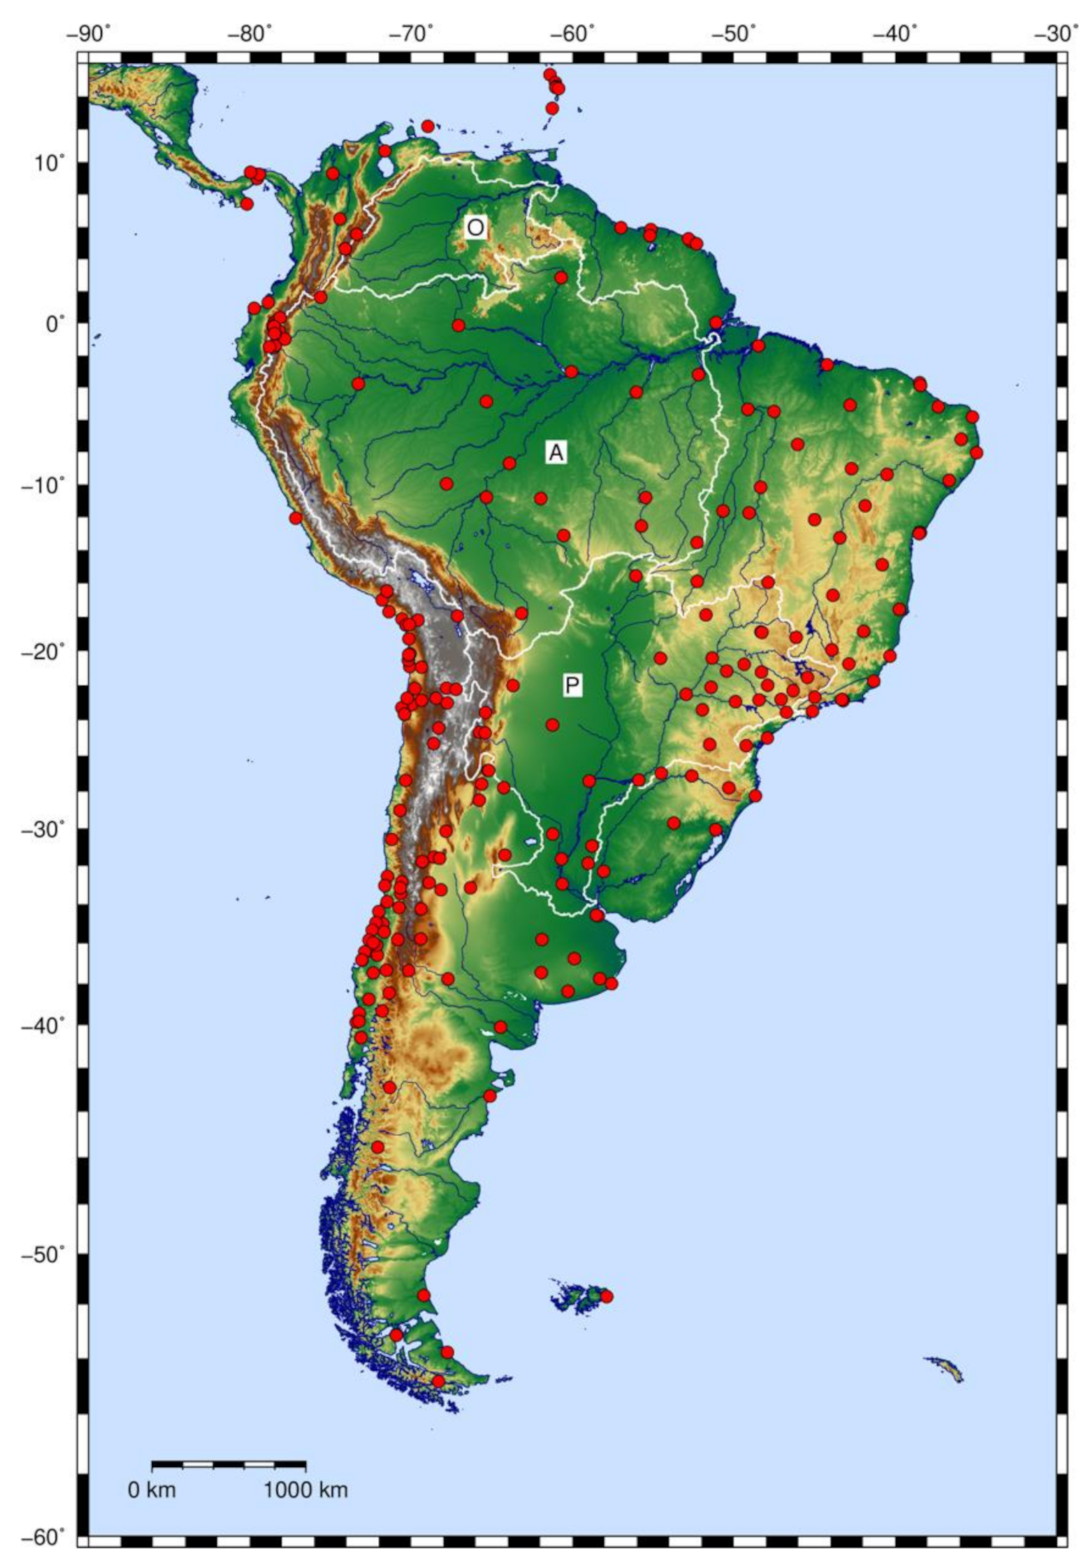
We selected 247 permanent stations in South America (Figure 4). In order to mitigate the effect of interpolation as much as possible, the selection of GPS sites was performed adopting the following criteria: time span not shorter than 5 years, common observation period with the model data sets no shorter than 2.5 years, the gap ratio could not be more than one third of the time series. The observation period spans from January 2003 to February 2016 and 60% of GPS time series were longer than 6 years (148 sites). The formal error of the selected stations was lower than 1 mm and 3 mm for the horizontal and vertical components, respectively.
We corrected the time series offset discontinuities related to equipment changes or earthquakes using the Hector software [60] with the potential steps epoch database provided by the NGL. Then, we adjusted and removed a linear trend of the GPS time series and outliers on all the three components at each station. We defined outliers as data points that exceed two times the sigma value. Before signal analysis, we filled the gap in GPS time series using an autoregressive (AR) model.

2.3. Multichannel Singular Spectrum Analysis (M-SSA)

For extracting time-variable seasonal signals from both daily GPS 3D position time series and environmental loading models mentioned above, we used Multichannel Singular Spectrum Analysis (M-SSA). This advanced analysis method of time series exploits the fact that geophysical data are both spatially and temporally correlated. The method thus allows common modes of spatial and temporal variability to be extracted as empirical basis functions. Hence, the method is particularly suitable to unravel oscillations and trends embedded in noisy time series without any a priori assumption of their amplitudes or slopes, even when stationarity is not ensured.
Following the first theoretical works of the 1980–90s, the pioneer method known as Singular Spectrum Analysis (SSA) has been successively utilized with paleoclimatic time series [61,62] and global surface air temperature time series [63]. A comprehensive review of suitable methods, including SSA and M-SSA, for extracting useful information from geophysical time series may be found in [64]. Since then, the applications of SSA and M- SSA to time series from geophysics and space geodesy have not stopped developing. The value of SSA for extracting and predicting time-variable seasonal signals from weekly GPS position time series is illustrated in [65,66]. A systematic use of statistical indicators (e.g., Akaike Information Criterion [67]) and tests (Fisher–Snedecor test) is proposed in e.g., [68] so as to adjust SSA setting parameters for extracting periodicities of GPS ellipsoidal height time series. A systematic study of different analysis methods dedicated to GPS position time series presented in [69], demonstrated that SSA is as efficient as Kalman filtering regarding the percentage of the variance it can model. M-SSA is required when several time series are to be analyzed together [70]. The method is successfully applied in [71] for detecting transient-deformation signals in GNSS position time series. Other types of data can be processed by M-SSA as carried out in [43] with GRACE satellite data. Not less than 13 years of GRACE-estimated geopotential spherical harmonics coefficients provided by five processing centers are jointly analyzed therein, thus efficiently filtering undesired north–south stripes. Recent work has extended the use of M-SSA to the study of environmental loading models to be compared to space geodesy data coming notably from GNSS and GRACE [42,72]. These studies have undoubtedly shown that environmental loading models generally underestimate the amplitudes of seasonal signals observed by space geodesy, which motivated our own study.
The following is an overview of the mathematical formulation from which we implemented M-SSA. We drew heavily on seminal papers—e.g., [61,62]—where greater mathematical detail is given. The formulation is broadly inspired by the one proposed by [64].
X l k ,   l = 1 ,   2 ,   ,   L ;   k = 1 ,   2 ,   ,   N
Let there be a set of L time series and N the total number of data points evenly sampled at the sampling period T s . The duration of times series is thus N 1 T s . The case L = 1 can be treated by means of traditional single channel SSA. To be consistent with our own analysis, we henceforth focus on the case L = 3 , assuming that the time series X 1 k ,   X 2 k , X 3 k , k = 1 ,   2 , , N represent respectively the centered variations of East, North and Up position vector components at a given station. The starting point of M-SSA consists of determining the covariances of M time-delayed replicas of the original time series gathered in a fully augmented trajectory matrix D ˜ which is expressed as follows:
D ˜ = X ˜ 1 , X ˜ 2 , X ˜ 3
where trajectory matrices X ˜ l ,   l = 1 ,   2 ,   3 may be expressed as:
X ˜ l = X l 1 X l 2 X l M X l 2 X l 3 X l M + 1   X l N M + 1 X l N M + 2 X l N
The integer M can be interpreted as the length of the window on which original time series are embedded. Its value must be carefully chosen so as to allow seasonal signals sought to be extracted whilst keeping safe statistical confidence. This issue can be tackled in a theoretical (e.g., [73]) or practical way as proposed in [42]. We adopted the latter in this study carrying out numerical experiments with synthetical time series. A value of M = 730 ,   corresponding to a 2-year window with daily data, has proven to be well suited for resolving semiannual and annual time-varying signals. Equations (5) and (6) are then used to express the grand lag-covariance matrix C ˜ X given by:
C ˜ X = 1 N M + 1 D ˜ T D ˜
where D ˜ T denotes the transpose of matrix D ˜ .
Diagonalizing the 3 M × 3 M symmetric matrix C ˜ X yields 3 M eigenvectors E r ,   r = 1 ,   2 ,   ,   3 M , also designated as Empirical Orthogonal Functions (EOFs), each associated with 3 M eigenvalues λ r such that for all r 1 ,   2 ,   ,   3 M :
C ˜ X E r = λ r E r
Each eigenvector E r consists of three consecutive M -long segments of elements denoted now as e l r j for l = 1 ,   2 ,   3 and j = 1 ,   2 ,   ,   M . The 3 M   single-channel time series A r k obtained by projecting the X ˜ l onto the EOFs represent the Principal Components (PCs); they can be therefore expressed as:
A r k = j = 1 M l = 1 3 X l k + j 1 e l r j ,
where k varies from 1 to N M + 1 . At that stage, the so-called decomposition phase is over.
The next phase consists in selecting a given number of EOFs in order to reconstruct the part of the original time series associated with these EOFs. Let R 1 ,   2 ,   ,   3 M be the subset of EOF indices on which the reconstruction is based. The Reconstructed Components (RCs) can then be obtained by convolving the corresponding PCs with the EOFs. Hence, the r th RC ( r R ) at time k ( k 1 ,   2 ,   ,   N M + 1 ) for the l th position vector component ( l = 1 ,   2 ,   3 ) is given by:
R l r k = 1 M k j = L k U k A r k j + 1 e l r j
where the normalization factor M k and the lower and upper bounds L k and U k respectively are expressed by:
M k ,   L k ,   U k = k ,   1 ,   k 1 k M 1 , M ,   1 ,   M M k N M + 1 , N k + 1 ,   k N ,   M N M + 1 k N .
Once RCs determined, the periods of those that turn out to be periodic functions of time have to be accurately estimated. For this, we used the modified periodogram jointly developed by Lomb [74] and Scargle [75,76].

2.4. Taylor Diagram

The Taylor diagram [77] provides an easy-to-read graphical representation of key statistical values related to time series. Examining this diagram permits to assess how well matched are two times series in terms of their correlation, their root-mean-square difference, and their respective standard deviations. In this study, for each site, we systematically used the Taylor diagram to quantify the degree of similarity between one time series computed from observations and several time series computed from displacement models.
If X m k and X o k ,   k = 1 ,   2 ,   , N ,   denote respectively one of the model-derived time series and the observation-derived times series and X ¯ m , X ¯ o their respective mean values, then the four key statistical values displayed in the Taylor diagram are: (1) the standard deviation σ m of X m k , (2) the standard deviation σ o of X o k , (3) the correlation coefficient R between X m k et X o k , and (4) the Centered RMS difference (CRMS) D between X m k and X o k defined as:
D = 1 N k = 1 N X m k X ¯ m X o k X ¯ o 2 1 / 2
The four values σ m , σ o , R ,   D are simply related to each other by the following equation:
D 2 = σ m 2 + σ o 2 2 σ m σ o R
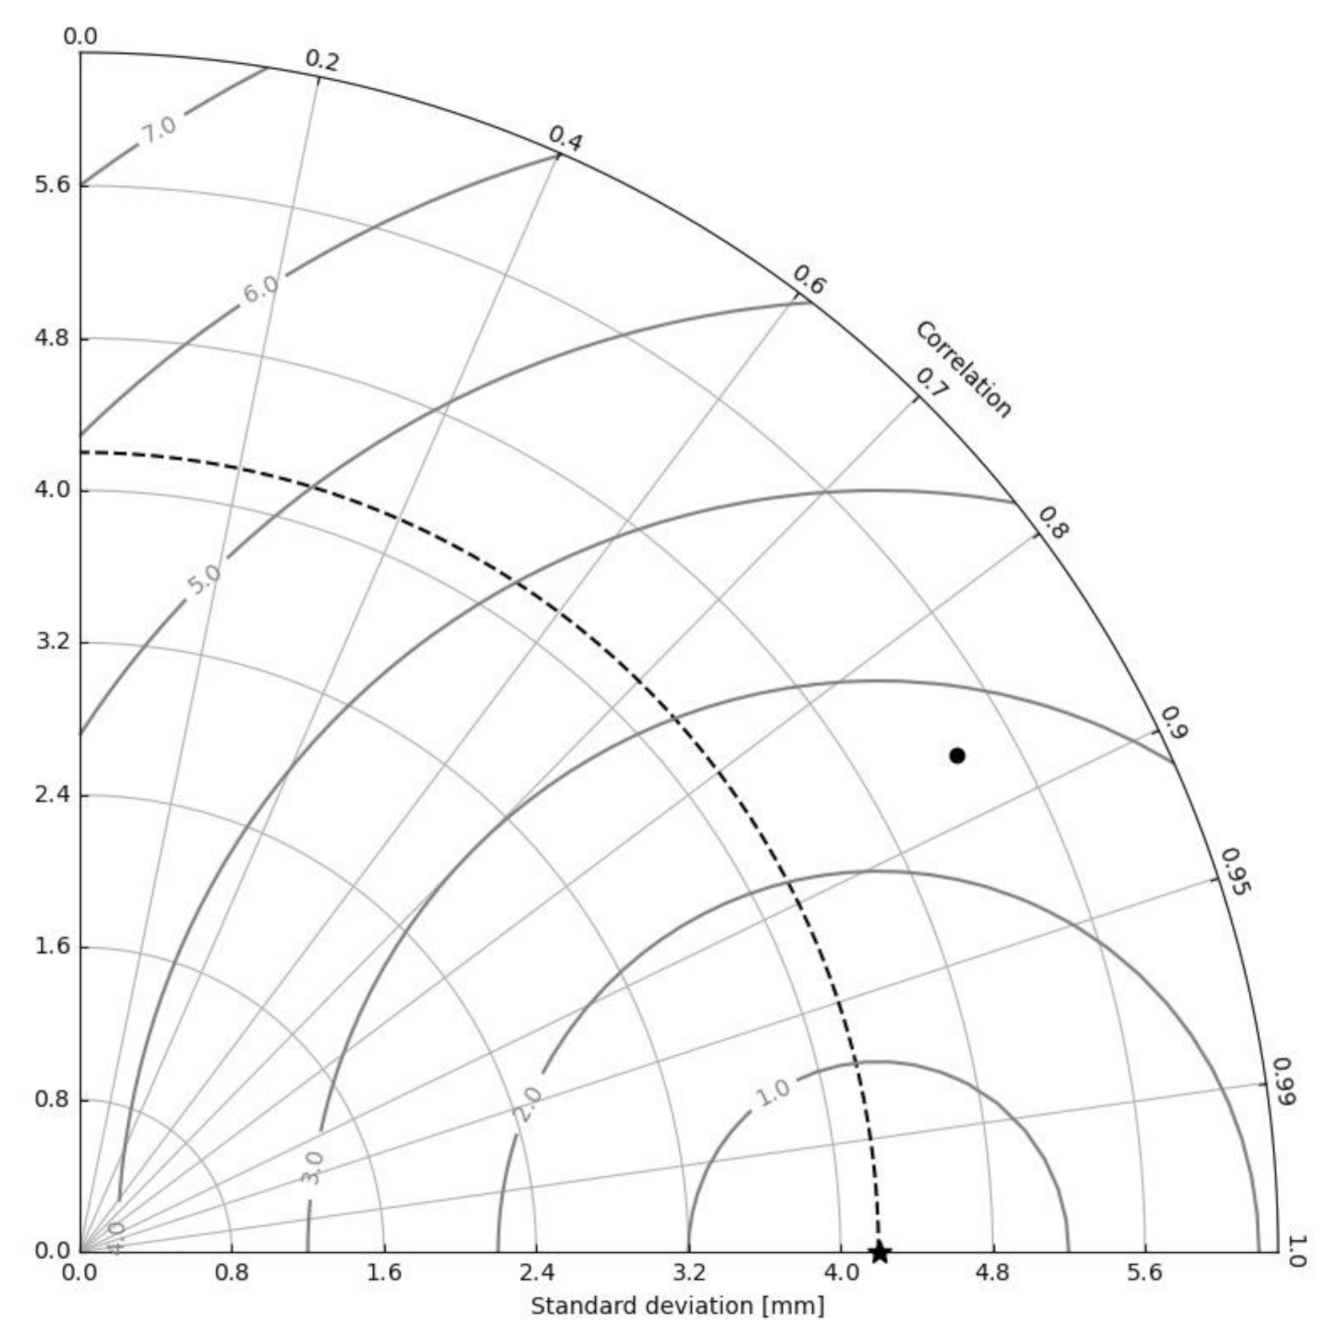
The correlation coefficient reaches its maximum value of 1 when, for all k 1 ,   2 ,   ,   N , X m k X ¯ m = a X o k X ¯ o , where a is a positive constant. Although perfectly correlated, the respective variations of the two time series nevertheless remain of different amplitudes unless a = 1 . In that case, the corresponding RMS difference satisfies D = σ m σ o , equal to 0 when σ m = σ o . Hence, in the general case, D is all the closer to 0 as both i) the correlation coefficient between the two time series is close to 1 and ii) the respective deviations of the two time series from their mean values are similar. To help the reader properly understand the results presented in Section 3, Figure 5 shows a synthetic example of Taylor diagram. In this figure, the point representing the observation time series X o k is plotted along the abscissa axis proportionally to its standard deviation σ o . The radial distance from the origin to the point representing the model-derived time series X m k is proportional to its standard deviation σ m , and the azimuthal position gives the correlation coefficient R between the two times series. The Centered RMS difference is directly proportional to the distance between the points representing X o k and X m k , respectively.

3. Results

We applied the proposed analysis technique to compare the 3D positioning GPS cleaned time series and the deformation time series computed with the different models presented in Section 2 for all the 247 selected sites and the time span from 2003 to 2016. For each site, we extracted the annual and semiannual signals for each 3D time series with the M-SSA. We applied the Taylor diagram method to the horizontal and vertical components of each time series using GPS as the reference. We computed the following comparison indicators: standard deviation of each solution, correlation coefficient between GPS and each model, and the centered RMS difference between GPS and the model time series (CRMS). In this section, the initial loading models are referred as GLDAS/Noah and MERRA-land and the new ones after addition of the river loading contribution are labelled GLDAS/Noah + river and MERRA-land + river. For these models, ATMMO indicates the model we used for the atmospheric and oceanic parts of the loading signal to compute the full deformation time series. We present the different results obtained concerning the annual signal for the initial loading models and the new models adding the river contribution, as well as the loading deformation time series inferred from GRACE mascons (v02.4, update of [47]) for comparison. We do not present and analyze the semi-annual term in this paper. For each parameter and indicator, we give the results overall the network considered (247 stations) and for the Amazon (25 stations) and Parana (40 stations) basins. Unfortunately, our selection criteria for GPS time series did not allow us to keep any stations in the Orinoco basin.

3.1. Annual Signal Amplitude

The first component (RC1) extracted from the M-SSA gives an estimate of the annual amplitude at each site for East, North, and Up components, respectively. The amount of the annual signal in the GPS times series can be estimated by calculating the percentage of RC1 (%RC1) defined as the ratio between the standard deviation of RC1 and the sum of the standard deviations for all the RCs. For all considered sites, the %RC1 for the vertical component ranges from 0% to 100% with a mean value at 47.1% and a standard deviation at 29.2%. For the horizontal components, the %RC1 varies in the same range, but the mean value of the North component (49.2%) is significantly different from the one of the East component (28.5%). The same comparisons carried out for the stations located in the Amazon basin and the Parana basin indicate a significant increase of the %RC1 mean values of both for the Up component at 63.8% and 59.5%, respectively. Similarly, an increase of %RC1 mean values can be observed for the North and East components, which reach the values of 52.1% and 43.4% respectively, for the Amazon and 58.6% and 31.1% respectively, for the Parana. These results suggest that the portion of the annual signal in the GPS time series is in the order of 60% for the stations located in the river basins and in the order of slightly less than 50% for the North and East components in the same zones.
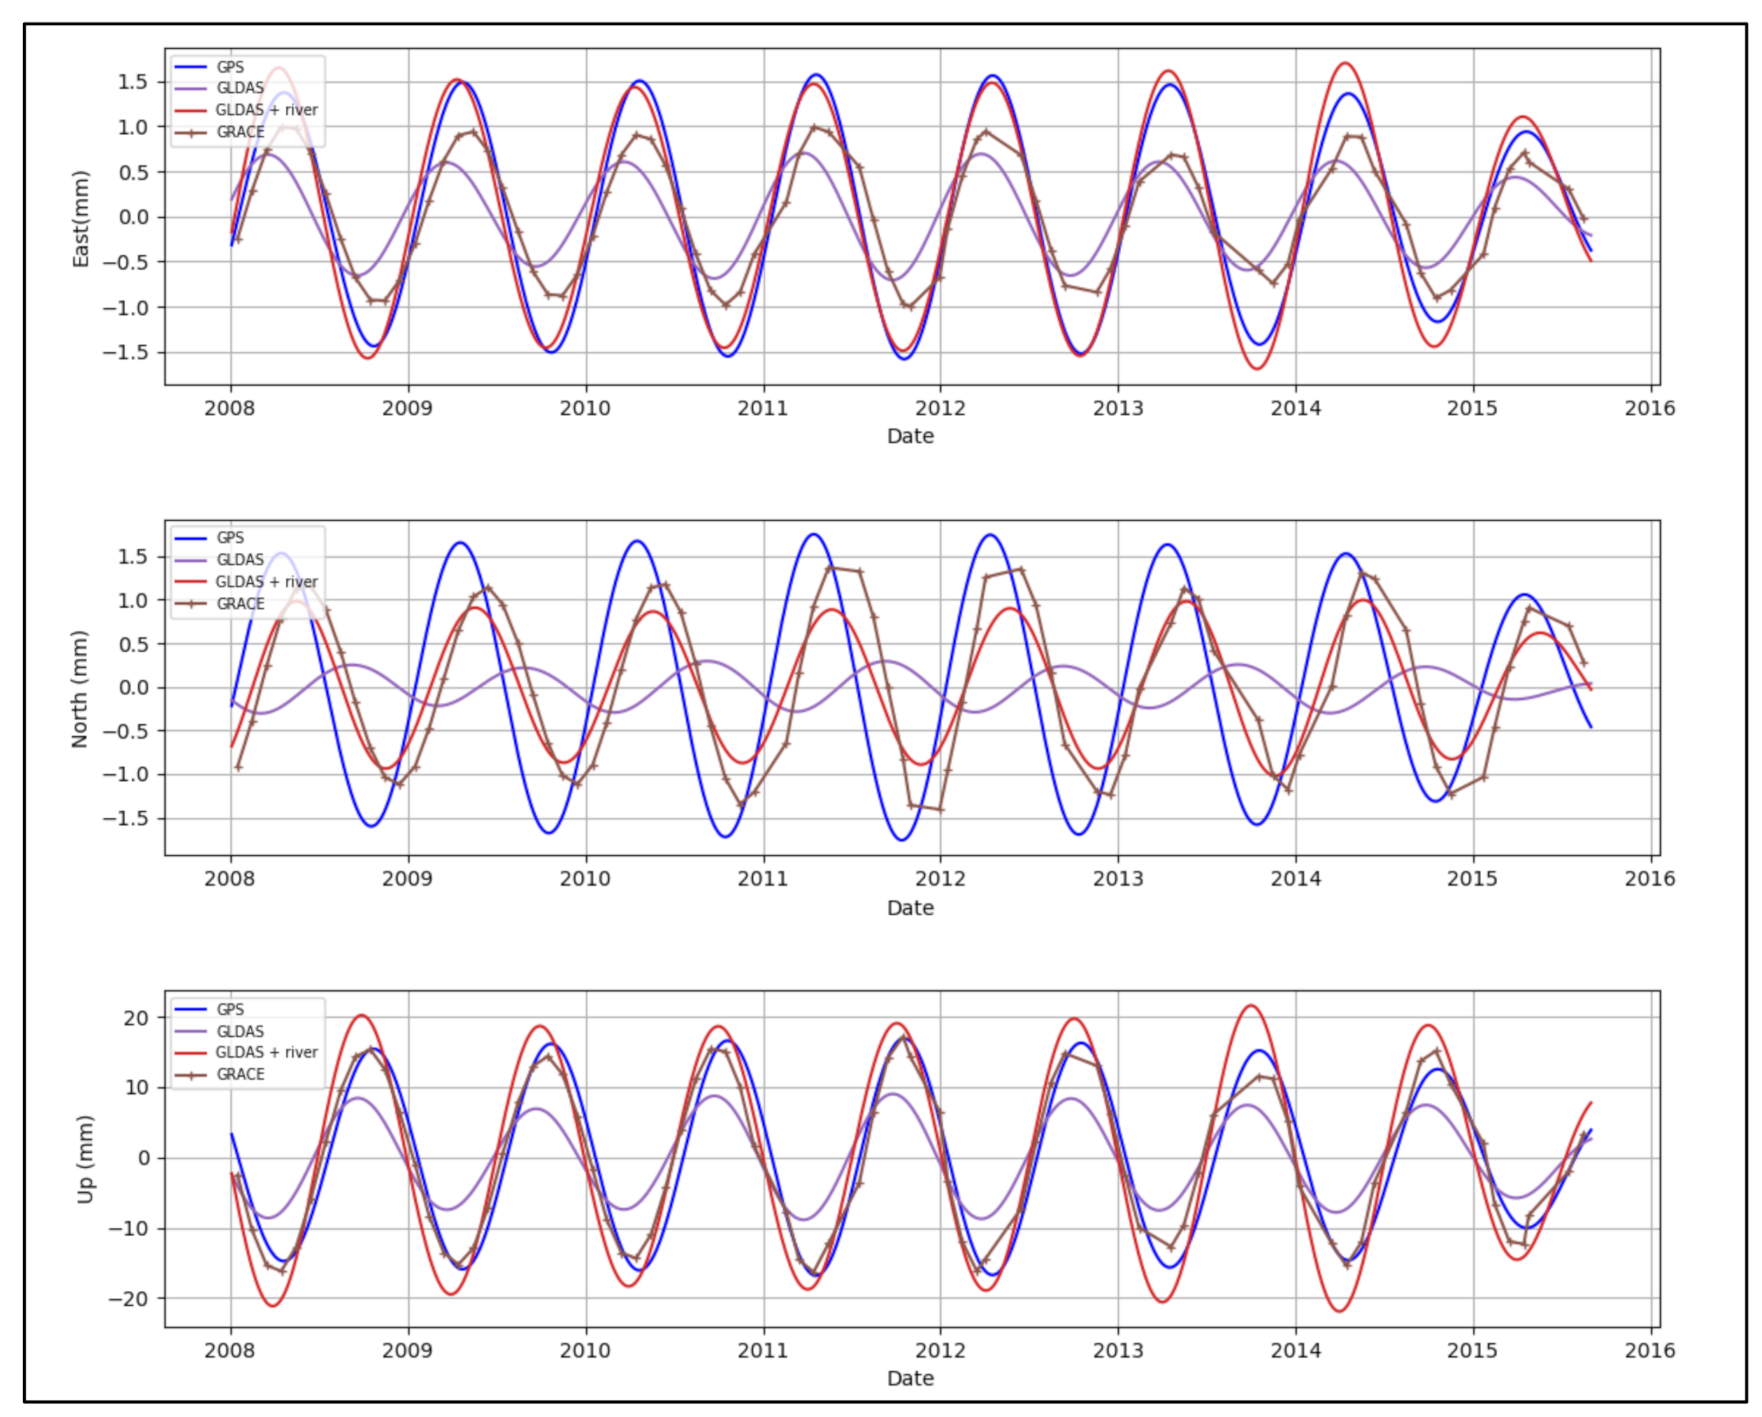
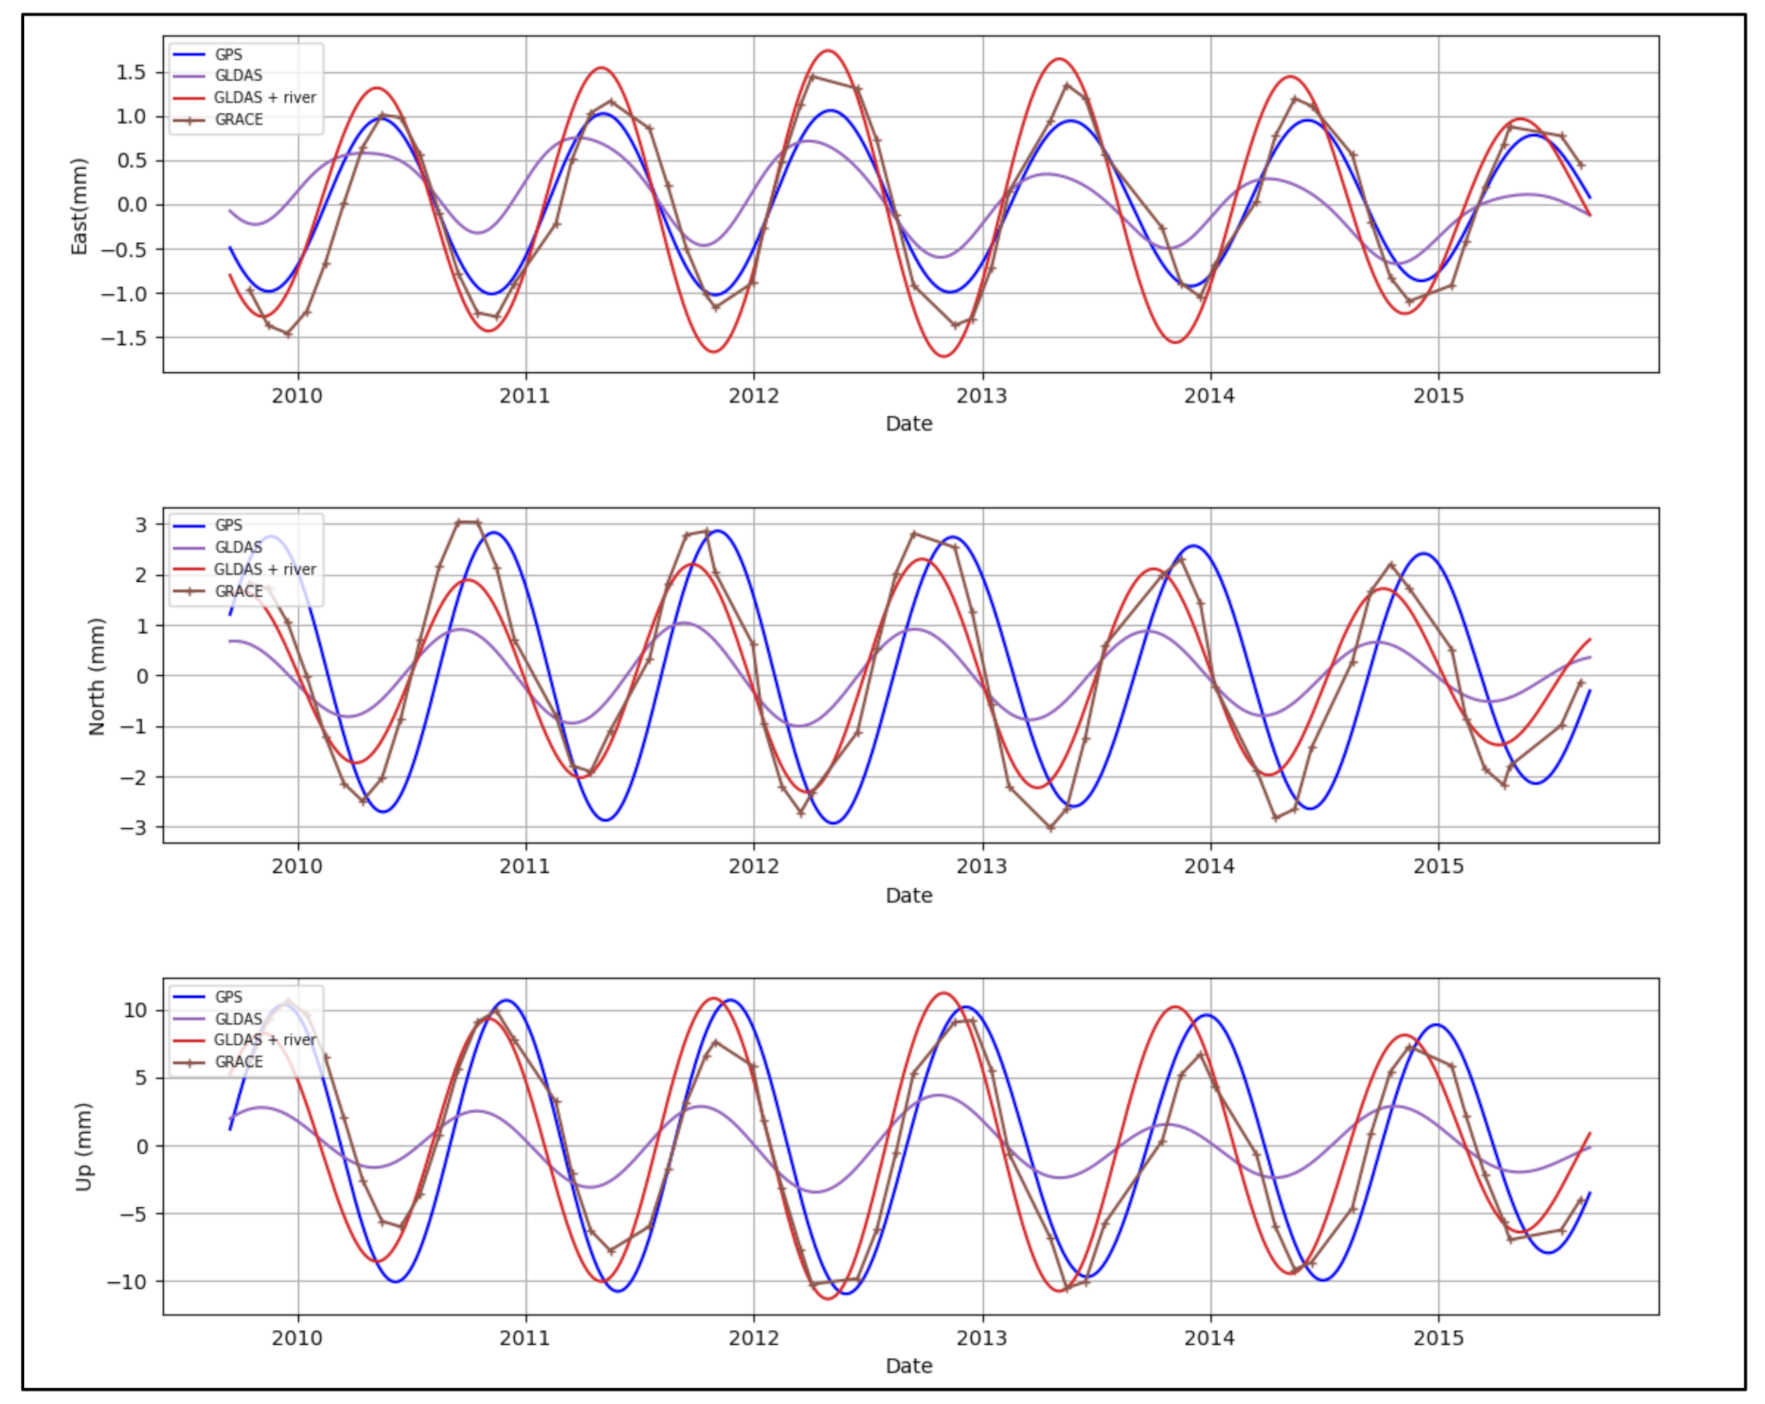
Figure 6 and Figure 7 give examples of the RC1 time series for GPS, the initial and new models using GLDAS/Noah, and GRACE solution for two stations located in the Amazon basin: POVE (Porto Velho, Brazil) and SAGA (São Gabriel da Cachoeira, Brazil). This illustrates the discrepancies between the GPS and the initial model, whereas the new model and GRACE are in much better agreement with the GPS annual signal. For all the considered sites, the GPS annual amplitude ranges from 0.0 mm to 41.2 mm for the vertical component and from 0.0 mm to 160.3 mm for the horizontal components. These values calculated for the Amazon basin range from 0.3 mm to 26.4 mm for the vertical component, and from 0.0 mm to 3.7 mm for the horizontal components. Doing the same for the Parana basin, the vertical component ranges from 0.2 mm to 13.3 mm and the horizontal components from 0.1 mm to 2.8 mm. For the whole network, the mean values for East, North, and Up components are 2.3 mm, 1.6 mm, 4.0 mm respectively, for GPS, 0.3 mm, 0.5 mm, 2.0 mm for GLDAS/Noah and 0.6 mm, 0.8 mm, 3.3 mm for GLDAS/Noah + river. The length of the arrows on Figure 13 discussed later shows the annual amplitudes with these two models. The spatial distribution of the amplitude evidences the river contribution in the annual signal.
The corresponding values with MERRA-land and MERRA-land + river are nearly the same (mean values: 0.3 mm, 0.5 mm, 1.8 mm for East, North, Up components respectively with MERRA-land and 0.5 mm, 0.8 mm, 2.9 mm with MERRA-land + river). For comparison, GRACE annual signal ranges from 0.0 mm to 2.2 mm and from 0.1 mm to 19.3 mm for the horizontal and vertical components, respectively. For the Amazon basin and the Parana basin, these values are [0.2 mm, 2.2 mm], [2.0 mm, 19.3 mm] and [0.0 mm, 1.5 mm], [0.2 mm; 9.7 mm], respectively. These results are in agreement with the previous studies underlining the lacks in the classical hydrological loading models in this area [34,36,37].
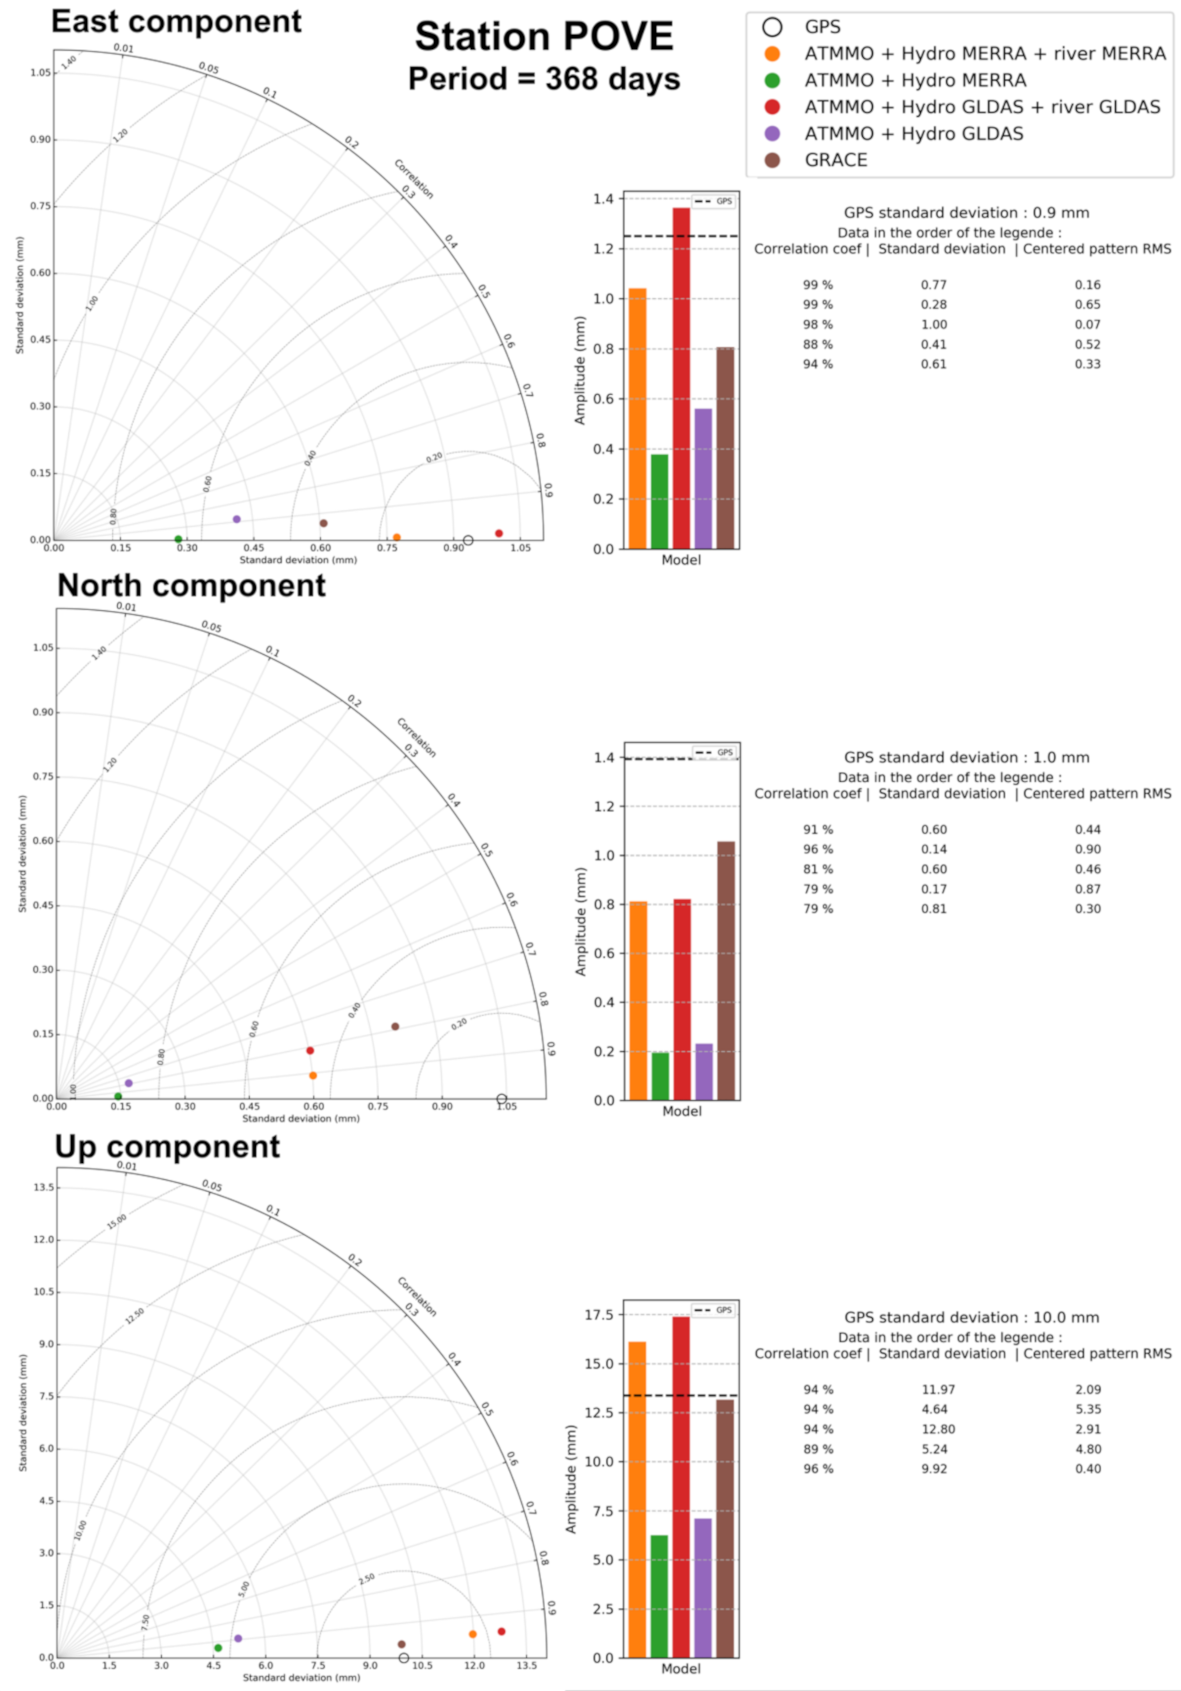
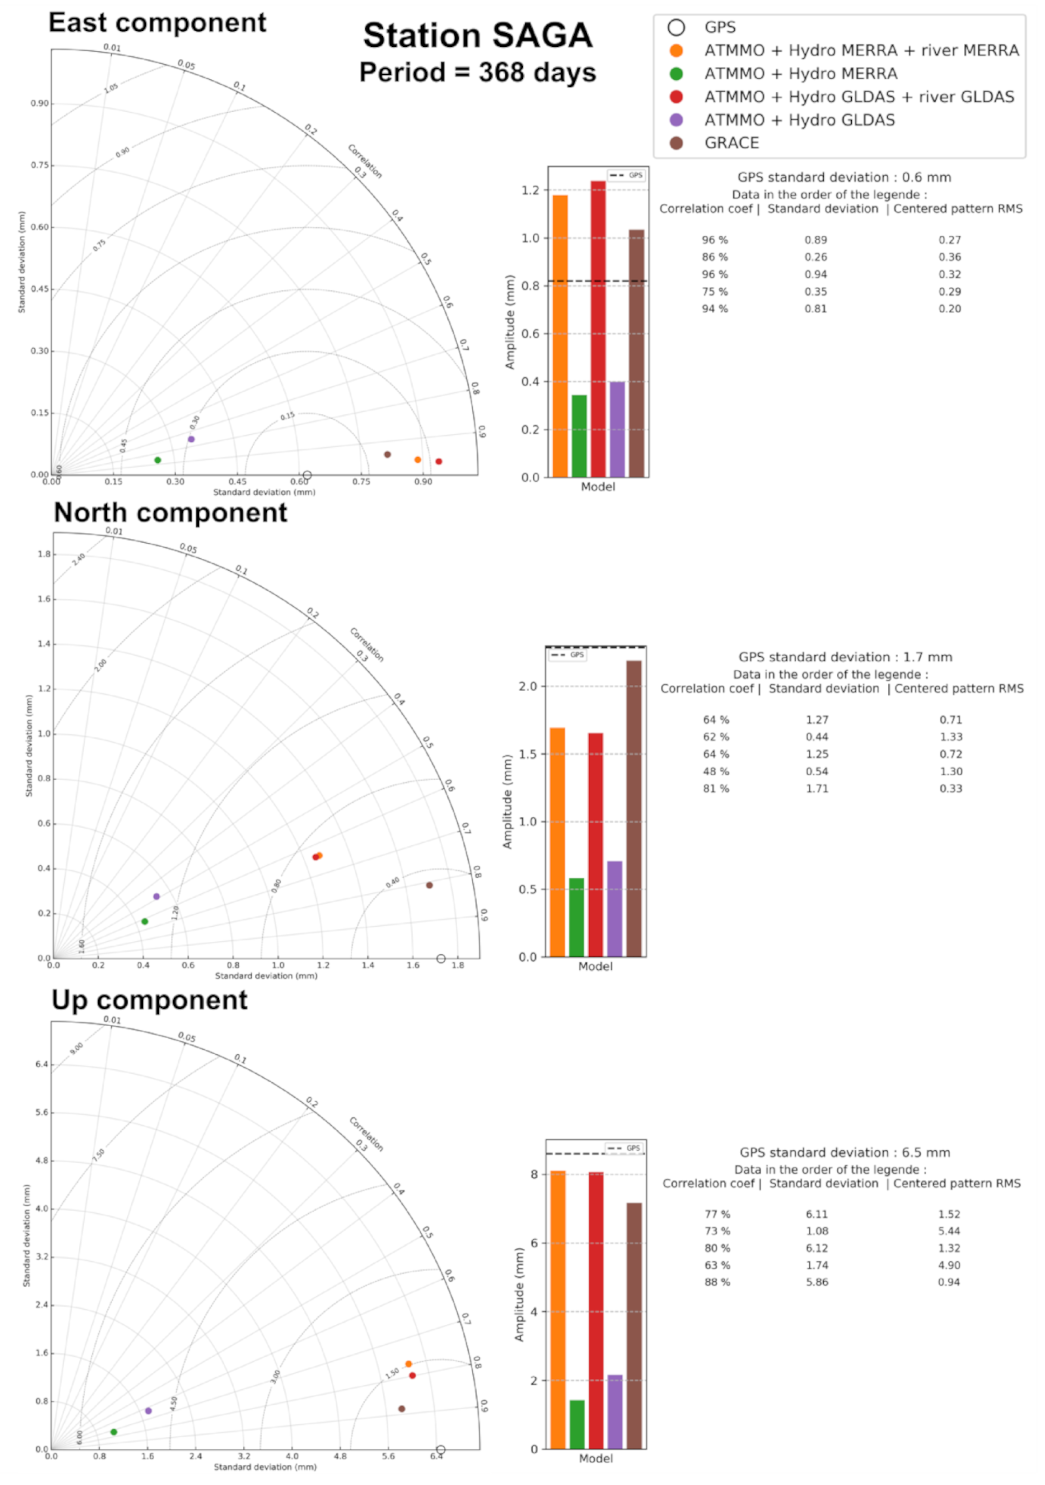
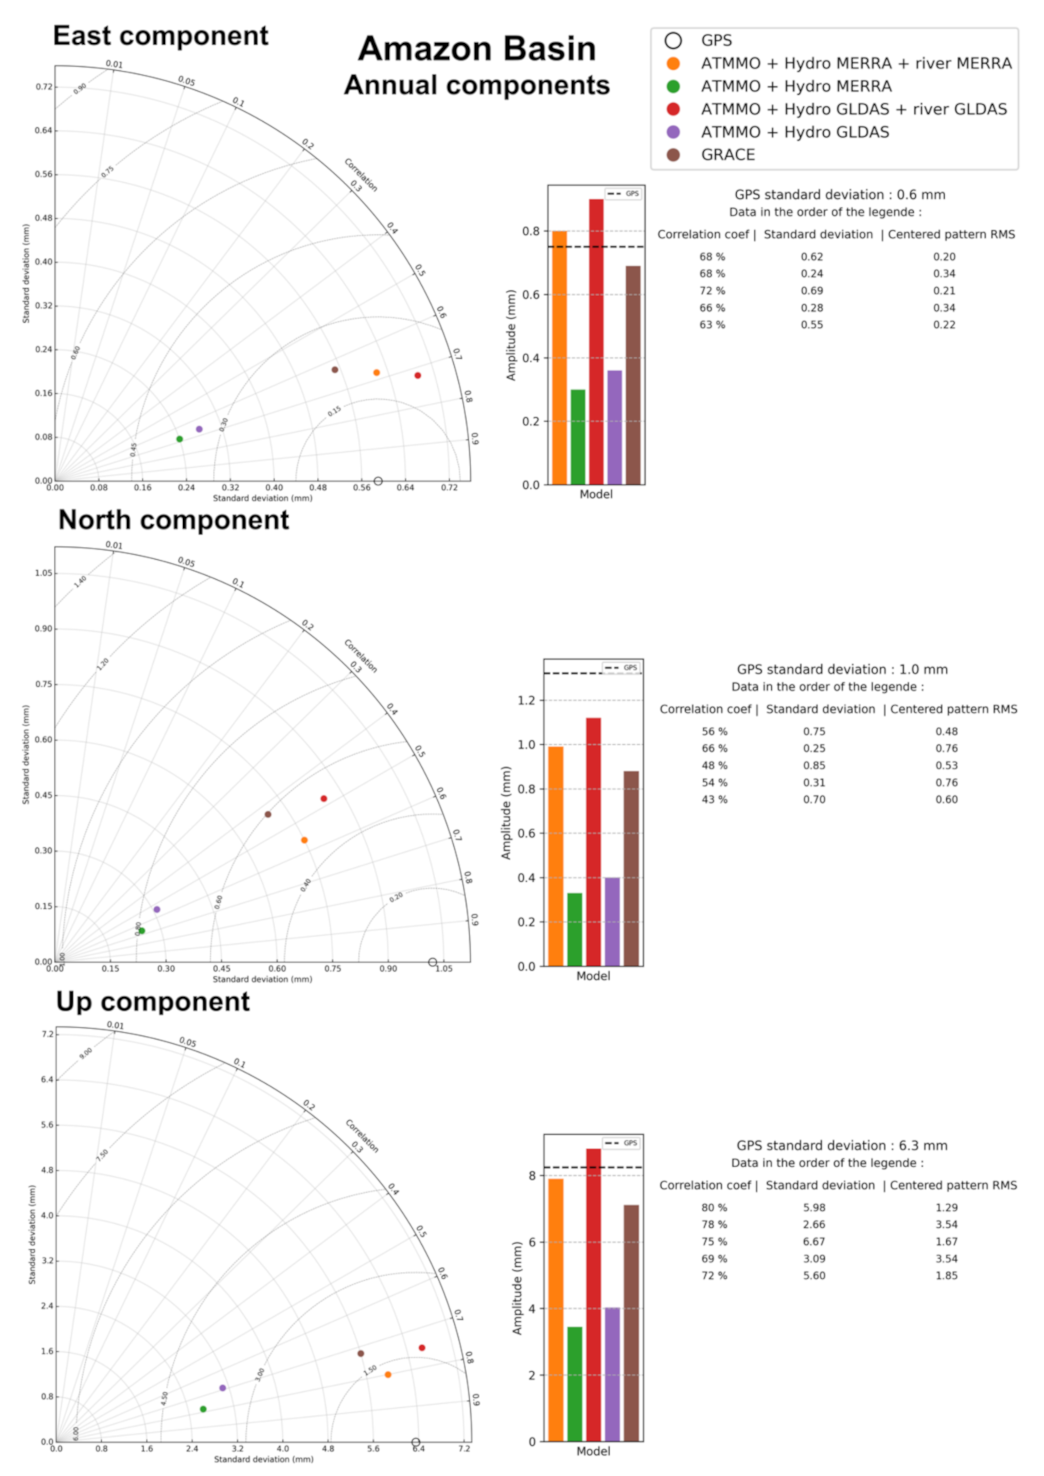
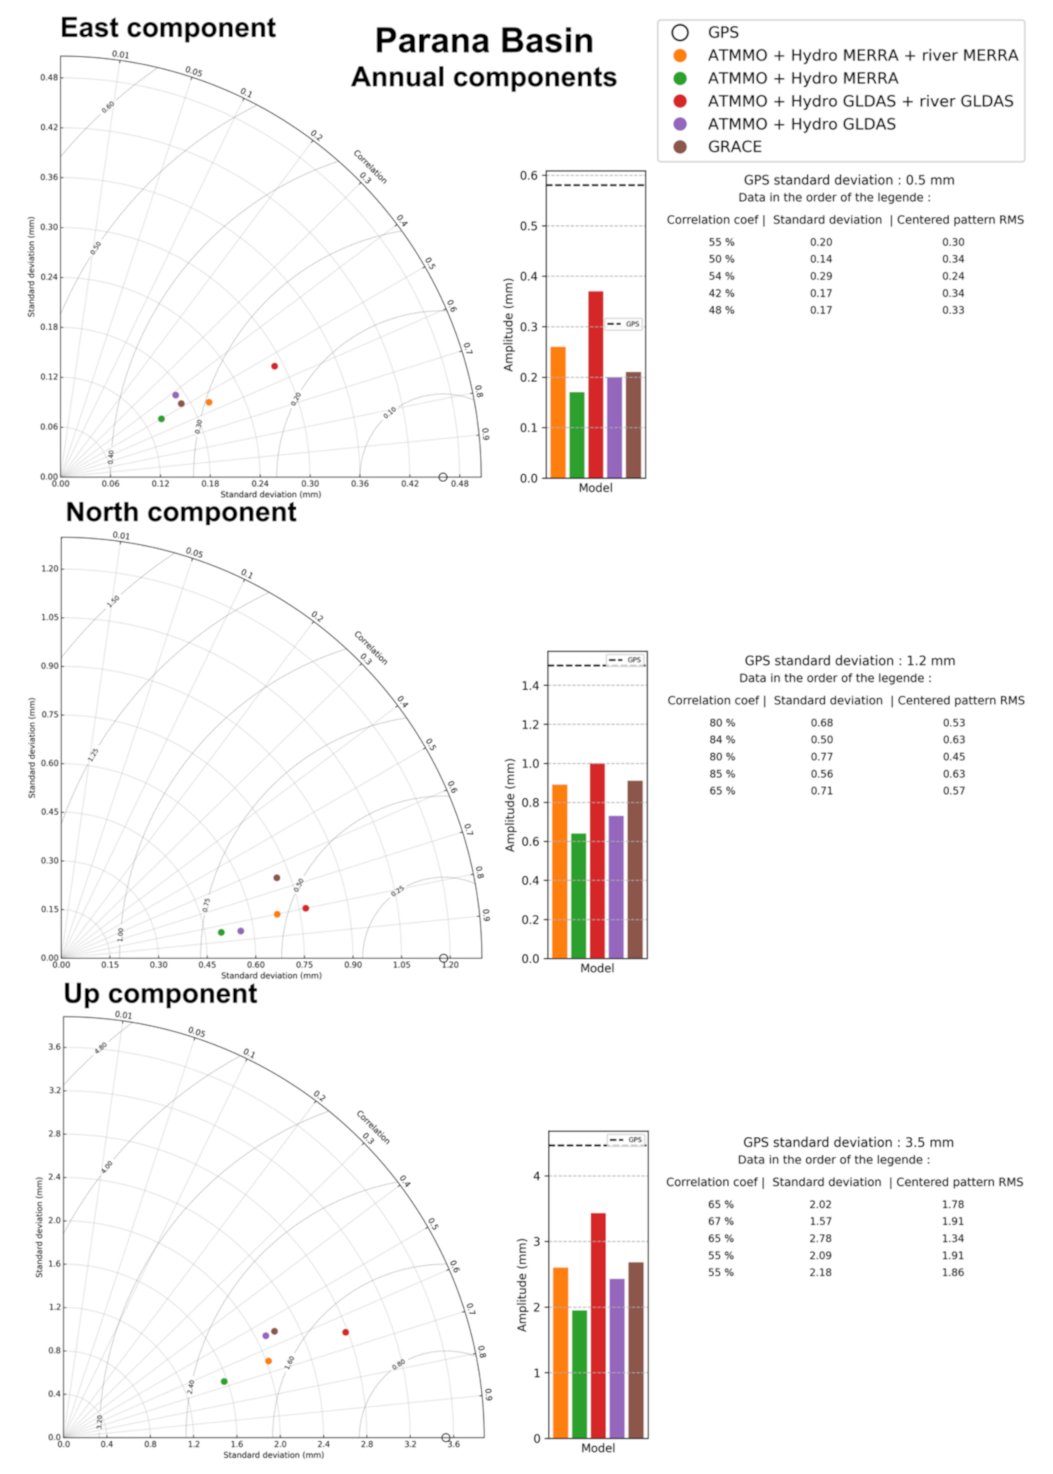
To go further in the improved hydrological model assessment, we need to consider other comparison estimators that can be provided by the Taylor diagrams. Figure 8 and Figure 9 illustrate the Taylor diagrams obtained for POVE and SAGA stations. For a given component at a given site, considering such a diagram gives clear indication of the agreement between the different models and GPS. Each color corresponds to a solution: GPS in black, MERRA-land + river model in orange, initial MERRA-land model in green, GLDAS/Noah + river model in red, initial GLDAS/Noah model in purple, and GRACE observations in brown. The improvement induced by the addition of the river contribution is clearly evidenced comparing the green to the orange and the purple to the red solutions. On the left part of the figure, the closer the points are to the reference point (black circle), the better the agreement between the model and the observations. The table gives in the first column the correlation coefficient (in %), in the second column the standard deviation (in mm), and in the last column the CRMS (in mm) with respect to the GPS for each solution in the same order as the color legend. The standard deviation for GPS (in mm) is given on the table legend. The histogram indicates the annual amplitude (in mm) for each solution, where the horizontal dashed line corresponds to the amplitude value for GPS. Considering these two examples, the lack of initial hydrological loading models and the huge improvement of the new models are clearly highlighted both in horizontal and in vertical. Nevertheless, we can still notice some discrepancies between the new models and GPS.
We compute the model improvement averaged for each river basin. Figure 10 and Figure 11 are the Taylor diagrams for the Amazon and Parana basins, respectively. Considering the Up component for both basins which is the highest in terms of GPS amplitude (8.2 mm and 4.7 mm for the Amazon basin and the Parana basin, respectively), we can observe a significant improvement in the models including rivers for the Amazon basin (CRMS < 3 mm with a correlation maintained between 70% and 80% using GLDAS/Noah + river and MERRA-land + river). This improvement is more moderate for the Up component of the Parana basin where the initial models already give rather good results regarding the CRMS (<2.4 mm) and the correlation (>70% for MERRA-land). Looking now at the horizontal, East and North components for both basins, we have to bear in mind the very low amplitudes of the corresponding GPS signals (<1 mm for the East and <2 mm for the North), at the limits of detectability. However, the results indicate that the models with rivers perform better for the horizontal components of the Amazon basin (CRMS roughly divided by two) than for the Parana basin (CRMS and correlation almost unchanged). A slight asymmetry can also be observed in the Amazon basin where the new models seem to overestimate the East amplitude component (0.9 mm for GLDAS/Noah + river, 0.8 mm for MERRA-land, 0.7 mm for GPS), and underestimate the North amplitude (1.1 mm for GLDAS/Noah + river, 1.0 mm for MERRA-land, 1.3 mm for GPS). This could be explained by the West to East direction of the Amazon’s runoff, which as the major river of the Amazon basin could have overcontributed to the models. It should be noted that the horizontal and vertical components derived from GRACE are generally consistent with those of the new models, regarding notably the amplitudes for the Amazon and the Parana basins e.g., 7.1 mm and 2.8 mm for GRACE Up component in the Amazon and Parana basins, respectively to be compared to 8.8 mm and 3.6 mm for GLDAS/Noah + river and 7.9 mm and 2.8 mm for MERRA-land, except for the East component of Parana. Such a consistency gives confidence in the reliability of the two models. The main point which deserves to be highlighted from our analysis, is perfectly illustrated by the behavior of the Up component in the Amazon basin. Whilst the initial models only explained nearly half of the amplitude of GPS (8.2 mm for GPS while 4.0 mm for GLDAS/Noah and 3.4 mm for MERRA-land), the new ones compensate for these gaps (8.8 mm for GLDAS/Noah + river, 7.9 mm for MERRA land) and remain consistent with GRACE (amplitude at 7.1 mm). These findings demonstrate conclusively the efficiency of the model with rivers in such basins as the Amazon.

3.2. Correlation Coefficient between the Models and GPS

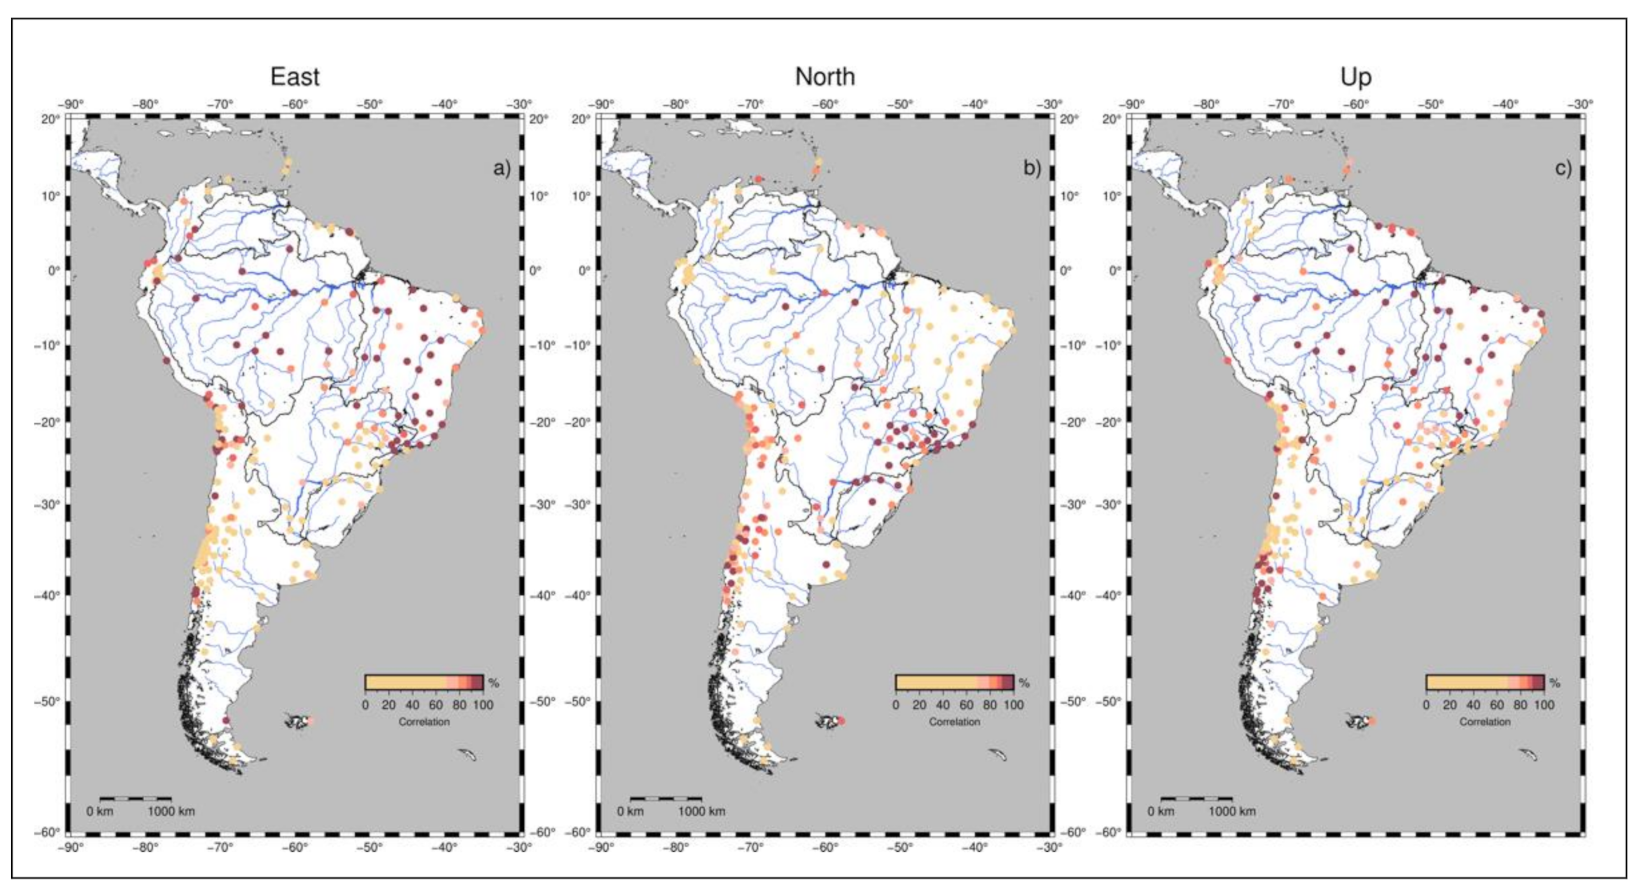
The correlation coefficient between the annual signal extracted from the GPS time series and from the different loading model time series are computed for each site and each component. The higher the correlation value is, the higher the agreement between the considered model time series is in agreement with the GPS one. A phase shift between two time series tends to decrease their correlation regardless of their amplitudes (see Section 2, Section 2.4). This indicator can thus be interpreted as a marker of phase shift. Figure 12 illustrates the correlation coefficients for GLDAS/Noah and GLDAS/Noah + river models. The darker the color, the higher agreement between the two time series. The spatial analysis of these correlation coefficients gives an indication of the spatial distribution of the impact of the new models in relation to the different river basins. We can clearly notice the major improvement for the vertical component in the Amazon basin.
We compute the number of sites in each case for different classes of correlation coefficient values: lower than 70%, between 70% and 80%, between 80% and 90%, and greater than 90%. Table 1 gives the distribution of the corresponding values for each component and each dataset. For the whole station set, the correlation coefficient values range from 0% to 100% for all components. The improvement between the initial (labelled nR in the table) and the new models (referred as wR in the table) can be highlighted for instance by the reduction of the percentage of sites with a correlation coefficient lower than 70%. Regarding the values in Table 1, the improvement is not obvious considering this value over the entire network. Nevertheless, if we focus on the number of stations with a correlation coefficient greater than 80% and even greater than 90%, then the improvement is highlighted for the Up and the East components. For instance, in the case of GLDAS/Noah when we add the river contribution, for all the considered sites the percentage of stations with a correlation larger than 80% increases of about 1.2% for the East, decreases of about 7% for the North, and increases of about 4% for the Up component. The corresponding values for MERRA-land are slightly different: increasing of about 2% in East, decreasing of about 11% in North, and increasing of about 2% in vertical. Compared to GRACE, the largest discrepancies with the new models are experienced in the North component. The proportions of correlation coefficient higher than 80% with the new models are larger than GRACE values of about 6–12% in Up, 19–26% in North, and 9–11% in East. If we focus on Amazon basin, the proportion of stations with a vertical correlation coefficient larger than 80% changes from 44% to 60% and from 56% to 64% for GLDAS/Noah and MERRA-land, respectively. For the horizontal components, the introduction of the river contribution slightly increases this proportion for the North component and decreases in the East component, the worst case being with MERRA-land. For Parana basin, the improvement is less obvious. Compared to GRACE the number of sites with a correlation higher than 80% differs from 12–20% in East, 0–4% in North, and 8–12% in Up in the Amazon basin. The impact of the new models is slightly different since the number of sites decreases by 5–10% in East, increases by 23–30% in North, and decreases by 2–22% in vertical. Thus, as expected the impact of the addition of the river is not uniform over the different river basins.

3.3. Model Contribution to Explain GPS Annual Signal

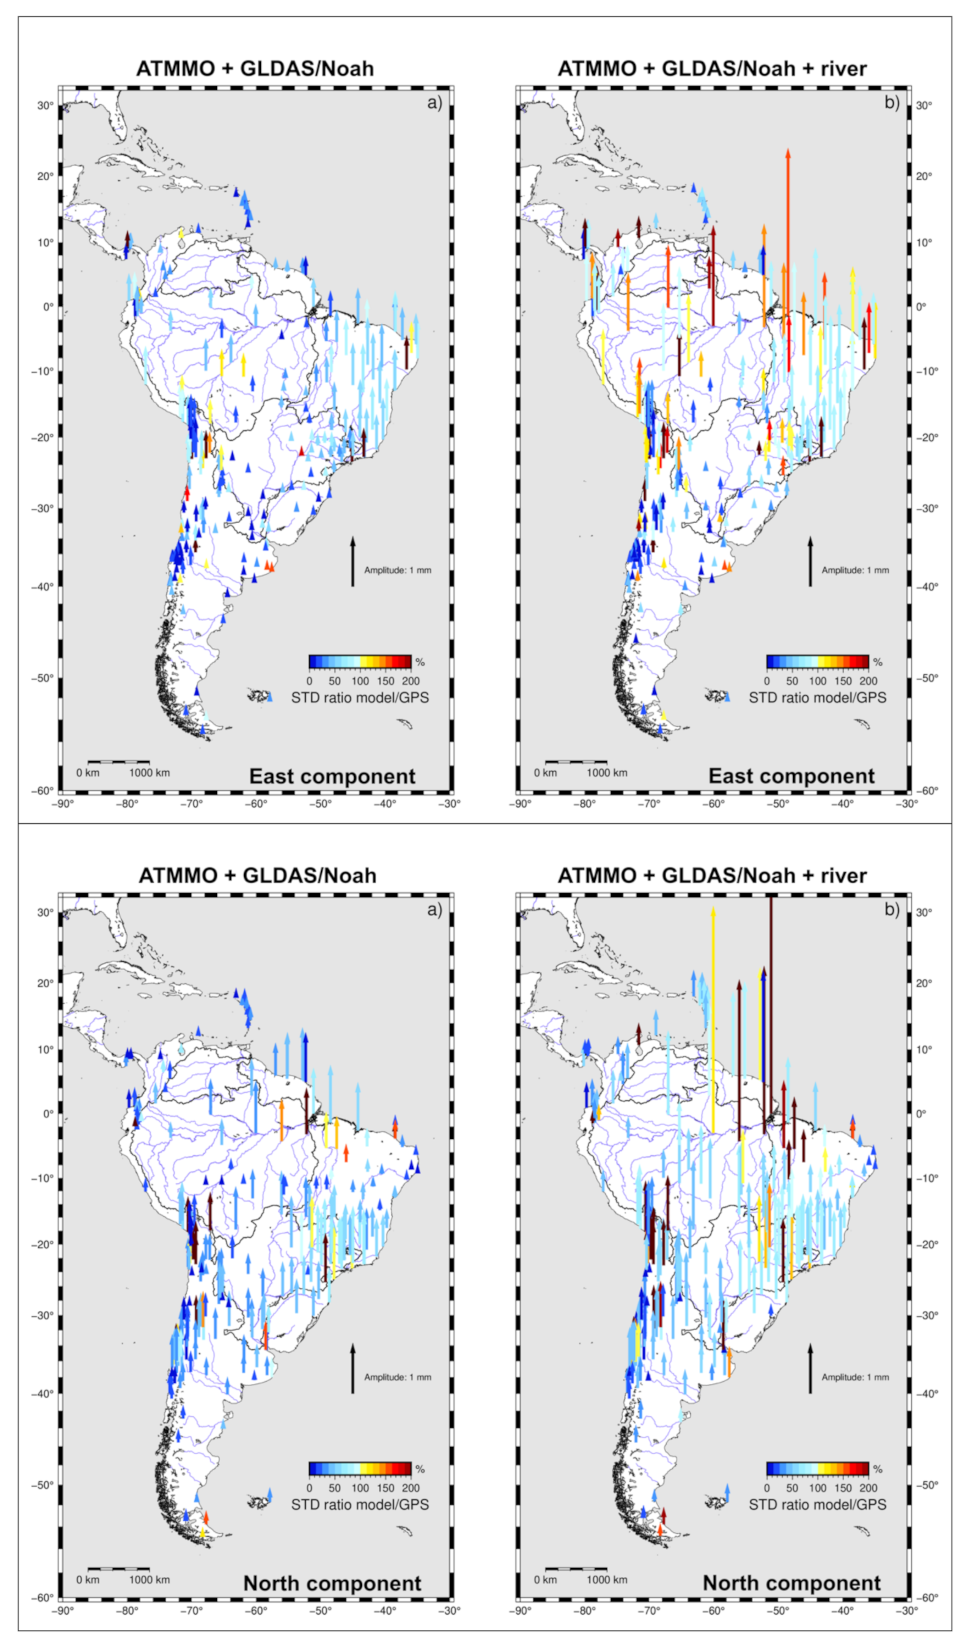
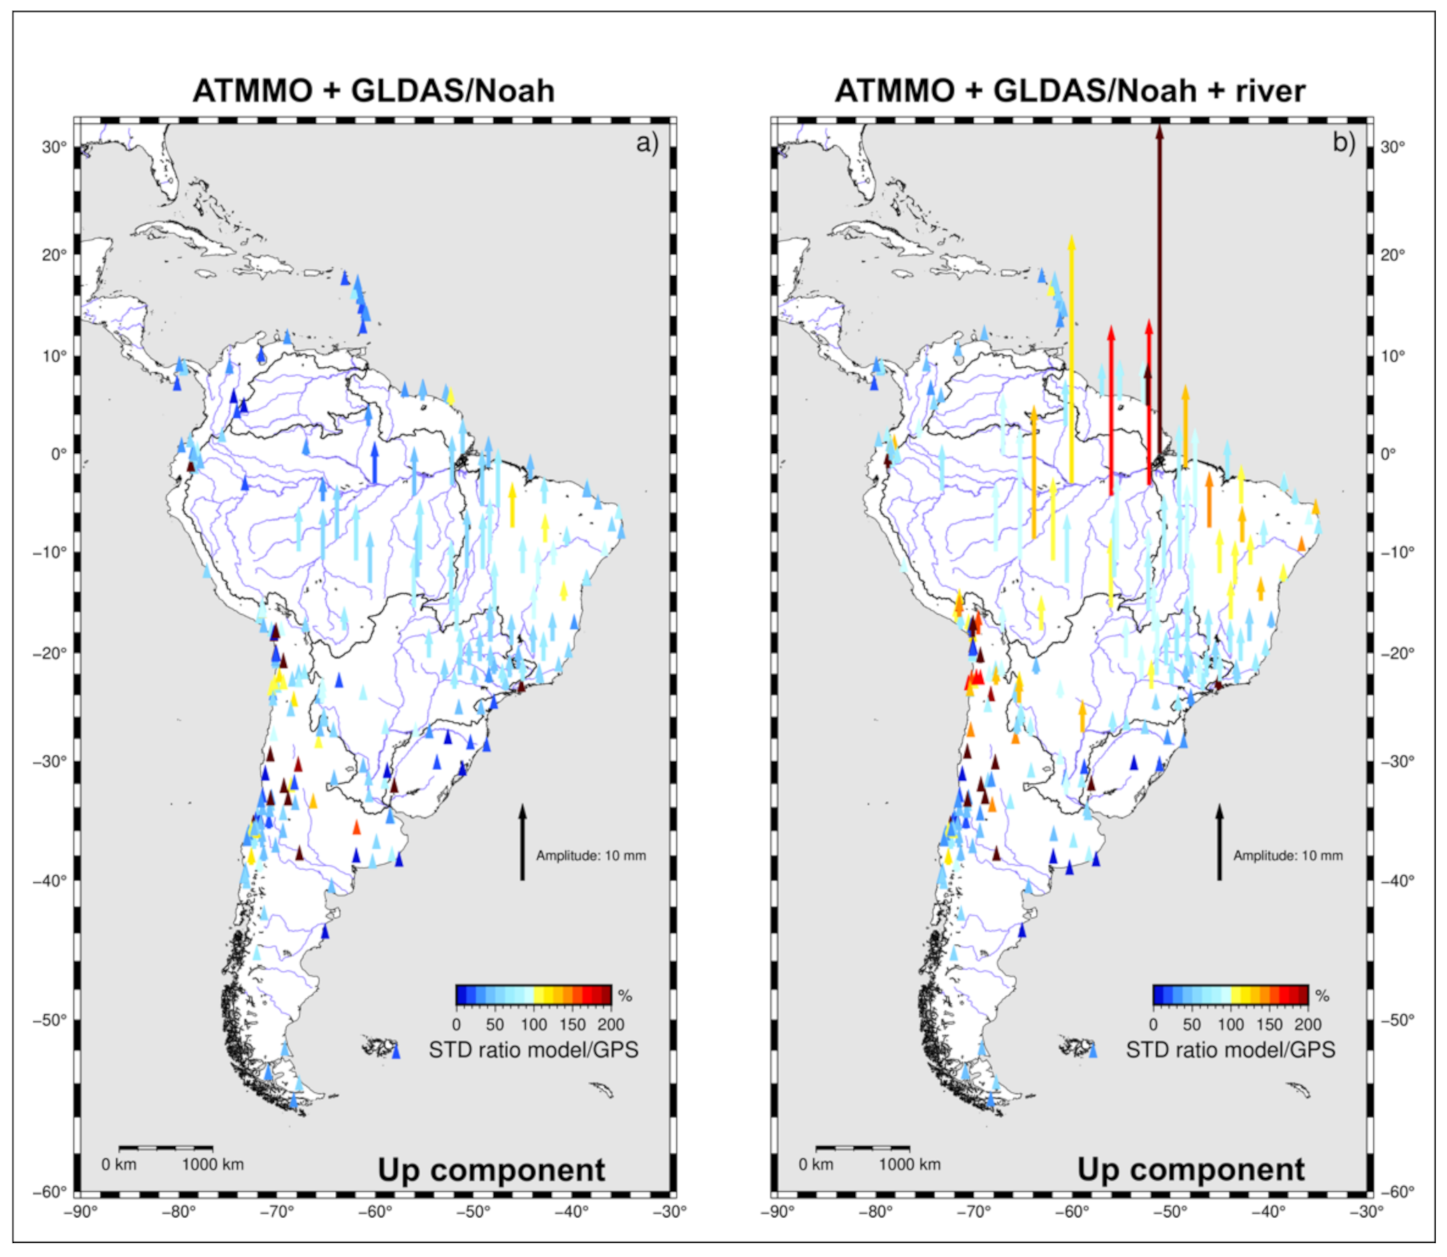
To estimate the contribution of the GPS annual signal explained by the different models, we computed the ratio of the standard deviation STD(model)/STD(GPS) for each model. Figure 13 illustrates the results obtained for GLDAS/Noah and GLDAS/Noah + river for all the three positioning components. As indicated previously, on this figure the length of the arrows corresponds to the annual amplitude. The color scale corresponds to the standard deviation ratio. The closer the model is to GPS, the closer this value is to 100%. Lighter colors correspond to better agreement between the model and GPS. Red colors indicate an overestimation of the model larger than 150%. For the North component, the oversize arrow corresponds to MAPA (Macapá, Brazil, amplitude of 6.1 mm for GLDAS/Noah + river). Looking at the annual amplitudes, the model improvement for each positioning component can be observed comparing the lengths of the arrows of the left map (initial model) to the ones of the right map (new model). We can first notice that the addition of the river contribution produces larger amplitudes for the vertical component of stations localized in the river basins. Larger amplitudes are also extracted for the new models for the horizontal components. In addition, the spatial distribution of the standard deviation ratio highlights the overall contribution of the river in the GPS signal and the importance of including them in loading models. It is particularly obvious on the vertical and North components. Nevertheless, the new model overestimates the annual signal at some stations for the vertical and North components, and for a lot of stations for the East component. These results concerning the horizontal components should be considered with respect to the horizontal accuracy of the GPS time series used in this study (1 mm).
Table 2 gives the standard deviation ratio distribution for all the sites, and for Amazon and Parana basins. We computed the number of stations for different ratio classes: lower than 50%, between 50 and 85%, between 85% and 115%, between 115% and 150%, and larger than 150%. Values higher than 100% indicate an overestimation of the annual signal by the model with respect to GPS annual term. The standard deviation ratio values demonstrate the improvement brought by the new models for the full 3D deformation. For instance, considering the number of sites in the class between 85% and 115% before and after addition of the river contribution, the differences are clear. For the vertical component, the number of stations in this class increases by 11% for the entire network, 36% for Amazon and 23% for Parana basin. The corresponding values with MERRA-land are slightly different with 7%, 28%, and 5%, respectively. For the North components, the values increase by less than 2% for the entire network, 8% for the Amazon basin, and 2.5% for the Parana basin with GLDAS/Noah, and by −0.5%, 8%, and 2.5% with MERRA-land. For the East component, with GLDAS/Noah the number of sites in this class increases by 7% for the entire network, 12% in the Amazon basin and 10% in the Parana basin. The corresponding values using MERRA-land are 4.8%, 0% and 7.5%. In the case of GRACE, the number of sites having a standard deviation between 85% and 115% are 44%, 12% and 8% in the Amazon basin for Up, North, and East components, respectively. These values are smaller in the case of the Parana basin with 17.5%, 5%, and 2.5%, respectively. This indicates that the agreement between GPS and GRACE in terms of standard deviation of the annual signal is better in the Amazon basin. These relatively lower agreements are probably due to the differences between GPS and GRACE in terms of spatial resolution and sensitivity to the loading effect, since GPS is sensitive to both regional and local effects. These results evidence the localized importance of the river contribution in the river basins considering both the new models and the GPS and GRACE observations.
Nevertheless, we can notice the slightly increasing proportion of sites where the new model overestimates the annual signal. Effectively, for instance, considering the proportion of sites in the class with a standard deviation ratio between 115% and 150%, it concerns an addition of about 7% with GLDAS/Noah and 4% with MERRA-land of sites for the entire network for the Up component. The corresponding values are about 3% for both models for the North component, and 8–9% for the East component. Focusing on the Amazon basin, with GLDAS/Noah, we notice an increase of 12%, 4% and 8%, for the Up, North, and East components, respectively. With MERRA-land, the differences are larger with corresponding values of 20%, 4%, and 16%. For comparison, in the Amazon basin, the GRACE solution shows 8%, 4%, and 11% of sites in this class for Up, North, and East components, respectively. Considering the stations with the larger overestimation, the ones in the upper class of standard deviation ratio, their number increases most in the Amazon basin for the East component for both models (more 24%). In the Amazon basin, GRACE exhibits a very small number of sites with such an overestimation for the vertical component, but the models largely overestimate the horizontal components for 16–20% of the sites in this basin. Again, this is most likely due to the spatial resolution difference between GRACE and GPS.

3.4. Centered RMS (CRMS) between the Models and GPS

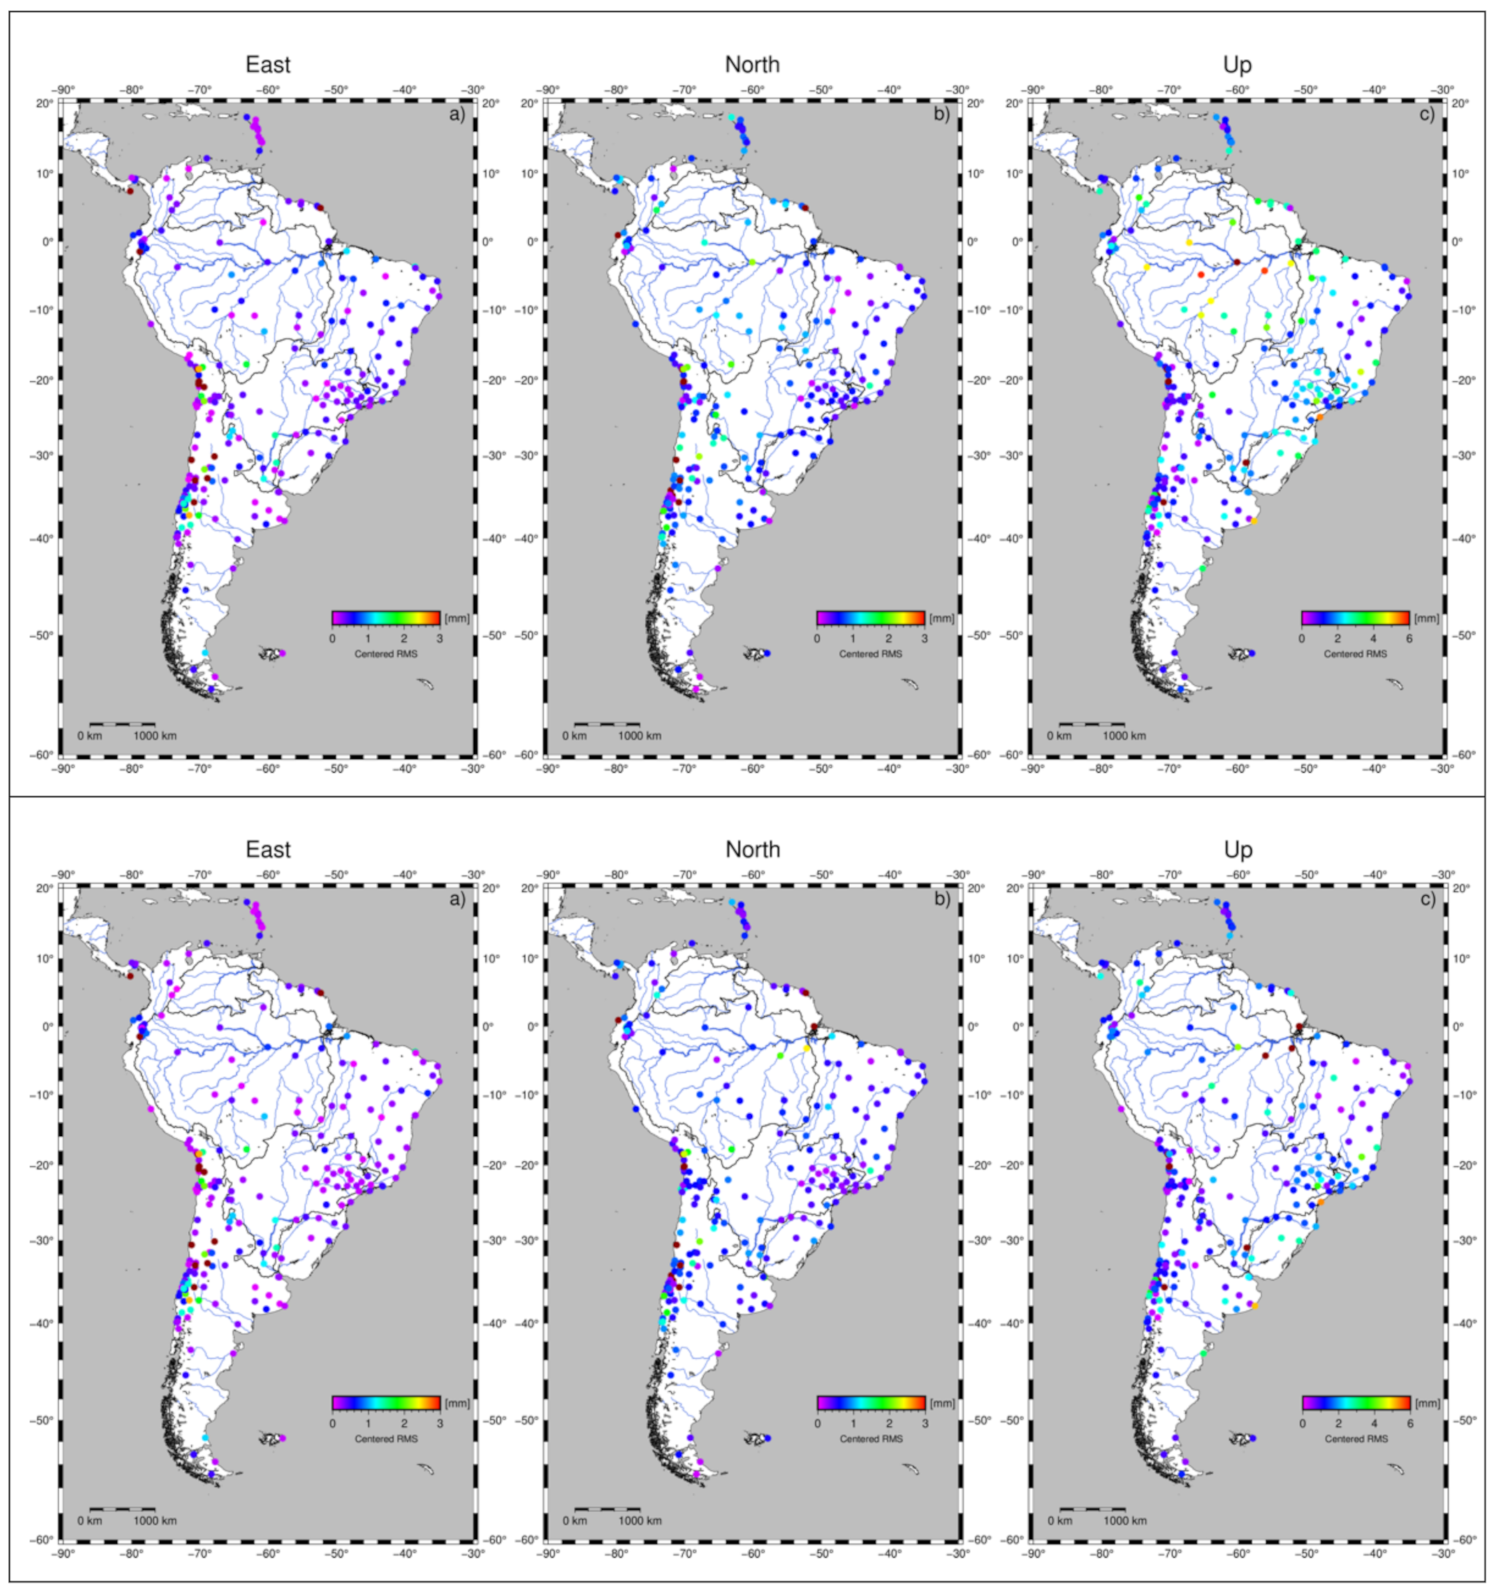
The Taylor diagram analysis gives another useful agreement estimator between the GPS and model time series, the centered RMS (CRMS). Figure 14 shows the map of the CRMS for the annual signal extracted by the M-SSA for all the considered sites with GLDAS/Noah initial and new models for the East, North, and Up components. The smaller the CRMS value is, the closer the model and the reference are. This estimator clearly evidences the improvement of the new models in the river basins, mainly in the Up and North components.
Table 3 provides the distribution (in %) of the number of sites in different classes of the CRMS values. These classes are different for the horizontal and vertical components to take into account the relative difference in terms of accuracy and amplitude. For the horizontal components, the classes are: lower than 1 mm, between 1 and 2 mm, between 2 and 3 mm, and larger than 3 mm. For the vertical component, the classes are: lower than 3 mm, between 3 and 6 mm, between 6 and 9 mm, larger than 9 mm. For the vertical component over all the sites, the addition of the river contribution slightly increases the number of sites with a CRMS lower than 3 mm (from about 85% to 93% with GLDAS/Noah and from about 84% to 91% with GLDAS/Noah). The new values are close to the GRACE one (about 90%). For the horizontal components, the differences of number of stations with a CRMS lower than 1 mm are quite small (improvement for about 6% in North and 1% in East), but again the values are closer to GRACE ones. Focusing on the Amazon and Parana river basins, we can see that the addition of the river contribution has an effect on the East component only with MERRA-land. For the North component, the impact is quite different with a larger impact on the sites located in the Amazon basin (more 24%) than for Parana basin sites (more 8%). This contrast is even more obvious considering the vertical component, with an increase of 36–40% in the Amazon and only 8% in the Parana. Each time the models correctly explain the GPS observations, the CRMS falls below the significance level (GPS accuracy).

4. Discussion

We have demonstrated that surface water is a significant contributor to seasonal mass variations in South America [27] which cannot be neglected when comparing GPS observations to hydrological loading estimates. Using a simple river routing scheme [49] forced by the runoffs from global hydrological models, we have shown that it is possible to determine the seasonal surface water changes with sufficient accuracy for loading estimates or comparing to time-variable gravity measurements from the GRACE and GRACE-FO missions. Almost half of the seasonal hydrological mass variations are stored in the river and the floodplains for the Amazon, Orinoco and Parana river basins.
We analyzed a set of almost 250 permanent GPS stations in South America over a 13-year period using the M-SSA technique. This tool allows to extract the common signal in the observed vertical and horizontal displacements, filtering out any local perturbation. Adding the river storage, we show and quantify the higher correlation between GPS observations and loading estimates, at the station level, but also at the river basin and continental scales. The improvement is particularly clear considering the CRMS (Centered Root Mean Square) values. Extracting this common mode is particularly interesting when comparing GPS measurements to loading models over such a large area. We show in our study higher correlation between the total loading estimates (atmosphere + ocean + hydrology, even without taking into account the river storage) than [14] over all equatorial regions. Indeed, [14] analyzed each individual vertical time series independently, then computed average over 10° latitude bands, and showed a minimum reduction of variance after correction of loading effects at low latitudes. Their analysis was then more sensitive to local deformation or mismodelling, unlike ours.
For all three components, the GLDAS/Noah model [45] including the river storage variations is in better agreement with GPS observations than MERRA-land [44] and also GRACE mascons [47]. The lower spatial resolution of GRACE solutions may explain some of the lower correlation with GPS displacements, compared to the hydrological models. The agreement between GPS and loading estimates are slightly lower for the Parana river basin than for the Amazon river basin; this is most likely due to smaller variations (on average a standard deviation of 3.6 mm for the vertical compared to 6.4 mm), leading to an increase sensitivity to the GPS noise. For stations in close vicinity of the rivers, compared to the river routing resolution (here 0.5 degree), such as Manaus (NAUS), a higher resolution of the river model may be required to avoid loading overestimates [29].

5. Conclusions

Further investigation will help to understand why new models exhibit overestimations of the annual signal at some sites. This study could also be extended to other areas with dense permanent GPS networks, such as Europe [78] or Northern America. In spite of smaller hydrological variations, loading effects cannot explain entirely GPS observations [14,78]. Adding river storage to the hydrological models using similar procedure should help us increase the agreement between loading estimates and deformation observations. Recent advances in remote sensing for hydrology should be considered to improve the river contribution modelling [79]. At higher frequencies, monitoring the deformations due to river floods using nearby GPS stations requires better river modelling using Manning’s equation and the knowledge of the river geometry (cross section area, hydraulic radius and channel slope).

Author Contributions

Conceptualization of the project and supervision of the interns: J.N. and J.V.; Loading computation and river modeling: J.-P.B. Analysis, software implementation: L.B., A.B., A.C. and A.A. Technical guidance to software implementation (M-SSA) and computer management: F.D. Review and scientific discussion: P.C. Result analysis and discussion: J.N., J.V., J.-P.B. and L.B. Writing and editing: J.N., J.V. and J.-P.B. All authors have read and agreed to the published version of the manuscript.

Funding

Cnam funded the Internships (LB, AB, AC and AA); Partial funding was obtained from CNES (Centre National d’Etudes Spatiales). This project has received funding from the European Union’s Horizon 2020 research and innovation program under the Marie Sklodowska-Curie grant agreement No 785919.

Data Availability Statement

GPS timeseries were obtained at NGL (http://geodesy.unr.edu/ accessed on 1 March 2021). Hector software is available at (http://segal.ubi.pt/hector/ accessed on 1 March 2021). Maps were obtained using GMT software (https://www.generic-mapping-tools.org/ accessed on 1 March 2021). We thank Hydroweb (data available at http://hydroweb.theia-land.fr/ accessed on 1 March 2021) research groups for providing water level data used in this study. Most of the loading estimates are available at the EOST loading service (http://loading.u-strasbg.fr accessed on 1 March 2021).

Acknowledgments

This study was performed with GRGS (Groupe de Recherche de Géodésie Spatiale, https://grgs.obs-mip.fr/ accessed on 1 March 2021). We are grateful to anonymous reviewers who help improve the manuscript.

Conflicts of Interest

The authors declare no conflict of interest.

References

  1. Blewitt, G.; Lavallée, D.; Clarke, P.; Nurutdinov, K. A New Global Mode of Earth Deformation: Seasonal Cycle Detected. Science 2001, 294, 2342–2345. [Google Scholar] [CrossRef] [PubMed] [Green Version]
  2. King, M.A.; Altamimi, Z.; Boehm, J.; Bos, M.; Dach, R.; Elosegui, P.; Fund, F.; Hernández-Pajares, M.; Lavallee, D.; Mendes Cerveira, P.J.; et al. Improved Constraints on Models of Glacial Isostatic Adjustment: A Review of the Contribution of Ground-Based Geodetic Observations. Surv. Geophys. 2010, 31, 465–507. [Google Scholar] [CrossRef]
  3. Reager, J.T.; Gardner, A.S.; Famiglietti, J.S.; Wiese, D.N.; Eicker, A.; Lo, M.-H. A Decade of Sea Level Rise Slowed by Climate-Driven Hydrology. Science 2016, 351, 699–703. [Google Scholar] [CrossRef] [PubMed] [Green Version]
  4. Wöppelmann, G.; Marcos, M. Vertical Land Motion as a Key to Understanding Sea Level Change and Variability. Rev. Geophys. 2016, 54, 64–92. [Google Scholar] [CrossRef] [Green Version]
  5. Santamaría-Gómez, A.; Gravelle, M.; Dangendorf, S.; Marcos, M.; Spada, G.; Wöppelmann, G. Uncertainty of the 20th Century Sea-Level Rise Due to Vertical Land Motion Errors. Earth Planet. Sci. Lett. 2017, 473, 24–32. [Google Scholar] [CrossRef]
  6. Vergnolle, M.; Bouin, M.-N.; Morel, L.; Masson, F.; Durand, S.; Nicolas, J.; Melachroinos, S.A. GPS Estimates of Ocean Tide Loading in NW-France: Determination of Ocean Tide Loading Constituents and Comparison with a Recent Ocean Tide Model. Geophys. J. Int. 2008, 173, 444–458. [Google Scholar] [CrossRef] [Green Version]
  7. van Dam, T.; Collilieux, X.; Wuite, J.; Altamimi, Z.; Ray, J. Nontidal Ocean Loading: Amplitudes and Potential Effects in GPS Height Time Series. J. Geod. 2012, 86, 1043–1057. [Google Scholar] [CrossRef] [Green Version]
  8. Tregoning, P.; van Dam, T. Atmospheric Pressure Loading Corrections Applied to GPS Data at the Observation Level. Geophys. Res. Lett. 2005, 32, L22310. [Google Scholar] [CrossRef] [Green Version]
  9. Argus, D.F.; Fu, Y.; Landerer, F.W. Seasonal Variation in Total Water Storage in California Inferred from GPS Observations of Vertical Land Motion. Geophys. Res. Lett. 2014, 41, 1971–1980. [Google Scholar] [CrossRef]
  10. Fenoglio-Marc, L.; Scharroo, R.; Annunziato, A.; Mendoza, L.; Becker, M.; Lillibridge, J. Cyclone Xaver Seen by Geodetic Observations. Geophys. Res. Lett. 2015, 42, 9925–9932. [Google Scholar] [CrossRef] [Green Version]
  11. Penna, N.T.; King, M.A.; Stewart, M.P. GPS Height Time Series: Short-Period Origins of Spurious Long-Period Signals. J. Geophys. Res. Solid Earth 2007, 112, B02402. [Google Scholar] [CrossRef]
  12. Ferenc, M.; Nicolas, J.; van Dam, T.; Polidori, L.; Rigo, A.; Vernant, P. An Estimate of the Influence of Loading Effects on Tectonic Velocities in the Pyrenees. Stud. Geophys. Geod. 2014, 58, 56–75. [Google Scholar] [CrossRef]
  13. Collilieux, X.; van Dam, T.; Ray, J.; Coulot, D.; Métivier, L.; Altamimi, Z. Strategies to Mitigate Aliasing of Loading Signals While Estimating GPS Frame Parameters. J. Geod. 2012, 86, 1–14. [Google Scholar] [CrossRef]
  14. Mémin, A.; Boy, J.-P.; Santamaría-Gómez, A. Correcting GPS Measurements for Non-Tidal Loading. GPS Solut. 2020, 24, 45. [Google Scholar] [CrossRef]
  15. Tapley, B.D.; Bettadpur, S.; Watkins, M.; Reigber, C. The Gravity Recovery and Climate Experiment: Mission Overview and Early Results. Geophys. Res. Lett. 2004, 31, L09607. [Google Scholar] [CrossRef] [Green Version]
  16. Chen, J.; Famigliett, J.S.; Scanlon, B.R.; Rodell, M. Groundwater Storage Changes: Present Status from GRACE Observations. Surv. Geophys. 2016, 37, 397–417. [Google Scholar] [CrossRef]
  17. Frappart, F.; Ramillien, G. Contribution of GRACE Satellite Gravimetry in Global and Regional Hydrology, and in Ice Sheets Mass Balance. In Water Resources Management and Modeling; Nayak, P., Ed.; InTech Open: London, UK, 2012. [Google Scholar] [CrossRef] [Green Version]
  18. Eicker, A.; Forootan, E.; Springer, A.; Longuevergne, L.; Kusche, J. Does GRACE See the Terrestrial Water Cycle “Intensifying”? J. Geophys. Res. Atmos. 2016, 121, 733–745. [Google Scholar] [CrossRef] [Green Version]
  19. Fu, Y.; Argus, D.F.; Landerer, F.W. GPS as an Independent Measurement to Estimate Terrestrial Water Storage Variations in Washington and Oregon. J. Geophys. Res. Solid Earth 2015, 120, 552–566. [Google Scholar] [CrossRef]
  20. Borsa, A.A.; Agnew, D.C.; Cayan, D.R. Ongoing Drought-Induced Uplift in the Western United States. Science 2014, 345, 1587–1590. [Google Scholar] [CrossRef]
  21. Chew, C.C.; Small, E.E. Terrestrial Water Storage Response to the 2012 Drought Estimated from GPS Vertical Position Anomalies. Geophys. Res. Lett. 2014, 41, 6145–6151. [Google Scholar] [CrossRef]
  22. Argus, D.F.; Landerer, F.W.; Wiese, D.N.; Martens, H.R.; Fu, Y.; Famiglietti, J.S.; Thomas, B.F.; Farr, T.G.; Moore, A.W.; Watkins, M.M. Sustained Water Loss in California’s Mountain Ranges During Severe Drought From 2012 to 2015 Inferred From GPS. J. Geophys. Res. Solid Earth 2017, 122, 10559–10585. [Google Scholar] [CrossRef] [Green Version]
  23. Knappe, E.; Bendick, R.; Martens, H.R.; Argus, D.F.; Gardner, W.P. Downscaling Vertical GPS Observations to Derive Watershed-Scale Hydrologic Loading in the Northern Rockies. Water Resour. Res. 2019, 55, 391–401. [Google Scholar] [CrossRef]
  24. Karegar, M.A.; Dixon, T.H.; Kusche, J.; Chambers, D.P. A New Hybrid Method for Estimating Hydrologically Induced Vertical Deformation From GRACE and a Hydrological Model: An Example From Central North America. J. Adv. Model. Earth Syst. 2018, 10, 1196–1217. [Google Scholar] [CrossRef]
  25. Carlson, G.; Shirzaei, M.; Werth, S.; Zhai, G.; Ojha, C. Seasonal and Long-Term Groundwater Unloading in the Central Valley Modifies Crustal Stress. J. Geophys. Res. Solid Earth 2020, 125, e2019JB018490. [Google Scholar] [CrossRef] [Green Version]
  26. Frappart, F.; Minh, K.D.; L’Hermitte, J.; Cazenave, A.; Ramillien, G.; Le Toan, T.; Mognard-Campbell, N. Water Volume Change in the Lower Mekong from Satellite Altimetry and Imagery Data. Geophys. J. Int. 2006, 167, 570–584. [Google Scholar] [CrossRef] [Green Version]
  27. Han, S.-C.; Yeo, I.-Y.; Alsdorf, D.; Bates, P.; Boy, J.-P.; Kim, H.; Oki, T.; Rodell, M. Movement of Amazon Surface Water from Time-Variable Satellite Gravity Measurements and Implications for Water Cycle Parameters in Land Surface Models. Geochem. Geophys. Geosystems 2010, 11, Q09007. [Google Scholar] [CrossRef]
  28. Nahmani, S.; Bock, O.; Bouin, M.-N.; Santamaría-Gómez, A.; Boy, J.-P.; Collilieux, X.; Métivier, L.; Panet, I.; Genthon, P.; de Linage, C.; et al. Hydrological Deformation Induced by the West African Monsoon: Comparison of GPS, GRACE and Loading Models. J. Geophys. Res. Solid Earth 2012, 117, B05409. [Google Scholar] [CrossRef] [Green Version]
  29. Dill, R.; Klemann, V.; Dobslaw, H. Relocation of River Storage From Global Hydrological Models to Georeferenced River Channels for Improved Load-Induced Surface Displacements. J. Geophys. Res. Solid Earth 2018, 123, 7151–7164. [Google Scholar] [CrossRef] [Green Version]
  30. Pinel, S.; Bonnet, M.-P.; Silva, J.S.D.; Sampaio, T.C.; Garnier, J.; Catry, T.; Calmant, S.; Fragoso, C.R.; Moreira, D.; Marques, D.M.; et al. Flooding Dynamics Within an Amazonian Floodplain: Water Circulation Patterns and Inundation Duration. Water Resour. Res. 2020, 56, e2019WR026081. [Google Scholar] [CrossRef] [Green Version]
  31. Frappart, F.; Seoane, L.; Ramillien, G. Validation of GRACE-Derived Terrestrial Water Storage from a Regional Approach over South America. Remote Sens. Environ. 2013, 137, 69–83. [Google Scholar] [CrossRef] [Green Version]
  32. Knowles, L.A.; Bennett, R.A.; Harig, C. Vertical Displacements of the Amazon Basin From GRACE and GPS. J. Geophys. Res. Solid Earth 2020, 125, e2019JB018105. [Google Scholar] [CrossRef]
  33. Ndehedehe, C.E.; Ferreira, V.G. Assessing Land Water Storage Dynamics over South America. J. Hydrol. 2020, 580, 124339. [Google Scholar] [CrossRef]
  34. Humphrey, V.; Gudmundsson, L.; Seneviratne, S.I. Assessing Global Water Storage Variability from GRACE: Trends, Seasonal Cycle, Subseasonal Anomalies and Extremes. Surv. Geophys. 2016, 37, 357–395. [Google Scholar] [CrossRef] [PubMed] [Green Version]
  35. Ferreira, V.G.; Montecino, H.D.; Ndehedehe, C.E.; del Rio, R.A.; Cuevas, A.; de Freitas, S.R.C. Determining Seasonal Displacements of Earth’s Crust in South America Using Observations from Space-Borne Geodetic Sensors and Surface-Loading Models. Earth Planets Space 2019, 71, 84. [Google Scholar] [CrossRef] [Green Version]
  36. Ferreira, V.G.; Ndehedehe, C.E.; Montecino, H.C.; Yong, B.; Yuan, P.; Abdalla, A.; Mohammed, A.S. Prospects for Imaging Terrestrial Water Storage in South America Using Daily GPS Observations. Remote Sens. 2019, 11, 679. [Google Scholar] [CrossRef] [Green Version]
  37. Bevis, M.; Alsdorf, D.; Kendrick, E.; Fortes, L.P.; Forsberg, B.; Smalley, R.; Becker, J. Seasonal Fluctuations in the Mass of the Amazon River System and Earth’s Elastic Response. Geophys. Res. Lett. 2005, 32, L16308. [Google Scholar] [CrossRef] [Green Version]
  38. Moreira, D.M.; Calmant, S.; Perosanz, F.; Xavier, L.; Filho, O.C.R.; Seyler, F.; Monteiro, A.C. Comparisons of Observed and Modeled Elastic Responses to Hydrological Loading in the Amazon Basin. Geophys. Res. Lett. 2016, 43, 9604–9610. [Google Scholar] [CrossRef]
  39. Scanlon, B.R.; Zhang, Z.; Save, H.; Sun, A.Y.; Schmied, H.M.; van Beek, L.P.H.; Wiese, D.N.; Wada, Y.; Long, D.; Reedy, R.C.; et al. Global Models Underestimate Large Decadal Declining and Rising Water Storage Trends Relative to GRACE Satellite Data. Proc. Natl. Acad. Sci. USA 2018, 115, E1080–E1089. [Google Scholar] [CrossRef] [Green Version]
  40. Solman, S.A. Regional Climate Modeling over South America: A Review. Adv. Meteorol. 2013, 2013, 504357. Available online: https://www.hindawi.com/journals/amete/2013/504357/ (accessed on 7 March 2021). [CrossRef]
  41. Li, Z.; Yue, J.; Li, W.; Lu, D. Investigating Mass Loading Contributes of Annual GPS Observations for the Eurasian Plate. J. Geodyn. 2017, 111, 43–49. [Google Scholar] [CrossRef]
  42. Klos, A.; Gruszczynska, M.; Bos, M.S.; Boy, J.-P.; Bogusz, J. Estimates of Vertical Velocity Errors for IGS ITRF2014 Stations by Applying the Improved Singular Spectrum Analysis Method and Environmental Loading Models. Pure Appl. Geophys. 2018, 175, 1823–1840. [Google Scholar] [CrossRef]
  43. Prevost, P.; Chanard, K.; Fleitout, L.; Calais, E.; Walwer, D.; van Dam, T.; Ghil, M. Data-Adaptive Spatio-Temporal Filtering of GRACE Data. Geophys. J. Int. 2019, 219, 2034–2055. [Google Scholar] [CrossRef] [Green Version]
  44. Reichle, R.H.; Koster, R.D.; Lannoy, G.J.M.D.; Forman, B.A.; Liu, Q.; Mahanama, S.P.P.; Touré, A. Assessment and Enhancement of MERRA Land Surface Hydrology Estimates. J. Clim. 2011, 24, 6322–6338. [Google Scholar] [CrossRef] [Green Version]
  45. Rodell, M.; Houser, P.R.; Jambor, U.; Gottschalck, J.; Mitchell, K.; Meng, C.-J.; Arsenault, K.; Cosgrove, B.; Radakovich, J.; Bosilovich, M.; et al. The Global Land Data Assimilation System. Bull. Am. Meteorol. Soc. 2004, 85, 381–394. [Google Scholar] [CrossRef] [Green Version]
  46. Carrère, L.; Lyard, F. Modeling the Barotropic Response of the Global Ocean to Atmospheric Wind and Pressure Forcing—Comparisons with Observations. Geophys. Res. Lett. 2003, 30, 1275. [Google Scholar] [CrossRef] [Green Version]
  47. Luthcke, S.B.; Sabaka, T.J.; Loomis, B.D.; Arendt, A.A.; McCarthy, J.J.; Camp, J. Antarctica, Greenland and Gulf of Alaska Land-Ice Evolution from an Iterated GRACE Global Mascon Solution. J. Glaciol. 2013, 59, 613–631. [Google Scholar] [CrossRef]
  48. Petrov, L.; Boy, J.-P. Study of the Atmospheric Pressure Loading Signal in Very Long Baseline Interferometry Observations. J. Geophys. Res. Solid Earth 2004, 109, B03405. [Google Scholar] [CrossRef] [Green Version]
  49. Oki, T.; Nishimura, T.; Dirmeyer, P. Assessment of Annual Runoff from Land Surface Models Using Total Runoff Integrating Pathways (TRIP). J. Meteorol. Soc. Jpn. Ser. II 1999, 77, 235–255. [Google Scholar] [CrossRef] [Green Version]
  50. Miller, J.R.; Russell, G.L.; Caliri, G. Continental-Scale River Flow in Climate Models. J. Clim. 1994, 7, 914–928. [Google Scholar] [CrossRef] [Green Version]
  51. Crétaux, J.-F.; Arsen, A.; Calmant, S.; Kouraev, A.; Vuglinski, V.; Bergé-Nguyen, M.; Gennero, M.-C.; Nino, F.; Abarca Del Rio, R.; Cazenave, A.; et al. SOLS: A Lake Database to Monitor in the Near Real Time Water Level and Storage Variations from Remote Sensing Data. Adv. Space Res. 2011, 47, 1497–1507. [Google Scholar] [CrossRef]
  52. Justice, C.O.; Townshend, J.R.G.; Vermote, E.F.; Masuoka, E.; Wolfe, R.E.; Saleous, N.; Roy, D.P.; Morisette, J.T. An Overview of MODIS Land Data Processing and Product Status. Remote Sens. Environ. 2002, 83, 3–15. [Google Scholar] [CrossRef]
  53. Didan, K. MOD13Q1 MODIS/Terra Vegetation Indices 16-Day L3 Global 250m SIN Grid V006 2015. NASA EOSDIS Land Processes DAAC: Sioux Falls, SD, USA, 2015. [Google Scholar] [CrossRef]
  54. Carabajal, C.C.; Boy, J.-P. Lake and Reservoir Volume Variations in South America from Radar Altimetry, ICESat Laser Altimetry, and GRACE Time-Variable Gravity. Adv. Space Res. 2020. [Google Scholar] [CrossRef]
  55. Blewitt, G.; Hammond, W.; Kreemer, C. Harnessing the GPS Data Explosion for Interdisciplinary Science. Eos 2018, 99. [Google Scholar] [CrossRef]
  56. Bertiger, W.; Bar-Sever, Y.; Dorsey, A.; Haines, B.; Harvey, N.; Hemberger, D.; Heflin, M.; Lu, W.; Miller, M.; Moore, A.W.; et al. GipsyX/RTGx, a New Tool Set for Space Geodetic Operations and Research. Adv. Space Res. 2020, 66, 469–489. [Google Scholar] [CrossRef]
  57. IERS. IERS Conventions. IERS Technical Note No. 36; Petit, G., Luzum, B., Eds.; Verlag des Bundesamts für Kartographie und Geodäsie: Frankfurt, Germany, 2010. [Google Scholar]
  58. Lyard, F.; Lefevre, F.; Letellier, T.; Francis, O. Modelling the Global Ocean Tides: Modern Insights from FES2004. Ocean Dyn. 2006, 56, 394–415. [Google Scholar] [CrossRef]
  59. Rebischung, P.; Altamimi, Z.; Ray, J.; Garayt, B. The IGS Contribution to ITRF2014. J. Geod. 2016, 90, 611–630. [Google Scholar] [CrossRef]
  60. Bos, M.S.; Fernandes, R.M.S.; Williams, S.D.P.; Bastos, L. Fast Error Analysis of Continuous GNSS Observations with Missing Data. J. Geod. 2013, 87, 351–360. [Google Scholar] [CrossRef] [Green Version]
  61. Vautard, R.; Ghil, M. Singular Spectrum Analysis in Nonlinear Dynamics, with Applications to Paleoclimatic Time Series. Phys. D Nonlinear Phenom. 1989, 35, 395–424. [Google Scholar] [CrossRef]
  62. Vautard, R.; Yiou, P.; Ghil, M. Singular-Spectrum Analysis: A Toolkit for Short, Noisy Chaotic Signals. Phys. D Nonlinear Phenom. 1992, 58, 95–126. [Google Scholar] [CrossRef]
  63. Ghil, M.; Vautard, R. Interdecadal Oscillations and the Warming Trend in Global Temperature Time Series. Nature 1991, 350, 324–327. [Google Scholar] [CrossRef]
  64. Ghil, M.; Allen, M.R.; Dettinger, M.D.; Ide, K.; Kondrashov, D.; Mann, M.E.; Robertson, A.W.; Saunders, A.; Tian, Y.; Varadi, F.; et al. Advanced Spectral Methods for Climatic Time Series. Rev. Geophys. 2002, 40, 1–3. [Google Scholar] [CrossRef] [Green Version]
  65. Chen, Q.; van Dam, T.; Sneeuw, N.; Collilieux, X.; Weigelt, M.; Rebischung, P. Singular Spectrum Analysis for Modeling Seasonal Signals from GPS Time Series. J. Geodyn. 2013, 72, 25–35. [Google Scholar] [CrossRef]
  66. Wang, X.; Cheng, Y.; Wu, S.; Zhang, K. An Enhanced Singular Spectrum Analysis Method for Constructing Nonsecular Model of GPS Site Movement. J. Geophys. Res. Solid Earth 2016, 121, 2193–2211. [Google Scholar] [CrossRef] [Green Version]
  67. Akaike, H. A New Look at the Statistical Model Identification. IEEE Trans. Autom. Control 1974, 19, 716–723. [Google Scholar] [CrossRef]
  68. Gruszczynska, M. Investigation of Time_changeable Seasonal Components in the GPS Height Time Series: A Case Study for Central Europe. Acta Geodyn. Geomater. 2016, 13, 281–289. [Google Scholar] [CrossRef] [Green Version]
  69. Klos, A.; Bos, M.S.; Bogusz, J. Detecting Time-Varying Seasonal Signal in GPS Position Time Series with Different Noise Levels. GPS Solut. 2017, 22, 21. [Google Scholar] [CrossRef] [Green Version]
  70. Golyandina, N. Particularities and Commonalities of Singular Spectrum Analysis as a Method of Time Series Analysis and Signal Processing. WIREs Comput. Stat. 2020, 12, e1487. [Google Scholar] [CrossRef]
  71. Walwer, D.; Calais, E.; Ghil, M. Data-Adaptive Detection of Transient Deformation in Geodetic Networks. J. Geophys. Res. Solid Earth 2016, 121, 2129–2152. [Google Scholar] [CrossRef] [Green Version]
  72. Gruszczynska, M.; Rosat, S.; Klos, A.; Gruszczynski, M.; Bogusz, J. Multichannel Singular Spectrum Analysis in the Estimates of Common Environmental Effects Affecting GPS Observations. Pure Appl. Geophys. 2018, 175, 1805–1822. [Google Scholar] [CrossRef] [Green Version]
  73. Hassani, H.; Mahmoudvand, R.; Zokaei, M. Separability and Window Length in Singular Spectrum Analysis. Comptes Rendus Math. 2011, 349, 987–990. [Google Scholar] [CrossRef]
  74. Lomb, N.R. Least-Squares Frequency Analysis of Unequally Spaced Data. Astrophys. Space Sci. 1976, 39, 447–462. [Google Scholar] [CrossRef]
  75. Scargle, J.D. Studies in Astronomical Time Series Analysis. II—Statistical Aspects of Spectral Analysis of Unevenly Spaced Data. Astrophys. J. 1982, 263, 835–853. [Google Scholar] [CrossRef]
  76. Scargle, J.D. Studies in Astronomical Time Series Analysis. III. Fourier Transforms, Autocorrelation Functions, and Cross-Correlation Functions of Unevenly Spaced Data. Astrophys. J. 1989, 343, 874–887. [Google Scholar] [CrossRef]
  77. Taylor, K.E. Summarizing Multiple Aspects of Model Performance in a Single Diagram. J. Geophys. Res. Atmos. 2001, 106, 7183–7192. [Google Scholar] [CrossRef]
  78. Springer, A.; Karegar, M.A.; Kusche, J.; Keune, J.; Kurtz, W.; Kollet, S. Evidence of daily hydrological loading in GPS time series over Europe. J. Geod. 2019, 93, 2145–2153. [Google Scholar] [CrossRef]
  79. Duan, W.; Maskey, S.; Chaffe, P.L.B.; Luo, P.; He, B.; Wu, Y.; Hou, J. Recent Advancement in Remote Sensing Technology for Hydrology Analysis and Water Resources Management. Remote Sens. 2021, 13, 1097. [Google Scholar] [CrossRef]
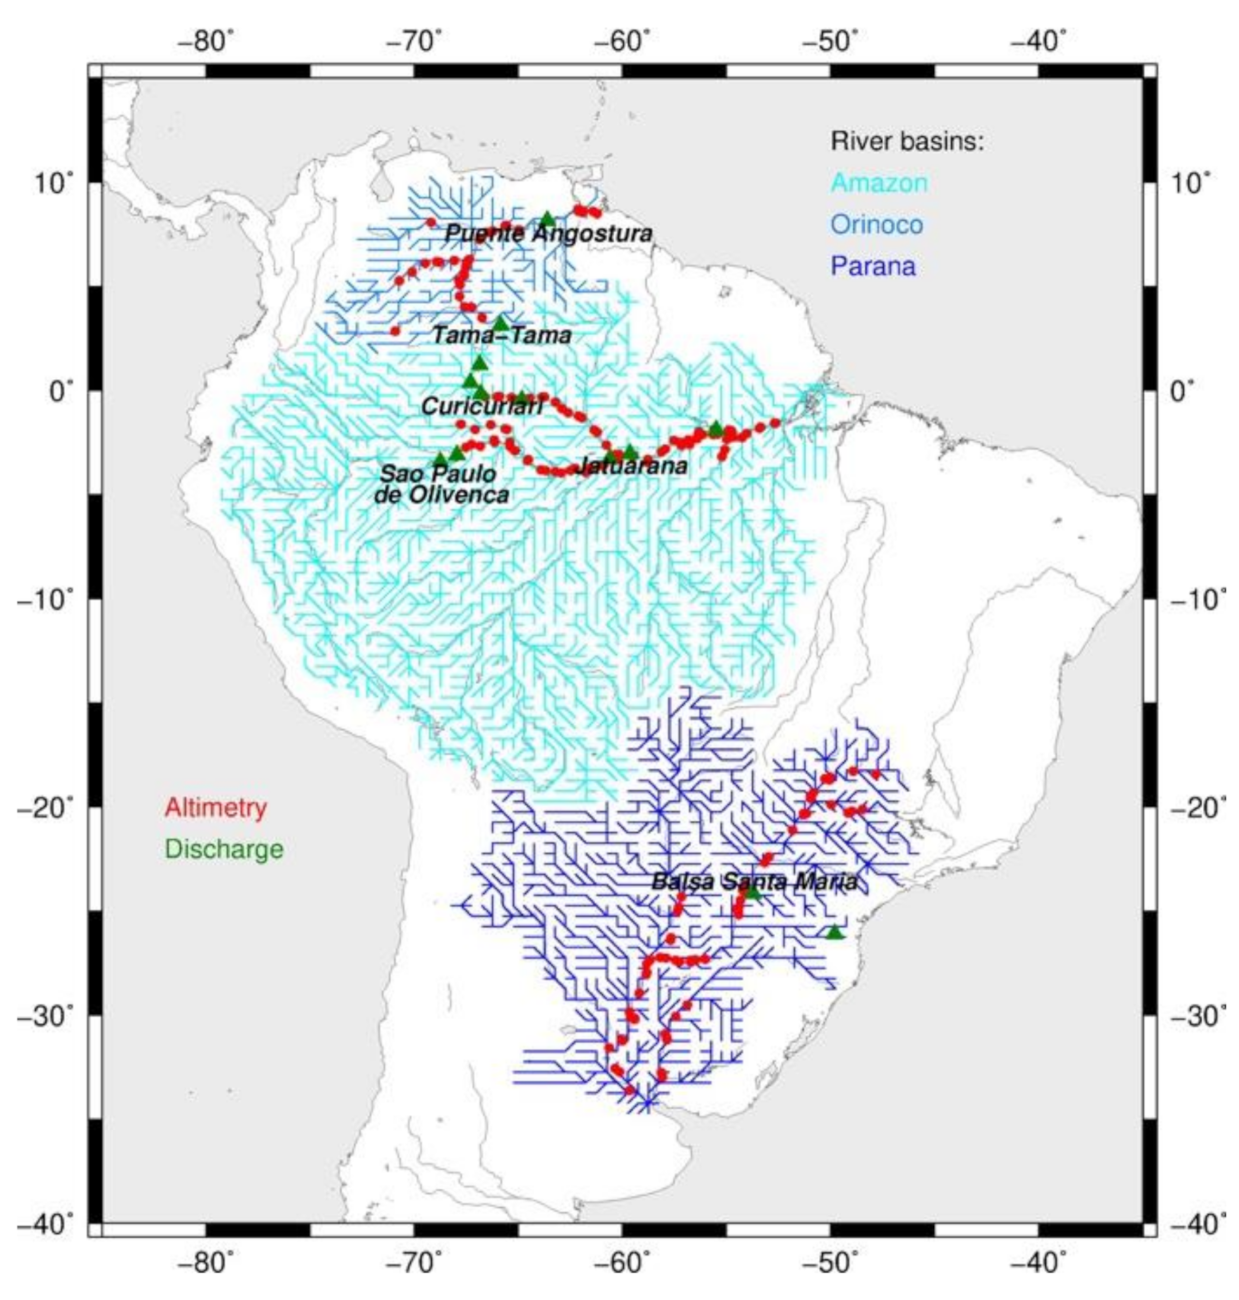
Figure 1. TRIP routing scheme for the Amazon, Orinoco and Parana rivers; radar altimetry virtual stations (red) and GRDC discharge (green) measurements.
Remotesensing 13 01605 g001
Figure 2. Mean annual measured (in black) and modeled (in red with GLDAS/Noah runoffs and in green with MERRA-land) annual discharged for three gauges in the Amazon river basin (top), and two in the Orinoco and Parana river basins (bottom). The location of the gauges is given in Figure 1.
Remotesensing 13 01605 g002
Figure 3. From top to bottom, annual amplitude (in cm) of GRACE, GLDAS/Noah and MERRA-land hydrology for the Amazon, Orinoco and Parana river basin (top), and surface water changes modeled with GLDAS/Noah and MERRA-land runoffs. Annual amplitude (in cm) of GRACE, GLDAS/Noah and MERRA-land after adding the river storage filtered at GRACE resolution and finally, mean seasonal mass variability per basin for GRACE (black), GLDAS/Noah (in red, thin line: mass changes from the hydrology model, thick line: total mass changes i.e., hydrology + river) and MERRA-land (in green) (bottom).
Remotesensing 13 01605 g003
Figure 4. Map of the 247 continuous GPS stations selected in South America used in this study. The different river basin limits are shown with a white solid line: Amazon (A), Parana (P), and Orinoco (O).
Remotesensing 13 01605 g004
Figure 5. Example of Taylor diagram as used in the paper. The point represented by a star (★) corresponds to the observation-derived time series X o k . It is plotted along the abscissa axis using its standard deviation (i.e., σ o = 4.2 mm). The point corresponding to the model-derived time series X m k is represented by a bullet (●). The radial distance from the origin to this point is proportional to the standard deviation of X m k (i.e., σ m = 5.3 mm). The labeled circles measure the distance from the star ★ and thus the Centered RMS difference between the two time series (i.e., D = 2.6 mm). The radial lines are labeled by the correlation coefficient between the two time series (i.e., R = 0.87).
Remotesensing 13 01605 g005
Figure 6. Example of annual signal (RC1, in mm) extracted by M-SSA at station POVE (Porto Velho, Brazil) for East, North, and Up components, respectively. The blue line is the RC1 estimated from the GPS cleaned time series compared to the loading model time series inferred from GRACE (in brown), ATMMO+GLDAS/Noah (in purple), and ATMMO+GLDAS/Noah adding the river contribution (in red).
Remotesensing 13 01605 g006
Figure 7. Same as Figure 6 for SAGA (São Gabriel da Cachoeira, Brazil).
Remotesensing 13 01605 g007
Figure 8. Example of Taylor diagram for the annual term at POVE (Porto Velho, Brazil) for the different loading models using GPS as the reference time series (in black) for the East (top), North (middle), and Up (bottom) components. The full nontidal loading signal is modelled using ATMMO for the atmosphere and the ocean effect combined with the hydrological contribution estimated using the classical MERRA-land model (in green), MERRA-land with the river contribution (in orange), GLDAS/Noah (in purple) or GLDAS/Noah with the river contribution (in red). The brown dot shows the full signal inferred from GRACE solution. The table gives the correlation coefficient (in %), the standard deviation (in mm), and CRMS (in mm) with respect to the GPS for each solution in the same order as the legend. The histogram indicates the amplitude (in mm) for each solution. The horizontal dashed line indicates the value for GPS.
Remotesensing 13 01605 g008
Figure 9. Same as Figure 8 for SAGA (São Gabriel da Cachoeira, Brazil).
Remotesensing 13 01605 g009
Figure 10. Taylor diagram for the annual term for the Amazon basin.
Remotesensing 13 01605 g010
Figure 11. Taylor diagram for the annual term for Parana basin.
Remotesensing 13 01605 g011
Figure 12. Map of the correlation coefficient (in %) between the GPS time series and the estimated loading time series using GLDAS/Noah hydrology model for the different GPS sites and each component (a) East, (b) North, and (c) Up. Top panel: correlation coefficient for the initial model (ATMMO+GLDAS/Noah). Bottom panel: correlation coefficient for the new model (ATMMO+GLDAS/Noah + river).
Remotesensing 13 01605 g012aRemotesensing 13 01605 g012b
Figure 13. Map of the annual signal estimated with the M-SSA for the full loading signal:(a) without (ATMMO + GLDAS/Noah) and (b) with the river contribution (ATMMO + GLDAS/Noah + river) for the East (top), North (middle), and Up (bottom) components, respectively. The length of the arrows corresponds to the amplitude (in mm). The color-scale represents the standard deviation ratio of the model with respect to GPS (in %).
Remotesensing 13 01605 g013aRemotesensing 13 01605 g013b
Figure 14. Map of the CRMS (in mm) using GLDAS/Noah hydrology model for the different GPS sites and each component, (a) East, (b) North, and (c) Up. Top panel: CRMS for the initial model (ATMMO+GLDAS/Noah). Bottom panel: CRMS for the new model (ATMMO+GLDAS/Noah + river).
Remotesensing 13 01605 g014
Table 1. Distribution (in %) of the correlation coefficient between GPS and the different models for different subsets of stations: all stations (247), the Amazon basin (25 stations), and the Parana basin (40 stations), designated by the acronyms “All”, “AB”, “PB”, respectively. The loading models without the river are provided in the “nR” columns, the ones including the rivers are in the “wR” columns.
ModelGRACEGLDAS/NoahMERRA-Land
ZoneAllABPBAllABPBAllABPB
ClassnRwRnRwRnRwRnRwRnRwRnRwR
East
≥90%14.220.015.022.724.736.044.017.515.019.421.128.036.010.012.5
[80%; 90%[10.520.017.511.710.916.016.05.07.511.712.124.016.017.515.0
[70%; 80%[11.738.07.55.78.116.08.00.010.09.38.512.08.05.07.5
<70%63.632.060.059.956.332.032.077.567.559.558.336.040.067.565.0
North
≥90%4.94.015.026.315.420.08.055.037.530.820.224.012.050.042.5
[80%; 90%[9.712.020.014.218.24.012.015.027.518.217.412.04.020.015.0
[70%; 80%[14.68.017.512.114.24.08.012.512.513.415.412.04.015.020.0
<70%70.976.047.547.452.272.072.017.522.537.747.052.080.015.022.5
Up
≥90%15.844.012.512.617.816.040.00.00.022.326.336.040.05.012.5
[80%; 90%[15.48.022.520.619.828.020.012.525.019.417.020.024.025.020.0
[70%; 80%[10.14.07.514.614.216.012.025.025.015.012.116.012.030.025.0
<70%58.744.057.552.248.240.028.062.550.043.344.538.024.040.042.5
Table 2. Distribution (in %) of the STD ratio between the different models and GPS for different subsets of stations: all stations (247), Amazon basin (25 stations), and Parana (40 stations), designated by the acronyms “All”, “AB”, “PB”, respectively. The loading models without the river are provided in the “nR” columns; the ones including the rivers are in the “wR” columns.
ModelGRACEGLDAS/NoahMERRA-Land
ZoneAllABPBAllABPBAllABPB
ClassnRwRnRwRnRwRnRwRnRwRnRwR
East
<50%42.120.060.061.135.668.016.062.532.564.839.760.016.082.550.0
[50%; 85%[33.640.037.522.324.78.016.030.037.523.129.620.024.017.537.5
[85%; 115%[9.78.02.58.515.412.024.05.015.05.710.516.016.00.07.5
[115%; 150%[6.112.00.02.410.58.016.00.07.51.610.94.020.00.05.0
≥150%8.520.00.05.713.84.028.02.57.54.99.30.024.00.00.0
North
<50%49.032.027.571.742.584.032.052.522.574.146.684.044.062.525.0
[50%; 85%[31.636.057.515.036.04.040.037.557.513.034.04.028.032.562.5
[85%; 115%[4.912.05.04.56.10.08.05.07.54.54.04.08.02.55.0
[115%; 150%[4.54.04.52.04.94.08.00.07.52.45.34.08.00.05.0
≥150%10.116.05.06.910.58.012.05.05.06.110.14.012.02.52.5
Up
<50%34.48.042.542.925.940.00.032.512.552.629.156.00.052.535.0
[50%; 85%[34.436.040.038.533.652.036.057.547.532.040.140.048.042.552.5
[85%; 115%[17.044.017.510.521.14.040.07.530.06.113.40.028.02.57.5
[115%; 150%[6.18.00.02.09.30.012.00.07.54.58.90.020.02.55.0
≥150%8.14.00.06.110.14.012.02.52.54.98.54.04.00.00.0
Table 3. Distribution of the CRMS (in %) for the different models for different subsets of stations: all the stations (247), Amazon basin (25 stations), and Parana (40 stations), designated by the acronyms “All”, “AB”, “PB”, respectively. The models without the rivers are provided in the “nR” columns, the ones including the river are in the “wR” columns. The horizontal and vertical classes are different to take into account the relative difference in terms of accuracy and signal amplitude.
ModelGRACEGLDAS/NoahMERRA-Land
ZoneAllABPBAllABPBAllABPB
ClassnRwRnRwRnRwRnRwRnRwRnRwR
East
<1 mm84.688.092.583.884.688.088.092.592.583.484.684.088.083.492.5
[1 mm; 2 mm[7.38.07.58.17.38.08.07.57.58.57.312.08.08.57.5
[2 mm; 3 mm[2.40.00.02.42.40.00.00.00.02.42.40.00.02.40.0
≥3 mm5.74.00.05.75.74.04.00.00.05.75.74.04.05.70.0
North
<1 mm80.280.085.077.383.460.084.087.595.078.585.064.088.085.092.5
[1 mm; 2 mm[15.020.015.017.010.936.012.012.55.015.89.732.012.015.07.5
[2 mm; 3 mm[0.80.00.01.61.24.04.00.00.01.60.84.00.00.00.0
≥3 mm4.00.00.04.04.50.00.00.00.04.04.50.00.00.00.0
Up
<3 mm89.580.087.584.692.348.084.087.595.083.891.148.088.082.590.0
[3 mm; 6 mm[7.312.010.012.64.048.08.010.02.512.66.140.012.015.07.5
[6 mm; 9 mm[0.80.00.00.81.60.08.00.00.01.60.88.00.00.00.0
≥9 mm2.48.02.52.02.04.00.02.52.52.02.04.00.02.52.5
Publisher’s Note: MDPI stays neutral with regard to jurisdictional claims in published maps and institutional affiliations.