Abstract
Defining the origin of ground deformation, which can be a very challenging task, may be approached through several investigative techniques. Ground deformation can originate in response to both natural (e.g., tectonics) and anthropic (e.g., groundwater pumping) contributions. These may either act simultaneously or be somewhat correlated in space and time. For example, the location of structurally controlled basins may be the locus of enhanced human-induced subsidence. In this paper, we investigate the natural and anthropic contributions to ground deformation in the urbanized area of the inner Sarno plain, in the Southern Apennines. We used a multidisciplinary approach based on the collection and analysis of a combination of geomorphological, stratigraphical, structural, hydrogeological, GPS, and DInSAR datasets. Geomorphological, stratigraphical, and structural data suggested the occurrence of a graben-like depocenter, the Sarno basin, bounded by faults with evidence of activity in the last 39 ka. Geodetic data indicated that the Sarno basin also experienced ground deformation (mostly subsidence) in the last 30 years, with a possible anthropogenic contribution due to groundwater pumping. Hydrogeological data suggested that a significant portion of the subsidence detected by geodetic data can be ascribed to groundwater pumping from the alluvial plain aquifer, rather than to a re-activation of faults in the last 30 years. Our interpretation suggested that a positive feedback exists between fault activity and the location of area affected by human-induced subsidence. In fact, fault activity caused the accumulation of poorly consolidated deposits within the Sarno basin, which enhanced groundwater-induced subsidence. The multidisciplinary approach used here was proven to be successful within the study area and could therefore be an effective tool for investigating ground deformation in other urbanized areas worldwide.
1. Introduction
Ground deformation is a complex phenomenon that may derive from both natural (e.g., tectonics, landslides, and sinkholes) and anthropic (e.g., human-induced subsidence) causes. Natural- and anthropic-induced subsidence may act simultaneously [1] and, in some cases, areas affected by human-induced subsidence have been shown to be clustered within basins bounded by active faults [2,3]. This makes the analysis of the ground deformation a very challenging task, especially in urbanized areas. Here, tectonic contributions to ground deformation may be disclosed by geomorphological, stratigraphical, and structural analyses [4], whereas anthropic contribution may be detected by geodetic analysis [5].
Further difficulties in the recognition of the causes that drive ground deformation may derive from the location of the investigated urban area. In fact, natural (e.g., tectonic) contributions to ground deformation are very elusive in low seismicity areas. Difficulties may arise from the lack of surface evidence of ground motions (e.g., offset landforms and/or deposits), which could provide geomorphological and stratigraphical constraints to locate active faults. Such evidence is typical of moderate to high magnitude earthquakes regions [6,7], whereas they may be rarely recognised in low-seismicity areas [8].
In areas of scarce seismicity, geomorphological analysis plays a crucial role in locating active faults by identifying fault-controlled features, both in the topography and in the river network. This is particularly true when geomorphological analysis is combined with other techniques of investigation, e.g., geodetic, geophysical, and geological [8,9,10,11,12].
The combination of different datasets may also allow the reconstruction of both the long-term (e.g., by means of geomorphological and stratigraphic data) and the short-term (e.g., by means of geodetic analysis) vertical motion history of a certain area. This approach has been adopted in different tectonic contexts, such as the Andes [10], the Himalayas [13], and the Central [14,15] and Southern Apennines [4,16] of Italy. It is worthy of note, that the classification of a fault as an active fault depends on the tectonic setting [17]. Here, we assume the definition provided by the Italian Civil Protection Department [18], which considers a fault as active if it was activated in the last 40 ka.
In this study, we investigated a low seismicity urbanized area of the Southern Apennines in Italy. The target area of our study was the inner sector of the Sarno plain, along the Tyrrhenian sector of the Campania region. Here, recent vertical motions have been inferred over both long (e.g., from geomorphological and subsurface data [19,20]) and short (e.g., GNSS and remote sensing analysis [1,21]) time periods. The first dataset pointed to a tectonic contribution (e.g., active faulting) to the subsidence of the plain, whereas the latter dataset highlighted the anthropic loading. However, to date, the two datasets for this area have not been integrated and jointly interpreted. To address this issue, we used a multidisciplinary approach by combining geomorphological, structural, and subsurface stratigraphic data with geodetic, i.e., global navigation satellite system (GNSS) and differential interferometric synthetic aperture radar (DInSAR), and hydrogeological data.
The aim of this multidisciplinary approach was: (1) to compare long-term vs. short-term vertical motions experienced by the study area; and (2) to verify if a relationship exists between the location of active faults and areas affected by human-induced subsidence.
2. Study Area
2.1. Geological Setting
The Sarno plain is located at the SE corner of the Campana plain, a large peri-Tyrrhenian graben situated along the inner sector of the Southern Apennines. The Southern Apennines are a NE-verging mountain belt that developed in response to the Neogene collision between the African and Eurasian plates [22,23,24]. Formation of the peri-Tyrrhenian grabens have been ongoing since the Lower Pleistocene in response to extensional tectonics due to the opening of the Tyrrhenian Sea [25,26,27]. These caused the lowering of the Apennine carbonate units, which are the highest morphostructural unit of the chain, either thousands of metres, in the inner areas [28,29], or hundreds of metres, in the axial zone, below the surface [4,30].
Geophysical data [28,31] has shed light on the subsurface setting of the Campana plain, which consists of three main depocenters, with the Sarno plain being the most south-easterly of these (Figure 1). The Quaternary filling of the Sarno plain consists of a ca. 1.8 km thick sequence of marine, transitional, and continental deposits, with abundant volcanics, whose age falls between the Middle Pleistocene and the Holocene [29,32]. The Quaternary filling becomes thinner towards the inner sector of the Sarno plain, where the carbonate substratum occurs at depths exceeding 250 m. Here, travertine, lacustrine, and peat layers lie on top of the 30–40 m thick Campania Ignimbrite (CI) chronostratigraphic regional marker near the Sarno village [20,33].
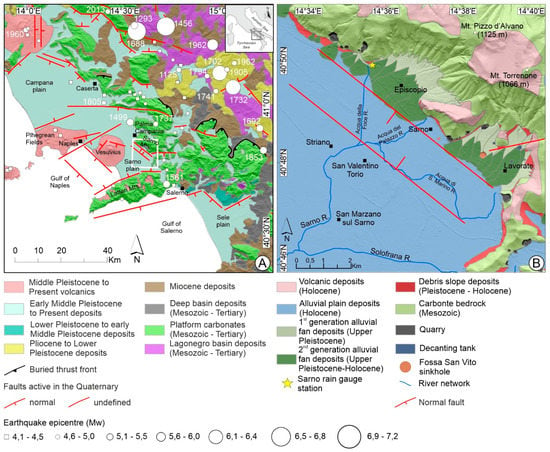
Figure 1.
(A) geological map of the sector of the Southern Apennines including the Sarno plain (modified from [20,34]). White box indicates location of the study area, shown in inset map B. Active faults are derived from the ITHACA database [35] and from Cinque et al. [36]. Earthquake epicentres and magnitude are derived from the Italian Earthquake Catalogue CPTI15 [37]. (B) geological map of the inner sector of Sarno plain (modified from [20]).
This stratigraphic setting hosts a multi-layered alluvial aquifer, which is recharged by local effective precipitation and, subordinately, by lateral groundwater flow coming from the Sarno Mountains karst aquifer. The groundwater circulation is directed towards the Sarno River and its tributaries [38,39,40]. A high number of uncontrolled and unauthorized private wells (up to approximately 90–100 wells/km2) use the plain groundwater for industrial, domestic, and agricultural purposes [5]. Other groundwater withdrawals are carried out at three well-fields and two gravity drainage galleries located near the Sarno Mountains karst aquifer.
The inner sector of the Sarno plain has been deeply investigated by means of DInSAR analysis [1,21], which suggested intense human-induced subsidence clustered around the Sarno village. In the same area, Valente et al. [20] suggested the occurrence of a graben-like structure bounded by active faults, which can be inferred by geomorphological and stratigraphic analysis around the Lavorate embayment. In contrast, evidence of recent vertical motions in the central and north-western sector of the Sarno Mountains pediment-alluvial plain junction area were not discussed in the previous work by Valente et al. [20] but are discussed in this paper.
Finally, the recent activity of the fault strands bounding the Sarno plain were not associated with diffuse and moderate-to-high magnitude seismicity (Figure 1A and Supplementary Figure S1). The strongest historical seismic events affecting the Sarno plain, and its surroundings, occurred in 1499 and in 1561, both having moment magnitudes of 5.5, and whose epicentres were located ~15 km to the NW and to the SE of the Sarno village urban area, respectively [36] (Figure 1).
2.2. Geomorphological Setting
The Sarno plain is an almost flat alluvial plain that is limited by the Gulf of Naples to the SW, and the carbonate ridges of the Sarno Mountains and the Lattari Mountains to the NE and to the SE, respectively (Figure 1). The size of the plain is about 15 × 8 km, with elevation ranging from 0 to 30 m a.s.l. near the pediment of the abovementioned mountain fronts. The flat morphology of the plain is interrupted by a slight topographic high, up to 10 m high and NW-SE trending, named the San Valentino Torio high (SVT) [20], which is bounded by rectilinear scarps towards the NE. The SVT high is dissected by the Sarno river in the area between the towns of Striano and San Valentino Torio (Figure 1B). The Sarno river is the main river flowing within the plain and is formed by the confluence of the Acqua della Foce River, the Acqua del Palazzo River, and the Acqua di San Marino River (Figure 1B). The courses of these three rivers were locally rectified by human-made interventions, which mainly affected the Acqua della Foce and Acqua del Palazzo river courses. However, the Acqua di San Marino River is less rectified, and its course is quite articulated, with a river bend that follows the NW-SE trend of the rectilinear scarp bounding the SVT towards the NE [20].
The SVT limits, to the SW, a very low-topography area that passes, in the NE, to the pediment of the Sarno Mountains. This low-topography area, hereinafter referred to as the Sarno basin, is NW-SE oriented, with a size of 2 × 10 km, and is bounded, towards the NE, by the alluvial fans that developed in the pediment of the Sarno Mountains [20]. To the east of the Sarno basin, the Sarno Mountains are roughly NW-SE trending and interrupted by two large embayments, the Episcopio and Lavorate embayments. Both embayments are characterised by the presence of two generations of coalescent alluvial fans that pass to a debris slope towards the mountain front [20]. In the Lavorate embayment, the alluvial fans are locally interrupted by the Fossa San Vito sinkhole. This sinkhole is located in the footwall block of the fault that was proposed to bound the Sarno Mountains mountain front [19].
3. Materials and Methods
We adopted a multidisciplinary approach to investigate ground deformation in the inner sector of the Sarno plain. Geomorphological, stratigraphic, and structural analyses of the mountain front-pediment-alluvial plain system were coupled with GNSS and DInSAR data analysis. Moreover, hydrogeological and piezometric data of the Sarno River alluvial plain aquifer are re-interpreted.
In the following paragraphs, each methodological step will be described separately and in detail.
3.1. Geomorphological Analysis
Geomorphological analysis was carried out by combining the analysis of topographic maps at detail scale, GIS-aided LIDAR data (1 m horizontal resolution) [41], and field surveys. Large-scale topographic maps (Technical Map of the Campania Region at scale 1:5000) were investigated to identify structural controlled landforms along the southern slope of the Sarno Mountains and in the adjoining pediment and alluvial plain. Large-scale topography of the Sarno River alluvial plain was also investigated using LIDAR data in GIS software (Arcgis 10.8 ©), which allowed for the recognition of landscape features not detectable by 1:5000 topographic maps. Finally, field surveys allowed for both the verification and integration of fault-controlled landforms recognised in the previous steps.
3.2. Stratigraphic Analysis
Stratigraphic analysis consisted of the collection and re-interpretation of both published and unpublished data from 71 boreholes (Supplementary Figure S2). Published data comprised of 14 boreholes from the ISPRA database [42] and 34 boreholes from scientific papers [43,44,45], whereas unpublished data comprised of 23 boreholes from the Piano Urbanistico Comunale of the Sarno municipality. Borehole depths ranged from 15 to 315 m. The borehole distribution allowed three geological NE-SW oriented cross-sections to be constructed, which were representative of the subsurface stratigraphy in the Episcopio and Lavorate embayments and in the Sarno village urban area.
3.3. Structural Geology Analysis
To better detail the geology of the Sarno Mountains to the east of Sarno village, we carried out geological structural mapping. A published geological map of the area [46] provided the base map for determining the lithological units, and mapping was mostly aimed at the collection of structural data. Data, such as bedding dips, fault dips, kinematic information, and fault displacements, were all recorded in the field at individual points of measurement. Using Stereonet software, these data were then used as inputs to plot planes and poles to assist in the inspection of the spatial arrangement of the data. Finally, the data allowed for the structure of the area of interest to be characterised.
3.4. Hydrogeological Analysis
To analyse hydrogeological trends within the study area, we integrated published piezometric data collected between 1978 and 2003 [19,38,47,48,49] with new data collected from September 2019 to March 2020.
Furthermore, monthly rainfall data, recorded by the rain gauge station at the Sarno village (Figure 1B) and collected from 1992 to 2020, were also considered (Table 1).

Table 1.
Hydrogeological data collected for the study area.
All these data were analysed in QGIS® and allowed for the reconstruction of three multi-temporal maps (for the years 1978, 1995, 2003) of groundwater levels (m a.s.l.; data not shown), and one map of the spatial-temporal variation of the piezometric heads. The latter map was constructed by overlapping piezometric data for the years 1992 and 2003 and by interpolating data points with the inverse distance weighted technique. We were also able to estimate the lowering groundwater level velocity (m/y) by dividing the piezometric head variation, observed between 1992 and 2003, by the time lapsed during the same period.
3.5. Geodetic Analysis
GNSS and DInSAR are two techniques of satellite geodesy, which have been widely used in recent years to measure crustal deformation associated with a number of natural phenomena, such as earthquakes, volcanism, landslides, and subsidence (e.g., [51,52,53,54,55,56,57,58]). GNSS can provide millimetre-level accuracy in horizontal directions and centimetre-level accuracy in the vertical direction [59] with unprecedented time resolution, but only at selected points, even if in dense networks. On the contrary, DInSAR techniques can be used to measure areal displacements in the direction of radar line-of-sight (LoS) with an accuracy of up to a portion of the microwave wavelength, namely an accuracy of several millimetres to centimetres [60]. For realistic crustal deformation monitoring, these two techniques perform better when used jointly. Due to the scarce availability of permanent GNSS stations in the studied area, hereafter we used GNSS only for validation purposes and cross-checking of the DInSAR data. Details of geodetic data used in this study are presented in Table 2.

Table 2.
Geodetic data sets used in this study.
3.5.1. GNSS 2003–2020
The available GNSS data were collected at the permanent station PACA, located in Palma Campania (Figure 1A). The whole data set encompasses 17.3 years, between 2003 and 2020 (Table 2). The GNSS data are a time series of 3D (north, east, up) site positions, produced by the Nevada Geodetic Laboratory [61] as daily solutions obtained using GIPSY-OASIS II software in Precise Point Positioning (PPP) mode. The solid earth and pole tide contributions were reduced according to the “IERS 2010 Conventions” [62], whereas ocean tide loading accounted for the FES2004 model [63]. The daily GNSS solutions referred to the IGS14 realisation of the International Terrestrial Reference Frame 2014 [64]. North, east, and up CGNSS components were analysed. Since the horizontal components displayed negligible rates after removal of the Eurasia plate movement, for this study we focused only on the vertical (up) component of the ground deformation.
3.5.2. DInSAR 1993–2020
DInSAR data were obtained from four different satellite constellations that have covered the investigated area since 1993 (Table 2). In detail, data was obtained from the ERS1/2 and ENVISAT constellations of the European Space Agency (ESA) for the period 1993–2010; the Cosmo-SkyMed satellite constellation of the Italian Space Agency (ASI) for the period 2012–2013, using and interpreting data obtained as part of the “II Not-ordinary Plan of Environmental Remote Sensing” [65,66]; and, finally, ESA′s SENTINEL-1 data, for the period 2016–2020, were processed and interpreted using SUBSIDENCE software, which implements the coherent pixel technique-temporal phase coherence (CPT-TPC) approach [67,68], developed at the Remote Sensing Laboratory (RSLab) of the Universitat Politecnica de Catalunya of Barcelona.
DInSAR data produce relative LoS motion measurements with respect to a reference point. To refer the GNSS and SAR motions to the same frame, the 3D GNSS vectors defined in the local reference system have to be projected into the SAR LoS using the relationship:
GNSS LoS = sin (θ) cos (ϕ)E + sin (θ) sin (ϕ)N + cos (θ) UP [69]
Where, (θ) and (ϕ) are the incidence angle and ground track, respectively, and E, N, UP satellite are the components (east, north, and up) of the GNSS displacement.
When just the vertical components of the GNSS vectors are of interest, the projection into the SAR LoS can be performed using the simplified relationship from [69]:
GNSS LoS = cosθ ∗ UP
4. Results
4.1. Geomorphological Analysis
Results of geomorphological analysis are reported in the geomorphological map of Figure 2. Here, we combined fault-controlled landforms detected in this study with landforms recognised by Valente et al. [20].
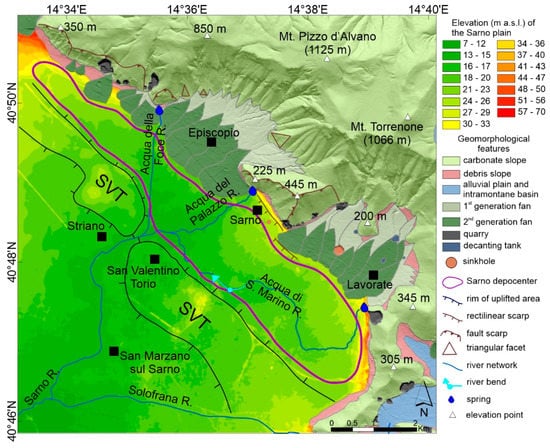
Figure 2.
Geomorphological map of the inner sector of the Sarno plain and the adjoining western slope of the Sarno mountains (modified from [20]).
Fault scarps characterise the southern slope of the Sarno Mountains mountain front and are NW-SE trending and SW facing. Their height ranges from 250 m, to the NW of the Acqua della Foce River, to 400 m, to the NE of the Sarno urban area (Figure 2). Furthermore, NE-SW trending, SE facing fault scarps were also recognised in the NW sector of both the Episcopio and the Lavorate embayments (Figure 3A). All the fault scarps exhibit a planar form, being poorly dissected by the river network, with a slope also exceeding 40°. In the Episcopio embayment, both NE-SW trending, SE facing, and NW-SE trending, SW facing triangular facets were recognised.
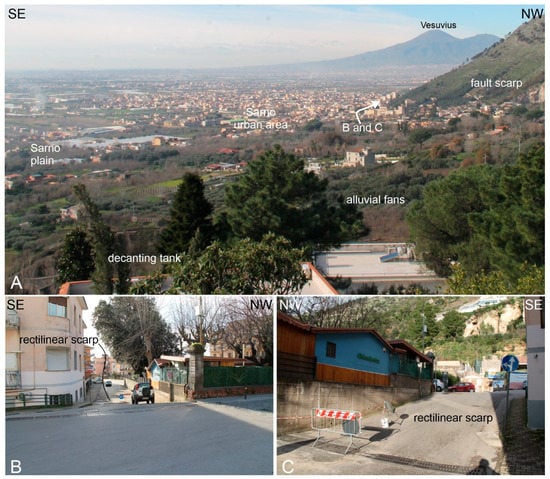
Figure 3.
(A) panoramic view of the Sarno plain from the Lavorate embayment. White arrow near Sarno town indicates location of the rectilinear scarp shown in insets B and C; a portion of the rectilinear scarp seen from footwall (B) and hanging wall (C) blocks.
Rectilinear scarps were recognised at the pediment-alluvial plain junction. These included a NW-SE trending, SW facing, 3 to 5 m high scarp that cut the second-generation alluvial fan in the Lavorate embayment, already recognised by Valente et al. [20]. Furthermore, field work allowed recognition of another rectilinear scarp, which occurs to the north of the previous one. It is NW-SE trending, SW facing, 3–5 m high and has been recognised in the urban area of Sarno village (Figure 3B,C).
The abundance of fault-controlled landforms suggests the presence of a complex fault pattern, thus enhancing the role of tectonics in shaping the mountain front. Further detail on the fault systems that affect the Sarno mountains in this area is provided in Section 4.3.
4.2. Tectonostratigraphy of the Sarno Plain
The detailed stratigraphic and structural setting of the surface and subsurface Quaternary filling of the Sarno plain and the Episcopio and Lavorate embayments was described based on field surveys and borehole data (Figure 4 and Supplementary Figure S2). Field surveys confirmed the geological setting described in Section 2.1. Pivotal to our study are deep boreholes, which allowed for the detailing of the subsurface stratigraphy of the alluvial plain deposits and their structural configuration.
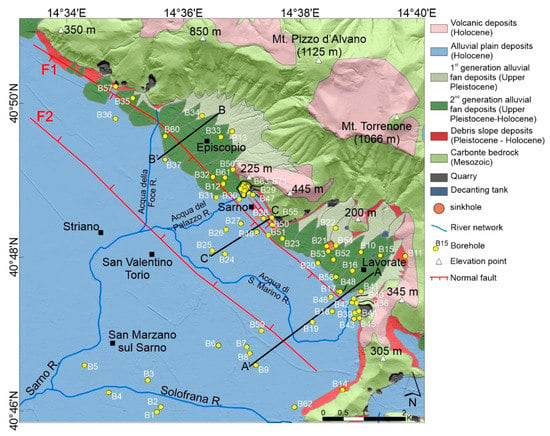
Figure 4.
Geological map of the inner sector of the Sarno plain (modified from [20]).
The subsurface stratigraphic and structural setting of the study area was synthesized in three geological cross-sections, labelled A–A′, B–B′ and C–C′ (Figure 4 and Figure 5). Stratigraphic units were grouped as follows (from the base to the top): carbonate substratum; marine to transitional deposits; pre-Campania Ignimbrite (pre-CI) alluvial deposits; Campania Ignimbrite (CI); alluvial plain deposits and post-Campania Ignimbrite (post-CI) pyroclastics; alluvial fan deposits; and lacustrine, peat, and travertine layers interlayered within the post-CI deposits.
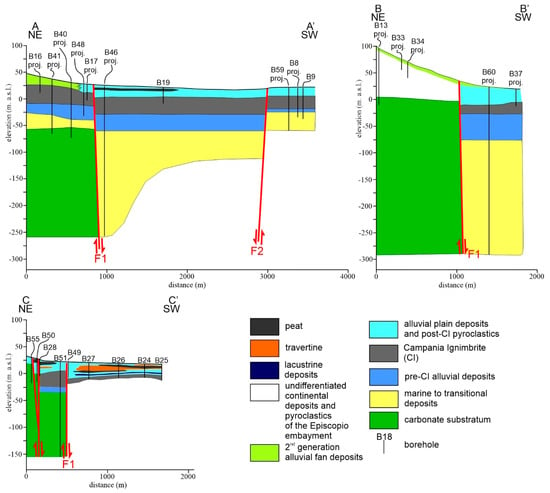
Figure 5.
Geological cross-section showing the spatial distribution of the Quaternary marine, continental, and volcanic deposits and the pre-Quaternary carbonate substratum. Cross-section traces are reported in Figure 4. Cross-section A–A′ is centred in the Lavorate embayment and it is modified from Valente et al. [20]. Cross-section B–B′ is centred in the Episcopio embayment; cross-section C–C′ is centred in the Sarno urban area.
Borehole data in the Lavorate embayment (cross section A–A′ in Figure 5) indicated that the embayment is filled with ~100 m of deposits. They consist of ~25 m of second-generation alluvial fan deposits passing downward to the 25–30 m thick CI, to the 25–30 m thick pre-CI deposits, and to the 15–30 m thick marine to transitional deposits. The above-described sequence lies on the carbonate substratum that is located at −50 m a.s.l. In the adjacent alluvial plain, the sequences described above are thicker, with thickness exceeding 200 m, and the carbonate substratum is not found up to −250 m a.s.l. These data suggest the presence of a SW-dipping fault, named F1 in Figure 4 and Figure 5, that initially downthrows the carbonate substratum, with a minimum throw of ca. 200 m. Fault F1 was also recognised by the geomorphological analysis (Section 4.1). Considerable change in the thickness of the marine to transitional deposits across fault F1 (Figure 5) indicated syn-kinematic accumulation of this sequence. This is suggestive of an evolutionary motion model in which fault F1 initially downthrows the top of the carbonate substratum with a synchronous, syn-faulting deposition of the marine to transitional deposits. The fault was then sealed by the pre-CI deposits and the CI and was then reactivated in more recent times and displaced them with a much smaller throw (ca. 15 m). Furthermore, in the hanging wall block of fault F1, a 5 m thick peat layer is present in the uppermost portion of the alluvial plain deposits. Both pieces of evidence suggest a recent motion of fault F1. The cross-section continues to the SW up to the SVT. In this area, subsurface data indicated offsets of both the CI, the pre-CI, and the marine to transitional deposits. These data allowed us to hypothesise the presence of another fault, named F2 in Figure 4 and Figure 5, associated with downward increasing throw values from a few metres near the surface to up to ca. 50 m at the top of the marine to transitional deposits. This fault may be also envisaged by the rectilinear scarp that bounds the SVT in this area and by anomalies in the river network (Figure 2).
Cross-section B–B′ in the Episcopio embayment (Figure 5) enhanced a similar subsurface setting as that of the Lavorate embayment. Unfortunately, the poor detail of deep boreholes, which describe the presence of a ~100 m thick sequence of undistinguished gravelly-sandy layers with abundant pyroclastics and tuff units, do not allow the subsurface stratigraphic setting to be detailed. Only the alluvial fan deposits may be envisaged by geomorphological analysis, even if it is not possible to define the thickness of this unit. Furthermore, it is possible to constrain the depth of the carbonate substratum in the Episcopio embayment that is located at ca. 0 m a.s.l. Similar to section A–A′, the SW-ward deepening of the top of the carbonate substratum could be ascribed to the presence of the SW-dipping fault F1.
Cross-section C–C′ (Figure 5) allowed for the subsurface setting of the Sarno urban area to be detailed. Here, borehole data indicated a more complex fault configuration in which the carbonate substratum was downthrown across SW-dipping fault segments that partition the bulk displacement in the footwall of fault F1. In detail, one fault could be identified near the NE end of cross section C–C′, which bifurcates upward in two fault segments. These fault segments are, however, unlinked along the strike, as shown in Figure 4 (see Camanni et al. [70] for similar fault geometries); each of these downthrow the top of the carbonate substratum of ca. 20 to 30 m. Furthermore, in the footwall of fault F1, the marine to transitional deposits are not present, thus testifying that this area was a topographic high during the deposition of this unit. Peat layers and travertine accumulated both in the footwall and in the hanging wall of fault F1. A thin layer of lacustrine deposits also accumulated at the base of the post-CI deposits, in the hanging wall of fault F1. Furthermore, the reconstructed CI top surface is NE-dipping, both in the hanging wall of fault F1 (elevation ranging from 0 m a.s.l. in borehole B24 to −5 m a.s.l. in borehole B27), and between fault F1 and its NE splay (elevation ranging from 8 m a.s.l. in borehole B51 to −1 m a.s.l. in borehole B28). These data testify to fault activity in the last 39 ka. Activity, very recently, of both fault F1 and its NE splay was also indicated by the north-eastward thickening of the alluvial plain deposits and post-CI pyroclastics, which can be interpreted as the effect of syn-tectonic deposition of this unit. Furthermore, very recent activity of the NE splay of fault F1 was also manifested by the offset of 3–5 m thick peat layers placed at the top of the post-CI deposits. This small splay is located in the area where geomorphological analysis allowed for recognition of a NW-SE trending, SW facing, 5 m high rectilinear scarp that cleaves the urban area of Sarno village (Figure 2 and Figure 3B,C). These data suggest that the rectilinear scarp may be interpreted as the surface expression of this fault activity.
4.3. Structural Geology of the Sarno Mountains
The carbonate substratum rocks, cropping out to the east of Sarno village, are well-bedded with bedding planes that are, overall, gently to moderately north-dipping (Figure 6C). The bedding is cross-cut by at least three fault systems displaying different orientations.
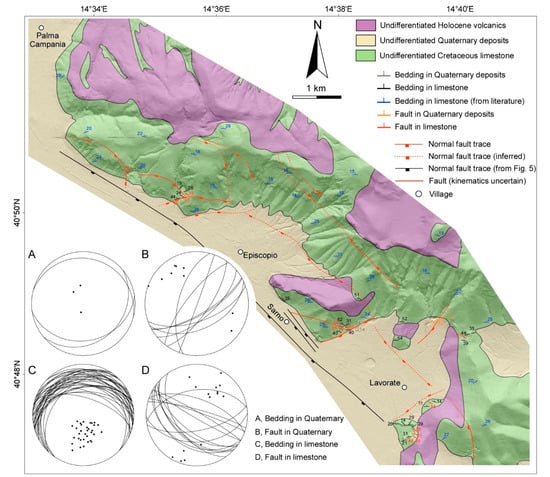
Figure 6.
Geological map of the Sarno Mountains with plots showing the spatial arrangement of bedding and fault data throughout the map area.
The most dominant of these is associated with hundred-metre-long fault segments that are, overall, oriented NW-SE (Figure 6D), roughly parallel to the above-described faults F1 and F2 (see Section 4.2). Although it was not possible to find kinematic indicators associated with this fault system, we interpreted it to be associated with dip-slip extensional kinematics on the basis of literature data from adjacent areas [31,71].
Another fault system that was identified in the field is oriented WNW-ESE and is made up of sub-vertical faults, which, in some cases, steeply dipped toward the NNE (Figure 6D). Field evidence suggested that this fault system could be associated with mostly strike-slip kinematics. The best example of a ca. 1 km long fault segment, belonging to this system, is cropping out immediately east of Sarno village (Figure 6). Finally, a roughly E-W fault system was also recognised (Figure 6D), whose kinematics are unknown. For each of the aforementioned fault systems, an accurate definition of the displacements of individual fault segments was not straightforward, largely due to the lack of markers within the carbonate substratum rocks.
Mapping also allowed us to collect bedding and fault data within the Quaternary deposits that flank the SW side of the Sarno Mountains in at least two locations around the Lavorate embayment (Figure 6). The bedding is overall E-W oriented and mostly shallowly dipping towards the south, as it was mapped within the Quaternary slope deposited on the south facing mountain slope (Figure 6A). However, one bedding data point displayed a northward dip. This is associated with a very recent fault that developed within these Quaternary deposits east of Sarno village and folded the bedding, determining this anomalous bedding dip. This fault belongs to a system comprised of faults oriented mostly NE-SW (Figure 6B), which were interpreted to be the most recent within the mountain front because it deforms Quaternary deposits. Offsets of beds across segments belonging to this fault system indicated primarily extensional displacements, with values spanning from a few centimetres to a few tens of metres.
Finally, cross-cutting map evidence seemed to suggest that NW-SE faults are cut by E-W faults in the NW of Episcopio, and that the recent NE-SW faults in the Quaternary deposits are cutting across the WNW-ESE sub-vertical fault to the east of Sarno village (Figure 6). However, the field data collected for this study did not allow for the inference of any definitive indication of the relative chronology between the recognised fault systems, an aim which was far beyond the scope of this article.
4.4. Hydrogeological Analysis
The groundwater level evolution in the study area during the period of 1992–2003 is depicted in Figure 7. Due to strong groundwater withdrawal from the plain aquifer, the water table suffered a general piezometric lowering. According to [72], the maximum values (up to −5 m) of the lowering of the water table level were observed in the north-western and south-western sectors of the study area and the urban area of Sarno village.
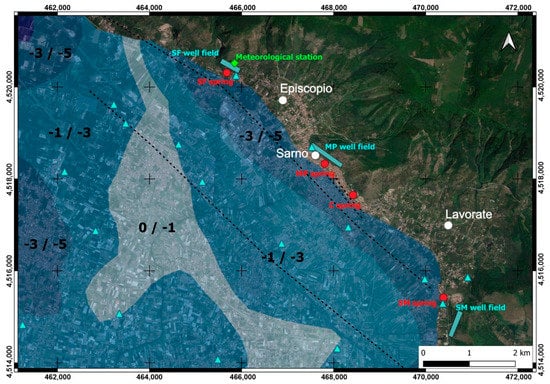
Figure 7.
Piezometric level variation (m) in the period of 1992–2003 for the study area ([38], integrated). Dashed black lines indicate faults mapped in Figure 4.
The groundwater lowering rate varied between 0.45 and 0.09 m/yr. The highest rates, occurring between 1992 and 2003, were concentrated in the central portion of the study area, around the town of Sarno and in the sector between the F1 and F2 faults.
As the study period was characterised by relatively stable amounts of monthly rainfall (Figure 8), the groundwater lowering likely resulted from other causes. The most probable of these could be intense groundwater pumping from the plain aquifer, which is equivalent to about 30 × 106 m3/yr [72], for agricultural, domestic, and industrial purposes.
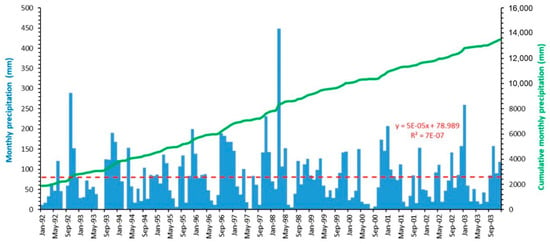
Figure 8.
Monthly rainfall (mm) at Sarno rain gauge station (Figure 1B for location) in the period of 1992–2003. Dotted red line indicates the mean long-term trend.
4.5. Geodetic Data (GNSS and DInSAR) Analysis
The next two sections are devoted to the overview of the main results obtained from the analysis of the geodetic data sets.
4.5.1. GNSS Analysis for the Period 2003–2020
The up component of the GNSS dataset (2003–2020) clearly showed that the PACA permanent station was relatively stable, with little vertical deformation (Figure 9a) and a low rate of subsidence experienced (about 1 mm/yr), which can be at the limit of significance for the accepted accuracies for this methodology. For a more accurate determination of the vertical ground motion, a first order linear trend was estimated from the CGNSS data. The results clearly depicted a periodic trend (Figure 9a), which is a well-known feature of the continuous GNSS time series [73]. Indeed, long-period noise in GNSS position time-series data is ubiquitous and often the most limiting factor preventing proper detection of subtle ground deformation in the geodetic signals. The continental hydrology loading was proven to be the largest contributor to surface deformation at seasonal and even longer timescales [74]. We estimated the elastic ground displacement, due to the hydrological loading over the Sarno plain, using the MERRA2 (modern-era retrospective analysis for research and applications) [75] and GLDAS (global land data assimilation system) [76] hydrological models. Computation of the ground displacement at the selected sites used in this study was made available at the EOST loading service [77]. The output grid of these models has, for MERRA2, a spatial resolution of 0.5° × 0.625° latitude by longitude and an hourly temporal resolution, while GLDAS has a spatial resolution of 0.25° × 0.25° and a three-hour temporal resolution. As the Sarno plain covers an area of 15 × 8 km, a single grid cell of the MERRA2 or GLDAS models covers the entire area.
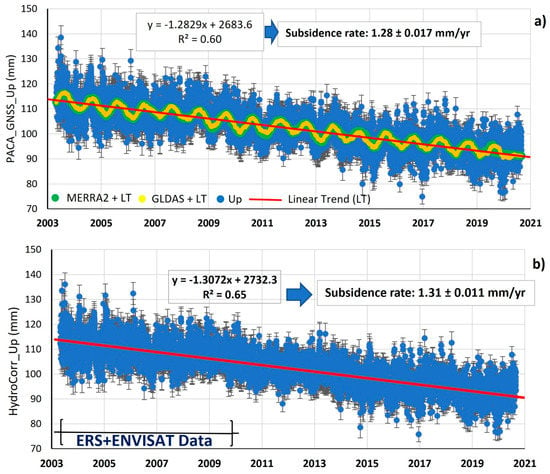
Figure 9.
GNSS daily solutions collected at PACA permanent station located in Palma Campania for the up component. Linear trend, which quantifies the subsidence rate, is plotted (red line). A tentative modelling of the hydrological contribution of the observed ground displacement based on MERRA2 and GLDAS models is plotted as well (a). GNSS daily solutions, after correction of the hydrological contribution and final assessment of the subsidence rate. The black brackets mark the time range for which the DInSAR dataset is available for comparison (b).
The annual phase and the amplitude of 5–7 mm of elastic displacements, provided by both MERRA2 and GLDAS models, match the de-trended geodetic time series of the PACA CGNSS station. The first-order linear fit preliminarily applied to the CGNSS time series indicated a mean geodetic velocity of –1.28 ± 0.03 mm/yr (Figure 9a). After periodic trend removal with the hydrology model, a more reliable mean subsidence rate was obtained (Figure 9b). Regardless, even after the removal of the periodic trend, GNSS data provided evidence of stability or very low subsidence (<1.5 mm/yr) for Palma Campania.
4.5.2. DInSAR Analysis for the Period 1993–2020
The DInSAR data used for this study covered the period of 1993–2020. In particular, the ERS1/2 and ENVISAT datasets (Figure 10A,D) were first analysed in both acquisition geometries (ascending and descending). As can be seen in Figure 10, the coverage of targets in the study area were well distributed, characterised by a density of about 60 targets/km2 for the ERS1/2 dataset and about 250 targets/km2 for the period of 2002–2010 (ENVISAT). In particular, for the periods of both 1993–2000 and 2002–2010, displacement rates in some sectors even higher than 10 mm/yr were recorded. Subsequently, the analysis was extended to the period of 2012–2013 due to the availability of high-resolution data acquired by the Cosmo-SkyMed satellite constellation (Figure 10E). Notably, the density of targets was much higher than previously, with about 2600 targets/km2.
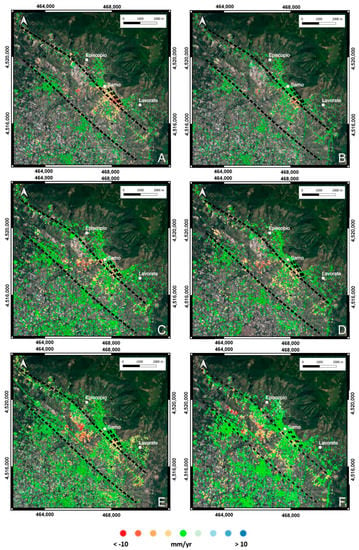
Figure 10.
Mean displacement rate maps for: ERS1/2, (A) ascending and (B) descending; ENVISAT: (C) ascending and (D) descending; (E) Cosmo-SkyMed images in descending orbit; and (F) SENTINEL-1 images in descending orbit (2016–2020 time span). Dashed black lines indicate faults inferred by geomorphological and stratigraphic analysis (see Figure 4).
Regarding displacement rates, again, values in some sectors were found to be greater than 10 mm/yr, particularly near the Sarno village urban area.
Moreover, the observation window for displacement rates was extended to 2020 using an additional 138 SAR images from SENTINEL-1, collected in the period of 2016–2020. Figure 10F shows the mean displacement rate for SENTINEL-1 images.
As with the other periods analyzed, it can be seen that the largest rates of displacement were, once again, concentrated within the faults F1 and F2. Although the SENTINEL-1 images were also in C-band and characterised by medium resolution, it was nevertheless possible to identify a high density of targets, i.e., about 1500 per km2.
4.5.3. Combination of GNSS and DInSAR datasets
To validate the interferometric results, because no GNSS data were available in the Sarno plain, we used the GNSS data collected at the PACA permanent station, which is located a few kilometres from the study area (Figure 11). The comparison between ENVISAT and GNSS time-series data is displayed in Figure 12. It is worth noting that, to obtain the vertical component identified by the interferometric results, the two acquisition geometries (ascending and descending) were decomposed according to procedures presented in the literature [78,79]. As a result, both the DInSAR and GNSS detected a ground displacement rate of the same amplitude (0.4–0.5 mm/yr) even if this was at the limit of detectability.
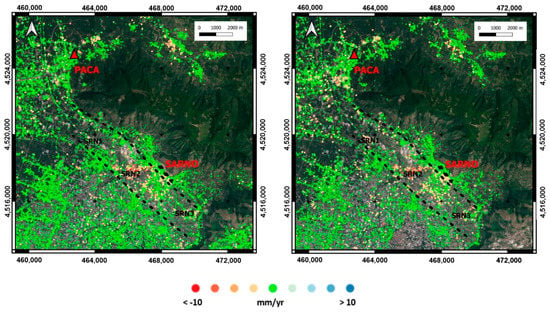
Figure 11.
Mean displacement rate map for ENVISAT images (2003–2010 period): (a) ascending and (b) descending. Red triangle indicates location of GNSS Palma Campania (PACA).
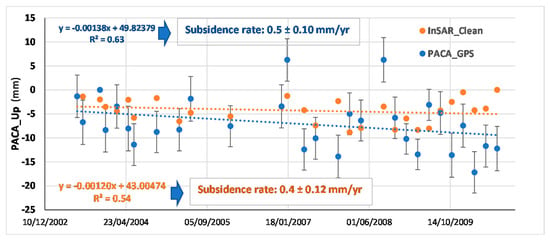
Figure 12.
Comparison of GNSS and DInSAR time series (vertical component) collected in Palma Campania with the aim of validating the DInSAR data.
Figure 13 shows the time series extracted from the DInSAR images for three selected points, which were deemed more suitable to characterise the kinematics of the study area. The DInSAR data were up components, projected according to the suitable satellite ground tracks. From the comparison between the GNSS and DInSAR time series, we derived a confidence limit for the DInSAR data. For the period when both GNSS and DInSAR data are available, namely, 2003–2010 (Figure 9b), the two techniques provided evidence on the stability of the PACA site located on the Apennine foothill, or a low-rate subsidence, whereas a different behaviour was evident from the DInSAR data for the Sarno plain.
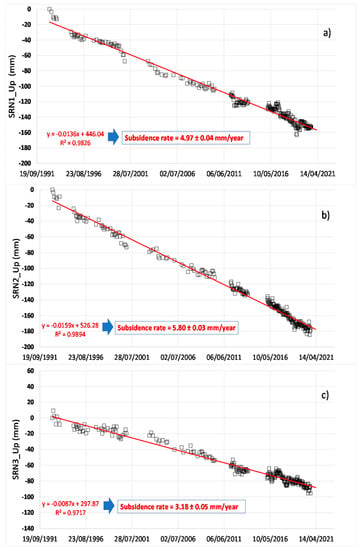
Figure 13.
Time series of the DInSAR data (up component) used to characterise the vertical displacements within the Sarno basin (a–c). Refer to Figure 11 to locate the selected points.
Therefore, after validating the interferometric results in the study area, it was possible to reconstruct the whole time series of displacements, by calculating the vertical components, for the period of 1993–2020 (Figure 13). It is evident that the area was subject to subsidence phenomena, as was well known in the literature [1,21]. Some targets, belonging to specific sectors within the Sarno basin, were selected (SRN1, SRN2, and SRN3 in Figure 11). From the time series, it is possible to observe an almost linear trend (Figure 13). The most relevant displacements were observed in the central-northern sector of the plain (SRN1 and SRN2), where the highest rates of piezometric depressions were recorded during the period of 1992–2003 (Figure 7). The central sector (SRN2) was found to be the most affected by subsidence phenomena, with a cumulative displacement of about -180 mm and a rate of nearly 6 mm/yr (Figure 13b), whereas the area less affected by subsidence, namely the south-eastern sector (SRN3), had subsidence rates of the order of 3 mm/yr (Figure 13c).
5. Discussion
Overall, the data confirmed the presence of a graben-like structure, the Sarno basin, in the inner sector of the Sarno plain, which was first suggested by Valente et al. [20]. This area was the locus of relevant subsidence, both in the long-term (as suggested by the accumulation of around 20 m of lacustrine, travertine, and peat layers in the last 39 ka), and in the short-term (as suggested by geodetic data for the 1992–2020 time span).
The comparison of all the datasets allowed for the distinguishing of the natural (e.g., tectonics) and larger anthropogenic (e.g., groundwater pumping) contributions to subsidence within the Sarno basin.
The tectonic contribution to subsidence was indicated by geomorphological and stratigraphic datasets (Section 4.1 and Section 4.2). Evidence of recent tectonic activity include the rectilinear scarps that ruptured the surface. These occurred both to the NE (e.g., in the surroundings of the Lavorate embayment and in the Sarno village) and to the SW (e.g., along the northern sector of the SVT) of the Sarno basin. Associated with these rectilinear scarps are, at depth, offset CI and post-CI deposits. As the CI is chronologically constrained at 39 ka [80], the fault slip rate during the last 39 ka may be derived. Valente et al. [20] estimated the slip rates for both faults F1 and F2, which were named, in that paper, faults F3 and F4, respectively. Slip rates in the last 39 ka were found to be 0.2 mm/yr for fault F1 and 0.1 mm/yr for fault F2. Notably, the slip rate for the fault F1 was estimated near the Lavorate embayment. In the Sarno urban area, fault F1 caused a ~10 m vertical offset of the top surface of the CI. This would result in an average slip rate of ~0.25 mm/yr during the last 39 ka, slightly larger than that seen in the adjoining Lavorate basin. It must also be considered that the top surface of the CI may have experienced erosion after its deposition, thus the value of the slip rate may be slightly different. Unfortunately, borehole data in the hanging wall block near the Sarno village urban area does not reach the base of the CI. As a consequence, we could not evaluate the offset of the CI base surface, which could have provided a more robust estimation of slip rate.
The slip rate variation along fault F1 was consistent with the often-observed variation in offset values along a normal fault [81], which are maxima in the central portion of the fault (e.g., a slip rate of 0.25 mm/yr in the Sarno urban area) and decrease towards its tips (e.g., a slip rate of 0.1–0.2 mm/yr in the Lavorate embayment). Furthermore, slip rate values around 0.1–0.25 mm/yr are consistent with the slip rate values detected in the inner sector of the Southern Apennines [40,82].
These data in combination suggest recent activity of the fault strands bounding the Sarno basin towards the NE (fault F1 in Figure 4 and Figure 5) and the SW (fault F2 in Figure 4 and Figure 5). Indeed, these faults are small and incapable of generating large earthquakes and breaking the surface in one single seismic event. The rectilinear scarps, however, can be interpreted as resulting from multiple low to moderate energy slip events. Furthermore, the orientation of the F1 and F2 faults is coherent with that of the more pervasive fault system cropping out in the adjacent Sarno Mountains (Section 4.3). Anthropogenic contribution to subsidence was indicated by the geodetic datasets and the hydrogeological data. DInSAR datasets also suggested the occurrence of a cluster of subsidence within the Sarno basin (Section 4.5). Hydrogeological data showed that piezometric variation was spread across the Sarno plain, with variable rates within the Sarno basin (Section 4.4). Furthermore, high values of lowering of the water table levels were observed both within the Sarno basin and outside of it (e.g., the area with values of −3/−5 m in Figure 7). Worthy of note is the fact that subsidence clustered only within the Sarno basin, thus enforcing the idea that subsidence occurred where unconsolidated deposits were present in the subsurface of the Sarno basin.
Furthermore, Figure 14 depicts the groundwater withdrawal rates at SF, MP, and SM well-fields (refer to Figure 7 for locations), located within Sarno Mountains karst aquifer, and monthly rainfall during the 2003–2020 period. The temporal variations of both hydrogeological parameters did not show significant anomalies but, rather, smooth trends. Consequently, we reasoned that the observed vertical ground deformation was not triggered by a decrease in the natural groundwater recharge of the plain aquifer because the precipitation regime did not display any substantial change during the same interval of time.
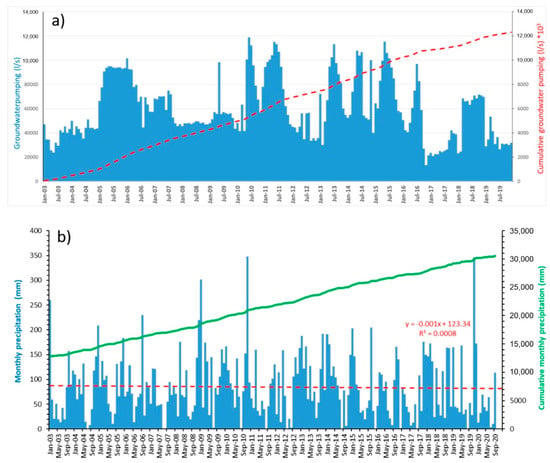
Figure 14.
(a) total monthly groundwater pumping rate (L/s) at SF, MP, SM well fields, located within the Sarno Mountains karst aquifer, and (b) monthly precipitation (mm) for the period of 2003–2020. The dotted red line indicates the mean long-time trend.
This field evidence presents new results that were not reported by or discussed in previous studies [21,49,83]. These findings allow for a better understanding of the anthropogenic cause of the ground deformation mechanisms observed in the plain aquifer.
Indeed, even in the absence of updated monitoring data on the groundwater table and pumping rates from the alluvial aquifer, these results indirectly confirmed that the land subsidence observed in the period of 1993–2020 (Figure 13) was mainly attributable to the widespread and uncontrolled groundwater abstraction, for industrial and irrigation use, within the plain aquifer. In a retrospective analysis, this hydrogeological interpretation is reasonably consistent with a strong link between the trend of ground deformation and groundwater table depletion observed in the period of 1992–2003.
Our results suggested that a positive feedback exists between fault activity and the distribution of subsidence. In fact, fault activity caused the formation of the Sarno basin and the consequent accumulation of unconsolidated deposits. The presence of these deposits amplified the deformation effect induced by groundwater pumping during the past 30 years, thus resulting in the significant subsidence rate detected by geodetic data, which is clustered within the Sarno basin.
6. Conclusions
We carried out a multidisciplinary analysis of the inner sector of the Sarno plain, in the Southern Apennines of Italy, with the aim of characterizing the subsidence experienced in both the short- and long-term in this area of low to moderate seismicity. We approached this problem by combining the geomorphological, stratigraphic, structural, hydrogeological, GNSS and DInSAR datasets. Comparison of all datasets allowed us to discriminate between the natural (i.e., tectonics) and the anthropogenic (i.e., groundwater pumping) contributions to subsidence in the Sarno basin.
We identified a sector of the inner Sarno plain, named the Sarno basin, that experienced enhanced subsidence both in the long- and short-term. Geomorphological, stratigraphic, and structural data suggest that the Sarno basin is bounded by two faults (i.e., faults F1 and F2 in Figure 4 and Figure 5) that show evidence of activity during the last 39 ka, and slip rates ranging from 0.1 to 0.25 mm/yr. We named these faults the Sarno Fault (fault F1) and the San Valentino Torio Fault (fault F2). Both are active faults, with the Sarno Fault also showing evidence of surface rupture, thus allowing for the interpretation that it is an active and capable fault. Notably, neither the Sarno fault nor the San Valentino Torio fault were included in any official national catalogues of active tectonic structures, e.g., the ITHACA [39] and DISS [84] databases.
The geodetic data indicated that the Sarno basin is also currently experiencing subsidence, which has occurred for at least the past 30 years. This subsidence has a rate of 3–5 mm/yr and is localized in the area between the bounding faults of the basin. Hydrogeological data suggested that a significant part of this subsidence can be ascribed to groundwater pumping from the alluvial plain aquifer.
We also determined that the fault activity and observed subsidence rate are related. In fact, fault activity caused the formation of the Sarno basin and the consequent accumulation of unconsolidated deposits, which are currently acting as amplifiers of subsidence that is mainly induced by groundwater exploitation.
Finally, our multidisciplinary approach was proven to be reliable for the study of ground deformation in urbanized areas. In principle, it could be applicable globally. In the inner Sarno plain, further investigation might provide more data about active tectonics. These data might include new boreholes across both the Sarno and the San Valentino Torio faults, chronological analysis on datable stratigraphic layers (e.g., 14C analysis of peat layers) and paleoseismological analysis.
Supplementary Materials
The following are available online at https://www.mdpi.com/article/10.3390/rs13163323/s1, Figure S1: Distribution of earthquakes epicentres and magnitude in the surroundings of the Sarno plain, Figure S2: Stratigraphy of the 71 boreholes used in this study.
Author Contributions
Conceptualization, E.V.; methodology, E.V., V.A., U.R., G.C. and D.D.M.; software, E.V., U.R. and D.D.M.; validation, E.V.; formal analysis, E.V., V.A., U.R., G.C. and D.D.M.; investigation, E.V., V.A., U.R., G.C. and D.D.M.; writing—original draft preparation, E.V., V.A., U.R., G.C. and D.D.M.; writing—review and editing, E.V., V.A., U.R., G.C. and D.D.M.; supervision, E.V. All authors have read and agreed to the published version of the manuscript.
Funding
This research received no external funding.
Acknowledgments
The authors wish to thank the editor and the anonymous reviewers, whose suggestions helped us to improve this manuscript.
Conflicts of Interest
The authors declare no conflict of interest.
References
- Matano, F. Analysis and Classification of Natural and Human-Induced Ground Deformations at Regional Scale (Campania, Italy) Detected by Satellite Synthetic-Aperture Radar Interferometry Archive Datasets. Remote Sens. 2019, 11, 2822. [Google Scholar] [CrossRef] [Green Version]
- Motagh, M.; Djamour, Y.; Walter, T.R.; Wetzel, H.U.; Zschau, J.; Arabi, S. Land subsidence in Mashhad Valley, northeast Iran: Results from InSAR, levelling and GPS. Geophys. J. Int. 2007, 168, 518–526. [Google Scholar] [CrossRef]
- Amelung, F.; Galloway, D.L.; Bell, J.W.; Zebker, H.A.; Laczniak, R.J. Sensing the ups and downs of Las Vegas: InSAR reveal structural control on land subsidence and aquifer-system deformation. Geology 1999, 27, 483–486. [Google Scholar] [CrossRef]
- Amato, V.; Aucelli, P.P.C.; Bellucci Sessa, E.; Cesarano, M.; Incontri, P.; Pappone, G.; Valente, E.; Vilardo, G. Multidisciplinary approach for fault detection: Integration of PS-InSAR, geomorphological, stratigraphic and structural data in the Venafro intermontane basin (Central-Southern Apennines, Italy). Geomorphology 2017, 283, 80–101. [Google Scholar] [CrossRef]
- Coda, S.; Tessitore, S.; Di Martire, D.; Calcaterra, D.; De Vita, P.; Allocca, V. Coupled ground uplift and groundwater rebound in the metropolitan city of Naples (Southern Italy). J. Hydrol. 2019, 569, 470–482. [Google Scholar] [CrossRef]
- Wang, Y.; Zhang, B.; Hou, J.; Xub, X. Structure and tectonic geomorphology of the Qujiang fault at the intersection of the Ailao Shan–Red River fault and the Xianshuihe–Xiaojiang fault system, China. Tectonophysics 2014, 634, 156–170. [Google Scholar] [CrossRef]
- Baize, S.; Audin, L.; Winter, T.; Alvarado, A.; Moreno, L.P.; Taipe, M.; Reyes, P.; Kauffmann, P.; Yepes, H. Paleoseismology and tectonic geomorphology of the Pallatanga fault (Central Ecuador), a major structure of the South-American crust. Geomorphology 2015, 237, 14–28. [Google Scholar] [CrossRef]
- Van der Wal, J.L.N.; Nottebaum, V.C.; Stauch, G.; Binnie, S.A.; Batkhishig, O.; Lehmkuhl, F.; Reicherter, K. Geomorphological Evidence of Active Faulting in Low Seismicity Regions—Examples from the Valley of Gobi Lakes, Southern Mongolia. Front. Earth Sci. 2021, 8, 589814. [Google Scholar] [CrossRef]
- Hreinsdóttir, S.; Bennett, R.A. Active aseismic creep on the Alto Tiberina low-angle normal fault, Italy. Geology 2009, 37, 683–686. [Google Scholar] [CrossRef]
- Nocquet, J.-M.; Villegas-Lanza, J.C.; Chlieh, M.; Mothes, P.A.; Rolandone, F.; Jarrin, P.; Cisneros, D.; Alvarado, A.; Audin, L.; Bondoux, F.; et al. Motion of continental slivers and creeping subduction in the northern Andes. Nat. Geosci. 2014, 7, 287–291. [Google Scholar] [CrossRef]
- Kuebler, S.; Streich, R.; Luck, E.; Hoffmann, M.; Friedrich, A.M.; Strecker, M.R. Active faulting in a populated low-strain setting (Lower Rhine Graben, Central Europe) identified by geomorphic, geophysical and geological analysis. In Seismicity, Fault Rupture and Earthquake Hazards in Slowly Deforming Regions; Special Publications 432; Landgraf, A., Kuebler, S., Hintersberger, E., Stein, S., Eds.; Geological Society: London, UK, 2016. [Google Scholar] [CrossRef]
- Grützner, C.; Fischer, P.; Reicherter, K. Holocene surface ruptures of the Rurrand Fault, Germany—insights from palaeoseismology, remote sensing and shallow geophysics. Geophys. J. Int. 2016, 204, 1662–1677. [Google Scholar] [CrossRef]
- Mohadjer, S.; Ehlers, T.A.; Bendick, R.; Mutz, S.G. Review of GPS and Quaternary fault slip rates in the Himalaya-Tibet orogen. Earth Sci. Rev. 2017, 174, 39–52. [Google Scholar] [CrossRef]
- Papanikolaou, I.D.; Roberts, G.P.; Michetti, A.M. Fault scarps and deformation rates in Lazio–Abruzzo, Central Italy: Comparison between geological fault slip-rate and GPS data. Tectoniphysics 2005, 408, 147–176. [Google Scholar] [CrossRef]
- Mazzoli, S.; Nardò, S.; Ascione, A.; Di Donato, V.; Terranova, C.; Vilardo, G. Fault motion reversals predating the Mw 6.3 2009 L’Aquila earthquake: Insights from synthetic aperture radar data. J. Geol. Soc. Lond. 2021, 178, jgs2020-016. [Google Scholar] [CrossRef]
- Ferranti, L.; Oldow, J.S.; D’Argenio, B.; Catalano, R.; Lewis, D.; Marsella, E.; Avellone, G.; Maschio, L.; Pappone, G.; Pepe, F.; et al. Active deformation in Southern Italy, Sicily and southern Sardinia from GPS velocities of the Peri-Tyrrhenian Geodetic Array (PTGA). Ital. J. Geosci. 2008, 127, 299–316. [Google Scholar]
- Machette, M.N. Active, capable and potentially active faults—A paleoseismic perspective. J. Geodyn. 2000, 29, 387–392. [Google Scholar] [CrossRef]
- Italian Civil Protection Department. Linee Guida per la Gestione del Territorio in Aree Interessate da Faglie Attive e Capaci (FAC). Version 1.0. Available online: http://governancerischio.protezionecivile.gov.it/documents/20182/206005/MS+Linee+Guida+Faglie+Attive+e+Capaci/48b6a905-df3b-4212-a618-651c4771d5c9 (accessed on 1 March 2021).
- Santo, A.; Santangelo, N.; De Falco, M.; Forte, G.; Valente, E. Cover collapse sinkhole over a deep buried carbonate bedrock: The case study of Fossa San Vito (Sarno—Southern Italy). Geomorphology 2019, 345, 106838. [Google Scholar] [CrossRef]
- Valente, E.; Ascione, A.; Santangelo, N.; Santo, A. Late quaternary geomorphological evolution and evidence of post-Campania Ignimbrite (40 ka) fault activity in the inner sector of the Sarno plain (Southern Apennines, Italy). Alp. Mediterr. Quat. 2019, 32, 185–197. [Google Scholar] [CrossRef]
- Cascini, L.; Peduto, D.; Reale, D.; Arena, L.; Ferlisi, S.; Verde, S.; Fornaro, G. Detection and monitoring of facilities exposed to subsidence phenomena via past and current generation SAR sensors. J. Geophys. Eng. 2013, 10, 064001. [Google Scholar] [CrossRef]
- Cinque, A.; Patacca, E.; Scandone, P.; Tozzi, M. Quaternary kinematic evolution of the Southern Apennines. Relationships between surface geological features and deep lithospheric structures. Ann. Geophys. 1993, 36, 249–259. [Google Scholar]
- Cello, G.; Mazzoli, S. Apennine tectonics in southern Italy: A review. J. Geodyn. 1999, 27, 191–211. [Google Scholar] [CrossRef]
- Turco, E.; Macchiavelli, C.; Mazzoli, S.; Schettino, A.; Pierantoni, P.P. Kinematic evolution of Alpine Corsica in the framework of Mediterranean mountain belts. Tectonophysics 2012, 579, 193–206. [Google Scholar] [CrossRef]
- Malinverno, A.; Ryan, W.B. Extension in the Tyrrhenian Sea and shortening in the Apennines as result of arc migration driven by sinking of the lithosphere. Tectonics 1986, 5, 227–245. [Google Scholar] [CrossRef]
- Jolivet, L.; Faccenna, C. Mediterranean extension and the Africa-Eurasia collision. Tectonics 2000, 19, 1095–1106. [Google Scholar] [CrossRef]
- Santangelo, N.; Romano, P.; Ascione, A.; Russo Ermolli, E. Quaternary evolution of the Southern Apennines coastal plains: A review. Geol. Carpath. 2017, 68, 43–56. [Google Scholar] [CrossRef] [Green Version]
- Cella, F.; Fedi, M.; Florio, G.; Grimaldi, M.; Rapolla, A. Shallow structure of the Somma-Vesuvius volcano from 3D inversion of gravity data. J. Volcanol. Geoth. Res. 2007, 161, 303–317. [Google Scholar] [CrossRef]
- Brocchini, D.; Principe, C.; Castradori, D.; Laurenzi, M.A.; Gorla, L. Quaternary evolution of the southern sector of the Campania Plain and early Somma-Vesuvius activity: Insights from the Trecase 1 well. Mineral. Petrol. 2001, 73, 67–91. [Google Scholar] [CrossRef]
- Ascione, A.; Ciotoli, G.; Bigi, S.; Buscher, J.; Mazzoli, L.; Ruggiero, L.; Sciarra, A.; Tartarello, M.C.; Valente, E. Assessing mantle versus crustal sources for non-volcanic degassing along fault zones in the actively extending southern Apennines mountain belt (Italy). Geol. Soc. Am. Bull. 2018, 130, 1697–1722. [Google Scholar] [CrossRef]
- Milia, A.; Torrente, M. Tectono-stratigraphic signature of a rapid multistage subsiding rift basin in the Tyrrhenian-Apennine hinge zone (Italy): A possible interaction of upper plate with subducting slab. J. Geodyn. 2015, 86, 42–60. [Google Scholar] [CrossRef]
- Bernasconi, A.; Bruni, P.; Gorla, L.; Principe, C.; Sbrana, A. Preliminary results of deep geothermal exploration in the Somma-Vesuvius volcanic area. Rendiconti Online Della Società Geologica Italiana 1981, 4, 237–240. [Google Scholar]
- Aprile, F.; Toccaceli, R.M. New knowledge about stratigraphy and the distribution of Quaternary ignimbrite deposits in the subsurface of the Sarno Plain (Salerno-Campania, Southern Italy). Il Quaternario 2002, 15, 169–174. [Google Scholar]
- Valente, E.; Buscher, J.T.; Jourdan, F.; Petrosino, P.; Reddy, S.M.; Tavani, S.; Corradetti, A.; Ascione, A. Constraining mountain front tectonic activity in extensional setting from geomorphology and Quaternary stratigraphy: A case study from the Matese ridge, southern Apennines. Quat. Sci. Rev. 2019, 219, 47–67. [Google Scholar] [CrossRef]
- Map of Active and Capable Faults in Italy. Available online: http://sgi2.isprambiente.it/ithacaweb/viewer/ (accessed on 10 March 2021).
- Cinque, A.; Ascione, A.; Caiazzo, C. Distribuzione spazio-temporale e caratterizzazione della fagliazione quaternaria in Appennino meridionale. In Le ricerche del GNDT nel campo della pericolosità sismica; Galadini, F., Ed.; CNR-GNDT: Rome, Italy, 2000; pp. 203–218. [Google Scholar]
- Rovida, A.; Locati, M.; Camassi, R.; Lolli, B.; Gasperini, P. The Italian earthquake catalogue CPTI15. Bull. Earthq. Eng. 2020, 18, 2953–2984. [Google Scholar] [CrossRef]
- Fabbrocino, S.; Lanari, R.; Celico, P.; Termolini, G.; Zeni, G. Groundwater pumping and land subsidence in the Sarno River plain. Memorie Descrittive della Carta Geologica d’Italia 2007, 76, 163–174. [Google Scholar]
- Ducci, D.; De Simone, S.; Sellerino, M. Modello litostratigrafico 3D propedeutico allo sviluppo di un modello di flusso sotterraneo: Caso di studio, la piana del Sarno (Italia). Ital. J. Eng. Geol. Environ. 2012, 1, 41–58. [Google Scholar] [CrossRef]
- De Vita, P.; Allocca, V.; Celico, F.; Fabbrocino, S.; Mattia, C.; Monacelli, G.; Musilli, I.; Piscopo, V.; Scalise, A.R.; Summa, G.; et al. Hydrogeology of continental southern Italy. J. Maps 2018, 14, 230–241. [Google Scholar] [CrossRef] [Green Version]
- Lidar Data of the Metropolitan Area of Naples. Available online: http://sit.cittametropolitana.na.it/lidar.html (accessed on 10 January 2021).
- Webgis of the ISPRA with Borehole in the Italian Territory. Available online: http://sgi2.isprambiente.it/mapviewer/ (accessed on 10 January 2021).
- Civita, M.; de Riso, R.; Vallario, A.; de Masi, R. Idrogeologia del massiccio del Taburno-Camposauro (Campania). Mem. Soc. Geol. Ital. 1971, 10, 65–120. [Google Scholar]
- Guarino, P.M.; Nisio, S. I sinkholes del settore nord-orientale della piana del F. Sarno: Ulteriori dati relativi all’assetto litostratigrafico del sottosuolo. In Atti 2° Workshop Internazionale “I Sinkholes: Gli Sprofondamenti Catastrofici nell’Ambiente Naturale ed in Quello Antropizzato”; ISPRA Servizio Geologico d’Italia: Rome, Italy, 2009; pp. 541–551. [Google Scholar]
- Nicotera, P.; Civita, M. Indagini idrogeologiche per la captazione delle sorgenti S. Maria di Lavorate (Sarno). Mem. E Note Dell’istituto Di Geol. Appl. Dell’università Di Napoli 1969, 11, 1–50. [Google Scholar]
- Sheet 448—Ercolano of the Geological Map of Italy at Scale 1:50,000. Available online: https://www.isprambiente.gov.it/Media/carg/448_ERCOLANO/Foglio.html (accessed on 20 January 2021).
- Celico, P. Idrogeologia dei massicci carbonatici, delle piane quaternarie e delle aree vulcaniche dell’Italia cen-tro-meridionale (Marche e Lazio meridionale, Abruzzo, Molise e Campania). Cassa del Mezzogiorno 1983, 4, 1–203. [Google Scholar]
- Celico, F.; Piscopo, V. Idrodinamica sotterranea e vulnerabilità all’inquinamento delle piane del Sarno e del Solofrana (Campania). Quad. Geol. Appl. 1995, 2, 407–414. [Google Scholar]
- Corniello, A.; Trifuoggi, M.; Ruggier, G.; Sellerino, M. The Sarno River plain (Campania): Piezometric and hydrochemical observations. Rend. Online Soc. Geol. Ital. 2013, 24, 61–63. [Google Scholar]
- Italian Civil Protection. Available online: www.protezionecivile.gov.it (accessed on 20 January 2021).
- Field, E.H.; Arrowsmith, R.J.; Biasi, G.P.; Bird, P.; Dawson, T.E.; Felzer, K.R.; Jackson, D.D.; Johnson, K.M.; Jordan, T.H.; Madden, C.; et al. Uniform California earthquake rupture forecast, version 3 (UCERF3)—The time- independent model. Bull. Seism. Soc. Am. 2014, 104, 1122–1180. [Google Scholar] [CrossRef]
- Dzurisin, D. Volcano Deformation Geodetic Monitoring Techniques, 1st ed.; Springer: Chichester, UK, 2007; pp. 111–151. [Google Scholar]
- Di Paola, G.; Alberico, I.; Aucelli, P.P.C.; Matano, F.; Rizzo, A.; Vilardo, G. Coastal subsidence detected by Synthetic Aperture Radar interferometry and its effects coupled with future sea-level rise: The case of the Sele Plain (Southern Italy). J. Flood Risk Manag. 2018, 11, 191–206. [Google Scholar] [CrossRef] [Green Version]
- Riccardi, U.; Arnoso, J.; Benavent, M.; Velez, E.; Montesinos, F.G. Exploring deformation scenarios in Timanfaya volcanic area (Lanzarote, Canary Islands) from GNSS and ground based geodetic observations. J. Volcanol. Geotherm. Res. 2018, 357, 14–24. [Google Scholar] [CrossRef]
- Pappalardo, G.; Mineo, S.; Angrisani, A.C.; Di Martire, D.; Calcaterra, D. Combining field data with infrared thermography and DInSAR surveys to evaluate the activity of landslides: The case study of Randazzo Landslide (NE Sicily). Landslides 2018, 15, 2173–2193. [Google Scholar] [CrossRef]
- Tessitore, S.; Fernández-Merodo, J.A.; Herrera, G.; Tomás, R.; Ramondini, M.; Sanabria, M.; Duro, J.; Mulas, J.; Calcaterra, D. Comparison of water-level, extensometric, DInSAR and simulation data for quantification of subsidence in Murcia City (SE Spain). Hydrogeol. J. 2016, 24, 727–747. [Google Scholar] [CrossRef]
- Amato, V.; Aucelli, P.P.C.; Corrado, G.; Di Paola, G.; Matano, F.; Pappone, G.; Schiattarella, M. Comparing geological and Persistent Scatterer Interferometry data of the Sele River coastal plain, southern Italy: Implications for recent subsidence trends. Geomorphology 2020, 351, 106953. [Google Scholar] [CrossRef]
- Vitagliano, E.; Riccardi, U.; Piegari, E.; Boy, J.-P.; Di Maio, R. Multi-Component and Multi-Source Approach for Studying Land Subsidence in Deltas. Remote Sens. 2020, 12, 1465. [Google Scholar] [CrossRef]
- Bock, Y.; Melgar, D. Physical applications of GPS geodesy: A review. Rep. Progr. Phys. 2016, 79, 106801. [Google Scholar] [CrossRef]
- Gens, R.; Van Genderen, J.L. Review article SAR interferometry—Issues, techniques, applications. Int. J. Remote Sens. 1996, 17, 1803–1835. [Google Scholar] [CrossRef]
- Blewitt, G.; Hammond, W.C.; Kreemer, C. Harnessing the GPS Data Explosion for Interdisciplinary Science. Eos 2018, 99, 485. [Google Scholar] [CrossRef]
- Luzum, B.; Petit, G. The IERS Conventions (2010): Reference systems and new models. Proc. Int. Astron. Union 2012, 10, 227–228. [Google Scholar] [CrossRef] [Green Version]
- Lyard, F.; Lefevre, F.; Letellier, T.; Francis, O. Modelling the global ocean tides: Modern insights from FES2004. Ocean. Dyn. 2006, 56, 394–415. [Google Scholar] [CrossRef]
- Altamimi, Z.; Rebischung, P.; Métivier, L.; Collilieux, X. ITRF2014: A new release of the International Terrestrial Reference Frame modeling nonlinear station motions. J. Geophys. Res. Solid Earth 2016, 121, 6109–6613. [Google Scholar] [CrossRef] [Green Version]
- Costantini, M.; Ferretti, A.; Minati, F.; Falco, S.; Trillo, F.; Colombo, D.; Novali, F.; Malvarosa, F.; Mammone, F.; Vecchioli, F.; et al. Analysis of surface deformations over the whole Italian territory by interferometric processing of ERS, Envisat and COSMO-SkyMed radar data. Remote Sens. Environ. 2017, 202, 250–275. [Google Scholar] [CrossRef]
- Di Martire, D.; Paci, M.; Confuorto, P.; Costabile, S.; Guastaferro, F.; Verta, A.; Calcaterra, D. A nation-wide system for landslide mapping and risk management in Italy: The second Not-ordinary Plan of Environmental Remote Sensing. Int. J. Appl. Earth Obs. 2017, 63, 143–157. [Google Scholar] [CrossRef]
- Mora, O.; Mallorqui, J.J.; Broquetas, A. Linear and nonlinear terrain deformation maps from a reduced set of interferometric SAR images. IEEE Trans. Geosci. Remote Sens. 2003, 41, 2243–2253. [Google Scholar] [CrossRef]
- Iglesias, R.; Mallorqui, J.J.; Monells, D.; López-Martínez, C.; Fabregas, X.; Aguasca, A.; Gili, J.A.; Corominas, J. PSI deformation map retrieval by means of temporal sublook coherence on reduced sets of SAR images. Remote Sens. 2015, 7, 530–563. [Google Scholar] [CrossRef] [Green Version]
- Tosi, L.; Da Lio, C.; Strozzi, T.; Teatini, P. Combining L- and X-Band SAR interferometry to assess ground displacements in heterogeneous coastal environments: The Po River Delta and Venice Lagoon, Italy. Remote Sens. 2016, 8, 308. [Google Scholar] [CrossRef] [Green Version]
- Camanni, G.; Roche, V.; Childs, C.; Manzocchi, T.; Walsh, J.; Conneally, J.; Saqab, M.M.; Delogkos, E. The three-dimensional geometry of relay zones within segmented normal faults. J. Struct. Geol. 2019, 129, 103895. [Google Scholar] [CrossRef]
- Caiazzo, C.; Ascione, A.; Cinque, C. Late Tertiary–Quaternary tectonics of the Southern Apennines (Italy): New evidences from the Tyrrhenian slope. Tectonophysics 2006, 421, 23–51. [Google Scholar] [CrossRef]
- Cascini, L.; Di Maio, C. Emungimento delle acque sotterranee e cedimenti nell’abitato di Sarno: Analisi preliminare. Rivista Italiana di Geotecnica 1994, 3, 217–231. [Google Scholar]
- Williams, S.D.P. The effect of coloured noise on the uncertainties of rates estimated from geodetic time series. J. Geod. 2003, 76, 483–494. [Google Scholar] [CrossRef]
- Mémin, A.; Boy, J.-P.; Santamaria-Gomez, A. Correcting GPS measurements for non-tidal loading. GPS Solut. 2020, 24, 45. [Google Scholar] [CrossRef]
- Gelaro, R.; McCarty, W.; Suárez, M.J.; Todling, R.; Molod, A.; Takacs, L.; Randles, C.A.; Darmenov, A.; Bosilovich, M.G.; Reichle, R.; et al. The Modern-Era Retrospective Analysis for Research and Applications, Version 2 (MERRA-2). J. Clim. 2017, 30, 5419–5454. [Google Scholar] [CrossRef] [PubMed]
- Rodell, M.; Houser, P.R.; Jambor, U.; Gottschalck, J.; Mitchell, K.; Meng, C.J.; Arsenault, K.; Cosgrove, B.; Radakovich, J.; Bosilovich, M.; et al. The Global Land Data Assimilation System. Bull. Am. Meteorolog. Soc. 2004, 85, 381–394. [Google Scholar] [CrossRef] [Green Version]
- EOST Loading Service. Available online: http://loading.u-strasbg.fr/ (accessed on 30 September 2020).
- Cascini, L.; Fornaro, G.; Peduto, D. Advanced low-and full-resolution DInSAR map generation for slow-moving landslide analysis at different scales. Eng. Geol. 2010, 112, 29–42. [Google Scholar] [CrossRef]
- Di Martire, D.; Novellino, A.; Tessitore, S.; Ramondini, M.; Calcaterra, D. Application of DInSAR techniques to engineering geology studies in southern Italy. Rend. Online Soc. Geol. Ital. 2013, 24, 95–97. [Google Scholar]
- Giaccio, B.; Hajdas, I.; Isaia, R.; Deino, A.; Nomade, S. High-precision 14C and 40Ar/39Ar dating of the Campanian Ignimbrite (Y-5) reconciles the time-scales of climatic-cultural processes at 40 ka. Sci. Rep. 2017, 7, 45940. [Google Scholar] [CrossRef] [PubMed] [Green Version]
- Delokgos, E.; Manzocchi, T.; Childs, C.; Camanni, G.; Roche, V. The 3D structure of a normal fault from multiple outcrop observations. J. Struct. Geol. 2020, 136, 104009. [Google Scholar] [CrossRef]
- Ferranti, L.; Palano, M.; Cannavò, F.; Mazzella, M.E.; Oldow, J.; Gueguen, E.; Mattia, M.; Monaco, C. Rates of geodetic deformation across active faults in southern Italy. Tectonophysics 2014, 621, 101–122. [Google Scholar] [CrossRef]
- Cascini, L.; Ferlisi, S.; Fornaro, G.; Lanari, R.; Peduto, D.; Zeni, G. Subsidence monitoring in Sarno urban area via multitemporal DInSAR technique. Int. J. Remote Sens. 2006, 27, 1709–1716. [Google Scholar] [CrossRef]
- Database of Individual Seismogenic Sources. Available online: http://diss.rm.ingv.it/dissmap/dissmap.phtml (accessed on 10 March 2021).
Publisher’s Note: MDPI stays neutral with regard to jurisdictional claims in published maps and institutional affiliations. |
© 2021 by the authors. Licensee MDPI, Basel, Switzerland. This article is an open access article distributed under the terms and conditions of the Creative Commons Attribution (CC BY) license (https://creativecommons.org/licenses/by/4.0/).