Article

Habitat Suitability Modeling for the Feeding Ground of Immature Albacore in the Southern Indian Ocean Using Satellite-Derived Sea Surface Temperature and Chlorophyll Data

1
Department of Environmental Biology Fisheries Science, National Taiwan Ocean University, 2 Pei-Ning Rd., Keelung 20224, Taiwan
2
Center of Excellence for Ocean Engineering, National Taiwan Ocean University, Keelung 20224, Taiwan
3
Department of Ecology & Aquatic Stocks Management, Artemia & Aquaculture Research Institute, Urmia University, Urmia 57179-44514, Iran
4
Coastal Resilience and Climate Change Adaptation Research Group, Department of Fisheries and Marine Science, University of Brawijaya, Malang 65145, Indonesia
*
Author to whom correspondence should be addressed.
Remote Sens. 2021, 13(14), 2669; https://doi.org/10.3390/rs13142669
Submission received: 15 June 2021 / Revised: 3 July 2021 / Accepted: 3 July 2021 / Published: 7 July 2021
(This article belongs to the Special Issue Optical Oceanographic Observation)

Abstract

:
In the current study, remotely sensed sea surface ocean temperature (SST) and sea surface chlorophyll (SSC), an indicator of tuna abundance, were used to determine the optimal feeding habitat zone of the southern Indian Ocean (SIO) albacore using a habitat suitability model applied to the 2000–2016 Taiwanese longline fishery data. The analysis showed a stronger correlation between the 2-month lag SSC and standardized catch per unit effort (CPUE) than 0-, 1-, 3-, and 4-month lag SSC. SST also exhibited a stronger correlation with standardized CPUE. Therefore, SST and SSC_2 were selected as final variables for model construction. An arithmetic mean model with SST and SSC_2 was deemed suitable to predict the albacore feeding habitat zone in the SIO. The preferred ranges of SSC_2 and SST for the feeding habitat of immature albacore were 0.07–0.09 mg m−3 and 16.5–18.5 °C, respectively, and mainly centralized at 17.5 °C SST and 0.08 mg m−3 SSC_2. The selected habitat suitability index model displayed a high correlation (R2 = 0.8276) with standardized CPUE. Overall, temperature and ocean chlorophyll were found to be essential for albacore habitat formation in the SIO, consistent with previous studies. The results of this study can contribute to ecosystem-based fisheries management in the SIO by providing insights into the habitat preference of immature albacore tuna in the SIO.

Graphical Abstract

1. Introduction

Multisatellite remote sensing has been used to obtain data on sea surface temperature (SST), sea surface chlorophyll (SSC) [1,2,3], phytoplankton concentrations, and other variables since 1978. These data have been highly useful for oceanography and fisheries management [4,5,6]. Because of its largescale data collection, remote sensing provides valuable support in fisheries exploitation and management [7,8,9,10]. For example, it has expanded understanding of the factors influencing the habitats of tuna and similar species [4,11,12,13,14,15]. Moreover, remote sensing data can help scientists develop sustainable strategies for fisheries management, modelers produce forecasts, and fishermen save fuel when detecting the fishing ground [16]. Tuna regional fisheries management organizations have provided new insights into ecosystem-based fisheries management (EBFM) using remote sensing tools [17]. These tools are frequently used in structuring the habitat models of tuna and similar species [13,14,15,18,19,20,21] and standardization [22,23] of catch per unit effort (CPUE) to remove biases due to various factors. SST is one of the finest oceanic parameters used to relate the tuna distribution with the ocean environment [1]. Phytoplankton biomass is the indicator of tuna distribution for the resource assessment of fisheries as phytoplankton is the primary food source in the ocean [8,24]. It was also observed in a previous study that the phytoplankton patches need a delay of at least 5–7 days to become mature in the feeding ground, and it was suggested to include 1-month lag chlorophyll data as a potential indicator [24]. Thus, environmental data obtained from remote sensing tools can potentially structure habitat preferences and be used for catchability assessment of target species in an effort to achieve EBFM.
Abundance indices with fishery data are used for assessing the temporospatial stock to highlight the population variation [25,26], including that of different fish species [27,28,29]. Furthermore, this method has been applied in ecology recovery studies, species monitoring, and environmental impact assessment [30]. Various types of habitat models, such as the generalized additive model (GAM), generalized linear model (GLM), and habitat suitability index (HSI) model, are in use widely to determine the potential habitat zone of marine organisms. Habitat modeling is a crucial part of EBFM [17]. Remotely sensed data have been used to design the habitat model of albacore tuna (Thunnus alalunga) in the South Atlantic Ocean [31] and North Pacific Ocean [32] and in many other studies [33,34,35]. Habitat models with optimal environmental factors have also been described for the Northwest Pacific neon flying squid (Ommastrephes bartramii) [36,37]. Lan et al. [4] applied GAMs to determine the CPUE variation in relation to environmental data in the Atlantic Ocean, and Zainuddin et al. [9] used combined GAM–GLM to determine potential fishing zones using multisatellite environmental and integrated CPUE data. Thus, habitat models can help to implement or modify EBFM through the monitoring of fish habitat, prey abundance, and climate effects [38] as well.
Albacore tuna is an essential commercial species. Many studies conducted in the Indian Ocean have focused on this species [4,39,40]. The albacore fishery first started in the 1950s by Japanese longlines. The longline fishery is responsible for more than 80% of the Indian Ocean albacore catch. Albacore has high migration behavior and is broadly distributed in the important oceans (Indian, Atlantic, and Pacific) from 50°N to 40°S, except up to 25°N in the Indian Ocean [41]. Indian Ocean albacore stock has mainly been exploited by Korea, Japan, and Taiwan in the past decades. Stock discrimination, production modeling, and age determination have been widely studied [42,43,44,45,46]. However, research on habitat distribution and oceanography in the Indian Ocean has been scattered relative to its prolonged exploitation record. Studies have emphasized that SST [47,48] and chlorophyll concentration are crucial for albacore distribution [8,39]. The current study focused on the feeding habitat of immature albacore. The weight and nominal CPUE distribution of albacore tuna in the southern Indian Ocean (SIO) from 2000 to 2016 are shown in Figure 1. The main data were categorized into mature and immature albacore following a previous study [39]. It is very crucial to develop habitat models using satellite data for promoting EBFM [19]. Accordingly, the present study developed a suitable habitat model to detect the feeding habitat preference and preferred environment range of albacore tuna by using remote sensing data and Taiwanese longline fishing data in the SIO.

2. Materials and Methods

2.1. Albacore Tuna Fishing Data

Albacore tuna fishing data for the SIO were collected from the longline fishing logbook of Taiwan supplied by the Overseas Fisheries Development Council of Taiwan. The 2000–2016 data with the major fishing season (April to September) [4] with a spatial grid of 1° × 1° were used for the analyses. The fishery data consisted of number of hooks employed, number of catches, albacore weight, year, month, latitude, and longitude. Data were introduced into the models after calculation. The nominal CPUE of longlines was employed as the stock abundance indicator in the fishing zones [9,10,26]. Monthly nominal CPUE was calculated as the number of individuals per 103 hooks (No. of individuals/103 hooks).
CPUEijk = ΣCijkEijk
where CPUEijk is the nominal CPUE; ΣCijk and ΣEijk are the total catches and hooks employed (103 hooks) in the 1° × 1° spatial grid, respectively; and i, j, and k indicate the month, longitude, and latitude, respectively.

2.2. Standardization of Nominal Catch per Unit Effort Data

Unintentional overestimation of abundance may be caused by the effect of covariates such as year, month, latitude, and longitude [10,27]. Therefore, a GLM was applied for the standardization of the nominal CPUE data to overcome bias in catch data as follows:
Log (CPUE + c) = µ + year + month + latitude + longitude +
where CPUE indicates the nominal catch per unit effort, c is a constant value of 0.1 of the overall nominal catch mean used in standardization [10,22], µ indicates the intercept, and is a variable with normal distribution and zero mean. The standardized CPUE value was used to remove the bias due to the influence of covariates.

2.3. Moderate Resolution Imaging Spectroradiometer (MODIS)-Derived Remotely Sensed Data

Initially, two remote sensing environmental parameters—SST and SSC from 2000 to 2016—were derived. SST is a key factor in albacore tuna habitat selection and has a direct relation with the albacore distribution [9,10]. SSC is an indicator of phytoplankton. The aquatic food web is established by phytoplankton, which are primary producers and fed upon by organisms ranging from microscopic zooplankton to multitoned whales. Invertebrates and small fishes also feed on phytoplankton and are fed upon by bigger fishes. Moreover, zooplankton and buoyant organisms also pile up near the SSC front to feed on the phytoplankton [49,50]. Higher-trophic-level predators such as albacore tuna are attracted by the biomass of these secondary producers [51], which indicates an indirect relation between SSC and albacore. Therefore, the present study used these two remotely sensed variables. There is no direct relation between SSC and albacore, as albacore feeds on secondary producers such as fish (Alepisauridae, Carangidae, Gempylidae, and Triacanthidae) [52,53,54] but also on crustaceans [51]. A previous study showed that a minimum time delay of 5–7 days is required for a phytoplankton patch to mature into a foraging ground, and it was suggested to include 1-month lag chlorophyll data as a potential indicator [24]. Moreover, it may take some time to reach the predating zone by searching, which means a higher concentration of SSC may not mean higher albacore biomass in a particular time. Thus, the authors tried to use the lag data of SSC also to see if there was any significant indication for using SSC lag data. A total of six variables were used for the initial analysis (Table 1). All these data on monthly composite fields were obtained from the Environmental Research Division Data Access Program (ERDDAP) database of the National Oceanic and Atmospheric Administration on a spatial grid of 1° × 1° (https://coastwatch.pfeg.noaa.gov/erddap/index.html, accessed on 2 April 2021) for consistency with the spatial resolution of fishery data.

2.4. Environmental Factor Selection for Model Building

Correlation analysis was executed to select the variables for fitting in the model. Variables were selected if the correlation coefficient (r) values were nearer to +1 or −1. One SSC variable from SSC_0 to SSC_4 and SST (Table 1) were selected for fitting into the model. Initially, Pearson analysis was also performed between the environments to assess the correlation between current and lag environments. If the correlation was significant, then another Pearson analysis was conducted between the standardized CPUE and environmental variables. Thereafter, the parameters were selected according to their r values for the construction of the final model.

2.5. Suitability Index of Environmental Variables and Standardized CPUE

On the basis of the central tendency of habitat factors [31,32], the suitability index (SI) for Indian Ocean albacore was computed to clarify the relationship between environmental variables and standardized CPUE by fitting them in specific latitudes, longitudes, and months through smoothing spline regression [27,28,29,31,32]. Environmental variables were used as independent variables, and standardized CPUE was used as the dependent variable. Normalization of standardized CPUE and selected environmental variables was performed using the 0 to 1 scale as follows [27,28,29,31,32]:
SI = Ŷ ijk Ŷ i j k m i n Ŷ i j k m a x Ŷ i j k m i n
where Ŷ indicates the predicted catch per unit effort or environmental parameters; Ŷ min and Ŷ max are the minimum and maximum observations of environmental variables or predicted CPUE, respectively; and i, j, and k indicate the month, longitude, and latitude, respectively.
The SI values (ranging from 0 to 1) were computed by using the summed frequency distribution of the standardized catch per unit effort for each class. Subsequently, the calculated SI values of environmental variables and midpoints of each class interval were used to fit the SI models. Finally, the association between the selected environmental parameters and SI was computed using the following formula [55,56,57]:
si m = e α m + β 2
where m is the response variable, and α and β are determined by using the least-squares estimate which minimizes the residual between the observed and estimated SI.

2.6. Development of the HSI Model

Two very common empirical HSI models—the arithmetic mean model (AMM) [31,32,58] and the geometric mean model (GMM) [31,32,59]—were employed to evaluate habitat preferences [7,31,32]. The SI values of each environmental factor were introduced into these two models [7,28,29]. HSI was assumed to have a univariate value range between 0 and 1 [60,61]. The AMM and GMM empirical HSI models were calculated as follows:
H S I A M M = 1 / m n = 1 m S I n
H S I G M M = ( n = 1 m S I n ) ^ 1 / m
where SIn is the SI for the nth environmental factor, and m is the number of environmental factors inserted into the model. The selected SSC variable and SST were applied individually and together as habitat data in each empirical habitat model. SI values > 0.6, obtained through various integrations of habitat factors, were then incorporated into the HSI model [31,32].

2.7. Model Selection and Validation

The performance of the HSI models was evaluated, and the model with the lowest Akaike information criterion (AIC; [60]) value was used for testing and validation. The performance of the selected HSI model was evaluated on the basis of the summed monthly standardized CPUE values from 2000 to 2016, which were tested according to the analyzed HSI value intervals [56,57]. Subsequently, the linear correlation between the selected HSI model and CPUE was determined to evaluate whether the HSI model can predict the potential habitats. Finally, the spatial distribution of HSI values was determined using the selected HSI model and mapped using ArcGIS (version 10.2) software to predict potential feeding habitats; these data were then compared to standardized CPUE data.

3. Results

3.1. Spatiotemporal Variation of Standardized CPUE in the SIO

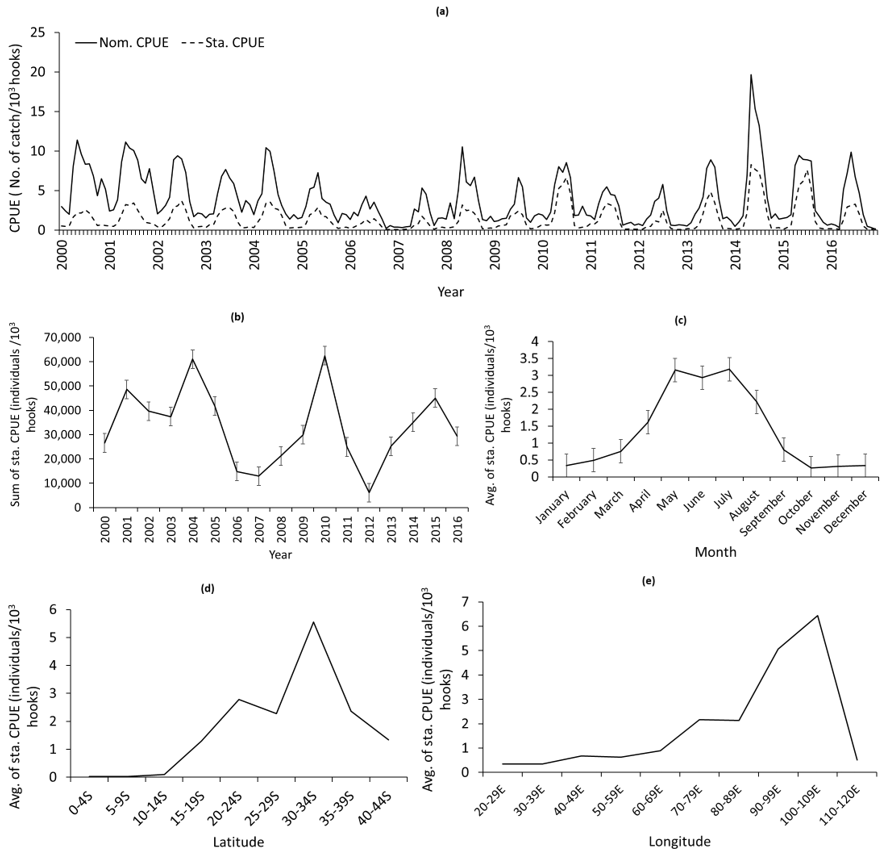
To remove the bias due to different factors, the nominal albacore CPUE data were standardized using the GLM (Figure 2a). The Pearson correlation coefficient values of nominal and standardized CPUE for the entire time series and monthly mean were 0.589 and 0.861, respectively.
The sum of standardized CPUE was highest in 2010 (approximately 70,000) and the lowest in 2012 (approximately 8212; Figure 2b). The major fishing period in the SIO is from April to September; thus, the data of these 6 months were used for the forthcoming analysis. The average standardized CPUE was the highest in May and July (>3 individuals/103 hooks; Figure 2c). Standardized CPUE displayed an increasing trend southward from 15 to 35°S and then decreased thereafter. The highest standardized CPUE was observed at 31–35°S (near 6 individuals/103 hooks). The standardized CPUE was <1 individuals/103 hooks northward from 15°S (Figure 2d). The longitudinally standardized CPUE exhibited an increasing trend eastward, and the highest standardized CPUE was between 90 and 99°E (>6 individuals/103 hooks; Figure 2e).

3.2. Variable Selection for Fitting into the Final Model

Correlation analysis was performed to select the most suitable SSC variable (SSC_0 to SSC_4). Analysis between the same environments and their lag data revealed higher correlations, resulting in a collinear effect on standardized CPUE (Table 2). Correlation analysis was also performed between the environmental variables and standardized CPUE. SST had the highest correlation (r = 0.681) with standardized CPUE, whereas among the SSCs, SSC_2 had the highest correlation (r = 0.224; Table 2). Therefore, SI curves were constructed for SST and SSC_2, and their data were introduced into the model for the final analysis.

3.3. Variation in Selected Remote Sensing Environmental Variables in the SIO

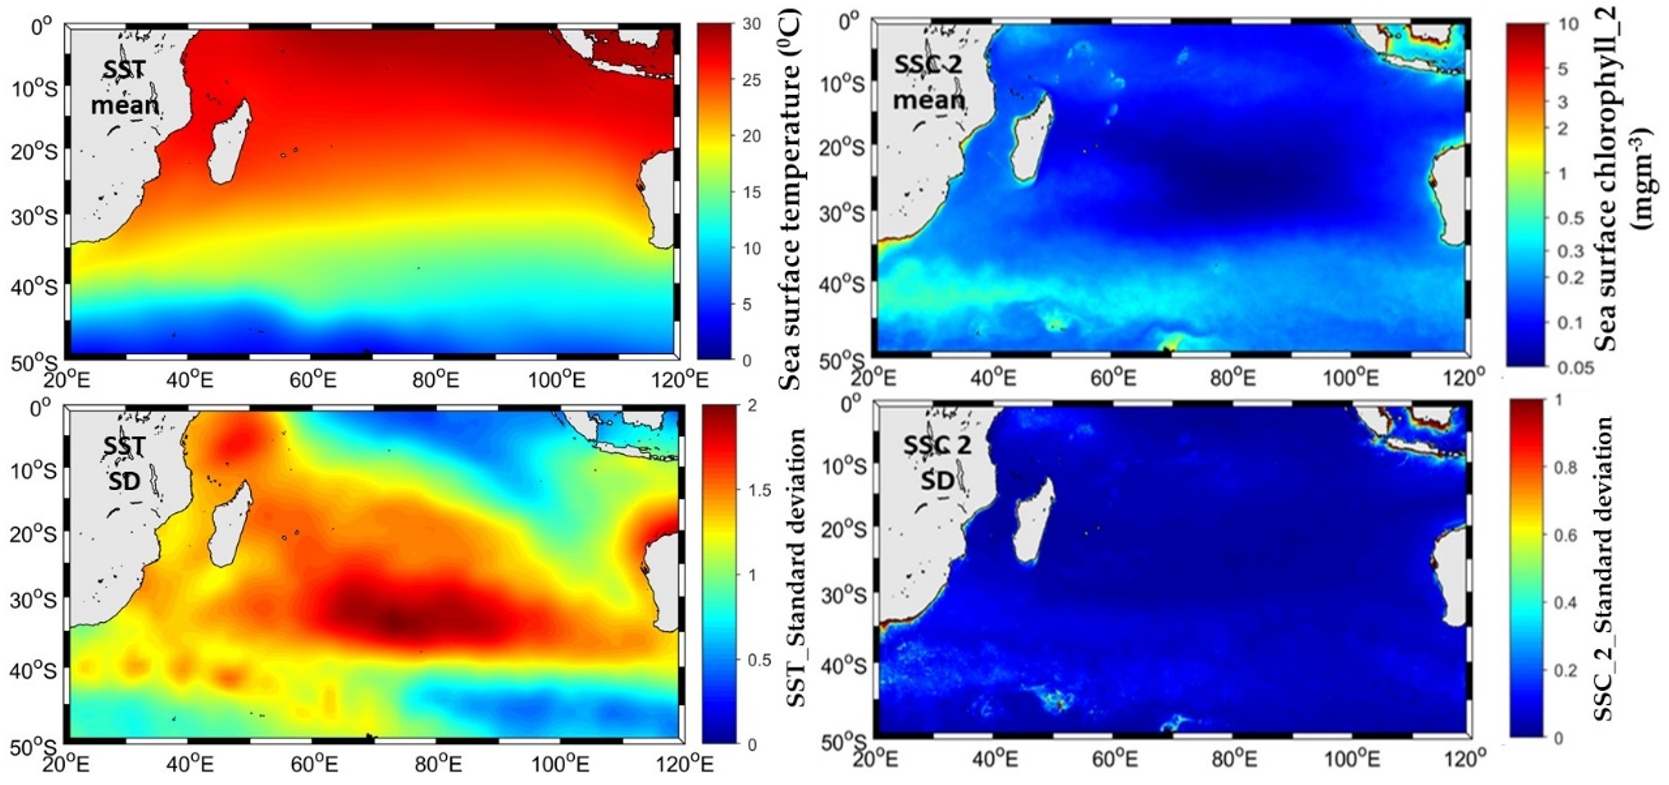
The area between 0 and 20°S was warmer than other parts of the SIO during the study period, with an SST of >20 °C (Figure 3). Southward of 20°S, SST tended to decrease, and from 40°S, it was ≤15 °C, which was cooler than other parts of SIO during the study period. The highest standard deviation was observed near 30°S (>2 °C); the lowest was observed near 40°S (0.2–0.6 °C; Figure 3). An SSC_2 < 0.3 mg m−3 was found in the area of 15–35°S 60–100°E, with generally low deviations (Figure 4). A higher SSC_2 was observed around the southern coast of Africa throughout the study period, with the standard deviation > 0.15.

3.4. SI Curves of Selected Environmental Factors and Modeling the HSI of Albacore Tuna

With SI > 0.6, the preferred ranges [49] of SST and SSC_2 for albacore tuna were 16.5–19.5 °C and 0.07–0.09 mg m−3, respectively (Figure 5). Summed standardized CPUE was mainly centralized in the area that had 17.5 °C SST and 0.08 mg m−3 SSC_2. The AMM-derived HSI model with SST and SSC_2 obtained the lowest Akaike index criterion value, 1.432 (Adjusted r2 = 0.839). Furthermore, SSC_2 had a lower AIC value than SST, with a higher Adjusted r2 value (Table 3).
AIC, Akaike’s information criterion; AMM, arithmetic mean model; GMM, general mean model; SSC_2, sea surface chlorophyll @ 2 months lag; SST, sea surface temperature.

3.5. Validation of the HSI models and HSI prediction

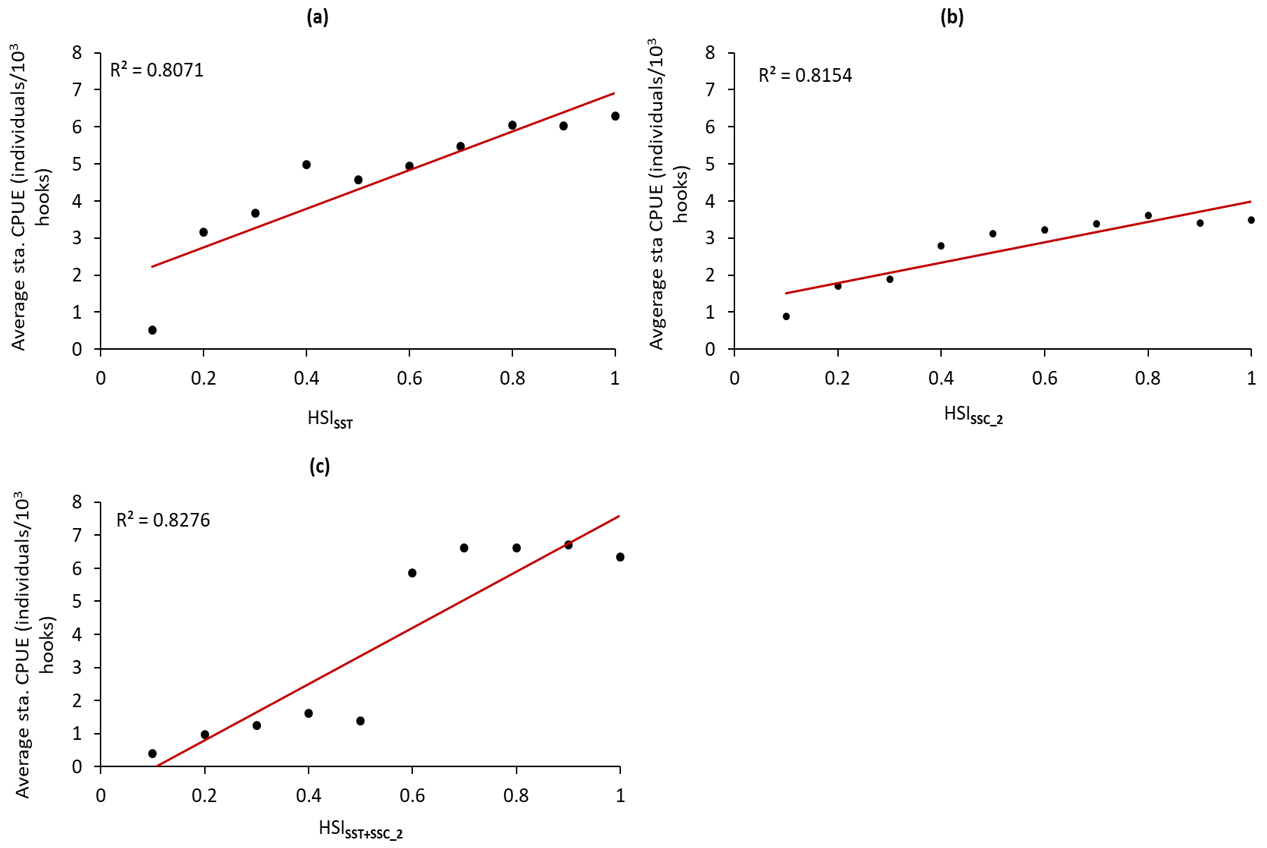
The final AMM model performance was validated by the comparison of the average standardized CPUE using all three models (SST, SSC_2, and SST + SSC_2; Figure 5). Linear regression analysis revealed a higher r2 value for SST + SSC_2 (r2 = 0.8276) than SST (r2 = 0.8071) and SSC_2 (r2 = 0.8154; Figure 5a–c).
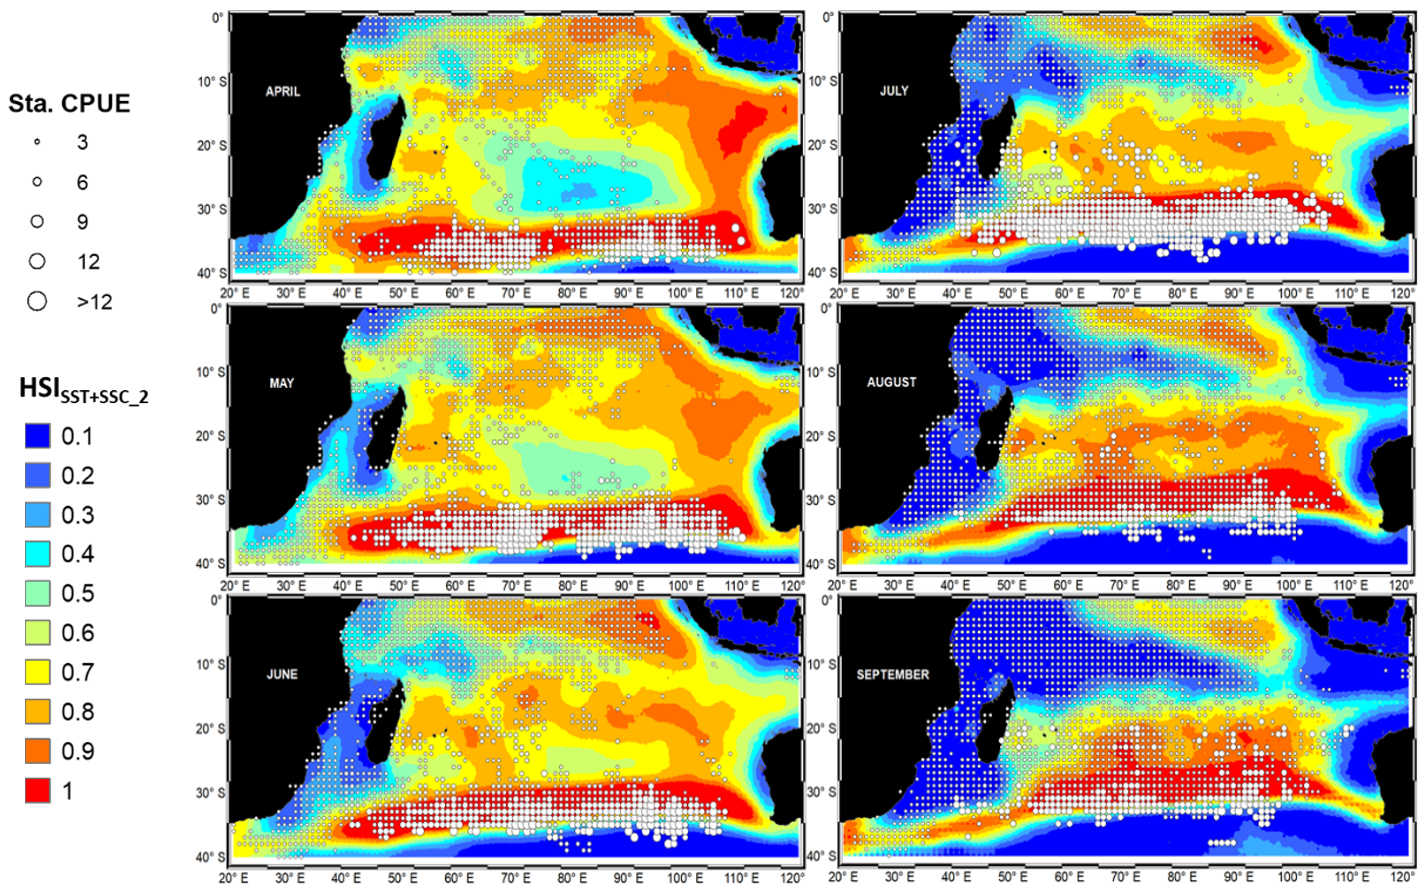
Therefore, HSI-AMM based on SST + SSC_2 was deemed suitable for the HSI prediction the albacore. The AMM (temporal) with SSC_2 and SST was employed to detect albacore tuna habitat during the fishing season (April to September) in the SIO between 2000 and 2016. Maps were shaped for the spatial distribution (monthly) of the standardized CPUE and HSI (Figure 6). The predicted monthly mean HSI was high (>0.6) between 40°S and 30°S from April to September (Figure 6). Specifically, high HSI was extensively distributed in 35–40°S, 60–100°E in April and 30–35°S, 50–100°E in September. The monthly variations in standardized CPUE can be observed in a more concentrated manner by evaluating the optimal HSI value distribution on the HSI map. In April, the optimal HSI value was at approximately 35–40°S, with a low habitat suitability index value of less than 0.6 northward of 35°S. After April, the high HSI values exhibited a northward shift until September. Standardized CPUE followed the same pattern as the HSI values (Figure 6). Higher CPUE (>10) was detected around 35°S, 60–100°E from April to June but at approximately 35°S, 50–100°E from July to August. In September, higher standardized CPUE was mainly concentrated on the Madagascar’s southwest coast, around 50–70°E. Figure 7 showed monthly spatial distribution of SIO albacore standardized CPUE in relation to SSC_2 and SST from April to September (major fishing period) where the red line indicates the 17.5°C SST isotherm in the current month, and the green line represents the 0.08 mg m−3 SSC_2 isopleth at a time delay of 2 months.

4. Discussion

Earlier studies demonstrated the environmental relation of albacore tuna in the southern Indian Ocean, but in the present manuscript, it was shown specifically for the immature albacore. Moreover, none of the previous studies used the chlorophyll lag data to find the difference in projected habitat due to the use of lag. The current study found that SSC_2 was a better clarifier.
The term “total allowable catch” was first used in 2000 [43]. Since then, efforts to rebuild worldwide albacore tuna stocks have been increasing, with size selectivity rules for harvesting. EBFM should be guided by optimal biological parameters and should use different practical tools. An understanding of the tempo-spatial distribution of species and the influences of the oceanic environment on their distribution can help in the effective planning of stock rebuilding [62]. These tools are applicable to Taiwanese fishing fleets in the SIO that are part of the albacore tuna fishing industry. The present study was conducted to model the habitat preferences of albacore tuna in the SIO using environmental variables remotely sensed during 2000–2016. An empirical AMM-derived HSI model using both SSC_2 and SST data was deemed to be optimal for modeling SIO albacore tuna habitat suitability. HSI > 0.6 with an optimal environment of 17.5 °C SST and 0.08 mg m−3 SSC_2 indicated higher chances of albacore presence. Several studies worldwide have offered hypotheses regarding albacore’s preferred environmental ranges and the environmental influences on their habitat [6,9,19,32]. AMM-based HSI exhibited a favorable monthly variation of standardized CPUE, which showed a northward shifting from 40°S in April to 30°S in September. Moreover, higher standardized albacore CPUE and higher HSI coincided mainly in the area of 30–40°S from April to September. Consequently, the migration of albacore schools northward of 40°S may increase the catch probability near 30°S from June to September. Low HSI and lower standardized CPUE were observed in areas beyond the 30–40°S zone. In contrast, the favorable habitat region was 30–40°S from April to September. The current study focused on the feeding habitat zone of the SIO immature albacore tuna. Chen et al. [39] stated that the initial length and weight at maturity of the Indian Ocean albacore tuna were 90 cm and 14 kg, respectively (Figure 1). Figure 1 also indicates that albacore tuna with length < 90 cm and weight < 14 kg were noted in the 30–40°S area, implying that immature albacore inhabit that area from April to September.
Temperature [4,39] and chlorophyll [40,41,42] are key predictors of suitable albacore habitat because they indicate the source of food for albacore [19,31,32]. Several abundance models for albacore distribution have used temperature and chlorophyll [31,32]. However, the present study employed a different method of using chlorophyll data by using remotely sensed data and lag values (SSC_0 to SSC_4 and SST), following a suggestion [24] and experimental results of previous studies. Initially, the current and 1-, 2-, 3-, and 4-month lag data for chlorophyll were used to determine which of them performed optimally. SST and 2-month lag chlorophyll (SSC_2) data provided the optimal results. There is no direct relation between chlorophyll and albacore because albacore feeds on secondary producers such as fish [52,53], shrimp, squid, and octopus [54]. A previous study showed a better correlation between 1-month chlorophyll lag and albacore catch (r = 0.982) than chlorophyll with no lag (r = 0.907). It may take some time for phytoplankton patches to become prominent [24]; therefore, it may take some time for secondary producers to reach the high-chlorophyll zone, and it can take more time for albacore to reach secondary producers for feeding. These results indicate that a higher concentration of chlorophyll does not mean higher albacore biomass at the same time. These results suggest that chlorophyll does not have an immediate effect on albacore distribution, but a delayed effect. Present results provide new insights into using chlorophyll data with a 2-month lag for determining albacore tuna distribution. SST and SSC_2 in the range of 16.5–18.5 °C and 0.07–0.09 mg m−3, respectively, were associated with a higher albacore tune distribution in the SIO, with the highest abundance near 17.5 °C and 0.08 mg m−3. Lan et al. [4] stated that a 95% higher CPUE was in the SST of 16–18.5 °C. For immature albacore, 18.9 °C was considered an appropriate SST [39]. Lee et al. [62] concluded that SST (17–21 °C) explained the predominant habitat pattern of albacore tuna in the SIO and reported that SST is the primary factor influencing the albacore tuna distribution. In a previous study, it was discovered that CPUE is strongly associated with SSC in the range of 0.1–0.2 mg m−3. Arrizabalaga et al. [63] reported that albacore favors relatively low chlorophyll levels (0.11–0.22 mg m−3), although it can tolerate a wide range of chlorophyll levels. The temperature range in the present study is consistent with that reported in previous studies, with slight differences due to variations in the study period [64]. In comparison, the chlorophyll range exhibited slight differences, which may be due to the use of 2-month lag data in the present study. The area between 30 and 40°S showed higher standardized CPUE, which may be attributed to favorable SSC_2 and SST in this area (Figure 7) during the study period. HSI-AMM based on SSC_2 was a more accurate indicator of albacore aggregation than that based on SST, suggesting that the feeding habitat of immature albacore was between 30 and 40°S during the study period. Higher abundance was observed near the areas with a 17.5 °C and 0.1 mg m−3 isopleth line (Figure 7). Thus, SST and SSC_2 can help determine the areas with a higher probability of albacore aggregation, which is similar to the previous findings. Overall, remotely sensed SST and SSC_2 can assist in identifying the distribution pattern of the SIO albacore tuna.
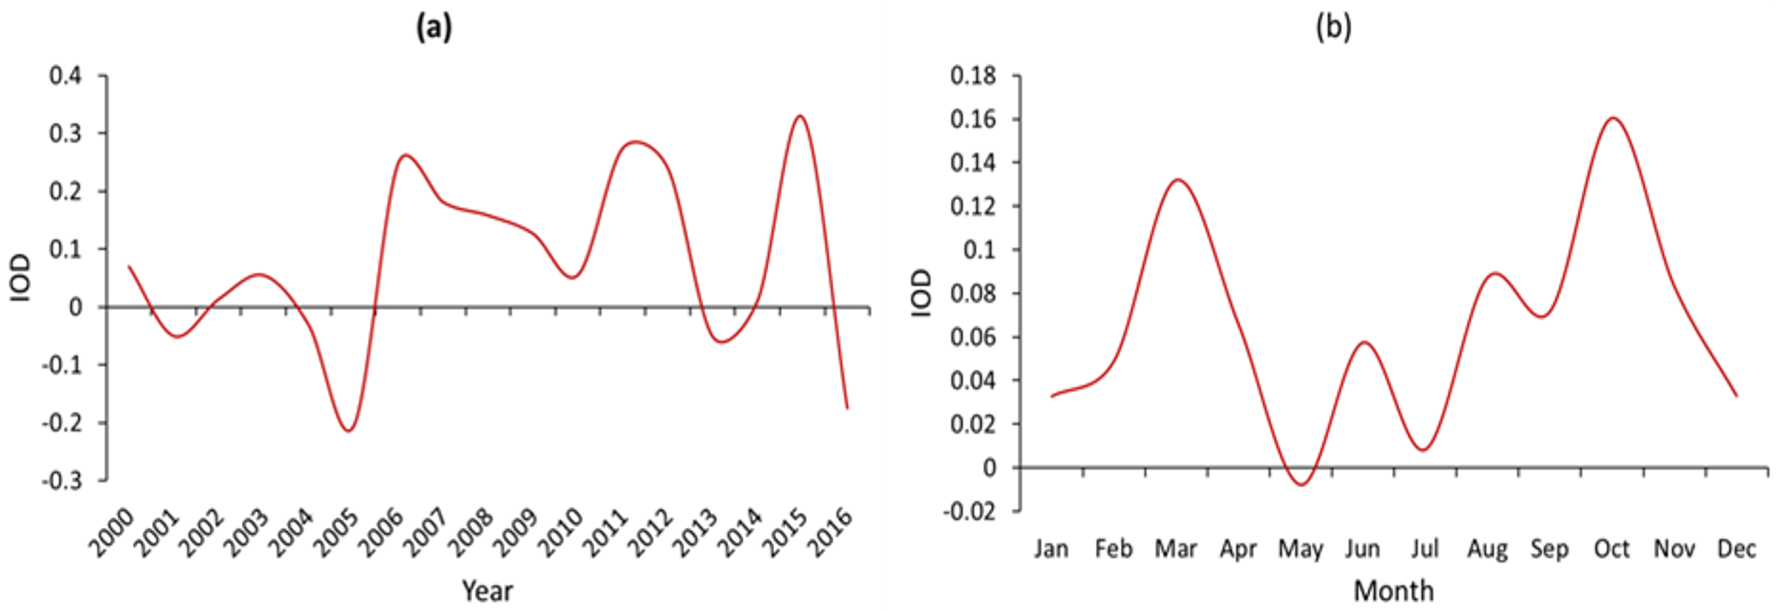
The highest and lowest catches were in 2010 and 2012, respectively (Figure 2b), likely due to a negative Indian Ocean Dipole (IOD) event in 2010 (Figure 8a), which lowered the SST and led to a higher catch. Similar phenomena have been noted in the western Indian Ocean and other places. The second-highest fishing effort (Figure 9a) during the study period was in 2010, which may have also contributed to the high albacore catch in 2010 (Figure 9b). By contrast, in 2012, a positive IOD event occurred (Figure 8a), but the lowest fishing effort (Figure 9a) was also in 2012, leading to the lowest catch (Figure 9b). A study revealed that April to September is the primary fishing season in the SIO. This may be because the months of April to September tend to have lower IOD values than the other months (Figure 9b), allowing the distribution of immature albacore in the SIO from April to September. Following a related study, the use of geostatistical techniques to calculate the abundance in SIO may help clarify the reasons for interannual variability.
Nevertheless, saving the future stock of albacore in the SIO requires urgent intervention. There is a lack of proper stock assessment and management, and the exceeding of maximum sustainable yield continues in the SIO [65]. In addition, climate change may be a major reason for stock shifting of albacore in the SIO in near future. Assuming that environmental variables are the primary influence of albacore distribution in the SIO may be unwise. Future studies should evaluate the effect of climate change on albacore distribution in the SIO. However, factors such as the dynamics of marine fisheries and various biotic and abiotic factors can also alter the distribution pattern [62,66]. The mechanism of habitat preference is difficult to determine, and it may change because of other factors such as prey abundance and fleet behavior. Recently, SEAPODYM has provided useful tools for achieving EBFM [66] for the South Pacific albacore. Further research using empirical HSI models, as used in the present study, and population dynamics [67] can help guide EBFM strategies in the SIO and elsewhere.

5. Conclusions

In summary, an empirical HSI model was constructed using remote sensing data for albacore in the SIO. The sum of standardized CPUE was highest in 2010 and lowest in 2012. The months of May and July showed higher standardized CPUE than the rest of the months. Chlorophyll with 2-month lag data showed a higher correlation with standardized CPUE than 0-, 1-, 3-, and 4-month lag. The final models were constructed using only SST and SSC_2. An AMM-based HSI model was developed using the SI values of remote sensing data and was shown as the optimum empirical HSI model for the SIO albacore. Two variables SST and SSC_2 were used in the selected model to detect the habitat preference of albacore. The optimal habitat was detected in areas where SST and SSC_2 were 16.5–18.5 °C and 0.07–0.09 mg/m3, respectively. The predicted monthly mean HSI was high (>0.6) between 40 and 30°S from April to September. In particular, high HSI was extensively distributed in 35–40°S, 60–100°E in April and 30–35°S, 50–100°E in September. Moreover, the detection of the suitable habitat with the use of remote sensing data was associated with the areas with high standardized catch per unit effort, suggesting that high tuna habitat is connected to favorable SST and SSC_2. However, several uncertain factors such as global warming, climatic changes, and various abiotic and biotic factors (e.g., fleet behavior or prey abundance) that could have an impact on the albacore habitat were not considered in the present study. Future studies will examine these mechanisms to ensure the long-term tuna stock sustainability under the jurisdiction of RFMOs such as the ICCAT to ensure the successful regional EBFM in the SIO.

Author Contributions

Conceptualization, S.M. and M.-A.L.; methodology, M.-A.L. and S.M.; software, S.M.; validation, M.-A.L., A.H.V. and B.S.; formal analysis, S.M.; investigation, M.-A.L. and Y.-C.W.; resources, M.-A.L. and Y.-C.W.; writing—original draft preparation, S.M.; writing—review and editing, M.-A.L., A.H.V. and B.S.; visualization, Y.-C.W. All authors have read and agreed to the published version of the manuscript.

Funding

This research was financed by the Taiwan Council of Agriculture (106AS-10.1.5-FA-F1 (4); 107AS-9.1.5-FA-F1 (4)) and the Ministry of Science and Technology of Taiwan (MOST105-2611-M-019-011).

Institutional Review Board Statement

Not applicable.

Informed Consent Statement

Not applicable.

Data Availability Statement

No data.

Acknowledgments

We thank the valuable comments and suggestions from the three anonymous reviewers and the editor, as well as the team members of the Fisheries Agency (FA), and the Overseas Fisheries Development Council (OFDC) of Taiwan for their assistance in data preparation. We are grateful to the Council of Agriculture, Taiwan, R.O.C., for the grant.

Conflicts of Interest

The authors declare no conflict of interest.

References

  1. Kirches, G.; Paperin, M.; Klein, H.; Brockmann, C.; Stelzer, K.; Kirches, G.; Paperin, M.; Klein, H.; Brockmann, C.; Stelzer, K. GRADHIST—A method for detection and analysis of oceanic fronts from remote sensing data. Remote Sens. Environ. 2016, 181, 264–280. [Google Scholar] [CrossRef]
  2. Ping, B.; Su, F.; Meng, Y.; Fang, S.; Du, Y. A model of sea surface temperature front detection based on a threshold interval. Acta Oceanol. Sin. 2014, 33, 65–71. [Google Scholar] [CrossRef]
  3. Diehl, S.F.; Budd, J.W.; Ullman, D.; Cayula, J.F. Geographic window sizes applied to remote sensing sea surface temperature front detection. J. Atmos. Ocean. Technol. 2002, 19, 1105–1113. [Google Scholar] [CrossRef]
  4. Lan, K.-W.; Kawamura, H.; Lee, M.-A.; Lu, H.-J.; Shimada, T.; Hosoda, K.; Sakaida, F. Relationship between albacore (Thunnus alalunga) fishing grounds in the Indian Ocean and the thermal environment revealed by cloud-free microwave sea surface temperature. Fish. Res. 2012, 113, 1–7. [Google Scholar] [CrossRef]
  5. Maul, G.A. Introduction to Satellite Oceanography; Springer Science and Business Media LLC: Berlin/Heidelberg, Germany, 1985; p. 3. [Google Scholar]
  6. Zhou, C.; He, P.; Xu, L.; Bach, P.; Wang, X.; Wan, R.; Tang, H.; Zhang, Y. The effects of mesoscale oceanographic structures and ambient conditions on the catch of albacore tuna in the South Pacific longline fishery. Fish. Oceanogr. 2020, 29, 238–251. [Google Scholar] [CrossRef]
  7. Chen, X.; Tian, S.; Chen, Y.; Liu, B. A modeling approach to identify optimal habitat and suitable fishing grounds for neon flying squid (Ommostrephes bartramii) in the northwest Pacific Ocean. Fish. Bull. 2010, 108, 1–14. [Google Scholar]
  8. Zainuddin, M.; Saitoh, S. Detection of potential fishing ground for albacore tuna using synoptic measurements of ocean color and thermal remote sensing in the northwestern North Pacific. Geophys. Res. Lett. 2004, 31, 31. [Google Scholar] [CrossRef]
  9. Zainuddin, M.; Saitoh, K.; Saitoh, S.-I. Albacore (Thunnus alalunga) fishing ground in relation to oceanographic conditions in the western North Pacific Ocean using remotely sensed satellite data. Fish. Oceanogr. 2008, 17, 61–73. [Google Scholar] [CrossRef] [Green Version]
  10. Lan, K.-W.; Lee, M.-A.; Chou, C.-P.; Vayghan, A.H. Association between the interannual variation in the oceanic environment and catch rates of bigeye tuna (Thunnus obesus) in the Atlantic Ocean. Fish. Oceanogr. 2018, 27, 395–407. [Google Scholar] [CrossRef]
  11. Xu, Y.; Nieto, K.; Teo, S.L.; McClatchie, S.; Holmes, J. Influence of fronts on the spatial distribution of albacore tuna (Thunnus alalunga) in the Northeast Pacific over the past 30 years (1982–2011). Prog. Oceanogr. 2017, 150, 72–78. [Google Scholar] [CrossRef]
  12. Yen, K.-W.; Chen, C.-H. Research Gap Analysis of Remote Sensing Application in Fisheries: Prospects for Achieving the Sustainable Development Goals. Remote Sens. 2021, 13, 1013. [Google Scholar] [CrossRef]
  13. Lan, K.W.; Nishida, T.; Lee, M.A.; Lu, H.J.; Huang, H.W.; Chang, S.K.; Lan, Y.C. Influence of the marine environment varia-bility on the yellowfin tuna (Thunnus albacares) catch rate by the Taiwanese longline fishery in the Arabian sea, with special reference to the high catch in 2004. J. Mar. Sci. Technol. 2012, 20, 514–524. [Google Scholar]
  14. Majkowski, J. Global Fishery Resources of Tuna and Tuna-Like Species; FAO: Rome, Italy, 2007. [Google Scholar]
  15. Lehodey, P.; Senina, I.; Murtugudde, R. A spatial ecosystem and populations dynamics model (SEAPODYM)—Modeling of tuna and tuna-like populations. Prog. Oceanogr. 2008, 78, 304–318. [Google Scholar] [CrossRef]
  16. Klemas, V. Remote sensing of environmental indicators of potential fish aggregation: An overview. Baltica 2012, 25, 99–112. [Google Scholar] [CrossRef] [Green Version]
  17. Gilman, E.; Weijerman, M.; Suuronen, P. Ecological data from observer programs underpin ecosystem-based fisheries management. ICES J. Mar. Sci. 2017, 74, 1481–1495. [Google Scholar] [CrossRef] [Green Version]
  18. Lee, P.F.; Chen, I.C.; Tzeng, W.N. Spatial and temporal distribution patterns of bigeye tuna (Thunnus obesus) in the Indian Ocean. Zool. Stud. 2005, 44, 260. [Google Scholar]
  19. Zainuddin, M.; Farhum, A.; Safruddin, S.; Selamat, M.B.; Sudirman, S.; Nurdin, N.; Syamsuddin, M.; Ridwan, M.; Saitoh, S.-I. Detection of pelagic habitat hotspots for skipjack tuna in the Gulf of Bone-Flores Sea, southwestern Coral Triangle tuna, Indonesia. PLoS ONE 2017, 12, e0185601. [Google Scholar] [CrossRef] [Green Version]
  20. Lan, K.W.; Lee, M.A.; Lu, H.J.; Shieh, W.J.; Lin, W.K.; Kao, S.C. Ocean variations associated with fishing conditions for yel-lowfin tuna (Thunnus albacares) in the equatorial Atlantic Ocean. ICES J. Mar. Sci. 2011, 68, 1063–1071. [Google Scholar] [CrossRef]
  21. Mugo, R.; Saitoh, S.-I.; Nihira, A.; Kuroyama, T. Habitat characteristics of skipjack tuna (Katsuwonus pelamis) in the western North Pacific: A remote sensing perspective. Fish. Oceanogr. 2010, 19, 382–396. [Google Scholar] [CrossRef]
  22. Su, N.J.; Yeh, S.Z.; Sun, C.L.; Punt, A.E.; Chen, Y.; Wang, S.P. Standardizing catch and effort data of the Taiwanese distant-water longline fishery in the western and central Pacific Ocean for bigeye tuna, Thunnus obesus. Fish. Res. 2008, 90, 235–246. [Google Scholar] [CrossRef]
  23. Tian, S.; Chen, X.; Chen, Y.; Xu, L.; Dai, X. Standardizing CPUE of Ommastrephes bartramii for Chinese squid-jigging fishery in Northwest Pacific Ocean. Chin. J. Oceanol. Limnol. 2009, 27, 729–739. [Google Scholar] [CrossRef]
  24. Kumari, B.; Raman, M.; Mali, K. Locating tuna forage ground through satellite remote sensing. Int. J. Remote Sens. 2009, 30, 5977–5988. [Google Scholar] [CrossRef]
  25. Maunder, M.N.; Hinton, M.G.; Bigelow, K.A.; Langley, A.D. Developing indices of abundance using habitat data in a statistical framework. Bull. Mar. Sci. 2006, 79, 545–559. [Google Scholar]
  26. Maunder, M.N.; Thorson, J.T.; Xu, H.; Oliveros-Ramos, R.; Hoyle, S.D.; Tremblay-Boyer, L.; Lee, H.H.; Kai, M.; Chang, S.K.; Kitakado, T. The need for spatio-temporal modeling to determine catch-per-unit effort based indices of abundance and as-sociated composition data for inclusion in stock assessment models. Fish. Res. 2020, 229, 105594. [Google Scholar] [CrossRef]
  27. Vayghan, A.H.; Zarkami, R.; Sadeghi, R.; Fazli, H. Modeling habitat preferences of Caspian kutum, Rutilus frisii kutum (Kamensky, 1901) (Actinopterygii, Cypriniformes) in the Caspian Sea. Hydrobiologia 2016, 766, 103–119. [Google Scholar] [CrossRef]
  28. Vayghan, A.H.; Poorbagher, H.; Shahraiyni, H.T.; Fazli, H.; Saravi, H.N. Suitability indices and habitat suitability index model of Caspian kutum (Rutilus frisii kutum) in the southern Caspian Sea. Aquat. Ecol. 2013, 47, 441–451. [Google Scholar] [CrossRef]
  29. Vayghan, A.H.; Fazli, H.; Ghorbani, R.; Lee, M.-A.; Saravi, H.N. Temporal habitat suitability modeling of Caspian shad (Alosa spp.) in the southern Caspian Sea. J. Limnol. 2015, 75, 210–223. [Google Scholar] [CrossRef]
  30. Van der Lee, G.E.M.; Van der Molen, D.T.; Van den Boogaard, H.F.P.; Van der Klis, H. Uncertainty analysis ofa spatial habitat suitability model and implications for ecological management of water bodies. Landsc. Ecol. 2006, 21, 1019–1032. [Google Scholar] [CrossRef]
  31. Vayghan, A.; Lee, M.-A.; Weng, J.-S.; Mondal, S.; Lin, C.-T.; Wang, Y.-C. Multisatellite-Based Feeding Habitat Suitability Modeling of Albacore Tuna in the Southern Atlantic Ocean. Remote Sens. 2020, 12, 2515. [Google Scholar] [CrossRef]
  32. Lee, M.-A.; Weng, J.-S.; Lan, K.-W.; Vayghan, A.H.; Wang, Y.-C.; Chan, J.-W. Empirical habitat suitability model for immature albacore tuna in the North Pacific Ocean obtained using multisatellite remote sensing data. Int. J. Remote Sens. 2019, 41, 5819–5837. [Google Scholar] [CrossRef]
  33. Loukos, H.; Monfray, P.; Bopp, L.; Lehodey, P. Potential changes in skipjack tuna (Katsuwonus pelamis) habitat from a global warming scenario: Modelling approach and preliminary results. Fish. Oceanogr. 2003, 12, 474–482. [Google Scholar] [CrossRef]
  34. Lan, K.W.; Shimada, T.; Lee, M.A.; Su, N.J.; Chang, Y. Using remote-sensing environmental and fishery data to map potential yellowfin tuna habitats in the tropical Pacific Ocean. Remote Sens. 2017, 9, 444. [Google Scholar] [CrossRef] [Green Version]
  35. Wang, J.; Yu, W.; Chen, X.; Lei, L.; Chen, Y. Detection of potential fishing zones for neon flying squid based on remote-sensing data in the Northwest Pacific Ocean using an artificial neural network. Int. J. Remote Sens. 2015, 36, 3317–3330. [Google Scholar] [CrossRef]
  36. Wang, W.; Zhou, C.; Shao, Q.; Mulla, D.J. Remote sensing of sea surface temperature and chlorophyll-a: Implications for squid fisheries in the north-west Pacific Ocean. Int. J. Remote Sens. 2010, 31, 4515–4530. [Google Scholar] [CrossRef]
  37. Lan, K.-W.; Chang, Y.-J.; Wu, Y.-L. Influence of oceanographic and climatic variability on the catch rate of yellowfin tuna (Thunnus albacares) cohorts in the Indian Ocean. Deep Sea Res. Part II Top. Stud. Oceanogr. 2020, 175, 104681. [Google Scholar] [CrossRef]
  38. Chen, I.C.; Lee, P.F.; Tzeng, W.N. Distribution of albacore (Thunnus alalunga) in the Indian Ocean and its relation to environmental factors. Fish. Oceanogr. 2005, 14, 71–80. [Google Scholar] [CrossRef]
  39. Arrizabalaga, S.; Li, Z. Factors influencing the assessment of albacore tuna resources in the Indian Ocean. Ccamlr Sci. 2018, 25, 107–120. [Google Scholar]
  40. Collette, B.B.; Nauen, C.E. FAO species catalogue. Scombrids of the world. An annotated and illustrated catalogue of tunas, mackerels, bonitos, and related species known to date. FAO Fish. Synop. 1983, 125, 137. [Google Scholar]
  41. Hoyle, S.D.; Langley, A.D.; Campbell, R.A. Recommended approaches for standardizing CPUE data from pelagic fisheries. In Proceedings of the Western and Central Pacific Fisheries Commission, Majuro, Marshall Islands, 6–14 August 2014; pp. 1–21. [Google Scholar] [CrossRef]
  42. Report of the 2013 Iccat North and South Atlantic Albacore Stock Assessment Meeting; Sukarrieta, Spain. 2013. Available online: https://www.iccat.int/Documents/Meetings/Docs/2013_ALB_ASSESS_REP_ENG.pdf (accessed on 20 March 2020).
  43. Baglin, R.E. Reproductive biology of western Atlantic bluefin tuna. Fish. Bull. 1982, 80, 121–134. [Google Scholar]
  44. Arrizabalaga, H.; López-Rodas, V.; de Zárate, V.O.; Costas, E.; Gonzaléz-Garcés, A. Study on the migrations and stock structure of albacore (Thunnus alalunga) from the Atlantic Ocean and the Mediterranean Sea based on conventional tag release-recapture experiences. Collect. Vol. Sci. Pap. ICCAT 2002, 54, 1479–1494. [Google Scholar]
  45. De Zárate, V.O.; Cort, J.L. Albacore (Thunnus alalunga, Bonnaterre) stock structure in the Atlantic Ocean, as inferred from distribution and migration patterns. In Proceedings of the ICCAT Tuna Symposium, Rio de Janeiro, Brazil, 15–22 November 1999; pp. 251–260. [Google Scholar]
  46. Sund, P.N.; Blackburn, M.; Williams, F. Tunas and their environment in the Pacific Ocean: A review. Oceanography. Mar. Biol. Ann. Rev. 1981, 19, 443–512. [Google Scholar]
  47. Ramos, A.G.; Santiago, J.; Sangra, P.; Canton, M. An application of satellite-derived sea surface temperature data to the skipjack (Katsuwonus pelamis, Linnaeus, 1758) and albacore tuna (Thunnus alalunga, Bonnaterre, 1788) fisheries in the north-east Atlantic. Int. J. Remote Sens. 1996, 17, 749–759. [Google Scholar] [CrossRef]
  48. Bakun, A. Patterns in the Ocean; California Sea Grant, in cooperation with Centro de Investigaciones Biologicas del Noroeste: La Paz, Mexico, 1998; p. 323. [Google Scholar]
  49. Olson, D.B.; Hitchcock, G.L.; Mariano, A.J.; Ashjian, C.J.; Peng, G.; Nero, R.W.; Podesta, G.P. Life on the edge: Marine life and fronts. Oceanography 1994, 7, 52–59. [Google Scholar] [CrossRef] [Green Version]
  50. Polovina, J.J.; Howell, E.; Kobayashi, D.R.; Seki, M.P. The transition zone chlorophyll front, a dynamic global feature defining migration and forage habitat for marine resources. Prog. Oceanogr. 2001, 49, 469–483. [Google Scholar] [CrossRef]
  51. Koga, S. On the stomach contents of tuna in the West Indian Ocean. Bull. Fac. Fish. 1958, 6, 85–92. [Google Scholar]
  52. Nishida, T.; Tanaka, M. General review of Indian Ocean albacore (Thunnus alalunga). In Proceedings of the 1st Session of the Working Party on Temperate Tuna, Shimizu, Japan, 2–5 August 2004; p. 8. [Google Scholar]
  53. Xu, L.; Tian, S.Q. A study of fisheries biology for albacore based on Chinese observer data. In Proceedings of the 3rd Session of the Working Party on Temperate Tuna, Busan, Korea, 20–22 September 2011; pp. 3–11. [Google Scholar]
  54. Chen, X.; Li, G.; Feng, B.; Tian, S. Habitat suitability index of Chub mackerel (Scomber japonicus) from July to September in the East China Sea. J. Oceanogr. 2009, 65, 93–102. [Google Scholar] [CrossRef]
  55. Lee, D.; Son, S.H.; Kang, C.-K. Spatio-Temporal Variability of the Habitat Suitability Index for the Todarodes pacificus (Japanese Common Squid) around South Korea. Remote Sens. 2019, 11, 2720. [Google Scholar] [CrossRef] [Green Version]
  56. Lee, D.; Son, S.; Kim, W.; Park, J.M.; Joo, H.; Lee, S.H. Spatio-Temporal Variability of the Habitat Suitability Index for Chub Mackerel (Scomber Japonicus) in the East/Japan Sea and the South Sea of South Korea. Remote Sens. 2018, 10, 938. [Google Scholar] [CrossRef] [Green Version]
  57. Hess, G.R.; Bay, J.M. A Regional Assessment of Windbreak Habitat Suitability. Environ. Monit. Assess. 2000, 61, 239–256. [Google Scholar] [CrossRef]
  58. Lauver, C.L.; Busby, W.H.; Whistler, J.L. Testing a GIS Model of Habitat Suitability for a Declining Grassland Bird. Environ. Manag. 2002, 30, 88–97. [Google Scholar] [CrossRef]
  59. Hirzel, A.; Helfer, V.; Metral, F. Assessing habitat-suitability models with a virtual species. Ecol. Model. 2001, 145, 111–121. [Google Scholar] [CrossRef] [Green Version]
  60. Muhling, B.A.; Brill, R.; Lamkin, J.T.; Roffer, M.A.; Lee, S.-K.; Liu, Y.; Muller-Karger, F. Projections of future habitat use by Atlantic bluefin tuna: Mechanistic vs. correlative distribution models. ICES J. Mar. Sci. 2016, 74, 698–716. [Google Scholar] [CrossRef]
  61. Nikolic, N.; Morandeau, G.; Hoarau, L.; West, W.; Arrizabalaga, H.; Hoyle, S.; Nicol, S.J.; Bourjea, J.; Puech, A.; Farley, J.H.; et al. Review of albacore tuna, Thunnus alalunga, biology, fisheries and management. Rev. Fish Biol. Fish. 2017, 27, 775–810. [Google Scholar] [CrossRef]
  62. Lee, M.-A.; Vayghan, A.H.; Liu, D.-C.; Yang, W.-C. Potential and prospective seasonal distribution of hotspot habitat of albacore tuna (Thunnus alalunga) in the South Indian Ocean using the satellite data. In Proceedings of the 2017 IEEE International Geoscience and Remote Sensing Symposium (IGARSS), Fort Worth, TX, USA, 23–28 July 2017; pp. 5747–5750. [Google Scholar]
  63. Arrizabalaga, H.; Dufour, F.; Kell, L.; Merino, G.; Ibaibarriaga, L.; Chust, G.; Irigoien, X.; Santiago, J.; Murua, H.; Fraile, I.; et al. Global habitat preferences of commercially valuable tuna. Deep Sea Res. Part II Top. Stud. Oceanogr. 2015, 113, 102–112. [Google Scholar] [CrossRef] [Green Version]
  64. Lehodey, P.; Senina, I.; Dragon, A.-C.; Arrizabalaga, H. Spatially explicit estimates of stock size, structure and biomass of North Atlantic albacore tuna (Thunnus alalunga). Earth Syst. Sci. Data 2014, 6, 317–329. [Google Scholar] [CrossRef] [Green Version]
  65. Chust, G.; Goikoetxea, N.; Ibaibarriaga, L.; Sagarminaga, Y.; Arregui, I.; Fontán, A.; Irigoien, X.; Arrizabalaga, H. Earlier migration and distribution changes of albacore in the Northeast Atlantic. Fish. Oceanogr. 2019, 28, 505–516. [Google Scholar] [CrossRef]
  66. Lehodey, P.; Senina, I.; Nicol, S.; Hampton, J. Modelling the impact of climate change on South Pacific albacore tuna. Deep Sea Res. Part II Top. Stud. Oceanogr. 2015, 113, 246–259. [Google Scholar] [CrossRef]
  67. Senina, I.N.; Lehodey, P.; Hampton, J.; Sibert, J. Quantitative modelling of the spatial dynamics of South Pacific and Atlantic albacore tuna populations. Deep Sea Res. Part II Top. Stud. Oceanogr. 2020, 175, 104667. [Google Scholar] [CrossRef]
Figure 1. Nominal (N) CPUE and average weight (AW) distribution of albacore tuna for the southern Indian Ocean from 2000 to 2016. The area in the red rectangle is the main habitat zone of immature albacore tuna.
Remotesensing 13 02669 g001
Figure 2. (a) Time series of nominal (nom.) and standardized (sta.) catch per unit effort (CPUE) data and (b) the changes in the sum of standardized CPUE, yearly. Average of standardized CPUE (c) monthly, (d) latitudinally, and (e) longitudinally.
Remotesensing 13 02669 g002
Figure 3. Mean and standard deviations (SD) of SST and SSC_2 from 2000 to 2016.
Remotesensing 13 02669 g003
Figure 4. Suitability index (SI) curves for (a) SST and (b) SSC_2 for the SIO albacore tuna generated by using a regression method with smoothing spline. The intersection of the horizontal line and SI curve indicates the environmental variables with the optimal range.
Remotesensing 13 02669 g004
Figure 5. Association between average standardized monthly CPUE and AMM derived (a) HSISST, (b) HSISSC_2, and (c) HSISST+SSC_2 values for albacore tuna in the SIO.
Remotesensing 13 02669 g005
Figure 6. Monthly HSI predicted maps and albacore CPUE using an arithmetic mean model with SST and SSC_2 data.
Remotesensing 13 02669 g006
Figure 7. Monthly spatial distribution of SIO albacore standardized CPUE in relation to SSC_2 and SST from April to September (major fishing period). The red line indicates the 17.5 °C SST isotherm in the current month, and the green line represents the 0.08 mg m−3 SSC_2 isopleth at a time delay of 2 months.
Remotesensing 13 02669 g007
Figure 8. (a)Yearly and (b) monthly changes in Indian Ocean Dipole (IOD) from 2000 to 2016 in the southern Indian Ocean.
Remotesensing 13 02669 g008
Figure 9. (a) Effort and (b) number of albacore captured from 2000 to 2016 in the southern Indian Ocean.
Remotesensing 13 02669 g009
Table 1. Remotely sensed variables applied in the model and their data sources.
VariablesUnitsData Source Resolution
Sea Surface Temperature (SST)°CMODIS1° × 1°
Sea Surface Chlorophyll (SSC_0)mg m−3MODIS1° × 1°
Sea Surface Chlorophyll 1-month lag (SSC_1)mg m−3MODIS1° × 1°
Sea Surface Chlorophyll 2-month lag (SSC_2)mg m−3MODIS1° × 1°
Sea Surface Chlorophyll 3-month lag (SSC_3)mg m−3MODIS1° × 1°
Sea Surface Chlorophyll 4-month lag (SSC_4)mg m−3MODIS1° × 1°
Table 2. Correlation analysis between different environments and between environmental variables and standardized CPUE. Bold values were selected for the final model.
SSTSSC_0SSC_1SSC_2SSC_3SSC_4
SSC_0−0.079 *
SSC_1−0.041 *0.877 **
SSC_20.049 *0.815 **0.889 **
SSC_30.105 *0.775 **0.813 **0.893 **
SSC_40.123 *0.743 **0.798 **0.859 **0.875 **
Sta. CPUE−0.681 *−0.152 *−0.189 *−0.224 *−0.197 *−0.166 *
* 0.05 level of significance, ** 0.01 level of significance.
Table 3. Comparison between two empirical habitat suitability index models with the selected remote sensing environmental parameters for the SIO albacore tuna.
Environmental Variables AMM GMM
αβAdjusted r2AICP(F)αβAdjusted r2AICP(F)
SST1.9625.2060.78328.115<0.011.9625.2060.78328.115<0.01
SSC_21.3182.8120.81913.568<0.011.3182.8120.81913.568<0.01
SST, SSC_20.5341.2210.8391.432<0.014.3943.1040.17842.046<0.01
Publisher’s Note: MDPI stays neutral with regard to jurisdictional claims in published maps and institutional affiliations.