
Quantitative Assessment of Vertical and Horizontal Deformations Derived by 3D and 2D Decompositions of InSAR Line-of-Sight Measurements to Supplement Industry Surveillance Programs in the Tengiz Oilfield (Kazakhstan)


Abstract
1. Introduction
- (1)
- Determination of ground deformation velocities and rates at the Tengiz oilfield over the period of 2018–2020 using SBAS remote sensing techniques followed by 3D and 2D decompositions and cosine corrections to derive vertical and horizontal east-west and north-south movements from LOS measurements
- (2)
- Detection of vertical and horizontal ground deformation hotspots
- (3)
- Quantitative comparison of the ground deformation velocities and rates derived from LOS, 3D and 2D decomposition and cosine correction measurements
- (4)
- Assessment of the spatial relationships between the detected patterns of vertical and horizontal ground deformations, man-made oil field exploitation and natural tectonic processes
- (5)
- Provision of recommendations to operators of oil and gas fields and other types of petroleum infrastructure.
2. Materials and Methods
2.1. Study Area
2.2. Quantitative Assessment of Ground Deformations at the Tengiz Oilfield Using SBAS Techniques, 3D & 2D Decompositions and Cosine Corrections
3. Results
4. Discussion
5. Conclusions
- (1)
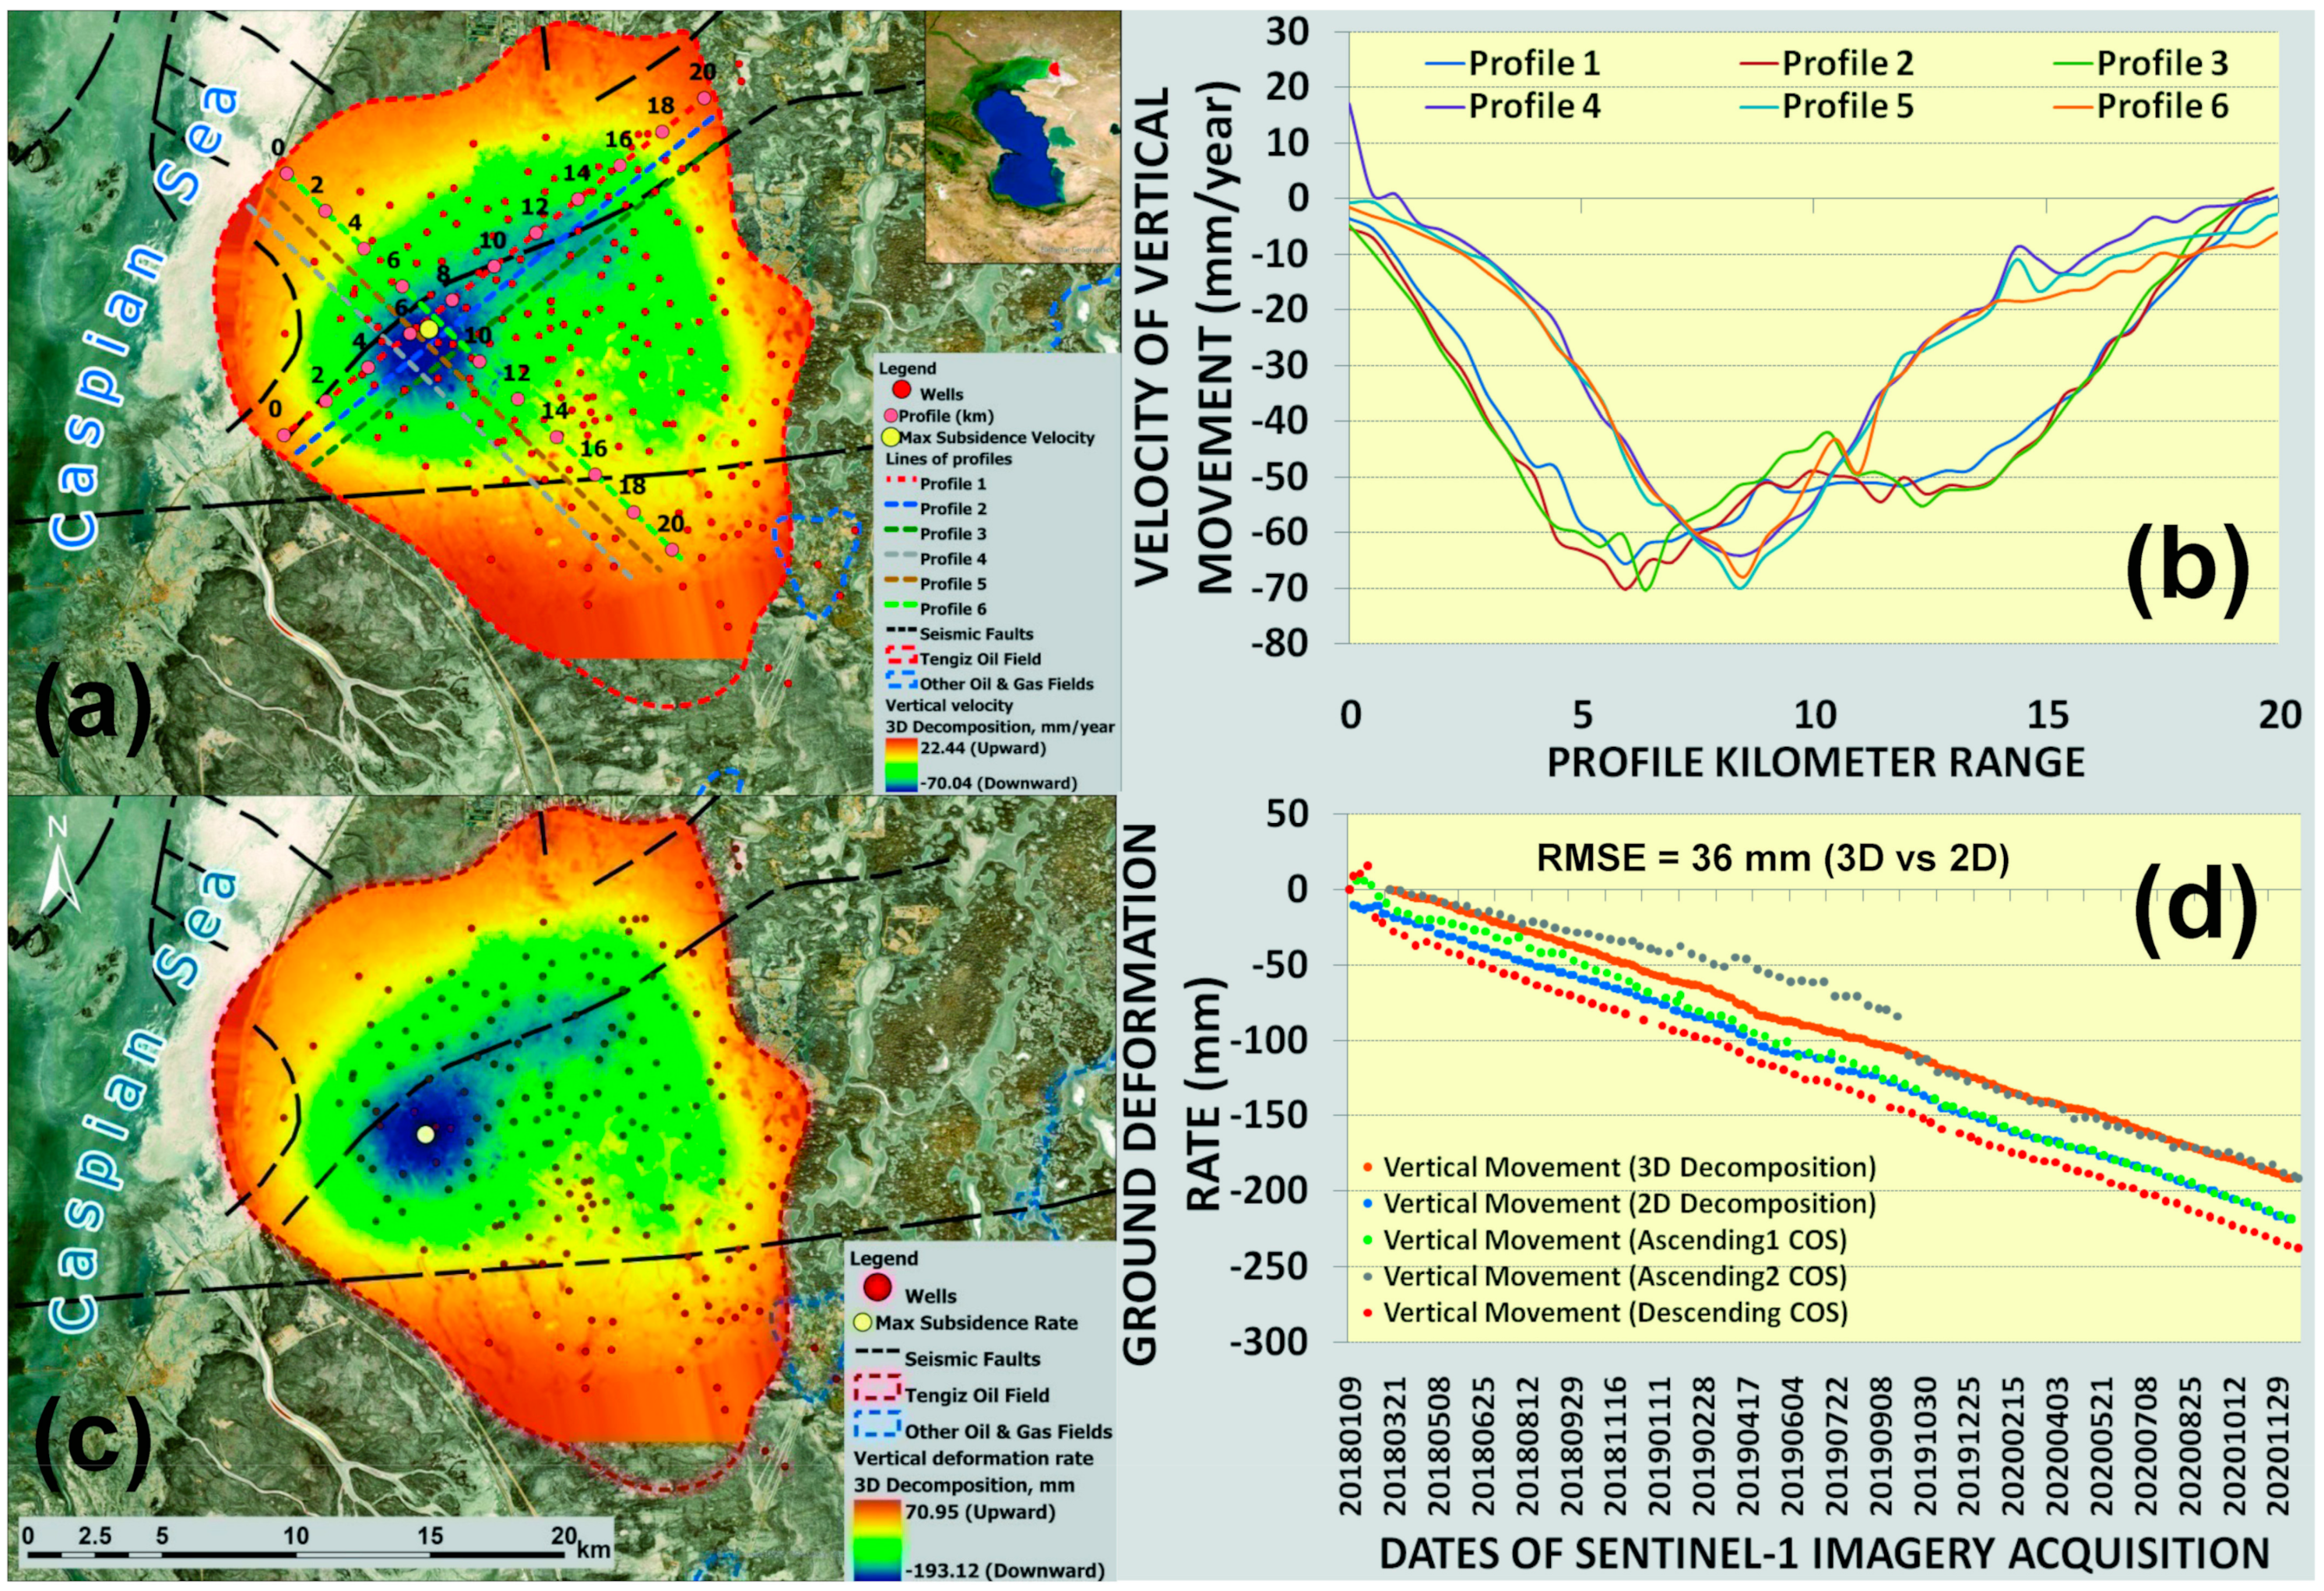
- 3D decomposition of LOS measurements concerning vertical movements showed that the Tengiz oilfield continued to subside during 2018–2020 with a maximum annual vertical deformation velocity around 70 mm. Following LOS measurements, the maximum annual subsiding velocity was observed to be 60 mm. Cosine corrections of LOS measurements to vertical movement revealed a maximum annual vertical deformation velocity of 77 mm.
- (2)
- Overall RMSE between 3D decomposed vertical deformation and LOS measurements was observed to be in the range of 10–13 mm. The differences on the local level were variable in the range of 7–21 mm.
- (3)
- Overall RMSE between 3D decomposed and cosine-corrected vertical deformations was observed to be in the range of 6–8 mm. Compared to LOS measurements, the cosine-correction improved the results of vertical deformation twice relative to 3D and 2D decomposition. The differences on the local level were variable in the range of 0–17 mm.
- (4)
- The ground deformation rate at the location of maximum subsidence reached around 200 mm of vertical ground movement derived from 3D decomposition of LOS measurements over the period of 2018–2020. The differences of vertical deformation rates derived from 3D decomposition and cosine corrections at the site of the maximum subsidence varied in the range of 0–50 mm. RMSE between vertical deformation rates from 3D and 2D decompositions and cosine correction was observed to be in the range of 30–40 mm. Besides the ground deformation velocity, it is highly important to consider the total displacement reflected in the deformation rate of individual sites of interest.
- (5)
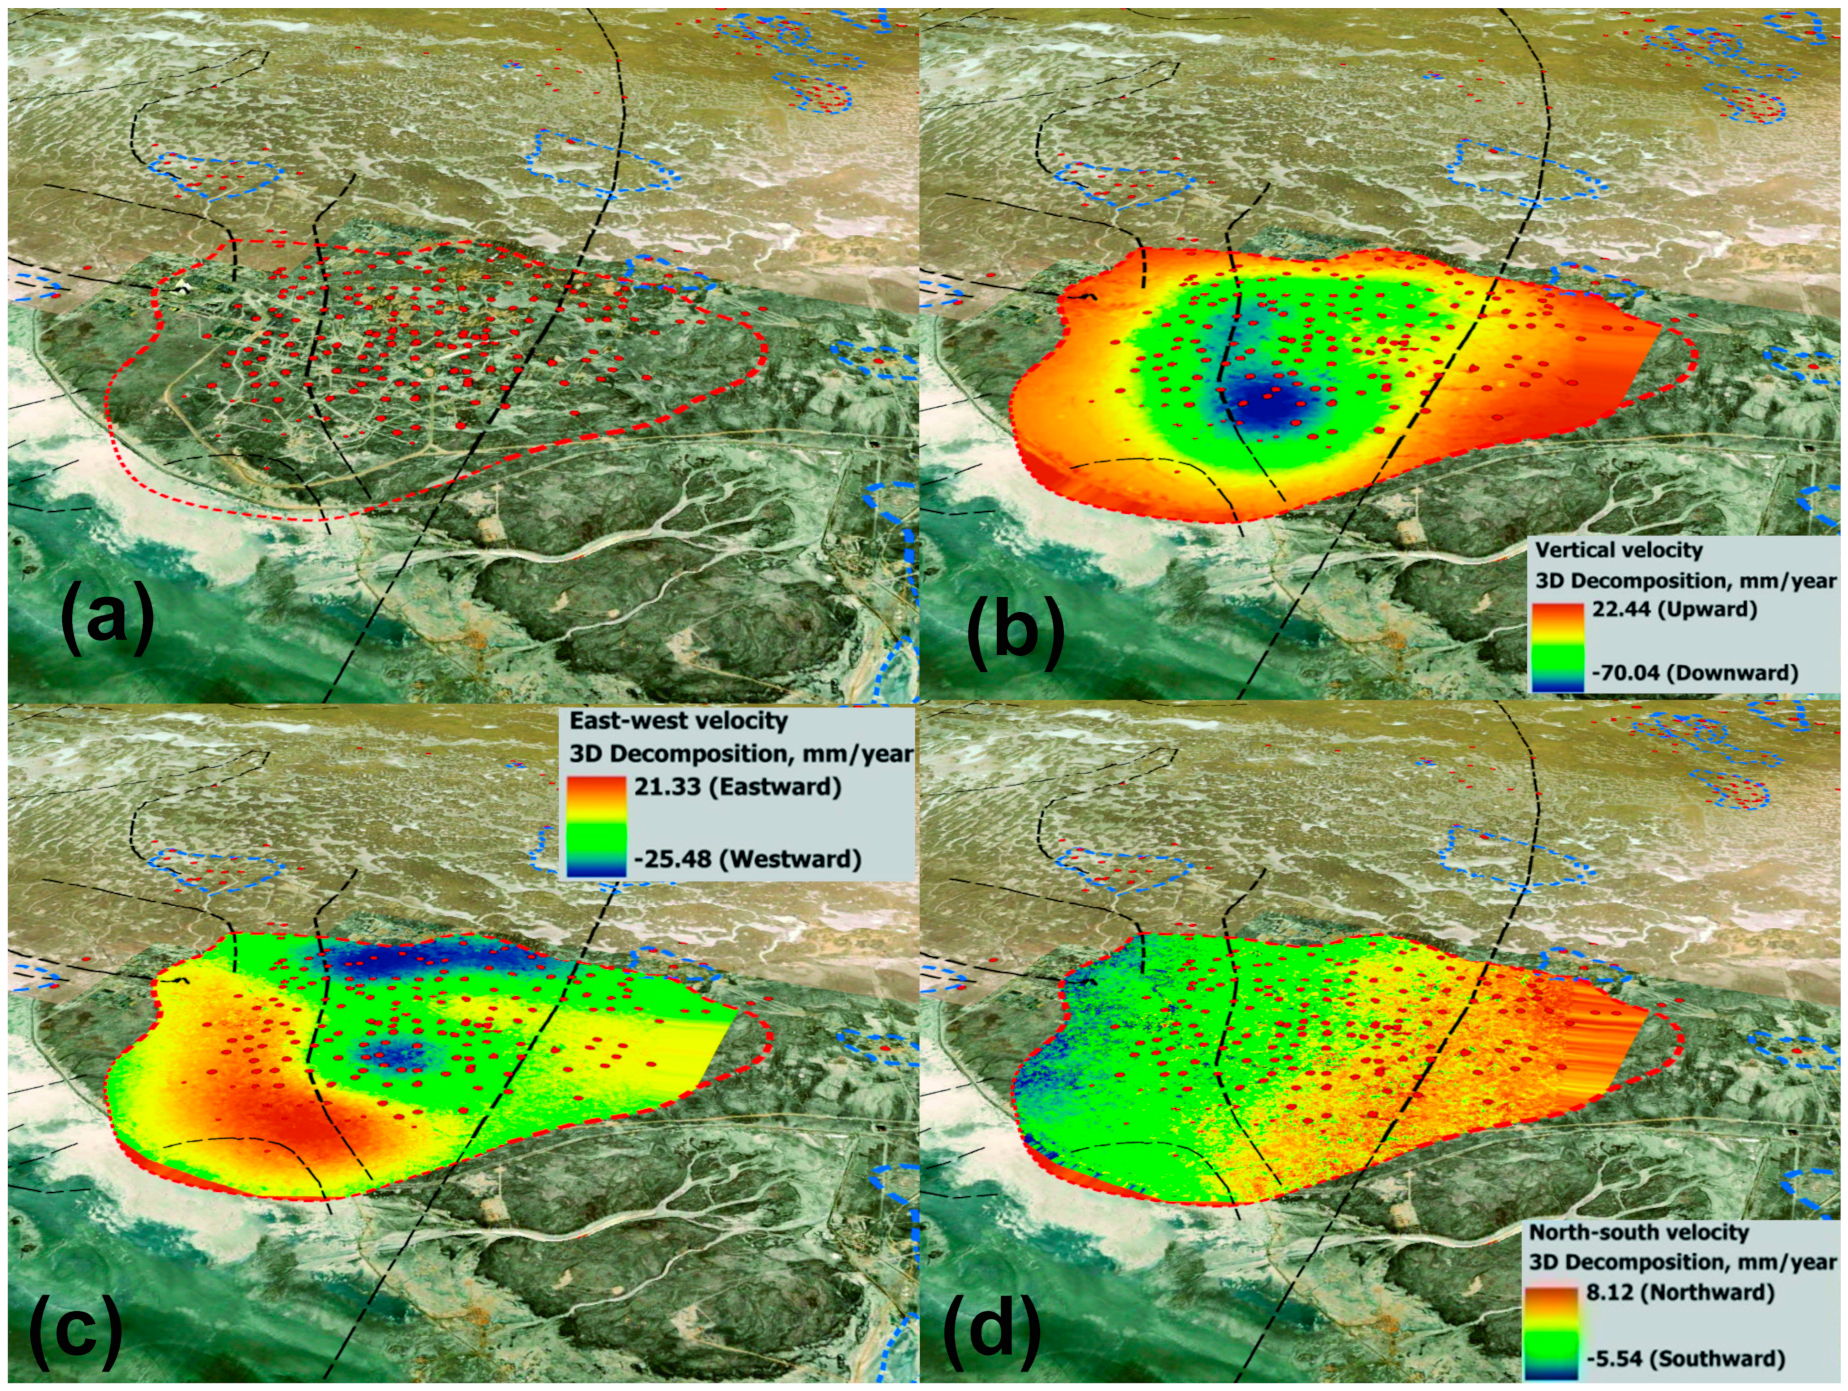
- The vertical deformation confirmed typical patterns of subsidence caused by oil extraction. Detected east-west and north-south movements at the Tengiz oilfield clearly indicated that the study area crossed by seismic faults is affected by natural tectonic processes. It has to be emphasized that the spatial patterns of east-west and north-south ground movements were observed on both sides of seismic fault crossing the detected hotspot of subsidence. It is possible to conclude that the natural tectonic process at the Tengiz field is one of the significant risk factors which might have significant consequences like induced seismicity and infrastructure failure as a result of ongoing man-made oil field exploitation.
Author Contributions
Funding
Acknowledgments
Conflicts of Interest
References
- Grebby, S.; Orynbassarova, E.; Sowter, A.; Gee, D.; Athab, A. Delineating ground deformation over the Tengizoilfield, Kazakhstan, using the Intermittent SBAS(ISBAS)DInSARalgorithm. Int. J. Appl. EarthObs. Geoinf. 2019, 81, 37–46. [Google Scholar] [CrossRef]
- Orynbassarova, E. Improvement of the method of integrated preparation and use of space images in tasks of assessment of sedimentation of industrial surface in the conditions of operation of Tengiz oil and gas field. Ph.D. Thesis, Satbayev University, Almaty, Kazakhstan, 2019. [Google Scholar]
- Bayramov, E.; Buchroithner, M.; Kada, M. Quantitative Assessment of Ground Deformations for the Risk Management of Petroleum and Gas Pipelines Using Radar Interferometry. Geomat. Nat. Hazards Risk 2020, 11, 2540–2568. [Google Scholar] [CrossRef]
- Bayramov, E.; Buchroithner, M.; Kada, M. Radar Remote Sensing to Supplement Pipeline Surveillance Programs through Measurements of Surface Deformations and Identification of Geohazard Risks. Remote. Sens. 2020, 12, 3934. [Google Scholar] [CrossRef]
- Bayramov, E.; Buchroithner, M.; Kada, M.; Bayramov, R. Quantitative assessment of ground deformation risks, controlling factors and movement trends for onshore petroleum and gas industry using satellite Radar remote sensing and spatial statistics. In Georisk: Assessment and Management of Risk for Engineered Systems and Geohazards; Taylor & Francis: London, UK, 2020. [Google Scholar] [CrossRef]
- Mirzaii, Z.; Hasanlou, M.; Samieie-Esfahany, S.; Rojhani, M.; Ajourlou, P. Land Subsidence Monitoring in Azar Oil Field Based on Time Series Analysis. Proceedings 2019, 18, 2. [Google Scholar] [CrossRef]
- Shi, J.; Yang, H.; Peng, J.; Wu, L.; Xu, B.; Liu, Y.; Zhao, B. InSAR Monitoring and analysis of ground deformation due to fluid or gas injection in Fengcheng oil field, Xinjiang, China. J. Indian Soc. Remote Sens. 2019, 47, 455–466. [Google Scholar] [CrossRef]
- Comola, F.; Janna, C.; Lovison, A.; Minini, M.; Tamburini, A.; Teatini, P. Efficient global optimization of reservoir geomechanical parameters based on synthetic aperture radar-derived ground displacements. Geophysics 2016, 81, M23–M33. [Google Scholar] [CrossRef]
- Del Conte, S.; Tamburini, A.; Cespa, S.; Rucci, A.; Ferretti, A. Advanced InSAR Technology for Reservoir Monitoring and Geomechanical Model Calibration. In Proceedings of the SPE Kuwait Oil and Gas Show and Conference, Kuwait City, Kuwait, 8–10 October 2013. [Google Scholar] [CrossRef]
- Katrenov, Z.; Tlepbergenov, N.; Flodin, E.; Buchmann, T.; Connolly, P. Mechanical Earth Modeling of the Tengiz Field. In Proceedings of the Conference Proceedings of the 2nd EAGE International Conference KazGeo, Almaty, Kazakhstan, 29–31 October 2012. [Google Scholar]
- Zhantaev, J.; Fremd, A.; Ivanchukova, A.; Kaldybayev, A.; Nurakynov, S.; Kantemirov, Y.; Nikiforov, S. Satellite radar monitoring of land surface subsidence over Tengiz oil and gas field. Geomat. Mag. 2012, 1, 61–71. (In Russian) [Google Scholar]
- Zhantayev, Z.; Kurmanov, B.; Bibosynov, A.; Fremd, A.; Ivanchukova, A. Persistent Scatterers Interferometry Technique for Urban Subsidence Monitoring in Kazakhstan Republic. ProcediaTechnol. 2014, 16, 583–587. [Google Scholar] [CrossRef][Green Version]
- Junisbekova, V.; Filatov, A.; Kuznetsova, I.; Yelisseyeva, A. SAR Interferometry Technique For Ground Deformation Assessment On Karazhanbas Oil field. Procedia Comput. Sci. 2016, 100, 1163–1167. [Google Scholar]
- Togaibekov, A.Z. Monitoring of Oil-Production-Induced Subsidence and Uplift. Master’s Thesis, Massachusetts Institute of Technology, Cambridge, MA, USA, 2020. [Google Scholar]
- Mozer, D.V.; Tuyakbai, A.S.; Toleubekova, Z.Z. State of the undermined Karaganda Coal Basin area by satellite monitoring data. J. Min. Sci. 2017, 53, 389–395. [Google Scholar] [CrossRef]
- Fuhrmann, T.; Garthwaite, M.C. Resolving Three-Dimensional Surface Motion with InSAR: Constraints from Multi-Geometry Data Fusion. Remote Sens. 2019, 11, 241. [Google Scholar] [CrossRef]
- Yang, Y.-J.; Hwang, C.; Hung, W.-C.; Fuhrmann, T.; Chen, Y.-A.; Wei, S.-H. Surface Deformation from Sentinel-1A InSAR: Relation to Seasonal Groundwater Extraction and Rainfall in Central Taiwan. Remote Sens. 2019, 11, 2817. [Google Scholar] [CrossRef]
- Fernandez, J.; Prieto, J.F.; Escayo, J.; Camacho, A.; Luzon, F.; Tiampo, K.; Palano, M.; Abajo, T.; Perez, E.; Valasco, J.; et al. Modeling the two- and three- dimensional displacement field in Lorca, Spain, subsidence and the global implications. Sci. Rep. 2018, 8, 14782. [Google Scholar] [CrossRef]
- Staniewicz, S.; Chen, J.; Lee, H.; Olson, J.; Savvaidis, A.; Reedy, R.; Breton, C.; Rathje, E.; Hennings, P. InSAR reveals complex surface deformation patterns over an 80,000 km2 oil-producing region in the Permian Basin. Geophys. Res. Lett. 2020, 47, e2020GL090151. [Google Scholar] [CrossRef]
- Even, M.; Westerhaus, M.; Simon, V. Complex Surface Displacements above the Storage Cavern Field at Epe, NW-Germany, Observed by Multi-Temporal SAR-Interferometry. Remote Sens. 2020, 12, 3348. [Google Scholar] [CrossRef]
- Liu, X.; Hu, J.; Sun, Q.; Li, Z.; Zhu, J. Deriving 3-DTime–Series Ground Deformations Induced by Underground Fluid Flows with InSAR: Case Study of Sebei Gas Fields, China. Remote Sens. 2017, 9, 1129. [Google Scholar] [CrossRef]
- Klemm, H.; Quseimi, I.; Novali, F.; Ferretti, A.; Tamburini, A. Monitoring horizontal and vertical surface deformation over a hydrocarbon reservoir by PSInSAR. First Break 2010, 28, 5. [Google Scholar] [CrossRef]
- Klein, I.; Gessner, U.; Kuenzer, C. Regional land cover mapping and changed detection in Central Asia using MODIS time-series. Appl. Geogr. 2012, 35, 219–234. [Google Scholar] [CrossRef]
- Bealessio, B.A.; Blánquez Alonso, N.A.; Mendes, N.J.; Sande, A.V.; Hascakir, B. A review of enhanced oil recovery(EOR) methods applied in Kazakhstan. Petroleum 2020, 7, 1–9. [Google Scholar] [CrossRef]
- Sokolova, I.N.; Mikhailova, N.N.; Velikanov, A.E.; Poleshko, N.N. Induced seismicity on the territory of Kazakhstan. In Book of Abstracts CTBT: Scienceand Technology Conference; CTBTO: Vienna, Austria, 2017. [Google Scholar]
- Anissimov, L.; Postnova, E.; Merkulov, O. Tengiz oilfield: Geological model based on hydrodynamic data. Petroleum Geosci. 2020, 6, 59–65. [Google Scholar] [CrossRef]
- Imamoglu, M.; Kahraman, F.; Çakir, Z.; Sanli, F.B. Ground Deformation Analysis of Bolvadin (W.Turkey) by Means of Multi-Temporal InSAR Techniques and Sentinel-1 Data. Remote Sens. 2019, 11, 1069. [Google Scholar] [CrossRef]
- Yang, C.; Zhang, D.; Zhao, C.; Han, B.; Sun, R.; Du, J.; Chen, L. Ground Deformation Revealed by Sentinel-1 MSBAS-InSAR Time-Series over Karamay Oil field, China. Remote Sens. 2019, 11, 2027. [Google Scholar] [CrossRef]
- Loesch, E.; Sagan, V. SBAS Analysis of Induced Ground Surface Deformation from Waste water Injection in East Central Oklahoma, USA. Remote Sens. 2018, 10, 283. [Google Scholar] [CrossRef]
- Farr, T.; Rosen, P.; Caro, E.; Crippen, R.; Duren, R.; Hensley, S.; Alsdorf, D. The shuttle radar topography mission. Rev. Geophys. 2007, 45. [Google Scholar] [CrossRef]
- Vassileva, M.; Tonolo, F.G.; Riccardi, P.; Lecci, D.; Boccardo, P.; Chiesa, G. Satellite SAR interferometric techniques in support to emergency mapping. Eur. J. Remote Sens. 2017, 50, 464–477. [Google Scholar] [CrossRef]
- Aslan, G.; Cakir, Z.; Lasserre, C.; Renard, F. Investigating Subsidence in the Bursa Plain, Turkey, Using Ascending and Descending Sentinel-1 Satellite Data. Remote Sens. 2019, 11, 85. [Google Scholar] [CrossRef]
- Fialko, Y. Interseismic strain accumulation and the earthquake potential on the southern San Andreas Fault system. Nature 2006, 441, 968. [Google Scholar] [CrossRef]
- Motagh, M.; Shamshiri, R.; Haghighi, M.H.; Wetzel, H.U.; Akbari, B.; Nahavandchi, H.; Roessner, S.; Arabi, S. Quantifying ground water exploitation induced subsidence in the Rafsanjan plain, Southeastern Iran, using InSAR time-series and in situ measurements. Eng. Geol. 2017, 218, 134–151. [Google Scholar] [CrossRef]
- Alatza, S.; Papoutsis, I.; Paradissis, D.; Kontoes, C.; Papadopoulos, G.A. Multi-Temporal InSAR Analysis for Monitoring Ground Deformation in Amorgos Island, Greece. Sensors 2020, 20, 338. [Google Scholar] [CrossRef] [PubMed]
- Ho Tong Minh, D.; NGO, Y.; Lê, T.T.; Le, T.C.; Bui, H.S.; Vuong, Q.V.; LeToan, T. Quantifying Horizontal and Vertical Movements in Ho Chi Minh City by Sentinel-1RadarInterferometry. Preprints 2020. [Google Scholar] [CrossRef]
- Pawluszek-Filipiak, K.; Borkowski, A. Integration of DInSAR and SBAS Techniques to Determine Mining-Related Deformations Using Sentinel-1 Data:The Case Study of Rydułtowy Mine in Poland. RemoteSens. 2020, 12, 242. [Google Scholar]
- Aslan, G. Monitoring of Surface Deformation in Northwest Turkey from High-Resolution Insar: Focus on Tectonic Aseismic Slip and Subsidence. Tectonics. Ph.D. Thesis, ISTANBUL Tekniküniversitesi, Istanbul, Turkey, 2019. Available online: https://tel.archives-ouvertes.fr/tel-02271771/document (accessed on 1 July 2021).
- Chang, Z.; Yu, W.; Wang, W.; Zhang, J.; Liu, X.; Zhu, J. An approach for accurately retrieving the vertical deformation component from two track InSAR measurements. Int. J. Remote Sens. 2017, 38, 1702–1719. [Google Scholar] [CrossRef]
- Hanssen, R.F. Radar Interferometry: Data Interpretation and Error Analysis; Kluwer Academic Publishers: Dordrecht, The Netherlands, 2001. [Google Scholar]
- Gee, D.; Sowter, A.; Novellino, A.; Marsh, S.; Gluyas, J. Monitoring land motion due to natural gas extraction: Validation of the Intermittent SBAS(ISBAS) DInSAR algorithm over gas fields of North Holland, TheNetherlands. Mar. Pet. Geol. 2016, 77, 1338–1354. [Google Scholar] [CrossRef]
- Rocca, F.; Rucci, A.; Ferretti, A.; Bohane, A. Advanced InSAR interferometry for reservoir monitoring. First Break 2013, 31, 77–85. [Google Scholar] [CrossRef]
- Ferretti, A.; Tamburini, A.; Novali, F.; Fumagalli, A.; Falorni, G.; Rucci, A. Impact of high resolution radar imagery on reservoir monitoring. Energy Procedia 2011, 4, 3465–3471. [Google Scholar] [CrossRef]
- Tamburini, A.; Bianchi, M.; Giannico, C.; Novali, F. Retrieving Surface Deformation by PSInsar™ Technology: A Powerful Tool in Reservoir Monitoring. Int. J. Greenh. Gas.Control. 2010, 4, 928–937. [Google Scholar] [CrossRef]
- Ferretti, A.; Prati, C. Rocca, F. Nonlinear Subsidence Rate Estimation Using Permanent Scatterers in Differential SAR Interferometry. IEEE Trans.Geosci. Remote. Sens. 2000, 38, 2202–2212. [Google Scholar] [CrossRef]
- Ferretti, A.; Prati, C.; Rocca, F.; Casagli, N.; Farina, P.; Young, B. Permanent Scatterers Technology: A Powerful State of the art Tool for Historic and Future Monitoring of Landslides and Other Terrain Instability Phenomena. In Proceedings of the International landslide Symposium–ISL2005, London, UK, 31 May–3 June 2005. [Google Scholar]
- Ferretti, A.; Savio, G.; Barzaghi, R.; Borghi, A.; Musazzi, S.; Novali, F.; Prati, C.; Rocca, F. Submillimeter Accuracy of InSAR Time Series:Experimental Validation. IEEETrans. Geosci. Remote Sens. 2007, 45, 1142–1153. [Google Scholar] [CrossRef]
- Lauknes, T.R.; Dehls, J.; Larsen, Y.; Høgda, K.A.; Weydahl, D.J. Acomparison of SBAS and PSERSInSAR for subsidence monitoring inOslo, Norway. In Proceedings of the Fringe 2005 Workshop, ESA ESRIN, Frascati, Italy, 28 November–2 December 2005. [Google Scholar]
- Hooper, A. Persistent Scatterer Radar Interferometry for Crustal Deformation Studies and Modeling of Volcanic Deformation. Ph.D. Thesis, Stanford University, Stanford, CA, USA, 2006. [Google Scholar]
- Zhou, W.; Chen, G.; Li, S.; Ke, J. InSAR Application in Detection of Oilfield Subsidence on Alaska North Slope. In Proceedings of the 41st US Symposiumon Rock Mechanics (USRMS), Golden, CO, USA, 17–21 June 2006. [Google Scholar]


Publisher’s Note: MDPI stays neutral with regard to jurisdictional claims in published maps and institutional affiliations. |
© 2021 by the authors. Licensee MDPI, Basel, Switzerland. This article is an open access article distributed under the terms and conditions of the Creative Commons Attribution (CC BY) license (https://creativecommons.org/licenses/by/4.0/).
Share and Cite
Bayramov, E.; Buchroithner, M.; Kada, M.; Zhuniskenov, Y. Quantitative Assessment of Vertical and Horizontal Deformations Derived by 3D and 2D Decompositions of InSAR Line-of-Sight Measurements to Supplement Industry Surveillance Programs in the Tengiz Oilfield (Kazakhstan). Remote Sens. 2021, 13, 2579. https://doi.org/10.3390/rs13132579
Bayramov E, Buchroithner M, Kada M, Zhuniskenov Y. Quantitative Assessment of Vertical and Horizontal Deformations Derived by 3D and 2D Decompositions of InSAR Line-of-Sight Measurements to Supplement Industry Surveillance Programs in the Tengiz Oilfield (Kazakhstan). Remote Sensing. 2021; 13(13):2579. https://doi.org/10.3390/rs13132579
Chicago/Turabian StyleBayramov, Emil, Manfred Buchroithner, Martin Kada, and Yermukhan Zhuniskenov. 2021. "Quantitative Assessment of Vertical and Horizontal Deformations Derived by 3D and 2D Decompositions of InSAR Line-of-Sight Measurements to Supplement Industry Surveillance Programs in the Tengiz Oilfield (Kazakhstan)" Remote Sensing 13, no. 13: 2579. https://doi.org/10.3390/rs13132579
APA StyleBayramov, E., Buchroithner, M., Kada, M., & Zhuniskenov, Y. (2021). Quantitative Assessment of Vertical and Horizontal Deformations Derived by 3D and 2D Decompositions of InSAR Line-of-Sight Measurements to Supplement Industry Surveillance Programs in the Tengiz Oilfield (Kazakhstan). Remote Sensing, 13(13), 2579. https://doi.org/10.3390/rs13132579