Communication

TWC-Net: A SAR Ship Detection Using Two-Way Convolution and Multiscale Feature Mapping

1
College of Information and Communication Engineering, Harbin Engineering University, Harbin 150001, China
2
Key Laboratory of Advanced Marine Communication and Information Technology, Ministry of Industry and Information Technology, Harbin Engineering University, Harbin 150001, China
3
College of Computer Science and Technology, Harbin Engineering University, Harbin 150001, China
*
Author to whom correspondence should be addressed.
Remote Sens. 2021, 13(13), 2558; https://doi.org/10.3390/rs13132558
Submission received: 7 May 2021 / Revised: 15 June 2021 / Accepted: 26 June 2021 / Published: 30 June 2021
(This article belongs to the Section Remote Sensing Image Processing)

Abstract

:
Synthetic aperture radar (SAR) is an active earth observation system with a certain surface penetration capability and can be employed to observations all-day and all-weather. Ship detection using SAR is of great significance to maritime safety and port management. With the wide application of in-depth learning in ordinary images and good results, an increasing number of detection algorithms began entering the field of remote sensing images. SAR image has the characteristics of small targets, high noise, and sparse targets. Two-stage detection methods, such as faster regions with convolution neural network (Faster RCNN), have good results when applied to ship target detection based on the SAR graph, but their efficiency is low and their structure requires many computing resources, so they are not suitable for real-time detection. One-stage target detection methods, such as single shot multibox detector (SSD), make up for the shortage of the two-stage algorithm in speed but lack effective use of information from different layers, so it is not as good as the two-stage algorithm in small target detection. We propose the two-way convolution network (TWC-Net) based on a two-way convolution structure and use multiscale feature mapping to process SAR images. The two-way convolution module can effectively extract the feature from SAR images, and the multiscale mapping module can effectively process shallow and deep feature information. TWC-Net can avoid the loss of small target information during the feature extraction, while guaranteeing good perception of a large target by the deep feature map. We tested the performance of our proposed method using a common SAR ship dataset SSDD. The experimental results show that our proposed method has a higher recall rate and precision, and the F-Measure is 93.32%. It has smaller parameters and memory consumption than other methods and is superior to other methods.

1. Introduction

Remote sensing, which is based on aerospace photography, plays an important role in resource management and disaster measurement. It is the only way to provide global dynamic observation data so far. In ship detection, using this technology can quickly collect ship information on the ocean surface, which has an important application in the protection of marine safety [1,2]. Because of the great difference between remote sensing images and ordinary optical images, remote sensing image processing is a challenging task.
SAR has the characteristics of all-day and all-weather operation, which is not affected by weather, such as cloud and fog, and can image in a large area. It has unique advantages in the military and civil fields and can perform better than other remote sensing methods in some cases. The application of ship detection based on SAR has appeared for a long time. The ship SAR image has the characteristics of small targets, sparse ship, and large noise interference. The generated SAR images not only have the characteristics of optical images but also have complex electromagnetic characteristics. Therefore, it is difficult to process the ship’s SAR images based on SAR.
Because the target of an SAR ship image is small and different from the ordinary image, it is difficult to get the best result by using the target detection structure designed according to the ordinary image directly. Therefore, according to the characteristics of the SAR image, we designed TWC-Net. TWC-Net has a feature extraction structure different from the residual network (ResNet) [3]. It uses a two-way convolution method to learn more feature information through fewer convolution layers, reduce residual connection, and save computing memory. Affected by the design idea of CrevNet [4], this module is a variant of CrevNet feature extraction.
The effectiveness of the method is verified on the SAR ship data set SSDD [5]. The experimental results show that this method has good performance in precision, recall, and F-Measure score for small targets in SAR ships and targets with interference onshore. In addition, this method has a smaller memory and faster operation speed. The main contributions of this paper are as follows:
  • To solve the problem that the traditional backbone has insufficient ability to extract SAR features and make the network extract SAR features more effectively, a convolution model based on a two-way structure is designed. The model makes the feature be used more effectively in the model through the information exchange between the upper and lower channels, reduces the loss of information, realizes the use of fewer parameters to learn more useful information, and reduces the overfitting of the model.
  • We design a multi-scale mapping output structure to make more effective use of feature information at different scales. The different outputs of the structure correspond to the results of the feature maps of different positions of the backbones. After simple processing of feature maps, the next step of detection can be conducted, which improves the detection ability of the model for ships of different sizes.
The rest of this paper is organized as follows. The second part introduces the related work. The third part introduces the specific implementation details of TWC-Net. The fourth part introduces the dataset composition and settings, TWC-Net and other models perform ship detection experiments based on the dataset, and provide different comparative experiments and results. The fifth part analyzes the different results, and finally, the sixth part summarizes the full text.

2. Related Work

The traditional method of SAR ship image processing, it is based on the mathematical distribution of the image itself. The constant false alarm rate (CFAR) detection algorithm is one of the most widely used algorithms. It detects ship targets by modeling the statistical distribution of background clutter information. Gamma-based global CFAR [6] and global CFAR [7] sliding window based on distribution are relatively simple algorithms and faster speeds. However, the traditional method has high artificial design characteristics, poor adaptability to the changing environment, and it is difficult to further improve the accuracy. The application of the convolution neural network in common image processing has achieved good results [3,8,9]. Therefore, the convolutional neural network is gradually applied in remote sensing image processing [10,11]. The main advantages of neural networks are high precision, good adaptability to the environment, and the ability to deal with more complex information.
In the aspect of feature extraction of neural networks, Duta et al. [12] proposed the idea of the pyramid convolution, which increased the receptive field of the backbone, and then the pyramid idea made great progress. Lin et al. [13] proposed a feature pyramid network (FPN) that can fuse multi-scale information and applied it to target detection. Ghaisi et al. [14] proposed neural architecture search (NAS) FPN by using network search technology. The object detection method based on the convolutional neural network is divided into two structures: two-stage target detection and one-stage target detection. The main structures of two-stage detection methods include candidate region extraction, regional target detection, and category prediction. These algorithms include Fast RCNN, Faster RCNN, R-FCN, etc. [15,16,17]. The structure using the two-stage detection method has high accuracy but because its structure has more processing steps, it will consume more time in target detection. The structure of one-stage target detection integrates candidate region extraction and target detection prediction. Compared with the two-stage target detection network, the one-stage target detection network has a simpler structure, so it is better than the two-stage target detection network in running speed. Such an algorithm includes SSD, you only look once (YOLO), and so on [18,19]. Due to the lack of an independent region proposal extraction module in its structure, the accuracy of the one-stage structure is lower than that of the two-stage structure. RetinaNet [20] is mainly about the application of focal loss. The author thinks that the accuracy of the one-stage target detection structure is not as good as that of the two-stage target detection structure because of the imbalance of samples. The new loss function avoids the impact of sample imbalance on the results as much as possible through the loss constraint of different samples, the detection accuracy of one-stage target detection structure is higher than that of the two-stage target detection structure.
With the application of deep learning in remote sensing images, its effectiveness has proved an increasing amount, so many researchers begin applying it to ship detection in SAR images. Chen et al. [21] used a visual geometry group (VGG) network for ship detection and achieved a good detection effect. To apply the idea of two-stage detection to SAR ship detection, Zhou et al. [22] improved Faster RCNN and achieved better detection accuracy. Researchers have favored one-stage detection because of its fast detection speed. Tang et al. [23] used SAR image denoising to improve the detection of SAR image in a high noise environment and achieved good results. Chen et al. [24] proposed the separation attention module to improve the detection effect of YOLOv3 in remote sensing images. Wang et al. [25] proposed a full neural network based on Gaussian heat map regression, which has a good effect on remote sensing images. The detection network for processing common images has many parameters and is easy to overfit. To reduce the number of parameters, Cozzolino et al. [26] proposed a small network to realize SAR target detection. Jin et al. [27] proposed a "pixel block to pixel block" convolution neural network for small ship detection in SAR images. The network adopts a four-layer dense block structure with the crop, combines with multilayer features to enhance the sensitivity of the network to small targets, introduces hole convolution to increase the receptive field, reduces the false alarm rate, and achieves a good detection effect. Chang et al. [28] proposed an improved version of YOLOv2 for SAR image processing. They merged some of the convolution layers of YOLOv2 to achieve faster detection. Lin et al. [29] proposed a method for context feature fusion and proposed a new module to suppress redundant subfeature maps, which achieved good detection results. Kang et al. [30] proposed the fusion of multi-scale feature information with the ROI feature, to process the detection network at the same time, to achieve the utilization of multi-scale information, and to improve the network detection performance. Cui et al. [11] proposed a dense connected attention pyramid structure, which overcomes the shortcomings of the traditional pyramid in feature usage. They make full use of the SAR image features of network learning and enhances the recognition ability of the model for small and clutter-jamming targets.

3. Methods

In this section, we will describe the details of TWC-Net structure and its application in SAR ship detection. Experiments by Duta et al. [10] show that in feature extraction, the deep convolution layer is more sensitive to large targets, and the shallow convolution layer is more sensitive to small targets. To realize the effective detection of small targets, it is necessary to use the shallow features more and detect the small target information at the feature layer with better induction. Therefore, to meet the corresponding information output of different scale features, TWC-Net has five output channels. We hope to realize the detection of the small target and large target, respectively, through multi-scale feature output and judge whether it is a ship target according to the predicted score of different scale features. SAR image has the characteristics of sparsity, and the positive and negative samples are unbalanced. We use the focal loss as the loss function to overcome this problem and realize the target detection of SAR ships.

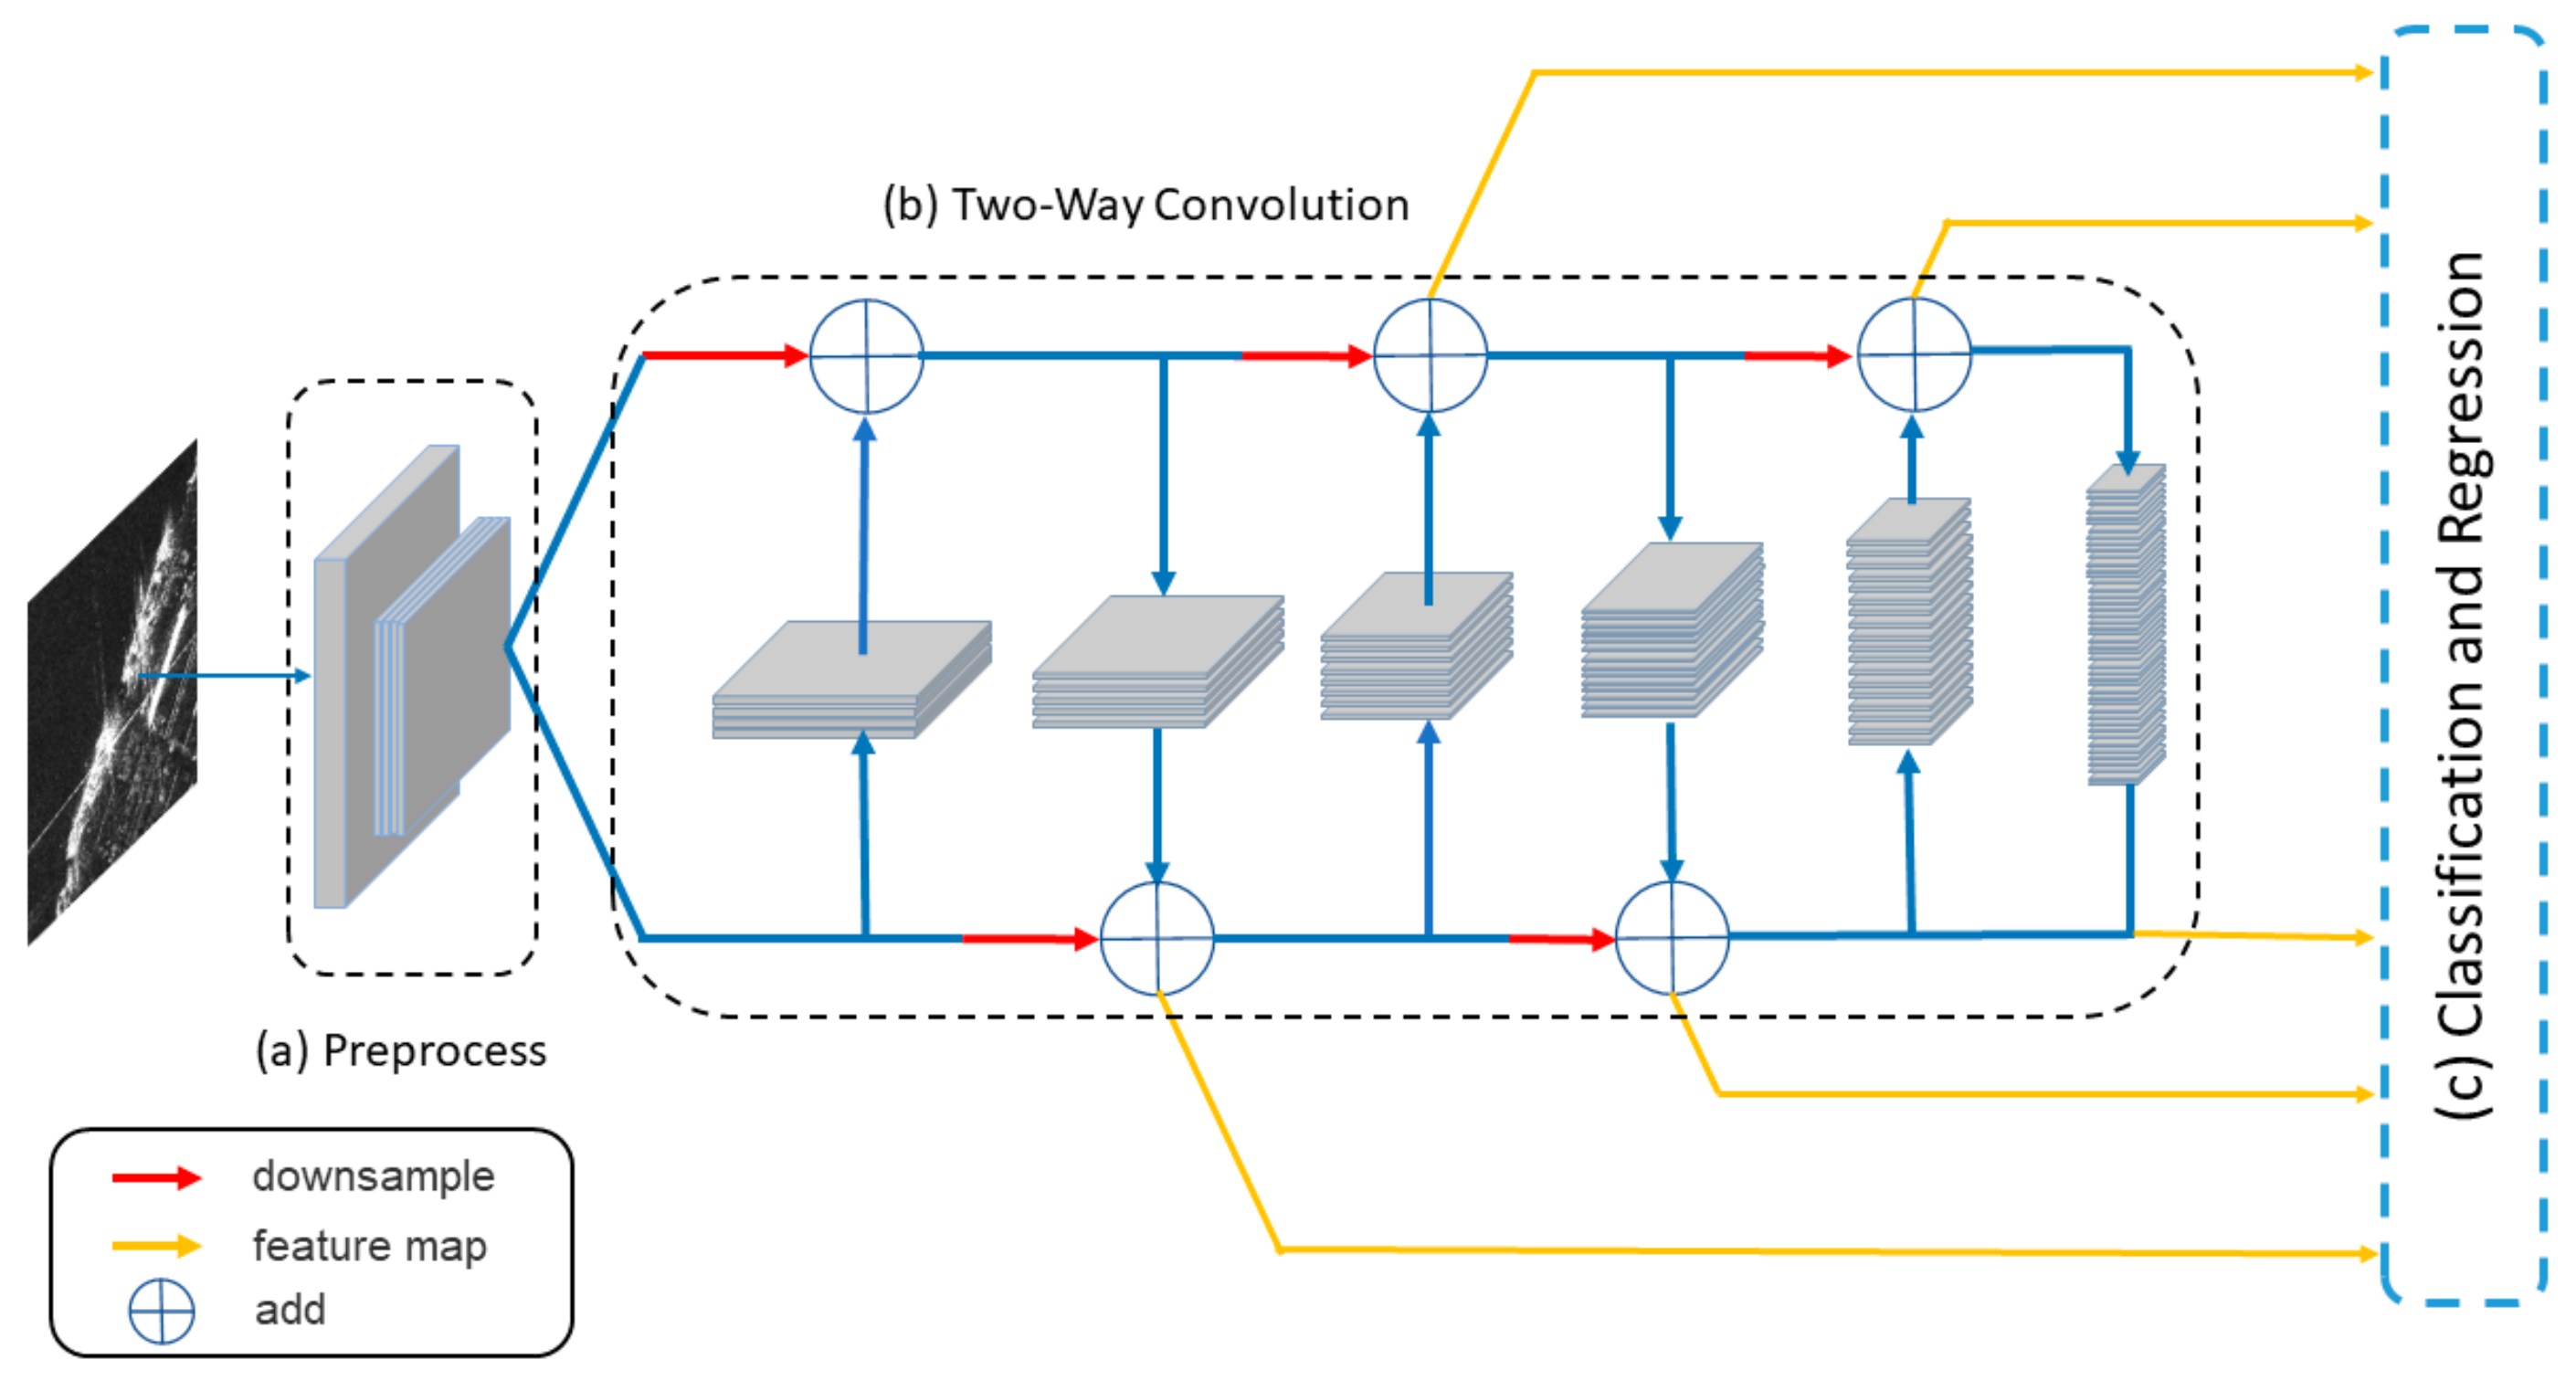
3.1. Network Architecture

TWC-Net is mainly composed of three parts: preprocess, two-way convolution, classification and regression, as shown in Figure 1. The size of the TWC-Net input SAR image is 600 × 600. The main function of the preprocessing module is to preprocess the input image, which is composed of the convolution and max-pooling. Because of the large noise in SAR images, the preprocessing module can effectively remove part of the noise and create better quality conditions for feature extraction. The two-way convolution module presents a rectangular structure, and the middle part of the rectangle is a convolution structure for feature extraction. The upper and lower blue arrows are the flow path of feature information. The feature output is conducted at different positions of the rectangle to realize the information collection of five scales so that the feature map covers the shallow to deep information. The collected multi-scale information is input into the classification and region module for post-processing, and the anchor is used to classify the categories. The classification network predicts the category probability of each anchor, and the category-independent fully convolutional networks are used for border regression. The classification sub network and border regression sub network share the same structure, and the parameters are independent. The final result is obtained by filtering the prediction box with non-maximum suppression.

3.2. Preprocess, Two-Way Convolution Structure, and Multi Scale Feature Extraction

For the preprocess module of TWC-Net, the main implementation details are shown in Figure 2. In this figure, “conv” is convolution, “batch norm” is batch normalization, and “ReLU” is the rectified linear unit. First, the convolution kernel with a size of 7 is used for preliminary processing, and then through the batch normalization module and rectified linear unit, finally, the max-pooling is performed. The size of the max-pooling kernel is 3, and the stride is 2, after that, two copies of the feature map are copied for the next step. The early-stage preprocessing can suppress the image noise, highlight effective information, and facilitate subsequent processing of the model.
Inspired by the autoencoder of CrevNet, the two-way convolution structure is a variant of CrevNet. The two-way convolution structure is mainly used to extract SAR image features, as shown in Figure 3. In the convolution process, to extract higher-level information of the SAR image, we use the convolution layer added step by step. In the two-way convolution structure, the middle part of the upper and lower circuits is the main module of convolution extraction features, which is composed of a convolution structure with a convolution kernel size of 1 and 3. After the convolution part of the middle feature extraction, the size of the feature map will be reduced by half. At this time, the fusion with the feature map on the road will cause dimension mismatch. Therefore, in Figure 3, the feature map on the road will be downsampled once, to make the size of the feature map on the road consistent with the size of the feature map extracted by middle convolution feature extraction and conducting feature fusion. Figure 3 shows more details about a single two-way convolution module. For the down-sampling module, we use a convolution kernel of size 1 and batch normalization, which is inspired by the shortcut module of Resnet. The middle feature extraction is achieved by stacking three convolution layers. Finally, the stacked convolution feature map is added with the downsampled feature map, and the rectified linear unit activation function is used uniformly.
For a better understanding, let us assume that the feature map of two way revolutions is X b o t t o m C × H × W , where C is the number of channels, H is the height of the feature map, and W is the width of the feature map. All convolutions in the middle layer are denoted by F c o n v . According to the structure of Figure 3, X b o t t o m C × H × W after F c o n v is denoted as X b o t t o m C × H / 2 × W / 2 . The whole process can be summarized as follows:
X b o t t o m = F c o n v ( X b o t t o m )
The upper path feature map of two-way convolution is X t o p C × H × W . Here, the size of X t o p is twice that of X b o t t o m C × H / 2 × W / 2 ; therefore, it is necessary to reduce the size of the upper path feature map by down sampling. Down sampling is set to F d o w n s a m p l e . The whole process can be summarized as follows:
X t o p = F down s a m p l e ( X t o p )
Finally, the feature maps with the same size are obtained, and then merged. The merged feature maps are marked as X c o m b i n e . The process is summarized as follows:
X c o m b i n e = X t o p + X b o t t o m
The two-way convolution module is composed of several structures, as shown in Figure 3.
In the design of TWC-Net, for every feature extraction, the size of the feature map is reduced by half and the number of channels is doubled, except for the first feature extraction. For the first feature extraction, the size of the feature map is unchanged, and the number of channels is doubled because the feature map with an unchanged size can retain more shallow information, and the number of channels can extract more detailed information for classification and regression calculation. As shown in the two-way convolution module in Figure 1, a total of six feature extractions are made. After six feature extractions, the size of the feature map, from left to right, is 75 × 75, 75 × 75, 38 × 38, 19 × 19, 10 × 10, and 5 × 5, and the corresponding number of channels is 64, 128, 256, 512, 1024, 2048.
In the two-way convolution module, we design a multi-scale feature mapping structure to achieve effective reuse of shallow and deep features. This module is different from the pyramid structure in the structure. We do not use too complex a pyramid convolution structure design, because the too complex design will reduce the speed of the model. We combine the main idea of a pyramid structure, that is, multi-scale information utilization. TWC-Net uses five feature maps of different locations as feature information of different scales. The sizes of these feature maps are 75 × 75, 38 × 38, 19 × 19, 10 × 10, and 5 × 5, respectively. The five output structures are respectively located in the right branch of the two-way convolution module, and the specific structure is shown in Figure 4. For the output features of the multi-scale structure, we use a convolution kernel of size 1 to process, so that the fused features can be better processed by the classification and regression module.

3.3. Classification and Regression

The classification and regression module adopts the method of RetinaNet, as shown in Figure 5. Each anchor box is associated with a one-hot vector of the category number and a four-dimensional vector to perform border regression. The classification subnetwork predicts the category probability of each anchor box, and the regression subnetwork performs border regression. In TWC-Net, we define the anchor number as 9, and the anchor size is 32 × 32, 64 × 64, 128 × 128, 256 × 256, 512 × 512. Although most of the ships in the SAR image are slim, because their distribution direction is not uniform, using the slim anchor is not a good choice for target detection boxes without direction, so the anchor ratio in TWC-Net is 0.5, 1, 2.
To solve the problem of imbalance between positive and negative samples of SAR image, the focal loss is used to replace the cross-entropy loss function in the classification subnetwork. Focal loss is defined as follows:
L c l s = F L p t = α t 1 p t γ log p t
where α t [ 0 , 1 ] is the weighting factor and γ [ 0 , 5 ] is the adjustable parameter. It is used to control the influence of positive and negative samples on total loss. Here, p t is defined as:
p t = p if   y = 1 1 p otherwise
where p [ 0 , 1 ] is the prediction probability. For SAR image processing, setting α = 0.25 , γ = 2 has the best effect. By setting the above parameters, we can make the model tend to the mining of difficult samples. For the box subnet module, smooth L 1 is used for border regression. Smooth L 1 is defined as:
L r e g = S mooth   L 1 ( t ) = 0.5 t 2 if   | t | < 1 | t | 0.5 otherwise
Thus, the loss function of TWC-Net can be expressed as:
L T W C N e t = L c l s + L r e g

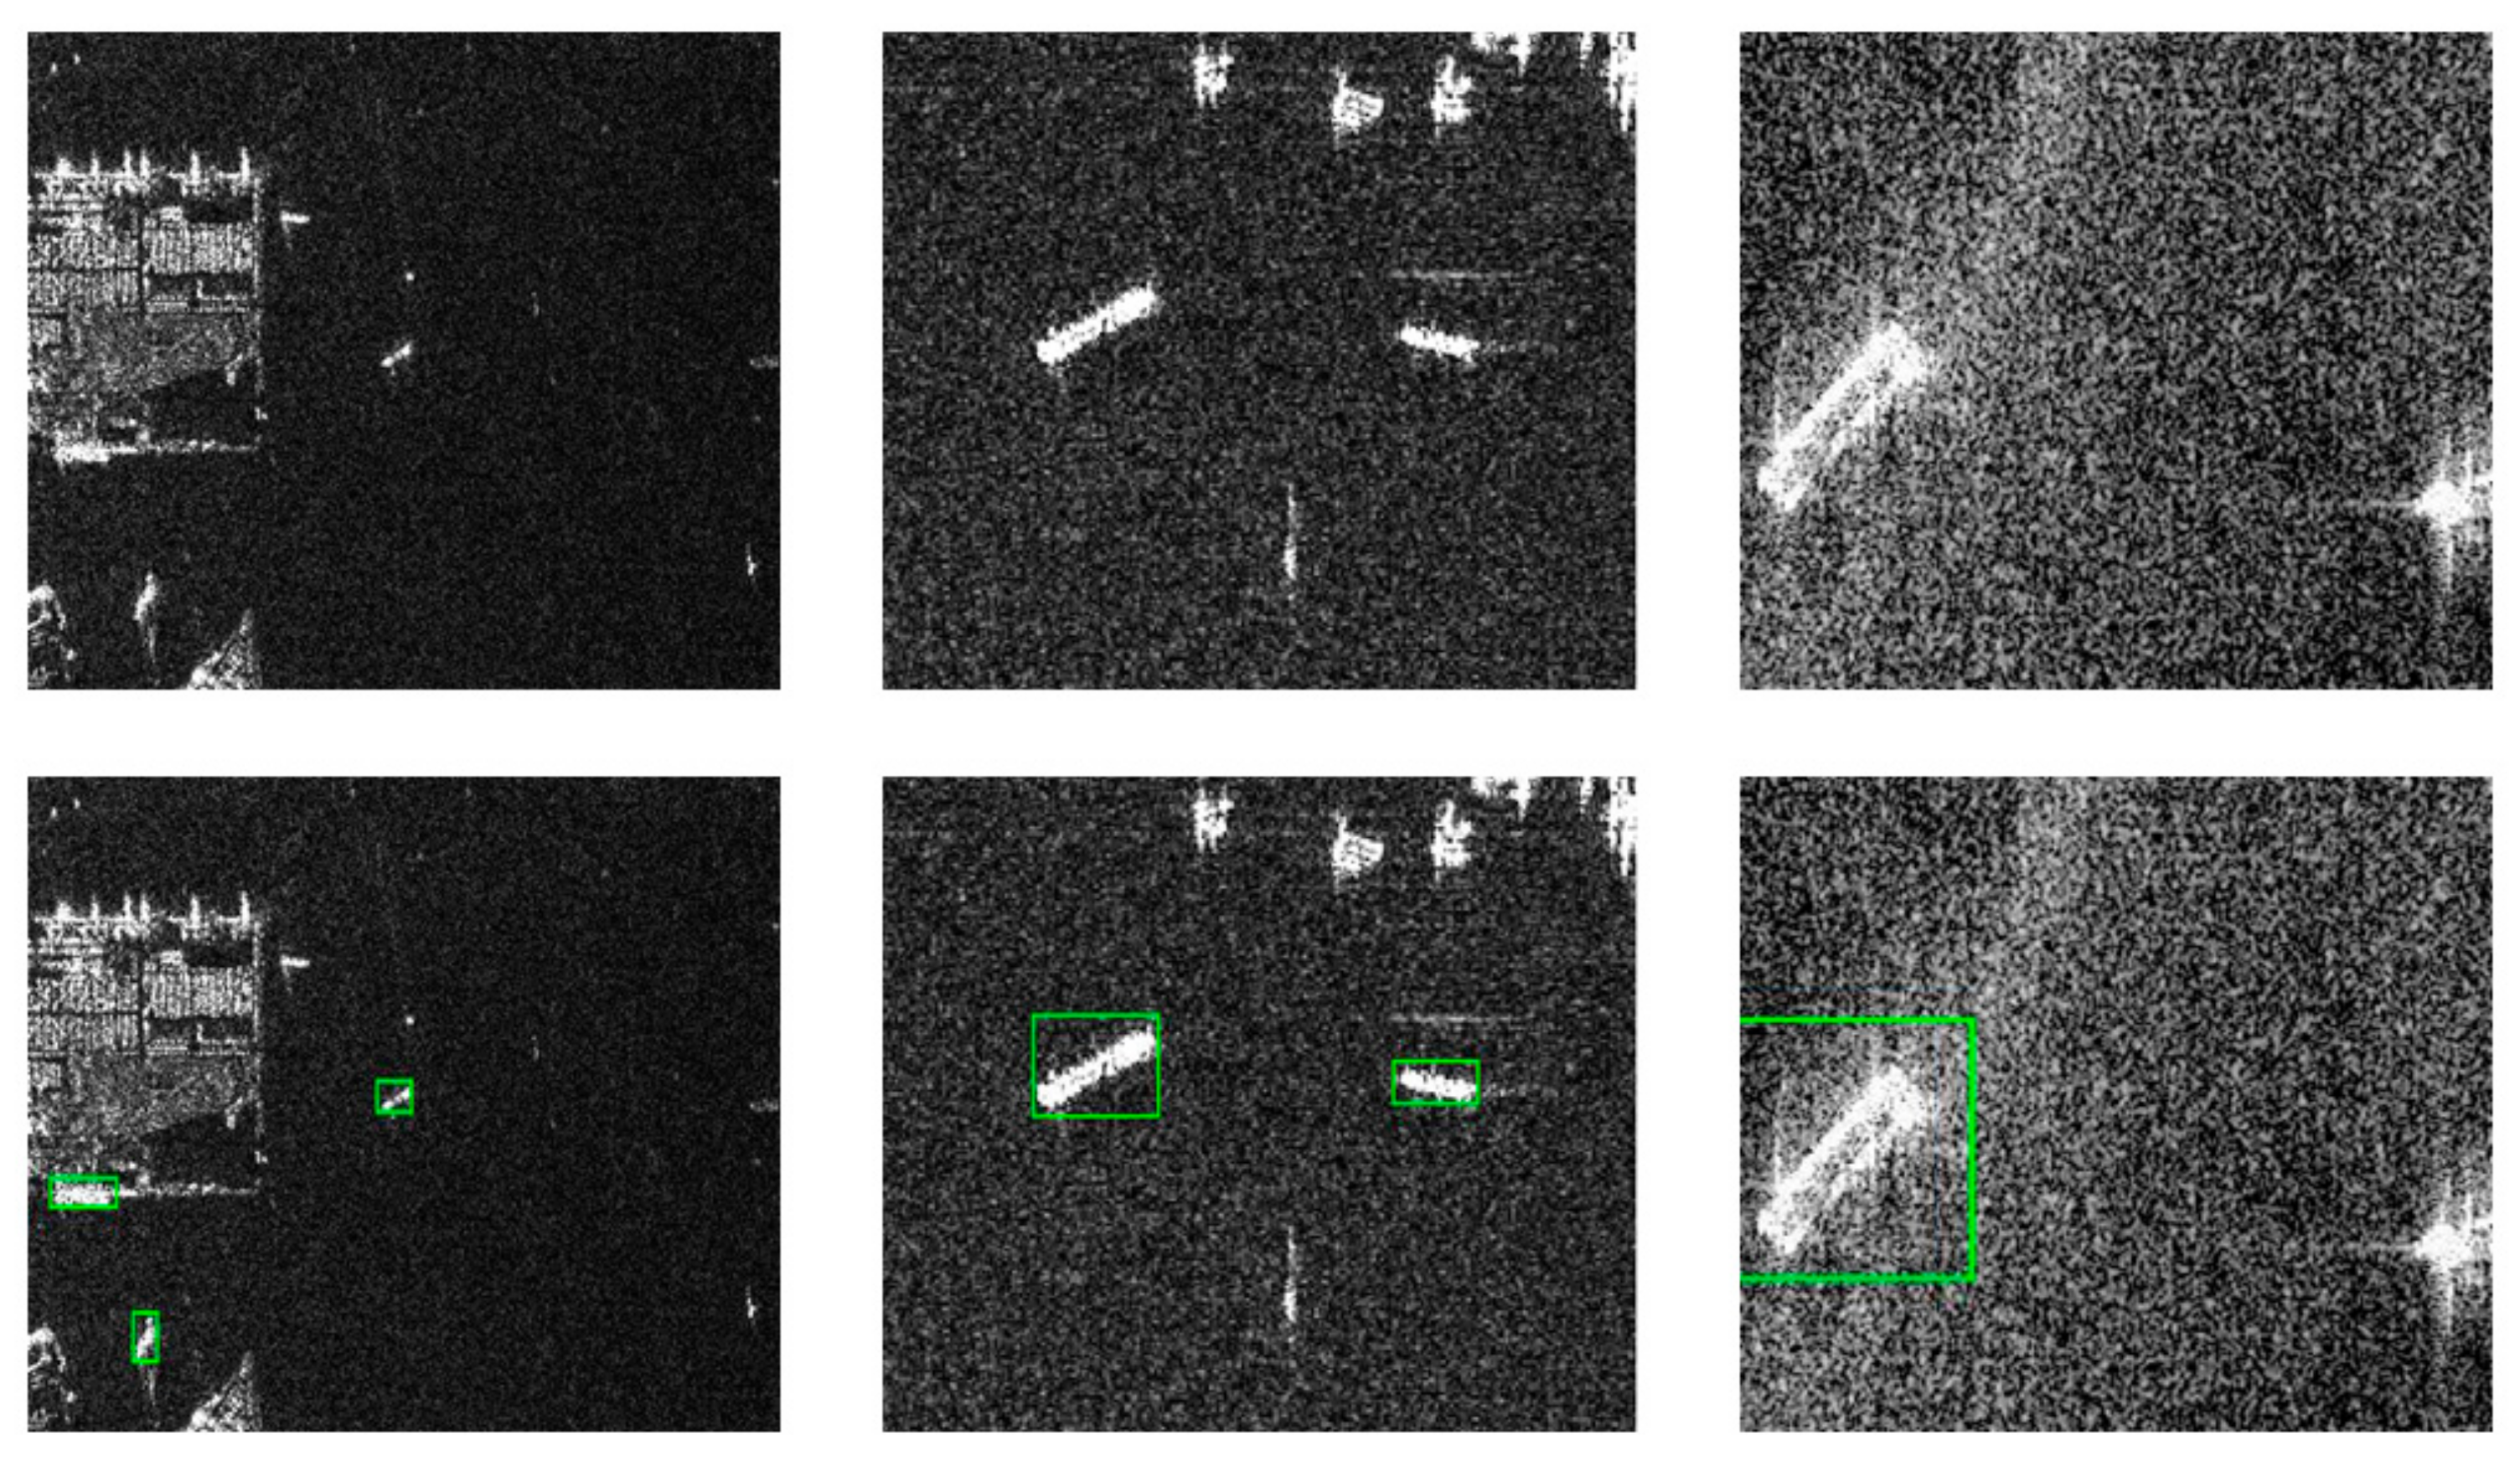
4. Experiments and Results

To test the performance of our proposed model, we will compare it with other models. This section describes the datasets used in the evaluation, evaluation criteria, comparison methods, and comparison results.

4.1. Datasets

The performance test mainly uses the SSDD dataset, which contains 1160 SAR images and 2456 ships, mainly from RadarSat-2, TerraSAR-X, and Sentinel-1. It contains four polarization modes: HH, HV, VV, and VH. The resolution is 1-15m. There are ship targets in large sea areas and coastal areas. Some data are shown in Figure 6, which are ship targets in large sea areas, ship targets in coastal areas, and ship targets in a complex background. The experiment classified 954 randomly divided images into training and validation sets, and the remaining 206 images as test sets. To ensure the consistency of variables, all models in this test use uniformly divided training, validation, and test sets.

4.2. Evaluation Indicators

Quantitative evaluation of the model, and evaluation of the model using the precision rate and recall rate is performed. Precision defines the ratio of the correct target to the number of detected targets, and recall defines the ratio of the correct target to the actual number of detected targets. The recall rate and the precision rate are usually contradictory measures. More cautious models tend to obtain higher precision, but the recall rate will be lower. On the contrary, a lower precision rate will be obtained. In the case of an imbalance between recall and precision, we add an F-measure index to measure recall and precision. The calculation method is as follows:
Precision   = T P T P + F P
Recall   = T P T P + F N
F   measure   = 2 Precision   ×   Recall Precision   +   Recall
where T P is true positive, F P is false positive, and F N is false negative. In this test, if the IOU between the prediction frame and the real frame is higher than 0.5, it is defined as T P . If the IOU is lower than 0.5, it is defined as F P , and if it is not detected, it is defined as F N .

4.3. Implementation Details

For the experimental platform, we used an Intel Core i7-8700k, 3.7 GHz six-core processor, 32 g memory, NVIDIA GeForce GTX 1080ti 11 g graphics card. In terms of the software environment, we used Windows 7 Ultimate 64-bit operating system. The programming language used was python 3.7, and the deep learning framework was used in PyTorch 1.6.0. THOP 0.0.31 was used to calculate floating point operations (FLOPs) and parameters. The GPU computing platform is CUDA 10.0 and cuDNN 7.4. TWC-Net uses the stochastic gradient descent (SGD) optimizer with an initial learning rate of 1 × 10⁻³, optimizer momentum of 0.9, weight decay of 5 × 10⁻⁴, and learning rate decay of 0.8. The training mode is overall training, and there is no need to freeze partial weights to train separately. The image data sizes were different in the experiment, so they were uniform to 600 × 600 before the input model.

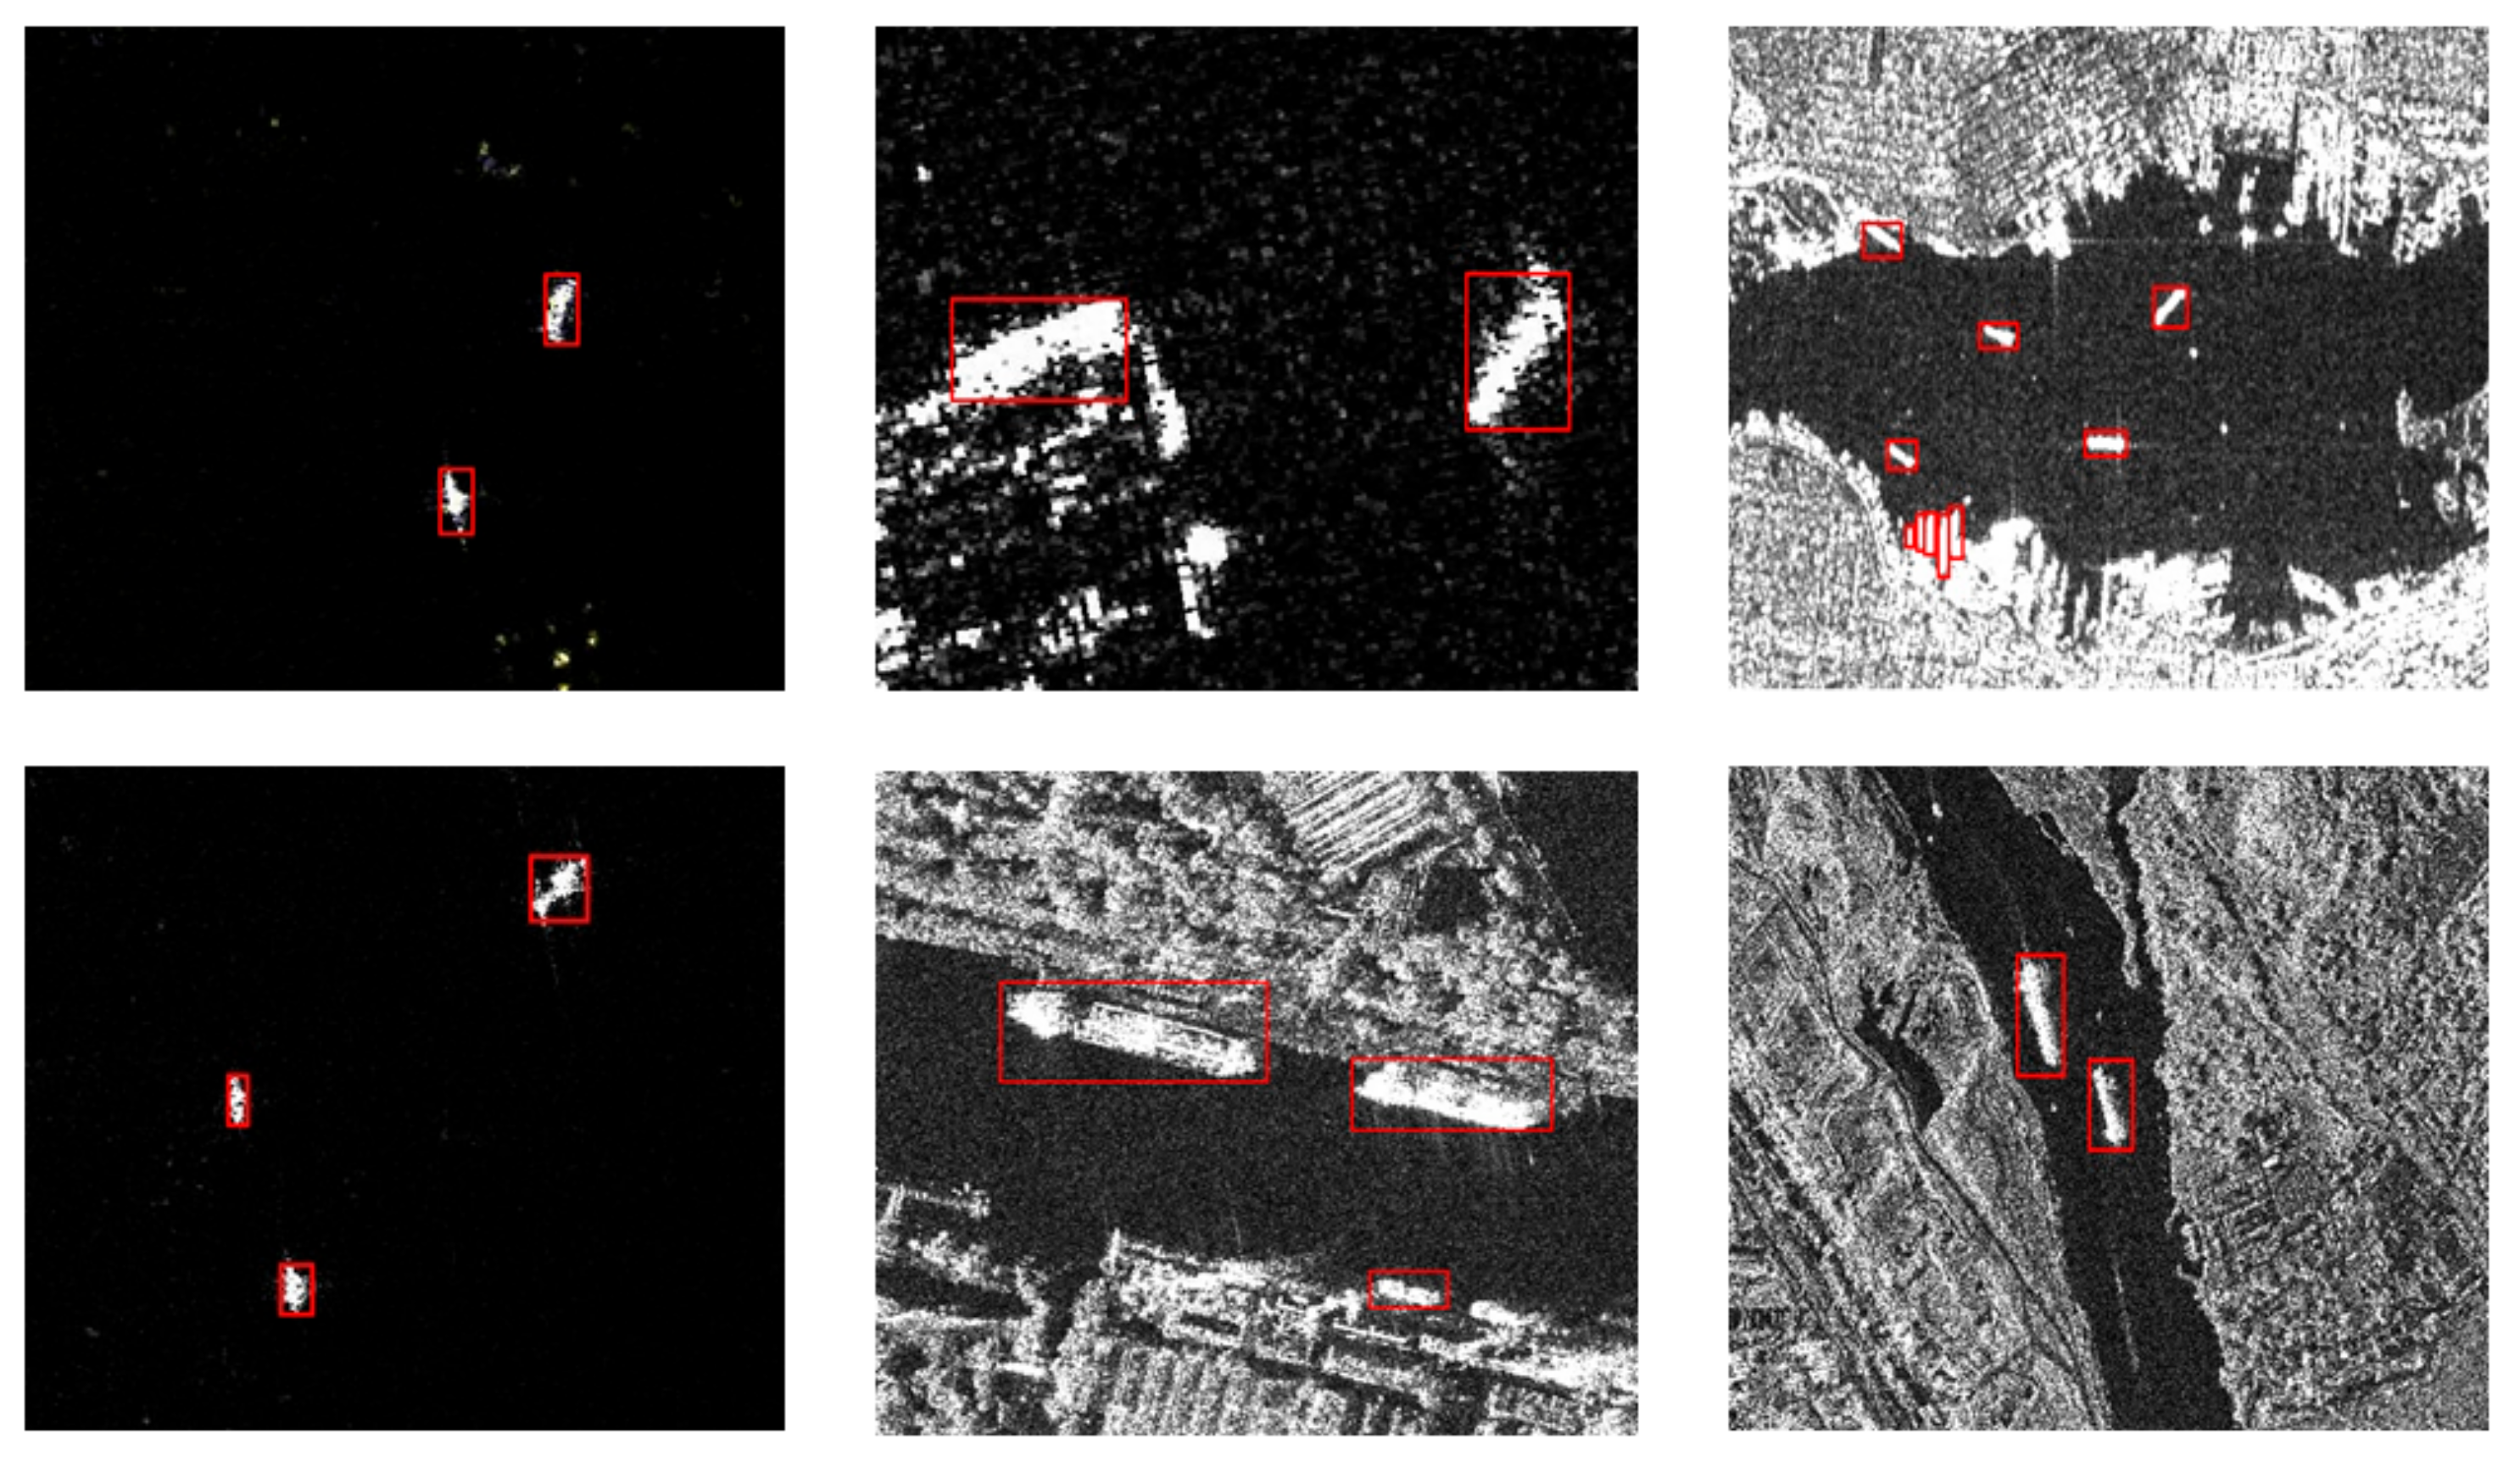
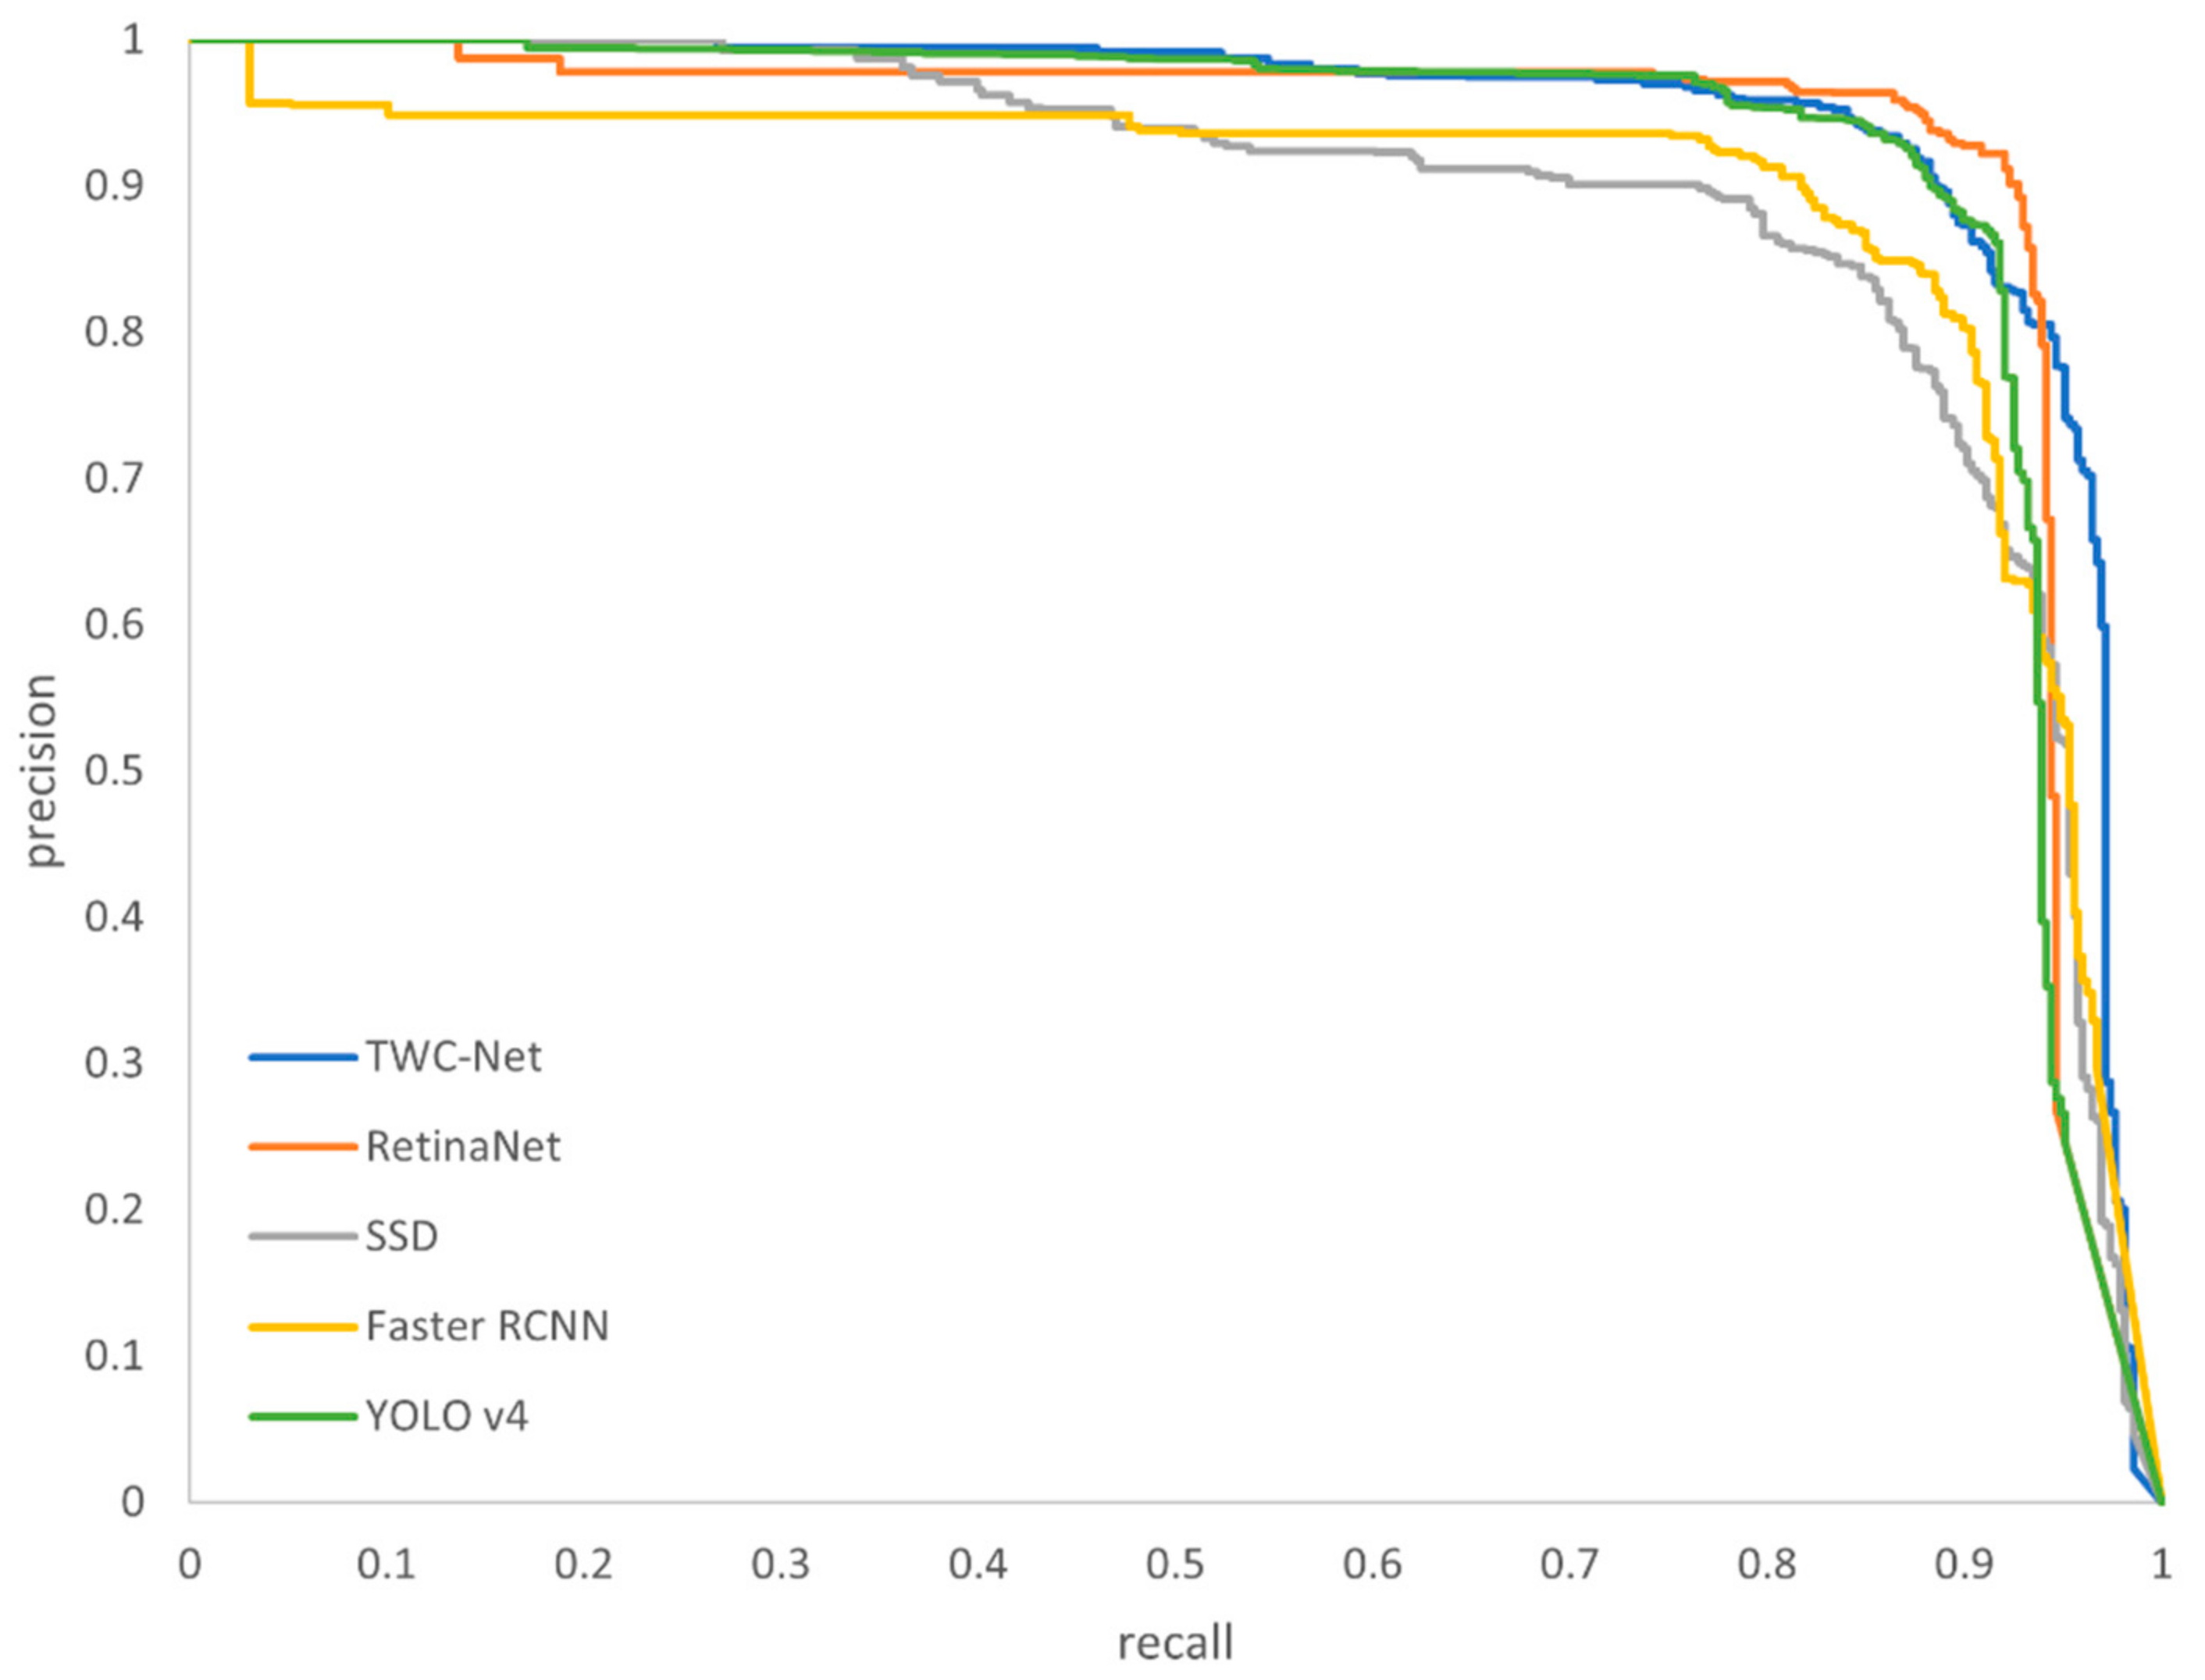
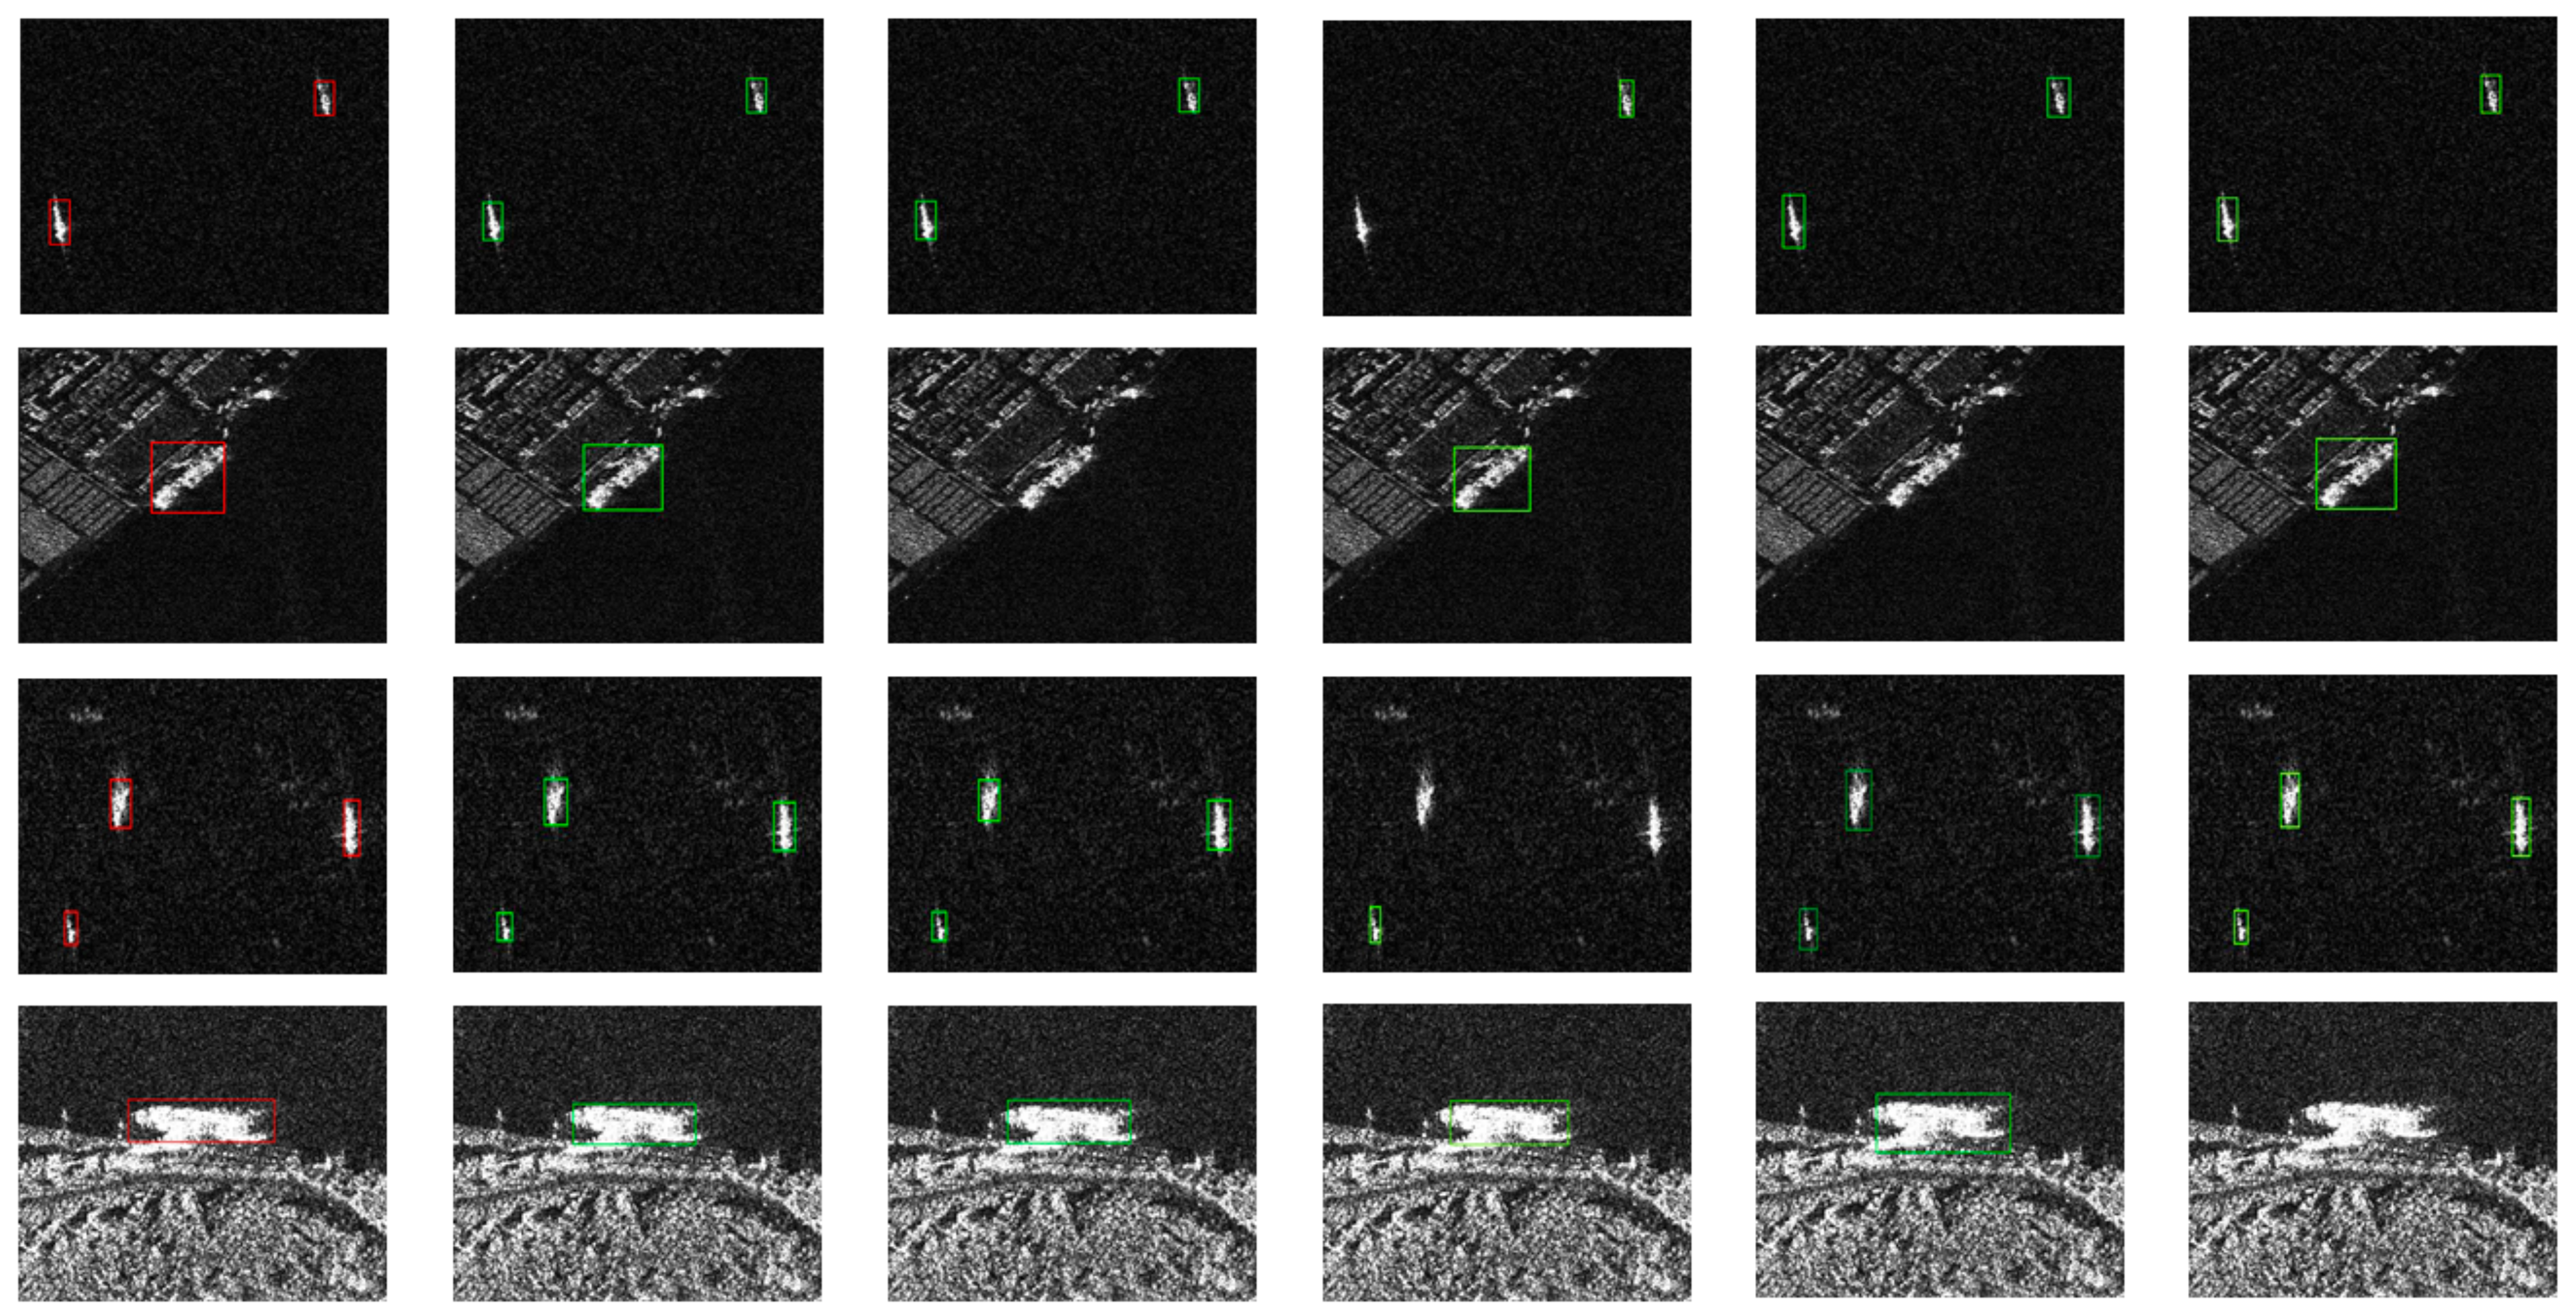
4.4. Comparative Experiment

To test the effectiveness of TWC-Net, we used RetinaNet, YOLO, SSD, and Faster RCNN as experimental comparison methods. TWC-Net belongs to the one-stage detector. In the comparison method, RetinaNet, YOLO, and SSD belong to the one-stage detector, and Faster RCNN belongs to the two-stage detector. To verify the validity of the model, we tested the validity of the model in a common image.
We used the VOC2007 dataset to validate the model’s ability to detect on common datasets, as shown in Table 1. Our model is better at small target detection of remote sensing images, so obtaining these results is not our primary goal.
RetinaNet is a detector based on focal loss, which mainly solves the problem of sample imbalance. RetinaNet uses ResNet50 (Res50) + FPN as the backbone, and the target classifier sub network uses focal loss as a loss function, which effectively eliminates the problem of sample imbalance and prompts the model to mine difficult samples.
YOLO is a one-stage target detection network. YOLO solves the problem of object detection as a regression problem. The input image can be processed once to output the location of the object and the corresponding category and confidence level. Through continuous development and improvement, YOLO has several different versions, of which YOLOv4 [31] has better overall performance. Therefore, YOLOv4 was also used as a comparison model in this experiment.
SSD runs faster than other models. SSD uses feature pyramid detection to predict targets on feature maps of different receptive fields. Different types of SSD have a different backbone, mainly including VGG19 [32] and ResNet50, which have a better performance than those using ResNet50. The SSD used in this experiment was SSD + ResNet50.
Faster RCNN is a two-stage detector proposed by Girshick and is an upgrade to the target detector of the previous RCNN series. Faster RCNN combines feature extraction, proposal extraction, and bounding box regression classification in a network to improve its comprehensive performance. Faster RCNN also has several different backbones, including ResNet50 and FPN as the backbone. This experiment used Faster RCNN + ResNet50 + FPN.
The proposed comparison between TWC-Net and RetinaNet, SSD, and Faster RCNN is quantitative and intuitive. Table 2 and Table 3 show the precision, recall, and F-Measure for all methods, and Figure 7 shows the visual detection results for different methods on the test sets.
In terms of recall rate, TWC-Net scored the highest at 95.29%, followed by SSD, which scored 95.21%. In terms of precision, RetinaNet achieved the highest score of 92.11%, followed by YOLOv4 with a score of 91.90%. The precision of the TWC-Net is 91.44%, which was close to the score of YOLOv4. In terms of F-measure, TWC-Net achieved the highest score of 93.32%, followed by SSD of 92.01%, RetinaNet of 86.36%, and Faster RCNN of 83.80%. Simply put, TWC-Net and SSD are better than other models, but SSD has lower precision than TWC-Net. Figure 7 shows the visual detection results of the different detection methods. It can be seen from the diagram that other methods have some degree of miss detection in small target detection or complex background detection near the shore, which is also the difficult point in SAR ship detection. Small target information is easily submerged in the continuous feature extraction. The high noise characteristics of SAR images make small target detection more difficult. Nearshore targets have a larger size, but image features are more complex. Detectors are prone to be miss detected and missed due to the interference of near-shore irrelevant information. In the figure, RetinaNet missed inshore ship targets, SSD performed poorly in small target detection, and small target ship missed detection that occurred in large areas of the sea. The result of the detection in the comprehensive graph shows that TWC-Net has a better comprehensive performance in detection.
For a more comprehensive comparison of the detection performance of each model, we set the IOU to 0.75 to re-evaluate the model. The IOU is 0.75, which means that the detection box has a higher overlap range with the ground truth box, so the model needs to detect the location of the detection more accurately. From Table 3, we can see that TWC-Net achieved the highest scores in recall rate and F-measure, while TWC-Net achieved the highest scores in precision. Next came RetinaNet and SSD. By comparison, our TWC-Net locations are more accurate and can more effectively locate the ship targets in the SAR image.
In the actual application environment, the complexity and memory requirements of the model are required. Models with high complexity require more stringent operating conditions and are more prone to over-fitting. Therefore, models with less memory and less complexity have more advantages. For a more comprehensive assessment of the model, we included comparisons of the model size, FLOPs, and parameters. The model size is the amount of memory occupied by the model after the training is completed. FLOPs are used to calculate floating-point arithmetic, which can measure the complexity of the model. Parameters represent the variables needed to define the model and measure the complexity of the model. Table 4 and Table 5 show the model size, FLOPs, and parameters for all methods.
Table 4 compares TWC-Net’s backbone with other mainstream backbones. By comparison, TWC-Net’s two-way convolution module has lower FLOPs and parameters, and a better performance in model size. Therefore, the backbone of TWC-Net has lower complexity and is suitable for lightweight devices with lower performance.
TWC-Net has a smaller memory footprint in terms of model size, followed by SSD. For FLOPs, TWC-Net has lower model complexity, followed by RetinaNet. SSD performed best in terms of parameters, followed by TWC-Net. Because Faster RCNN is a two-stage detector and has more module design in the structure, it has a poor performance in memory and complexity of the model. Overall, TWC-Net performs better in terms of model complexity.
To measure precision rates and recall rates, we used precision–recall curves to measure different models. The precision–recall curve can show the model’s overall recall and precision. The precision–recall curves take precision as the vertical axis and recall as the transverse axis. A skewed curve is obtained by counting each sample. As shown in Figure 8, the precision–recall curves shows that RetinaNet and TWC-Net perform better.

4.5. Generating Heatmap

Generation of a heatmap can be used to interpret models. Gradient-weighted class activation mapping (Grad CAM) [34] uses the gradient of the target concept to flow into the final convolution layer, producing a rough positioning map that highlights the area in the image used for prediction. Grad CAM overcomes the drawback of requiring a global average pooling (GAP) layer in class activation mapping (CAM) [35] network architecture and achieves the visualization result without modifying the network structure. In this experiment, Grad CAM was used to generate heatmap images to determine the effect of different locations on the output. As shown in Figure 9, the heatmap generated by TWC-Net using Grad CAM is displayed.
From Figure 9, it can be observed that the TWC-Net responds to each output feature map using large sea area images and offshore sea area images. Large sea area images have a simple background and small target. Based on the design of TWC-Net, high-scale shallow information is used for detection. Columns 2, 3, and 4 of Figure 9 show that the shallow output characteristics of TWC-Net can effectively respond to small targets. The image of the offshore sea area has the characteristics of a complex background and more interference information, so the network should extract deeper features for detection. TWC-Net can output deep low-scale information. As shown in columns 5 and 6 of Figure 9, it is easier for a network to learn the characteristics of larger targets from deep features and respond to them. Overall, through heatmap visualization, we can see that TWC-Net can effectively use multiscale structures to learn ship characteristics and detect ship targets of different scales.

4.6. Generalized Performance Test

Generalization ability is used to evaluate the model’s adaptability to fresh samples and is of great significance in practical application scenarios. In this experiment, we used other SAR ship data to test the generalization performance of TWC-Net, mainly using the HRSID [36] and SAR-Ship-Dataset [37]. HRSID contains 5604 high-resolution SAR images and 16951 ship targets, including SAR images of different resolutions, polarizations, and marine environments at resolutions of 0.5, 1 and 3m. The SAR-Ship-Dataset contains 43,819 SAR images. In total, 102 high-resolution 3rd and 108 Sentinel-1 images are used to construct the SAR images, including multiple imaging modes with resolutions of 3, 5, 8, 10 and 25 m. The SAR images that construct the sample library are multi-source and multi-mode. The three images of the HRSID and SAR-Ship-Dataset were selected for detection as shown in Figure 10.
Figure 10 shows that TWC-Net has a good detection effect for small target detection. It can detect most vessels effectively. The SAR-Ship-Dataset dataset contains some high noise interference images. It shows few such images during training. TWC-Net can still detect some high noise targets in the SAR-Ship-Dataset.
To quantitatively assess model generalization capabilities, we tested 10,955 pictures from the SAR-Ship-Dataset as test sets. The models used included TWC-Net, RetinaNet, SSD, and Faster RCNN. The indicators tested included recall, precision, and F-measure. The test results are shown in Table 6.
Table 6 shows that TWC-Net achieved the best results in recall rates, followed by SSD. RetinaNet achieved the best precision, followed by SSD. TWC-Net achieved the best results in the F-measure, followed by SSD. Overall, TWC-Net has better generalization performance.

5. Discussion

Through the comparison experiment shown in Table 2, we can see that TWC-Net achieved a higher recall rate and F-measure score for the SSDD dataset of 95.28% and 93.32%, respectively. For precision, a score of 91.44% was identified. In practice, most scenarios pay more attention to the model’s recall rate and have a higher tolerance for precision. Compared with other models in this experiment, TWC-Net has more advantages in real-world scenarios.
From Table 6, we can see that our proposed TWC-Net has good generalization capability on the new dataset, with the recall rate reaching 85.72%, while YOLOv4 and Faster RCNN have a relatively poor generalization performance, indicating that our model is more suitable for an unknown environment than other models. If we combine the data from Table 5 simultaneously, we can get another interesting conclusion in that smaller-sized models have a stronger generalization ability, so for SAR ship detection tasks, it can improve the generalization ability of models by reducing the model size appropriately.
The validity of the TWC-Net method was verified by comparative analysis of the above experiments. Figure 9 illustrates that the proposed two-way convolution and multi-scale feature extraction structures can effectively learn the main features of SAR images.
However, from the results of the test in Figure 11, it shows that not all the test results are ideal. As you can see from column 1 in the figure, TWC-Net partially misses images with complex backgrounds and small targets. Columns 2 and 3 show that TWC-Net partially misses images with high noise. These noises are caused by the principal defect of SAR itself. In the radar echo signals, the gray values of adjacent pixels will change randomly due to coherence, and this random change is around a certain mean value, which results in speckle noise in the image. Because there are fewer high-noise images in SSDD and the recognition of high-noise targets is difficult, TWC-Net lacks the response to the characteristics of high-noise images.
In the future, we will explore how to enhance the detection capability of detectors in more complex environments, especially for SAR images with a lot of noise, to reduce false positives and misses. We plan to build a dataset with a lot of noise to make the model more focused on learning difficult samples.

6. Conclusions

Ship detection based on SAR images is a meaningful and challenging task. The difficulty comes from the sparsity of the image object and the complexity of interference. To solve this problem, we proposed a detection method based on two-way convolution and multi-scale feature extraction. First, the image is preprocessed simply, and then the image is divided into two paths for feature processing, respectively. Feature extraction and fusion of the upper and lower side paths are adopted, and feature extraction of different scales is conducted for different size targets. The experimental results show that TWC-Net can achieve a better detection performance compared with the existing classical target detection methods. Simultaneously, TWC-Net has a smaller memory consumption and parameters, which allows TWC-Net to achieve a better detection effect in a generalization performance test. In the test of generalization performance, TWC-Net will still detect the high-noise SAR image incorrectly. The reason for this phenomenon is that the high-noise image will contain more useless information, which will cause great interference in the model detection. Alternatively, if the number of high-noise images in the SSDD dataset is small, the model does not fully learn the characteristic information of high-noise images. Future work will focus on better processing of high-noise SAR images.

Author Contributions

L.Y. and H.W. wrote the manuscript and designed the comparative experiments; Z.Z. and L.Z. supervised the study and revised the manuscript; Z.Z. revised the manuscript and gave comments and suggestions to the manuscript; Q.D. assisted H.H. in designing the architecture and conducting experiments. All authors have read and agreed to the published version of the manuscript.

Funding

This research was funded by the National Nature Science Foundation of China (Grant number: 61771155) and Fundamental Research Funds for the Central Universities.

Data Availability Statement

Publicly available datasets were used in this study. SSDD data can be found here: https://pan.baidu.com/share/init?surl=E8ixqK5AVfXc98UgQmpqaw, The extraction code is trnt, decompression password is 12345qwert, accessed on 6 May 2021. HRSID data can be found here: https://github.com/chaozhong2010/hrsid, accessed on 30 May 2021, SAR-Ship-Dataset data can be found here: https://github.com/CAESAR-Radi/SAR-Ship-Dataset, accessed on 30 May 2021.

Acknowledgments

Thanks a lot to Zheng Liying for her brilliant help to the research.

Conflicts of Interest

The authors declare no conflict of interest.

References

  1. Stasolla, M.; Mallorqui, J.J.; Margarit, G.; Santamaria, C.; Walker, N. A Comparative Study of Operational Vessel Detectors for Maritime Surveillance Using Satellite-Borne Synthetic Aperture Radar. IEEE J. Sel. Top. Appl. Earth Obs. Remote Sens. 2016, 9, 2687–2701. [Google Scholar] [CrossRef] [Green Version]
  2. Liu, W.; Ma, L.; Chen, H. Arbitrary-Oriented Ship Detection Framework in Optical Remote-Sensing Images. IEEE Geosci. Remote Sens. Lett. 2018, 15, 937–941. [Google Scholar] [CrossRef]
  3. He, K.; Zhang, X.; Ren, S.; Sun, J. Deep Residual Learning for Image Recognition. In Proceedings of the 2016 IEEE Conference on Computer Vision and Pattern Recognition (CVPR), Las Vegas, NV, USA, 27–30 June 2016; pp. 770–778. [Google Scholar]
  4. Yu, W.; Lu, Y.; Easterbrook, S.; Fidler, S. Efficient and Information-Preserving Future Frame Prediction and Beyond. In Proceedings of the International Conference on Learning Representations, Addis Ababa, Ethiopia, 30 April 2020. [Google Scholar]
  5. Li, J.; Qu, C.; Shao, J. Ship detection in SAR images based on an improved faster R-CNN. In Proceedings of the 2017 SAR in Big Data Era: Models, Methods and Applications (BIGSARDATA), Beijing, China, 13–14 November 2017; pp. 1–6. [Google Scholar]
  6. Xianxiang, Q.; Shilin, Z.; Huanxin, Z.; Gui, G. A CFAR Detection Algorithm for Generalized Gamma Distributed Background in High-Resolution SAR Images. IEEE Geosci. Remote Sens. Lett. 2013, 10, 806–810. [Google Scholar] [CrossRef]
  7. Frery, A.C.; Muller, H.J.; Yanasse, C.C.F.; Sant’Anna, S.J.S. A model for extremely heterogeneous clutter. IEEE Trans. Geosci. Remote Sens. 1997, 35, 648–659. [Google Scholar] [CrossRef]
  8. Szegedy, C.; Wei, L.; Yangqing, J.; Sermanet, P.; Reed, S.; Anguelov, D.; Erhan, D.; Vanhoucke, V.; Rabinovich, A. Going deeper with convolutions. In Proceedings of the 2015 IEEE Conference on Computer Vision and Pattern Recognition (CVPR), Boston, MA, USA, 7–12 June 2015; pp. 1–9. [Google Scholar]
  9. Tan, M.; Le, Q.V. EfficientNet: Rethinking Model Scaling for Convolutional Neural Networks. arXiv 2019, arXiv:1905.11946. [Google Scholar]
  10. Yin, W.; Diao, W.; Wang, P.; Gao, X.; Li, Y.; Sun, X. PCAN—Part-Based Context Attention Network for Thermal Power Plant Detection in Remote Sensing Imagery. Remote Sens. 2021, 13, 1243. [Google Scholar] [CrossRef]
  11. Cui, Z.; Li, Q.; Cao, Z.; Liu, N. Dense Attention Pyramid Networks for Multi-Scale Ship Detection in SAR Images. IEEE Trans. Geosci. Remote Sens. 2019, 57, 8983–8997. [Google Scholar] [CrossRef]
  12. Cosmin Duta, I.; Liu, L.; Zhu, F.; Shao, L. Pyramidal Convolution: Rethinking Convolutional Neural Networks for Visual Recognition. arXiv 2020, arXiv:2006.11538. [Google Scholar]
  13. Lin, T.-Y.; Dollár, P.; Girshick, R.; He, K.; Hariharan, B.; Belongie, S. Feature Pyramid Networks for Object Detection. arXiv 2016, arXiv:1612.03144. [Google Scholar]
  14. Ghiasi, G.; Lin, T.-Y.; Pang, R.; Le, Q.V. NAS-FPN: Learning Scalable Feature Pyramid Architecture for Object Detection. arXiv 2019, arXiv:1904.07392. [Google Scholar]
  15. Girshick, R. Fast R-CNN. arXiv 2015, arXiv:1504.08083. [Google Scholar]
  16. Ren, S.; He, K.; Girshick, R.; Sun, J. Faster R-CNN: Towards Real-Time Object Detection with Region Proposal Networks. IEEE Trans. Pattern Anal. Mach. Intell. 2017, 39, 1137–1149. [Google Scholar] [CrossRef] [PubMed] [Green Version]
  17. Dai, J.; Li, Y.; He, K.; Sun, J. R-FCN: Object Detection via Region-based Fully Convolutional Networks. arXiv 2016, arXiv:1605.06409. [Google Scholar]
  18. Liu, W.; Anguelov, D.; Erhan, D.; Szegedy, C.; Reed, S.; Fu, C.-Y.; Berg, A.C. SSD: Single Shot MultiBox Detector; Springer: Cham, Switzerland, 2016; pp. 21–37. [Google Scholar]
  19. Redmon, J.; Divvala, S.; Girshick, R.; Farhadi, A. You Only Look Once: Unified, Real-Time Object Detection. In Proceedings of the 2016 IEEE Conference on Computer Vision and Pattern Recognition (CVPR), Boston, MA, USA, 7–12 June 2016; pp. 779–788. [Google Scholar]
  20. Lin, T.-Y.; Goyal, P.; Girshick, R.; He, K.; Dollar, P. Focal Loss for Dense Object Detection. IEEE Trans. Pattern Anal. Mach. Intell. 2020, 42, 318–327. [Google Scholar] [CrossRef] [PubMed] [Green Version]
  21. Chen, S.-W.; Tao, C.-S.; Wang, X.-S.; Xiao, S.-P. Polarimetric SAR Targets Detection and Classification with Deep Convolutional Neural Network. In Proceedings of the 2018 Progress in Electromagnetics Research Symposium (PIERS-Toyama), Toyama, Japan, 1 August 2018; pp. 2227–2234. [Google Scholar]
  22. Zhou, F.; Fan, W.; Sheng, Q.; Tao, M. Ship Detection Based on Deep Convolutional Neural Networks for Polsar Images. In Proceedings of the IGARSS 2018—2018 IEEE International Geoscience and Remote Sensing Symposium, Valencia, Spain, 22–27 July 2018; pp. 681–684. [Google Scholar]
  23. Tang, G.; Zhuge, Y.; Claramunt, C.; Men, S. N-YOLO: A SAR Ship Detection Using Noise-Classifying and Complete-Target Extraction. Remote Sens. 2021, 13, 871. [Google Scholar] [CrossRef]
  24. Chen, L.; Shi, W.; Deng, D. Improved YOLOv3 Based on Attention Mechanism for Fast and Accurate Ship Detection in Optical Remote Sensing Images. Remote Sens. 2021, 13, 660. [Google Scholar] [CrossRef]
  25. Wang, Z.; Zhou, Y.; Wang, F.; Wang, S.; Xu, Z. SDGH-Net: Ship Detection in Optical Remote Sensing Images Based on Gaussian Heatmap Regression. Remote Sens. 2021, 13, 499. [Google Scholar] [CrossRef]
  26. Cozzolino, D.; di Martino, G.; Poggi, G.; Verdoliva, L. A fully convolutional neural network for low-complexity single-stage ship detection in Sentinel-1 SAR images. In Proceedings of the 2017 IEEE International Geoscience and Remote Sensing Symposium (IGARSS), Fort Worth, TX, USA, 23–28 July 2017; pp. 886–889. [Google Scholar]
  27. Jin, K.; Chen, Y.; Xu, B.; Yin, J.; Wang, X.; Yang, J. A Patch-to-Pixel Convolutional Neural Network for Small Ship Detection with PolSAR Images. IEEE Trans. Geosci. Remote Sens. 2020, 58, 6623–6638. [Google Scholar] [CrossRef]
  28. Chang, Y.-L.; Anagaw, A.; Chang, L.; Wang, Y.; Hsiao, C.-Y.; Lee, W.-H. Ship Detection Based on YOLOv2 for SAR Imagery. Remote Sens. 2019, 11, 786. [Google Scholar] [CrossRef] [Green Version]
  29. Lin, Z.; Ji, K.; Leng, X.; Kuang, G. Squeeze and Excitation Rank Faster R-CNN for Ship Detection in SAR Images. IEEE Geosci. Remote Sens. Lett. 2019, 16, 751–755. [Google Scholar] [CrossRef]
  30. Kang, M.; Ji, K.; Leng, X.; Lin, Z. Contextual Region-Based Convolutional Neural Network with Multilayer Fusion for SAR Ship Detection. Remote Sens. 2017, 9, 860. [Google Scholar] [CrossRef] [Green Version]
  31. Bochkovskiy, A.; Wang, C.-Y.; Liao, H.-Y.M. YOLOv4: Optimal Speed and Accuracy of Object Detection. arXiv 2020, arXiv:2004.10934. [Google Scholar]
  32. Simonyan, K.; Zisserman, A. Very Deep Convolutional Networks for Large-Scale Image Recognition. arXiv 2014, arXiv:1409.1556. [Google Scholar]
  33. Huang, G.; Liu, Z.; van der Maaten, L.; Weinberger, K.Q. Densely Connected Convolutional Networks. arXiv 2016, arXiv:1608.06993. [Google Scholar]
  34. Selvaraju, R.R.; Cogswell, M.; Das, A.; Vedantam, R.; Parikh, D.; Batra, D. Grad-CAM: Visual Explanations from Deep Networks via Gradient-Based Localization. In Proceedings of the 2017 IEEE International Conference on Computer Vision (ICCV), Venice, IT, USA, 22–29 October 2017; pp. 618–626. [Google Scholar]
  35. Zhou, B.; Khosla, A.; Lapedriza, A.; Oliva, A.; Torralba, A. Learning Deep Features for Discriminative Localization. In Proceedings of the 2016 IEEE Conference on Computer Vision and Pattern Recognition (CVPR), Boston, MA, USA, 7–12 June 2016; pp. 2921–2929. [Google Scholar]
  36. Wei, S.; Zeng, X.; Qu, Q.; Wang, M.; Su, H.; Shi, J. HRSID: A High-Resolution SAR Images Dataset for Ship Detection and Instance Segmentation. IEEE Access 2020, 8, 120234–120254. [Google Scholar] [CrossRef]
  37. Wang, Y.; Wang, C.; Zhang, H.; Dong, Y.; Wei, S. A SAR Dataset of Ship Detection for Deep Learning under Complex Backgrounds. Remote Sens. 2019, 11, 765. [Google Scholar] [CrossRef] [Green Version]
Figure 1. Overall framework of TWC-Net.
Remotesensing 13 02558 g001
Figure 2. Architecture of the preprocess.
Remotesensing 13 02558 g002
Figure 3. Architecture of two-way convolution.
Remotesensing 13 02558 g003
Figure 4. Architecture of the multi-scale feature extraction module.
Remotesensing 13 02558 g004
Figure 5. Architecture of the multi-scale feature extraction module.
Remotesensing 13 02558 g005
Figure 6. SSDD sample, in which ship targets in large areas of the sea, offshore areas, and complex background are listed in column 1, column 2, and column 3.
Remotesensing 13 02558 g006
Figure 7. Comparison of the different detection methods; from left to right are ground truth, TWC-Net, RetinaNet, SSD, YOLOv4, and Faster RCNN.
Remotesensing 13 02558 g007
Figure 8. Precision–recall curves of different detection methods.
Remotesensing 13 02558 g008
Figure 9. Heatmap is generated, with the leftmost column listed as ground truth, and the 2, 3, 4, 5, and 6 columns corresponding to the output of the multi-scale feature extraction module of TWC-Net from a high scale to a low scale (from shallow to deep), and the last column representing the output of TWC-Net.
Remotesensing 13 02558 g009
Figure 10. Generalization performance tests, column 1 images from HRSID, column 2 results from column 1, column 3 images from SAR-Ship-Dataset, and column 4 results from column 3.
Remotesensing 13 02558 g010
Figure 11. TWC-Net test results, ground truth for behavior 1, detection result for behavior 2, images in columns 1 and 2 are from SSDD, and images in column 3 are from SAR-Ship-Dataset.
Remotesensing 13 02558 g011
Table 1. Recall, precision, and F-measure of TWC-Net in VOC2007 (IOU = 0.5).
MethodsRecall (%)Precision (%)F-Measure (%)
TWC-Net82.6781.3682.01
Table 2. Recall, precision, and F-measure of all methods (IOU = 0.5).
MethodsRecall (%)Precision (%)F-Measure (%)
RetinaNet+Res50+FPN81.2892.1186.36
YOLOv482.1491.9086.75
SSD+Res5095.2189.0392.01
Faster RCNN+Res50+FPN79.7688.2883.80
TWC-Net95.2891.4493.32
Table 3. Recall, precision, and F-measure of all methods (IOU = 0.75).
MethodsRecall (%)Precision (%)F-Measure (%)
RetinaNet+Res50+FPN55.0053.3054.14
YOLOv437.3721.8227.55
SSD+Res5056.1946.2050.71
Faster RCNN+Res50+FPN32.8436.0234.36
TWC-Net62.7553.0557.49
Table 4. Model size, FLOPs, and number of parameters of backbones.
BackbonesModel Size (MB)FLOPs (G)Parameter (M)
VGG1954962.26143.73
ResNet509813.2925.67
DenseNet201 [33]7813.7520.21
EfficientNet B7 [9]256255.8366.72
Two-way Convolution775.8019.54
Table 5. Model size, FLOPs, and number of parameters of all methods.
MethodsModel size (MB)FLOPs (G)Parameter (M)
RetinaNet+Res50+FPN14312.5835.17
YOLOv425129.8863.94
SSD+Res5012216.2315.43
Faster RCNN+Res50+FPN324134.2541.35
TWC-Net1049.3926.36
Table 6. Recall, precision, and F-measure of all methods.
MethodsRecall (%)Precision (%)F-Measure (%)
RetinaNet+Res50+FPN70.5566.9367.23
YOLOv463.9958.0360.86
SSD+Res5082.5766.7572.37
Faster RCNN+Res50+FPN61.8760.3761.11
TWC-Net85.7264.9073.87
Publisher’s Note: MDPI stays neutral with regard to jurisdictional claims in published maps and institutional affiliations.

