Article

Retrieving Three-Dimensional Large Surface Displacements in Coal Mining Areas by Combining SAR Pixel Offset Measurements with an Improved Mining Subsidence Model

1
College of Geological Engineering and Geomatics, Chang’an University, Xi’an 710054, China
2
School of Geography and Geomatics and Urban-Rural Planning, Jiangsu Normal University, Xuzhou 221116, China
3
Key Laboratory of Western China’s Mineral Resource and Geological Engineering, Ministry of Education, Xi’an 710054, China
4
Big Data Center for Geosciences and Satellites (BDCGS), Xi’an 710054, China
5
School of Engineering, Newcastle University, Newcastle upon Tyne NE1 7RU, UK
*
Author to whom correspondence should be addressed.
Remote Sens. 2021, 13(13), 2541; https://doi.org/10.3390/rs13132541
Submission received: 19 May 2021 / Revised: 22 June 2021 / Accepted: 26 June 2021 / Published: 29 June 2021

Abstract

:
Interferometric synthetic aperture radar (InSAR) technology can obtain one-dimensional surface displacements in the radar line of sight (LOS). In the field of mining subsidence, large 3D movements often occur at the same time, and hence InSAR derived one-dimensional LOS displacements can hardly reflect the actual surface motion in mining areas. To realize the monitoring of three-dimensional large surface displacements in mining areas, a method for monitoring three-dimensional large surface displacements in mining areas that combines SAR pixel offset tracking (OT) and an improved mining subsidence model is proposed in this article. First, a new functional relationship between surface subsidence and horizontal movement combined with the characteristics of the overburden rock stress and the deformation characteristics of the fractured rock mass in coal mining areas is established. Then, a three-dimensional surface deformation model is established based on the proposed relationship between surface subsidence and horizontal movement and the radar projection equation, and finally, the optimal parameters of the deformation model are inverted iteratively using LOS deformation results obtained by OT method to retrieve the three-dimensional large displacements of the surface. The significant advantage of the method proposed in this article is that it can accurately acquire the 3D large surface displacements using only two SAR amplitude images with the same imaging geometry. To verify the accuracy and reliability of the proposed algorithm, two scenes of high-resolution spotlight TerraSAR-X images are used in this paper to conduct a three-dimensional surface displacement monitoring experiment on a working panel in the Daliuta mining area in Shaanxi Province, China, based on the proposed method. Experimental monitoring results show that the maximum surface subsidence is approximately 4.5 m, and the maximum horizontal movements in the strike and dip directions are approximately 1.4 m and 1.2 m, respectively. Using GPS measurements to verify the monitoring results, the root mean square error (RMSE) of vertical subsidence is 6.8 cm, and the RMSE of horizontal movement is 7.1 cm. Compared with those in the original mining subsidence model, the accuracies of vertical subsidence and horizontal movement in the proposed model are increased by 28.2% and 37.5%, respectively, which proves the reliability and accuracy of the proposed method.

1. Introduction

Coal has been a basic energy source and an important industrial raw material for all countries in the world, and it has strongly supported the development of the world economy. However, large-scale and high-intensity coal mining often causes severe and large-gradient deformation on the Earth’s surface during a short period, which in turn not only causes the ground surface to sink but also could result in damage to the buildings, infrastructure and roads above the goaf. Monitoring of coal mining induced large-gradient three-dimensional deformation on the Earth’s surface is of great significance to accurately assess the impacts of coal mining activities, adjust mining plans in mining areas, and predict potential geological disasters during mining.
Traditional monitoring techniques for mining subsidence include triangulation, leveling and GPS, but they have disadvantages such as high cost, heavy workload, and sparse monitoring point density [1,2]. Interferometric synthetic aperture radar (InSAR) has been proven to be a powerful tool for monitoring surface displacements [3,4] with the advantages of all-time, all-weather, wide coverage (tens of kilometers to hundreds of kilometers), high precision (centimeters to millimeters) and high spatial resolution (tens of meters to submeters). It overcomes the shortcomings of the above mentioned traditional monitoring techniques, and has been successfully used to monitor mining subsidence [5,6,7,8,9]. Coal mining often causes large-gradient surface displacements during a short period, and the surface displacement gradient can exceed the maximum detectable deformation gradient of InSAR [10,11], which impedes InSAR to determine the correct surface displacements. Yang et al. [12] proposed using the interpolation multiview method to increase the detectable deformation gradient, and Zhao et al. [13] used the full resolution method of a single interferogram to increase the detectable deformation gradient. However, the extent for these two methods to increase the detectable deformation gradient is limited and the problem how to use InSAR to obtain large-gradient surface displacements remains unsolved. To obtain large-gradient surface displacements in mining areas, Zhao et al. [14] used SAR pixel offset tracking (OT) method to obtain surface subsidence signals in a mining area with an accuracy of approximately 1/25 pixels. Huang et al. [15] managed to recover the surface displacements in the Daliuta mining area in Shaanxi Province, China; the maximum LOS displacement was found to be approximately 3.6 m, and the RMSEs in the strike and dip directions were 0.143 m and 0.108 m, respectively. Note that this method obtained vertical displacements only with an assumption of zero horizontal movement.
Conventional InSAR can only provide one-dimensional surface displacements in the direction of the radar’s line of sight (LOS) in the absence of multi-tracks of SAR images, but the surface displacements caused by underground mining often occur in both vertical and horizontal directions, and hence InSAR LOS results cannot fully reflect the actual surface motion in mining areas, which may even cause misinterpretation in some cases. To derive three-dimensional (3D) surface displacements from InSAR observations, multi-tracks of SAR images and/or a dense GNSS network are often required [16,17,18,19,20,21,22]. On the other hand, the existing mining subsidence theory [23] reveals that there is a functional relationship between vertical and horizontal movements caused by coal mining. Therefore, it can be used to determine 3D surface displacements from 1D LOS displacements. Fan et al. [24] and Yang et al. [25] used OT method to obtain large-gradient surface displacements in the LOS direction and then combined them with a mining subsidence model to obtain large-gradient 3D surface displacements. It should be noted that the existing mining subsidence model has two shortcomings: (i) it is assumed that the horizontal movement is proportional to the tilt in the existing mining subsidence model, indicating that horizontal displacements are equal to zero in the critical and supercritical areas, but that assumption does not always hold true [26,27,28]; (ii) the predicted curves of vertical and horizontal displacements from the existing mining subsidence model converge too fast at the boundaries; that is, the prediction errors of the existing mining subsidence model are greater near the goaf boundaries than those away from the boundaries [29]. These two deficiencies lead to low accuracy of the 3D surface displacements through the fusion of the existing mining subsidence model and the OT method. Chen et al. [30] presented a method that integrates OT and clastic medium theory to resolve 3D large gradient displacements caused by underground coal mining. This method solves the above mentioned problem (i), but the problem (ii) has not been solved yet.
To solve the abovementioned problems and obtain a higher accuracy, in this paper, an improved mining subsidence model is proposed based on previous study [30]. It is combined with the OT method to retrieve precise three-dimensional surface displacements in mining areas, with a working panel in the Daliuta mining area in Shaanxi Province, China, being taken as an example.

2. Principle of Mining Subsidence

2.1. Mining Subsidence in the Original Mining Subsidence Model

The mining subsidence model based on the random medium theory is one of the most widely used mining subsidence prediction methods. In this theory, the main rock mass of the subsidence area is considered as a discontinuous medium, and its medium model is similar to the granular medium model. It is assumed that, although the rock is deformed under mining, the total volume remains unchanged [23]. As shown in Figure 1a, we assume that xOy is the ground coordinate system and vO1u is the coal seam coordinate system. According to the principle of mining subsidence in the existing mining subsidence model, in horizontal or near-horizontal coal seam mining unit B(u, v), the vertical and horizontal displacements of any point A(x, y) on the ground surface can be written as follows [23]:
W e x , y = 1 / r 2 exp π x u 2 + y v 2 / r 2
U e x , y = B I e x , y B = b H / t a n β
where We (x, y) is the surface subsidence caused by mining unit B(u, v), r is the main influence radius, r = H/tanβ. b, H and tanβ represent the coefficient of the horizontal movement, the mining depth of the extracted unit element, and the tangent of the major influential angle, respectively. U e x , y and I e x , y are the unit horizontal movement and tilt deformation caused by exploiting unit B(u, v). B is the proportionality coefficient between U e x , y and I e x , y .
Equation (1) is established according to the theory of granular medium mechanics in discontinuous medium [23]. In this theory, the granular medium is composed of medium particles similar to sand particles or relatively small rock masses, and the particles have completely lost contact with each other and can move around. The movement of a granular medium is characterized by the random movement of particles, and the movement of a large number of granular media is regarded as a random process[23]. As shown in Figure 1b, in the flat bottom of the mobile basin, the stress of the mining overburden along the bedding direction is relatively small, which is basically in line with the theoretical assumption of the existing mining subsidence model. Above the coal pillars in the goaf, the rock mass is subject to strong tensile stress directed towards the center of the goaf. Under the action of tensile stress, the mining overburden above the coal pillar produces horizontal displacements towards the center of the mined-out area and sink in the vertical direction, which leads to the deviations between the predicted surface subsidence and the measured values. In addition, if there is a certain thickness of loose layers (such as alluvial layers and residual layers) overlying the coal seam, cracks are prone to appear under the action of tensile stress due to the low compressive and tensile strength of the loose layers. A more significant plastic flow towards the center of the mined-out area can be generated, which increases the amount of subsidence above the coal pillar and make it more difficult to predict at the boundaries. In addition, in mining areas with high phreatic water levels, the surface subsidence in the mined-out area causes the groundwater level to rise, and the collapsibility of loess can also result in prediction biases at the boundaries. Therefore, the subsidence curve predicted by the existing mining subsidence model (as Equation (1)) converges too fast at the edges (as shown in Figure 1b) and has a large deviation from the actual subsidence curve.
Equation (2) shows the proportionality between horizontal movement and tilt according to the stochastic medium theory model (SMTM), which holds true only in a limited number of cases. This is because the SMTM assumes that the total volume of the rock mass remains unchanged with coal mining but the assumption of the SMTM is inconsistent with the actual movement of the rock mass. The actual rock mass is anisotropic and discontinuous (with cracks), and thus its volume varies during mining due to the bulk expansion and rheology of the rock mass; the rock mass should be considered as a clastic medium [30].

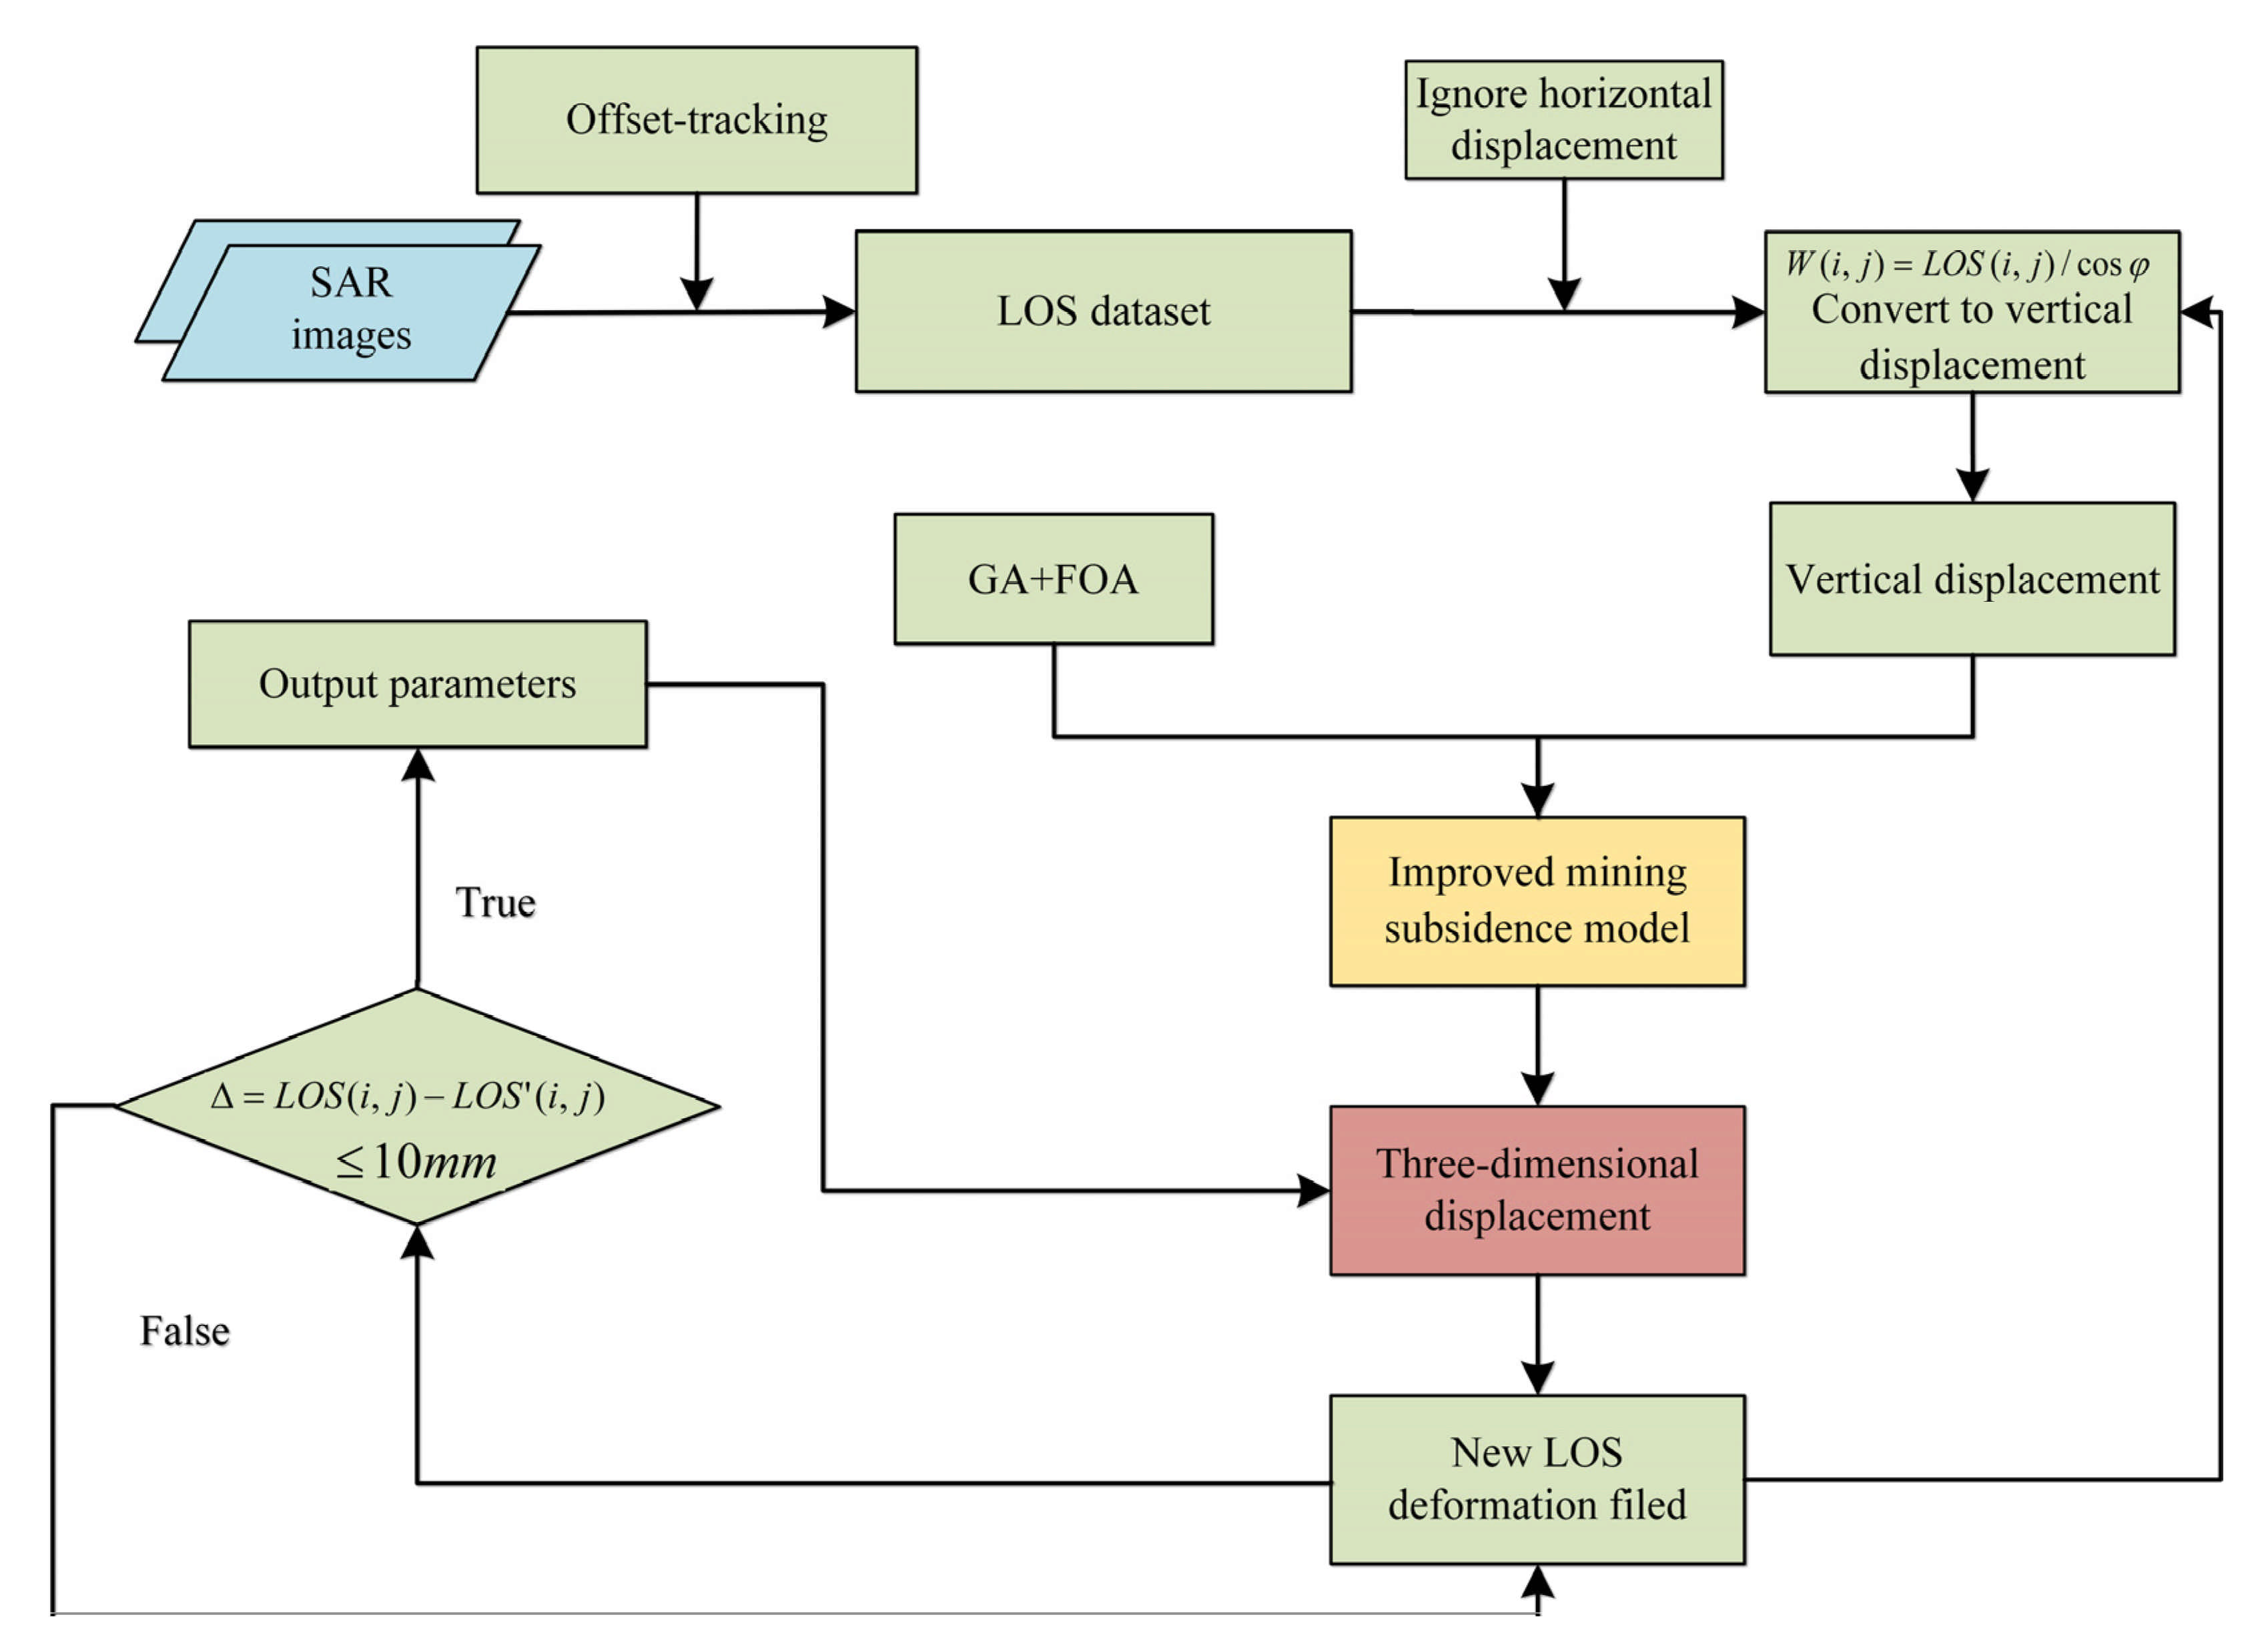
2.2. Modeling 3D Surface Displacements in Coal Mining Areas with Improved Mining Subsidence Model

In this paper, phenomenological theory [31] is invoked to address the problem of converging too fast at the edges in Equation (1), which refers to the laws obtained by summarizing experimental results instead of using its internal mechanism. Phenomenological theory is the generalization and refinement of experimental phenomena and it has the function of describing and predicting physical phenomena, but no explanatory function. This method can avoid the exploration of the complex mechanical properties and mechanical processes of the internal movements and deformation of the rock layer, and an appropriate fitting can be obtained as long as the appropriate parameters are determined. According to the phenomenological theory [31], the expression form of the surface unit sinking basin can be changed to a combination of two unit sinking basins with different main influence radii according to a certain proportion, and then the surface subsidence prediction formula is established according to the superposition method, which can be expressed as [23]:
W e i x , y = W e 1 x , y 1 ρ + W e 2 x , y ρ
W e 1 x , y = 1 / r 1 2 e x p π x u 2 + y v 2 / r 1 2 W e 2 x , y = 1 / r 2 2 e x p π x u 2 + y v 2 / r 2 2
where W e i x , y is the subsidence caused by mining unit B(u, v) that is obtained by the improved mining subsidence model, and W e 1 x , y and   W e 2 x , y represent the subsidence of the unit corresponding to the changed main influence radius r1 and r2, respectively. ρ is the scale factor, r1 and r2 represent the main influence radius of the improved mining subsidence model, where r1 = H/tanβ1 and r2 = H/tanβ2.
According to the superposition principle, the surface point A(x, y) caused by the mining of the entire working panel can be expressed as:
W a x , y = m q a c o s α s 3 l s 1 c o s α L W e i x , y d u d v
where m is the coal seam thickness, qa is the sink factor of improved model, α is the coal seam dip, l = D3s4, L = (D1s2)cosα, and D3 and D1 represent the lengths of the strike and dip directions, respectively. s1, s2, s3 and s4 are the offsets of the inflection points at the lower and upper boundaries of the goaf in the main section and the left and right boundaries of the main section, respectively.
According to Chen et al. [30], in the x-z plane, the horizontal movement of the surface caused by unit mining can be expressed as:
U e x , z = B I e x , z + c o t θ W e x , z
where θ is the propagation angle of coal mining.
Combining Equation (6) with Equation (2), the horizontal movements of point A on the surface can be written as:
U E W x , y = b a H / t a n β I E W x , y + c o t θ W a x , y U N S x , y = b a H / t a n β I N S x , y + c o t θ W a x , y
where UEW (x, y) and UNS (x, y) represent horizontal movements in the easting and northing directions, respectively; and IEW (x, y) and INS (x, y) represent the east-west and north-south tilts, respectively. Since tilt is the first derivative of the vertical displacements [23], the corresponding tilts (IEW (x, y) and INS (x, y)) of point A(x, y) in the easting and northing directions can be expressed as:
I E W x , y = W a x + x , y W a x , y / x I N S x , y = W a x , y + y W a x , y / y
where Δx and Δy are the distances between adjacent points in the easting and northing directions, respectively.
In Equations (5)–(8), parameters H, D1, D3, Δx and Δy are constants of the coal mining area. Therefore, 3D surface displacements can be derived according to Equations (5) and (7) when parameters qa, tanβ, θ, ba, s and ρ are known. Note that the tangent of the major influential angle in the improved mining subsidence model is changed to two, so tanβ needs to be determined by Equation (9):
t a n β = t a n β 1 1 ρ + t a n β 2 ρ

2.3. Estimation of Model Parameters using OT Results

From Section 2.2, it is clear that three-dimensional movements can be retrieved only if the parameters qa, tanβ, θ, b, s and ρ are determined. Here, an iteration method is proposed to determine the parameters qa, tanβ, θ, b, s and ρ using OT results as follows:
(1) Obtain the initial vertical subsidence. Assuming that there is no horizontal movement in the initial settlement field, the initial vertical subsidence can be determined. The vertical subsidence of any pixel (i, j) can be expressed as:
W i , j = L O S i , j / c o s φ
where φ represents the incident angle of the radar, W (i, j) is the vertical subsidence of pixel (i, j), and LOS(i, j) is the LOS-direction deformation of pixel (i, j) obtained by OT method.
(2) Determine the initial parameters of the model based on the genetic algorithm (GA) and fruit fly optimization algorithm (FOA). The increased number of the parameters in the improved mining subsidence model may lead to a decrease in the inversion accuracy of the existing intelligent optimization algorithm. Therefore, the GA+FOA integrated method is used to invert the parameters qa, tanβ, θ, ba, s and ρ. The GA is a random search algorithm that can simulate natural evolution processes. The GA is derived from the ideas of “genetic selection” and “natural selection” [32]. The main function of the GA is to compare the optimization problem to a population, encode the parameters to be sought as chromosomes, perform the steps of selection, crossover, and mutation in an iterative manner, and finally generate chromosomes that meet the target requirements. The GA has high versatility and strong robustness and is suitable for solving multi-parameter models; its disadvantage is that the local optimization ability is insufficient. The fruit fly has a keen sense of smell and the algorithm tries to simulate this [33]. The FOA has a very keen sense of smell and vision and can find the source of a scent tens of kilometers away [34]. When it is close to the source of a scent, its keen vision can find the location of food and companions and then it quickly flies towards the target [35]. The advantage of the FOA is that the optimization accuracy is high and the algorithm is easy to be implemented by computer programming. Its disadvantage is that when the step length is set too large, the local optimization ability decreases, and if the setting is too small, the global optimization ability is poor. The GA+FOA integrated method combines the excellent global optimization ability of the GA and the good local optimization ability of the FOA. It can also achieve higher inversion accuracy for the improved mining subsidence model with an increased number of parameters. Based on the principle of the minimum RMSE between the predicted and true values (here, the true values are GPS displacements), the output parameters are the initial optimal parameters.
(3) Calculate the initial three-dimensional surface displacements. Based on the initial optimal parameters output in Step (2), the three-dimensional initial deformation of the ground surface is estimated according to Equations (5) and (7).
(4) Obtain the new LOS deformation field. Based on the three-dimensional surface displacements obtained in Step (3), the following equation can be used to obtain the simulated LOS deformation LOS’(i, j) [36]:
L O S i , j = W i , j c o s φ s i n φ U E W i , j c o s δ U N S i , j s i n δ
where δ represents the heading angle of the radar and UEW(i, j) and UNS(i, j) represent the horizontal movement of pixel (i, j) in the easting and northing directions, respectively. Now, we can calculate the absolute residual of the LOS-direction deformation, which can be expressed as L O S i , j = L O S i , j L O S i , j .
(5) Threshold judgment and loop iteration. We set a threshold ε for the absolute residual L O S i , j , here set to 10 mm. (i) If L O S i , j > ε , return to Steps (1)–(4) to start a new iteration; (ii) if L O S i , j ε , then output the current parameters as the optimal parameters of the model. Set the maximum number of iterations to 100.
(6) Output the optimal parameters of the model and obtain the final three-dimensional surface displacement field. Repeat Steps (1) (use the LOS’ as new input for the next iteration) through (5) until the closure error ΔLOS(i, j) < ε, thereby retrieving the parameters qa, tanβ, θ, ba, s and ρ and deriving the time-varying three-dimensional deformation fields from Equations (5) and (8).
Since this algorithm is established by combining OT and improved random medium theory (as introduced in Section 2.2), this algorithm is referred to as OT-IRMT. The flow chart of the OT-IRMT model is shown in Figure 2. The IRMT model (yellow box in Figure 2) is incorporated and utilized to analytically separate the vertical and horizontal components (Equation (7) in Section 2.2). The OT results (LOS dataset in Figure 2) are used to estimate the parameters of IRMT model. The significant advantage of the OT-IRMT is that it can accurately acquire the 3D large surface displacements using only two SAR amplitude images with the same imaging geometry.

3. Case Study

3.1. Study Area and Data Used in this Study

The study area is located in the Daliuta coal mining area, Shaanxi Province, China. The study area has thick loose layers, shallow coal seams, thin bedrock, and a small mining depth to mining thickness ratio, and the thickness of the coal seam is approximately 6.94 m. The average mining depth in the mining area is 235 m, and the inclination of the coal seam is 1°~3°, which is a near-horizontal coal seam. The strike length of the working panel is approximately 4547 m, the dip length is approximately 300 m and the strike is super-critical mining. The small mining depth to thickness ratio and the rapid advancement of the working panel make the ground movement in this area large. Ground movement due to coal mining has unique features, including the fast propagation of coal mining influences, discontinuous surface displacements, and a large probability of catastrophes such as stepped collapses, hillside slip and ground fissures (shown in Figure 3b,c). A single reference real-time kinematic (RTK) GPS was used to collect the coordinates of 71 ground stations along the strike (direction of the line formed by the intersection of the coal seam with a horizontal plane) and dip (direction of the line formed by the intersection of the coal seam with a vertical plane perpendicular to the strike of the feature) directions in the coal mine working panel (shown in Figure 3a).
Coal mining activity started on November 2012, and terminated on April 2013, along the southeast-northwest direction. The overlying bedrock primarily consists of siltstones and fine sandstones, with an average depth of approximately 200 m. The parameters of SAR data used in the study are shown in Table 1, and the schematic diagram of the mining panel is shown in Figure 3a.

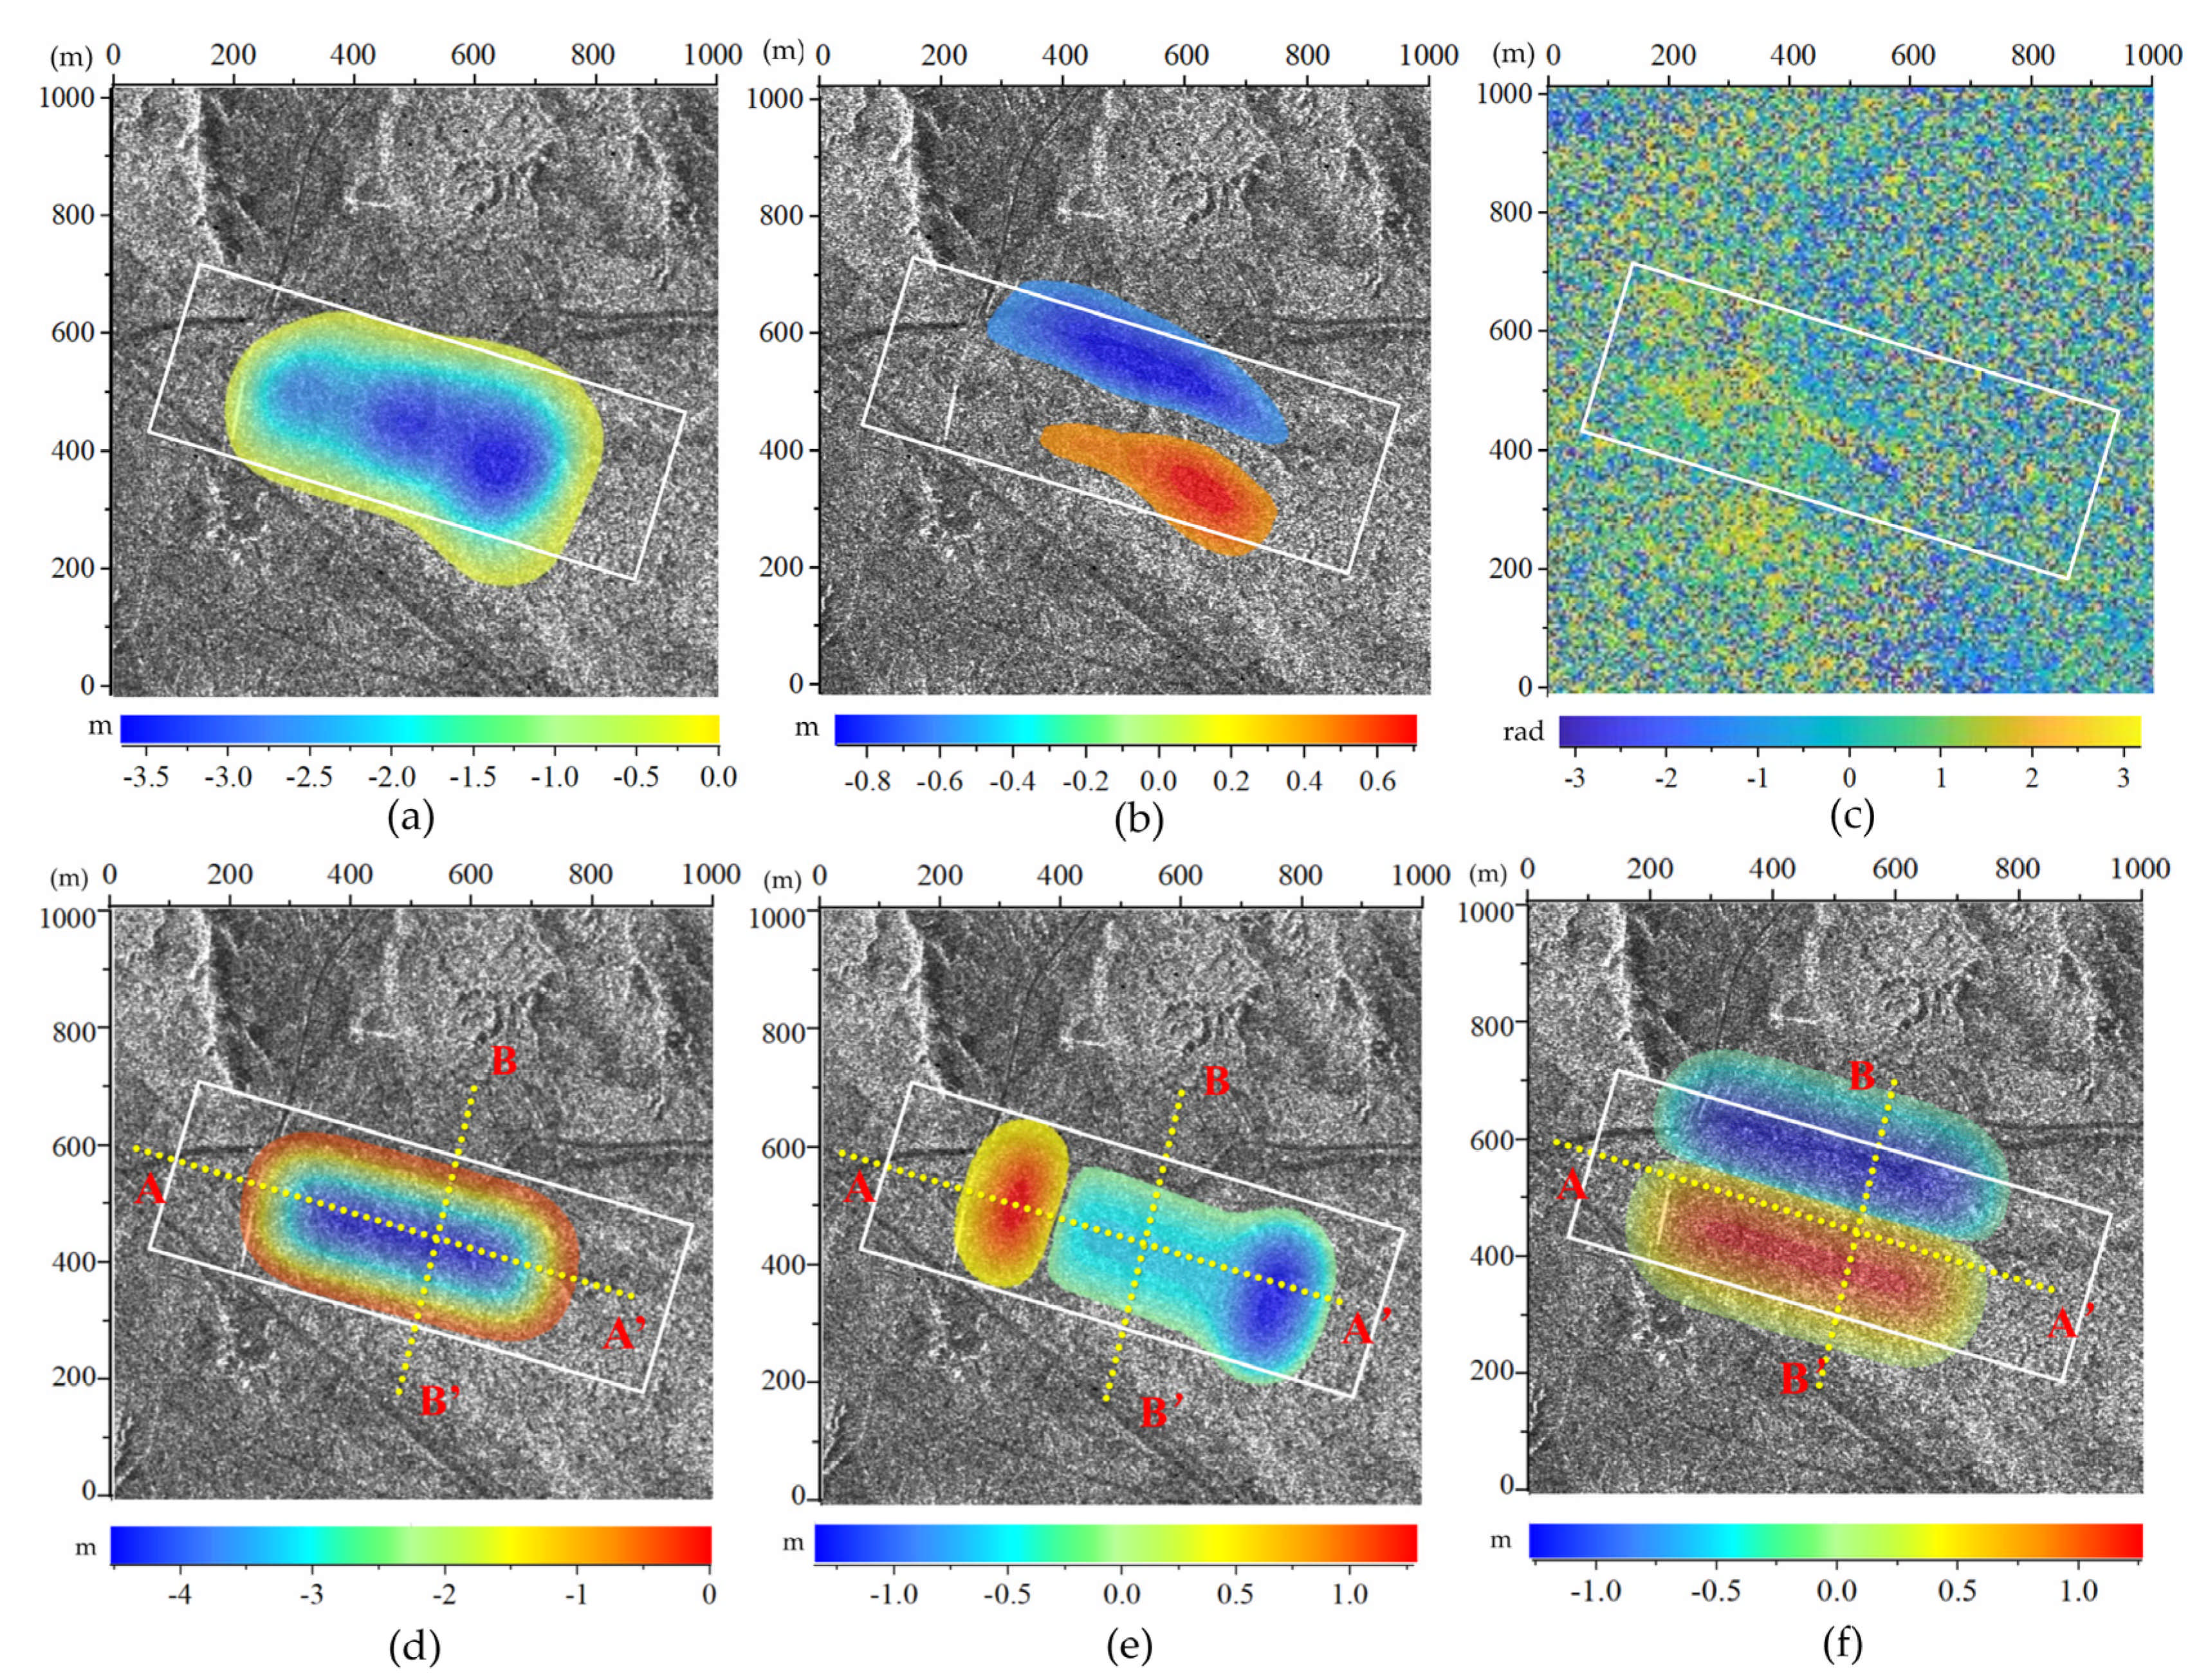
3.2. 3D Surface Displacement Model in the Study Area

GPS measurements show that the maximum subsidence during the period from 21 November 2012 to 2 April 2013 was approximately 4.4 m. The OT method was used to obtain the large surface displacements in the mining area. The Shuttle Radar Topography Mission (SRTM) digital elevation model (DEM) with a pixel resolution of 30 m × 30 m was used to remove topographic contributions [37]. The search window in the OT computation process was set to 64 × 64 pixels, and the oversampling factor to 2. The OT-derived surface displacements in the LOS direction were then employed to model 3D displacements with the method presented in Section 2.2. According to the algorithm flow shown in Section 2.3, 71 points (these points are colocated with the GPS measurements) along the strike line A-A’ and dip line B-B’ were extracted for parameter inversion for the improved mining subsidence model.
The GA+FOA integrated parameter method was selected to invert the model parameters: (i) set the initial range of parameters (as shown in Table 2); (ii) use the GA to perform parameter inversions 20 times independently; (iii) take the maximum and minimum values of each parameter inversion as the new optimization range; (iv) use the FOA to perform parameter inversions 20 times independently; and (v) the average values are output as the optimal parameters of the model. Table 2 shows the initial parameter ranges and the inversion results, whilst Figure 4 shows the distribution of parameter inversion values.
Based on the optimal inversion parameters of proposed model and Equations (5) to (8), the vertical subsidence and the horizontal movement are obtained (as shown in Figure 5).
Figure 5b illustrates the maximum vertical surface subsidence of approximately 4.5 m during the period from 21 November 2012 to 2 April 2013. The ground movement is shown as an elliptical area of displacements. Figure 5e,f show the maximum horizontal movements of approximately 1.4 m and 1.2 m in the strike and dip directions, respectively. A comparison between Figure 5e,f shows that the maximum horizontal movement in the strike direction was greater than that in the dip direction and that the horizontal movements in the dip direction were nearly symmetric. In addition, Figure 5e,f show that the horizontal movements were slight near the subsidence center, the maximum horizontal movement occurred at the edges of the mining area, and the horizontal movements decreased outside of the mining area.

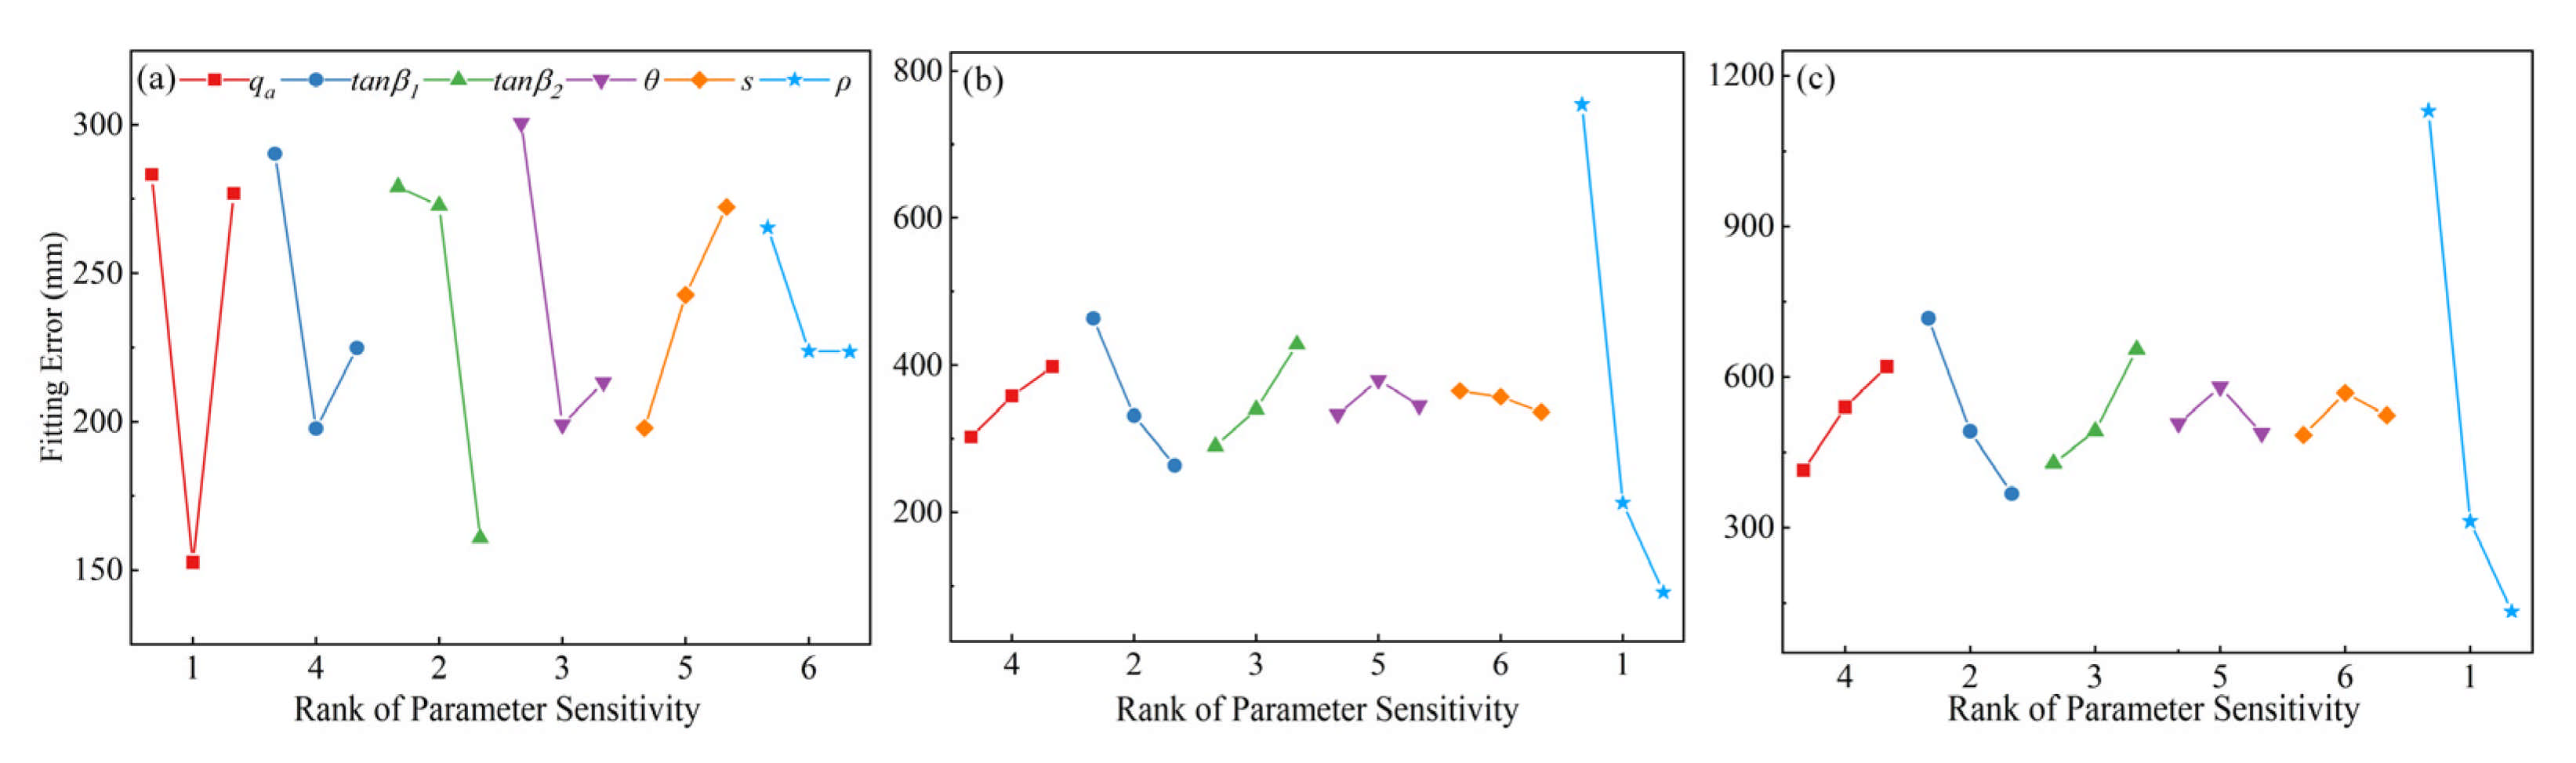
3.3. Performance Assessment

To assess the performance of the OT-IRMT model, we compare the 3D surface displacements with GPS derived displacements over the 71 GPS points on the working panel (Figure 3). Figure 6a,c show that the vertical displacements predicted by the OT-IRMT model were closer to GPS derived vertical displacements than those predicted by the original mining subsidence model, especially for the points at edges, e.g., Points 6–11 and 43–46 in Figure 6a and Points 5–8 and 19–24 in Figure 6c.
It is clear in Figure 6b that the horizontal displacements along Profile A-A’ were equal to zero in the area of critical or super-critical extraction for the original mining subsidence model, whilst the horizontal displacements predicted by the OT-IRMT model agreed well with GPS ones. For Profile B-B’, the OT-IRMT model was also in a better agreement with GPS measurements at the edges than the original model (Points 1–8 and 20–25 in Figure 6d). In terms of the RMSE of the differences between the predicted displacements and GPS-derived ones, the accuracies of vertical and horizontal displacements obtained by the OT-IRMT model increased by 28.2% and 37.5%, respectively, compared with those obtained by the original model. Figure 6e shows that the OT-IRMT derived vertical displacements were in good agreement with GPS measurements, with an RMSE of 6.8 cm (equivalent to 1.7% of the maximum subsidence). Figure 6f shows that the RMSE of the differences between the OT-IRMT derived horizontal movement and GPS measurements was 7.1 cm, which was 6.7% of the maximum horizontal displacement.
Chen et al. [30] and Yang et al. [38] combined the OT method and the original mining subsidence model to monitor the three-dimensional deformation in a coal mining area. The method proposed by Yang et al. [38] is based on the assumptions that (i) the horizontal movement at the edge of the mining area is zero and (ii) the horizontal movement is proportional to the tilting deformation, and the three-dimensional deformation model is solved by back-substitution method. However, as described in Section 2.1, the hypothetical model may not be consistent with the actual ground movements, and if there were uncertainties in the initial LOS-direction deformation, the back-substitution method would accumulate errors and thus lead to poor performance. The method proposed by Chen et al. [30] was mainly to address the problem of zero horizontal movements in the area of critical or super-critical extraction, but the issue of the fast convergence at the edges remained unsolved. Table 3 shows the comparisons among the offset tracking-clastic medium theory (OT-CMT) model proposed by Chen et al. [30], the OT-IRMT model proposed in this paper, and the alternative offset tracking-single amplitude pair (AOT-SAP) model proposed by Yang et al. [38]. Compared with the OT-CMT method, the OT-IRMT model improved 6.8% and 18.4% for the vertical and horizontal displacements, respectively. Compared with the AOT-SAP model, the OT-IRMT model improved 60.4% and 51.7% in the vertical and horizontal directions, respectively. The comparisons suggest the superiority of the OT-IRMT model. Note that the improvement of the OT-IRMT model compared with the OT-CMT method occurred mainly at the edges of the mining area, and hence the improvement was marginal. In contrast, the improvement of the OT-IRMT model compared with the AOT-SAP model was much greater, this was because the assumption of the AOT-SAP model that the horizontal movements and the tilt deformation are proportional during the modeling process may not hold true in the coal mining.

4. Discussion

The inversion accuracy of the OT-IRMT model parameters directly determines the accuracy of the OT-IRMT derived 3D surface displacements, and hence an orthogonal experiment was performed to examine the sensitivity of model parameters. The orthogonal experiment method is an experimental method to study the degree of the influence of multiple factors on a model [39]. This factor-equilibrium method can use a limited number of experiments to analyze the sensitivity of the model to the parameters. In this paper, the OT-IRMT model parameters, i.e., qa, tanβ1, tanβ2, θ, s and ρ were selected as the factors that influence the model accuracy. Table 4 shows the settings of the model parameters in the orthogonal experiment. Taking the three-dimensional directions of the ground motion, namely, the vertical, easting and northing directions, the differences between the measured and estimated values were used as indicators in the orthogonal experiment to analyze the sensitivity of the model to the parameters. Since the horizontal movement coefficient b only affects the horizontal motion, it was not included in the experiment.
Taking the geological mining conditions of the mining area as an example, the thickness of the coal seam at the simulated working panel was 5 m, the mining depth was 200 m and the coal seam inclination angle was 0°. The lengths of the strike direction D3 and the dip direction D1 were 400 m and 200 m, respectively. The overlying rock lithology was medium hard. Seventy observation points were arranged at 10 m intervals along the strike and dip directions (as shown in Figure 7).
The orthogonal table L 27 3 6 was calculated with 6 factors and 3 levels, as shown in Table 5.
After the 27 tests shown in Table 5, we obtained the analysis results of the orthogonal test (shown in Table 6). Through multifactor analysis of variance, the coefficient of determination R2 of the vertical monitoring accuracy in this experiment was 0.813. This means that the independent variables, namely, the parameters qa, tanβ1, tanβ2, θ, s and ρ, can explain 81.3% of the change in the dependent variables. In other words, if the independent variables remained unchanged, the degree of the change in the dependent variables would be reduced by 81.3%. Parameters qa, tanβ1, tanβ2, θ and s had significant impacts on the vertical displacements (p < 0.05), and ρ did not have a significant impact on the vertical displacements (p > 0.05). For the monitoring accuracy of horizontal motion in the easting and northing directions, the coefficients of determination R2 were 0.892 and 0.863, indicating that the independent variables qa, tanβ1, tanβ2, θ, s and ρ were able to explain 89.2% and 86.3% of the change in the monitoring accuracy in the easting and northing directions, respectively. Parameters tanβ1 and ρ had significant impacts on the easting and northing monitoring accuracy (p < 0.05), and qa, tanβ2, θ and s did not have significant impacts on the easting and northing monitoring accuracy (p > 0.05).
To determine the sensitivity of the 3D surface displacements to each parameter, the single-factor range comparison method was used to analyze the results of this experiment. Figure 8 shows the parameter trends with the order of sensitivity of each parameter as the horizontal axis and the error in the fit between the measured and predicted values as the vertical axis. It can be seen in Figure 8 that for the vertical direction, when parameter qa was at different levels, the range of the fitting error was the largest, indicating that it had the most significant impact on the vertical monitoring accuracy. The range of the fitting error of parameter ρ was the smallest, suggesting that it had the smallest impact on the vertical monitoring accuracy. For horizontal movements in both the easting and northing directions, parameter ρ had the most significant impact, and parameter s had the smallest impact.
To quantitatively analyze the impact of parameter changes on the accuracy of the 3D surface displacements in the mining area, the range of empirical values corresponding to the nature of the overburden was used for each parameter [40] combined with the abovementioned orthogonal test parameter sensitivity ranking results. The more sensitive parameters such as qa, tanβ1, tanβ2, θ and ρ were changed with a step of 0.01 or 0.1, the least sensitive parameter s was changed with a step of 1, and the estimated values in the vertical, easting and northing directions were calculated. Figure 9 shows the fitting errors.
It is clear in Figure 9 that the changes in qa, θ and s had great impacts on the monitoring accuracy in the vertical direction but had marginal impacts on the monitoring accuracy in the easting and northing directions. As shown in Figure 9a, when the error of qa reached 13% of the given true value, that is, the maximum error of the given range, the error in the vertical fitting accounted for 7.3% of the maximum subsidence while the easting and northing monitoring accuracy was almost unaffected.
In addition, as shown in Figure 9f, ρ had a great impact on the monitoring accuracy in the easting and northing directions but had limited effects on the vertical accuracy. When the error of ρ reached 125% of the given true value, which was the maximum error of the given range, the errors in the easting and northing accounted for 28.9% and 40.4% of the maximum horizontal displacements, respectively. This conclusion is consistent with the results of the orthogonal experiment. tanβ1 and tanβ2 had impacts on the vertical, easting and northing monitoring accuracy. Note that tanβ1 had a greater impact on the vertical monitoring accuracy than on the easting and northing monitoring accuracy, which is consistent with the orthogonal experimental results. When the error of tanβ1 reached 30% of the given true value, which was the maximum error of the given range, the errors in the vertical, easting and northing accounted for 6.2%, 1.5% and 2.1% of the maximum vertical and horizontal displacements, respectively. When the error of tanβ2 reached 46.7% of the given true value, which was the maximum error of the given range, the errors in the vertical, easting and northing fittings accounted for 8.4%, 2.9% and 3.8% of the maximum vertical and horizontal displacements, respectively. Note that although in the analysis of variance tanβ2 showed limited impacts on the monitoring accuracy in the easting and northing directions, its parameter sensitivity ranked the third in the range analysis, indicating that it still had to some extent impact on the monitoring accuracy in these two directions. This suggests that it is not rigorous to use multifactor analysis of variance to draw conclusions on the influence of parameters in the model, and it is necessary to combine range analysis to assess the sensitivity of the parameters. Based on the above analysis, when a parameter (except for ρ) fluctuated within the given range, the fitting error did not exceed 10% of the maximum deformation value. In this experiment, the parameters qa, tanβ1, tanβ2, θ and s were selected according to the lithology of the overlying rock to meet the requirements of mining subsidence monitoring accuracy, that is, no more than 10% of the maximum deformation value. On the other hand, it is necessary to set the range of ρ to [0.19, 0.69] (indicated by the dashed line in Figure 9f). From the analysis above, when we use the model in this paper to obtain the 3D surface displacements in mining areas, if the vertical subsidence error is large, we can focus on adjusting the parameters qa, tanβ1, tanβ2, θ, and s, which have greater impacts on the vertical monitoring accuracy, to achieve high monitoring accuracy. When the errors of horizontal movements in the easting and northing directions are large, the parameters ρ, tanβ1, and tanβ2 can be adjusted to obtain high monitoring accuracy.
It is worth noting that the OT-IRMT model has only considered one mining subsidence area in a specific type of geology and mining method. Mining subsidence with different topography, different mining depth and coal seam inclination may present different movement behaviours and require different forms of analysis. And the inversion accuracy of the OT-IRMT model parameters directly determines the accuracy of the OT-IRMT derived 3D surface displacements, but the increased number of the parameters in the OT-IRMT model may lead to a decrease in the inversion accuracy of the existing optimization algorithm, which is another limit of the model.

5. Conclusions

Coal mining often causes severe and large surface displacements in a short time, which can affect buildings and damage infrastructure and roads. In this paper, we combine the OT method and an improved mining subsidence model to extract three-dimensional large surface displacements in mining areas. One big advantage of the OT-IRMT model presented in this paper is that it can precisely recover the 3D large deformation of the ground surface using only two SAR amplitude images with the same imaging geometry. It is demonstrated in this paper that the OT-IRMT model is able to (i) extract surface displacements with large spatial gradients, (ii) avoid the problem of the original mining subsidence model converging too fast at the edges of the mining area, and (iii) address the issue of the original mining subsidence model causing zero horizontal movement in the area of critical or super-critical extraction. The RMSEs of the vertical and horizontal displacements were 6.8 cm and 7.1 cm, respectively. Compared with those of the original mining model, the monitoring accuracy of the OT-IRMT model in the vertical and horizontal directions had improved by 28.2% and 37.5%, respectively. It is believed that the OT-IRMT model can be used to monitor ground motion caused by mining activities and then use such information for disaster prevention and mitigation.
Note that the GA+FOA integrated method presented in this paper is time consuming, and an efficient inversion algorithm to determine the model parameters would be the next phase of this work. In addition, the 3D surface displacements retrieved in this article represent the total ground motion after the coal exploitation finished, and it would be valuable to examine the evolution of 3D surface displacements during the whole mining procedure in the future.

Author Contributions

Conceptualization, B.C. and Z.L.; methodology, H.M. and Z.W.; software, H.M.; validation, H.M. and H.Y.; formal analysis, H.M.; investigation, Y.Y.; writing—original draft preparation, H.M. and B.C.; writing—review and editing, B.C. and Z.L.; visualization, H.Y.; supervision, B.C. and Z.L.; project administration, B.C. and Z.L.; funding acquisition, B.C., Y.Y. and Z.L. All authors have read and agreed to the published version of the manuscript.

Funding

This work was supported by the Natural Science Foundation of China (reference numbers 41702375 and 41907240), the China Postdoctoral Science Foundation (reference number 2019M663601), the Key Research and Development Program of Xuzhou (Social Development, reference number KC20180), the Shaanxi Province Science and Technology Innovation team (reference number 2021TD-51), the Fundamental Research Funds for the Central Universities, CHD (reference numbers 300102260301 and 300102261108), and by the European Space Agency through the ESA-MOST DRAGON-5 project (reference number 59339).

Data Availability Statement

The data presented in this study are available on request from the corresponding author. The data are not publicly available due to confidentiality.

Acknowledgments

The authors acknowledge the provision of the TerraSAR-X data by German Aerospace Centre (TerraSAR-X Science Plan, No. LAN1425 and LAN1173). The authors are grateful to the Associate Editor (Tina Jiang) and four anonymous reviewers for their constructive reviews.

Conflicts of Interest

The authors declare no conflict of interest.

References

  1. Ma, F.; Gu, H.; Jie, G.; Rong, L. Analysis of ground deformation based on GPS in Sanshandao gold mine, China. J. Nepal Geol. Soc. 2018, 55, 7–14. [Google Scholar] [CrossRef]
  2. Dinescu, S.A. Using GIS/GPS for monitoring the closed mine areas. In Proceedings of the 17th International Multidisciplinary Scientific GeoConference SGEM2017, Albena, Bulgaria, 29 June–5 July 2017. [Google Scholar]
  3. Amelung, F.; Galloway, D.L.; Bell, J.W.; Zebker, H.A.; Laczniak, R.J. Sensing the ups and downs of Las Vegas: InSAR reveals structural control of land subsidence and aquifer-system deformation. Geology 1999, 27, 483–486. [Google Scholar] [CrossRef]
  4. Hooper, A. A new method for measuring deformation on volcanoes and other natural terrains using InSAR persistent scatterers. Geophys. Res. Lett. 2004, 31, 10029–10034. [Google Scholar] [CrossRef]
  5. Qing, Y.; Zhanqiang, C.; Yanqiao, W.; Yanxin, Z.; Songbo, H. Ground deformation of Dongsheng mining area revealed by multi-temporal InSAR. IOP Conf. Ser. Earth Environ. Sci. 2021, 675, 012029. [Google Scholar]
  6. Ishwar, S.G.; Kumar, D. Application of DInSAR in Mine Surface Subsidence Monitoring and Prediction. Curr. Sci. 2017, 112, 46. [Google Scholar] [CrossRef]
  7. Wempen, J.M.; Mccarter, M.K. Comparison of L-band and X-band differential interferometric synthetic aperture radar for mine subsidence monitoring in central Utah. Int. J. Min. Sci. Technol. 2017, 27, 159–163. [Google Scholar] [CrossRef]
  8. Fan, H.; Xu, Q.; Hu, Z.; Du, S. Using temporarily coherent point interferometric synthetic aperture radar for land subsidence monitoring in a mining region of western China. J. Appl. Remote Sens. 2017, 11, 26003. [Google Scholar] [CrossRef]
  9. Pawluszek-Filipiak, K.; Borkowski, A. Integration of DInSAR and SBAS Techniques to Determine Mining-Related Deformations Using Sentinel-1 Data: The Case Study of Rydułtowy Mine in Poland. Remote Sens. 2020, 12, 242. [Google Scholar] [CrossRef] [Green Version]
  10. Zebker, H.; Villasenor, J. Decorrelation in interferometric radar echoes. IEEE Trans. Geosci. Remote Sens. 1992, 30, 950–959. [Google Scholar] [CrossRef] [Green Version]
  11. Massonnet, D.; Feigl, K.L. Radar interferometry and its application to changes in the Earth’s surface. Rev. Geophys. 1998, 36, 441–500. [Google Scholar] [CrossRef] [Green Version]
  12. Yang, C.; Zhang, Q.; Zhao, C.; Ji, L.; Zhu, W. Monitoring mine collapse by D-InSAR. Min. Sci. Technol. 2010, 20, 441–500. [Google Scholar] [CrossRef]
  13. Zhao, C.; Lu, Z.; Zhang, Q.; Yang, C.; Zhu, W. Mining collapse monitoring with SAR imagery data: A case study of Datong mine, China. J. Appl. Remote Sens. 2014, 8, 83574. [Google Scholar] [CrossRef]
  14. Zhao, C.; Zhong, L.U.; Zhang, Q. Time-series deformation monitoring over mining regions with SAR intensity-based offset measurements. Remote Sens. Lett. 2013, 4, 436–445. [Google Scholar] [CrossRef]
  15. Huang, J.; Deng, K.; Fan, H.; Yan, S. An improved pixel-tracking method for monitoring mining subsidence. Remote Sens. Lett. 2016, 7, 731–740. [Google Scholar] [CrossRef]
  16. Gudmundsson, S.; Sigmundsson, F.; Carstensen, J.M. Three-dimensional surface motion maps estimated from combined interferometric synthetic aperture radar and GPS data. J. Geophys. Res. Space Phys. 2002, 107, ETG 13. [Google Scholar] [CrossRef]
  17. Samsonov, S.; Tiampo, K. Analytical Optimization of a DInSAR and GPS Dataset for Derivation of Three-Dimensional Surface Motion. IEEE Geosci. Remote Sens. Lett. 2006, 3, 107–111. [Google Scholar] [CrossRef]
  18. Guglielmino, F.; Nunnari, G.; Puglisi, G.; Spata, A. Simultaneous and Integrated Strain Tensor Estimation From Geodetic and Satellite Deformation Measurements to Obtain Three-Dimensional Displacement Maps. IEEE Trans. Geosci. Remote Sens. 2011, 49, 1815–1826. [Google Scholar] [CrossRef]
  19. Wright, T.J.; Parsons, B.E.; Lu, Z. Toward mapping surface deformation in three dimensions using InSAR. Geophys. Res. Lett. 2004, 31, 31. [Google Scholar] [CrossRef] [Green Version]
  20. HM, N.G.; Linlin, G.E.; Zhang, K.; Chang, H.C.; Xiaojing, L.; Rizos, C.; Omura, M. Deformation mapping in three dimensions for underground mining using InSAR—Southern highland coalfield in New South Wales, Australia. Int. J. Remote Sens. 2011, 32, 7227–7256. [Google Scholar]
  21. Gray, L. Using multiple RADARSAT InSAR pairs to estimate a full three-dimensional solution for glacial ice movement. Geophys. Res. Lett. 2011, 38, L05502. [Google Scholar]
  22. Samsonov, S.; Tiampo, K.; Rundle, J.; Li, Z. Application of DInSAR-GPS Optimization for Derivation of Fine-Scale Surface Motion Maps of Southern California. IEEE Trans. Geosci. Remote Sens. 2007, 45, 512–521. [Google Scholar] [CrossRef] [Green Version]
  23. Litwiniszyn, J. Stochastic Methods in Mechanics of Granular Bodies; Springer: Vienna, Austria, 1974. [Google Scholar]
  24. Fan, H.; Wen, B.; Liu, J.; Liu, J.; Yin, J. An improved method of three-dimensional displacement field generation in mining areas with a single InSAR pair. Eur. J. Remote Sens. 2019, 52, 493–503. [Google Scholar] [CrossRef] [Green Version]
  25. Yang, Z.; Li, Z.; Zhu, J.; Preusse, A.; Hu, J.; Feng, G.; Papst, M. Time-Series 3-D Mining-Induced Large Displacement Modeling and Robust Estimation from a Single-Geometry SAR Amplitude Data Set. IEEE Trans. Geosci. Remote Sens. 2018, 56, 3600–36101. [Google Scholar] [CrossRef]
  26. Wu, K.; Ge, J. Some modifications of using probability method to predicate model. J. China Coal Soc. 1998, 23, 33–36. [Google Scholar]
  27. He, G.; Ma, W. New knowledge of distribution of horizontal deformation caused by ground movement and “YY” program. J. China Coal Soc. 1987, 1, 5603490. [Google Scholar]
  28. Barbato, J.; Hebblewhite, B.; Mitra, R.; Mills, K. Prediction of horizontal movement and strain at the surface due to longwall coal mining. Int. J. Rock Mech. Min. Sci. 2016, 84, 105–118. [Google Scholar] [CrossRef]
  29. Wang, Z. Study on the Non-Linear Prediction Theory of Old Goaf Residual Subsidence and Its Application; China University of Mining and Technology: Beijing, China, 2011. [Google Scholar]
  30. Chen, B.; Li, Z.; Yu, C.; Fairbairn, D.; Liang, L. Three-dimensional time-varying large surface displacements in coal exploiting areas revealed through integration of SAR pixel offset measurements and mining subsidence model. Remote Sens. Environ. 2020, 240, 111663. [Google Scholar] [CrossRef]
  31. Heidegger, M. The Basic Problems of Phenomenology; Indiana University Press: Bloomington, IN, USA, 1988. [Google Scholar]
  32. Holland, J.H. Genetic Algorithms and the Optimal Allocation of Trials. Siam J. Comput. 1973, 2, 88–105. [Google Scholar] [CrossRef]
  33. Pan, W.T. A new Fruit Fly Optimization Algorithm: Taking the financial distress model as an example. Knowl. Based Syst. 2012, 26, 69–74. [Google Scholar] [CrossRef]
  34. Lin, S.-M. Analysis of service satisfaction in web auction logistics service using a combination of Fruit fly optimization algorithm and general regression neural network. Neural Comput. Appl. 2013, 22, 783–791. [Google Scholar] [CrossRef]
  35. Mitić, M.; Vuković, N.; Petrović, M. Chaotic fruit fly optimization algorithm. Knowl. Based Syst. 2015, 89, 446–458. [Google Scholar] [CrossRef]
  36. Fialko, Y.; Simons, M.; Agnew, D. The complete (3-D) surface displacement field in the epicentral area of the 1999 M_W7.1 Hector Mine Earthquake, California, from space geodetic observations. Geophys. Res. Lett. 2001, 28, 3063–3066. [Google Scholar] [CrossRef] [Green Version]
  37. NASA SRTM Version 3.0 Global 1 Arc Second Dataset. 2015. Available online: https://lpdaac.usgs.gov/documents/179/SRTM_User_Guide_V3.pdf (accessed on 1 October 2015).
  38. Yang, Z.; Li, Z.; Zhu, J.; Preusse, A.; Hu, J.; Feng, G.; Yi, H.; Papst, M. An Alternative Method for Estimating 3-D Large Displacements of Mining Areas from a Single SAR Amplitude Pair Using Offset Tracking. IEEE Trans. Geosci. Remote Sens. 2018, 56, 3645–3656. [Google Scholar] [CrossRef]
  39. Taguchi, G. Off-line and on-line quality control systems. In Proceedings of the International Conference on Quality, Tokyo, Japan, 6–12 September 1978; Volume 4, pp. 1–5. [Google Scholar]
  40. Darling, P. SME Mining Engineering Handbook; SME: Englewood, CO, USA, 2011. [Google Scholar]
Figure 1. (a) Local coordinate systems for coal mining. (b) Stress distribution of mining rock mass. (c) Comparison between the predicted subsidence from the original model and the true values (the dashed boxes show that the model converges too fast at the edges). (d) The geometric explanation of parameters r and β. W(x) is the subsidence curve under semi-infinite mining condition, i.e., when time t → ∞ and in x > 0, all the coal seam is exploited and in x < 0, the unmined coal seam remains. Surface deformation is mainly concentrated in the range of 2r above the mining boundary, this is the origin of parameter r; β is the angle between the horizontal and the line connecting the boundary point of the major influence range (i.e., −r or r) and the mining boundary point. (e) Plane-coordinate system for coal mining. Note that (i) B(u, v) represents one unit element, A(x, y) represents one surface point influenced by exploiting unit element B(u, v), D1 and D3 are the extraction length and width of the working panel, respectively. (ii) parameters r, β, and H represent the major influence radius, major influence angle and mining depth. (iii) W e i is the vertical displacement caused by exploiting unit element, parameters θ and α represent the propagation angle of the coal mine and coal seam inclination, respectively. s1 and s3 are the offsets of the inflection points at the lower and upper boundaries of the goaf in the main section.
Remotesensing 13 02541 g001
Figure 2. The flow chart of the proposed OT-IRMT model.
Remotesensing 13 02541 g002
Figure 3. (a) The study area with the coal mine working panels (green circles represent GPS stations, white polygons represent the working panels, and the white arrow represents the mining direction). (b,c) are ground fissures observed in the field.
Remotesensing 13 02541 g003
Figure 4. (ag) represent the distributions of the parameter inversion results. (a) is the distribution of sink factor of improved model, (b,c) are the distributions of tangent of the different major influential angle, respectively. (d) is the distribution of propagation angle of coal mining. (eh) are the distributions of offsets of the inflection points at the lower and upper boundaries of the goaf in the main section and the left and right boundaries of the main section, respectively. (i) is the distribution of improved coefficient of the horizontal movement and (j) is the distribution of scale factor.
Remotesensing 13 02541 g004
Figure 5. (a,b) are the deformation field obtained using OT. (a)shows deformation field in LOS direction. (b) represents the deformation field in azimuth direction. (c) shows the differential interferogram between 21 November 2012 to 2 April 2013. Predicted (d) vertical ground subsidence and horizontal movements in the (e) strike and (f) dip directions superimposed on the SAR amplitude image. Arrows shown in (e,f) indicate the directions of the horizontal movements. The white rectangle denotes the designed working panel, whereas the yellow circles indicate the locations of GPS points used for accuracy evaluation.
Remotesensing 13 02541 g005
Figure 6. Comparisons of the predicted displacements with GPS measurements. (a,b) represent vertical subsidence and horizontal movements along Profile A-A’, respectively, and (c,d) represent vertical subsidence and horizontal movements along Profile B-B’, respectively. (e,f) show scatter plots of the OT-IRMT and GPS derived displacements in the vertical and horizontal directions, respectively. (g,h) represent scatter plots of the OT-IRMT and GPS derived displacements along Profile A-A’ (strike direction) and Profile B-B’ (dip direction), respectively. Note that the solid line indicates the perfect fit between the predicted displacements and GPS derived displacements, whereas the dotted line indicates a least squares regression line between these two datasets. The errors of GPS measurements are about 1 cm in the easting and northing directions and 2 cm in the vertical direction.
Remotesensing 13 02541 g006
Figure 7. Schematic diagram of the relative positions of the simulated working panel and surface monitoring points. Note that blue points indicate monitoring points, and D3 and D1 indicate the strike length and dip length, respectively.
Remotesensing 13 02541 g007
Figure 8. Fitting error trends of each parameter. (a), (b) and (c) represent the fitting errors in the vertical, easting and northing directions, respectively.
Remotesensing 13 02541 g008
Figure 9. Fluctuations in fitting errors of various parameters.
Remotesensing 13 02541 g009
Table 1. The main geometric parameters of SAR images.
SatelliteAcquisition DatePass DirectionTemporal
Baseline/d
Perpendicular Baseline/mBandIncidence
Angle/°
Heading
Angle/°
TerraSAR-X21 November 2012Descending132−72.52X42.43189.53
2 April 201342.43189.53
Table 2. Parameter settings and inversion results.
Parameter q a t a n β 1 t a n β 2 θ (°) b a s 1 ( m ) s 2 ( m ) s 3 ( m ) s 4 ( m ) ρ
Initial range0.1–11–31–380–900.1–0.330–5030–5030–5030–500–1
Inversion value0.622.061.6887.90.27454546420.4
Table 3. Comparison of the accuracy of different monitoring methods.
MethodsOT-IRMTOT-CMTAOT-SAPImprovement in OT-IRMT vs. OT-CMTImprovement in OT-IRMT vs. AOT-SAP
Vertical RMSE6.8 cm7.3 cm17.2 cm6.8%60.4%
Horizontal RMSE7.1 cm8.7 cm14.7 cm18.4%51.7%
Table 4. Selected factors for the orthogonal experiment.
Parametersqa t a n β 1 t a n β 2 θ s ρ
True values0.752.01.585200.4
Range of values0.651.51.085200.2
0.752.01.286250.3
0.852.51.587300.4
Table 5. The results of the orthogonal design.
Experiment Numberqa t a n β 1 t a n β 2 θ s ρ
10.651.51.085200.2
20.651.51.085250.3
30.651.51.085300.4
40.652.01.286200.2
50.652.01.286250.3
60.652.01.286300.4
70.652.51.587200.2
80.652.51.587250.3
90.652.51.587300.4
100.751.51.287200.3
110.751.51.287250.4
120.751.51.287300.2
130.752.01.585200.3
140.752.01.585250.4
150.752.01.585300.2
160.752.51.086200.3
170.752.51.086250.4
180.752.51.086300.2
190.851.51.586200.4
200.851.51.586250.2
210.851.51.586300.3
220.852.01.087200.4
230.852.01.087250.2
240.852.01.087300.3
250.852.51.285200.4
260.852.51.285250.2
270.852.51.285300.3
Table 6. The results of orthogonal statistical analysis.
VerticalSS/106dfFp
Intercept1.521301.9270.000 **
qa0.1029.6750.002 **
tanβ10.0424.0380.041 *
tanβ20.0827.8930.005 **
θ0.0525.3880.018 *
s0.0121.0330.042
ρ0.0322.4970.118
Residual0.0714R2 = 0.813* p < 0.05, ** p < 0.01
EastingSS/106dfFp
Intercept3.361151.4680.000 **
qa0.0420.9440.413
tanβ10.1924.1740.038 *
tanβ20.0921.9970.173
θ0.0120.2390.791
s0.0020.0890.915
ρ2.24250.4590.000 **
Residual0.3114R2 = 0.892* p < 0.05, ** p < 0.01
NorthingSS/106dfFp
Intercept7.441106.0740.000 **
qa0.2021.4060.278
tanβ10.5624.0260.042 *
tanβ20.2521.7510.210
θ0.0420.3030.743
s0.0320.2250.801
ρ5.09236.3070.000 **
Residual0.9814R2 = 0.863* p < 0.05, ** p < 0.01
Note that SS represents the sum of squares, df represents the degrees of freedom, F represents the test for homogeneity of variance, p represents the significance and R2 represents the coefficient of determination.
Publisher’s Note: MDPI stays neutral with regard to jurisdictional claims in published maps and institutional affiliations.

