1. Introduction
The failure of bridges may be due to incorrect geotechnical evaluation, over-loading, concrete/metal corrosion or lack of inspection [
1] and, rarely, poor design. Water-scour of foundations is a significant and often unpredictable cause of problems in bridge supports [
2,
3]. Deng and Cai (2010: [
4]) considered it to be one of the main causes of failure, presenting over 1000 cases from 1961 to 1991 in the United States alone, with an attendant annual maintenance cost of over USD 30 million. Whilst modern design practices take increased flood events into account, future climate change is not currently reliably predicted. Older bridges, which would benefit from closer monitoring, typically did not consider these factors at the design stage and so rarely benefit from the mitigatory construction of modern structures, such as that seen in flexi-arch bridges [
5].
Deng and Cai (2010, [
4] p. 125) stated that “Scour is the result of the erosive action of flowing water, which excavates and carries away materials from the bed and banks of streams, and from around the piers and abutments of bridges”. They observed (also p. 125) that “there are generally three types of scour that affect the performance and safety of bridges, namely, local scour, contraction scour, and degradational scour”. These are common in the gyratory currents of the marine realm (see [
6] on the collapse between Belfast and Dublin, Ireland, for instance) but also occur in rivers and, to some extent, lakes; in this work, we focused on a fluvial system with two different bridge types.
Sonar surveys have been typically applied to quantify water depths and water–sediment interfaces, and to identify/locate objects [
7]. Sonar does, however, have limitations, including: the inability to penetrate beneath the sediment–water interface, rocky substrates, weed infestation and gas bubbles [
8]. Ground-penetrating radar (GPR) is commonly used to investigate terrestrial engineering structures and the surrounding environment, but has rarely been used when surveying in fresh water.
The aim of this paper was to first evaluate previous studies where water-penetrating radar (WPR from hereon) was used for the inspection of sub-bottom channel profiles around structures such as bridge piers in freshwater; secondly, to detail a case study where we have used both WPR and sonar to investigate bridge scour and infill; and thirdly, to combine the results to create a 3D model of the study site as an exemplar.
Ground-Penetrating Radar (GPR) Applied to Water-Penetrating Radar (WPR)
It is beyond the scope of this paper to review in detail all GPR and electrical geophysical survey methodologies; only a brief introduction to the relevant concepts is given here and the interested reader is referred to geophysical textbooks [
9,
10,
11]. GPR uses the transmission and reflection of electromagnetic waves (typically 25 to 1000 MHz depending on the desired resolution and depth penetration) in soil, rock, water/ice and sediment. A GPR system requires source and receiving antennas (measuring the same central frequency). The transmitter–receiver array is typically moved along a survey profile and radar traces are collected against a pre-set time or distance interval to produce a time–distance cross-section (called a radargram in some studies in the literature); these may have been collated into plan views typical of other geophysical surveys. Alternatively, one antenna may be moved away from a static antenna to create a moveout profile. Radargrams possess two properties that are of particular interest here: (a) reflections at interfaces between two geological media of differing dielectric permittivity; and (b) radar wave attenuation (or signal loss) as a function of fluid electrical conductivity and wavelength [
9]. A number of key features of GPR antennas relevant to this study are summarised. Antennas may be built to transmit and receive a range of frequencies, from low (e.g., 25 MHz) to very high (e.g., 2–3 GHz). Most common for subsurface surveying (including in freshwater) would be antennae in the 50 to 500 MHz range.
This study tested 50, 100, 200 and 250 MHz antennas, the results of which are outlined below. Antennas may be left unshielded, making the results of GPR surveying prone to nontarget artefacts (e.g., metal poles, power lines and out-of-plane objects) but leaving a lightweight and flexible design. Shielding of the antennae partly removes this problem of such interference but creates a relatively inflexible design. Antenna orientation can influence results, with different orientations achieving varied subsurface resolutions, balanced with being prone to out-of-plane reflections [
12]. For boat-borne GPR surveying, the dimensions of the vessel often determines antenna size and orientation for lower-frequency antennas such as 100 MHz or lower [
13]. GPR data can be extensively processed to remove artefacts and improve clarity; a full description of what processing steps are available and what they do can be found in: [
9,
11]. Freshwater GPR surveys are generally successful [
14,
15], although, as with all geophysical surveys, there is the choice of improved resolution at shallow depths (in GPR with higher-frequency antennas) vs. poorer resolution but with a greater depth range (in GPR with lower-frequency antennas). Most surveys of sediment thickness/type deploy lower-frequency antennas, attempting to image subsurface sediments [
16,
17,
18,
19]. The primary difference between terrestrial GPR and aqueous WPR is antenna deployment; in GPR, these are used in assessing ground conditions, with the antenna moved across the surface of the area to be investigated. In WPR, such antennas are positioned in contact with fresh water, be it within a non-metallic, single-skin boat, or on/within the water (water-proofed as necessary). Some work (see above) has trialled suspending antennas above water, with a resultant airgap that may diminish results. Variations in water conductivity (e.g., salt content in brackish/coastal waters) and type(s) of suspended matter affect radar wave propagation and reflection [
20] such that in some brackish lakes and lagoons, WPR will not work well. This is because fresh- and saltwater have similar dielectric properties (~80 each) and radar velocities (fresh is 0.033 m/ns; saltwater is 0.01 m/ns) but very different conductivities (freshwater is 0.5 mS/m; saltwater is 30,000 mS/m). This results in a low radar wave attenuation in freshwater and high deterioration in saltwater, which simply absorbs radar waves at the frequencies needed. A summary of water-penetrating radar or WPR can be found in [
20], who suggest that because water is relatively homogeneous, radar waves penetrate easily but slowly. Radar wave transmission is facilitated along the water–air interface, causing out-of-plane anomalies when floating objects are present. Conversely, excellent cross-sections of water depth, with suspended objects, as well as sediment subsurface, are obtained using WPR in fresh water. Two WPR data outputs are possible: most common are 2D radargrams (vertical soundings of water and sediment) and, more rarely, 3D plan views at various depths. These map-like outputs comprise digital data and can be subjected to manipulation in a Geographic Information System such as ARC-GIS, but require accurate geolocation on a grid or by GPS. Although WPR has been used to successfully image scour around bridge supports (e.g., Gorin and Haeni, 1989, and see below), the current work showed 2D radargrams, digitised 3D plan views, selected processed data of bridge scours and made an evaluation of each data output type. A critical factor in WPR data acquisition is the mode of antenna deployment (in water/out of water; within boat/type of vessel and base; antenna orientation): [
21] reviewed previous methods of WPR surveying for a range of applications, and they commented that many authors do not state this, something we (here) do explicitly.
2. Previous Work
A pioneering study in [
13] used low-frequency 80 MHz WPR data, compared to three seismic (or acoustic) methods (black and white fathometer; colour fathometer; tuned transducer), in their study of sediment scour around road bridge supports along the Connecticut River (USA). In their study, WPR suffered less sidescan anomalies and penetrated the sub-bottom sediments more effectively than the acoustic methods, but few details on WPR data acquisition were provided (e.g., antenna orientation). Refs. [
22,
23] had similar intentions to [
13] in assessing scour around bridge supports in rivers; their work compared both their own 100 and 450 MHz antenna profiles to those from the literature and the water conductivities/water depths in each. These both clearly showed the interplay between low frequency and better depth penetration, vs. higher antenna frequencies with improved stratigraphic detail but less penetration—both limited by increasing water conductivities. Ref. [
23] also showed how an initial review of the location, water conductivity, engineering, river flow, previous work and local geology are essential in planning a WPR survey. They also elucidated some of the issues in WPR surveying in that objects/surfaces not directly under the boat may be imaged, due to the high transmissivity of radar waves at the air–water interface (surface out-of-plane reflections such as jetties, piers and buoys); water-bottom multiples may dominate the sub-bottom reflections without processing (see below) and the limits of water depth.
Ref. [
24] used a 300 MHz radar antenna array to gather 22 lines around 16 bridges in New Hampshire (USA), documenting pre- and post-flood scour holes plus infilled scour at seven locations. Where possible, the results were verified by insertion of a steel rod, for both water depth and sub-bottom sediment thickness. A similar deployment method was used as in this study, by placing a commercially available GPR system in the base of an inflatable boat; water levels (and, thus, changing depths) were elucidated. WPR data processing included migration and signal amplification (gain) on profiles on deeper water, to enhance sediment reflections.
Refs. [
25,
26] followed the work of [
27] with evaluations of the use of WPR in assessing bridge-support-related scour. Ref. [
27] acquired WPR data from ten bridge sites over shallow water in Missouri (USA), using boat-borne methods or lowering the radar antenna from bridge decks. Their 2D profiles successfully imaged the base of each water body, some at peak flood times. Both works considered the use of 2D profiling before and during floods as a predictive tool in risk management, as well as WPR surveys over time, to build up a model of changing fluvial processes that they consider superior to reflection seismic 2D profiling, echo sounding and electrical conductivity profiling. Ref. [
25] made the contentious comment that the radar system does not need to be in contact with water, which is correct (see [
17] although, naturally, optimal coupling between the antenna and water is desirable.
Following abundant publications on the use of WPR in assessing scour through the 1980s and 1990s, there appears fewer mainstream publications until 2020, when [
28] considered the complicating issue of wood debris accumulating at bridge supports, which may accelerate circulatory scour by expanding the effective footprint of the bridge pier, as well as setting up internal vortices between wooden objects, especially tree trunks and branches. [
21] summarised many of the above articles and commented that advances in radar technology (e.g., the wide use of multiplexer systems); the use of borehole antennas in deep (over 20–30 m) water; a conjunctive approach with sonar (especially remotely deployed sidescan systems such as the Codaoctpus), and CHIRPS; and data processing and visualisation may still further advance the use of WPR in assessing bridge scour.
3. Site Description
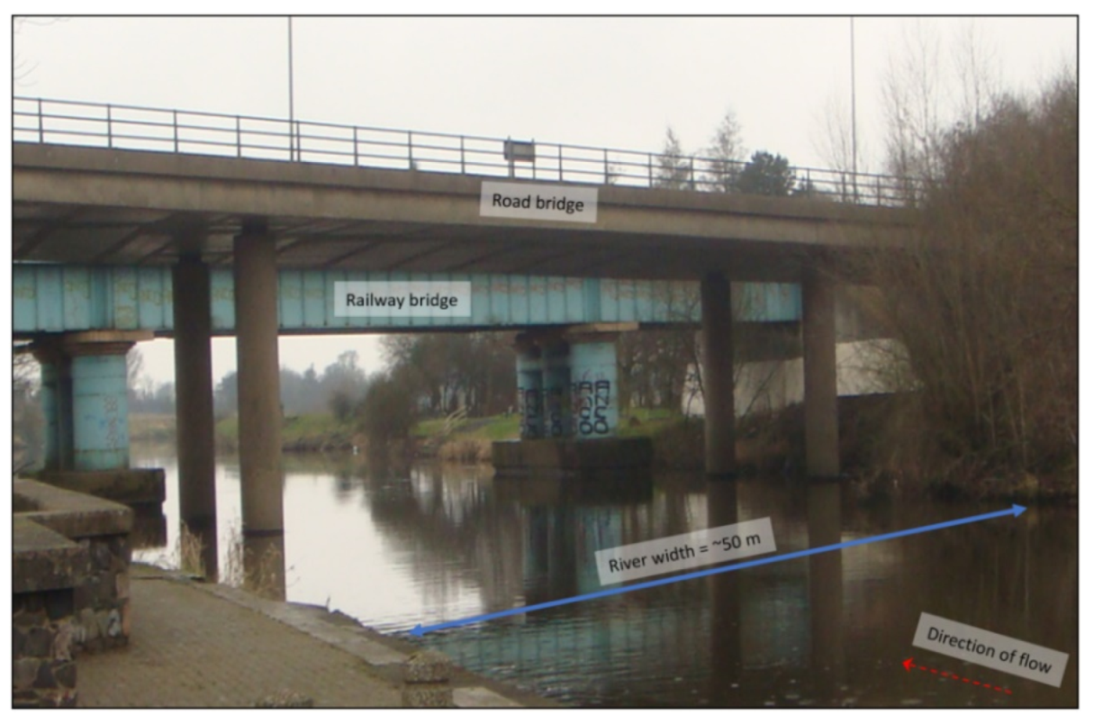
This site was used for two reasons. First, because, within a relatively short distance of 40 m, there is both a road and rail bridge, crossing a navigable section of the River Bann, on the southern outskirts of Portadown, County Armagh (N. Ireland)—
Figure 1 shows a satellite image of the two bridges.
The road bridge is a reinforced concrete deck bridge supported over the river on four circular reinforced concrete piers (in the foreground of
Figure 2). The railway bridge is seen in the background of
Figure 2 and consists of a metal truss deck on circular metal supports on top of two piled foundation-reinforced concrete piers.
Secondly, the River Bann is one of the longest rivers in Ireland, with this section being adjacent to a slipway facility; this section of river experiences a significant volume of water, as well as wash effects from powerboats and other river activities. At the location of these two bridges, the River Bann narrows and becomes slightly shallower, which leads to pressurized flow at the supports which, in conjunction with motorized boat movements, may encourage scouring action at these structures [
29,
30].
The A3 Northway Dual Carriageway Bridge (road bridge built in two phases through the early 1970s) has four circular reinforced concrete vertical supports (
Figure 2) whilst the Belfast–Dublin railway bridge (current construction 1958–1960, replacing an 1848 wooden structure) has two, elongate vertical reinforced piled concrete support (lozenge-shaped, or rectangular, with acute ends) piers (
Figure 2).
This location presented a good opportunity to consider the scouring effects around two separate bridge pier types of two separate bridges adjacent to each other in the same short stretch of river. The main caveat to this is that the relative proximity of each, implies the possibility of alterations in current flow from the upstream road bridge supports, may influence scour around the downstream railway bridge structures (
Figure 2). Conversely, for infrastructural and topographic reasons, road, rail and other (e.g., pipeline) bridges are often constructed side-by-each, making this study relevant. The road bridge comprises a multi-span-reinforced concrete bridge which carries 3 lanes of arterial route traffic. There are four circular piers located in the water: two are near the edge of the riverbank (depending on flood conditions) each consisting of circular concrete columns of 1.5 m in diameter. These columns are spaced ~10 m apart and the span between the four piers is ~20 m (approximate distances as the sides of the river are not linear and are sometimes arcuate). The railway bridge has two tracks (North-East Bound and South-West Bound) with two 15 m long and 2 m wide piers, founded on piled foundations in the riverbed, but closer (1–2 m) to the riverbank than the central roadway piers, leaving a clear navigable channel down the centre of the watercourse.
The River Bann is typically 30–60 m wide at the study location and is popular for both fishing and water-sports, with a 30% “good”, 55% “moderate”, 10% “poor” and 5% annual water quality classification by the Department of Agriculture and Economic Affairs/Northern Ireland Environment Agency [
31]. Conductivities were measured for both survey times (March and September) at between 0.02 and 0.04 µS/m; pH was consistently measured at 6.5 and eH at +20, reflecting the iron-rich Palaeogene basaltic (Antrim Lava Group) river hinterlands, the underlying Palaeogene Lough Neagh Clay Group, and the red, oxidised glacial till of the river and its catchment in this area.
There is no marine influence, as the site is inland, with the river draining north to Lough Neagh, Europe’s largest freshwater lake, and being fed by rainfall riverine catchments upstream. Depth-soundings using a plumb bob indicated that the river has variable depth in and around the bridges, from 0 m at the banks, to an average of 3 m, with isolated locations up to 5 m (see Methods, below). This variability makes hydrographic surveying particularly relevant, as physical soundings (such as rods or plum-bob) are specific to discrete locations and may not be representative of the entire area.
4. Methods
Visual examination of the riverbed from the bank and dinghy, plus indications from plumb-bob soundings, suggest the riverbed to comprise both rocks and soft silt/mud. A carbon-fibre peat probe (Van Walt Ltd., 75 cm extension lengths, Surrey, UK) was also deployed and, as with the plumb-bob, no obvious firm substrate could be felt in the river centre by the user: rocks were detected adjacent to the riverbanks. The use of WPR is very relevant under such mixed subsurface conditions as sediment type may be indicated, buried objects located and sediment depth (or indeed lack of sediment, say, rock at surface) determined.
Three phases are considered in WPR surveys: air/gas, water and sediment/rock. Of the three phases present, air/gas bubbles were only present when sediment was disturbed, and they have a negligible effect on radar waves; freshwater was considered here and the boundary between it and the underlying rock/sediment was always imaged. In order to study the efficacy of the two main data outputs in WPR, (i) 2D profiles and (ii) 3D fence diagram views were generated (see below). A Sidescan Sonar survey using a Lowrance Elite 12Ti Totalscan was also conducted in order to further calibrate/compare to WPR depths and to identify any submerged hazards for health and safety considerations.
Initial tests used 50 MHz and 100 MHz rough terrain (unshielded) antennas, housed in thick plastic sheathing and towed behind the electric motor-powered (MinKota Ltd., Racine, WA, USA, 12v Trolling engine) inflatable rib (
Figure 3A). These antennas proved hard to manoeuvre in the 30–60 m-wide river, showed limited detail in the 0–6 m of water depth and suffered from numerous out-of-plane reflections from the bridge piers, metal riverbank signage, subsurface debris and trees.
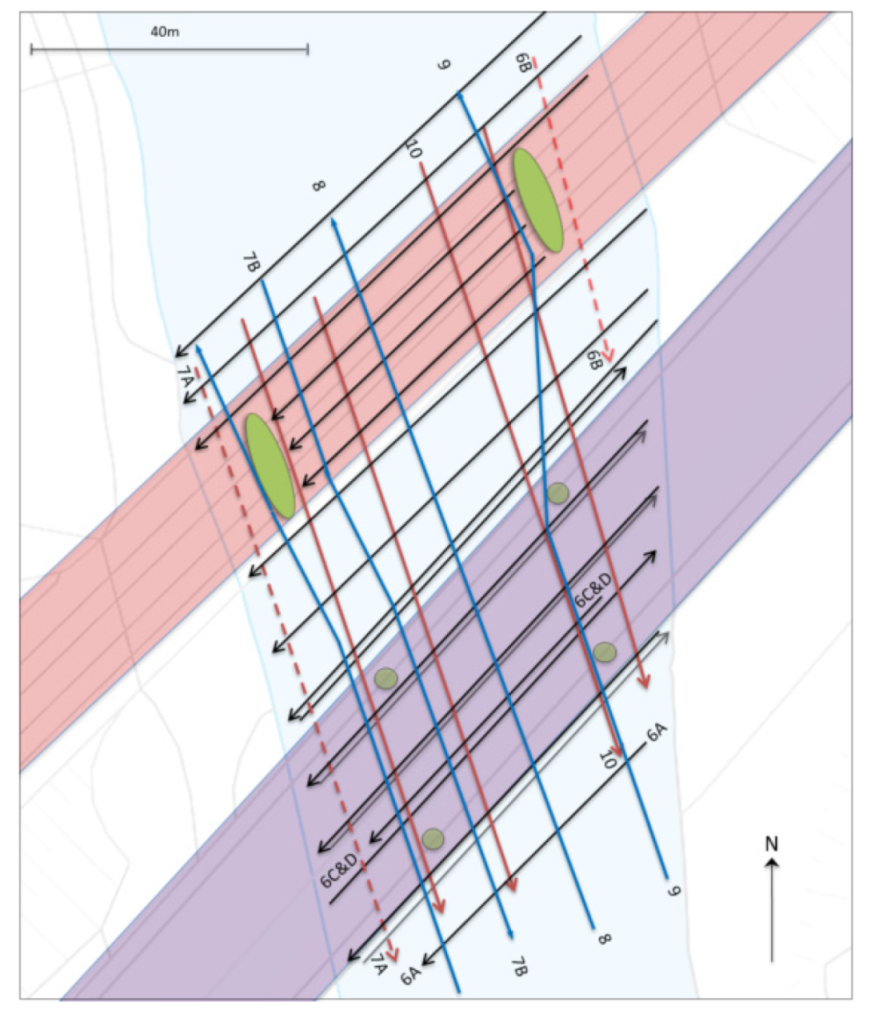
Then, 100 and 250 MHz shielded antennas in parallel and broadside endfire mode were used for the bulk of the surveys, with an unshielded 200 MHz antenna (also in both parallel endfire and parallel broadside mode) deployed to compare with data from the 250 MHz shielded antenna. A grid of survey data around all six piers was gathered and positioned using a Leica Icon Total Station, checked by dead-reckoning of landmarks such as bridge piers: differential GPS was only accurate for the start and end points of the river-parallel survey lines, when not under either bridge, a common problem also encountered when surveying under buildings and tree cover.
Each radar antenna was placed in the base of a 4-person, 6 m-long, 3 m-wide (Avon Boats Ltd., Stratford-upon-Avon, UK) inflatable plastic dinghy with foot-slats removed (
Figure 3), propelled by an electric outboard engine. Running a survey with the engine off (drifting in the wind or current) and then running one with the motor on had negligible effect on the radar data (noted on figures, where present). The radar antennas were set directly onto the rubber floor of the dinghy, allowing for the contact with the water through a minimal thickness of 5 mm of rubber. We considered mounting unshielded antennas outside of the dinghy, but this was precluded by the decreased manoeuvrability around bridge piers and the presence of 5–10 cm-amplitude waves from wind, passing vessels and our own survey.
Problems encountered included (
Table 1): loss of positioning information around both bridge piers (the total station could only be placed on the west bank footpath; the east bank was inaccessible due to industrial wire fence and thick vegetation); drift in the dinghy during windy conditions; the need to stop or re-run cross-river survey lines when other water craft approached; and the presence of debris in shallow water, adjacent to riverbanks such as tree branches, shopping trollies (carts), discarded metal work (railings) and dumped bicycles. If a wind-generated drift of more than the width of the dinghy (and, thus, for all antennas used, roughly the radar-wave footprint at the boat-deck to water interface) was recorded, the survey line was deleted and re-recorded.
The WPR data were initially viewed onsite and, later, in Mala Geoscience MV Groundvision (Version 1.4) software in which clear images of both the riverbed and sub-bottom sediment profiles were obvious, even when air-water multiples, causing ringing in the data, were prevalent. Data were also viewed in Sandmeier’s ReflexW (Version 7.2.4) software for comparison. Both Gain and Background Removal filters were applied to all 2D profile data (for consistency), with no further requirement for other data processing steps. Velocity could only be calculated to the water depths (as normal moveout requires two dinghies in water, and hyperbola-fitting needs accurate distance measurement), calibrated against plumb-bob and probe estimates. Depths to water-bottom and sediment reflectors were interpreted and digitised for import to ARC-GIS and AutoCAD visualisation software. The latter outputs allowed secondary import to Google SketchUp to visualise the bridge support scour and sub-scour sediment geometries (see
Table 2 below, and Results). A complimentary sidescan sonar survey of the study site was also collected using a Lowrance Elite 12Ti Totalscan, operating at 10 Hz in continuous data collection mode, with no data processing.
5. Results
The sidescan sonar data were successfully acquired, detailing any potential submerged hazards present in the water for the subsequent WPR surveys, showed the sides of the bridge piers effectively (an example in
Figure 4), and imaged some riverbed objects, but they suffered from gas bubble interference and from sonar scattering from rocks that are typically observed at such shallow water depths.
Notably, the 100 MHz data showed the best balance between resolution and depth, so these were deployed for the bulk of the survey area, in conjunction with the 250 MHz data, especially in shallow waters on the riverbank sides of the bridge piers where deeper water penetration was not needed (
Figure 5).
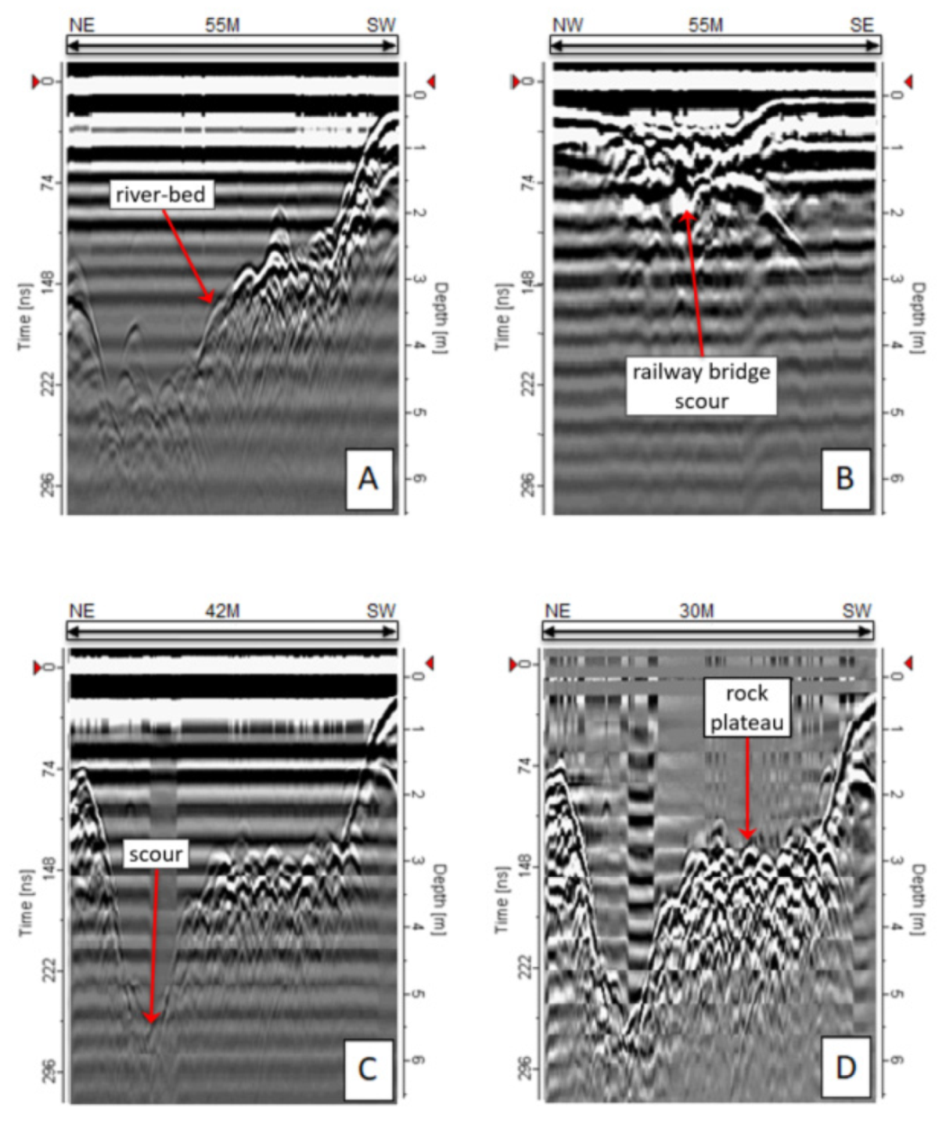
The short cross-lines (all original data are available, on request) shown in
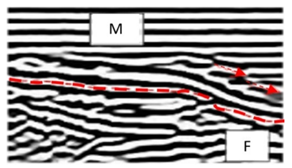
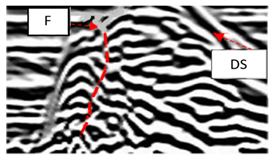
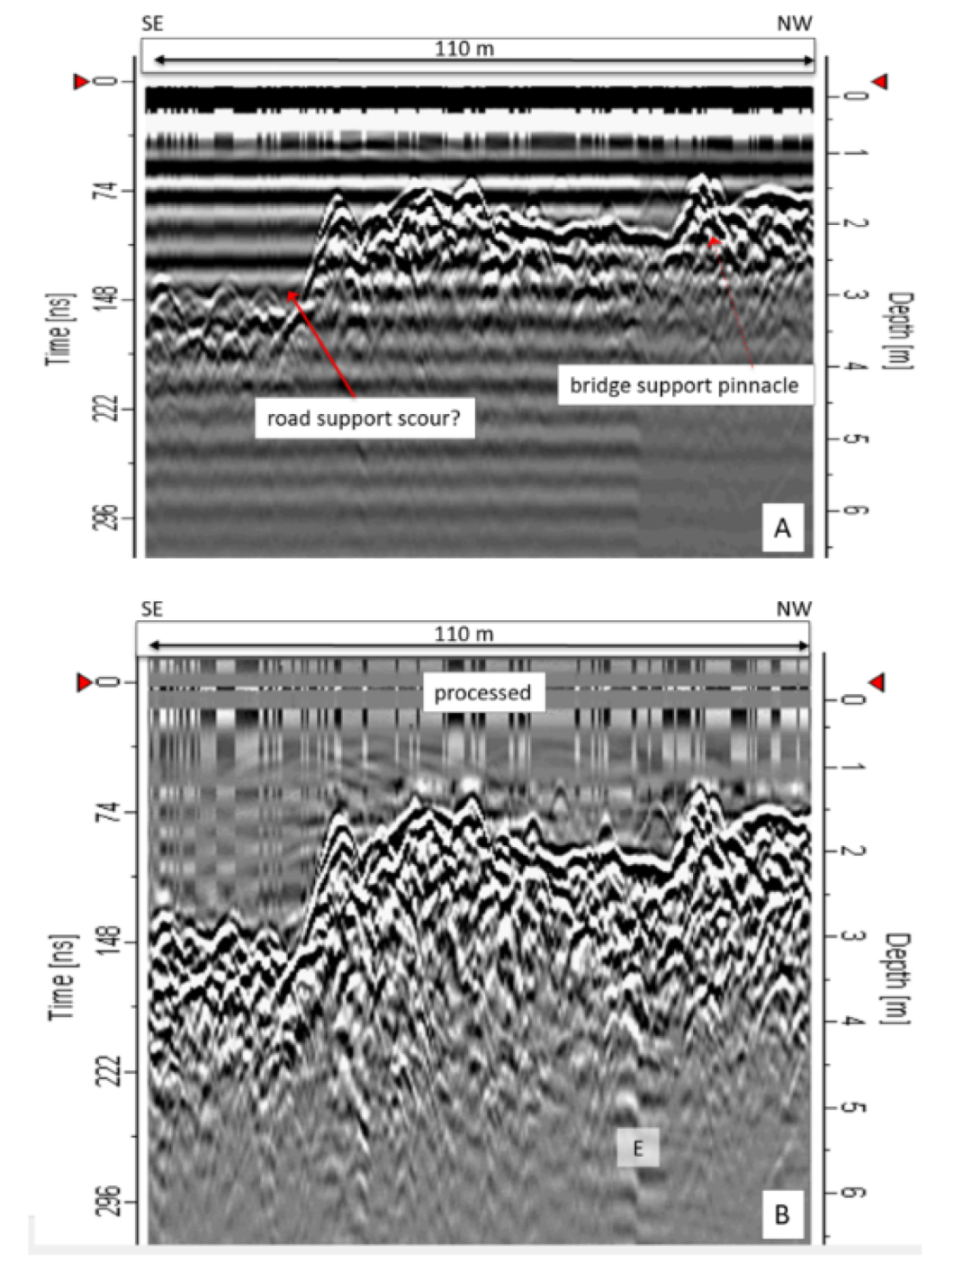
Figure 6 show changes in bathymetry across the river, as well as some detail below the water-sediment surface. Processing of the data, as shown in the examples of
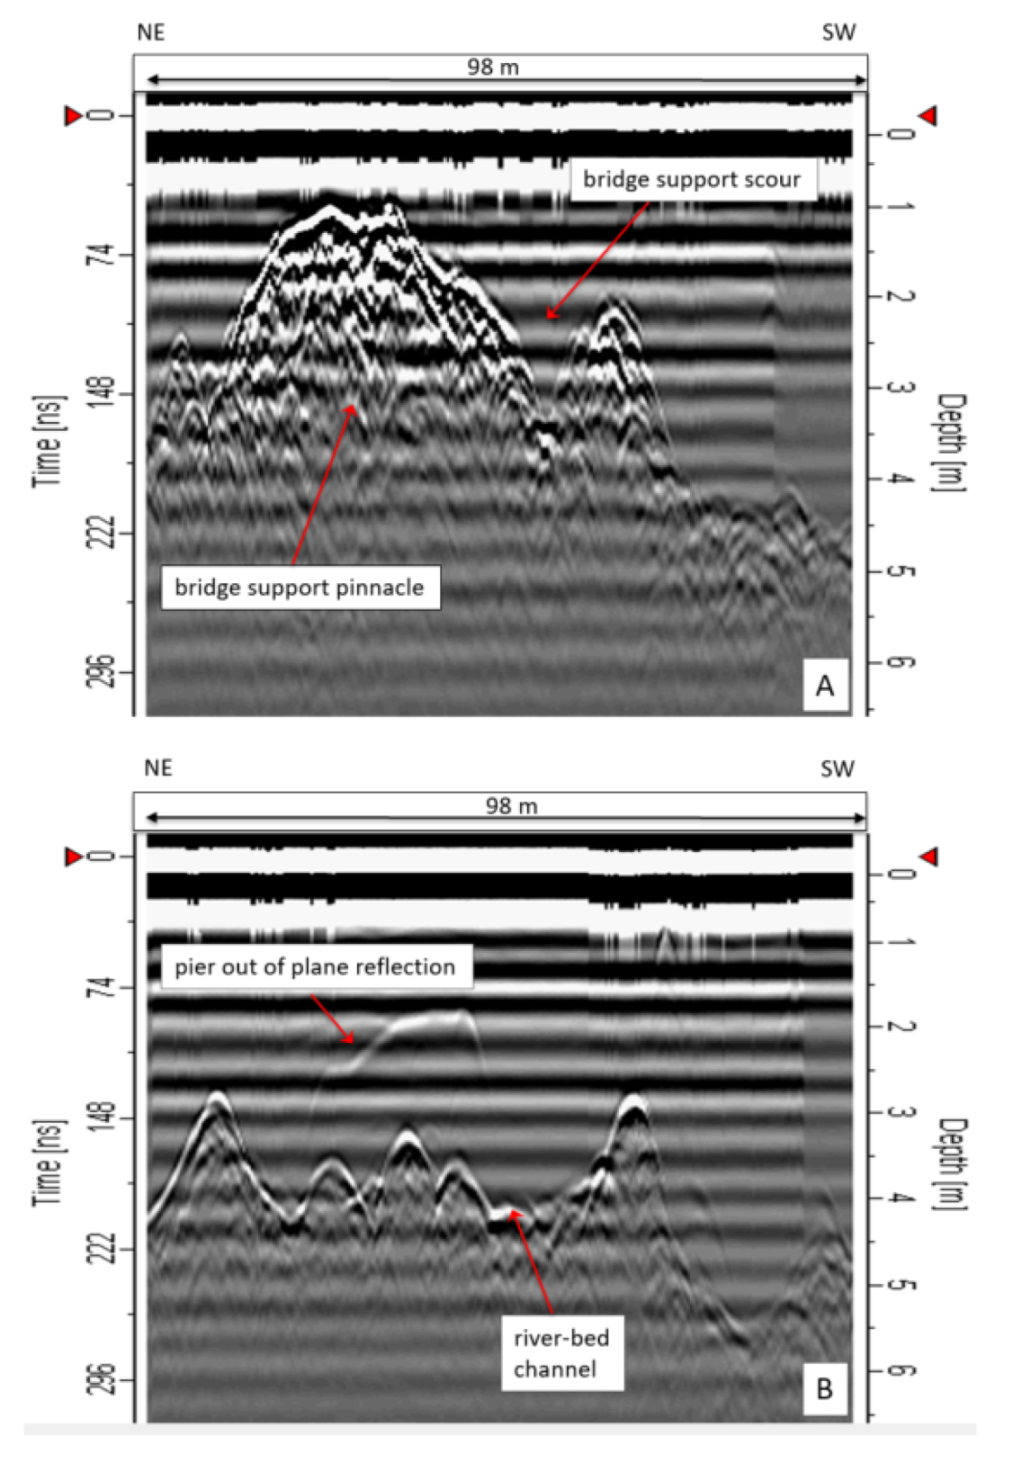
Figure 6 and
Figure 7, improves the data quality, allowing rocky outcrops, hollows (from scour) around bridge piers, subsurface objects and an indication of sediment thickness to be observed.
Data interpretation followed the methods of [
11] in picking strong, continuous reflections for digitising: these surfaces separate distinct radar facies (see
Table 2). When interpreted and digitised, these 2D profiles were then combined (
Figure 10), which allowed a crude view of the area under both the road bridge and its four supports, as well as the railway bridge with the two elongated piers plus deeper areas of water and a central rock outcrop (
Figure 11) to be determined. The plan view of water depth in the same survey area (
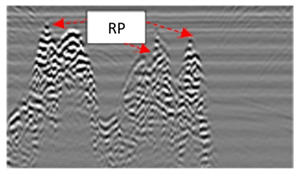
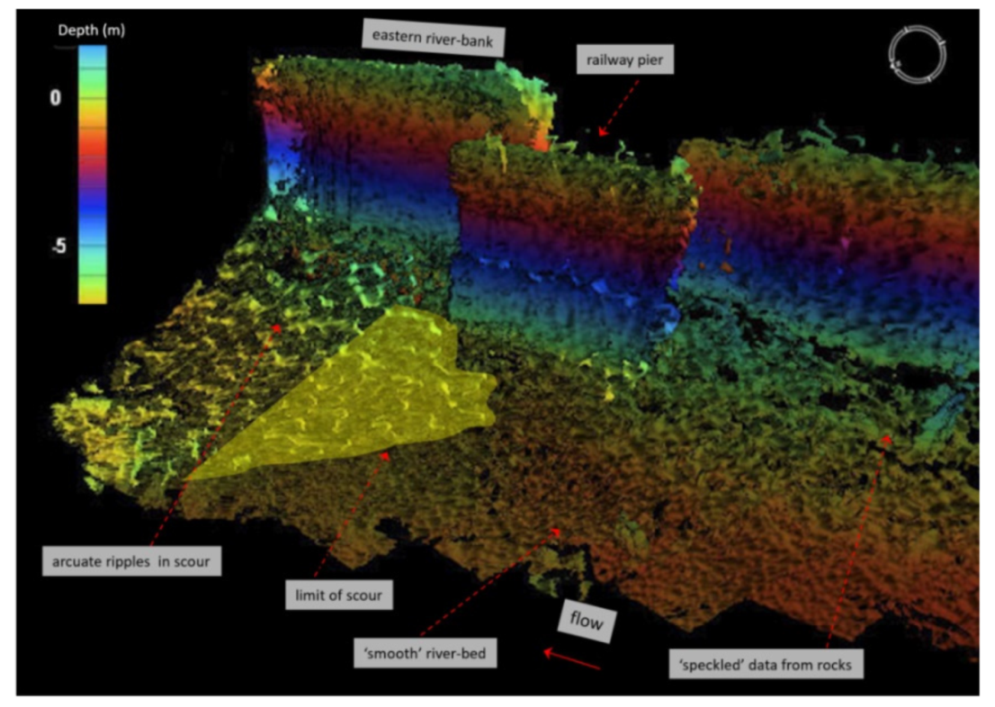
Figure 11) shows greater detail, with the deep-water area now resolved as two ~5 m deep hollows with a third area not detected from looking at the 2D WPR profiles alone.
These depressions in the river floor are adjacent to the circular bridge supports. In order to gain some insight into the nature of these hollows, each was examined in detail and their sediment thickness mapped; all depocentres were aligned SW-NE in parallel to the main flow direction of the river in this location. Significant scour was detected adjacent to, and upstream of, the elongated railway piers. Scour was also observed upstream of the circular roadway supports. This was anticipated—contributory factors may be that the railway piers are positioned in shallower water, with an attendant higher current flow. The road piers are positioned in similar conditions to the railway piers; however, it is located adjacent to the slipway used by motorised river craft, and the railway bridge constricts flow. No obstructions are present for another 100 m upstream.
6. Discussion
This paper first reviewed the typical equipment setup and previous use of Water-Penetrating Radar (WPR) for bridge engineering studies, with different antenna configurations, shielded/unshielded antenna types and different boat deployments all having significant effects on the datasets collected by earlier authors. By far, the dominant collection strategy is the collection of multiple 2D profile datasets, using low-frequency radar antennas, which may or may not need to be combined into 3D datasets. For simple rural surveys with little geophysical cultural noise, an unshielded antenna on nonconductive boats may be optimal, but in urban areas with above-ground conductive items present, shielded antennas are thus recommended.
This paper secondly detailed a case study of surveying a navigable section of river around two bridges (a railway and road bridge) with different-shaped vertical supports. WPR results showed that the two bridges had correspondingly different river sediment scour geometries associated with them, which could be both detected and characterised by relatively closely spaced 2D profiles being collected, processed (with simple gain filters) and combined into a 3D dataset with interpreted riverbed scours, below the water–sediment interface boundaries and bedrock all being imaged.
One area of deep water within the survey site, with an adjacent platform of rock outcrop, was identified from the 2D data—this was resolved using the 3D fence diagram data as more than three areas of deep water, each with 4–5 m of sediment infill. Areas of riverbed infill were found to be adjacent to both bridge supports, and oriented along the axis of river flow. They could be due to scour-fills from the bridge supports, or possibly locations of fossil scours where the bridge piles were originally sunk when bridge construction took place. Results largely agree with [
24,
27] who performed similar WPR surveys around bridges, with data from 100 MHz shielded antennas providing optimal 2D profile data. Side-scan sonar data were also collected to compare with WPR data, which was favourable, as well as to identify any submerged hazards to the data acquisition stage. Limited intrusive 1D investigations, using a plumb bob/metal probe, can also give some ground truth of results, but are relatively slow and spatially unrepresentative; side scan sonar was evidenced in this study to be more effective for bathymetry.
7. Conclusions
This paper briefly reviewed Water-Penetrating Radar (WPR) surveys, equipment configurations and relevant case studies to evidence what is currently known and the potential major variables associated with data collection in such challenging environments.
Whilst physical depth sounding with a plumb bob or probe may be quick and inexpensive, it might not provide the comprehensive coverage of a hydrographic survey using echo sounding or WPR. For estimates of sediment thickness, buried objects and rock outcrops in confined locations such as our study location, WPR appeared to be advantageous when compared to other methods such as side-scan sonar.
The WPR 2D datasets collected in the case study allowed the interpretation of the survey site water bathymetry, the presence of rock vs. sediment on the riverbed floor, and some estimate of the likely distribution of water and sediment depths. Combining 2D profiles into 3D datasets were deemed less useful in assessing likely sub-bottom conditions, but did give an accurate image of the distribution of both water depths and sediment thicknesses. The unshielded antennae were not suitable for such an urban small site with above-ground conductive objects present, so 100 MHz shielded antennas were determined to be optimal and were used for the main survey.
The nature of interpreting radar traces is open for debate and the accuracy difficult to ascertain without physical excavations to validate assumptions on site. The analysis largely relies on the experience of the user and the quality of the radar data to determine interfaces between distinct geological/sedimentary features. The challenges faced with undertaking an accurately positioned grid of radar traces from a small inflatable boat were considered and more work would be required in improving this element of the data retrieval. As such, the accuracy of the positioning and interpretation of these WPR surfaces are somewhat unknown without further investigation. However, the principle of identifying bed level and potential scour features subsurface was demonstrated in this work and warrants further consideration.
This work demonstrates the applicability of the WPR technique using existing nonadapted technology (terrestrial GPR) to give good indicative results useful for bridge managers in order to decide on a suitable maintenance plan. It can be seen that WPR can be used for the identification of sub bottom profiling around bridges. Although this concept of using GPR on water or around bridges is not new in itself, there is still a clear opportunity to exploit this technology and develop it further as a useful tool for bridge inspections and 3D channel profiling.


 ,
, 


