1. Background
Part I of this study focused on the large-scale weather and surface features contributing to two heavy rainfall events in early 2020 triggering numerous landslides in the mountains of western North Carolina [
1]. Space-based soil moisture observations of the upper (shallow) layer suggested sufficient recovery time occurred before the onset of the second (12–13 April 2020) heavy rainfall event, implying that earlier, potential pre-conditioning rain events in late March and early April 2020 were irrelevant to the triggering of the landslides that followed. The return to dry pre-storm soil moisture conditions of the upper layer within a few days is not unusual [
1,
2] due to the effects of wind and soil temperature on evapotranspiration. However, the mechanics of landslide initiation are often determined by soil moisture characteristics at deeper layers in the soil [
2]. In addition to the variable atmospheric factors of precipitation and evapotranspiration and the “constant” geologic factors of slope and lithology, the variable factors of runoff, percolation and storage of moisture and their interaction within the deeper soil layers determine if a region is predisposed to landslides when a storm of sufficient precipitation intensity can serve as the trigger. The latter factors involve change at relatively long time scales relative to the atmospheric factors due to the limited movement of water through porous soil. The concept of watershed “memory” in which the latter factors were linked to precipitation events in the recent and distant past was studied in the Coweeta River sub-Basin (CRB) of the southern Appalachian Mountains by Nippgen et al. [
3]. A key finding was the significant lag correlation between monthly mean precipitation and monthly mean runoff ratio (runoff divided by precipitation) for monthly mean precipitation occurring up to six months before the monthly mean runoff ratio (cf., Figure 6 of [
3]). Miller et al. [
4] found a significant correlation between extreme (top 2.5%) precipitation events and landslide days occurring within 30 days of the events in the CRB. Hence, the implication is the long time scale of runoff in the CRB watershed contributes to a significant storage of water in the deeper soil layers for a prolonged period of time as percolation in this region is negligible due to the presence of impermeable bedrock located underneath the soil [
3].
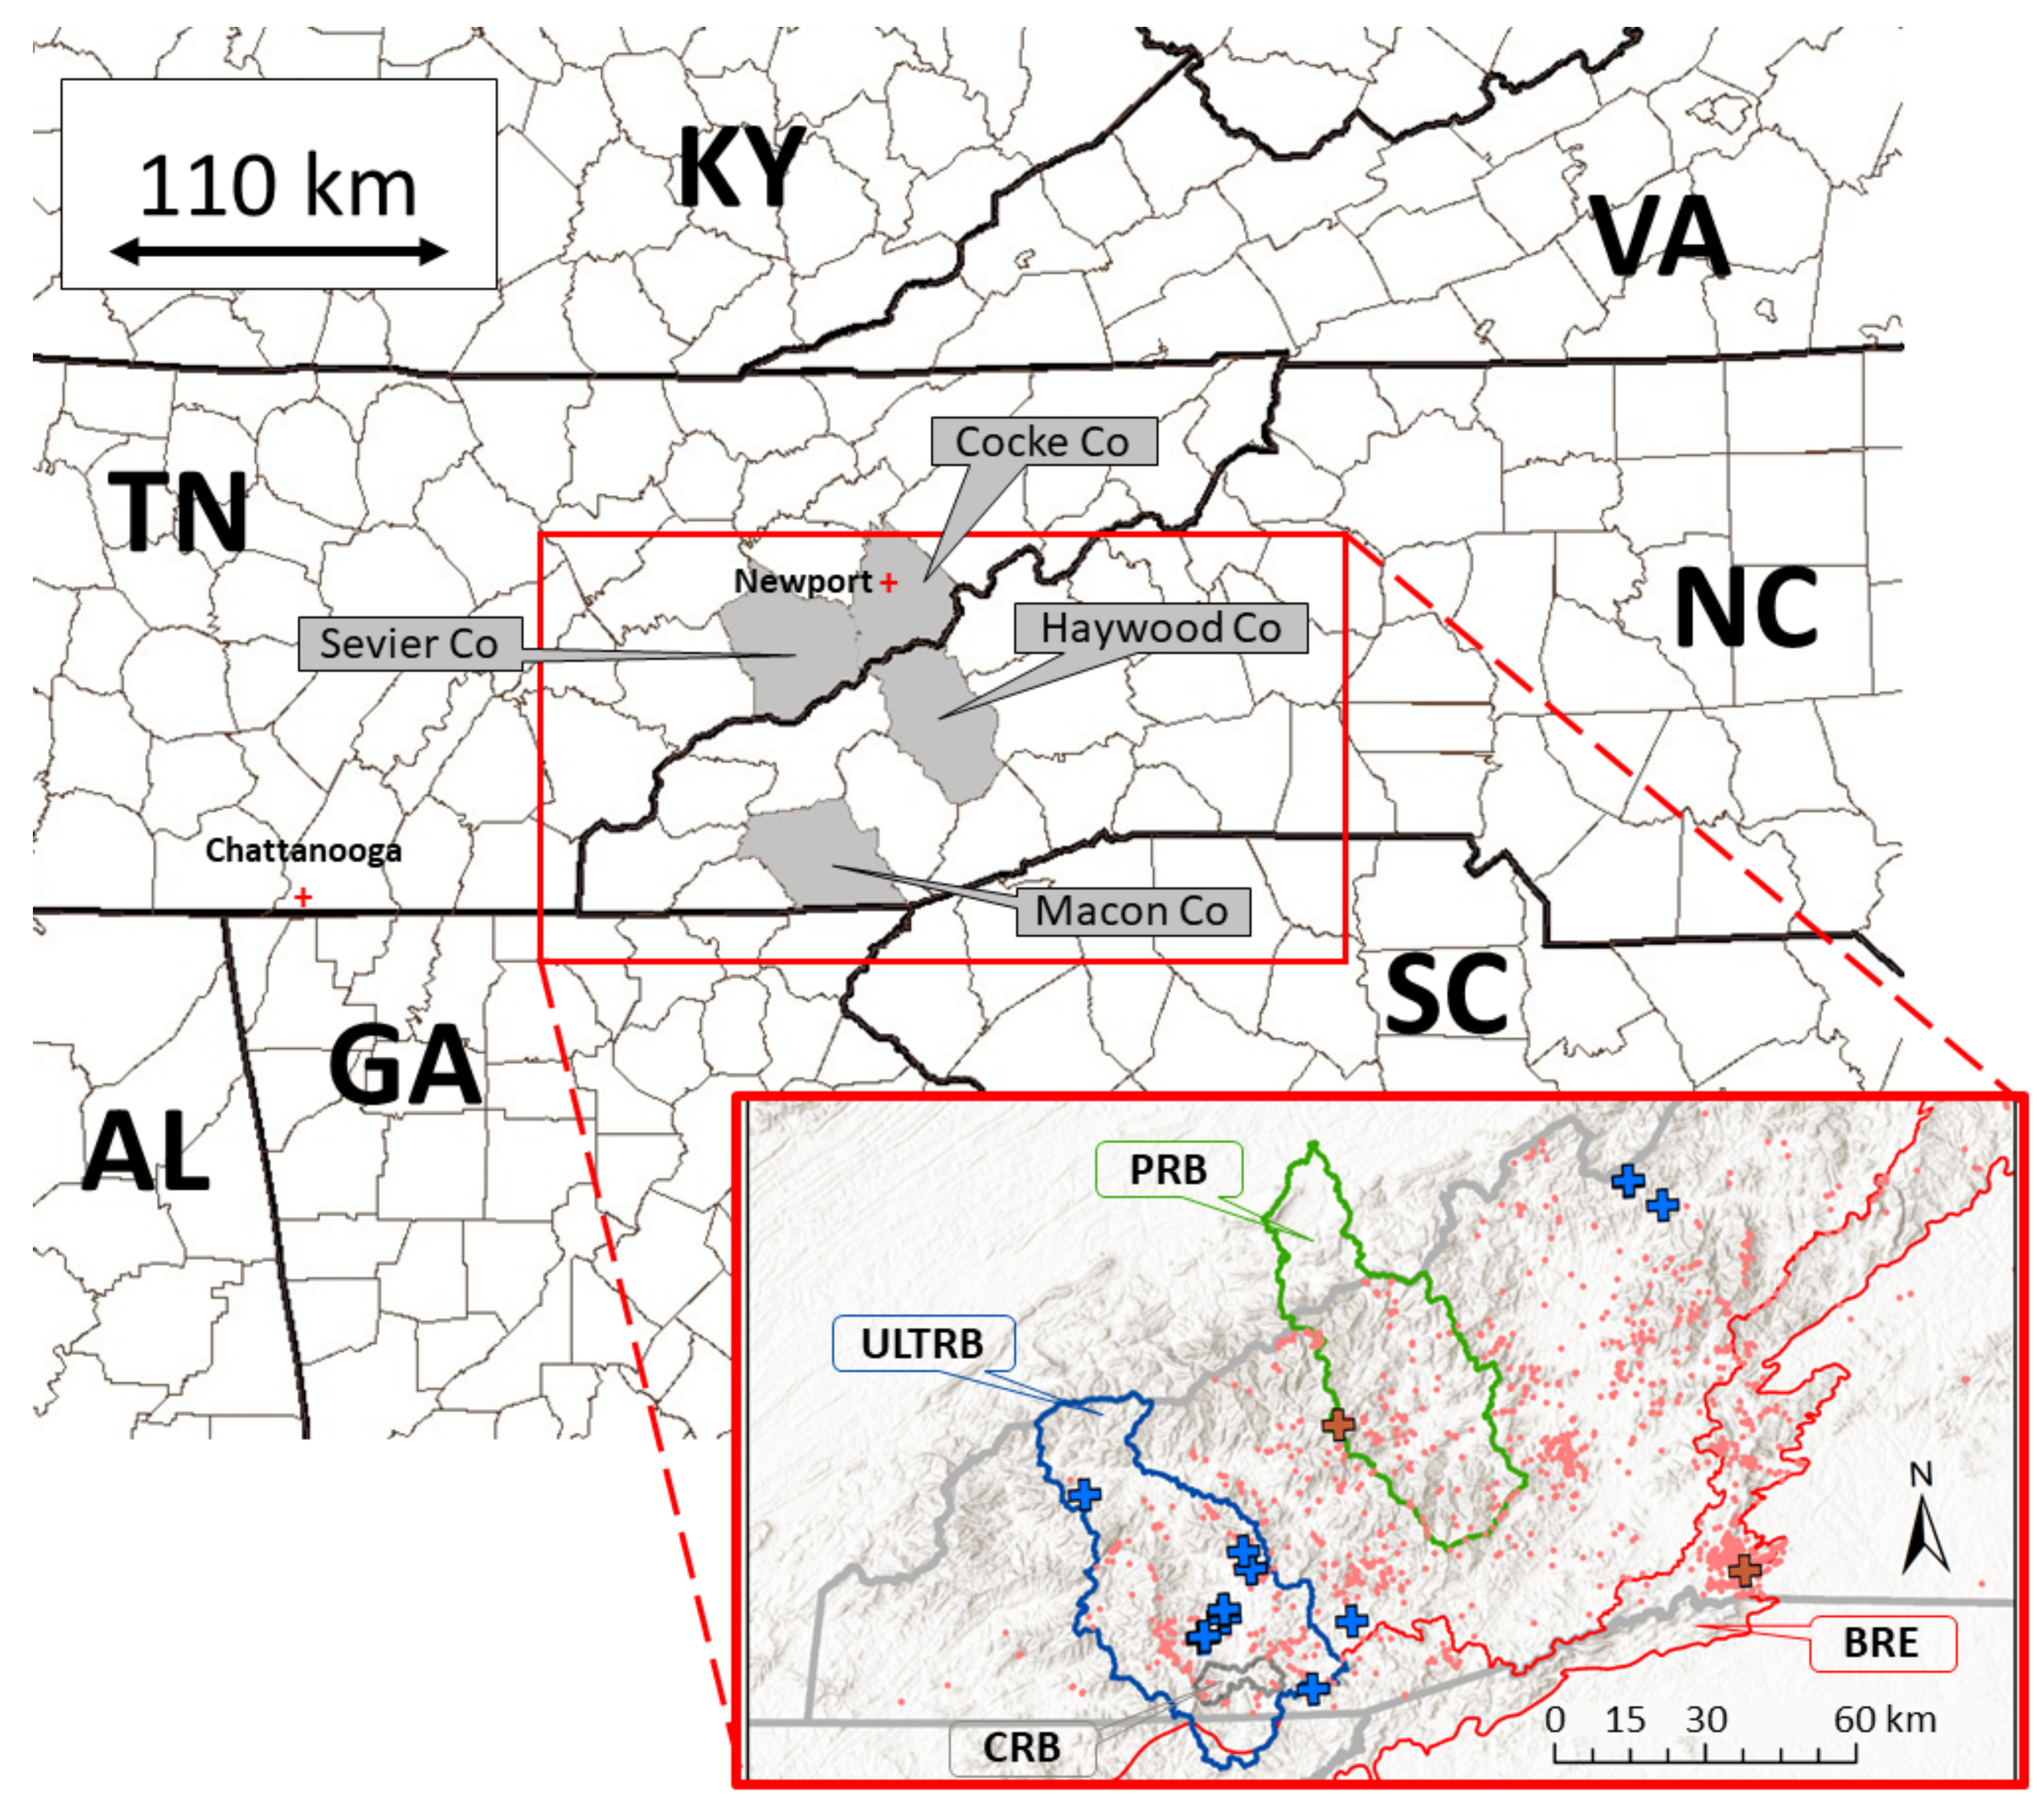
Of the two heavy rainfall events, the greatest number of landslides were triggered during or shortly after the April event, which had the lower total accumulation and shorter duration. In contrast, the 5–7 February 2020 event had a higher total accumulation and longer duration, even though a lesser number of landslides were triggered in the southern Appalachians during or just after the event. Post-case distant downstream flooding between Newport and Chattanooga, Tennessee (
Figure 1) noted in Part I, with more significant (lesser) impacts observed after the April (February) 2020 event, suggested deep soil moisture storage was near or at (far from) capacity prior to the onset of heavy rainfall. The purpose of this second portion of the two-part study is twofold. First, to examine evidence that noteworthy atmospheric processes were responsible for triggering landslides initiated during or soon after passage of the heavy rainfall events in the southern Appalachians in early 2020. Second, to examine the utility of satellite QPEs and estimates of other atmospheric fields in highlighting noteworthy regional aspects of the events.
Although substantial progress has been made in understanding the atmospheric and geologic factors contributing to the initiation of landslides, reliable predictions of landslide initiation are still currently unattainable (e.g., [
2,
5]) due partly to a lack of understanding of the overall science and, to a greater degree, the lack of relevant earth and atmospheric observations covering remote areas in the mountains of the mid-latitudes. Recently, space-based observations of rain rate and surface properties (e.g., soil moisture) have reached horizontal resolutions useful to landslide scientists [
2]. Comparisons of space-based soil moisture estimates by Thomas et al. [
2] to in situ soil moisture observations in a landslide-prone region of California found that estimates from space were prone to soil moisture overestimates between major rain events. Space-based rainfall estimates are known to have their own unique challenges, particularly for mountainous regions (e.g., [
6,
7]). However, improvements in both types of space-based estimates have reached a point that an operational landslide risk assessment product has been developed with global applications [
8].
The focus of this study is on the atmospheric side of the earth–atmosphere landslide initiation process of the two storms in early 2020. Numerous studies (e.g., [
9]) have investigated a variety of weather events in the mid-latitudes providing ample hydrological input to overwhelm the soil’s water redistribution and storage processes, reducing the shear resistance force of the soil below a critical threshold and resulting in slope failure [
10]. Common methods used to quantify the critical threshold of the atmospheric rainfall contribution toward landslide initiation are the total accumulation within a 24-h period (e.g., [
2,
10]) and period rain rates exceeding a critical rain rate threshold (e.g., [
10,
11,
12]). No matter the atmospheric critical threshold initiation methodology, landslides are almost always initiated in the southern Appalachian Mountains when taking a “direct hit” from rainfall of the spiral rainbands in the remnants of tropical cyclones (e.g., [
9]). The challenge in landslide initiation prediction, from the atmosphere side, is gaining a better understanding of initiation by the more common extratropical cyclones that occur during the cool season. As highlighted in Collins et al. [
13], attention of weather events has often focused on the larger-scale aspects of the cool season storm, without attention to the individual effects of all precipitating systems embedded within the large storm system. Recently, investigators have focused on a “cause” and “trigger” period of atmospheric precipitation during which the former period conditions the soil and can either be distinct from or a part of the same storm providing the trigger period of precipitation [
2,
12].
3. Results
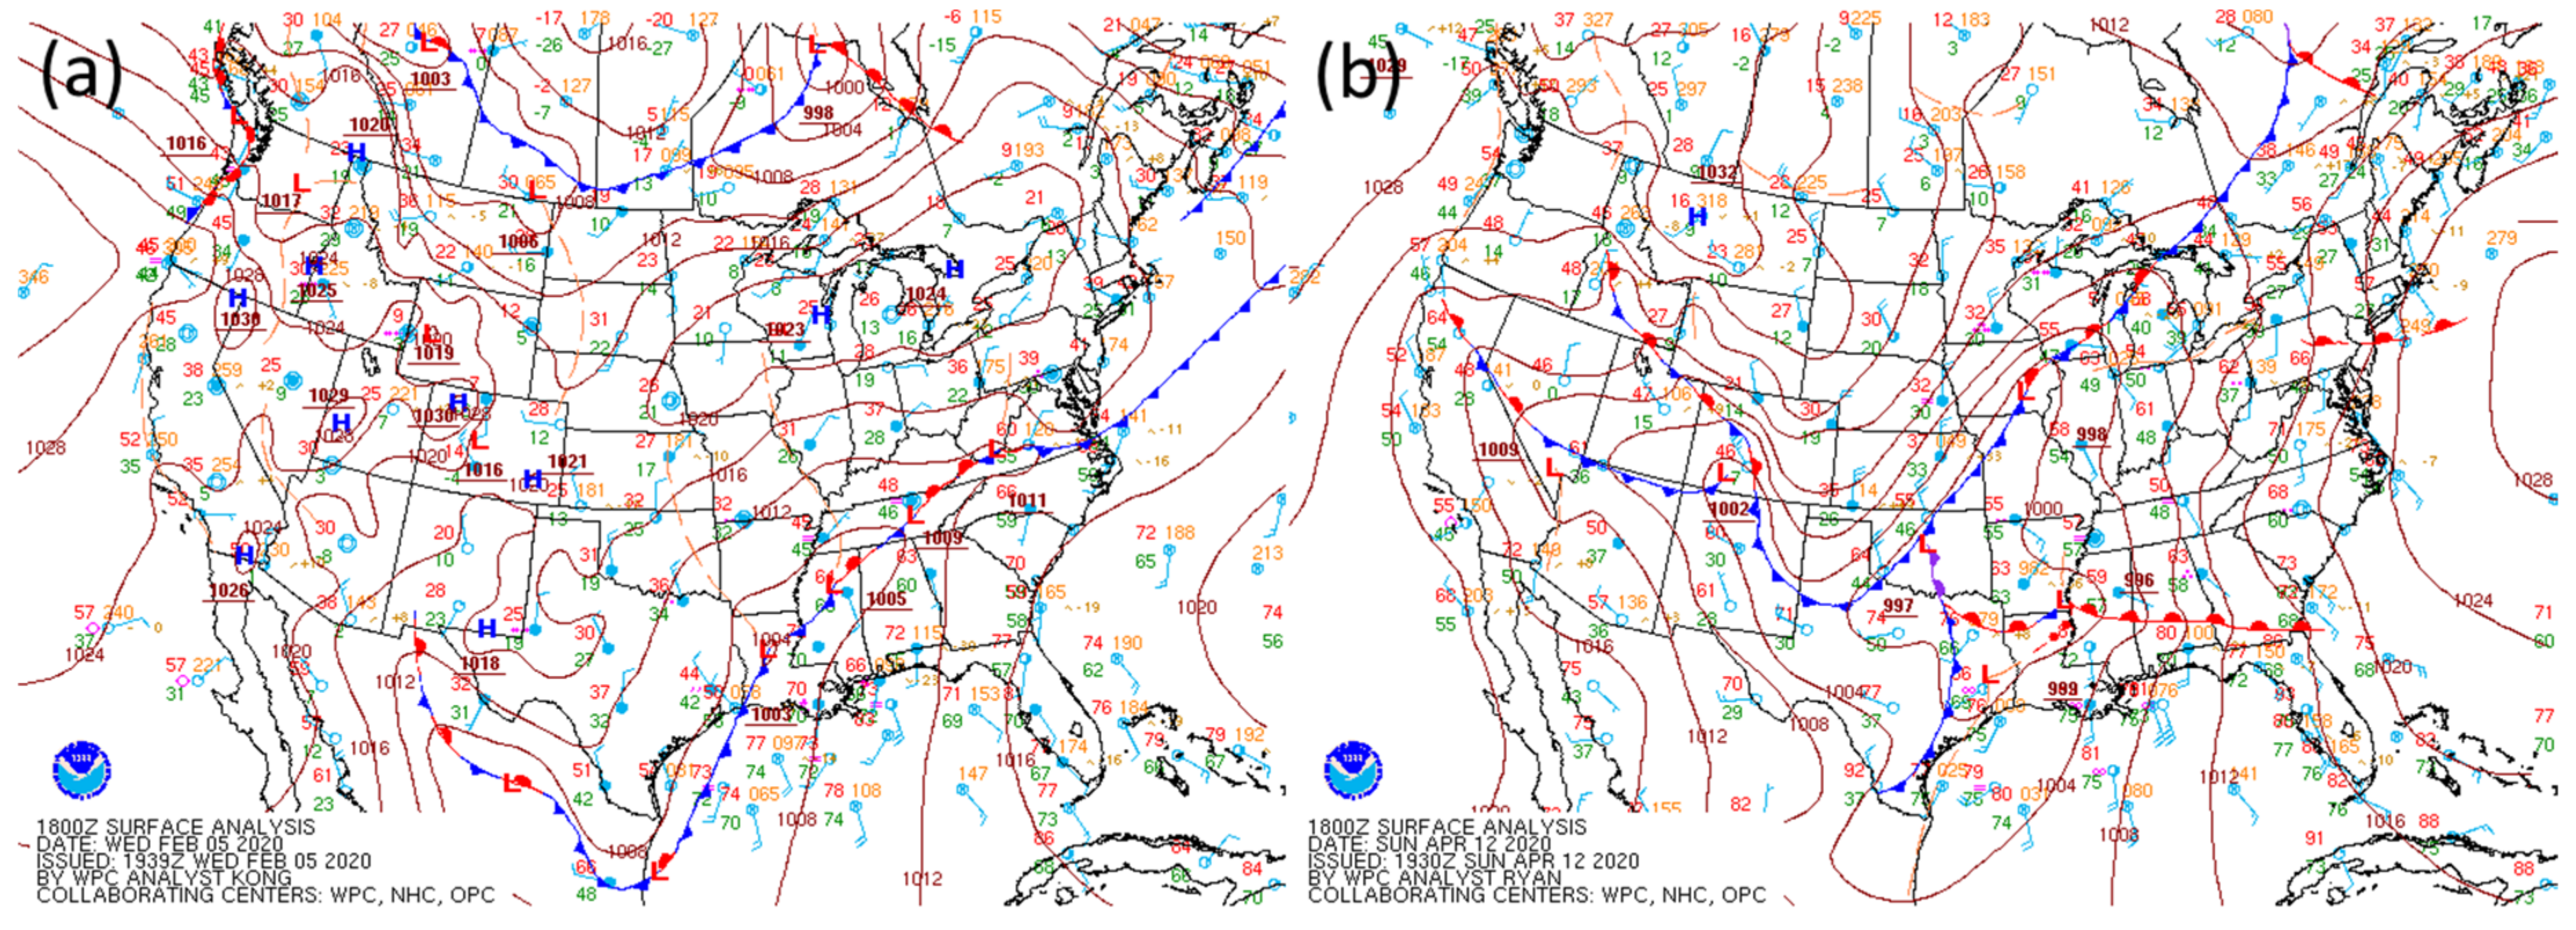
The 6-h synoptic periods covering observed rainfall by the Duke GSMRGN during the two events in early 2020 spanned the periods 0600 UTC 5 February–1200 UTC 7 February (54 h) and 1200 UTC 12 April–1800 UTC 13 April 2020 (30 h). A description of the synoptic scale weather pattern during each event is provided in Part I of the study. The focus of this part is on a regional view in the southeastern U.S. of the weather pattern at times corresponding to the cause and trigger phases of each event. Selected periods during the trigger phases of each event corresponded to the time when the associated atmospheric river (AR) of moisture was centered on the southern Appalachian Mountains; 1200 UTC 6 February 2020 and 0600 UTC 13 April 2020 (cf., Figure 6a,b of Part I). Selected cause periods of each event corresponded to the nearest 6-hourly time period of the GFS gridded analyses when widespread precipitation was observed in the PRB early in the event; 1800 UTC 5 February 2020 and 1800 UTC 12 April 2020 (
Figure 3).
The cause phase of the February 2020 event differed from the schematic of
Figure 2b in that the southern Appalachian Mountains were entirely on the warm-air side of the frontal zone located in eastern Tennessee and northern Alabama (
Figure 3a) during the early sector of the storm. Hence, its cause period corresponded more directly to the first-half middle sector of the storm schematic in which weak warm air advection occurred over the southern Appalachians and, from the synoptic scale perspective, contributed to broad ascent of low-level humid air over the interior southeastern U.S. (
Figure 4a), resulting in sporadic precipitation (
Figure 4c). This period represented a transition between a recently departed AR of 4 February and a second AR corresponding to the heavy rainfall of 6 February. Hence, the relatively low 700 hPa level equivalent potential temperature (
θe) values offshore of the southeastern United States (
Figure 4b) were a reflection of the transitory anticyclone before the 6 February storm had moved into the region, the leading edge of which was evident over Alabama, southcentral Tennessee, and Georgia where high 700 hPa level
θe values were collocated with winds exceeding 20 m s
−1.
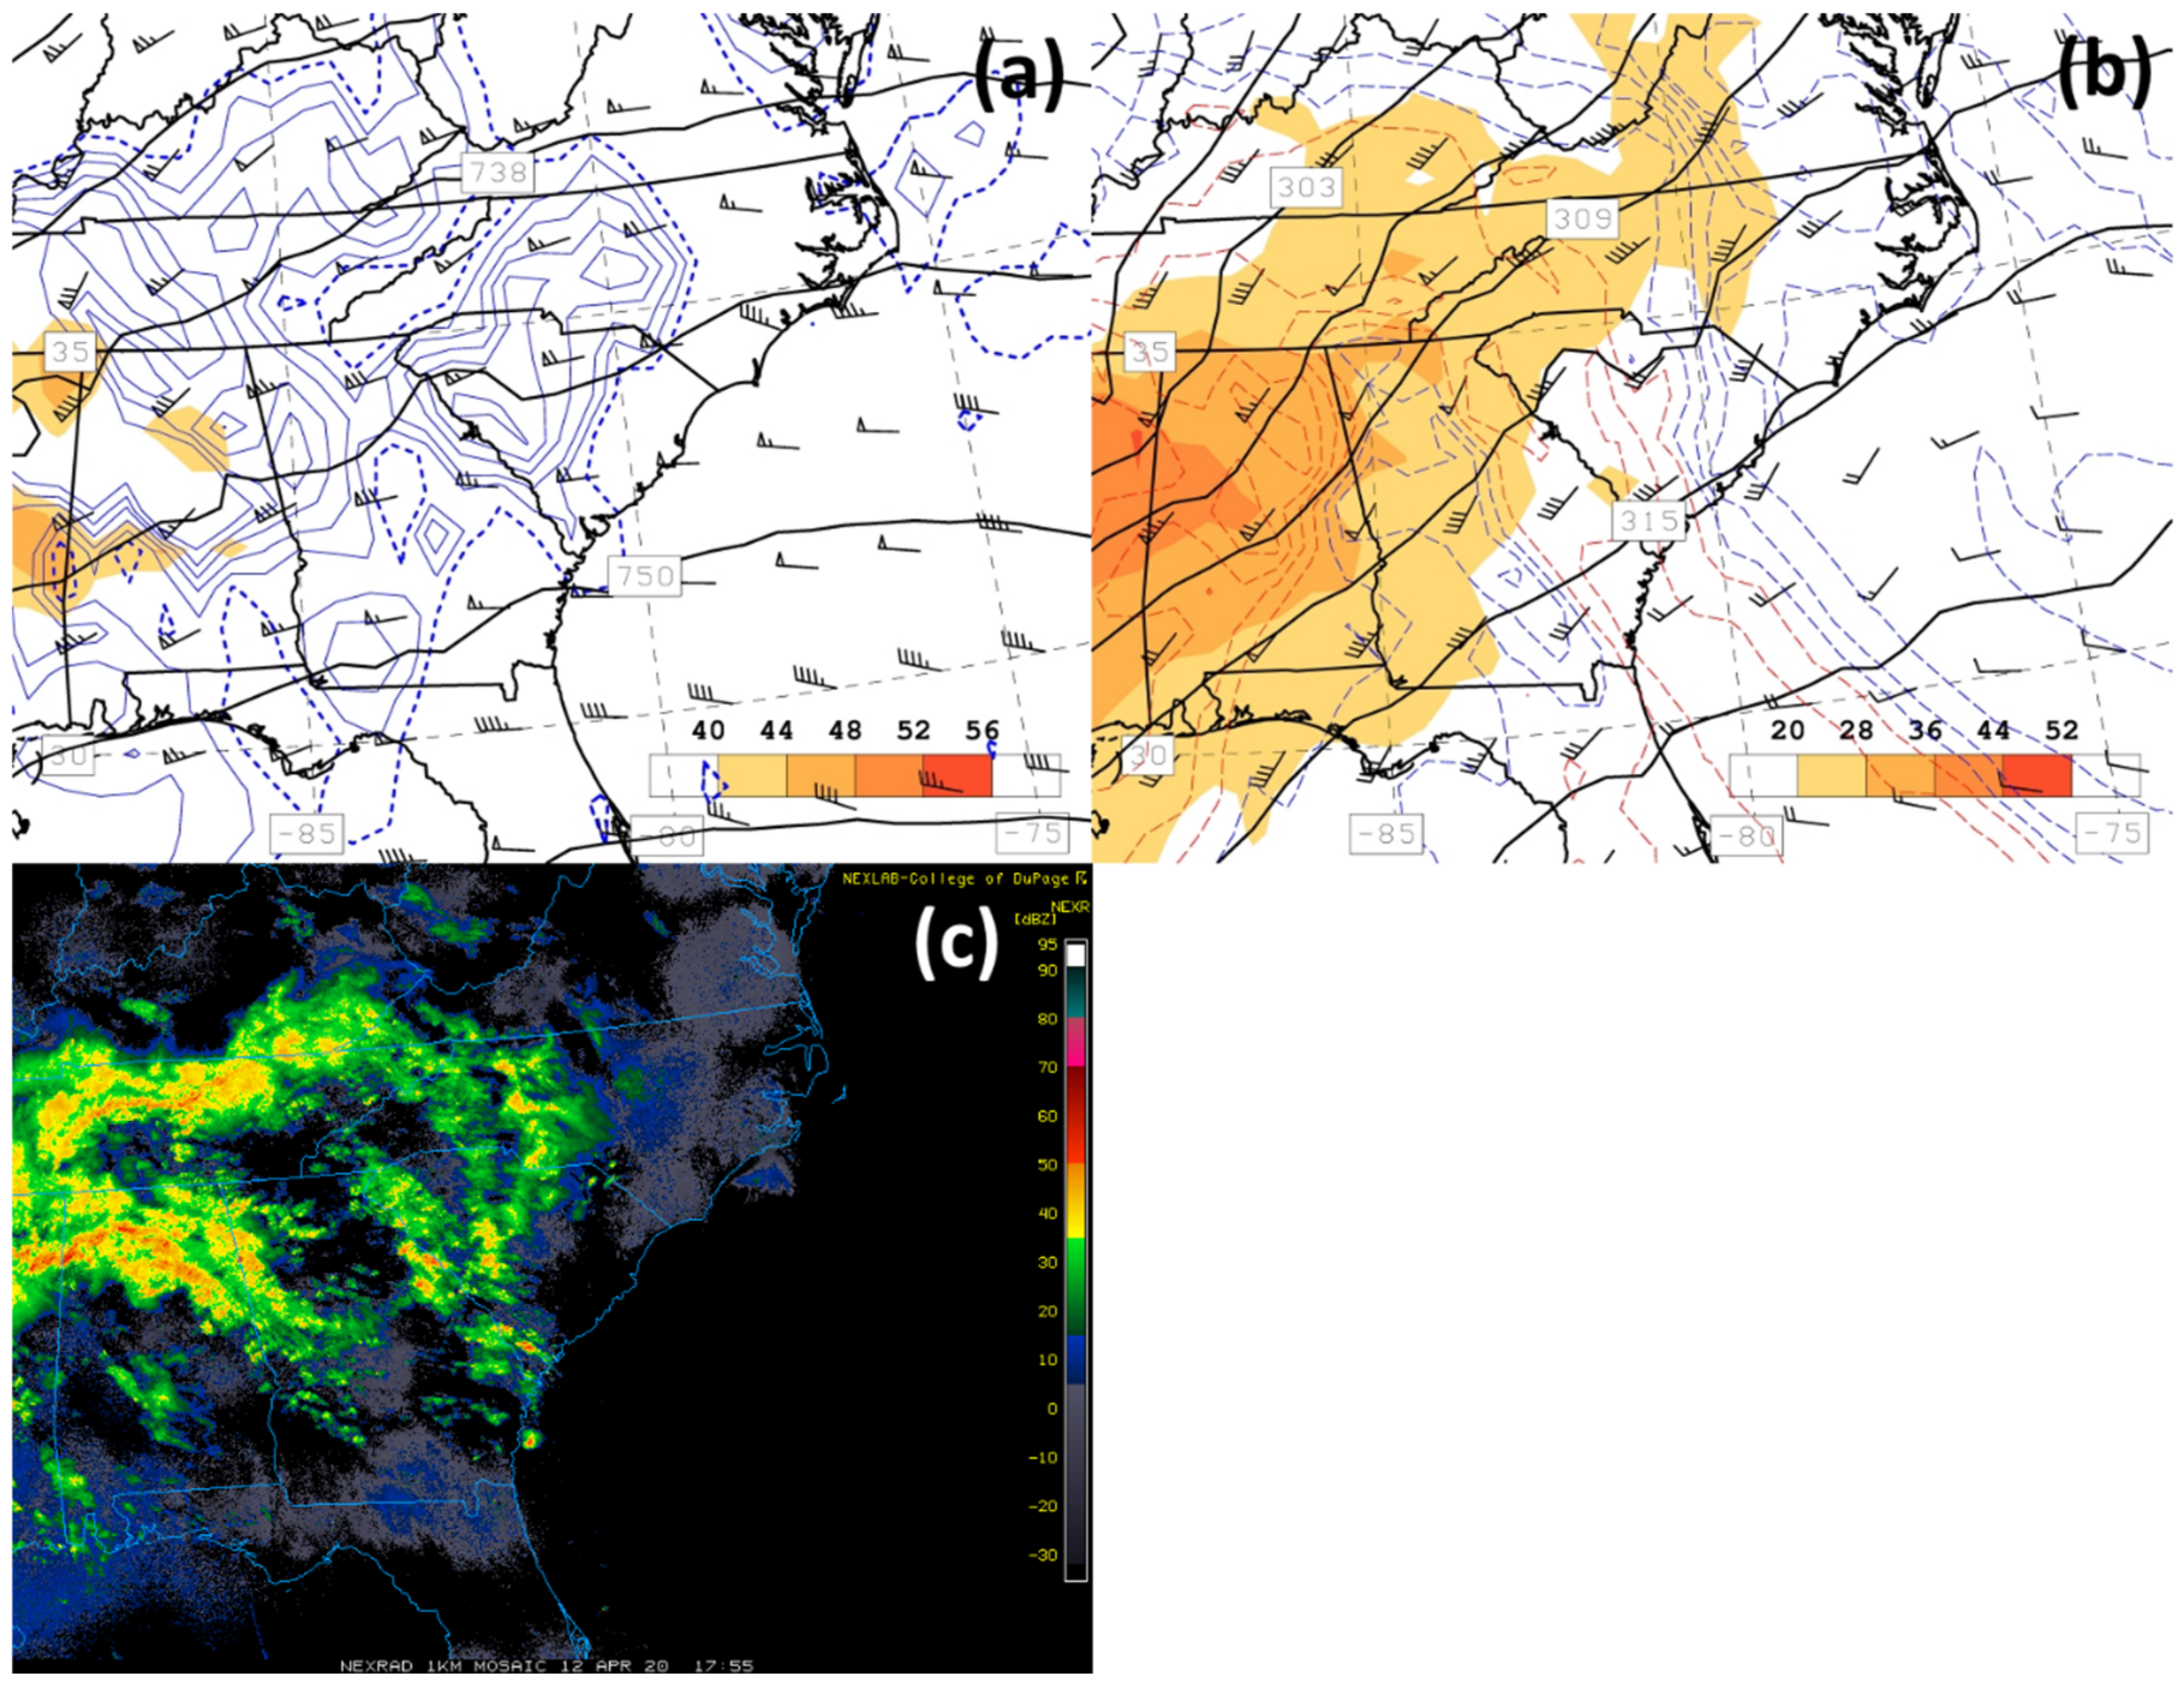
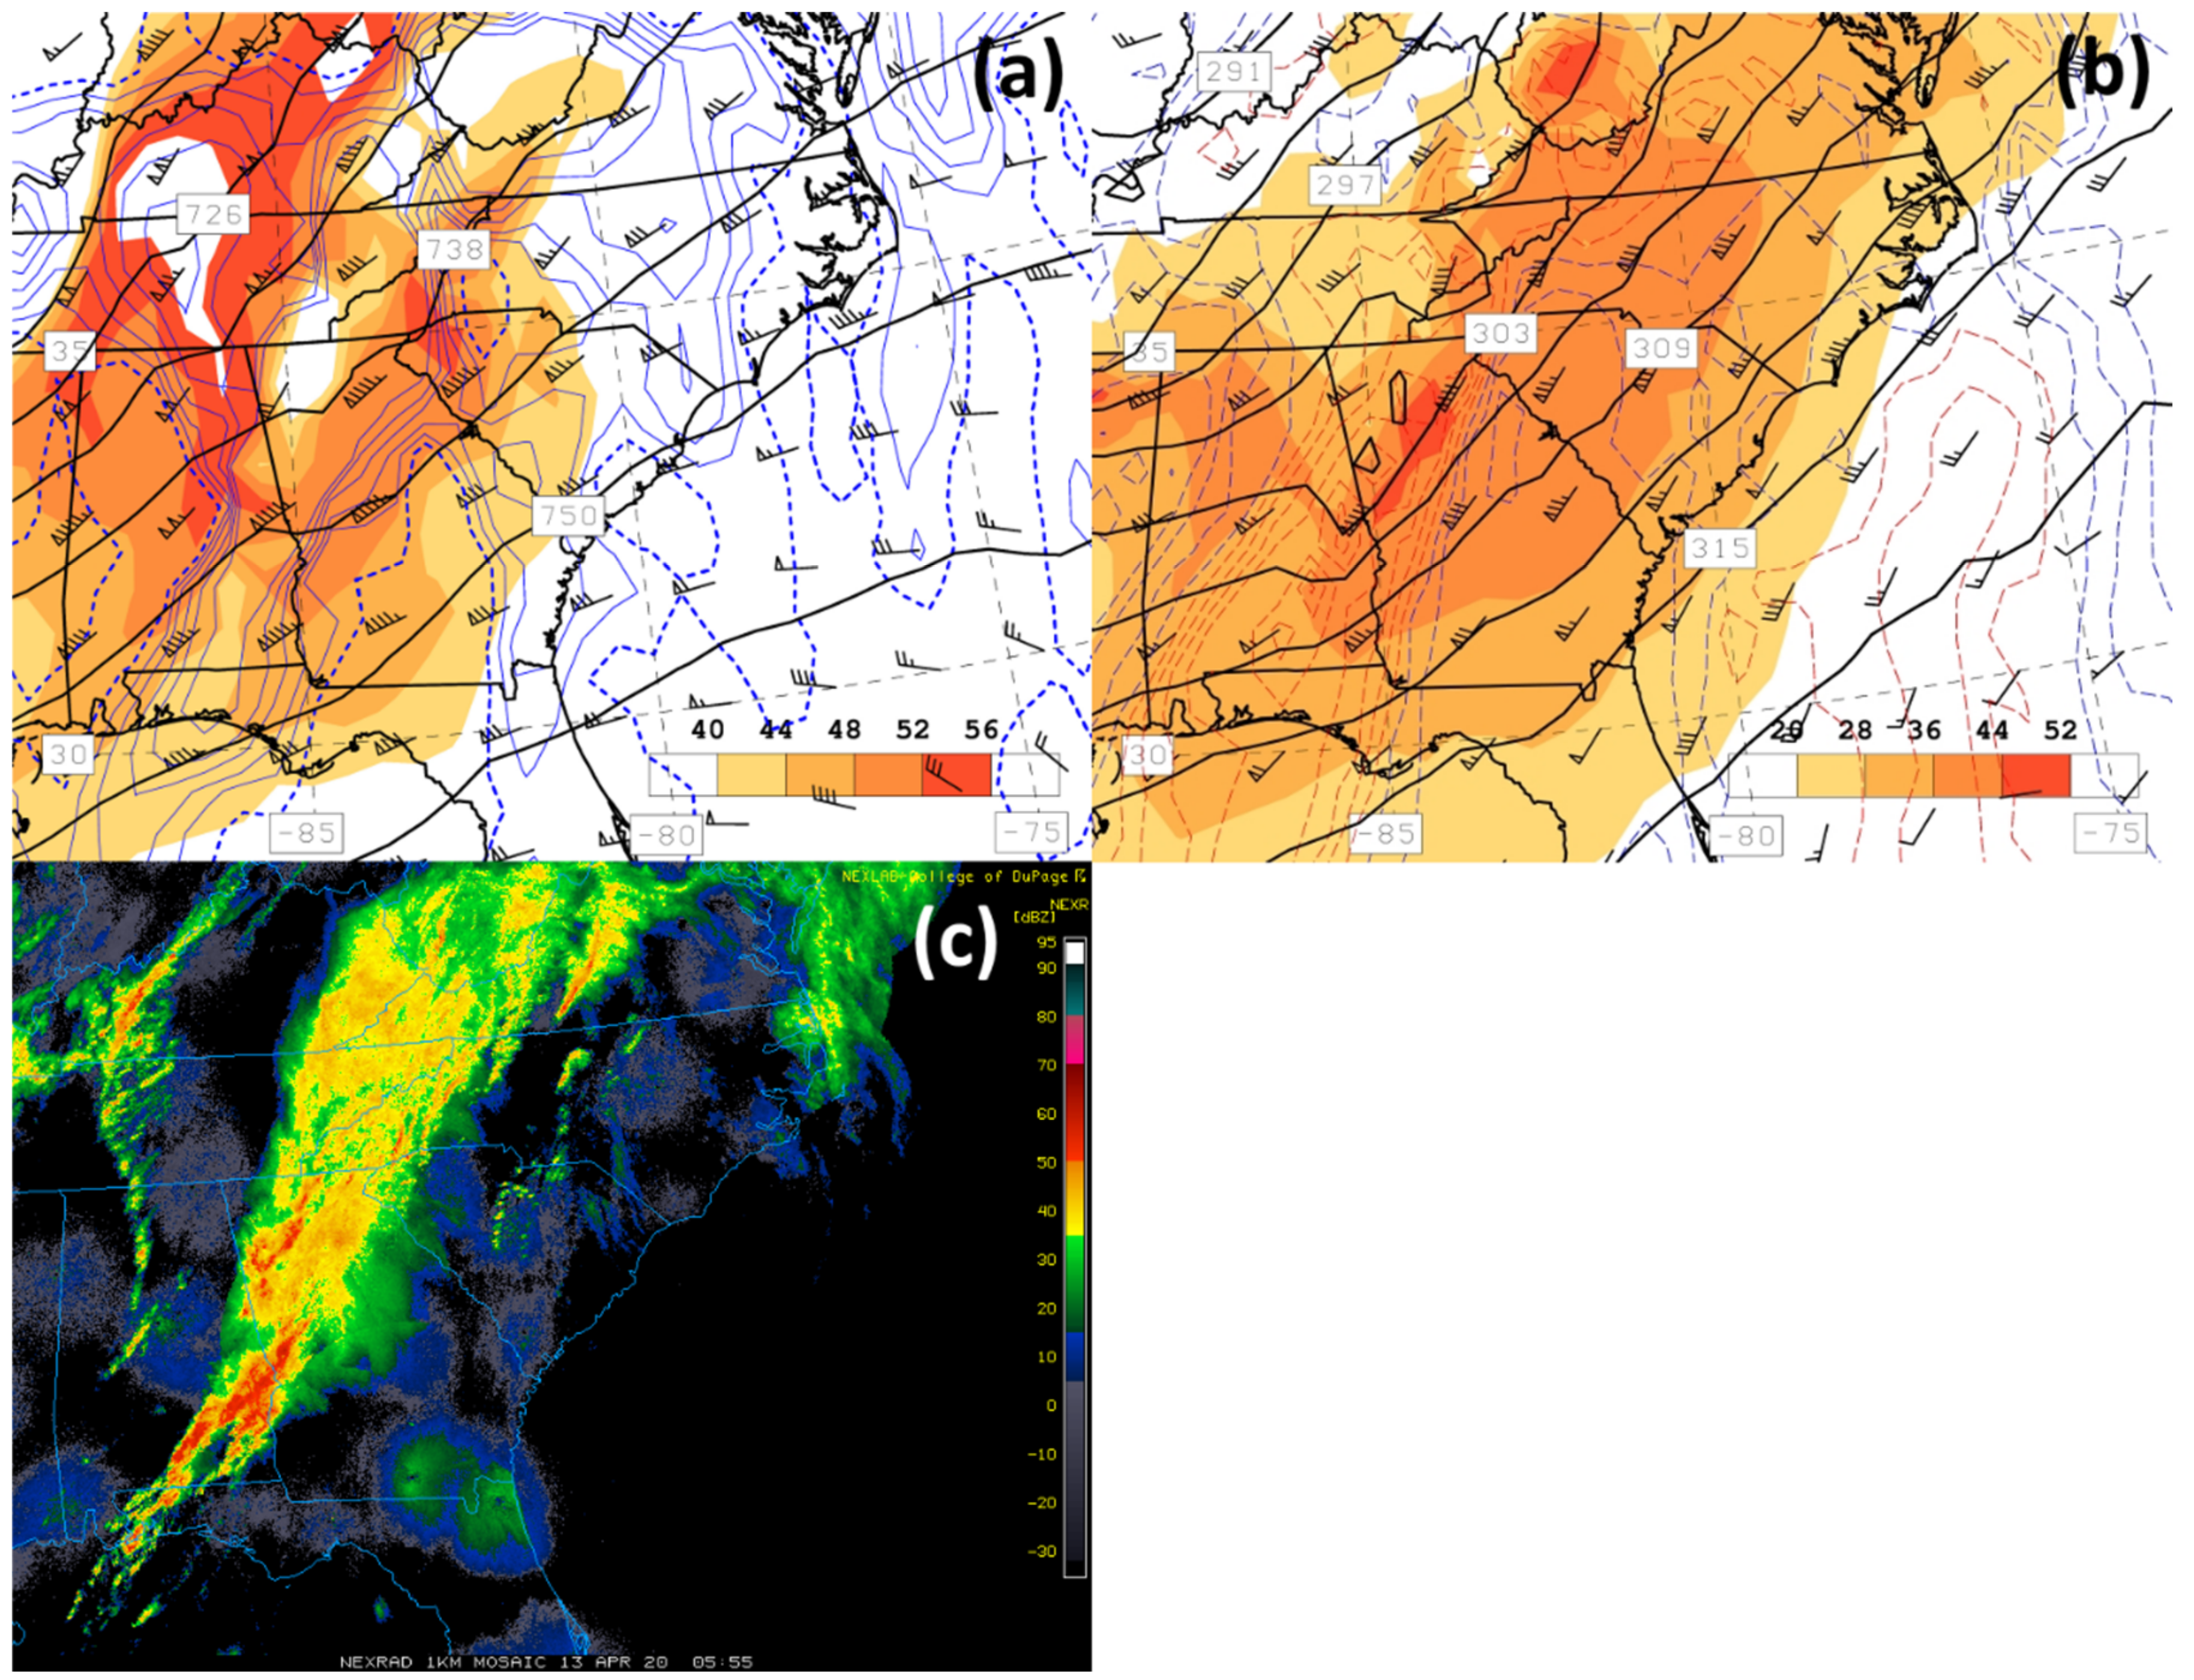
The cause phase of the April 2020 event (
Figure 3b) more closely resembled the early sector of the
Figure 2b schematic in which strong warm air advection and overrunning along the warm front (
Figure 5a,b) contributed to sporadic moderate precipitation in the southern Appalachians (
Figure 5c). The AR associated with the heavy rainfall of 13 April had already entered the southern Appalachians (
Figure 5b) during the cause phase, evident by the region of high-
θe values collocated with 700 hPa level wind speeds ranging between 20 and 44 m s
−1 to the southwest. Additionally evident at this time was the “belt” of high-
θe air (
Figure 5b) identified in the ALPW imagery of Part I emanating outward from the strong surface anticyclone offshore of Florida and extending inland over the Georgia–South Carolina border (cf., Figure 11b,d of Part I). Convergence of humid air streams at low levels has been identified as a signature in other heavy rainfall events [
39].
Consistent with the schematic of
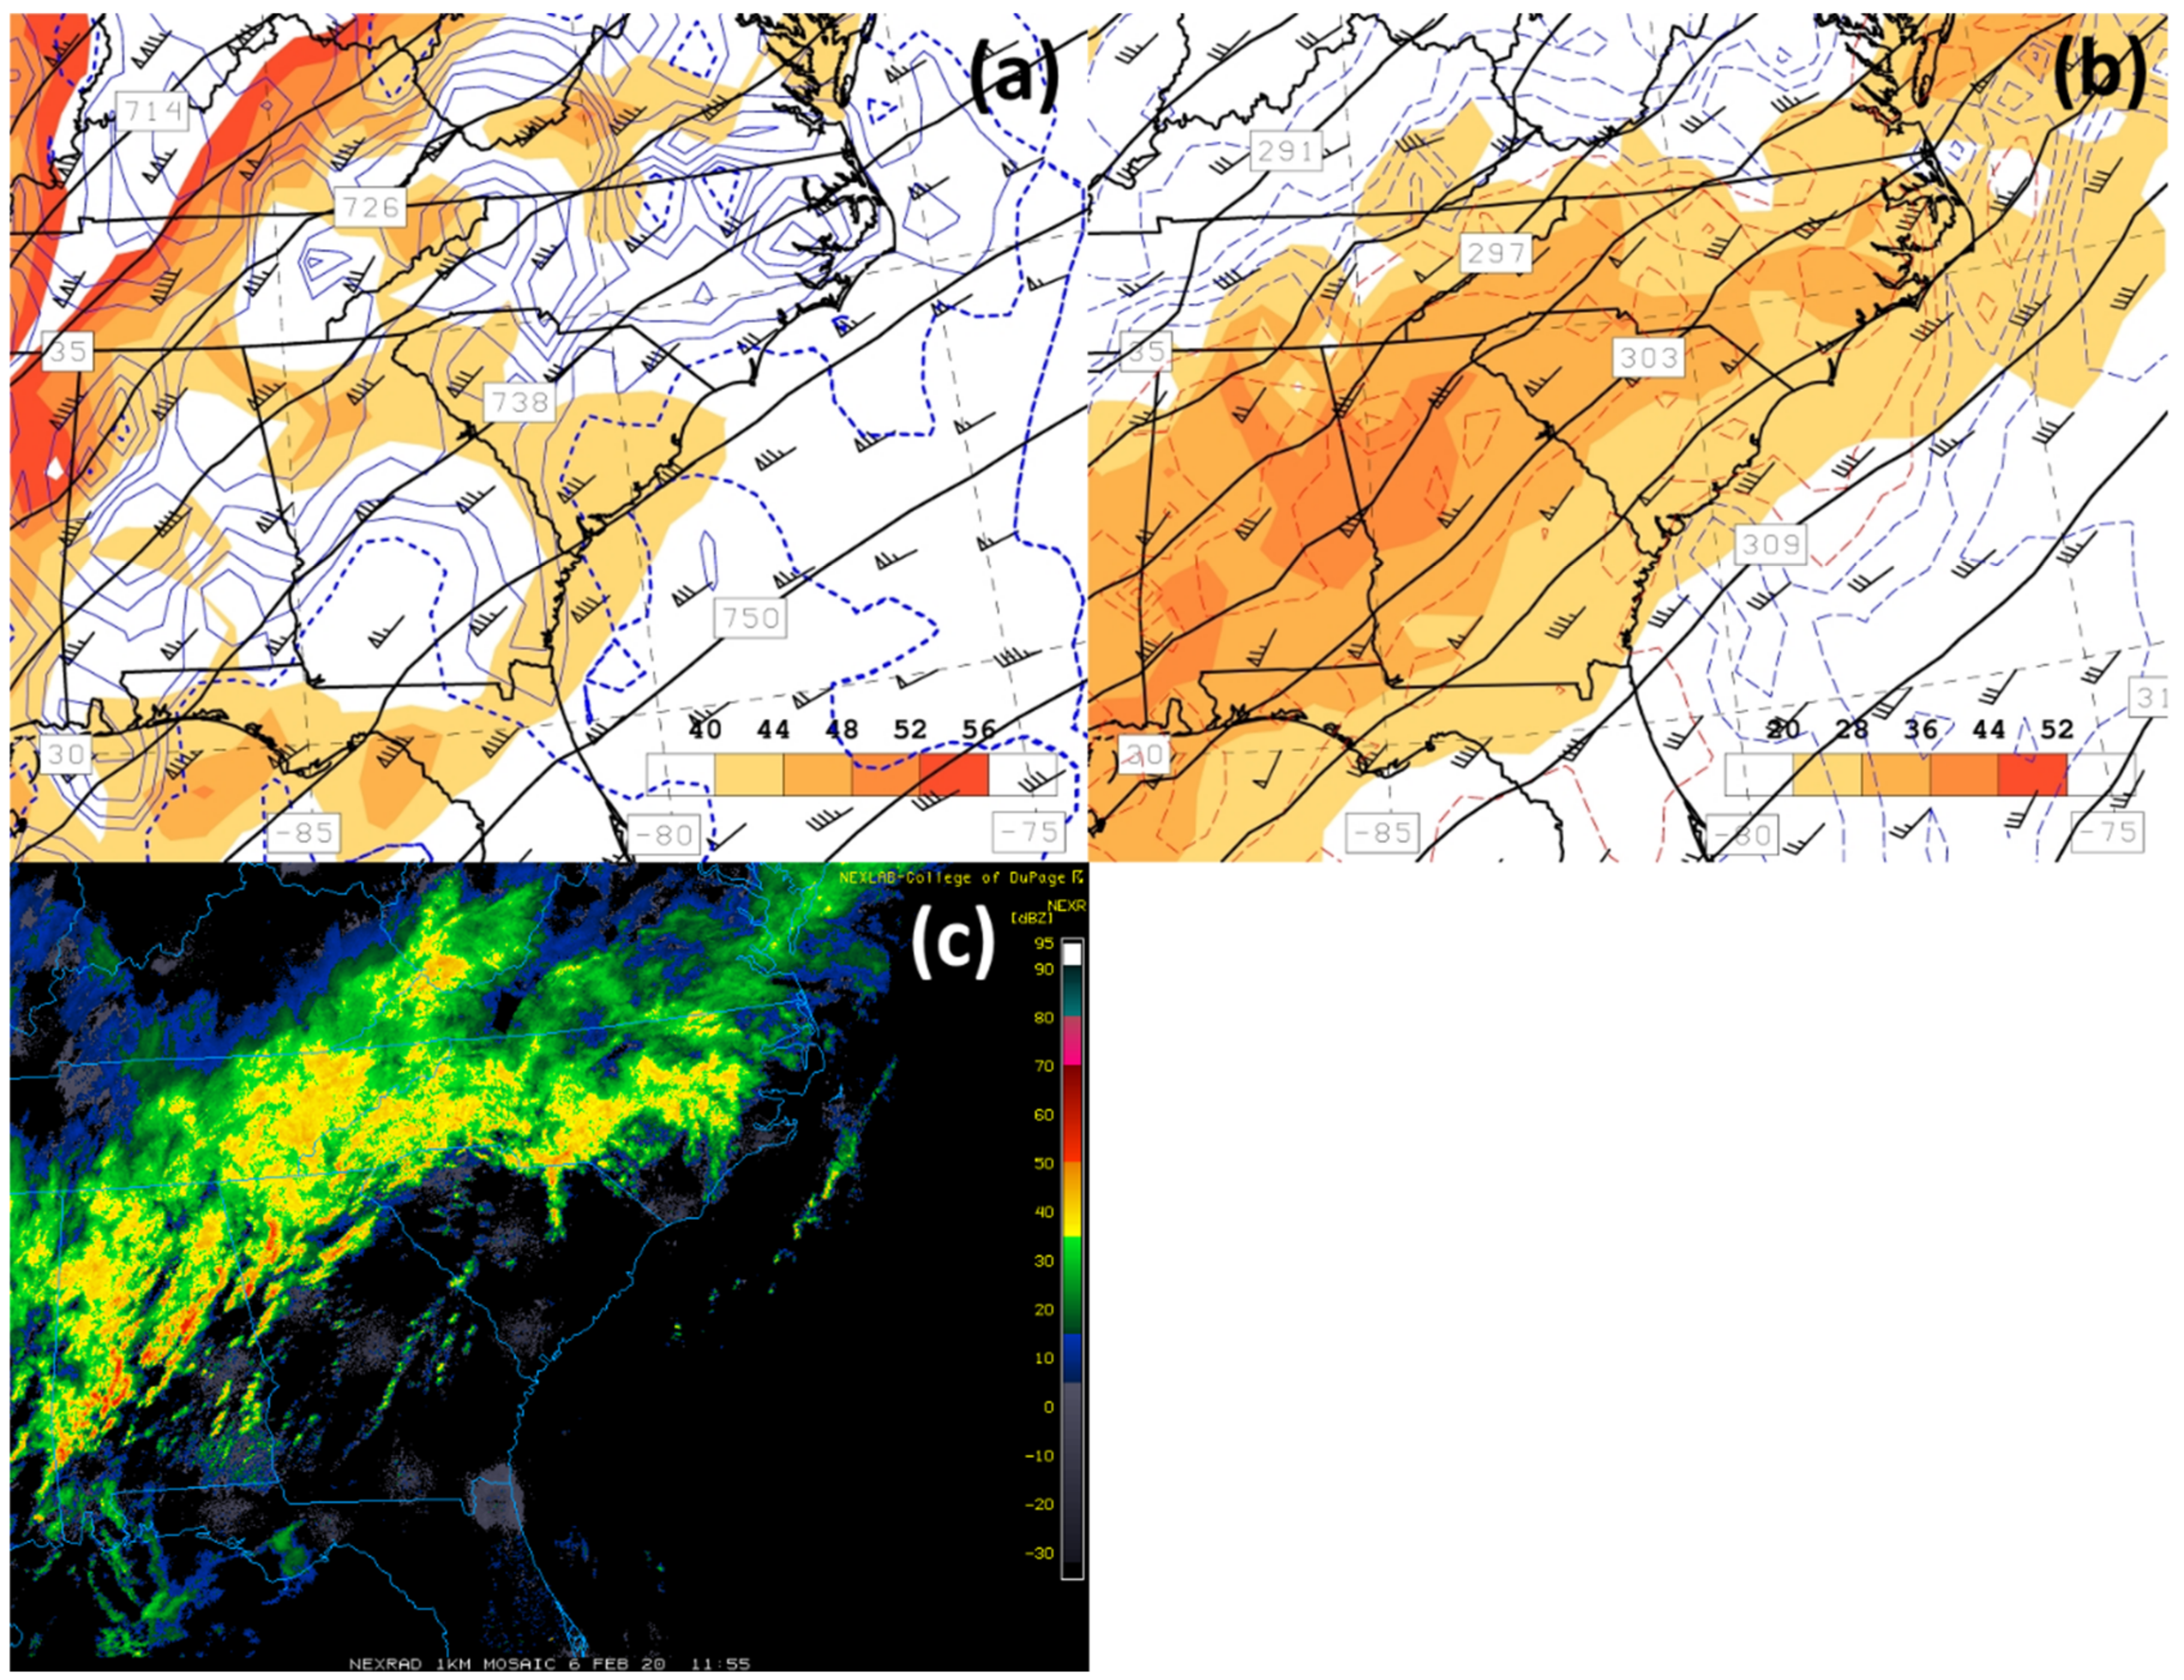
Figure 2b, the trigger phase of the February 2020 event resembled the increasingly convective and heavy rainfall of the second-half middle storm sector (
Figure 6c) compared to earlier in the event. By this time, the AR center was aligned with the southern Appalachians, highlighted at the 700 hPa level as a ridge of high-
θe values collocated within a wide swath of strong winds between 20 and 40 m s
−1 (
Figure 6b). The seemingly random convective nature of the storm was evident in variations of wind speed located to the southeast of the merged polar/sub-tropical jet core, as numerous pockets of sub-20 m s
−1 speeds were found at the 400 hPa level (
Figure 6a) above maxima of ascending motion associated with embedded MCEs (
Figure 6a,c). As the second-half middle storm sector passed over the southern Appalachians, convection remained rather disorganized and lacking in intensity until its leading edge moved past the mountains at 1425 UTC 6 February and a convective line developed along an elongated outflow boundary by 1855 UTC 6 February extending from central North Carolina to the panhandle of Florida (not shown).
Although the second-half middle storm sector during the trigger phase of the April 2020 event moved through the southern Appalachians rather quickly, the convection was organized into larger-scale elements over the mountains, particularly near the North Carolina, Georgia, and South Carolina border (
Figure 7c). Strong winds at the 700 hPa level, associated with the AR, moved humid air northward along a narrow corridor (
Figure 7b) providing fuel for the narrow swath of observed convection (
Figure 7c). Noteworthy is the tongue of dry air whose axis was located over South Carolina and Georgia, on the anticyclonic shear side of the 700 hPa level jet core and a secondary tongue of dry air over northwestern Alabama. As will be shown, the source region of the dry air in the two tongues of low
θe was different, but each was significant in contributing directly and indirectly to the evolution of intense convection over the southern mountains. The “split” in the sub-tropical jet core, evident at the 400 hPa level (
Figure 7a), was a consequence of the narrow zone of intense convection present over eastern Tennessee, northern Georgia, and southeastern Alabama (
Figure 7c) whose strong updrafts (
Figure 7a), divergence aloft, and sensible heating due to latent heat release disrupted the jet dynamics.
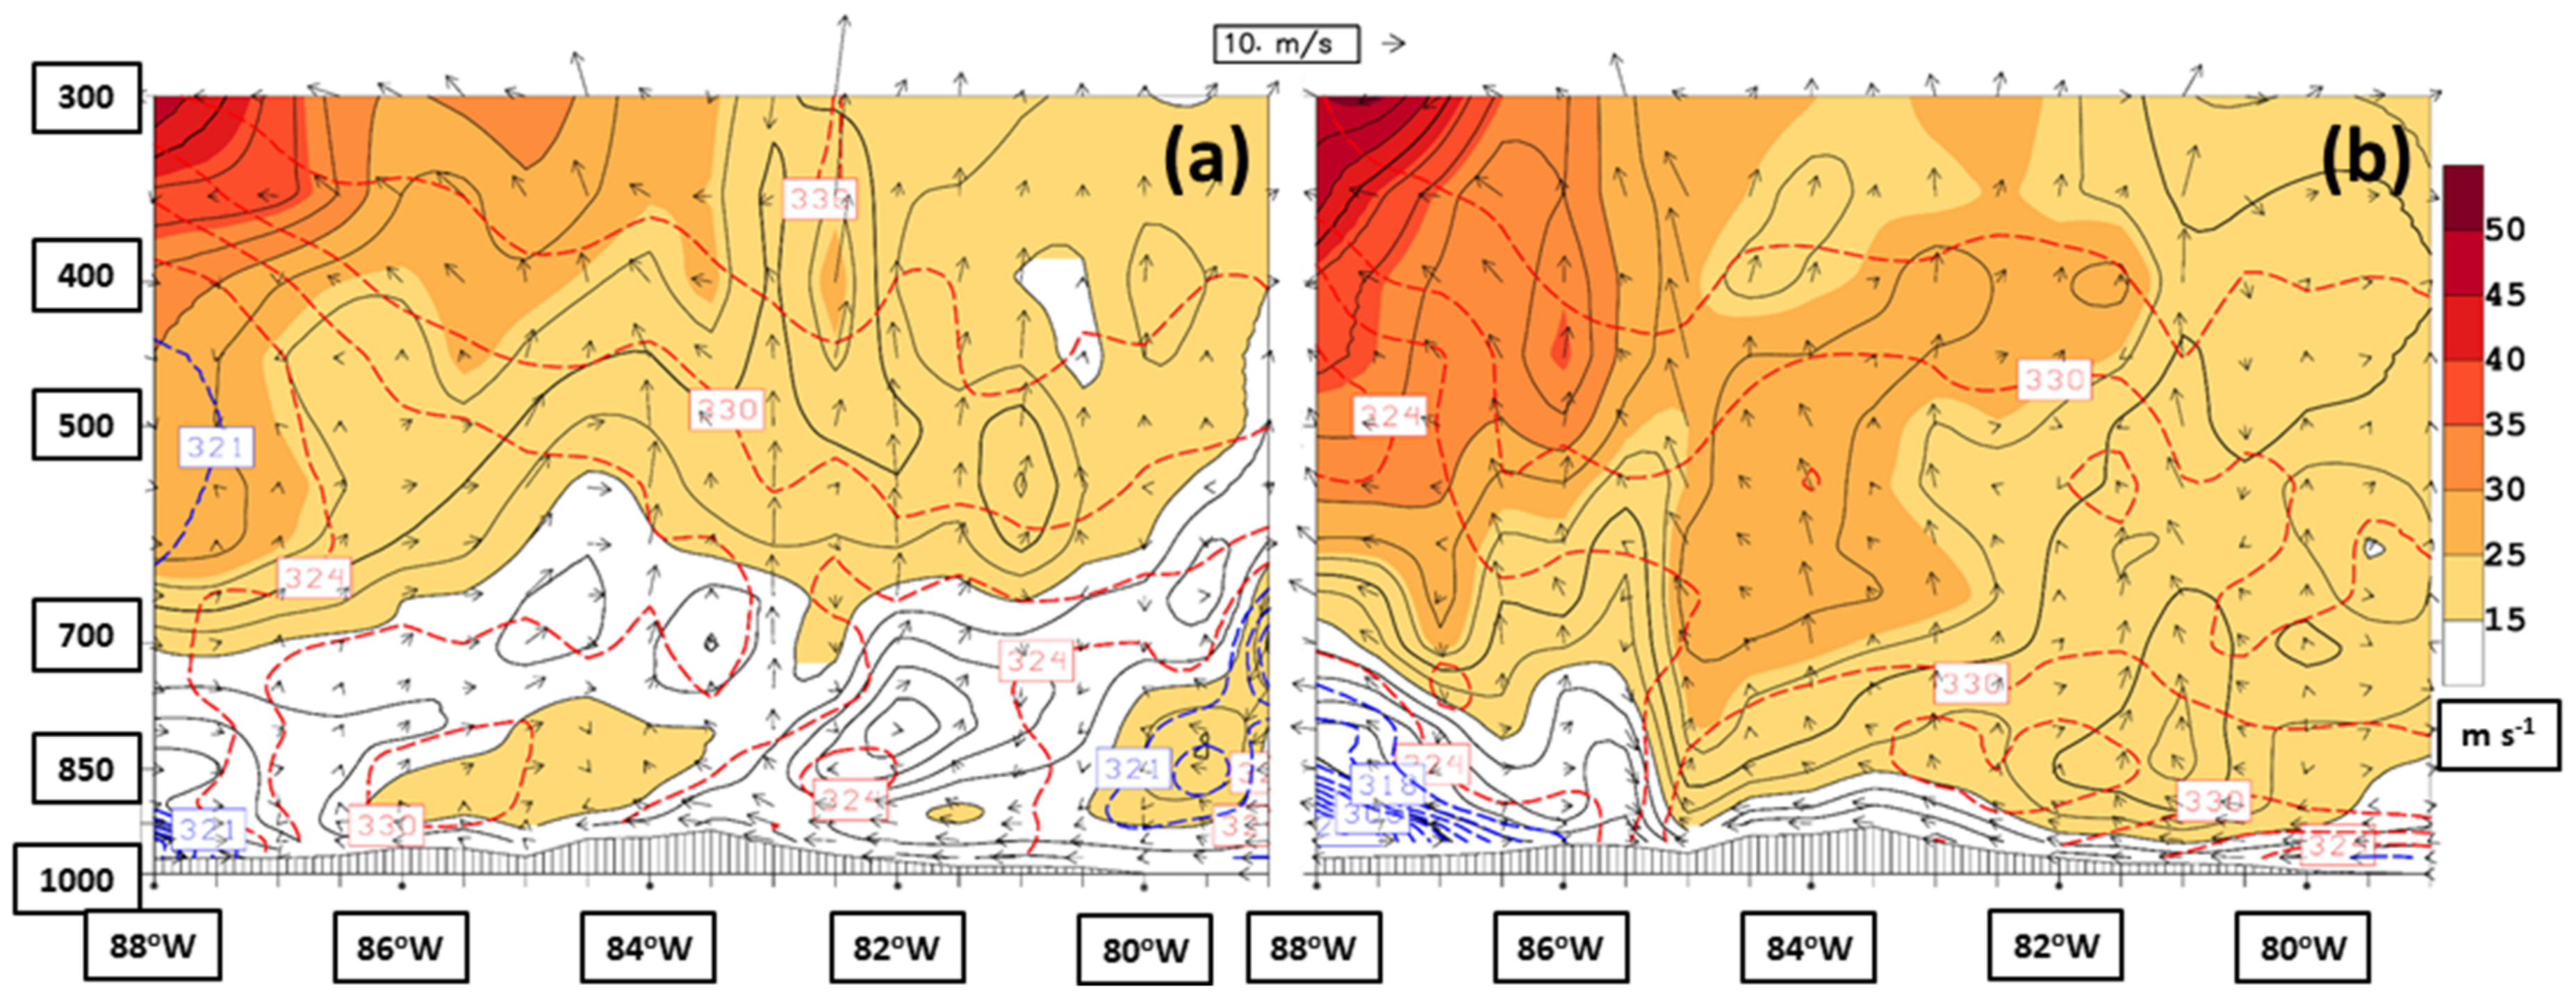
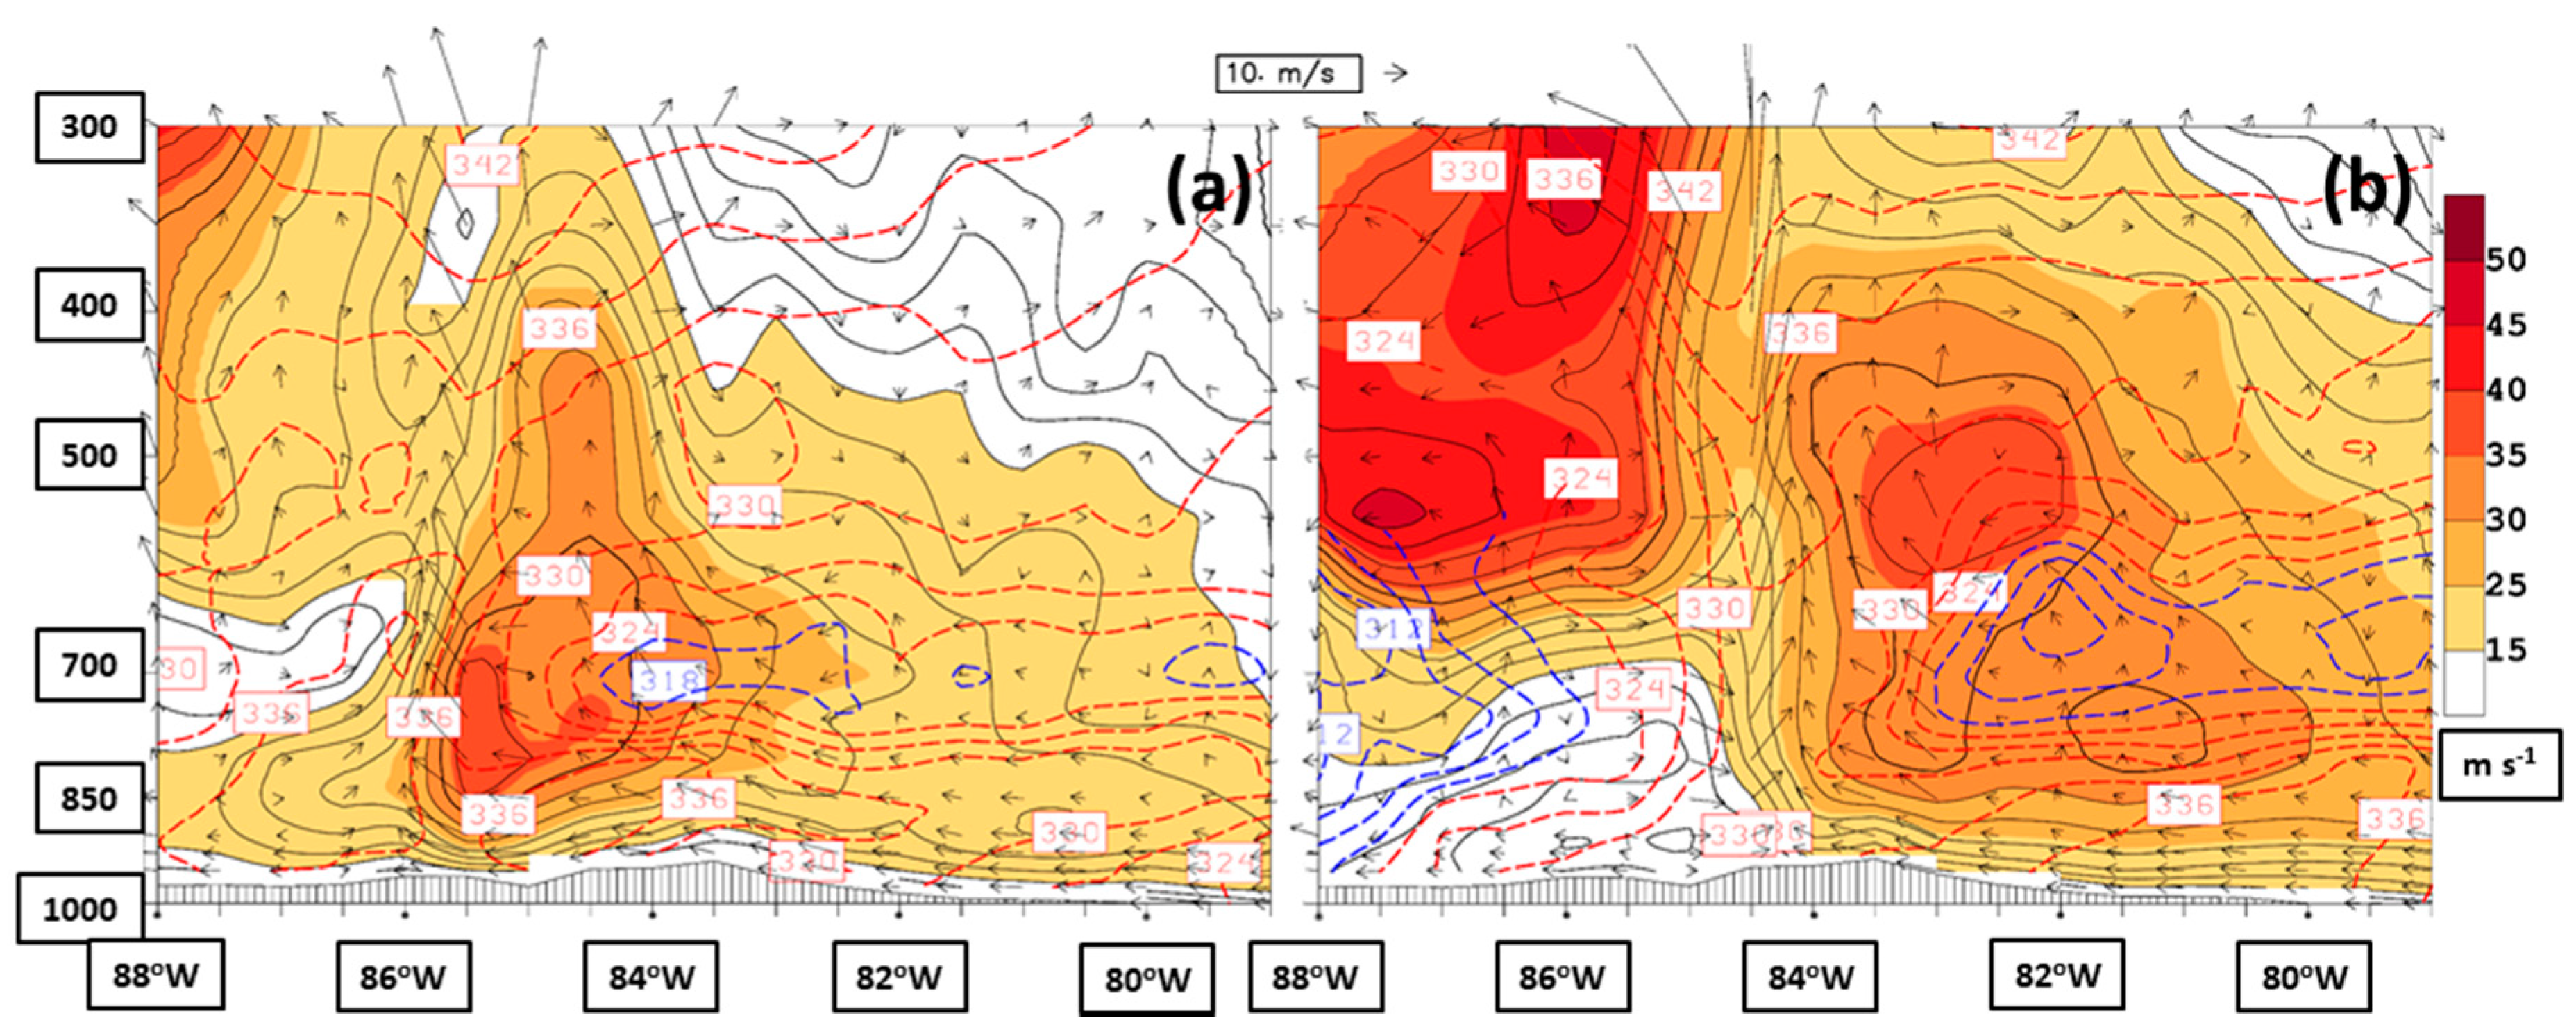
Vertical cross sections extending from 34.75°N, 88°W (left) to 34.75°N, 79°W (right, section location is plotted in
Figure 4a) both valid six hours before (0600 UTC 6 February,
Figure 8a) and at the time of the AR being centered on the southern Appalachians (1200 UTC 6 February,
Figure 8b), during the trigger phase of the February 2020 event, are displayed in
Figure 8. The 6-hourly progression of the merged polar/ sub-tropical jet in the upper-left (western) corner of the sections reflected the relatively slow eastward propagation of the storm warm sector. The breadth of the stronger winds in the lower layer at 1200 UTC 6 February (
Figure 8b) was a response to the strengthening baroclinic zone evident below the 700 hPa level and contributed to the enhanced integrated vapor transport within the AR (cf., Equation (1) of Part I). Small-scale structures evident as local minima in wind speed were collocated with small-scale convective elements highlighted by the ageostrophic circulation vectors showing strong rising motion. Isolated pockets of strong rising motion also reflected the weakly stratified environment of the warm sector at both times as highlighted by the wide vertical spacing between
θe contours. Only the cold dome of air at the surface near the western boundary of the section, behind the surface cold front at 86°W (
Figure 8b), had appreciable strong environmental stability.
Comparable vertical cross sections of the April 2020 event valid six hours before (0000 UTC 13 April,
Figure 9a) and at the time of the AR being centered on the southern Appalachians (0600 UTC 13 April,
Figure 9b), both during the trigger phase of the event, show the fast progression of the storm warm sector as reflected by the passage of the sub-tropical jet core in the upper-left corner of the section (cf., Figure 9c of Part I). The jet cores at 84.5°W at 0000 UTC 13 April (
Figure 9a) and at 83°W at 0600 UTC 13 April (
Figure 9b) owed their existence in the upper (600–300 hPa) layer to the sub-tropical jet dynamics. The local minimum of wind speed in the upper layer immediately east of the sub-tropical jet core was a consequence of MCEs having strong rising motion, made possible by the weakly stratified environment of the warm sector.
The jet core maxima in the lower (1000–600 hPa) layer of the April 2020 event represented a thermal wind response to a reversal of the east–west horizontal density gradient evident as one moves upward from the ground to the 600 hPa level. Near the ground, humid low-density (high-
θe) air was moving into the eastern half of the section, forced by flow about the surface anticyclone to the southeast and identified in the ALPW imagery (cf., Figure 11b,d) of Part I and in
Figure 5b. The east–west horizontal density gradient reversed at ~800 hPa level as dry high-density air was advected into the section at the 700 hPa level, corresponding to the eastern “dry tongue” as described in the discussion of
Figure 7b. Close inspection of
Figure 9 reveals three distinct lower layer jet core maxima at 85.5°W at 0000 UTC 13 April (
Figure 9a) and 83°W and 81.5°W at 0600 UTC 13 April (
Figure 9b), highlighted by the thick 33 m s
−1 isotach. The cores at 85.5°W and 83°W were found on the leading edge of strong and elongated convective elements (
Figure 7c), drifting eastward and weakening as their associated convection dissipated (e.g., lower layer jet core at 81.5°W in
Figure 7b). Each low-level jet enhanced the observed rainfall during the trigger phase of the April 2020 event in two ways; by increasing the horizontal vapor transport into the southern Appalachians, making vapor available to ascending air forced by synoptic-scale processes (e.g., cyclonic vorticity and warm air advection; cf., Figure 9a of Part I, upper-level divergence in the right entrance quadrant of the sub-tropical jet streak;
Figure 7a), and by providing water vapor fuel (latent heat) for driving the intense convection. A wide swath of convective instability of the environment in the storm warm sector, capped by the eastern dry tongues at 0000 and 0600 UTC 13 April, was relatively long-lived during the April 2020 event and created favorable conditions for heavy rainfall.
The western dry tongue at 0600 UTC 13 April, apparent at the western boundary of the section (
Figure 9b), extended through a relatively deep layer, overrode high-
θe air at the surface, and represented the approach of drier and cooler air from the west as part of the late storm sector. This zone of convective instability, positioned along the flanking edge of the storm warm sector, was long-lived as vertical differences in layered precipitable water were evident over western Mississippi at 0000 UTC 13 April 2020 in ALPW imagery (cf., Figures 11b,c and 12d) of Part I.
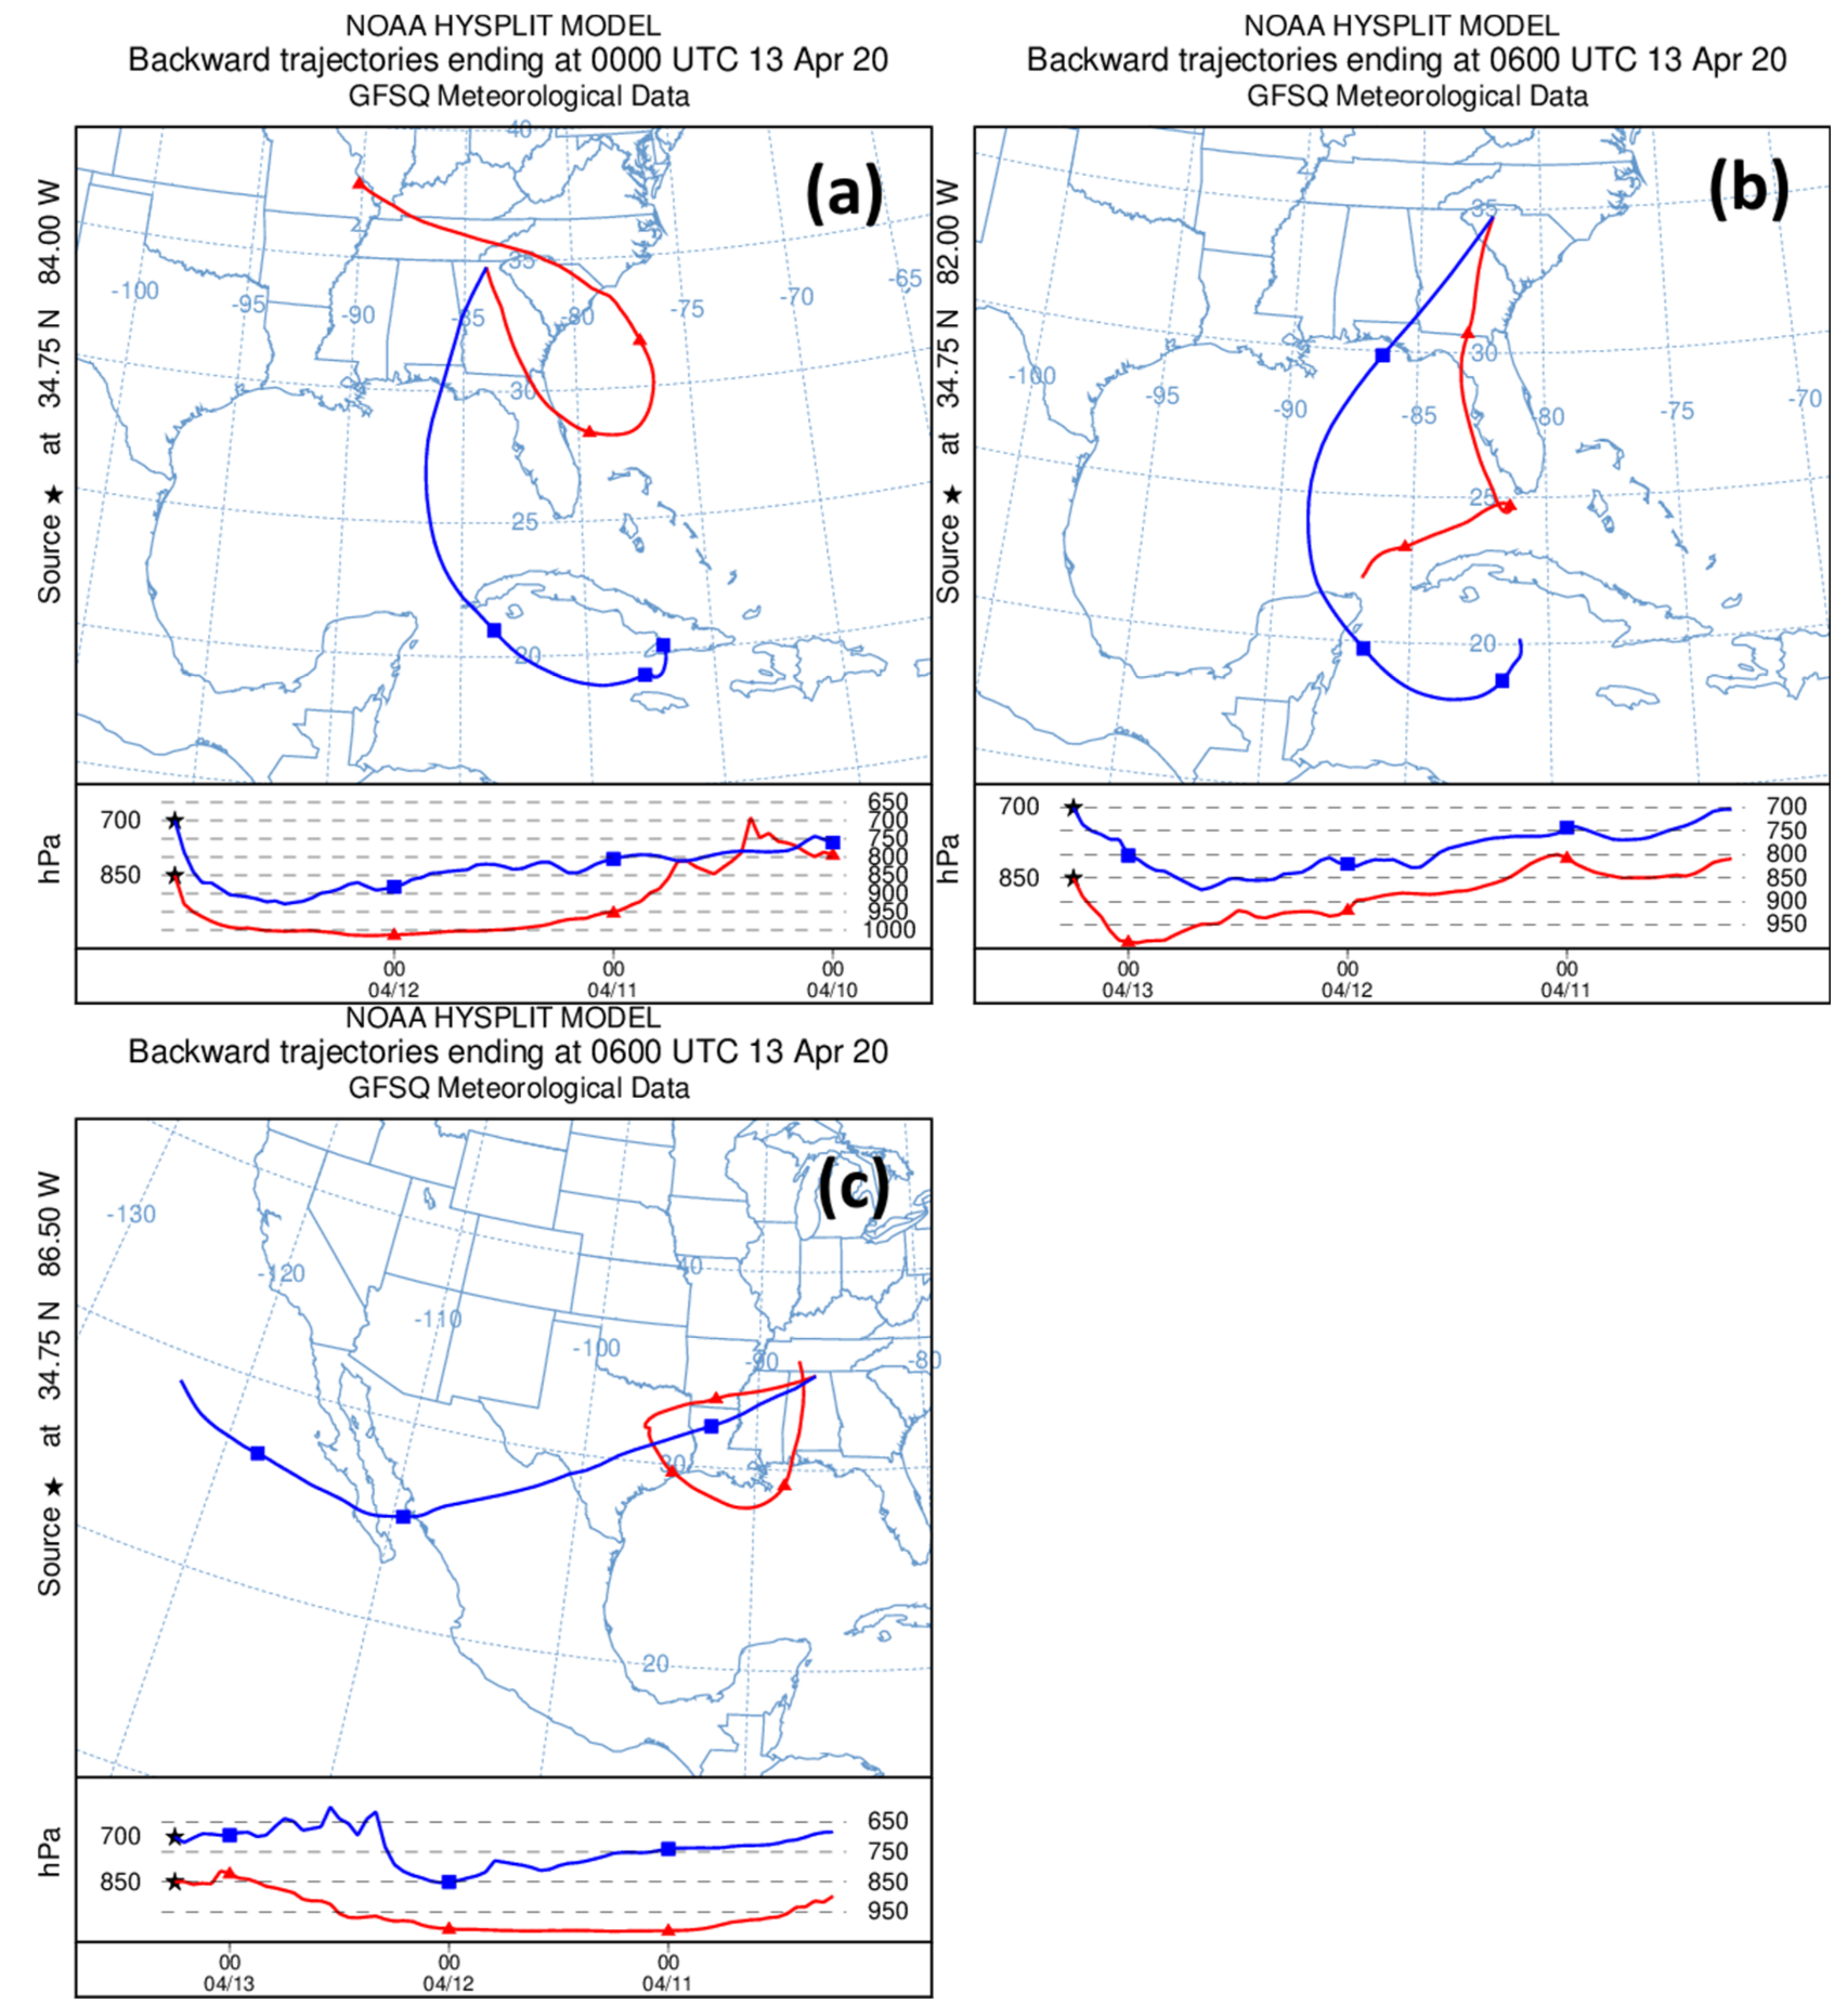
The source of high-density dry air noted at the ~700 hPa level from 0000–0600 UTC 13 April 2020 (
Figure 9) was analyzed using the HYSPLIT trajectory model [
40], its results displayed in
Figure 10. Air parcel 72-h trajectories ending at the 700 and 850 hPa level for locations east of the sub-tropical jet core are displayed in
Figure 10a (end point; 34.75°N, 84°W at 0000 UTC) and
Figure 10b (end point; 34.75°W, 82°W at 0600 UTC) showed similar points of origin for the 700 hPa level air parcels ending in the eastern dry tongue (
Figure 7b). Both air parcels started within the 700–800 hPa layer for locations just south of Cuba and moved anticyclonically with gradual subsidence associated with the offshore anticyclone until making landfall. The relative humidity of the 0000 UTC- and 1200 UTC-arriving air parcel, as established from GFS analyses, just after making landfall over Florida was 30 and 10%, respectively. Inspection of soundings released at the Owen Roberts Airport (19.30°N, 81.35°W) at 1200 UTC 9 April and 1200 UTC 10 April 2020 (not shown) indicated a strengthening subsidence inversion at low levels, with increased drying throughout the 900–300 hPa layer. Both air parcel trajectories remained far enough above the surface to avoid humidification as they traveled over the Gulf of Mexico. In contrast, the 0000 UTC and 1200 UTC air parcels arriving at the 850 hPa level (
Figure 10a,b, respectively) underneath the eastern dry tongue contained low-density humid air and spent enough time at or near the surface to become humidified from their initial dry conditions, reaching a relative humidity of 90 and 80% just after landfall, respectively. The 850 hPa air parcel that arrived in the region at 0000 UTC 13 April (
Figure 10a) was part of the converging air streams of water vapor at low levels described in Part I (cf., Figure 12d of Part I) originating over the sub-tropical Atlantic Ocean (
Figure 5b).
Air parcel 72-h trajectories ending at the 700 and 850 hPa level for a location underneath the sub-tropical jet core are displayed in
Figure 10c (end point; 34.75°N, 86.5°W at 0600 UTC). The air parcel trajectory at the ~700 hPa level ending in the western dry tongue (
Figure 7b) originated over the eastern Pacific Ocean, gradually subsiding within the sub-tropics, until making landfall along the west coast of Mexico. Once over land, the air parcel experienced ascent as it was ingested into a position downstream of the large-scale upper-air cyclone. The air parcel traveled at mid-levels throughout its journey, remaining well below saturation, with a relative humidity of only 30% as it entered northern Louisiana. In contrast, the air parcel ending at the 850 hPa level underneath the western dry tongue spent at least 24 h (0000 UTC 11 April–0000 UTC 12 April 2020) being humidified by the warm underlying waters of the northern Gulf of Mexico, reaching a relative humidity of 87% as it made landfall near the surface. For each of the 700 hPa level 72-h air parcel trajectories described above in the discussion of
Figure 10, the late period of their journey was undoubtedly spent experiencing wet-bulb cooling as precipitation of the April storm fell through their position. Hence, the relatively low-
θe layer of air at ~700 hPa in
Figure 9 was the combination of a very dry air source at the parcel origin and evaporative cooling once the air parcel reached the precipitation shield of the April storm.
3.1. Rainfall Evolution
3.1.1. Rain Gauge Observations
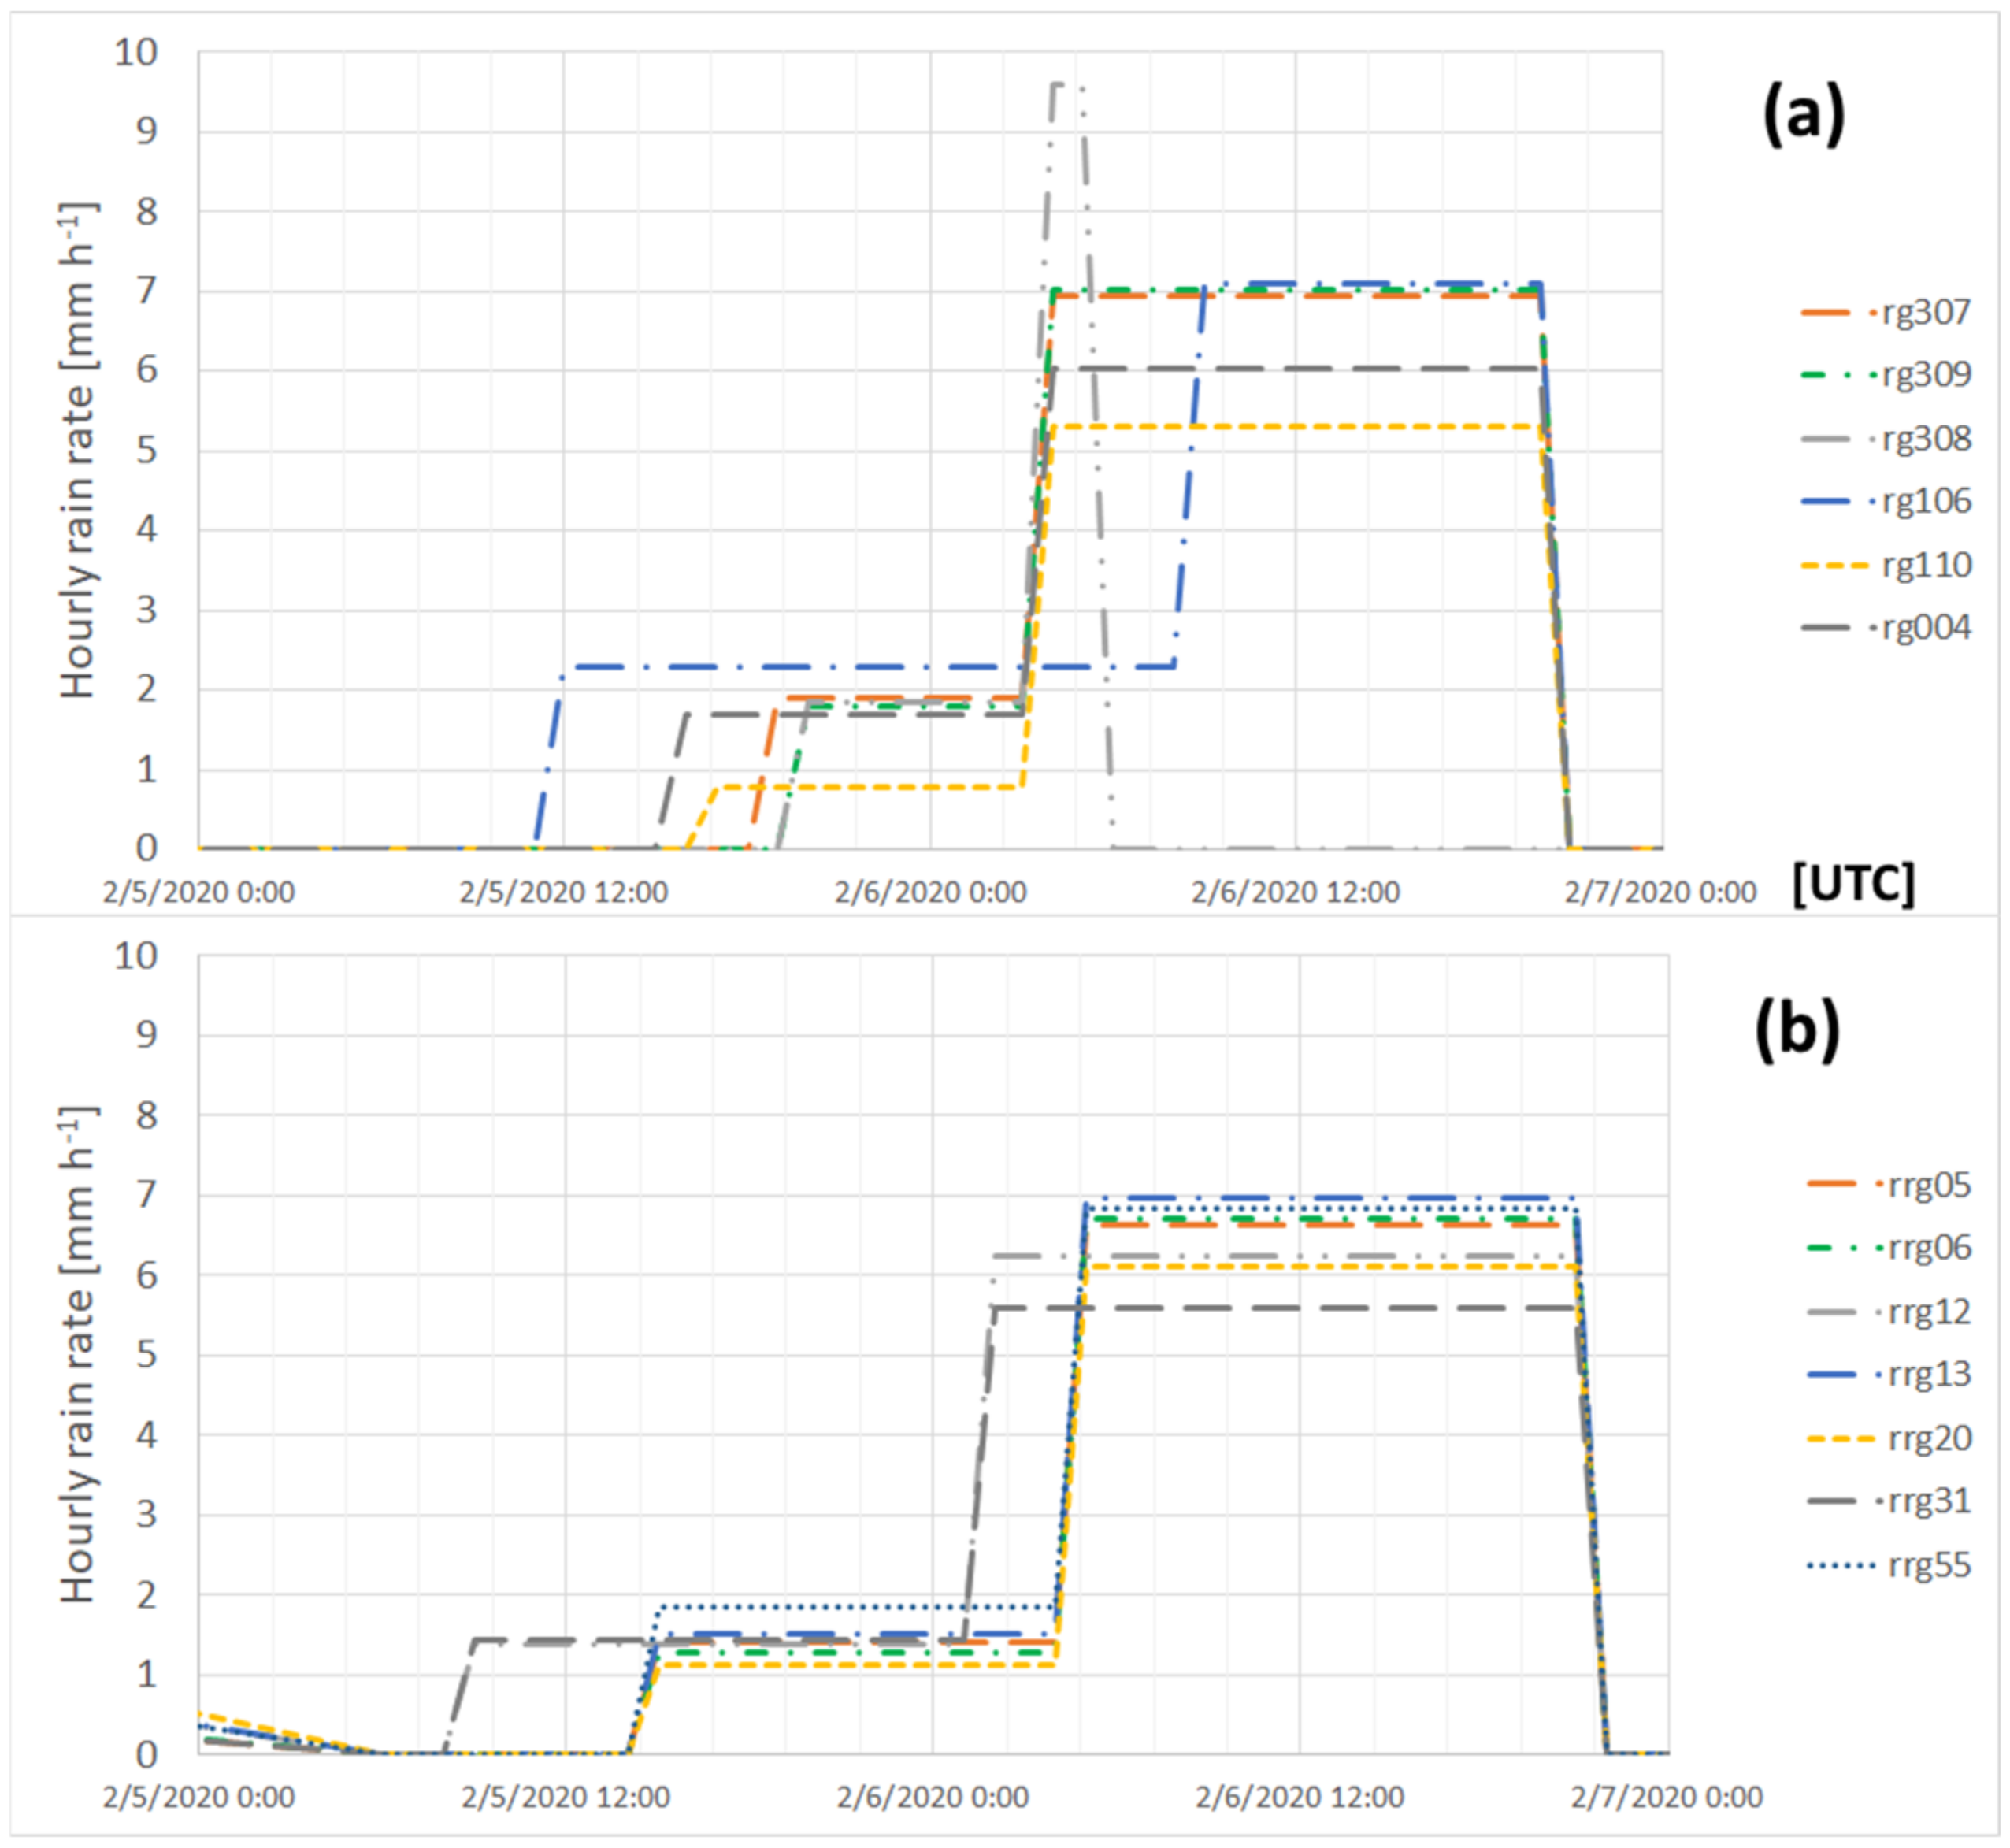
Hourly rain rate and time (RRt) profiles of both heavy rainfall events in early 2020 (
Figure 11 and
Figure 12) were created to allow comparison of the macroscopic cause and trigger precipitation structures that may have been unique to each event. Only selected RRt profiles are shown in
Figure 11 and
Figure 12 as there is much similarity in profile patterns between numerous gauges. Reasons for inclusion of particular rain gauge profiles in the figures are unique to each event and will be explained in the description that follows.
The Bunches Bald landslide occurred during or slightly after passage of the February 2020 event (inset of
Figure 1) and was located 5.1 km southwest of rain gauge #110 and 14.7 km south of rain gauge #307 of the Duke GSMRGN (
Figure 11a). For comparison, RRt profiles of the highest event accumulation gauges (#308 and #309) of the February event are included in
Figure 11, along with RRt profiles at a climatologically rainy location in the PRB (#106) and the second highest elevation gauge (#004) of the gauge network, located in the southernmost portion of the PRB. The RRt profile of the closest rain gauge to Bunches Bald (#110) was unspectacular and, potentially, its suppressed cause and trigger phase mean rain rates the result of downsloping as it is located near Garretts Gap, at a lower elevation than Bunches Bald (1672 m). A review of animations of radar reflectivity observed by the WSR88D station of the Morristown, TN National Weather Service (NWS) office (KMRX, not shown) indicated cloud elements moving from the southwest, orthogonal to the ridgeline containing Bunches Bald, confirming likely downsloping at gauge #110. The RRt profile at the next closest rain gauge to Bunches Bald (#307) was not noteworthy compared to the gauge of the greatest event accumulation (179 mm, #309). The ordinary nature of the gauge #307 RRt profile was further confirmed when compared to those of seven selected rain gauges in the CRB (
Figure 11b), showing similar cause phase hourly mean rain rates (1.9 mm h
−1) and trigger phase hourly mean rain rates (6.9 mm h
−1). Recall that no landslides occurred during or after the February event in close proximity to the CRB. In hindsight, the lack of high-impact downstream flooding observed between Newport and Chattanooga, Tennessee (Part I) after the February event suggested the pre-event deep soil moisture was low (storage well below capacity) such that a minimal number of landslides (two) were triggered by a long duration and high accumulation event.
Consistent with the hypotheses and findings of Collins et al. [
13], the lack of organized MCEs embedded in the middle sector of the February event having high-intensity rain rates prevented widespread landslide occurrence in the southern Appalachians. A supposition, consistent with the findings of Nippgen et al. [
3] and Part I of the study, is the February event added significantly to the deep volumetric water storage of the southern Appalachians, predisposing the region to landslides when the second heavy rainfall event entered the southern Appalachians in April.
In contrast, the April event consisted of numerous sizable embedded MCEs (observed by the WSR88D station at the Greer, SC NWS office (KGSP, not shown)), particularly near the shared border between North and South Carolina, which gave hourly mean rain rates several times greater in the PRB (
Figure 12a) and CRB (
Figure 12b) than observed during the February event. Most of the 21 landslides triggered during or just after the April event occurred north and within 30 km of the CRB (
Figure 1). The gauge observing the highest event accumulation in the PRB (#102,
Figure 12a) had hourly mean rain rates during the cause phase matching the rates observed during the trigger phase of the February event (~7 mm h
−1). Although its trigger phase hourly mean rain rate was nearly triple (~19 mm h
−1) that of the February event, its magnitude and duration (5-h) was insufficient to trigger a landslide in its proximity or for any gauge location in the PRB. This would suggest a combination of an insufficient preconditioning of the deep soil water storage of the PRB during the February event (mean event accumulation of 138 mm) and/or an insufficient accumulation during the cause and trigger phase of the April event (mean event accumulation of 94 mm) for exceeding the deep soil storage capacity of the PRB.
In the CRB to the south, the preconditioning of the deep soil water storage during the February event (mean event accumulation of 157 mm) and/or a sufficient accumulation during the cause and trigger phase of the April event (mean event accumulation of 126 mm) exceeded the deep soil storage capacity of the CRB, resulting in widespread landslides in the region. Three gauges in the CRB observing the largest trigger phase hourly mean rain rate and duration (#05, #13, and #20,
Figure 12b) are located along the ridgeline of its northernmost border, on south-facing slopes, ideal positioning for upslope flow during the second-half of the middle storm sector during the April event. The RRt profile of gauge #31, located at the southernmost ridgeline of the CRB boundary, observed a one-hour trigger phase having an hourly mean rain rate of 30 mm h
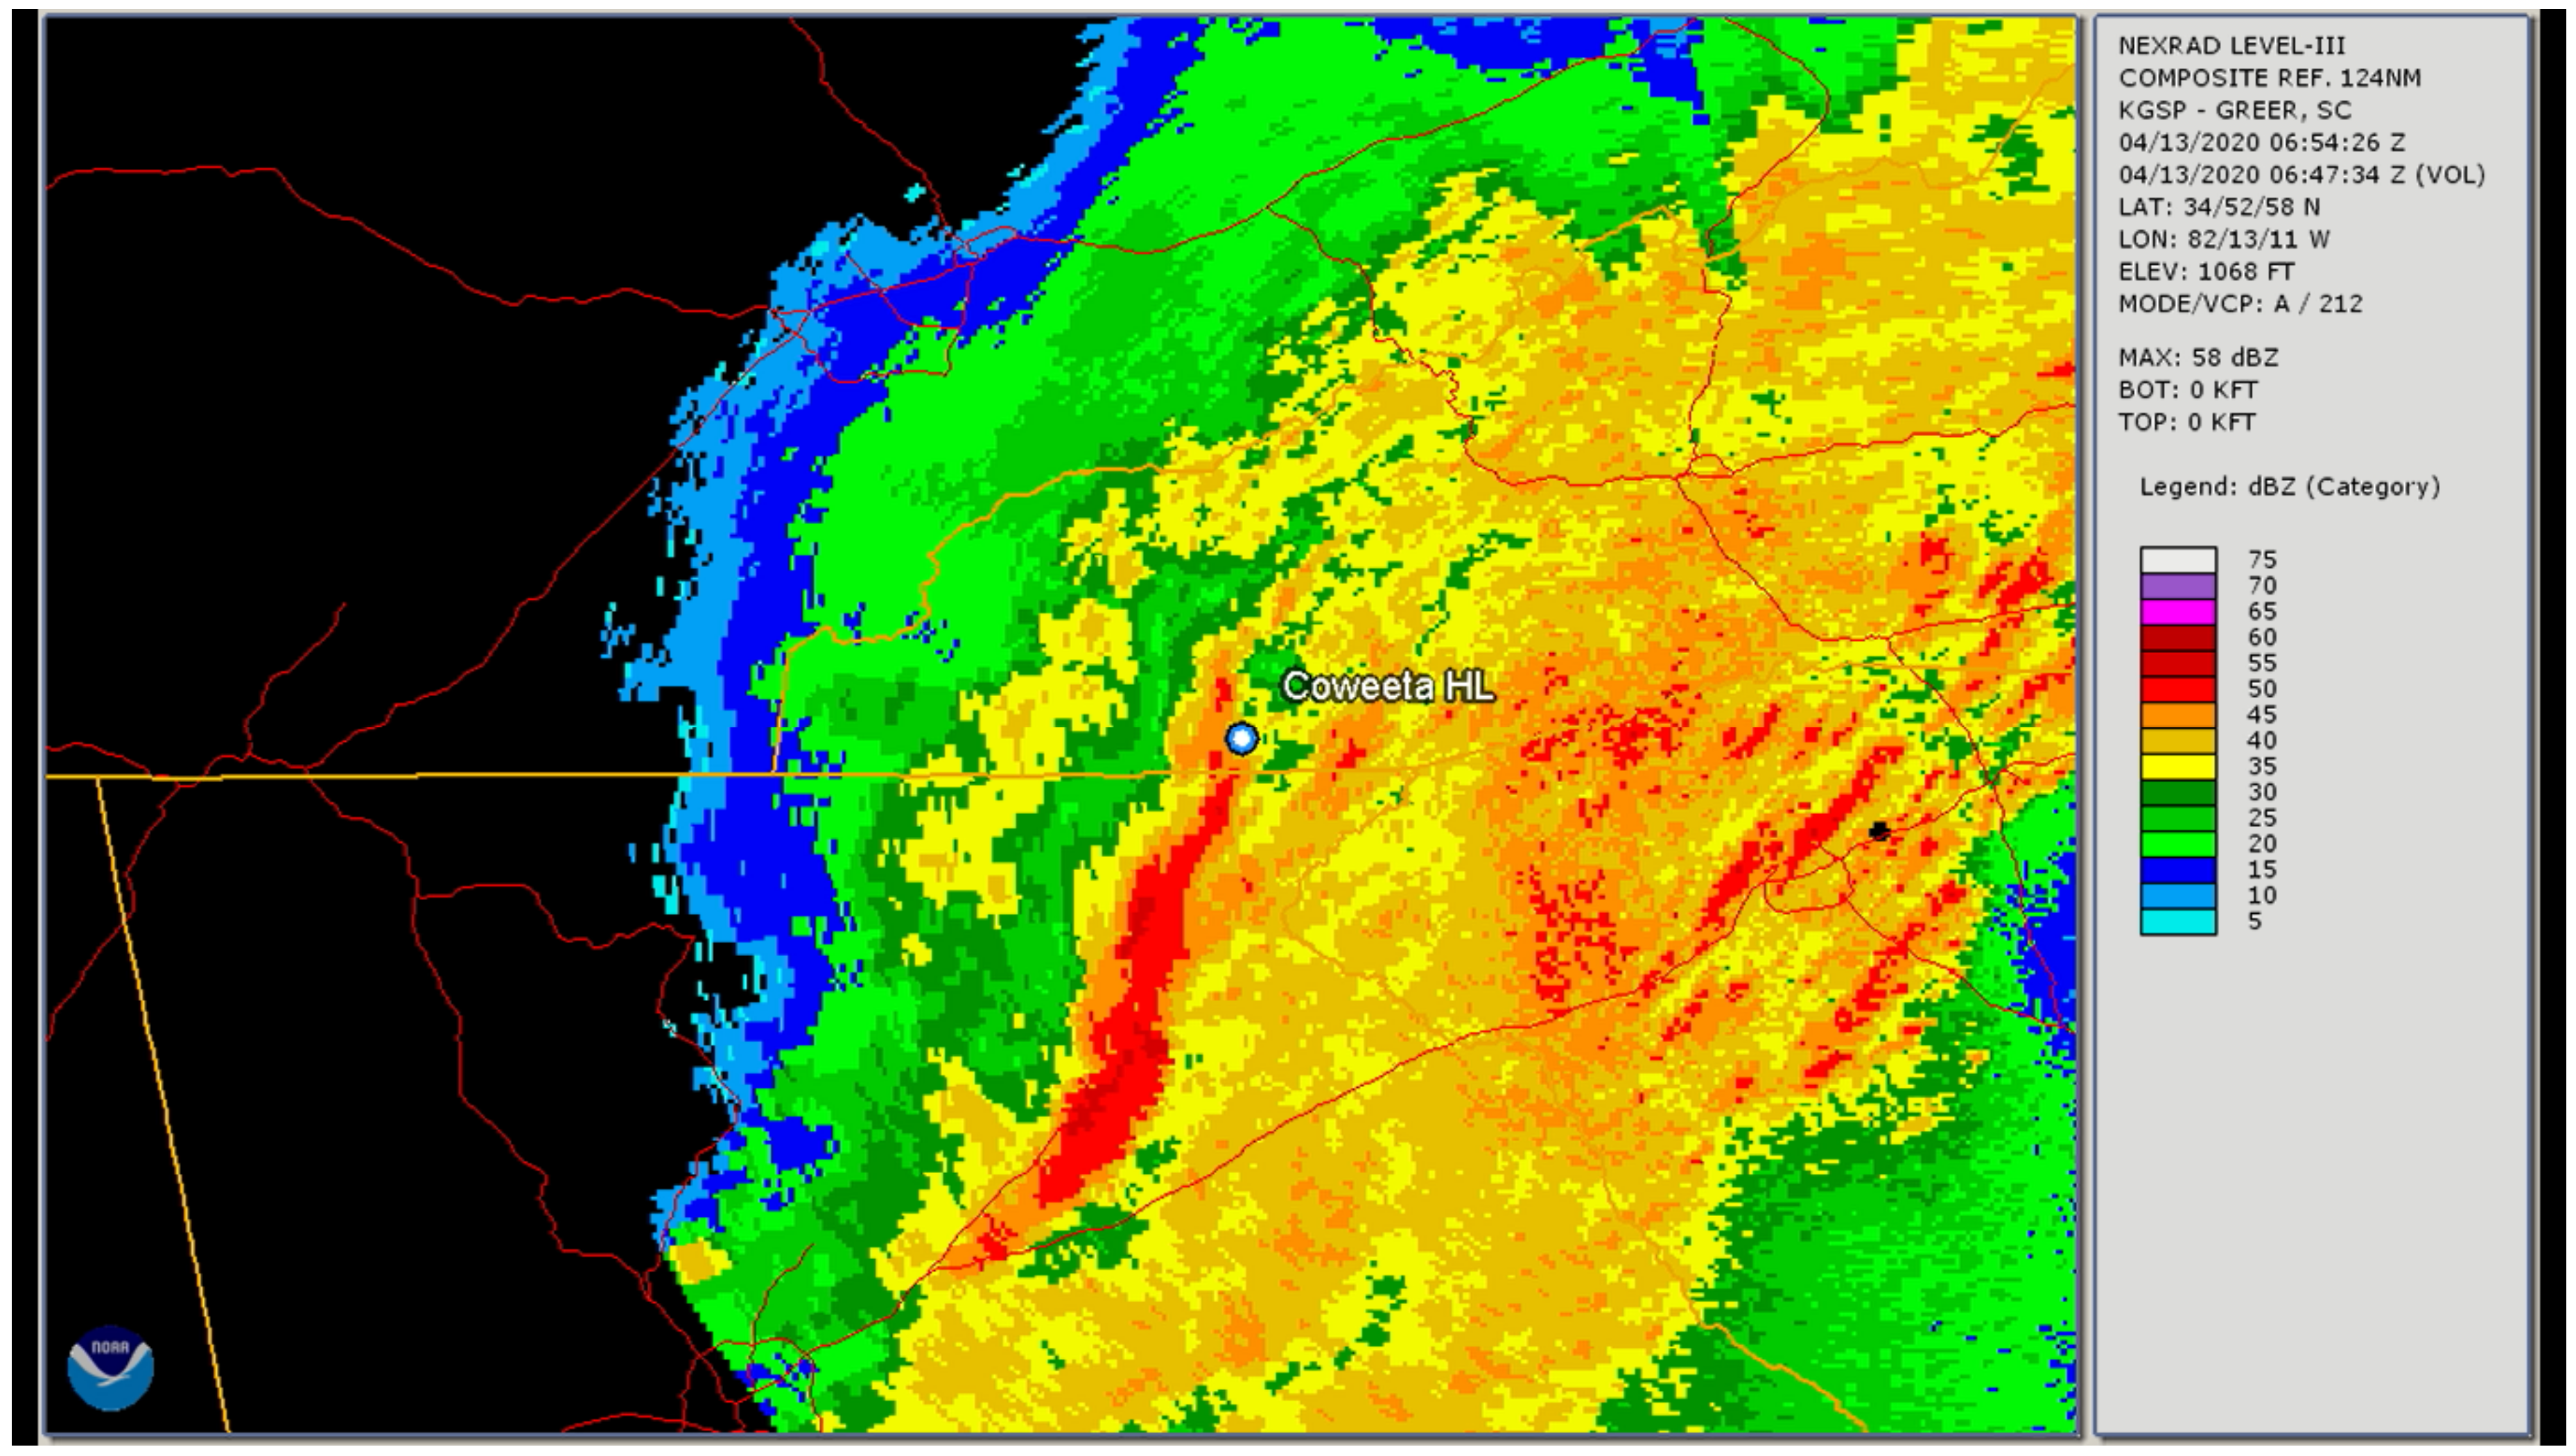
−1, the consequence of a linear MCE (
Figure 13) located at the leading edge of the 700 hPa level western dry tongue (
Figure 7b and
Figure 9b).
3.1.2. Space-Borne Rainfall Estimates
A comparison of CMORPH-based QPEs averaged over the 1° × 1° landslide focus region (
Figure 4d) to the advective timescale-averaged 15-min “instantaneous” rain rate observations of the Duke GSMRGN are provided in
Figure 14. As described above and in Part I, the February 2020 event (
Figure 14a,c,e) was of longer duration and had the higher event accumulation compared to the April 2020 event (
Figure 14b,d,f). CMORPH accumulation estimates suggest the February was nearly double that of the April event (
Figure 14a,b). The time of greatest CMORPH-based mean and maximum rain rates in both events occurred when the integrated vapor transport (IVT) plume associated with the AR was centered over southwestern North Carolina (cf., Figure 6a,b of Part I). Observed elevated mean and maximum rain rates of the Duke GSMRGN corresponded to the passage of ARs of both events, but also showed significant rates at earlier stages of the February 2020 event, associated with the smaller and lesser-organized MCEs described above (1200 UTC 5 February and 0500 UTC 6 February 2020;
Figure 14c,e). CMORPH-based mean and maximum rain rate estimates during the early stages of the April event AR passage (0000–0500 UTC 13 April;
Figure 14d,f) were nearly half the amounts observed by the Duke GSMRGN.
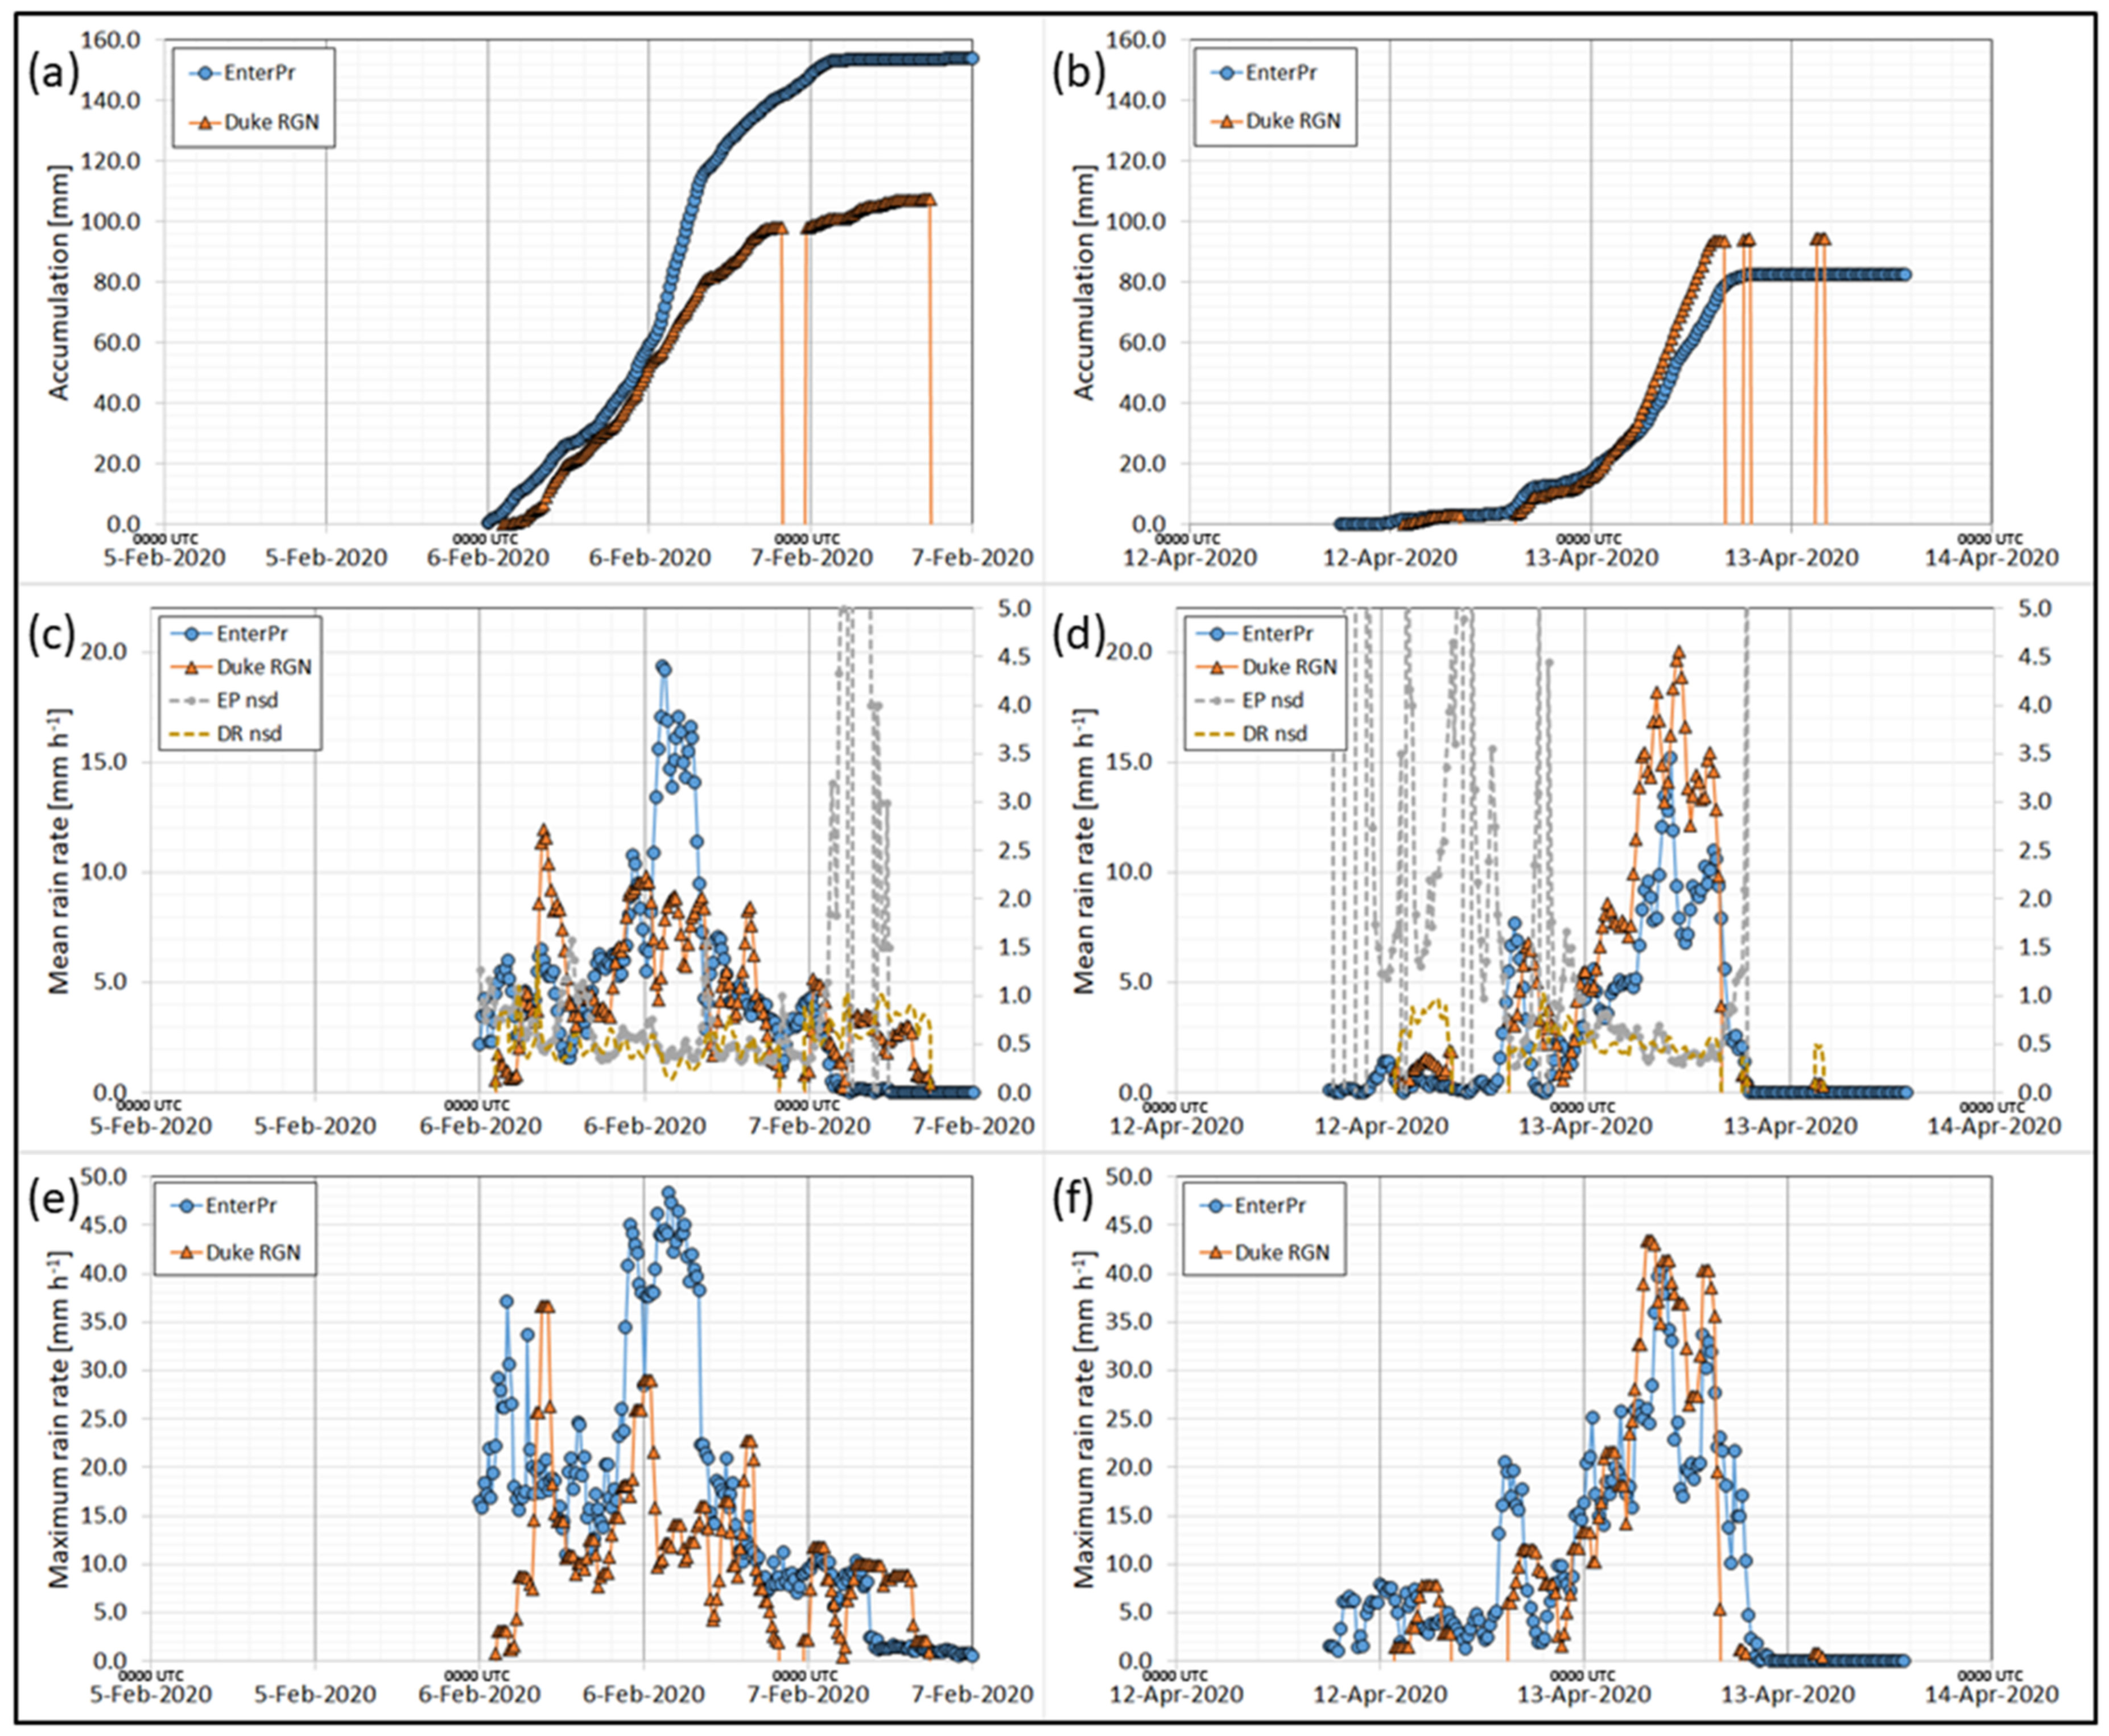
A comparison of Enterprise-based QPEs averaged over the 1° × 1° landslide focus region to the advective timescale-averaged 15-min “instantaneous” rain rate observations of the Duke GSMRGN are provided in
Figure 15. The lower observed Duke GSMRGN accumulation totals of the February event in
Figure 15a are due to the “late” start of the Enterprise record of observations, which initiate at 0000 UTC 6 February 2020. In spite of the late start of the data record, the overall Enterprise-based total event accumulation of the February storm is comparable to the total CMORPH estimate (
Figure 14a). This “catch up” in accumulation was made possible by a particularly active period (1000–1600 UTC 6 February 2020;
Figure 15c,e) assessed by the Enterprise algorithm in which mean and maximum rain rates topped out at 19.4 and 48.4 mm h
−1, respectively, in the landslide focus region. Elevated mean rain rates were also noted over the region during this period by CMORPH (
Figure 14c), which corresponded to the middle and late stages of an AR passing over the focus region (
Figure 6). In contrast, observed mean and maximum rain rates of the Duke GSMRGN over the same period did not exceed 10 and 30 mm h
−1, respectively (
Figure 15c,e). Unfortunately, MiRS and GPROF QPEs were unavailable within the active AR period during the February event (
Table 1) due to their orbital geometry. Average accumulation observed by the CHLRGN in the CRB over this 6-h period was 49.6 mm, compared to the Enterprise estimate of 65.2 mm. Although physically plausible, the high Enterprise QPEs over the 6-h period due to the relatively small and transient convective elements of the February event (
Figure 6c), compared to the larger and slower moving elements of the April event (
Figure 7c and
Figure 13), raise suspicions. Enterprise QPEs during AR passage of the April event (
Figure 15d,f) over the landslide focus region were much reduced in mean and maximum rain rate compared to the February event. The GPROF 53.28 mm h
−1 maximum rain rate estimate at 0740 UTC 13 April 2020 (
Table 1) was a reflection of the reinvigorated convective line depicted in
Figure 13 as it exited the mountains and moved east of the landslide focus region. The MiRS QPEs of 0659 UTC 13 April 2020 (
Table 1) were valid five minutes after the time of the convective line radar image depicted in
Figure 13 as it was crossing the southern Appalachians. Closer inspection of the reduced Enterprise QPEs during AR passage of the April event revealed warming cloud tops in GOES-16 IR imagery that forced a change in rain-type classifications relating IR window brightness temperatures to surface rain rate. Hence, the reduced Enterprise QPEs during AR passage of the April event were likely in error, rather than the elevated estimates during AR passage of the February event.
Given the plausibility of the Enterprise QPEs during AR passage of the February event, it is worth considering that the nearest gauges of the Duke GSMRGN to the initiation point of the landslide at Bunches Bald were too far north and east to be representative of atmospheric conditions at the bald. In other words, the observed maximum rain rates at the Duke GSMRGN gauges #110 and #307 during the 6-h period (18.1 mm h
−1; 1000–1600 UTC 6 February 2020,
Figure 11a), 5.1 km northeast and 14.7 km north of the Bunches Bald ridgeline, respectively, were outside the influence of a small-scale and transient MCE passing overhead, having a localized rain rate as high as 48.4 mm h
−1. The third closest of the Duke GSMRGN gauges (#106) to Bunches Bald, located 17.0 km to the southeast, observed a maximum rain rate during the 6-h period of 29.0 mm h
−1. Total Enterprise event accumulation estimates of the February storm (not shown) increased southward, toward the Blue Ridge Escarpment. Hence, Enterprise QPEs during the February event raise the possibility of the cause and trigger by atmospheric processes being sufficient to initiate the landslide at Bunches Bald. A survey of the landslide zone near Bunches Bald by the NCGS showed it was initiated on a human-modified slope, near where a previous heavy rainfall event had initiated a landslide in April 2019 [
41]. Wooten et al. [
11] and others have shown that landslides can be initiated with lower intensity peak rain rates where the surface soil has been modified by human activity. The increased vulnerability of the soil at this location likely reduced the critical cause and trigger landslide thresholds, resulting in an isolated landslide for relatively modest rain rates.
3.2. Other Space-Borne Nowcasting Aids
Vertical profiling capabilities of instrumentation aboard the polar-orbiting NOAA-20/ATMS and S-NPP/ATMS satellites offer unique insights into the thermodynamics of these extratropical storms. Retrieved profiles of temperature and water vapor allow the analysis of convective instability potential through vertical cross section plots of
θe (
Figure 16). After passage of the AR during the February event (1825 UTC 6 February 2020,
Figure 16a), a relatively stable environment was evident through all layers of the atmosphere as
θe clearly increased with height above the surface, consistent with the general pattern of the GFS analysed vertical sections (
Figure 8). The transition from maritime tropical to continental polar air masses was evident on the left-hand side of the section at 1825 UTC 6 February with lower
θe values moving in from the west. As addressed in the discussion of observed rain rates shown in
Table 1, no polar-orbiting observations of
θe were available near the time of the AR being centered on the landslide focus study area (1200 UTC 6 February 2020,
Figure 4d). Hence, analysis of the evolution of pre-, concurrent-, and post-AR environmental stability as estimated by MiRS was not possible for the February heavy rainfall event.
In contrast, passage of the AR during the April 2020 event (
Figure 16b) showed isolated “pockets” of instability just below the 700 hPa level, similar to the GFS-analysed vertical sections (
Figure 9), as
θe decreased with height from the ground to 700 hPa. The low-stability pocket in the middle of the section (
Figure 16b) is likely associated with the western “dry tongue” (source region over the eastern Pacific Ocean) while the pocket near the eastern edge of the section was associated with the eastern “dry tongue” (source region located south of Cuba). The low-
θe air moving in from the west (left-hand edge of
Figure 16b) represented the transition to dryer continental polar air as maritime tropical air and its parent cyclone moved eastward at 0659 UTC 13 April 2020.
4. Discussion
The lack of mid- and lower-layer soil moisture measurements makes the prediction of landslide initiation in the mountains challenging. As suggested by Nippgen et al. [
3], watershed memory implies that runoff and storage within the watershed requires a long period view (six months or less) of precipitation events affecting it, beyond the 30-day lag period investigated in Miller et al. [
4]. Although absolute water storage of mountainous watersheds is likely to be an unknown in the foreseeable future, remote sensing observations of downstream flooding (e.g., VIIRS/ABI algorithm of Part I), post-event upper-soil layer moisture drying rate (e.g., SMOPS; cf., Figure 10 of Part I), and geostationary QPEs (e.g., CMORPH and Enterprise algorithms) allow indirect estimates in the trends of relative water storage in the watersheds.
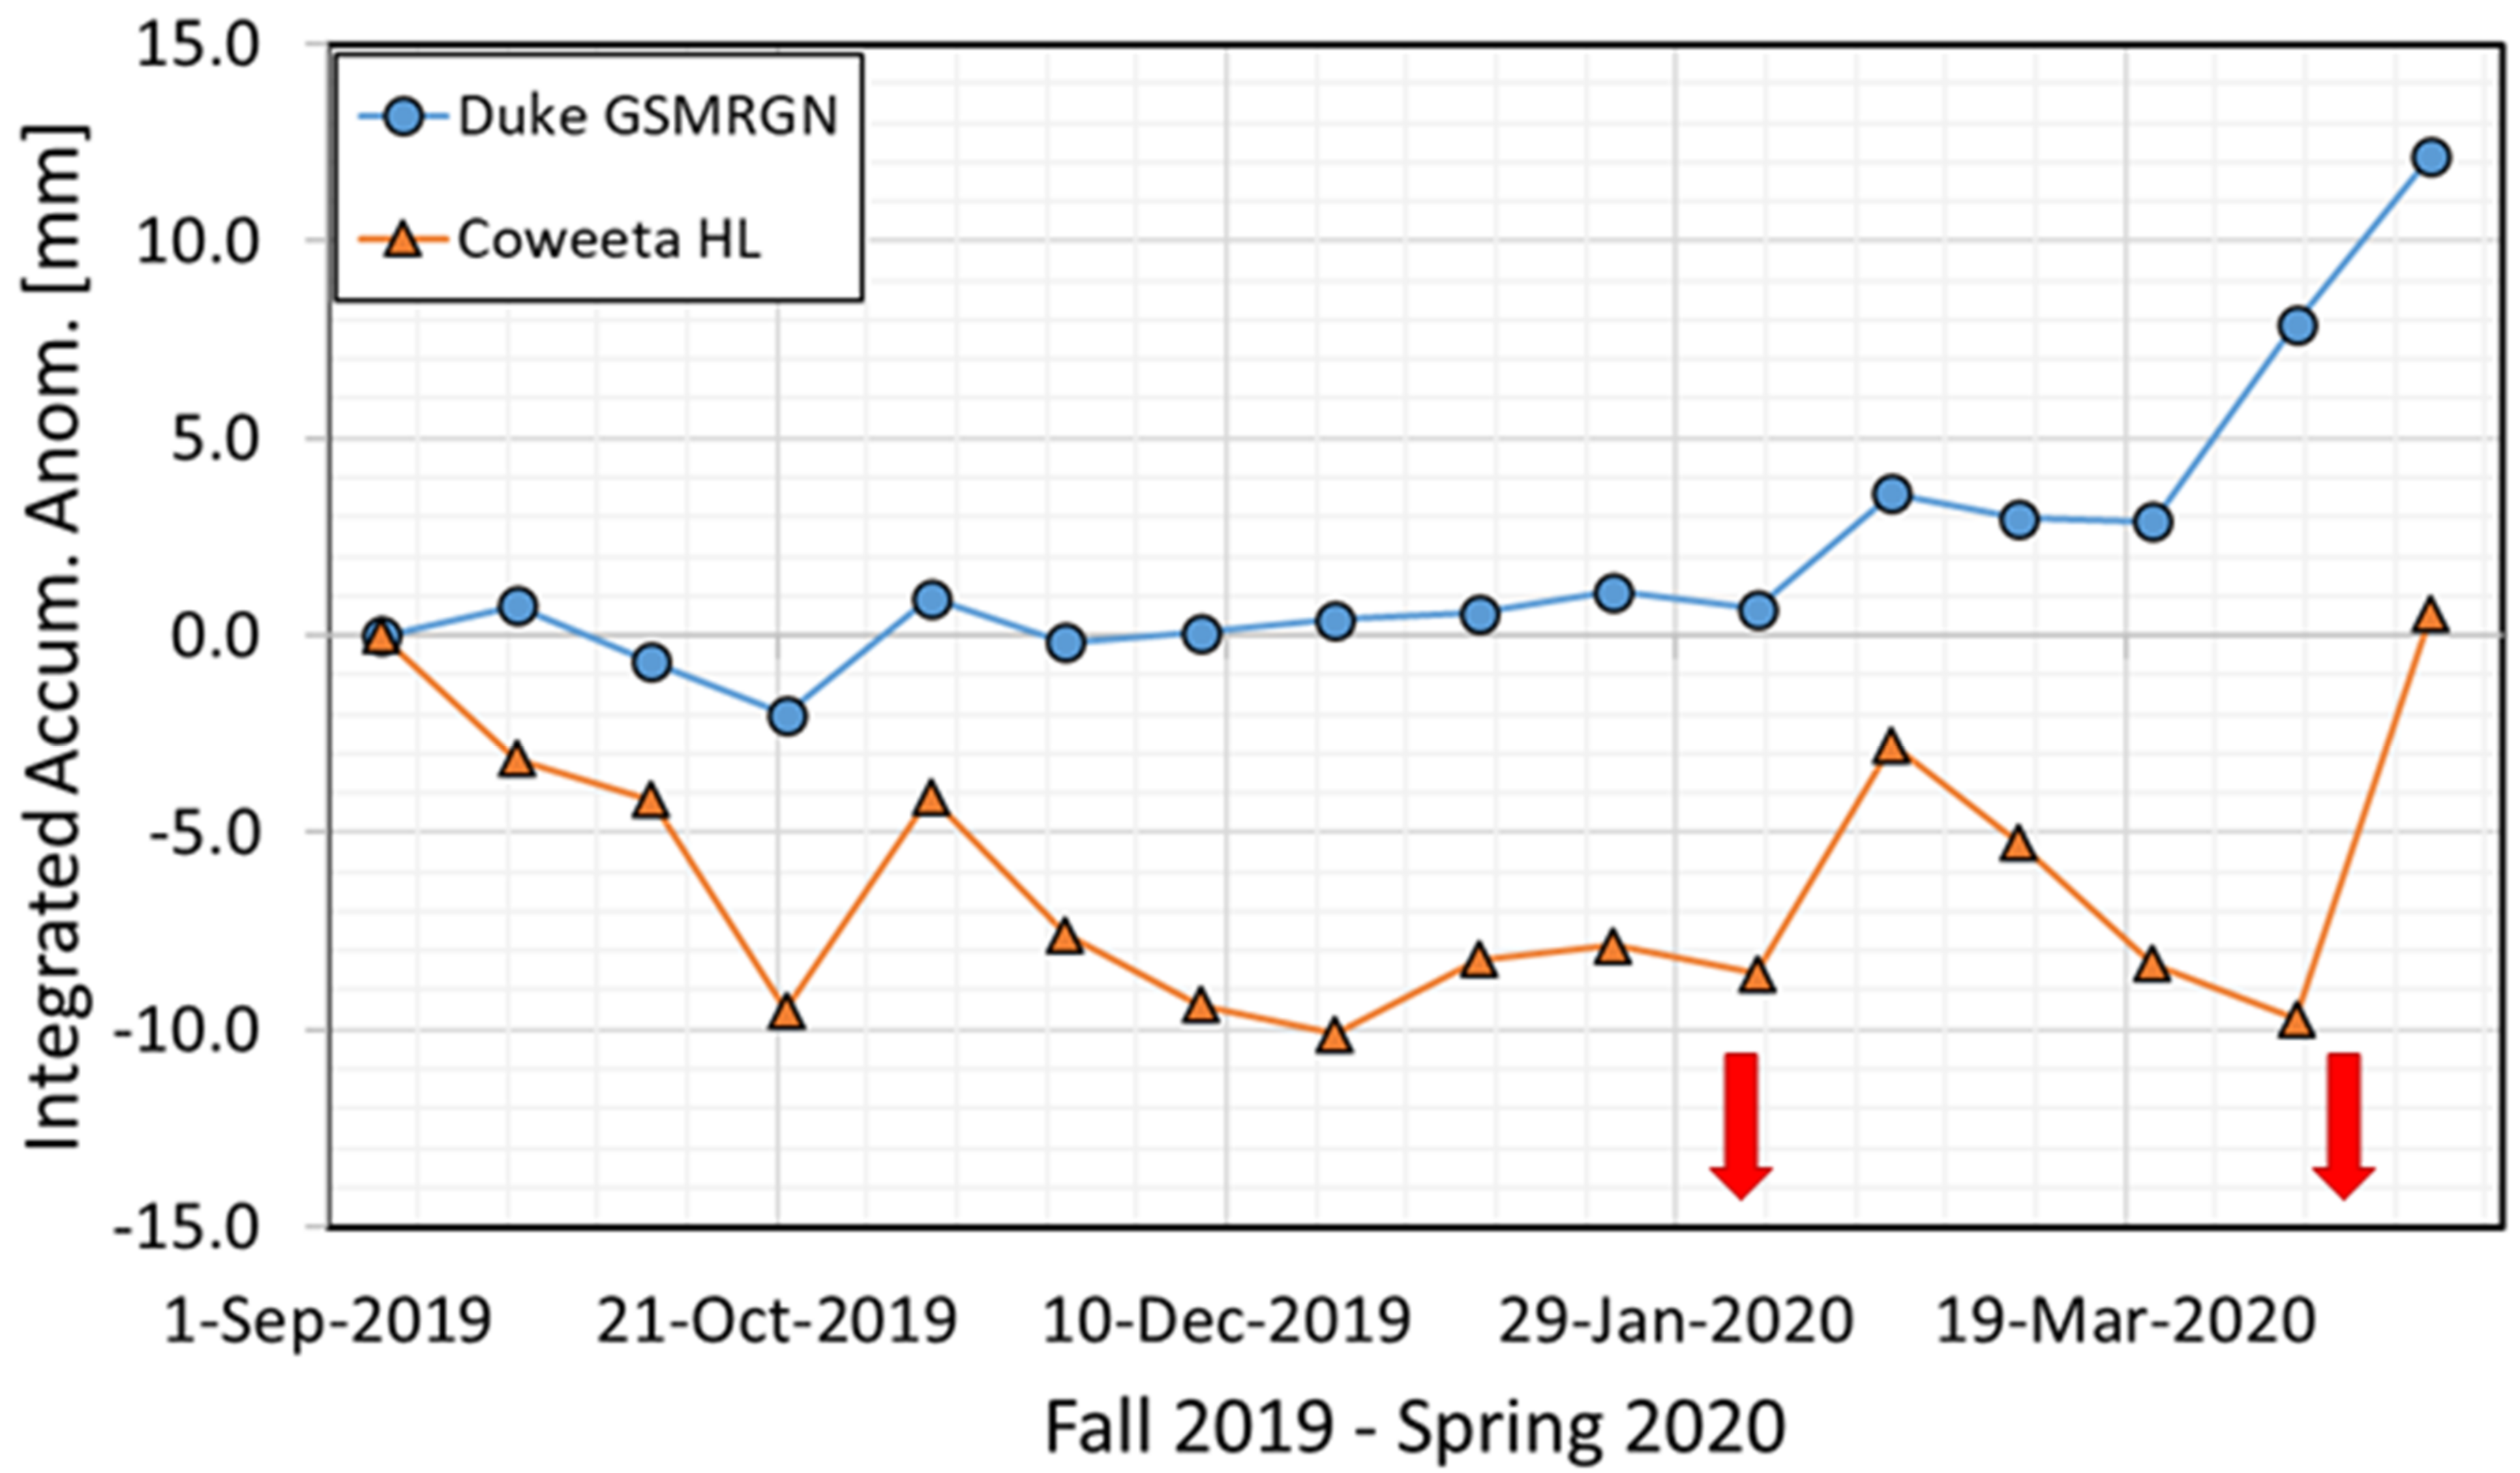
Figure 17 is the bi-monthly integrated watershed-averaged precipitation accumulation climatological anomaly of the PRB (blue) and CRB (orange) with an early September 2019 starting point. Time series in
Figure 17 are calculated from the observed and climatological time series in Figure 13 of Part I. Bi-monthly data points (first half; days 1–15, second half; days 16-end of month) are plotted on the 7th and 22nd day of each month and represent the summed bi-monthly anomalies up to the point. For example, the CRB anomaly point plotted on 22 December 2019 represents the summed CRB-averaged precipitation accumulation anomaly over the period 1 September–15 December 2019. No matter the slope of the lines in
Figure 17, precipitation is always adding water to the watershed that is either stored or lost through runoff and evapotranspiration. The stronger the positive slope, water input via precipitation is exceeding watershed loss to a greater degree, and storage is increasing at a faster rate. With a large enough archive of geostationary QPEs over each mountainous watershed, the curves of
Figure 17 could be recreated to serve as input to relative water storage assessments, negating the need to have rain gauge networks covering the entire mountainous region. Post-event observed downstream flooding and upper-soil layer moisture drying, coupled with observed precipitation event accumulation and duration, would also contribute as input to the qualitative estimate of how close watershed storage might be to its capacity or limit. Atmospheric model predictions (forecasting) or observations of “instantaneous” rain rates by geostationary or polar-orbiting QPEs (e.g., GPROF, MiRS algorithms) during passage of each individual extratropical storm (nowcasting) during its cause and trigger phases can, with the relative water storage estimate of a mountainous watershed as described above, give a landslide forecaster the sense of whether landslides within a watershed are likely or unlikely.
Using 10 April 2020 as an example, a forecaster looking at
Figure 17 can see that a significant input of water to the PRB and CRB watersheds occurred between the first and second half of February 2020 (primarily during the 5–7 February 2020 event), no more than 65 days in the past. Investigation of downstream flooding via VIIRS/ABI observations during February would show insignificant impacts, SMOPS would indicate rapid drying of the upper-soil layer, and geostationary QPEs of the 5–7 February 2020 event would flag the event as a high accumulation and long duration event, its associated rainfall, thus, being able to infiltrate into mid and lower (deep) layers of each watershed, significantly increasing watershed storage. Additionally, the lack of widespread landslides after the February 2020 heavy rainfall event would serve as another clue that mid- and lower-soil layer water storage capacity had not been exceeded. The greater event accumulation over the CRB, along with the stronger positive slope of the CRB curve for February (
Figure 17) would alert the forecaster to the higher likelihood of landslide initiation in close proximity to the CRB. Atmospheric model forecasts of the 12–13 April 2020 event, with sufficient skill, would further alert the forecaster to the likelihood of landslides triggered by the presence of MCEs in the middle sector (trigger phase) of the storm. “Sufficient skill” implies that atmospheric models would accurately simulate the observed “dry tongues” and AR, necessary ingredients for sustaining the landslide-triggering MCEs of the April 2020 event. Vertical sections of MiRS-estimated
θe (
Figure 16) nicely highlighted differences in environmental stability between the two heavy rainfall events. Such a product could prove useful as a nowcasting tool in evaluating convective instability potential during the passage of ARs, if imagery was available more frequently than the local times of ascending and descending nodes of polar-orbiting satellites.
It is possible widespread landslides may have occurred had the February 2020 event occurred, instead, in November or December 2019. Post-Olga, at the end of October 2019, produced two shallow landslides (rupture depths of ~0.91 m, [
15]) in the southern Appalachians without widespread flooding, indicative of Olga rainfall serving as a replenishing event for mid- and lower-soil layer water. In reality, the 98-day lag time between the passage of tropical cyclone Olga and 5 February 2020 allowed ample time for runoff to reduce the mid- and lower-soil layer moisture content in the southern Appalachians. Despite sporadic rainfall events between the end of October 2019 and 5 February 2020, soil water replenishment in the interim period (
Figure 17) was too weak to keep soil water content near capacity. As a result, the “instantaneous” (15-min) rate rates (
Figure 14c,e and
Figure 15c,e) and cause and trigger phase hourly rain rates and duration (
Figure 11) of the 5–7 February 2020 event proved insufficient for overwhelming soil moisture storage capacity. Only two superficial landslides occurred after the February 2020 event, indicating its associated rainfall served primarily to replenish the mid- and lower-soil layer water 65 days before the April 2020 heavy rainfall event.
Once a sufficient number of rainfall case studies has been collected over the southern Appalachians to establish a meaningful precipitation climatology, a future study can begin to investigate positive slope thresholds of the curves in
Figure 17 that could form the basis of landslide “watch” issuances for relevant basins. In addition to defining positive slope thresholds, examination of corresponding space-based QPEs, downstream flooding and upper-layer soil moisture drying estimates, along with observed (NCGS) landslides of each event will help improve understanding of lag thresholds between a significant replenishing event and an upcoming rainfall event. The lag threshold will undoubtedly also be a function of the predicted “instantaneous” (15-min) rate rates and cause and trigger phase hourly rain rates and duration of the upcoming rainfall event.
5. Conclusions
In conclusion, a comparison of two heavy rainfall events of early 2020 in which the long duration event (February) yielded two documented landslides, while the shorter duration event (April) yielded 21 landslides spread over a broad area near the CRB in the southern Appalachian mountains, illuminated key factors resulting in the different outcomes. The large-scale upper-level trough/cyclone supporting each storm was initiated beforehand by anticyclonic Rossby wave breaking (Part I). A significant distinction between the two events in the large-scale weather pattern was the role of the downstream sub-tropical anticyclone. The anticyclone of the 12–13 April 2020 event was responsible for a humid airstream originating from the sub-tropical Atlantic Ocean converging with another airstream having origins in the Caribbean Sea/ Gulf of Mexico (
Figure 5b of this paper and Figure 11b,d of Part I). The downstream anticyclone also provided a source region of dry air above the PBL south of Cuba. Because of its strengthening subsidence, the dry air stream guided poleward by the sub-tropical anticyclone and ingested into the April storm, immediately above the moisture-laden AR, was a sustained dry air source (
Figure 10a,b), the eastern “dry tongue”. The omnipresent dry layer yielded long-term available potential energy that, combined with synoptic-scale lift, released convective instability (
Figure 9 and
Figure 16b) and long-lived and relatively large MCEs.
The largest and longest lived of the MCEs in the April event was found on the western flank of the AR (
Figure 9b), in a position one might expect to find a narrow cold frontal rainband (
Figure 13) corresponding to the second-half of the middle storm sector stage (
Figure 2b), during the trigger phase. The source of the western “dry tongue” air stream was a sub-tropical anticyclone in the eastern Pacific Ocean (
Figure 10c) and was ingested into the large-scale upper-air cyclone as it moved poleward. The dry airstream, in a storm-relative sense, moved eastward faster than the progression of the AR so that the airstream overtook it and provided yet another environment of sustained convective instability (
Figure 9b and
Figure 16b) during passage of the late middle storm sector.
Conditioning of the mid- and lower-soil layer moisture by the 5–7 February 2020 event 65 days before the April 2020 event was a key ingredient to the widespread landslide response observed near the CRB during and after the rainfall of the 12–13 April storm. This conclusion was based on space-borne observations showing a lack of downstream flooding and a rapid drying of the upper-soil layer after the February 2020 (Part I). These observations, coupled with the scant number of observed landslides, led to the conclusion that the February 2020 event was primarily a soil moisture-replenishing event.
A significant number of landslides that occurred during and after the April 2020 storm were concentrated near the CRB (
Figure 1). The storm ranked as an extreme (top 2.5%) rainfall event in both the CRB and PRB over the 86- and 11-year data archive, respectively. A natural question worthy of attention is why landslides did not occur near the PRB during or after 13 April 2020. The event accumulation mean rainfall of the February 2020 event in the PRB was 138 mm (compared to 157 mm of the CRB, Part I), and it could be argued that the antecedent soil moisture was not as well conditioned for landslides to occur in the PRB in April. However, it is unlikely that an event accumulation mean rainfall difference of 19 mm is significant enough to be a satisfactory answer to the question. Additionally, rainfall during 5–7 February was sufficient for triggering the isolated landslide near Bunches Bald. The most likely explanation for differences in the post-April rainfall event landslide response near the two basins is related to differences in localized storm structure during passage of the April storm, resulting in diminished cause and trigger phase hourly rain rates in the PRB (
Figure 12). The PRB is located a fair distance north and west of the BRE. As stated previously, orography of the BRE provides additional lift beyond the dynamics of the storm that leads to generally heavier rainfall for basins located closer to it. Additionally, the horizontal expanse of the eastern and western dry tongues diminished northward (
Figure 5b and
Figure 7b) and triggered MCEs near the PRB were of smaller horizontal extent and lifespans. Finally, local orography lining the southern boundary of the PRB has been shown to diminish rainfall accumulation in the PRB for events having a low-level southerly wind [
4]. Wind directions at the 700 hPa level (at the center of the cross sections of
Figure 9) just before and during the time of AR passage in the April event had a significant southerly component (~205°).
