
A Fused Radar–Optical Approach for Mapping Wetlands and Deepwaters of the Mid–Atlantic and Gulf Coast Regions of the United States


Abstract
:
1. Introduction
1.1. Prior United States Wetlands Mapping Efforts
1.2. Satellite-Based Wetlands Mapping Background
1.3. Research Objectives and Rationale for Satellite-Based Wetlands Mapping
2. Materials and Methods
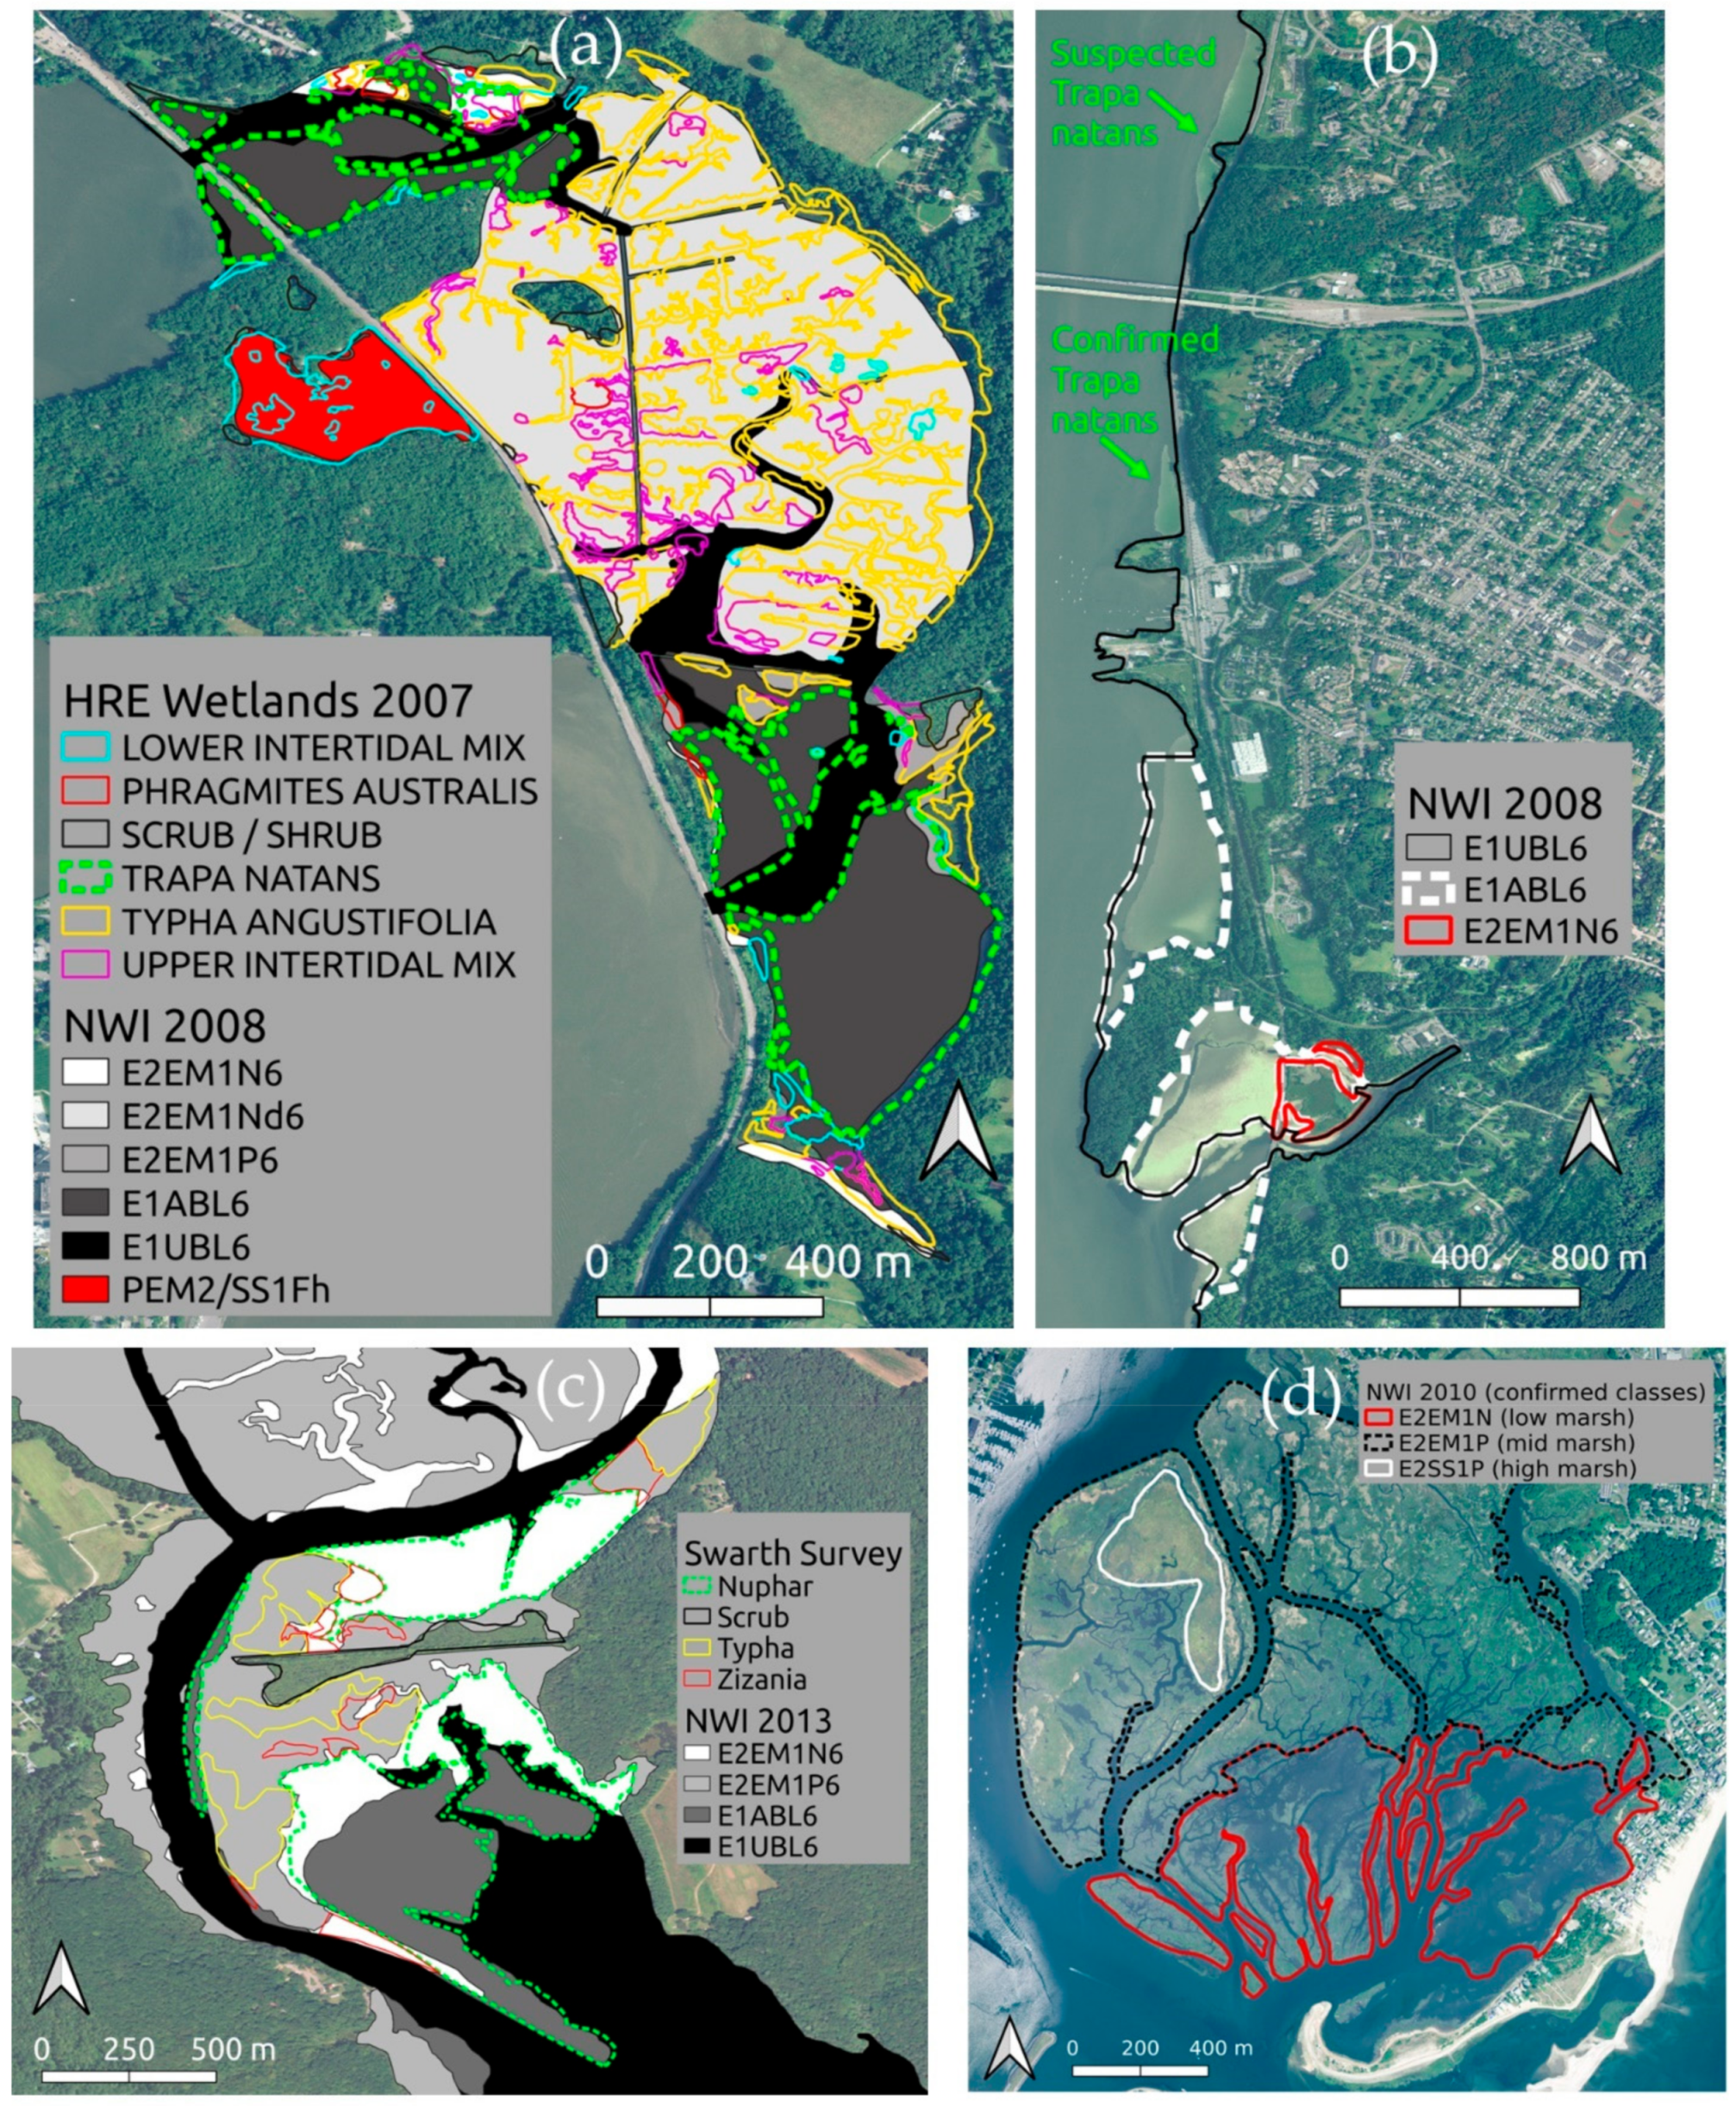
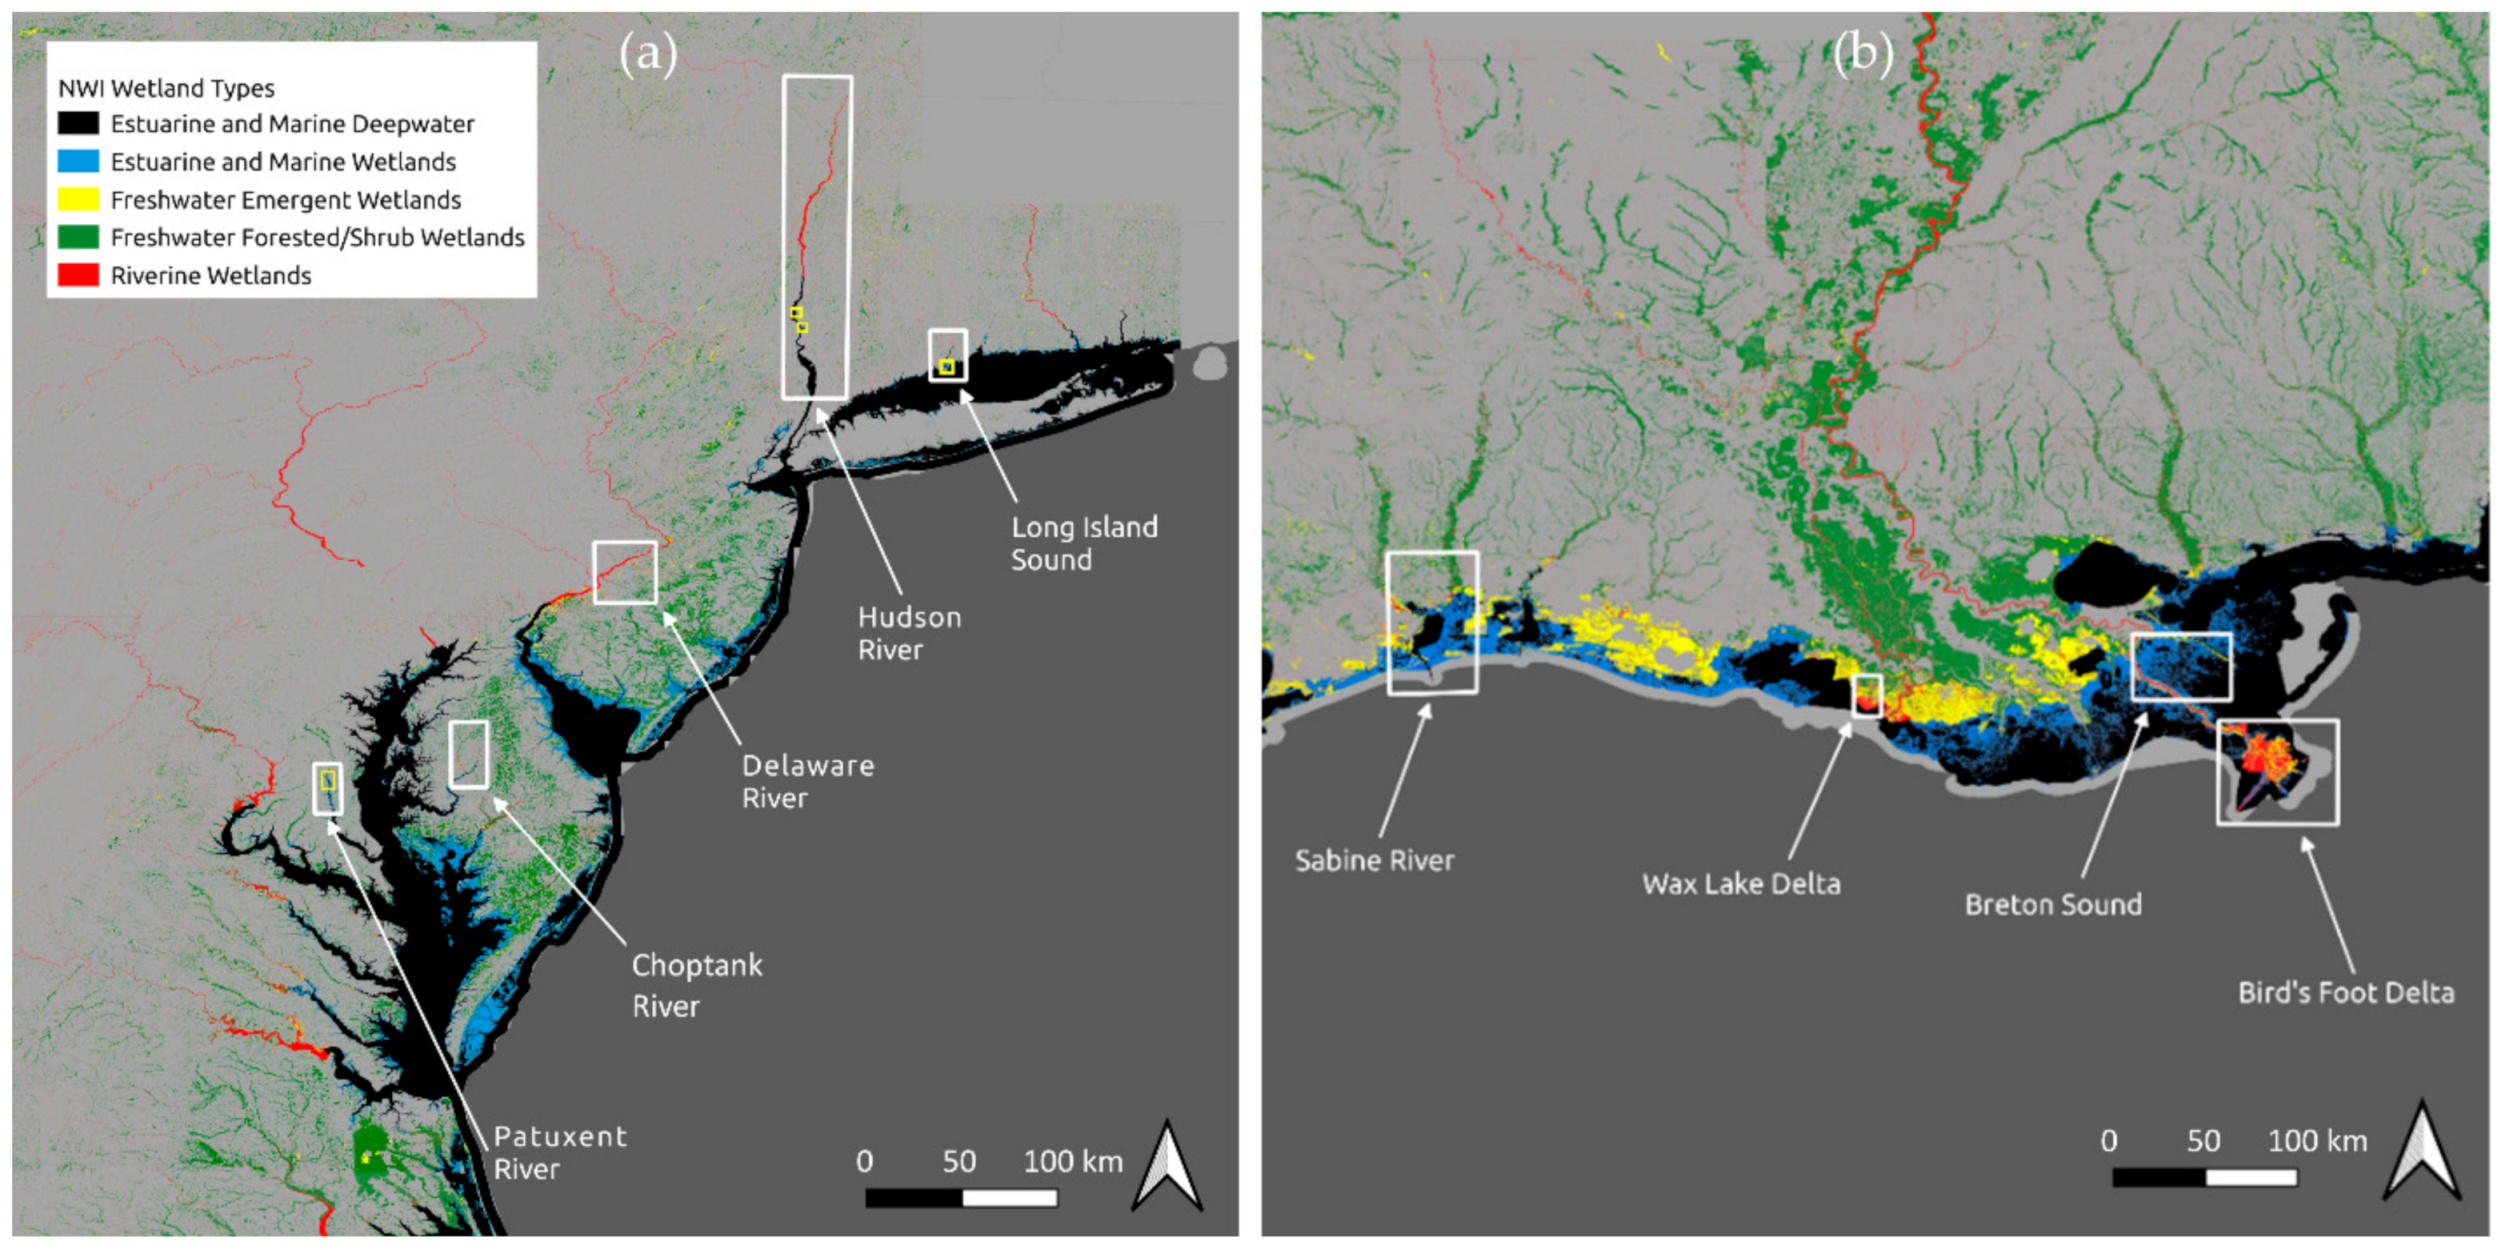
2.1. Study Sites
2.2. Satellite Image Assembly and Selection Rationale
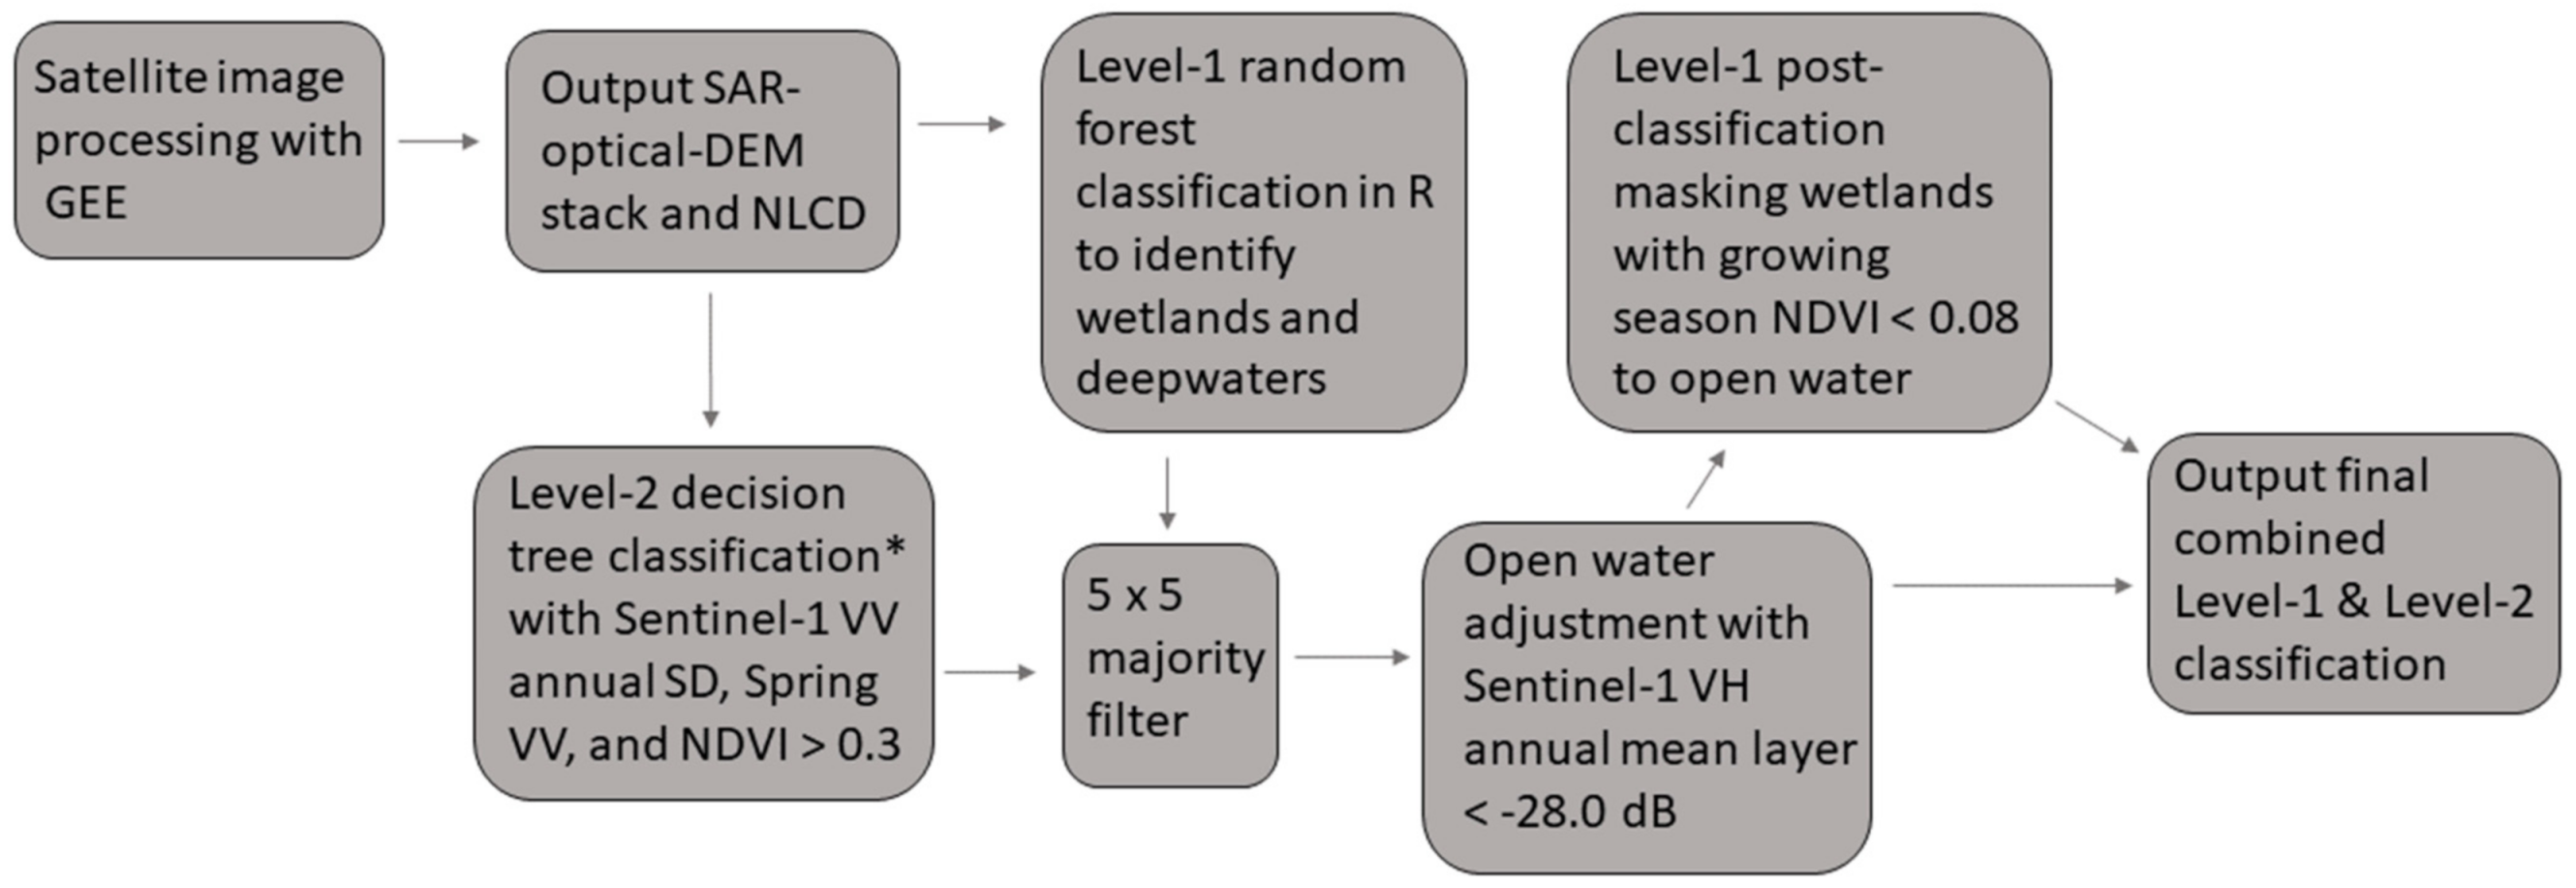
2.3. Level-1 Classification of Wetlands and Deepwaters
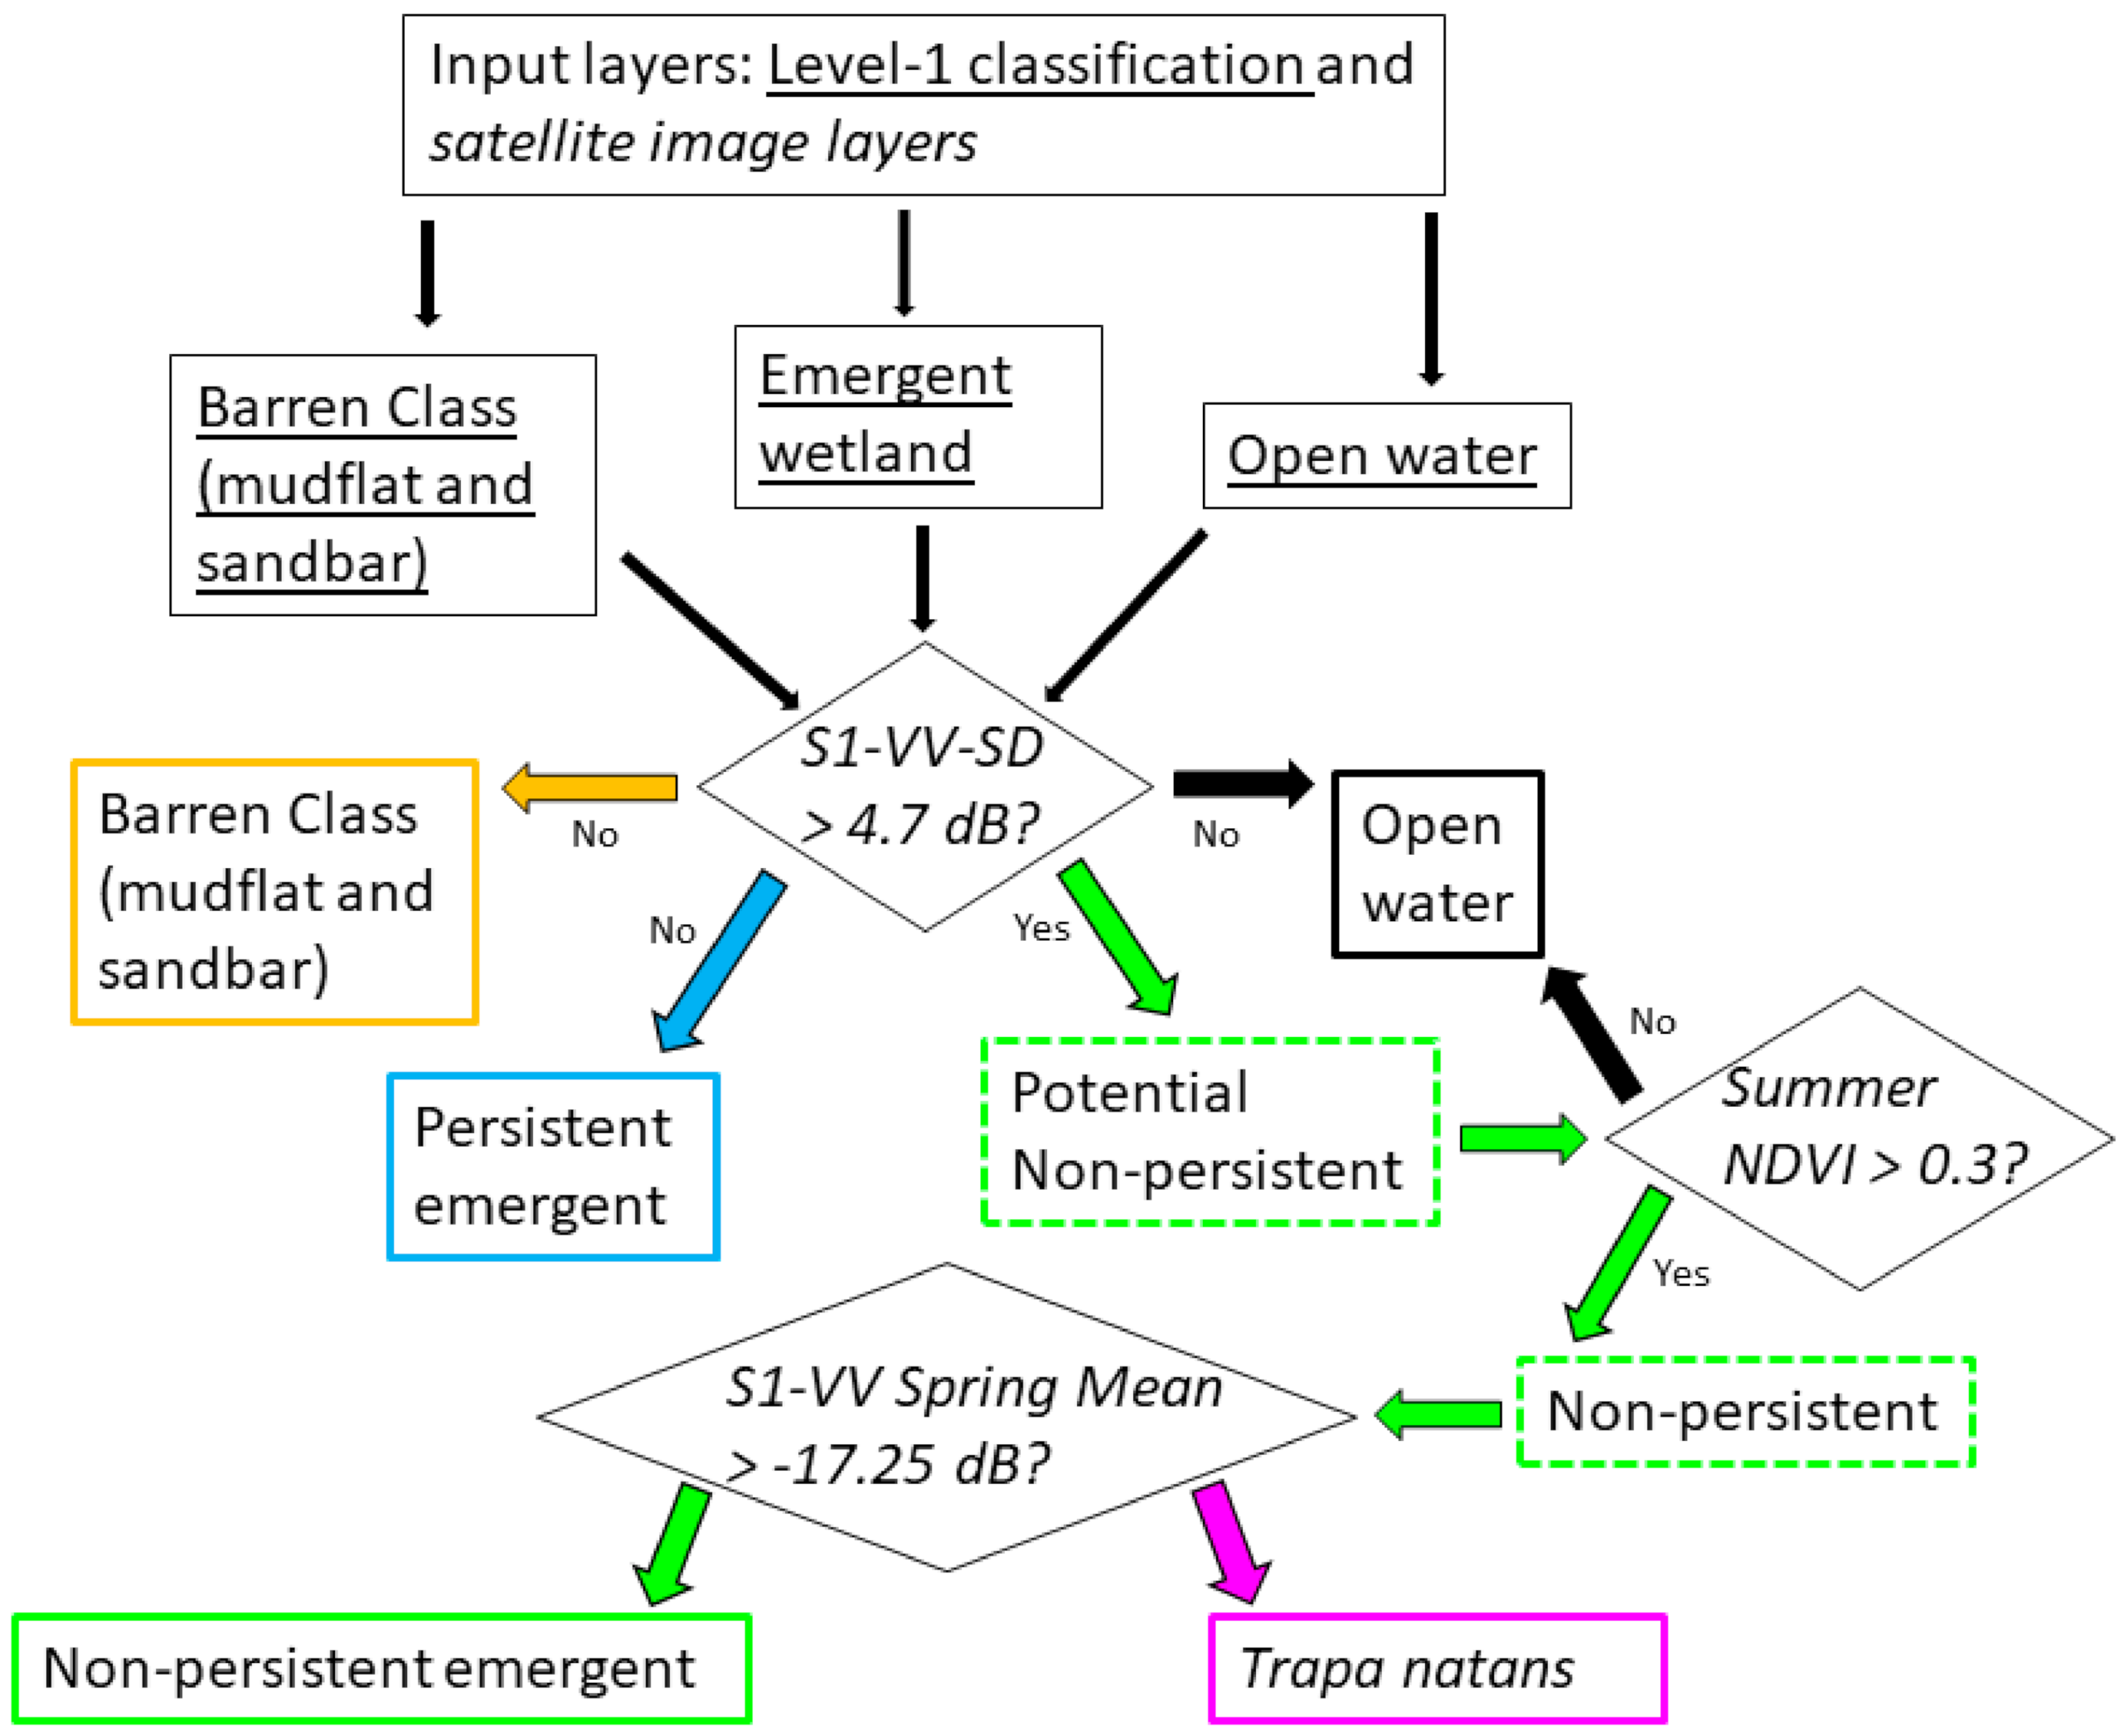
2.4. Level-2 Classification of Wetlands and Deepwater Vegetation
2.5. Study Site-Based Classification Performance Assessment
3. Results
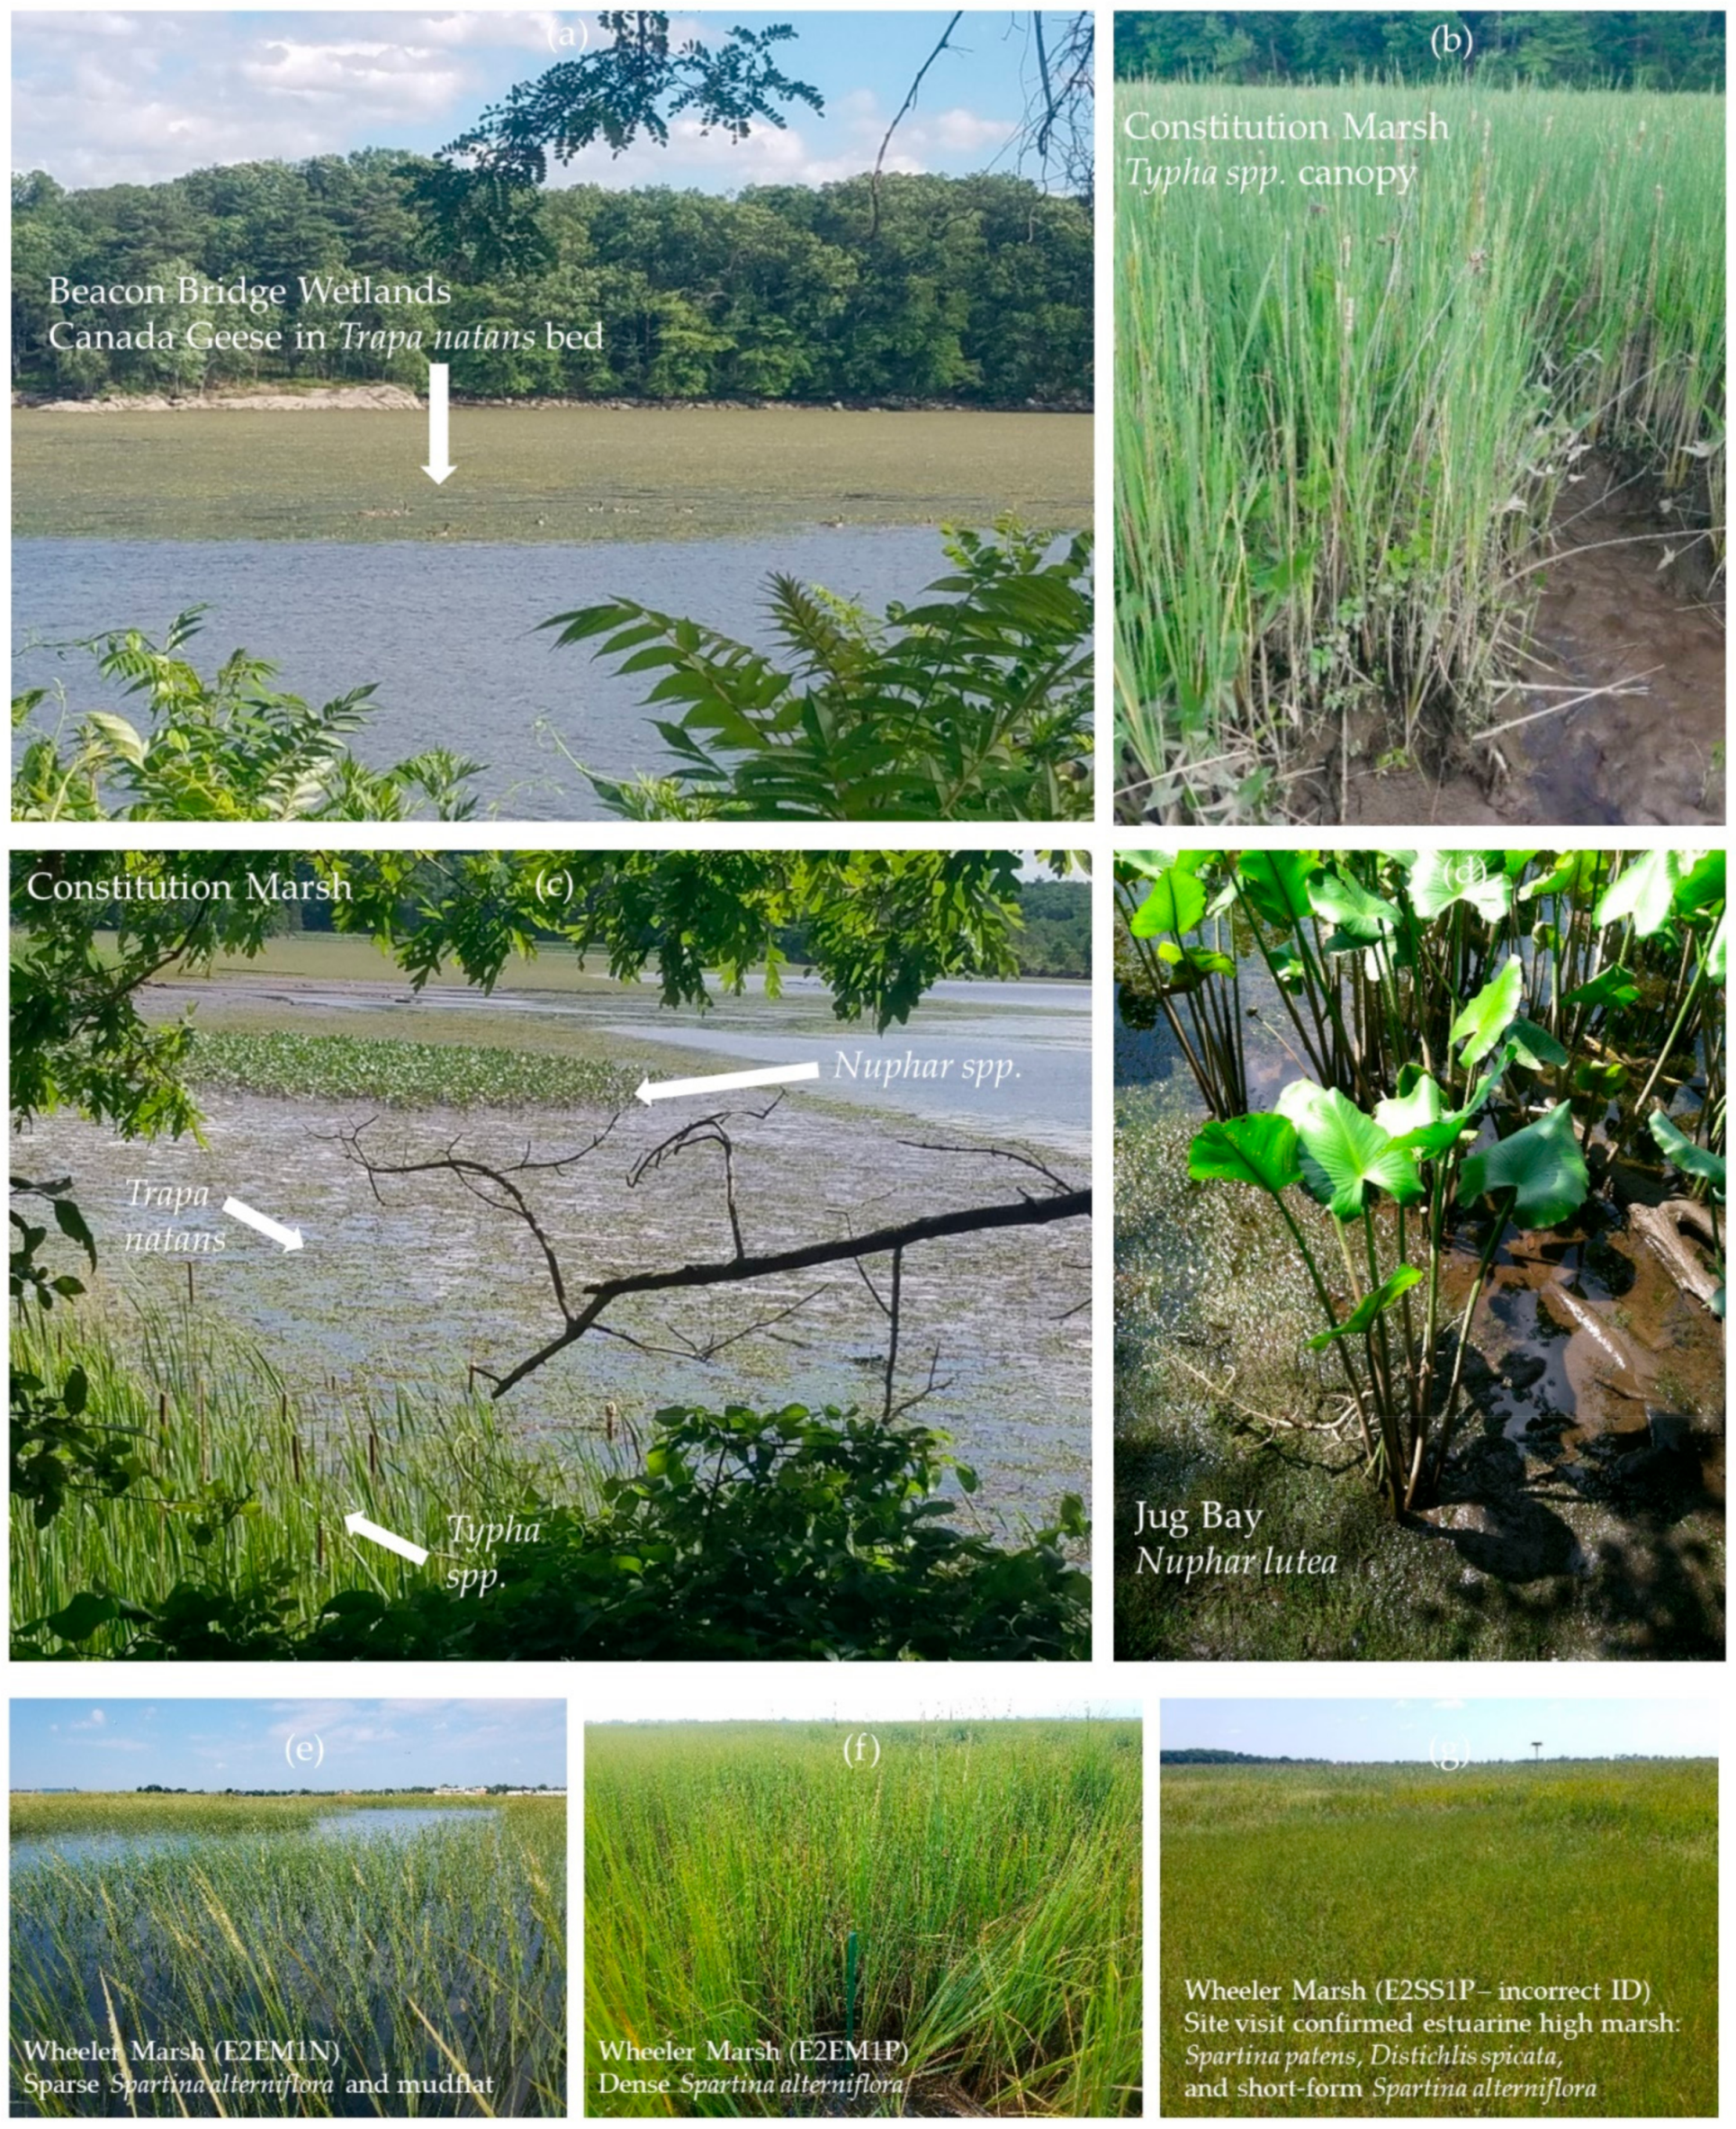
3.1. Study Site Assessments
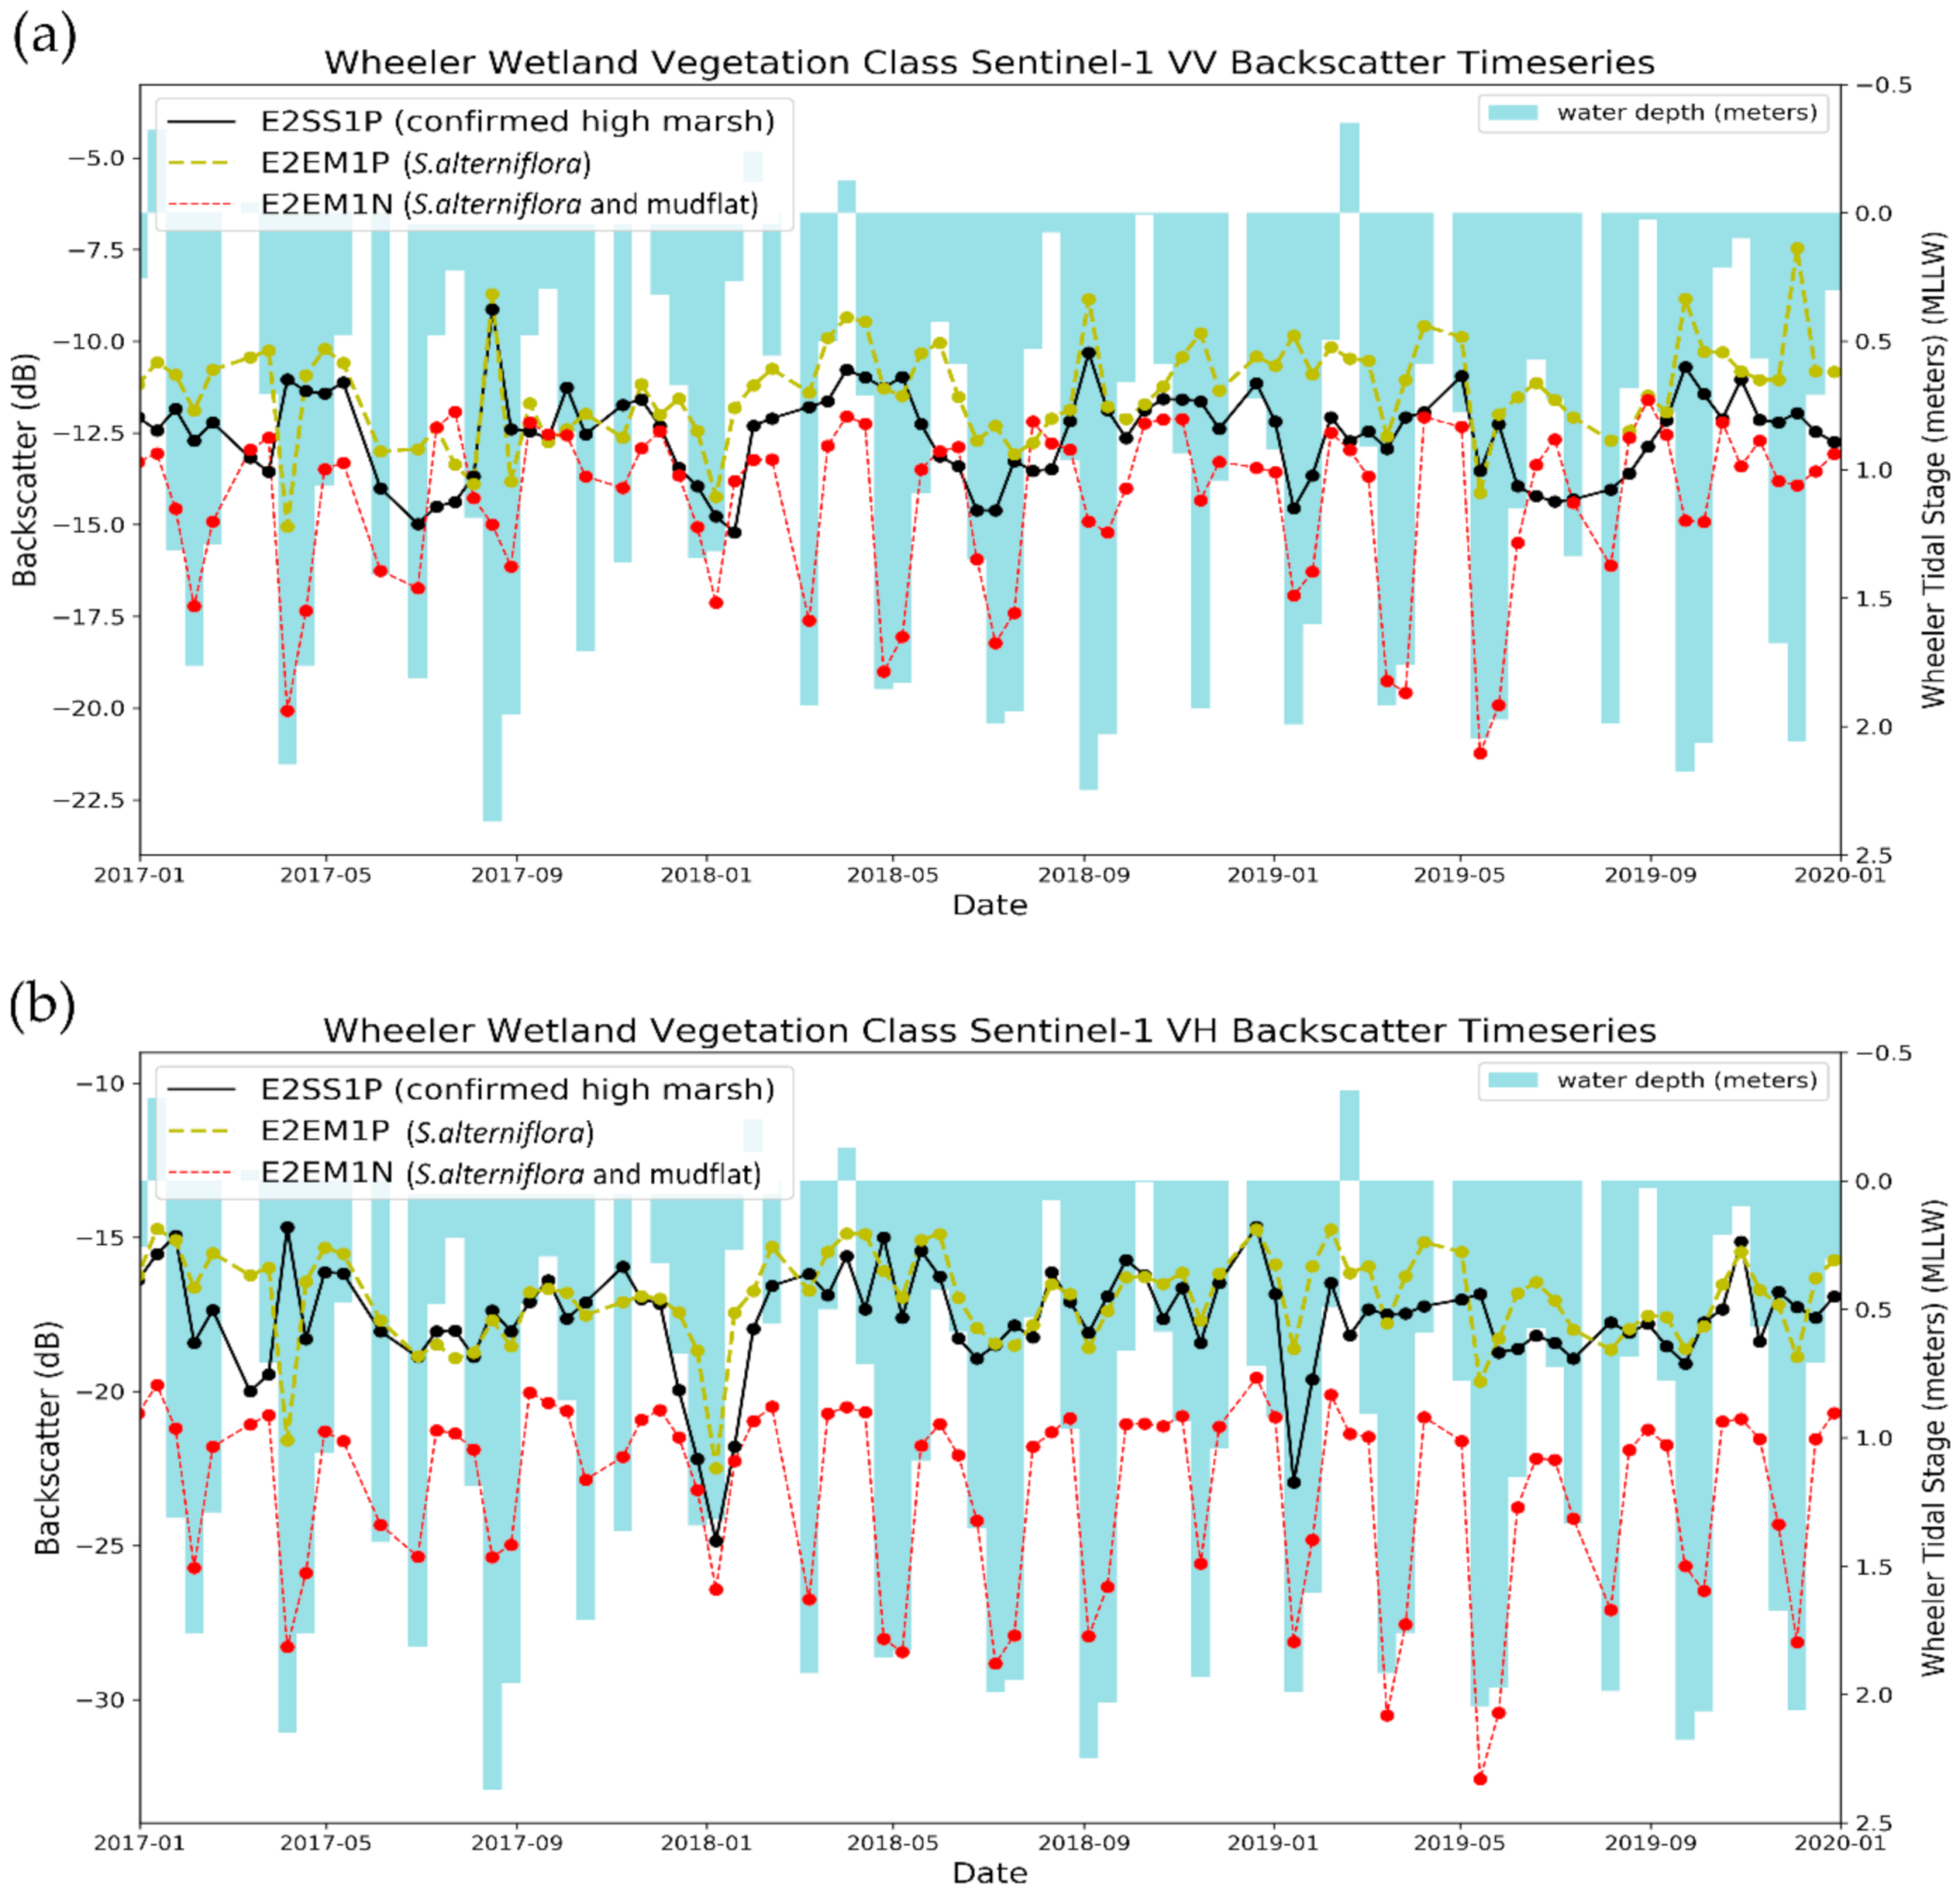
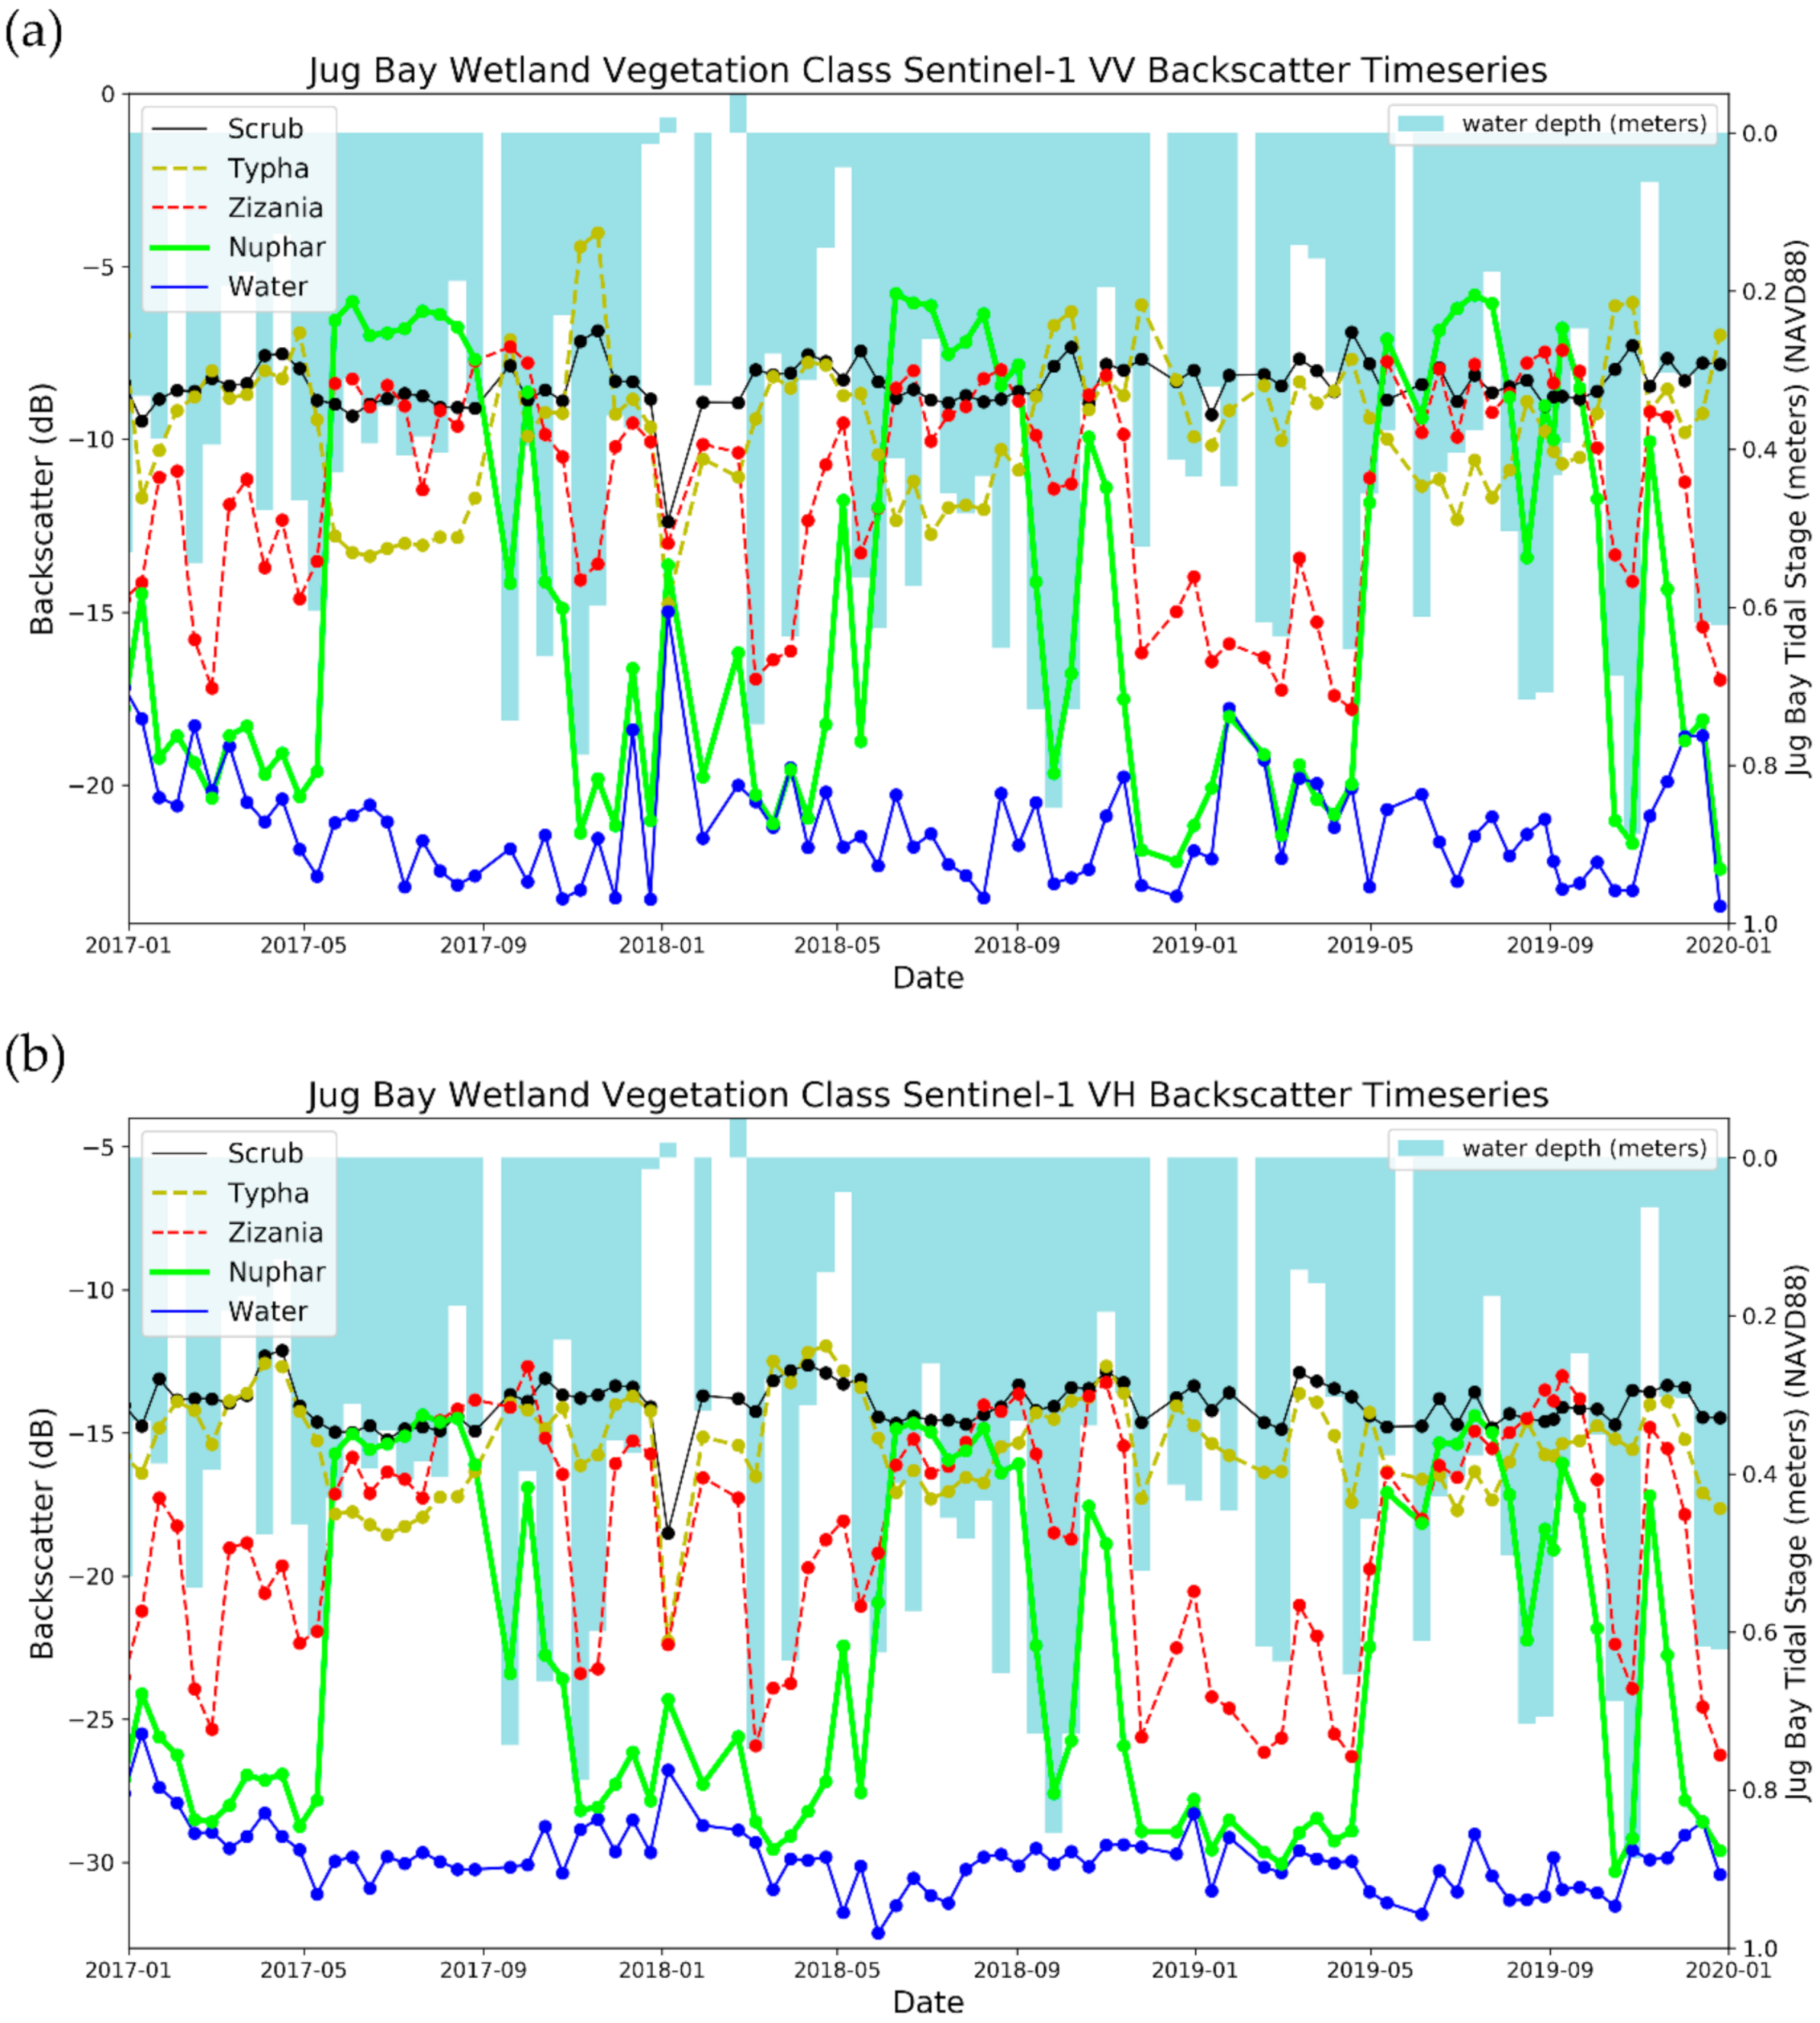
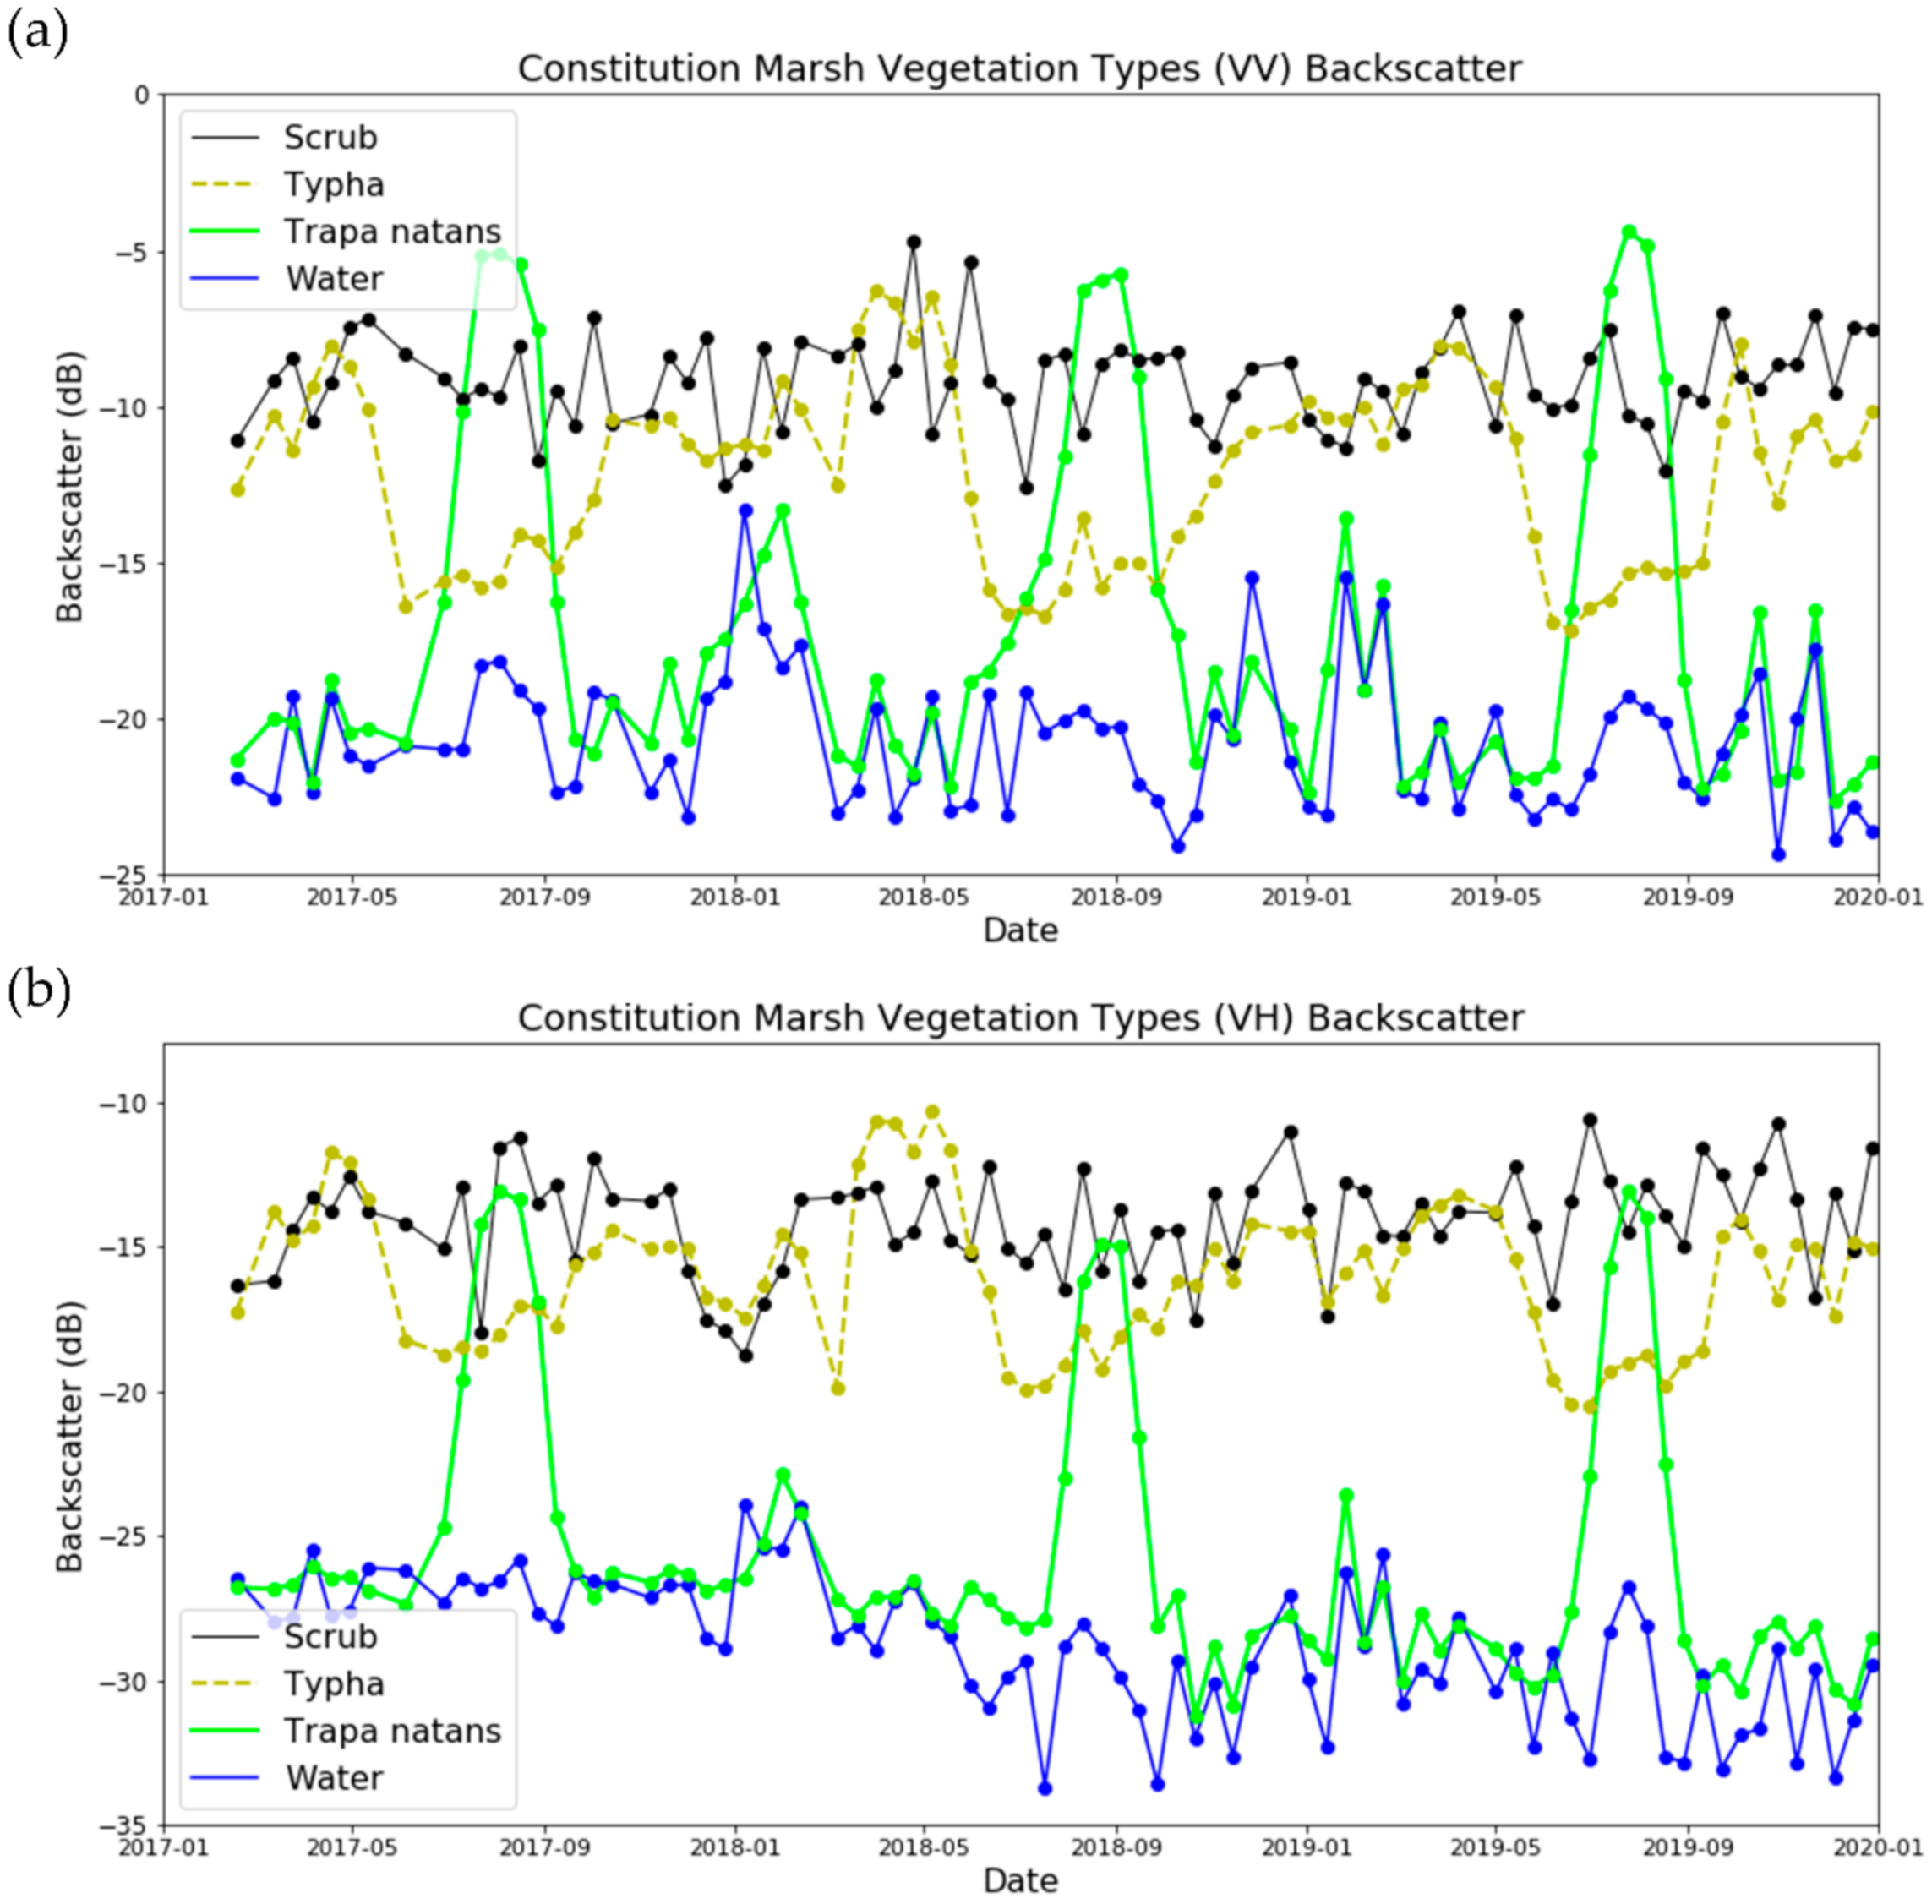
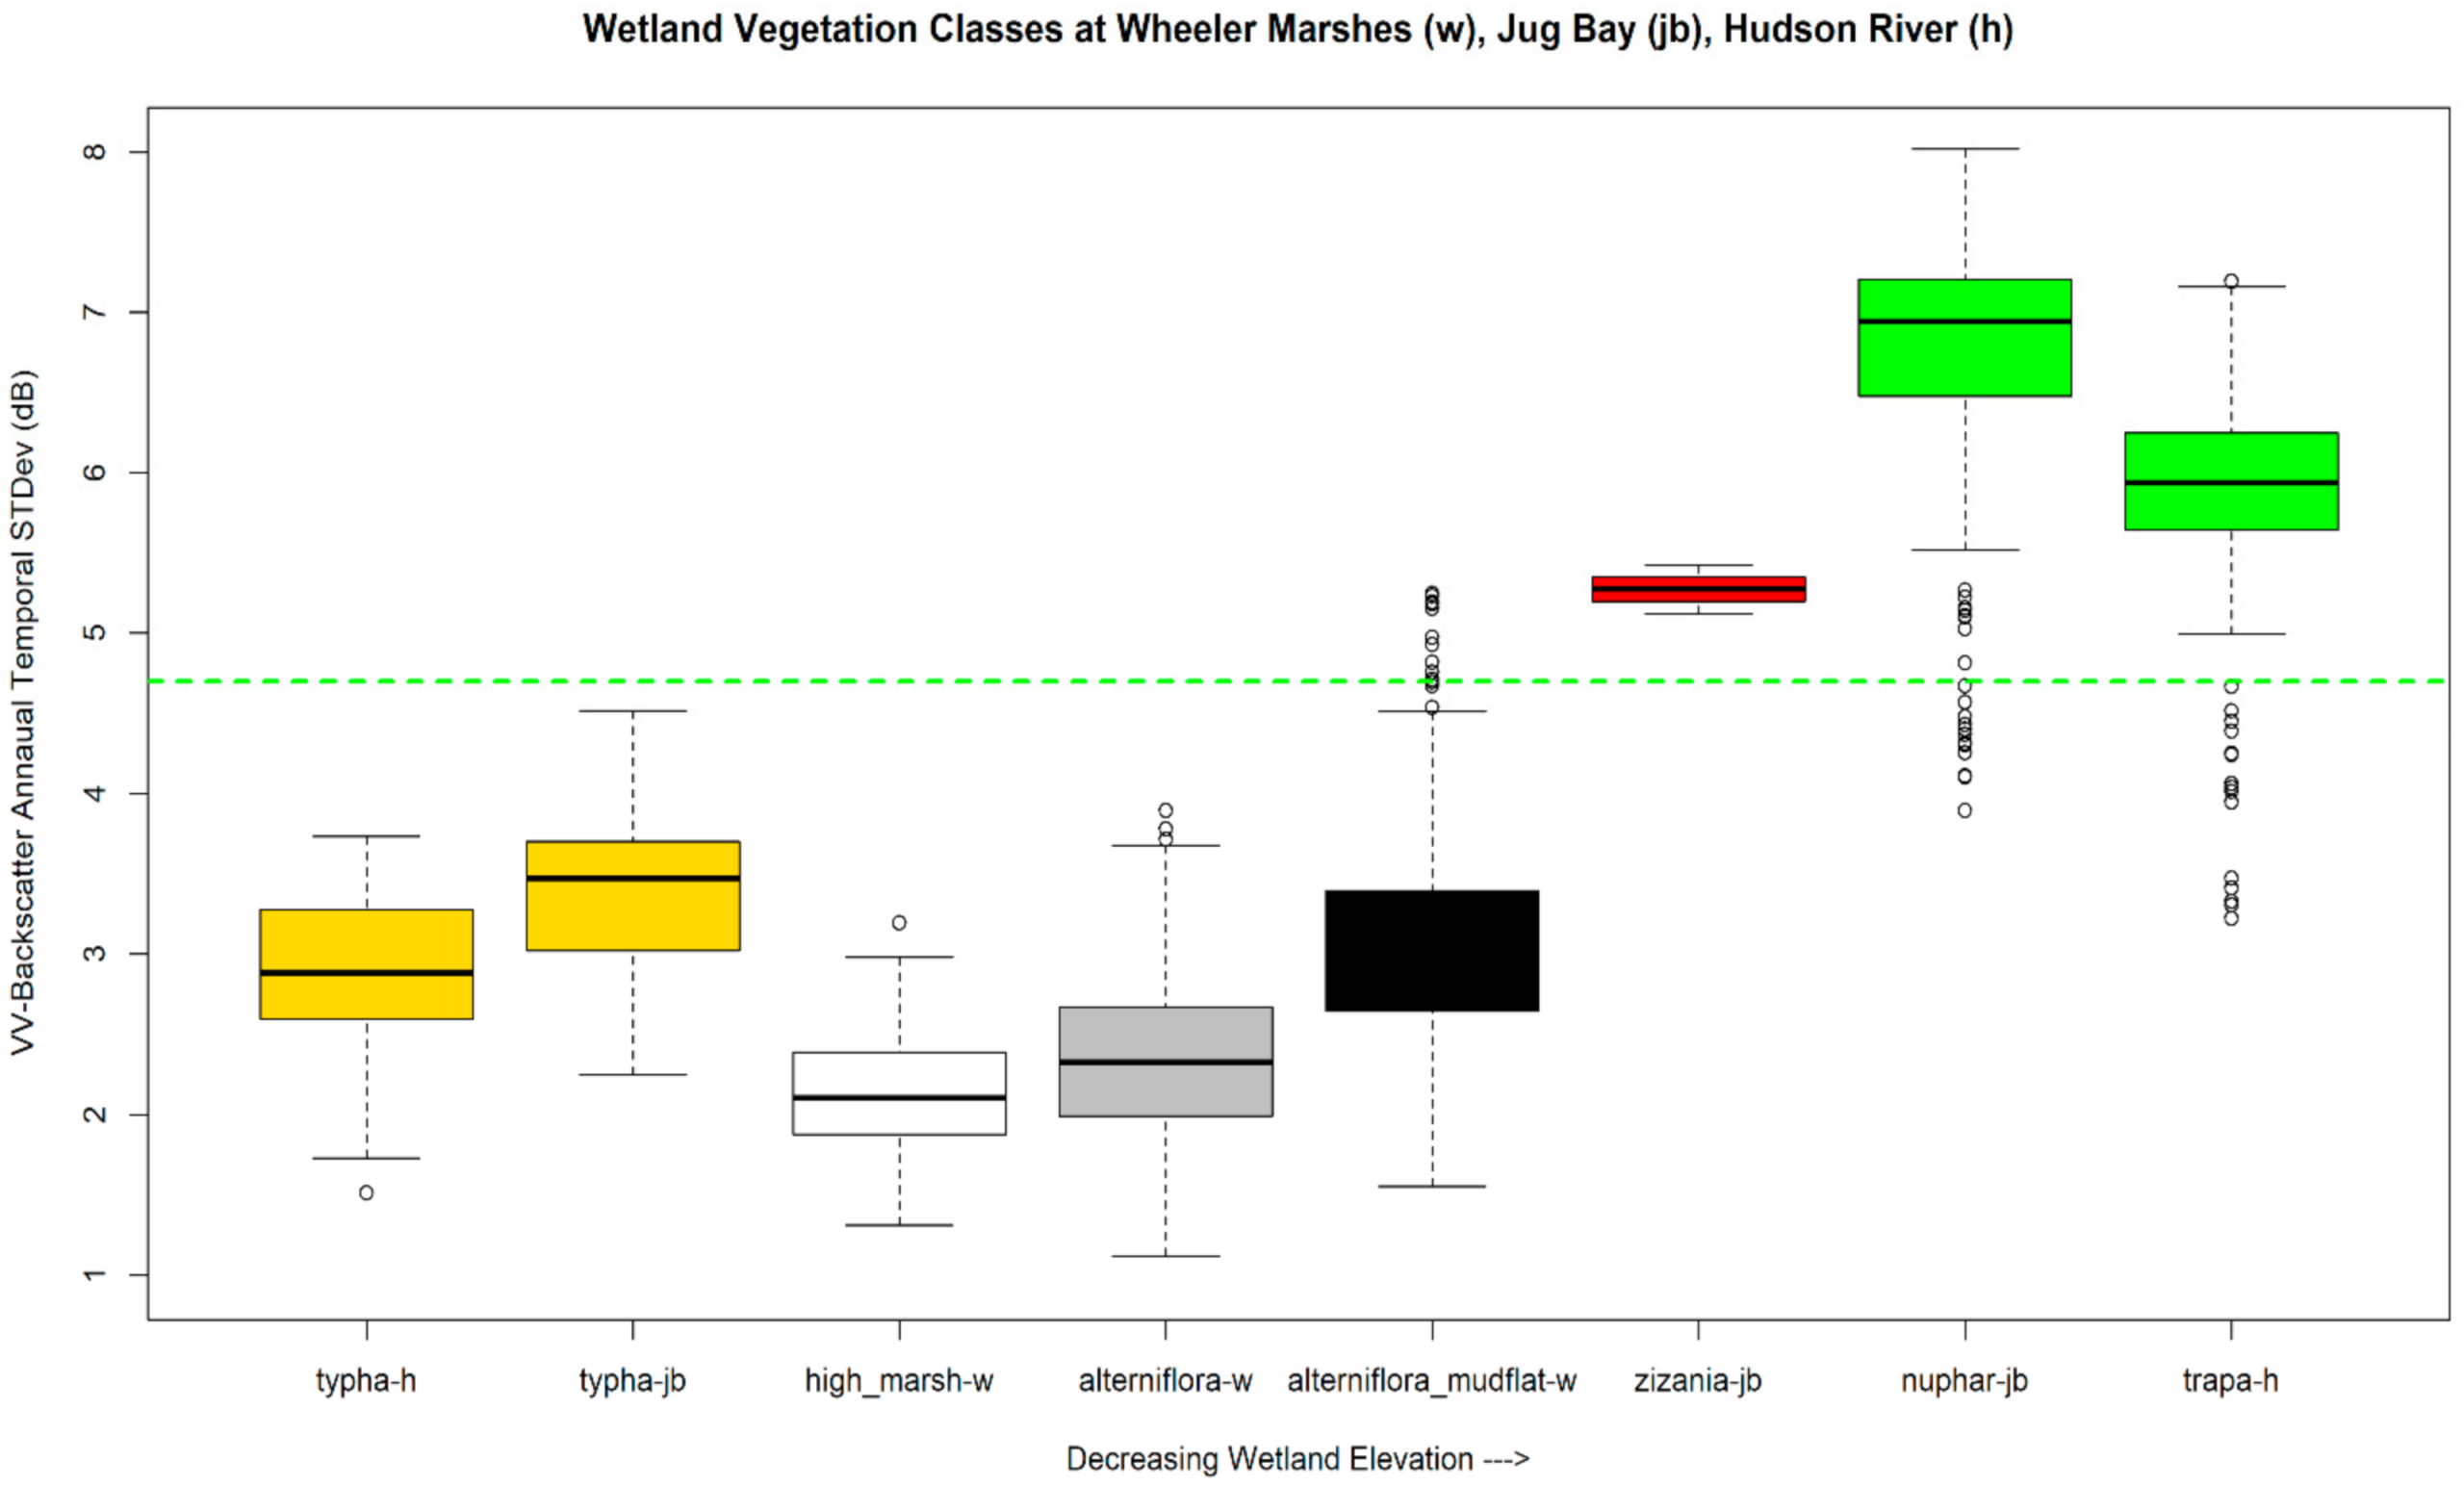
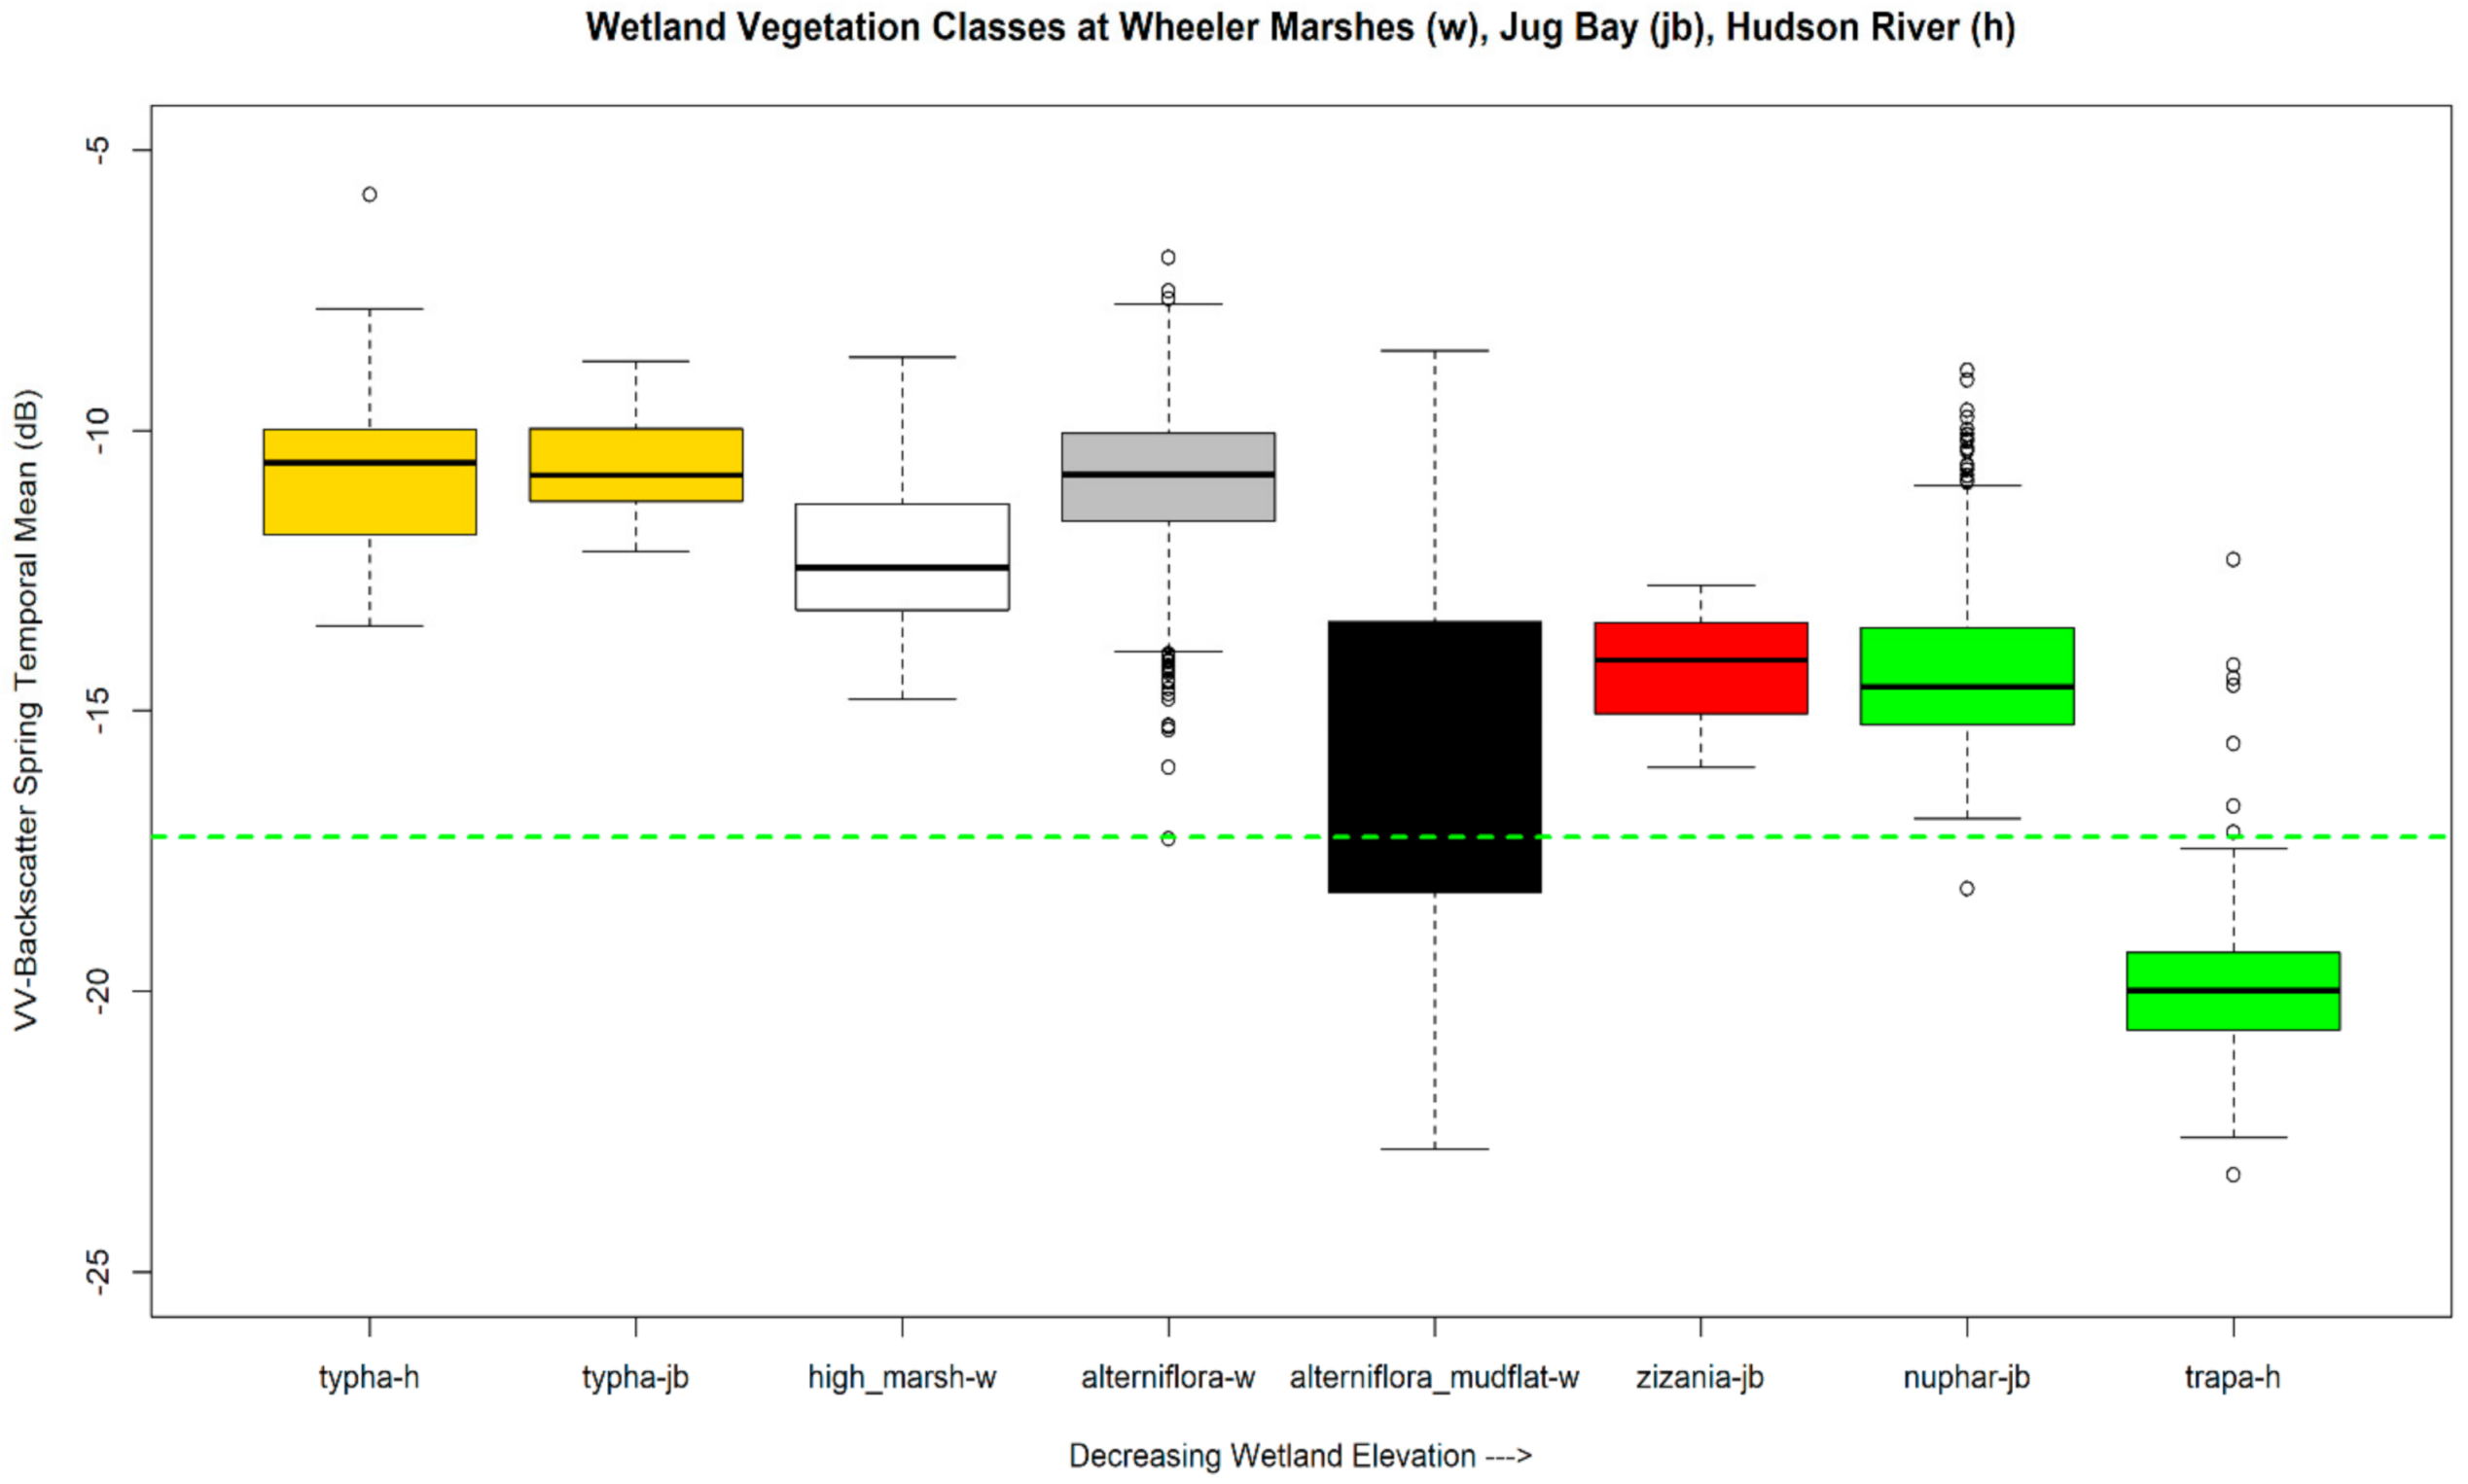
3.2. Assessment of Sentinel-1 Imagery for Level-2 Vegetation Classification
3.3. Level-1 Classification Results and Accuracy Assessment
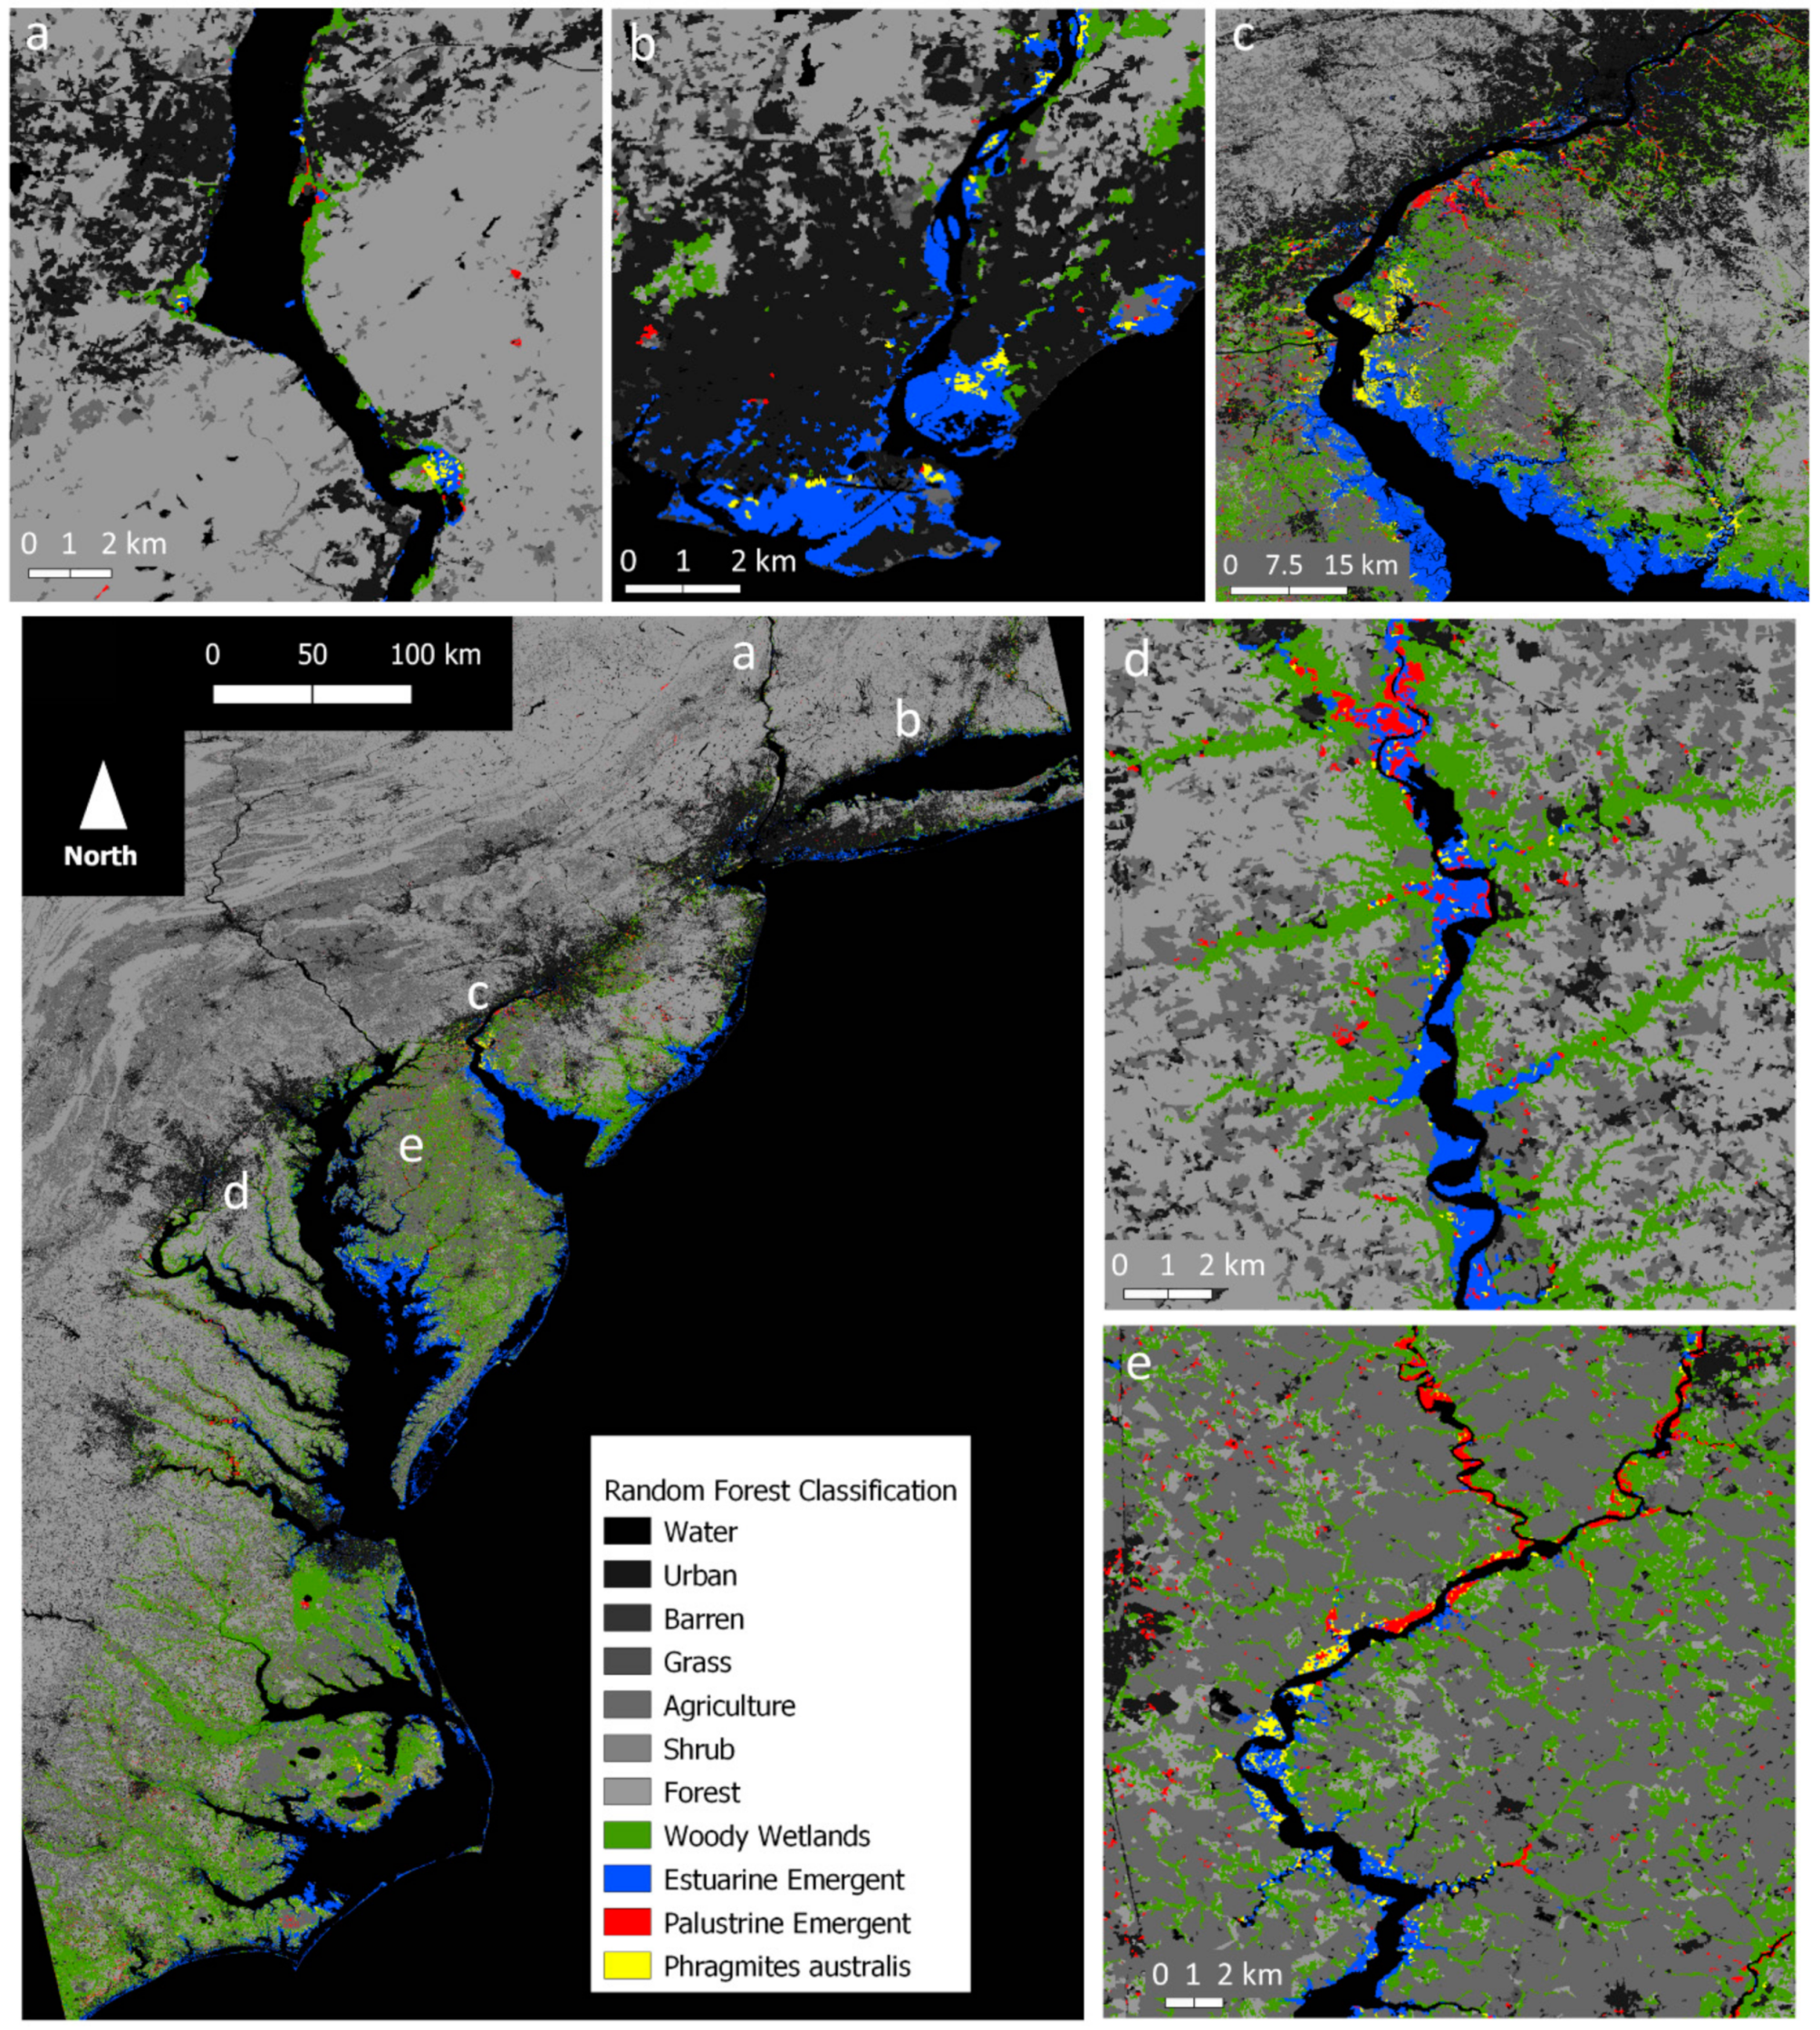
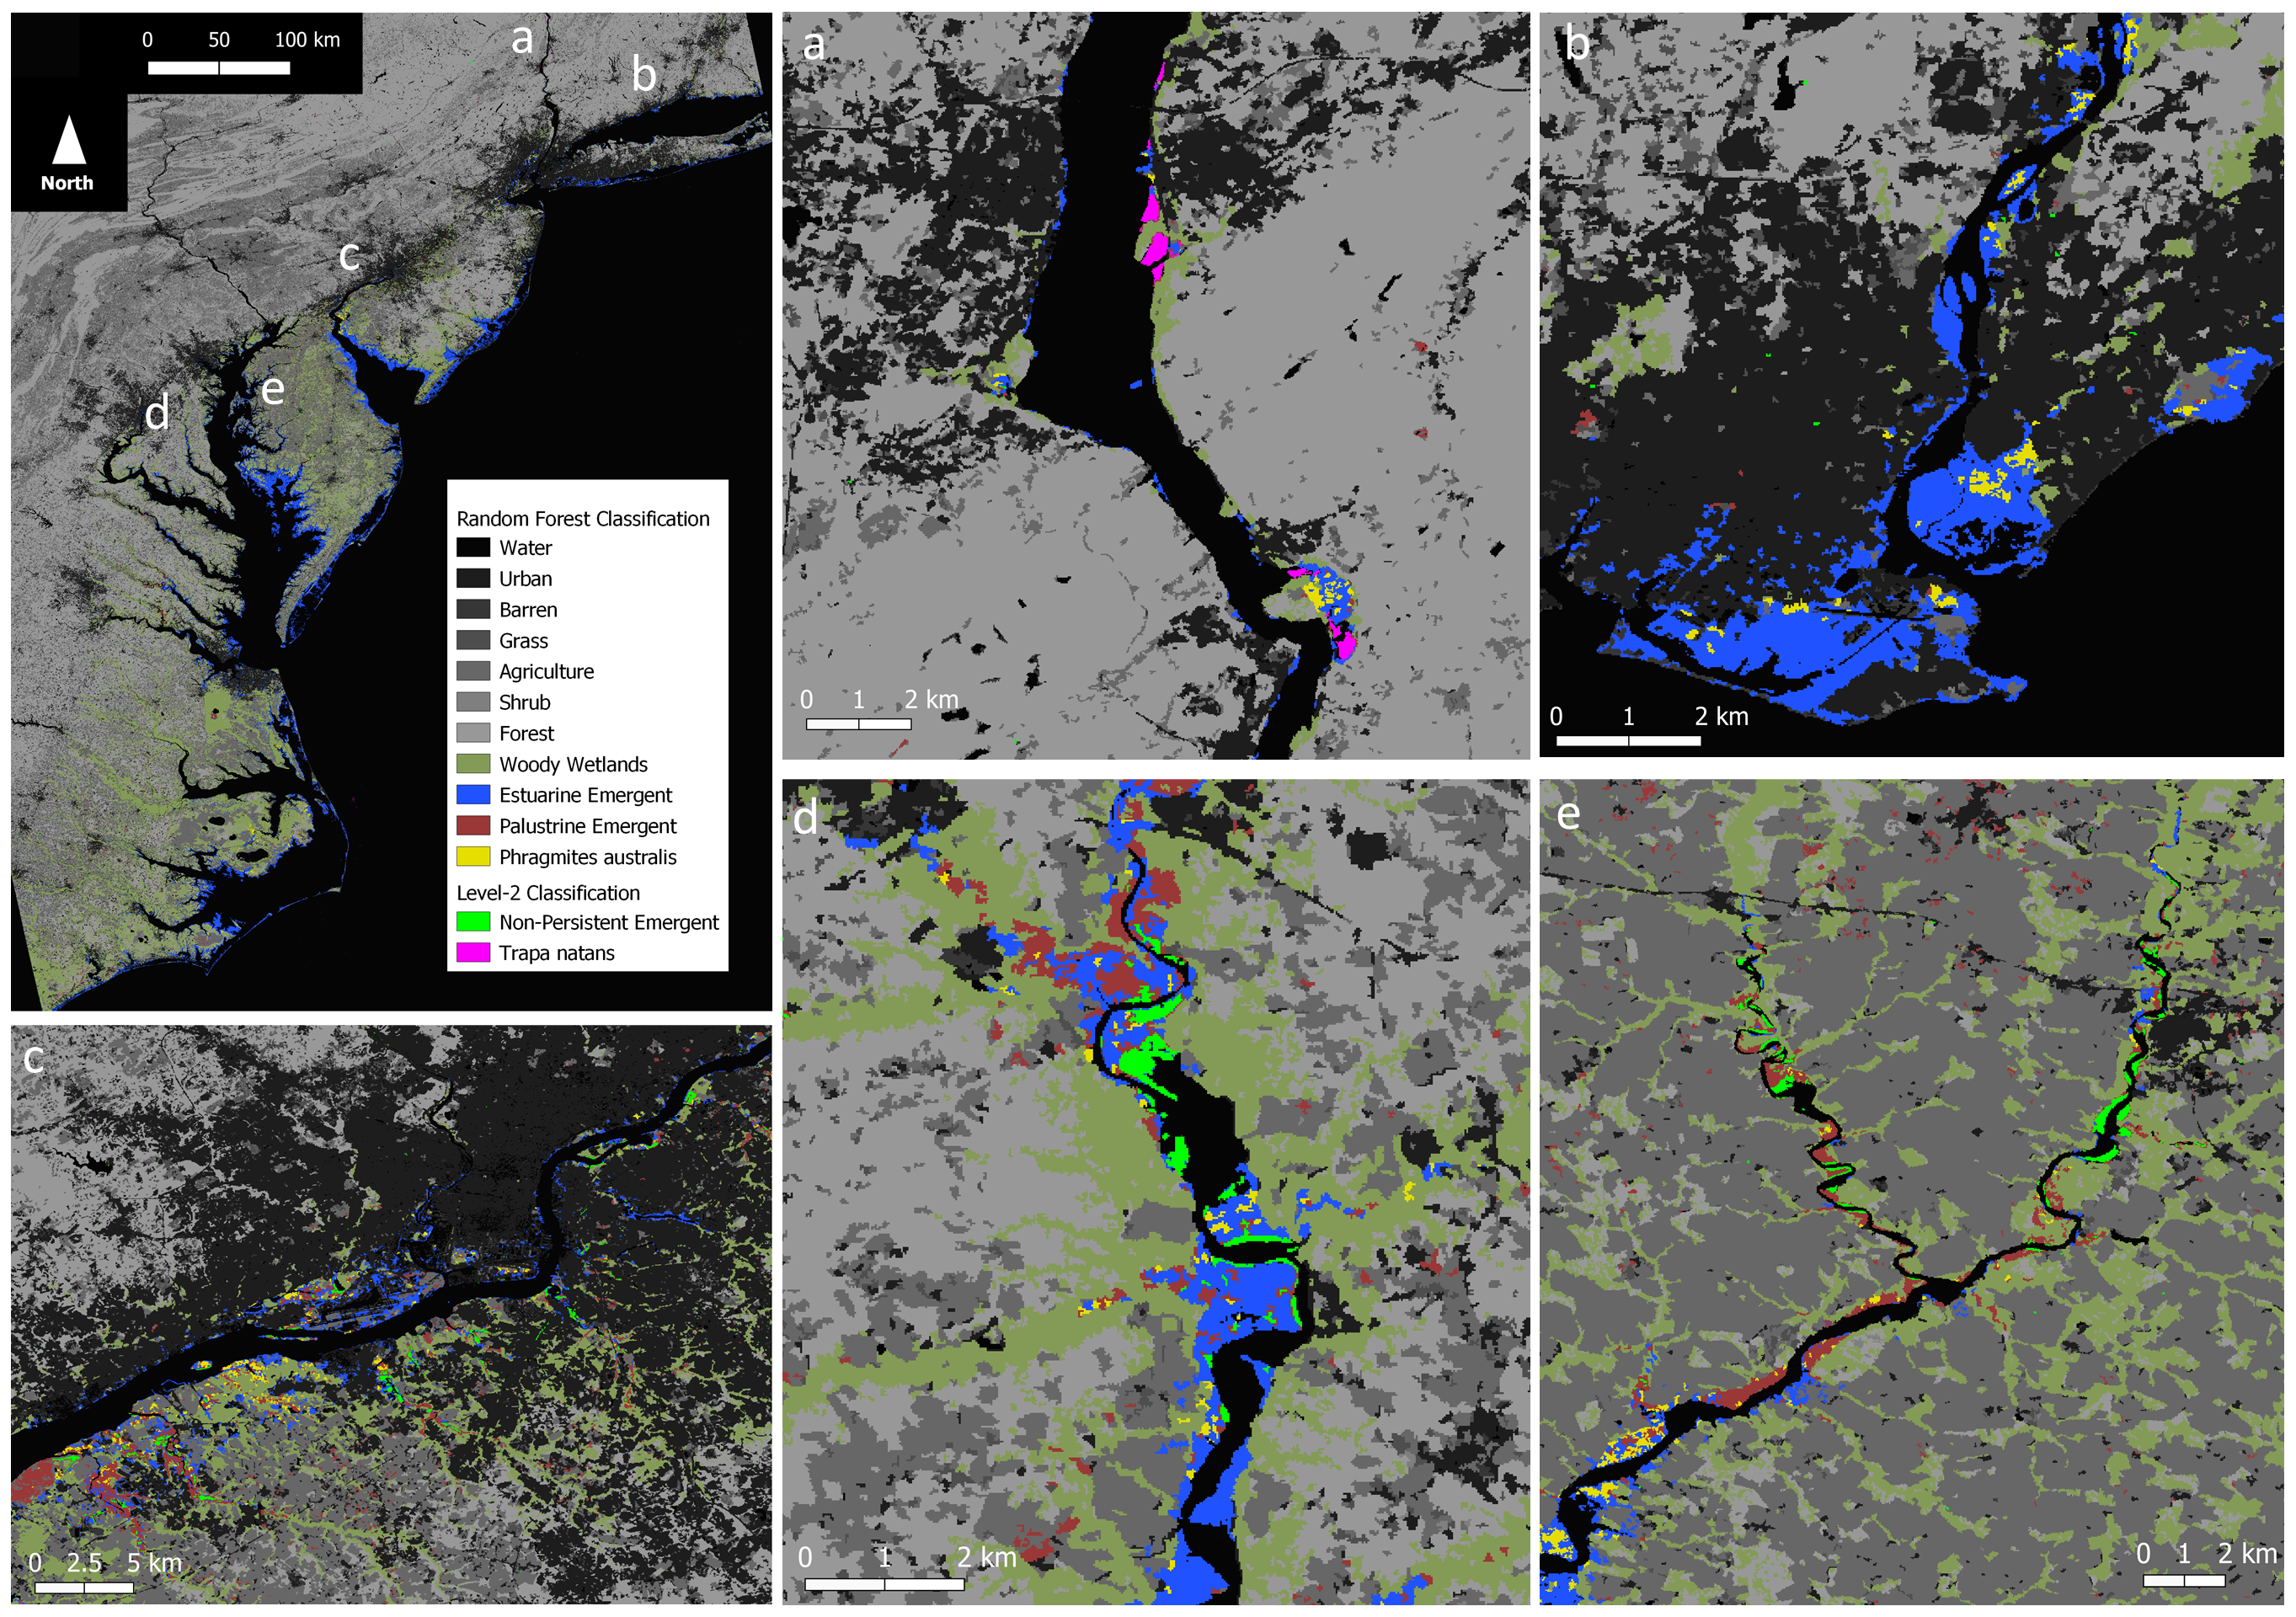
3.4. Level-2 Classification Results
3.5. Level-2 Accuracy Assessment at Study Sites
4. Discussion
5. Conclusions
Author Contributions
Funding
Data Availability Statement
Conflicts of Interest
Additional Support
References
- McLeod, E.; Chmura, G.L.; Bouillon, S.; Salm, R.; Bjork, M.; Duarte, C.M.; Lovelock, C.E.; Schlesinger, W.H.; Silliman, B.R. A blueprint for blue carbon: Toward an improved understanding of the role of vegetated coastal habitats in sequestering CO2. Front. Ecol. Environ. 2011, 9, 552–560. [Google Scholar] [CrossRef] [Green Version]
- Howard, J.; Sutton-Grier, A.; Herr, D.; Kleypas, J.; Landis, E.; Mcleod, E.; Pidgeon, E.; Simpson, S. Clarifying the role of coastal and marine systems in climate mitigation. Front. Ecol. Environ. 2017. [Google Scholar] [CrossRef]
- Hinson, A.L.; Feagin, R.A.; Eriksson, M.; Najjar, R.G.; Herrmann, M.; Bianchi, T.S.; Kemp, M.; Hutchings, J.A.; Crooks, S.; Boutton, T. The spatial distribution of soil organic carbon in tidal wetland soils of the continental United States. Glob. Chang. Biol. 2017, 23, 5468–5480. [Google Scholar] [CrossRef] [PubMed]
- Thomas, N.; Lucas, R.; Bunting, P.; Hardy, A.; Rosenqvist, A.; Simard, M. Distribution and drivers of global mangrove forest change, 1996-2010. PLoS ONE 2017, 12, 1–14. [Google Scholar] [CrossRef] [Green Version]
- Bunting, P.; Rosenqvist, A.; Lucas, R.M.; Rebelo, L.M.; Hilarides, L.; Thomas, N.; Hardy, A.; Itoh, T.; Shimada, M.; Finlayson, C.M. The global mangrove watch—A new 2010 global baseline of mangrove extent. Remote Sens. 2018, 10, 1669. [Google Scholar] [CrossRef] [Green Version]
- Pendleton, L.; Donato, D.C.; Murray, B.C.; Crooks, S.; Jenkins, W.A.; Sifleet, S.; Craft, C.; Fourqurean, J.W.; Kauffman, J.B.; Marb, N. Estimating Global “Blue Carbon” Emissions from Conversion and Degradation of Vegetated Coastal Ecosystems. PLoS ONE 2012, 7, e43542. [Google Scholar] [CrossRef] [Green Version]
- Mcowen, C.; Weatherdon, L.; Bochove, J.-W.; Sullivan, E.; Blyth, S.; Zockler, C.; Stanwell-Smith, D.; Kingston, N.; Martin, C.; Spalding, M.; et al. A global map of saltmarshes. Biodivers. Data J. 2017, 5, e11764. [Google Scholar] [CrossRef]
- Rooth, J.E.; Stevenson, J.C. Sediment deposition patterns in P. australis communities: Implications for coastal areas threatened by rising sea-level. Wetl. Ecol. Manag. 2000, 8, 173–183. [Google Scholar] [CrossRef]
- Leonard, L.A.; Croft, A.L. The effect of standing biomass on flow velocity and turbulence in S. alterniflora canopies. Estuar. Coast. Shelf Sci. 2006, 69, 325–336. [Google Scholar] [CrossRef]
- Feagin, R.A.; Forbrich, I.; Huff, T.P.; Barr, J.G.; Ruiz-Plancarte, J.; Fuentes, J.D.; Najjar, R.G.; Vargas, R.; Vázquez-Lule, A.; Windham-Myers, L.; et al. Tidal Wetland Gross Primary Production Across the Continental United States, 2000–2019. Glob. Biogeochem. Cycles 2020, 34, 1–25. [Google Scholar] [CrossRef]
- Odum, W.E. Comparative ecology of tidal freshwater and salt marshes. Annu. Rev. Ecol. Syst. 1988, 19, 147–176. [Google Scholar] [CrossRef]
- Elmore, A.H. Remote Sensing of Tidal Freshwater Marsh Elevation, Channels, and Vegetation Structure. Masters Thesis, University of Maryland, Supervised by Professor Katharina Engelhardt, College Park, MA, USA, 2008. [Google Scholar]
- Bertness, M.D.; Ewanchuk, P.J.; Silliman, B.R. Anthropogenic modification of New England salt marsh landscapes. Proc. Natl. Acad. Sci. USA 2002, 99, 1395–1398. [Google Scholar] [CrossRef] [Green Version]
- Cowardin, L.M.; Carter, V.; Golet, F.C.; LaRoe, E.T. Classification of Wetlands and Deepwater Habitats of the United States; U.S. Fish and Wildlife Service, Office of Biological Services: Washington, DC, USA, 1979.
- Federal Geographic Data Committee. Classification of Wetlands and Deepwater Habitats of the United States. 2013. Available online: https://www.fws.gov/wetlands/Documents/Classification-of-Wetlands-and-Deepwater-Habitats-of-the-United-States-2013.pdf (accessed on 1 July 2019).
- Kudray, G.M.; Gale, M.R. Evaluation of National Wetland Inventory maps in a heavily forested region in the upper Great Lakes. Wetlands 2000, 20, 581–587. [Google Scholar] [CrossRef]
- Homer, B.C.; Dewitz, J.; Yang, L.; Jin, S.; Danielson, P.; Coulston, J.; Herold, N.; Wickham, J.; Megown, K. Completion of the 2011 National Land Cover Database for the Conterminous United States—Representing a Decade of Land Cover Change Information. Photogramm. Eng. Remote Sens. 2015, 81, 345–354. [Google Scholar]
- Yang, L.; Jin, S.; Danielson, P.; Homer, C.; Gass, L.; Bender, S.M.; Case, A.; Costello, C.; Dewitz, J.; Fry, J.; et al. A new generation of the United States National Land Cover Database: Requirements, research priorities, design, and implementation strategies. ISPRS J. Photogramm. Remote Sens. 2018, 146, 108–123. [Google Scholar] [CrossRef]
- Tiner, R.W. NWI Maps: What They Tell Us. Natl. Wetl. Newsl. 1997, 19, 7–12. [Google Scholar]
- National Oceanic and Atmospheric Administration, Office for Coastal Management. 2016 C-CAP Regional Land Cover Coastal Change Analysis Program (C-CAP) Regional Land Cover. Charleston, SC: NOAA Office for Coastal Management. Available online: www.coast.noaa.gov/htdata/raster1/landcover/bulkdownload/30m_lc/ (accessed on 20 April 2021).
- Campbell, A.; Wang, Y.; Christiano, M.; Stevens, S. Salt Marsh Monitoring in Jamaica Bay, New York from 2003 to 2013: A decade of change from restoration to hurricane sandy. Remote Sens. 2017, 9, 131. [Google Scholar] [CrossRef] [Green Version]
- Howes, N.C.; FitzGerald, D.M.; Hughes, Z.J.; Georgiou, I.Y.; Kulp, M.A.; Miner, M.D.; Smith, J.M.; Barras, J.A. Hurricane-induced failure of low salinity wetlands. Proc. Natl. Acad. Sci. USA 2010, 107, 14014–14019. [Google Scholar] [CrossRef] [Green Version]
- Turner, R.E.; Layne, M.; Mo, Y.; Swenson, E.M. Net land gain or loss for two Mississippi River diversions: Caernarvon and Davis Pond. Restor. Ecol. 2019, 27, 1231–1240. [Google Scholar] [CrossRef] [Green Version]
- Beckett, L.H.; Baldwin, A.H.; Kearney, M.S. Tidal marshes across a Chesapeake Bay subestuary are not keeping up with sea-level rise. PLoS ONE 2016, 11, 1–12. [Google Scholar] [CrossRef]
- Byrd, K.B.; Ballanti, L.; Thomas, N.; Nguyen, D.; Holmquist, J.R.; Simard, M.; Windham-Myers, L. A remote sensing-based model of tidal marsh aboveground carbon stocks for the conterminous United States. ISPRS J. Photogramm. Remote Sens. 2018, 139, 255–271. [Google Scholar]
- Holmquist, J.R.; Windham-Myers, L.; Bernal, B.; Byrd, K.B.; Crooks, S.; Gonneea, M.E.; Herold, N.; Knox, S.H.; Kroeger, K.D.; McCombs, J.; et al. Uncertainty in United States coastal wetland greenhouse gas inventorying. Environ. Res. Lett. 2018, 13, 115005. [Google Scholar] [CrossRef]
- Herbert, E.R.; Schubauer-Berigan, J.; Craft, C.B.; Affairs, E.; Agency, E.P.; Risk, N. Differential effects of chronic and acute simulated seawater intrusion on tidal freshwater marsh carbon cycling. Biogeochemistry 2018, 138, 137–154. [Google Scholar] [CrossRef]
- Ross, P.; Adam, P. Climate Change and Intertidal Wetlands. Biology 2013, 2, 445–480. [Google Scholar] [CrossRef] [Green Version]
- Tobias, C.; Neubauer, S. Chapter 16—Salt Marsh Biogeochemistry—An Overview. Coastal Wetlands 2009, 76, 539–596. [Google Scholar]
- Bartlett, D.S.; Klemas, V. In situ spectral reflectance studies of tidal wetland grasses. Photogramm. Eng. Remote Sens. 1981, 47, 1695–1703. [Google Scholar]
- Kearney, M.S.; Rogers, A.S.; Townshend, J.R.G.; Rizzo, E.; Stutzer, D.; Stevenson, J.C.; Sundborg, K. Landsat imagery shows decline of coastal marshes in Chesapeake and Delaware Bays. Eos. Trans. Am. Geophys. Union 2002, 83, 173. [Google Scholar] [CrossRef]
- Kulawardhana, R.W.; Thenkabail, P.S.; Vithanage, J.; Biradar, C.; Islam, M.A.A.; Gunasinghe, S.; Alankara, R. Evaluation of the wetland mapping methods using Landsat ETM+ and SRTM data. J. Spat. Hydrol. 2007, 7, 62–96. [Google Scholar]
- Ozesmi, S.L.; Bauer, M.E. Satellite remote sensing of wetlands. Wetl. Ecol. Manag. 2002, 10, 381–402. [Google Scholar] [CrossRef]
- Frohn, R.C.; Reif, M.; Lane, C.; Autrey, B. Satellite remote sensing of isolated wetlands using object-oriented classification of Landsat-7 data. Wetlands 2009, 29, 931–941. [Google Scholar] [CrossRef]
- Couvillion, B.R.; Barras, J.A.A.; Steyer, G.D.D.; Sleavin, W.; Fischer, M.; Beck, H.; Trahan, N.; Griffin, B.; Heckman, D.; Catherine, S.; et al. Land Area Change in Coastal Louisiana from 1932 to 2010. U.S. Geol. Surv. Sci. Investig. 2011, 3164, 12. [Google Scholar]
- Gilmore, M.S.; Wilson, E.H.; Barrett, N.; Civco, D.L.; Prisloe, S.; Hurd, J.D.; Chadwick, C. Integrating multi-temporal spectral and structural information to map wetland vegetation in a lower Connecticut River tidal marsh. Remote Sens. Environ. 2008, 112, 4048–4060. [Google Scholar] [CrossRef]
- Hurd, J.D.; Civco, D.L.; Gilmore, M.S.; Prisloe, S.; Wilson, E.H. Coastal marsh characterization using satellite remote sensing and in situ radiometry data: Preliminary results. In Proceedings of the American Society of Photogrammetry and Remote Sensing 2005 Annual Conference, Baltimore, MD, USA, 7–11 March 2005. [Google Scholar]
- Klemas, V. Using Remote Sensing to Select and Monitor Wetland Restoration Sites: An Overview. J. Coast. Res. 2013, 289, 958–970. [Google Scholar] [CrossRef]
- Langley, J.A.; Megonigal, J.P. Field-based radiometry to estimate tidal marsh plant growth in response to elevated CO2 and nitrogen addition. Wetlands 2012, 32, 571–578. [Google Scholar] [CrossRef]
- Lopes, C.L.; Mendes, R.; Caçador, I.; Dias, J.M. Assessing salt marsh extent and condition changes with 35 years of Landsat imagery: Tagus Estuary case study. Remote Sens. Environ. 2020, 247, 111939. [Google Scholar] [CrossRef]
- Van Beijma, S.; Comber, A.; Lamb, A. Random forest classification of salt marsh vegetation habitats using quad-polarimetric airborne SAR, elevation, and optical RS data. Remote Sens. Environ. 2014, 149, 118–129. [Google Scholar] [CrossRef]
- Lamb, B.T.; Tzortziou, M.A.; McDonald, K.C. Evaluation of Approaches for Mapping Tidal Wetlands of the Chesapeake and Delaware Bays. Remote Sens. 2019, 11, 2366. [Google Scholar] [CrossRef] [Green Version]
- Mahdianpari, M.; Salehi, B.; Mohammadimanesh, F.; Homayouni, S.; Gill, E. The first wetland inventory map of newfoundland at a spatial resolution of 10 m using sentinel-1 and sentinel-2 data on the Google Earth Engine cloud computing platform. Remote Sens. 2019, 11, 43. [Google Scholar] [CrossRef] [Green Version]
- Villa, P.; Bresciani, M.; Bolpagni, R.; Pinardi, M.; Giardino, C. A rule-based approach for mapping macrophyte communities using multi-temporal aquatic vegetation indices. Remote Sens. Environ. 2015, 171, 218–233. [Google Scholar] [CrossRef] [Green Version]
- Villa, P.; Pinardi, M.; Toth, V.R.; Hunter, P.D.; Bolpagni, R.; Bresciani, M. Remote sensing of macrophyte traits: Implications for the management of shallow lakes. J. Limnol. 2017, 76, 1629. [Google Scholar] [CrossRef] [Green Version]
- Jones, J.W. Improved automated detection of subpixel-scale inundation-revised Dynamic Surface Water Extent (DSWE) partial surface water tests. Remote Sens. 2019, 11, 374. [Google Scholar] [CrossRef] [Green Version]
- O’Connell, J.L.; Mishra, D.R.; Cotten, D.L.; Wang, L.; Alber, M. The Tidal Marsh Inundation Index (TMII): An inundation filter to flag flooded pixels and improve MODIS tidal marsh vegetation time-series analysis. Remote Sens. Environ. 2017, 201, 34–46. [Google Scholar] [CrossRef]
- Atwood, D.; Battaglia, M.; Bourgeau-Chavez, L.; Ahern, F.; Murnaghan, K.; Brisco, B. Exploring Polarimetric Phase of Microwave Backscatter from Typha Wetlands. Can. J. Remote Sens. 2020, 46, 49–66. [Google Scholar] [CrossRef]
- Brisco, B.; Kapfer, M.; Hirose, T.; Tedford, B.; Liu, J. Evaluation of C-band polarization diversity and polarimetry for wetland mapping. Can. J. Remote Sens. 2011, 37, 82–92. [Google Scholar] [CrossRef]
- Brisco, B.; Ahern, F.; Murnaghan, K.; White, L.; Canisus, F.; Lancaster, P. Seasonal change in wetland coherence as an aid to wetland monitoring. Remote Sens. 2017, 9, 158. [Google Scholar] [CrossRef] [Green Version]
- Kasischke, E.S.; Bourgeau-Chavez, L.L. Monitoring south Florida wetlands using ERS-1 SAR imagery. Photogramm. Eng. Remote Sens. 1997, 63, 281–291. [Google Scholar]
- Lang, M.W.; Kasischke, E.S. Using C-band synthetic aperture radar data to monitor forested wetland hydrology in Maryland’s coastal plain, USA. IEEE Trans. Geosci. Remote Sens. 2008, 46, 535–546. [Google Scholar] [CrossRef]
- Schmitt, A.; Brisco, B. Wetland Monitoring Using the Curvelet-Based Change Detection Method on Polarimetric SAR Imagery. Water 2013, 5, 1036–1051. [Google Scholar] [CrossRef]
- Moser, L.; Schmitt, A.; Wendleder, A.; Roth, A. Monitoring of the Lac Bam wetland extent using dual-polarized X-band SAR data. Remote Sens. Environ. 2016, 8, 302. [Google Scholar] [CrossRef] [Green Version]
- Jensen, K.; McDonald, K.; Podest, E.; Rodriguez-Alvarez, N.; Horna, V.; Steiner, N. Assessing L-Band GNSS-reflectometry and imaging radar for detecting sub-canopy inundation dynamics in a tropical wetlands complex. Remote Sens. 2018, 10, 1431. [Google Scholar] [CrossRef] [Green Version]
- Rosenqvist, J.; Rosenqvist, A.; Jensen, K.; McDonald, K. Mapping of maximum and minimum inundation extents in the amazon basin 2014-2017 with ALOS-2 PALSAR-2 scan SAR time-series data. Remote Sens. 2020, 12, 1326. [Google Scholar] [CrossRef] [Green Version]
- Ramsey, E.; Werle, D.; Suzuoki, Y.; Rangoonwala, A.; Lu, Z. Limitations and Potential of Satellite Imagery to Monitor Environmental Response to Coastal Flooding. J. Coast. Res. 2012, 280, 457–476. [Google Scholar] [CrossRef]
- Kim, J.-W.; Lu, Z.; Jones, J.W.; Shum, C.K.; Lee, H.; Jia, Y. Monitoring Everglades freshwater marsh water level using L-band synthetic aperture radar backscatter. Remote Sens. Environ. 2014, 150, 66–81. [Google Scholar] [CrossRef]
- Novo, E.M.L.M.; Costa, M.P.F.; Mantovani, J.E.; Lima, I.B.T. Relationship between macrophyte stand variables and radar backscatter at L and C band, Tucuruí reservoir, Brazil. Int. J. Remote Sens. 2002, 23, 1241–1260. [Google Scholar] [CrossRef]
- Leck, M.A.; Baldwin, A.H.; Parker, V.T.; Schile, L.; Whigham, D.F. Plant Communities of Tidal Freshwater Wetlands of the Continental USA and Canada. Tidal Freshw. Wetl. 2009, 5, 41–58. [Google Scholar]
- Hird, J.N.; DeLancey, E.R.; McDermid, G.J.; Kariyeva, J. Google earth engine, open-access satellite data, and machine learning in support of large-area probabilistic wetland mapping. Remote Sens. 2017, 9, 1315. [Google Scholar] [CrossRef] [Green Version]
- Slagter, B.; Tsendbazar, N.-E.; Vollrath, A.; Reiche, J. Mapping wetland characteristics using temporally dense Sentinel-1 and Sentinel-2 data: A case study in the St. Lucia wetlands, South Africa. Int. J. Appl. Earth Obs. Geoinf. 2020, 86, 102009. [Google Scholar] [CrossRef]
- Huang, W.; DeVries, B.; Huang, C.; Lang, M.W.; Jones, J.W.; Creed, I.F.; Carroll, M.L. Automated extraction of surface water extent from Sentinel-1 data. Remote Sens. 2018, 10, 797. [Google Scholar] [CrossRef] [Green Version]
- Bioresita, F.; Puissant, A.; Stumpf, A.; Malet, J.-P. A Method for Automatic and Rapid Mapping of Water Surfaces from Sentinel-1 Imagery. Remote Sens. 2018, 10, 217. [Google Scholar] [CrossRef] [Green Version]
- Ramsey, E.; Rangoonwala, A.; Jones, C.E. Structural classification of marshes with polarimetric SAR highlighting the temporal mapping of marshes exposed to oil. Remote Sens. 2015, 7, 11295–11321. [Google Scholar] [CrossRef] [Green Version]
- Jensen, D.; Cavanaugh, K.C.; Simard, M.; Okin, G.S.; Castañeda-Moya, E.; McCall, A.; Twilley, R.R. Integrating imaging spectrometer and synthetic aperture radar data for estimating wetland vegetation aboveground biomass in coastal Louisiana. Remote Sens. 2019, 11, 2533. [Google Scholar] [CrossRef] [Green Version]
- Thomas, N.; Simard, M.; Castañeda-Moya, E.; Byrd, K.; Windham-Myers, L.; Bevington, A.; Twilley, R.R. High-resolution mapping of biomass and distribution of marsh and forested wetlands in southeastern coastal Louisiana. Int. J. Appl. Earth Obs. Geoinf. 2019, 80, 257–267. [Google Scholar] [CrossRef]
- Bourgeau-Chavez, L.; Endres, S.; Battaglia, M.; Miller, M.E.; Banda, E.; Laubach, Z.; Higman, P.; Chow-Fraser, P.; Marcaccio, J. Development of a bi-national Great Lakes coastal wetland and land use map using three-season PALSAR and Landsat imagery. Remote Sens. 2015, 7, 8655–8682. [Google Scholar] [CrossRef] [Green Version]
- San Martín, L.; Morandeira, N.S.; Grimson, R.; Rajngewerc, M.; González, E.B.; Kandus, P. The contribution of ALOS/PALSAR-1 multi-temporal data to map permanently and temporarily flooded coastal wetlands. Int. J. Remote Sens. 2020, 41, 1582–1602. [Google Scholar] [CrossRef]
- Whitcomb, J.; Moghaddam, M.; McDonald, K.; Kellndorfer, J.; Podest, E. Mapping vegetated wetlands of Alaska using L-band radar satellite imagery. Can. J. Remote Sens. 2009, 35, 54–72. [Google Scholar] [CrossRef]
- Clewley, D.; Whitcomb, J.; Moghaddam, M.; McDonald, K.; Chapman, B.; Bunting, P. Evaluation of ALOS PALSAR Data for High-Resolution Mapping of Vegetated Wetlands in Alaska. Remote Sens. 2015, 7, 7272–7297. [Google Scholar] [CrossRef] [Green Version]
- Breiman, L. Random forests. Mach. Learn. 2001, 45, 5–32. [Google Scholar] [CrossRef] [Green Version]
- Swarth, C.W.; Delgado, P.; Whigham, D.F. Vegetation Dynamics in a Tidal Freshwater Wetland: A Long-Term Study at Differing Scales. Estuaries Coasts 2013, 36, 559–574. [Google Scholar] [CrossRef]
- New York State Department of Environmental Conservation (NYSDEC); Hudson River National Estuarine Research Reserve (HRNERR); Cornell Institute for Resource Information Sciences (Cornell IRIS). Hudson River Estuary Tidal Wetlands 2007. Published by HRNERR and NYSEC. Albany, New York. 2011. Available online: https://gis.ny.gov/gisdata/inventories/details.cfm?DSID=1210 (accessed on 2 June 2020).
- Gorelick, N.; Hancher, M.; Dixon, M.; Ilyushchenko, S.; Thau, D.; Moore, R. Google Earth Engine: Planetary-scale geospatial analysis for everyone. Remote Sens. Environ. 2017, 202, 18–27. [Google Scholar] [CrossRef]
- Tucker, C.J. Red and photographic infrared linear combinations for monitoring vegetation. Remote Sens. Environ. 1979, 8, 127–150. [Google Scholar] [CrossRef] [Green Version]
- Prabhakara, K.; Dean Hively, W.; McCarty, G.W. Evaluating the relationship between biomass, percent groundcover and remote sensing indices across six winter cover crop fields in Maryland, United States. Int. J. Appl. Earth Obs. Geoinf. 2015, 39, 88–102. [Google Scholar] [CrossRef] [Green Version]
- Vermote, E.; Justice, C.; Claverie, M.; Franch, B. Preliminary analysis of the performance of the Landsat 8/OLI land surface reflectance product. Remote Sens. Environ. 2016, 185, 46–56. [Google Scholar] [CrossRef]
- Zhu, Z.; Wang, S.; Woodcock, C.E. Improvement and expansion of the Fmask algorithm: Cloud, cloud shadow, and snow detection for Landsats 4-7, 8, and Sentinel 2 images. Remote Sens. Environ. 2015, 159, 269–277. [Google Scholar] [CrossRef]
- Knight, J.F.; Tolcser, B.P.; Corcoran, J.M.; Rampi, L.P. The effects of data selection and thematic detail on the accuracy of high spatial resolution wetland classifications. Photogramm. Eng. Remote Sens. 2013, 79, 613–623. [Google Scholar] [CrossRef]
- R Core Team. R: A Language and Environment for Statistical Computing; R Foundation for Statistical Computing: Vienna, Austria, 2020; Available online: http://www.r-project.org/ (accessed on 2 June 2020).
- United States Fish and Wildlife Service. Water Chestnut (T. natans). Ecology Risk Screening Summary; U.S. Fish &Wildlife Service: Washington, DC, USA, 2014.
- Cornell Institute for Resource Information Sciences (Cornell IRIS); Hudson River National Estuarine Research Reserve (HRNERR); New York State Department of Environmental Conservation (NYSDEC). Hudson River Submerged Aquatic Vegetation 2018. Published by HRNERR and NYSEC. Albany, New York. 2019. Available online: http://gis.ny.gov/gisdata/inventories/details.cfm?DSID=1350 (accessed on 2 June 2020).
- USDA Farm Service Agency, 2021. National Agriculture Imagery Program (NAIP). Available online: https://www.fsa.usda.gov/programs-and-services/aerial-photography/imagery-programs/naip-imagery/index (accessed on 20 April 2021).
- Carle, M.V.; Sasser, C.E.; Roberts, H.H. Accretion and Vegetation Community Change in the Wax Lake Delta Following the Historic 2011 Mississippi River Flood. J. Coast. Res. 2015, 31, 569–587. [Google Scholar] [CrossRef]
- Sciance, M.B.; Patrick, C.J.; Weller, D.E.; Williams, M.N.; McCormick, M.K.; Hazelton, E.L.G. Local and regional disturbances associated with the invasion of Chesapeake Bay marshes by the common reed P. australis. Biol. Invasions 2016, 18, 2661–2677. [Google Scholar] [CrossRef]
- National Audubon Society. Active Delta (Mississippi River Birdsfoot Delta). Available online: https://www.audubon.org/important-bird-areas/active-delta-mississippi-river-birdsfoot-delta (accessed on 12 September 2016).
- Ganju, N.K.; Defne, Z.; Kirwan, M.L.; Fagherazzi, S.; D’Alpaos, A.; Carniello, L. Spatially integrative metrics reveal hidden vulnerability of microtidal salt marshes. Nat. Commun. 2017, 8, 14156. [Google Scholar] [CrossRef] [Green Version]
- Handley, L.; Wells, C. Comparison of NLCD with NWI Classifications of Baldwin and Mobile Counties, Alabama; United States Geological Survey Report 2009-1058; US Department of the Interior, US Geological Survey: Washington, DC, USA, 2009.
- Nichols, C. Map Accuracy of National Wetlands Inventory Maps for Areas Subject to Maine Land Use Regulation Commission Jurisdiction; Ecological Services Report R5-94/6; U.S. Fish and Wildlife Service: Hadley, MA, USA, 1994; p. 14.
- Dabrowska-Zielinska, K.; Budzynska, M.; Tomaszewska, M.; Malinska, A.; Gatkowska, M.; Bartold, M.; Malek, I. Assessment of carbon flux and soil moisture in wetlands applying Sentinel-1 data. Remote Sens. 2016, 8, 756. [Google Scholar] [CrossRef] [Green Version]
- Elliton, C.E. Interactions among Hydrology, Sediment and Vegetation in Accreting Wax Lake Delta: Physical and Biogeochemical Implications for Coastal Louisiana Restoration. Master’s Thesis, LSU Office of Research and Economic Development, Baton Rouge, LA, USA, 2013. [Google Scholar]
- Olliver, E.A.; Edmonds, D.A.; Shaw, J.B. Influence of Floods, Tides, and Vegetation on Sediment Retention in Wax Lake Delta, Louisiana, USA. J. Geophys. Res. Earth Surf. 2020, 125, 1–21. [Google Scholar] [CrossRef]


| NWI Code | System | Subsystem | Class | Subclass | Water Regime | Special Modifiers | Water Chemistry | Common Species |
|---|---|---|---|---|---|---|---|---|
| E2EM1P | E-estuarine | 2-intertidal | EM-emergent | 1-persistent | P-irregularly flooded | -- | -- | Spartina patens |
| E2EM1N | E-estuarine | 2-intertidal | EM-emergent | 1-persistent | N-regularly flooded | -- | -- | Spartina alterniflora |
| E2EM2N | E-estuarine | 2-intertidal | EM-emergent | 2-non-persistent | N-regularly flooded | -- | -- | Nuphar lutea * |
| E2EM5P | E-estuarine | 2-intertidal | EM-emergent | 5-phragmites | P-irregularly flooded | -- | -- | Phragmites australis |
| E2SS1P | E-estuarine | 2-intertidal | SS-shrub/scrub | 1-broad leafed | P-irregularly flooded | -- | -- | Iva frutescens |
| E2EM1P6 | E-estuarine | 2-intertidal | EM-emergent | 1-persistent | P-irregularly flooded | -- | 6-Oligohaline | Leersia oryzoides |
| E2EM1N6 | E-estuarine | 2-intertidal | EM-emergent | 1-persistent | N-regularly flooded | -- | 6-Oligohaline | Scirpus spp. |
| E2EM1Nd6 | E-estuarine | 2-intertidal | EM-emergent | 1-persistent | N-regularly flooded | d-Ditched | 6-Oligohaline | Typha spp. |
| E2EM5Pd6 | E-estuarine | 2-intertidal | EM-emergent | 5-phragmites | P-irregularly flooded | d-Ditched | 6-Oligohaline | Phragmites australis |
| E1ABL6 | E-estuarine | 1-subtidal | AB-aquatic bed | -- | L-subtidal | -- | 6-Oligohaline | Trapa natans |
| E1UBL6 | E-estuarine | 1-subtidal | UB-consolidated | -- | L-subtidal | -- | 6-Oligohaline | mud/sand |
| PEM1 | P-palustrine | -- | EM-emergent | 1-persistent | -- | -- | -- | Carex spp. |
| PEM2 | P-palustrine | -- | EM-emergent | 2-non-persistent | -- | -- | -- | Pontederia cordata |
| PEM5 | P-palustrine | -- | EM-emergent | 5-phragmites | -- | -- | -- | Phragmites australis |
| R1ABT ** | R-riverine | 1-tidal | AB-aquatic bed | -- | T-semipermanently flooded | -- | -- | Sagittaria spp. |
| R1AB3V ** | R-riverine | 1-tidal | AB-aquatic bed | 3-rooted vascular | V-permanently flooded | -- | -- | Zostera marina |
| R1AB3T ** | R-riverine | 1-tidal | AB-aquatic bed | 3-rooted vascular | T-semipermanently flooded | -- | -- | Ruppia martima |
| R1AB4V ** | R-riverine | 1-tidal | AB-aquatic bed | 4-floating vascular | V-permanently flooded | -- | -- | Eichhornia crassipes |
| * Nuphar lutea and other non-persistent emergent vegetation only occur in this class when salinities are sufficiently low | ||||||||
| ** Riverine NWI class was not used in the level-1 classification training and validation process | ||||||||
| Classification | ||||||||||||||
|---|---|---|---|---|---|---|---|---|---|---|---|---|---|---|
| water | urban | barren | grass | agriculture | shrub | upland forest | woody wetlands | estuarine emergent | palustrine emergent | Phragmites australis | Total | Producer’s Accuracy % | ||
| water | 39,538 | 96 | 275 | 28 | 102 | 1 | 14 | 4 | 370 | 14 | 17 | 40,459 | 97.72 | |
| urban | 53 | 21,874 | 1722 | 3207 | 5789 | 517 | 2007 | 162 | 457 | 305 | 78 | 36,171 | 60.47 | |
| barren | 561 | 3981 | 8849 | 839 | 3208 | 221 | 1587 | 155 | 1036 | 129 | 172 | 20,738 | 42.67 | |
| grass | 18 | 5258 | 559 | 6667 | 10,207 | 1174 | 11,662 | 860 | 280 | 432 | 108 | 37,225 | 17.91 | |
| agriculture | 23 | 3665 | 893 | 3092 | 47,904 | 827 | 6661 | 563 | 515 | 899 | 183 | 65,225 | 73.44 | |
| Reference | shrub | 12 | 1991 | 206 | 2230 | 3359 | 3121 | 9460 | 1213 | 106 | 381 | 101 | 22,180 | 14.07 |
| forest | 13 | 1830 | 389 | 3148 | 5094 | 1327 | 94,643 | 5119 | 28 | 164 | 64 | 111,819 | 84.64 | |
| woody wet. | 3 | 286 | 11 | 526 | 349 | 408 | 9855 | 12,221 | 33 | 101 | 101 | 23,894 | 51.15 | |
| estuarine | 249 | 213 | 333 | 76 | 252 | 9 | 15 | 42 | 19,043 | 312 | 1349 | 21,893 | 86.98 | |
| palustrine | 49 | 167 | 72 | 175 | 1217 | 111 | 431 | 119 | 687 | 16,249 | 549 | 19,826 | 81.96 | |
| Phragmites | 18 | 49 | 18 | 28 | 154 | 14 | 30 | 25 | 840 | 95 | 13,729 | 15,000 | 91.53 | |
| Total | 40,537 | 39,410 | 13,327 | 20,016 | 77,635 | 7730 | 136,365 | 20,483 | 23,395 | 19,081 | 16,451 | -- | -- | |
| User’s Accuracy % | 97.54 | 55.50 | 66.40 | 33.31 | 61.70 | 40.38 | 69.40 | 59.66 | 81.40 | 85.16 | 83.45 | -- | Overall Accuracy % | |
| 68.49 |
| Classification | ||||||||||||||
|---|---|---|---|---|---|---|---|---|---|---|---|---|---|---|
| water | urban | barren | grass | agriculture | shrub | upland forest | woody wetlands | estuarine emergent | palustrine emergent | Phragmites australis | Total | Producer’s Accuracy % | ||
| water | 35,015 | 86 | 330 | 13 | 171 | 0 | 16 | 13 | 845 | 65 | 2 | 36,556 | 95.78 | |
| urban | 35 | 13,084 | 1354 | 2323 | 6877 | 103 | 1861 | 631 | 870 | 497 | 32 | 27,667 | 47.29 | |
| barren | 681 | 2699 | 4899 | 1140 | 4996 | 45 | 876 | 353 | 874 | 175 | 23 | 16,761 | 29.23 | |
| grass | 39 | 2723 | 606 | 8211 | 14,099 | 598 | 9468 | 1185 | 437 | 162 | 16 | 37,544 | 21.87 | |
| agriculture | 51 | 2630 | 561 | 4724 | 50,487 | 475 | 7093 | 1695 | 1177 | 996 | 102 | 69,991 | 72.13 | |
| Reference | shrub | 7 | 689 | 116 | 2290 | 6227 | 1875 | 18641 | 1134 | 64 | 22 | 2 | 31,067 | 6.04 |
| forest | 10 | 861 | 128 | 3189 | 5163 | 829 | 77,938 | 6290 | 13 | 36 | 0 | 94,457 | 82.51 | |
| woody wet. | 15 | 590 | 24 | 289 | 1207 | 70 | 12264 | 23,620 | 56 | 221 | 4 | 38,360 | 61.57 | |
| estuarine | 1061 | 207 | 223 | 7 | 413 | 0 | 1 | 57 | 32,073 | 5374 | 584 | 40,000 | 80.18 | |
| palustrine | 373 | 197 | 59 | 24 | 666 | 3 | 99 | 328 | 6573 | 21,294 | 384 | 30,000 | 70.98 | |
| Phragmites | 5 | 48 | 8 | 3 | 132 | 0 | 10 | 4 | 3438 | 1478 | 3847 | 8973 | 42.87 | |
| Total | 37,292 | 23,814 | 8308 | 22,213 | 90,438 | 3998 | 128,267 | 35,310 | 46,420 | 30,320 | 4996 | -- | -- | |
| User’s Accuracy % | 93.89 | 54.94 | 58.97 | 36.96 | 55.82 | 46.90 | 60.76 | 66.89 | 69.09 | 70.23 | 77.00 | -- | Overall Accuracy % | |
| 63.13 |
| Layer/Class | Water | Urban | Barren | Grass | Agriculture | Shrub | Upland Forest | Woody Wetlands | Estuarine Emergent | Palustrine Emergent | Phragmites Australis | Mean Decrease Accuracy |
|---|---|---|---|---|---|---|---|---|---|---|---|---|
| dem | 0.289 | 0.091 | 0.088 | 0.043 | 0.077 | 0.059 | 0.192 | 0.184 | 0.529 | 0.563 | 0.622 | 0.200 |
| vv_mean | 0.295 | 0.115 | 0.067 | 0.019 | 0.088 | 0.010 | 0.148 | 0.125 | 0.146 | 0.318 | 0.307 | 0.140 |
| vh_mean | 0.275 | −0.014 | 0.119 | 0.011 | 0.194 | 0.057 | 0.271 | 0.237 | 0.142 | 0.488 | 0.388 | 0.198 |
| vv_sd | 0.026 | 0.009 | 0.033 | 0.010 | 0.069 | 0.030 | 0.052 | 0.052 | 0.050 | 0.238 | 0.303 | 0.060 |
| vv_spring | 0.052 | 0.052 | 0.049 | 0.011 | 0.057 | 0.022 | 0.109 | 0.078 | 0.125 | 0.244 | 0.266 | 0.085 |
| vv_summer | 0.148 | 0.073 | 0.049 | 0.014 | 0.053 | 0.018 | 0.089 | 0.028 | 0.269 | 0.260 | 0.328 | 0.098 |
| vv_fall | 0.513 | 0.062 | 0.027 | 0.012 | 0.036 | 0.020 | 0.081 | 0.041 | 0.070 | 0.186 | 0.247 | 0.110 |
| ndvi | 0.371 | 0.193 | 0.171 | 0.055 | 0.058 | 0.061 | 0.275 | 0.222 | 0.311 | 0.489 | 0.480 | 0.223 |
| Layer/Class | Water | Urban | Barren | Grass | Agriculture | Shrub | Upland Forest | Woody Wetlands | Estuarine Emergent | Palustrine Emergent | Phragmites Australis | Mean Decrease Accuracy |
|---|---|---|---|---|---|---|---|---|---|---|---|---|
| dem | 0.108 | 0.089 | 0.060 | 0.079 | 0.106 | 0.066 | 0.185 | 0.169 | 0.413 | 0.400 | 0.283 | 0.173 |
| vv_mean | 0.260 | 0.101 | 0.065 | 0.014 | 0.087 | −0.022 | 0.116 | 0.243 | 0.185 | 0.112 | 0.129 | 0.119 |
| vh_mean | 0.282 | −0.002 | 0.094 | 0.036 | 0.166 | 0.021 | 0.164 | 0.211 | 0.126 | 0.045 | 0.189 | 0.132 |
| vv_sd | 0.040 | 0.017 | 0.036 | 0.018 | 0.081 | 0.018 | 0.053 | 0.039 | 0.053 | 0.046 | 0.089 | 0.047 |
| vv_spring | 0.140 | 0.070 | 0.027 | 0.015 | 0.038 | 0.004 | 0.066 | 0.057 | 0.108 | 0.097 | 0.106 | 0.064 |
| vv_summer | 0.126 | 0.065 | 0.050 | 0.013 | 0.051 | 0.002 | 0.059 | 0.058 | 0.078 | 0.076 | 0.143 | 0.060 |
| vv_fall | 0.077 | 0.049 | 0.039 | 0.011 | 0.031 | 0.002 | 0.050 | 0.025 | 0.076 | 0.030 | 0.128 | 0.042 |
| ndvi | 0.486 | 0.147 | 0.142 | 0.057 | 0.083 | 0.042 | 0.209 | 0.265 | 0.138 | 0.184 | 0.196 | 0.177 |
| Validation Dataset | Site | Pixel Count | Class Assessed | Occurrence Accuracy % | Level-1 P. emergent | Level-1 E. Emergent | Level-1 Phragmites | Level-1 Water | Level-1 Barren | Level-1 Woody | Additional Notes |
|---|---|---|---|---|---|---|---|---|---|---|---|
| HRSAV | Hudson | 6882 | T. natans | 96.47% | 3.91% | 3.98% | <1% | 15.66% | 76.14% | <1% | -- |
| NAIP | Choptank | 675 | NPE | 93.60% | 68.15% | 8.15% | <1% | 22.37% | <1% | 1.19% | T. natans = 1.93% |
| NAIP | Choptank | 1006 | PE | 95.79% | 89.78% | 1.10% | 4.91% | <1% | <1% | 3.71% | non-persistent = 1.2% |
| NWI | Wax Lake | -- | R1ABT-NPE | 32.21% | 16.14% | 8.33% | 1.12% | 52.65% | <1% | <1% | agriculture = 21.15% |
| NWI | Wax Lake | -- | R1AB3V-NPE | 47.37% | 20.74% | 3.08% | <1% | 57.69% | <1% | <1% | agriculture = 17.05% |
| NWI | Wax Lake | -- | R1AB4V-NPE | 14.08% | 25.03% | 29.35% | <1% | 13.97% | <1% | <1% | grassland = 27.06% |
| NWI | Wax Lake | -- | R1AB3T-NPE | 23.94% | 1.81% | 7.18% | <1% | 88.61% | <1% | <1% | grassland = 1.40% |
Publisher’s Note: MDPI stays neutral with regard to jurisdictional claims in published maps and institutional affiliations. |
© 2021 by the authors. Licensee MDPI, Basel, Switzerland. This article is an open access article distributed under the terms and conditions of the Creative Commons Attribution (CC BY) license (https://creativecommons.org/licenses/by/4.0/).
Share and Cite
Lamb, B.T.; Tzortziou, M.A.; McDonald, K.C. A Fused Radar–Optical Approach for Mapping Wetlands and Deepwaters of the Mid–Atlantic and Gulf Coast Regions of the United States. Remote Sens. 2021, 13, 2495. https://doi.org/10.3390/rs13132495
Lamb BT, Tzortziou MA, McDonald KC. A Fused Radar–Optical Approach for Mapping Wetlands and Deepwaters of the Mid–Atlantic and Gulf Coast Regions of the United States. Remote Sensing. 2021; 13(13):2495. https://doi.org/10.3390/rs13132495
Chicago/Turabian StyleLamb, Brian T., Maria A. Tzortziou, and Kyle C. McDonald. 2021. "A Fused Radar–Optical Approach for Mapping Wetlands and Deepwaters of the Mid–Atlantic and Gulf Coast Regions of the United States" Remote Sensing 13, no. 13: 2495. https://doi.org/10.3390/rs13132495
APA StyleLamb, B. T., Tzortziou, M. A., & McDonald, K. C. (2021). A Fused Radar–Optical Approach for Mapping Wetlands and Deepwaters of the Mid–Atlantic and Gulf Coast Regions of the United States. Remote Sensing, 13(13), 2495. https://doi.org/10.3390/rs13132495