Abstract
Impervious surfaces have been widely considered as the key indicator for evaluating urbanization and environmental quality. As one of the most widely applied methods, spectral mixture analysis (SMA) has been commonly used for mapping urban impervious surface fractions. When implementing SMA, the original multispectral remote-sensing reflectance images are served as the foundation and key to successful SMA. However, the limited spectral variances among different land covers from the original reflectance images make it challenging in information extraction and results in unsatisfactory mapping results. To address this issue, a new method has been proposed in this study to improve urban impervious surface mapping through integrating statistical methods and SMA. In particular, two traditional statistical methods, principal component analysis (PCA) and minimum noise fraction rotation (MNF) were applied to highlight the spectral variances among different land covers. Three endmember classes (impervious surface, soil, and vegetation) and corresponding spectra were identified and extracted from the vertices of the 2-D space plots generated by the first three components of each of the statistical analysis methods, PCA and MNF. A new dataset was generated by stacking the first three components of the PCA and MNF (in a total of six components), and a fully constrained linear SMA was implemented to map the fractional impervious surfaces. Results indicate that a promising performance has been achieved by the proposed new method with the systematic error (SE) of −3.45% and mean absolute error (MAE) of 11.52%. Comparative analysis results also show a much better performance achieved by the proposed statistical method-based SMA than the conventional SMA.
1. Introduction
With the development of agricultural, industrial, and medical technologies, the world has experienced unprecedented population growth in recent decades [1,2,3]. The world’s population was only 2.5 billion in 1950, it reached 3.7 billion in 1970, 5.3 billion in 1990, 6.9 billion in 2010, and crossed the 7.7 billion mark in 2019 [1]. More importantly, only 29.4% of the world’s population resided in urban areas in 1950. This figure jumped to 43% in 1990, 51.6% in 2010, and it is expected to be over 60% in 2030 and reach 67.2% in 2050 [1]. Clearly, the urban areas have experienced faster population growth than rural areas, and the future population growth is likely to mainly occur in urban areas [3,4,5]. This rapid urbanization process was associated with population migration from rural areas to urban areas and the land-use conversion from rural land use, such as agricultural land and forest to urbanized human settlements [4,5,6].
Associated with this rapid urbanization, impervious surfaces, the major biophysical component in the urban environment, have increased significantly. Impervious surfaces are generally defined as the surfaces that prevent water infiltration such as manmade materials, concrete and asphalt. As the impervious surface is closely related to commercial, industrial, and residential areas, it has been widely applied as an important indicator for reflecting the land use/land cover transformation from natural features to urban features [7,8,9]. Moreover, the impervious surface has also been used for assessing environmental quality as the rapid increases of impervious surfaces can generate several environmental issues [10,11]. For instance, the increase of impervious surfaces influences surface and underground water cycles leading to the decrease of base flow, and the increase of surface runoff and flood frequency [12,13,14,15,16]. Furthermore, the increase of impervious surfaces and corresponding surface runoff would influence surface pollutant transportation, and lead to associated water pollution [9,17]. In addition to the hydrological issues, impervious surfaces can alter the local climate, and cause the corresponding urban heat island effect [18,19,20,21,22]. Moreover, the reduction of natural habitats led by the increase of impervious surfaces can also lead to the reduction of biodiversity [13,16,23]. Therefore, it is imperative to map, monitor, and timely update the accurate distribution of urban impervious surfaces to support decision-making for urban future planning and development.
Impervious surface estimation was first conducted by manual interpretation. So far, this has been recognized as the most accurate method, but it is time-consuming and cost intensive. Since the first remote-sensing satellite was launched, the remote-sensing data with the advantages of wide-area coverage, regular revisiting period, and multiple spectral bands, has become widely used to monitor urban land-use change and environmental quality. Meanwhile, it has also become the preferred data source for impervious surface estimation in most studies [24,25,26,27,28,29]. With the availability of different sources of remote-sensing data, some traditional classification techniques, such as supervised and unsupervised classification, have been widely applied in impervious surface estimation at different scales. Although these approaches are very easy to conduct, they only consider one land-cover type in one pixel and overlook the spatial heterogeneity of urban areas. In fact, there are a lot of mixed pixels instead of a single land-cover class in imageries which caused some issues associated with information loss and reduced accuracy [30]. Therefore, many approaches have been developed for mapping impervious surfaces at the sub-pixel level, such as decision tree (DT), regression tree (RT), artificial neural network (ANN), and spectral mixture analysis (SMA) [19,20,21]. Among them, the SMA has been most widely used with the advantage of addressing spectral mixture issues, and several comparison studies have also been conducted and it has been proven that the SMA has a better performance than other methods in many fields, such as land-cover classification [31], wetland classification [32], urban classification [33]. Moreover, numerous studies have also been conducted for improving SMA performance [34,35]. Wu and Murray [26] applied a four-endmember (vegetation–soil-high albedo-low albedo) spectral mixture analysis to improve the estimation of impervious surface distribution in Columbus, Ohio using Landsat Enhanced Thematic Mapper Plus (ETM+) images. To assess the estimation accuracy, the estimated fractional impervious surface was compared with the reference data, and 10.6% of RMS were reported for the whole study area. Moreover, slight overestimation and underestimation of impervious surface fraction in the less developed areas and developed areas were also reported, respectively. Wu [36] also introduced a normalized spectral mixture analysis (NSMA) to reduce brightness variations within each endmember (vegetation, soil, and impervious surface) for spectral mixture analysis. Specifically, the Landsat ETM+ collected for Columbus, Ohio was used in this study. Research results indicate a significant accuracy improvement with the RMSE of 10.1% and SE of −3.4% for the overall study area. Moreover, a better performance has been achieved by the less developed areas with the RMSE of 6.1% (vs. 14.5% in developed areas) and SE of 1.0% (vs. −10.7% in developed areas). Roberts et al. proposed a multiple endmember spectral mixture analysis (MESMA) to improve the performance of unmixing analysis with the consideration of the spatial variation of endmember set and endmember spectra [37]. In their studies, the proposed MESMA was applied to map chaparral in the Santa Monica Mountains using a visible/infrared imaging spectrometer (VIRIS). The root mean squared error was used for evaluating mapping accuracy, and lowered root mean squared error and tightened residual constraints were also reported. Chang and Ji [38] developed a weighted spectral mixture analysis (WSMA) which assigned higher weights to the spectral band with lower endmember variability and lower weights to the spectral bands with high endmember variability to handle the spectral mixture issue. Deng and Wu [39] limited endmember selection to a certain local extent to reduce endmember variability in the proposed spatial adaptive spectral mixture analysis. This newly proposed method has been applied in Columbus, Ohio, using collected Landsat ETM+. Three measures, including root mean square error (RMSE), mean absolute error (MAE), and systematic error (SE), were applied to evaluate the performance. Research results indicate a promising performance has been achieved with the RMSE of 15.25%, MAE of 8.5%, and SE of −0.93%. In addition, Li and Wu proposed a temporal mixture analysis to map impervious surface fractions at a large scale [40]. Specifically, instead of applying reflectance images, they used temporal Moderate Resolution Imaging Spectroradiometer Normalized Difference Vegetation Index (MODIS NDVI) data to estimate fractional impervious surfaces for the whole Wisconsin State. The RMSE, SE, and MAE were calculated to evaluate the performance of the proposed temporal mixture analysis, a scatter plot with R2 value was also provided to show a promising performance has been achieved. Deng and Lin used both daytime Landsat Thematic Mapper (TM) images and nighttime light images to estimate impervious surfaces in desert areas in Las Vegas, Amman, and Baghdad. The research result shows the new proposed method is reliable in mapping urban impervious surfaces in desert areas [41]. Tang et al. proposed a new method to map large-scale impervious surface by integrating the Nighttime Light (NTL) and MODIS products. The proposed method has been applied in Guangdong–Hong Kong–Macao Greater Bay area to analyze the impervious surface change in the past decade. Research results show that the impervious surface percentage has increased from 7.97% in 2000 to 17.11% in 2019 with a MAE of 6.47%, RMSE of 10.03%, and R2 of 92.39% [42]. Schug et al. developed a new method to map built-up and vegetation at national scale using Sentinel-2 spectral-temporal metrics and a regression-based unmixing analysis method. In particular, Sentinel-2 data in 2017 and 2018 were used for mapping built up and vegetation at subpixel level for all of Germany and Austria at 10 m resolution using spectral-temporal metrics and regression based unmixing analysis method [43].
The original multispectral remote-sensing images serve as the foundation and key to successful SMA. However, the limited spectral variances among different land covers from the original remote-sensing reflectance images may make it challenging in information extraction and results in unsatisfactory land categories distinction. While numerous efforts have been made in the past decades for improving the performance of the SMA and the estimation accuracy of impervious surfaces, most of them only focus on the improvement of endmember extraction and final unmixing process, and few studies have been conducted for highlighting the spectral variances among different land covers. To address this issue, this study proposed a new method for mapping urban impervious surface fractions through integrating statistical methods and SMA. Specifically, two widely used statistical methods, principal component analysis (PCA) and minimum noise fraction rotation (MNF) were applied in highlighting the spectral variances among different land covers from the original multispectral remote sensing images [44,45]. Instead of applying original remote-sensing images, the generated PCA components and MNF components were adopted for endmember selection and further unmixing analysis for mapping the urban impervious surfaces for the selected study site, Milwaukee County in the Wisconsin State of the U.S.A. The rest of this paper is organized as follows, Section 2 introduces the study site and materials, Section 3 describes the methodology, including PCA, MNF, and SMA, applied in the estimation of impervious surfaces, Section 4 reports the estimation results and discusses the contributions made by this study, and conclusions and future research direction are summarized in Section 5.
2. Study Site and Materials
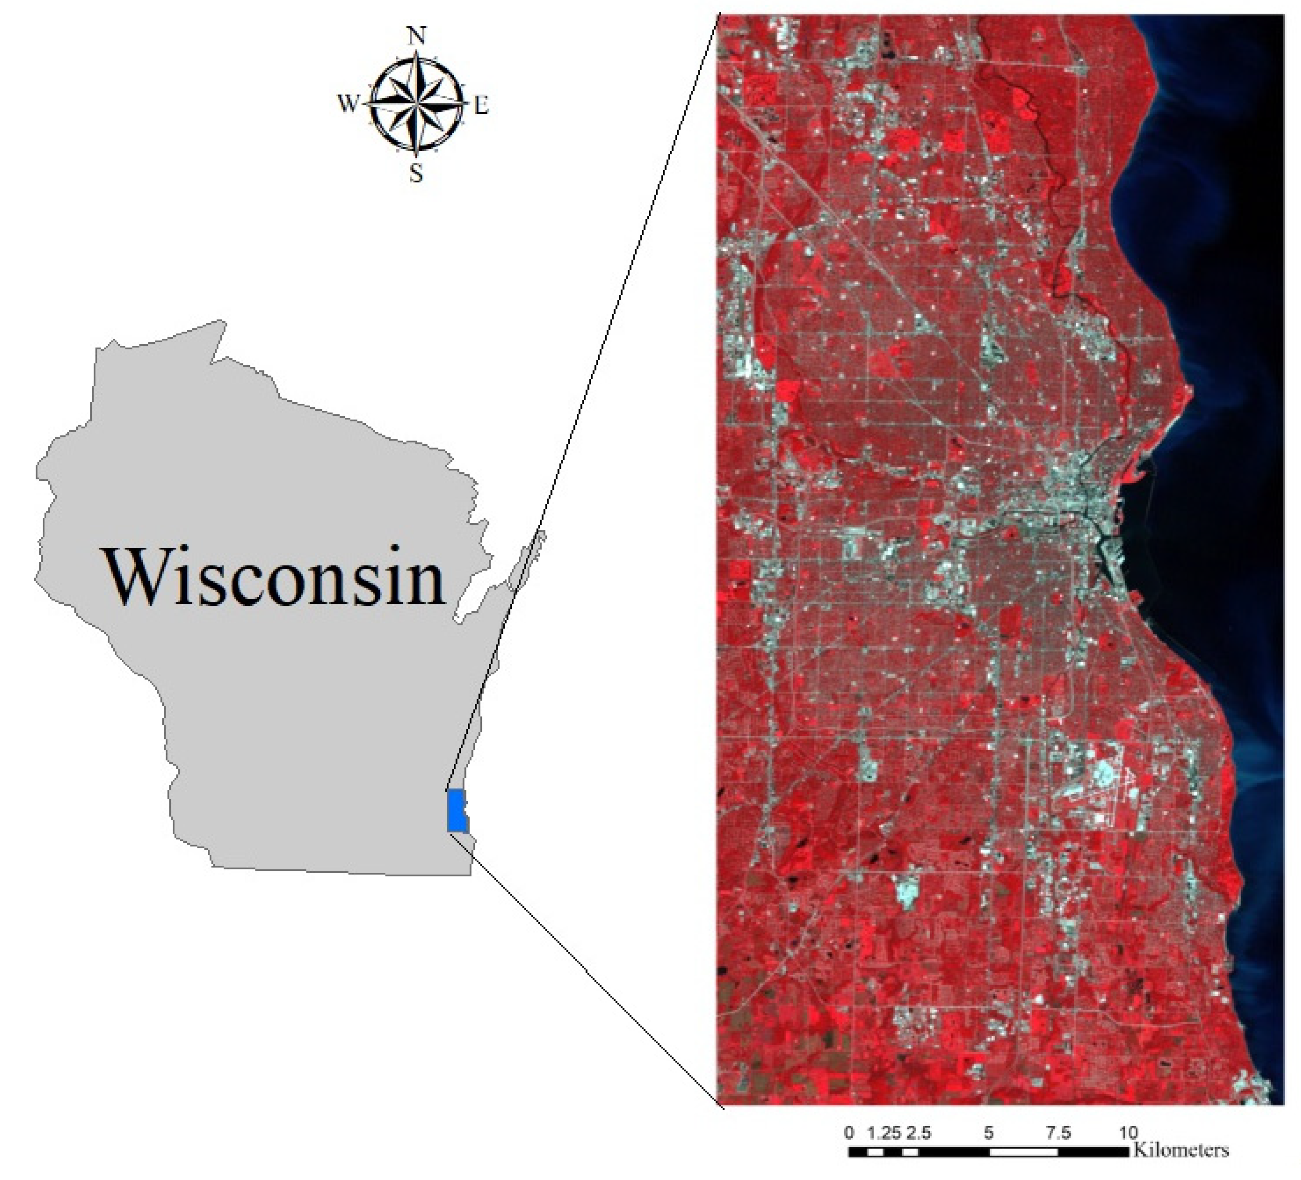
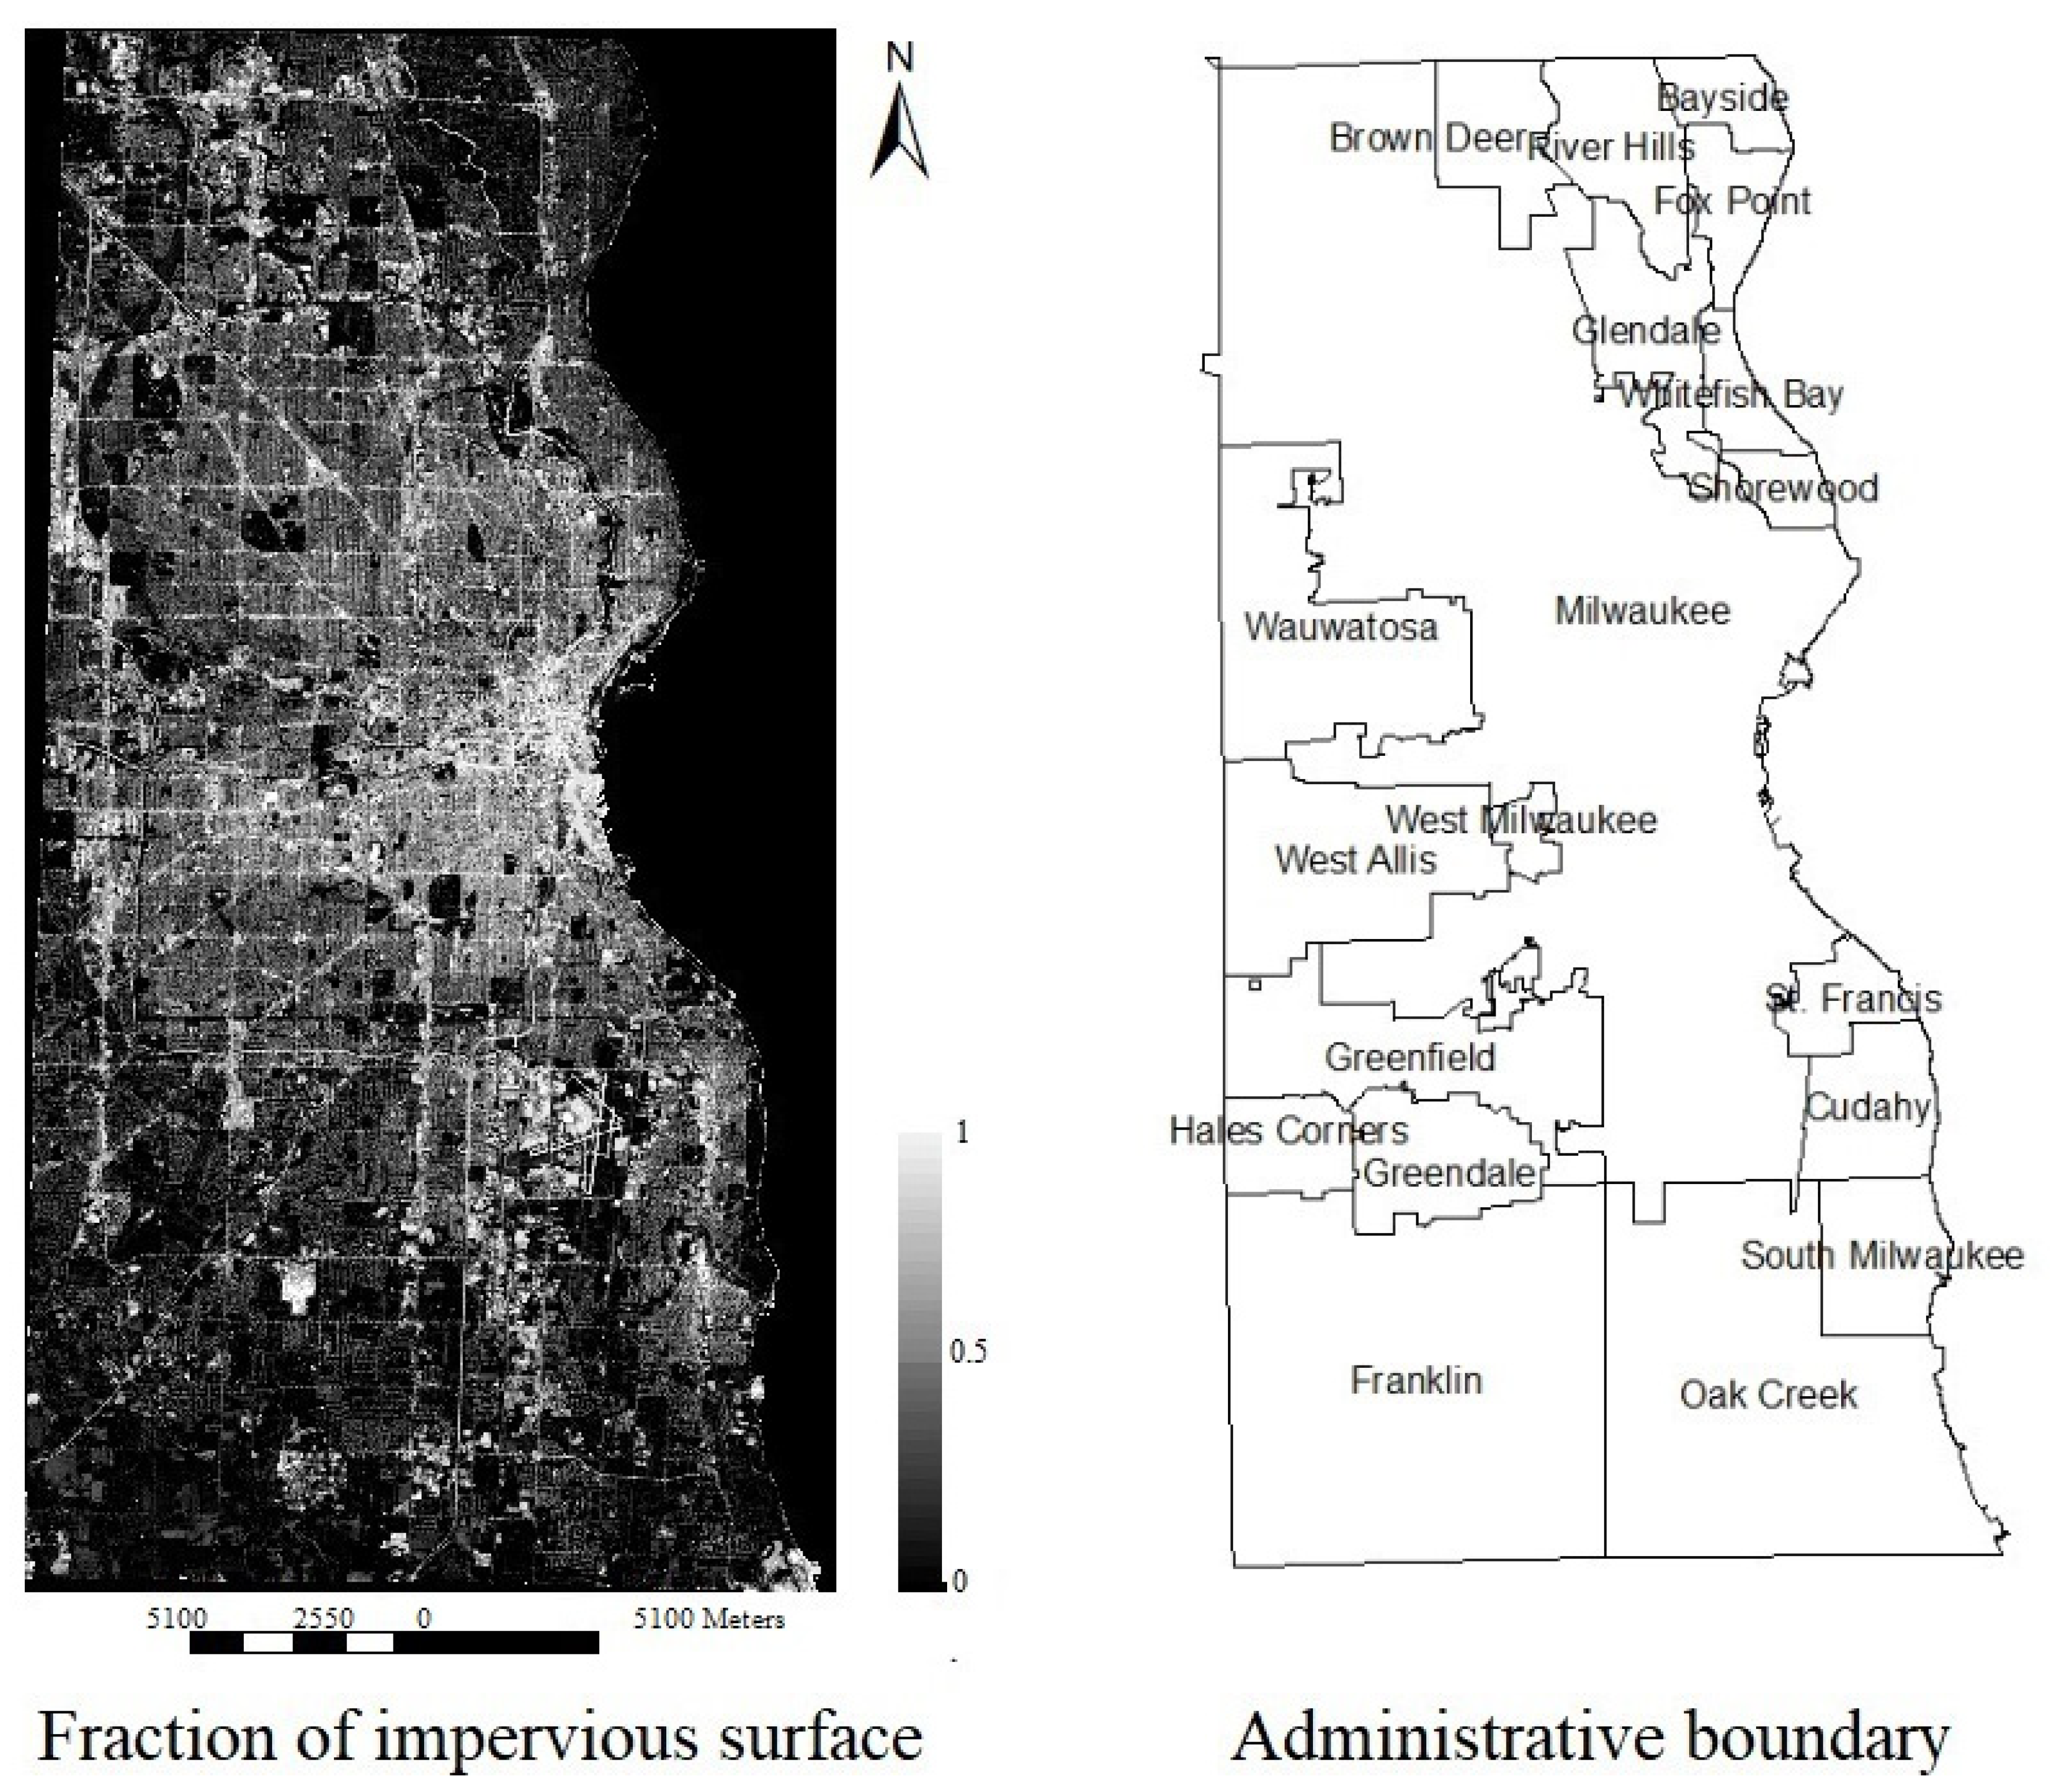
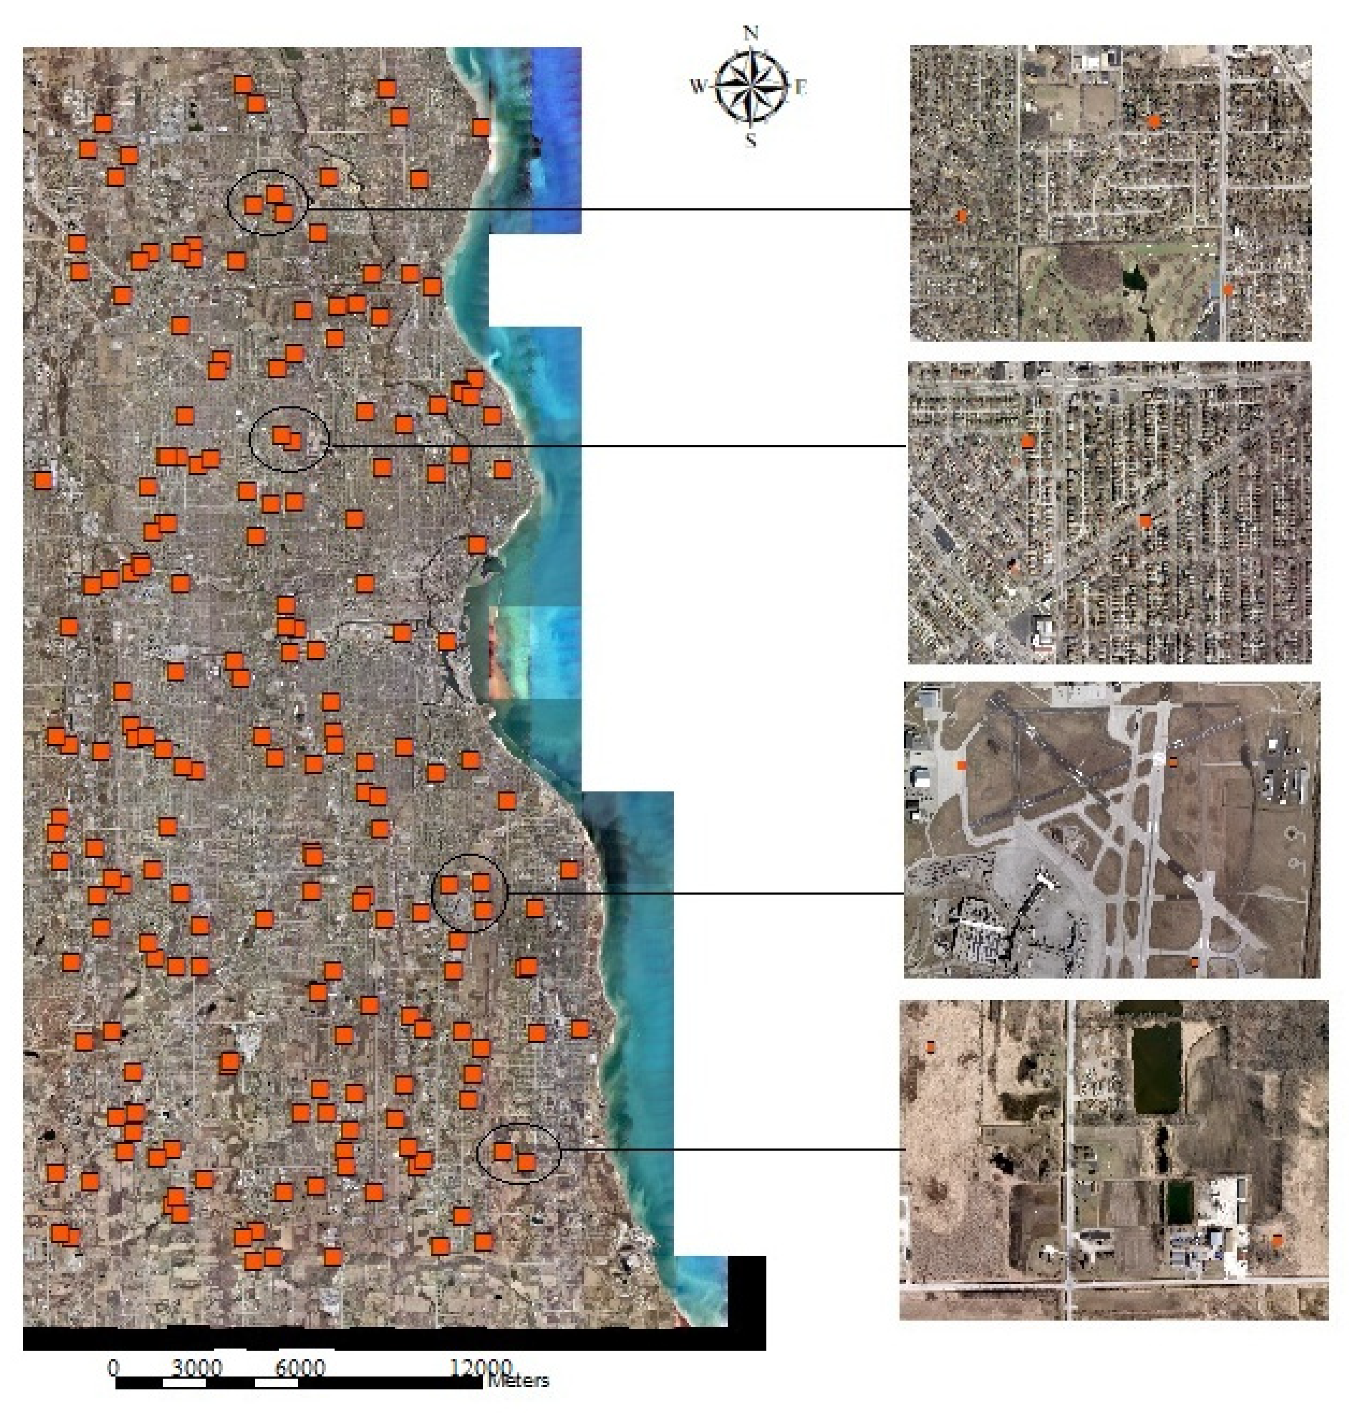
Milwaukee County in Wisconsin State, U.S., was chosen as the study site in this paper (Figure 1). Milwaukee County is located in the southeastern of Wisconsin State and the west shore of Lake Michigan. It covers a geographical area of 3080 km2 with 19 cities. The population of Milwaukee County is 945,726 in 2019, and over 60% of people live in the City of Milwaukee, then followed by West Allis, Wauwatosa, Greenfield, and Oak Creek. Milwaukee County is situated in a humid continental climate which is hot and humid in the summer with temperatures over 90 °F for over 7 days per year, and cold, snowy, and windy in the winter with temperatures below 0 °F over 6 days every year. In the past decades, Milwaukee County has also experienced rapid population growth and urbanization. While this rapid development boosts the local economy, it also brings several challenging problems, such as water pollution, ecological degradation, traffic congestion, and intensified urban heat island effect. As impervious surfaces are playing a major role in the urbanization process, accurate mapping, monitoring, and updating the distribution of impervious surfaces becomes critical for Milwaukee County’s sustainable development.

Figure 1.
The study site: Milwaukee County, WI, USA.
In this study, we are focusing on improving impervious surface estimation through integrating statistical methods and spectral mixture analysis. To avoid the spectral confusion between impervious surface and high albedo in winter, and the large tree crown coverage on the impervious surface in summer, the images in either spring or fall severs as the optimal option for impervious surface estimation. To keep the collected remote-sensing image and the referenced high spatial resolution image consistent in a timely manner, the Landsat TM on 12 September 2010, collected from the U.S. Geological Survey was applied in this study. The remote-sensing data obtained were composed of six bands (band 6: the thermal band was excluded) with 30 m spatial resolution. The data were processed by converting the original Digital Number (DN) value to radiance and then converted to reflectance. To evaluate the performance of the proposed statistical method-based SMA, the digital orthophotography captured on 5 October 2010 were obtained for Milwaukee County. In particular, the collected orthophotography is obtained by aircraft and composed of three bands, green, blue, and red, with a 15 cm spatial resolution. All digital orthophotography remote-sensing images were provided and preprocessed by the American Geographical Society Library at the University of Wisconsin Milwaukee. Specifically, the air photo was co-registered, orthorectified, and reprojected by precisely registered Landsat data using the automated registration and orthorectification package and, finally, all air photos were consistent in geographic extent, spatial resolution, and projection [46].
3. Methodology
The proposed statistical method-based SMA could be implemented by the following steps (Figure 2). First, two statistical methods, PCA and MNF, are applied to highlight the spectral variances among land covers on original remote-sensing images. Second, the endmember and endmember spectra are selected based on the first three components of each of statistical methods, PCA and MNF. Third, the constrained linear spectral mixture analysis was applied on the stacked PCA and MNF images (in a total of six components) for estimating the fractional impervious surfaces.
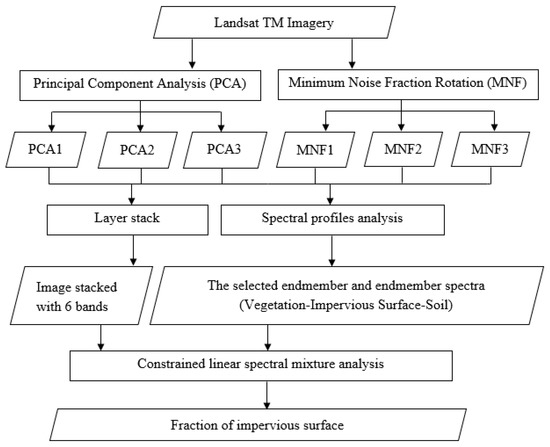
Figure 2.
The flowchart of the proposed method.
3.1. Highlighting Spectral Variances through Statistical Methods
To highlight the spectral variances among land covers on the original remote sensing images, both the PCA and MNF have been applied in this study. PCA is a simple process of extracting the major components from the confusing data and apply them to conduct a change analysis based on the data [44]. The PCA can both reduce the complex dimensionality of original data and keep the major information from the original image. Moreover, it can also minimize the influence of band-to-band correlation. In general, only the first two or three components from the PCA are extracted and used as almost 90% of the spectral variances among land covers are included in the first two or three components which could be applied to separate different land use land-cover types [26]. In this study, the PCA was conducted using the software of ENVI, and the first three PCA components, PCA1, PCA2, PCA3, were extracted and included in further analysis. The MNF transformation is a linear transformation composed of several principal component analysis rotations [45]. It has also been recognized as the cascaded principal component analysis and widely used in enhancing the remote-sensing image. MNF transformation could be conducted by the following steps. First, the noise covariance matrix could be diagonalized by the principal component transformation. Second, an identify matrix was generated by converting the noise covariance matrix in the first step. Third, another principal component analysis was conducted based on the scaled dataset. In this study, the MNF transformation was conducted by using the software of ENVI, and the first three MNF components, MNF1, MNF2, and MNF3, were extracted and applied in a further study.
3.2. Endmember Selection
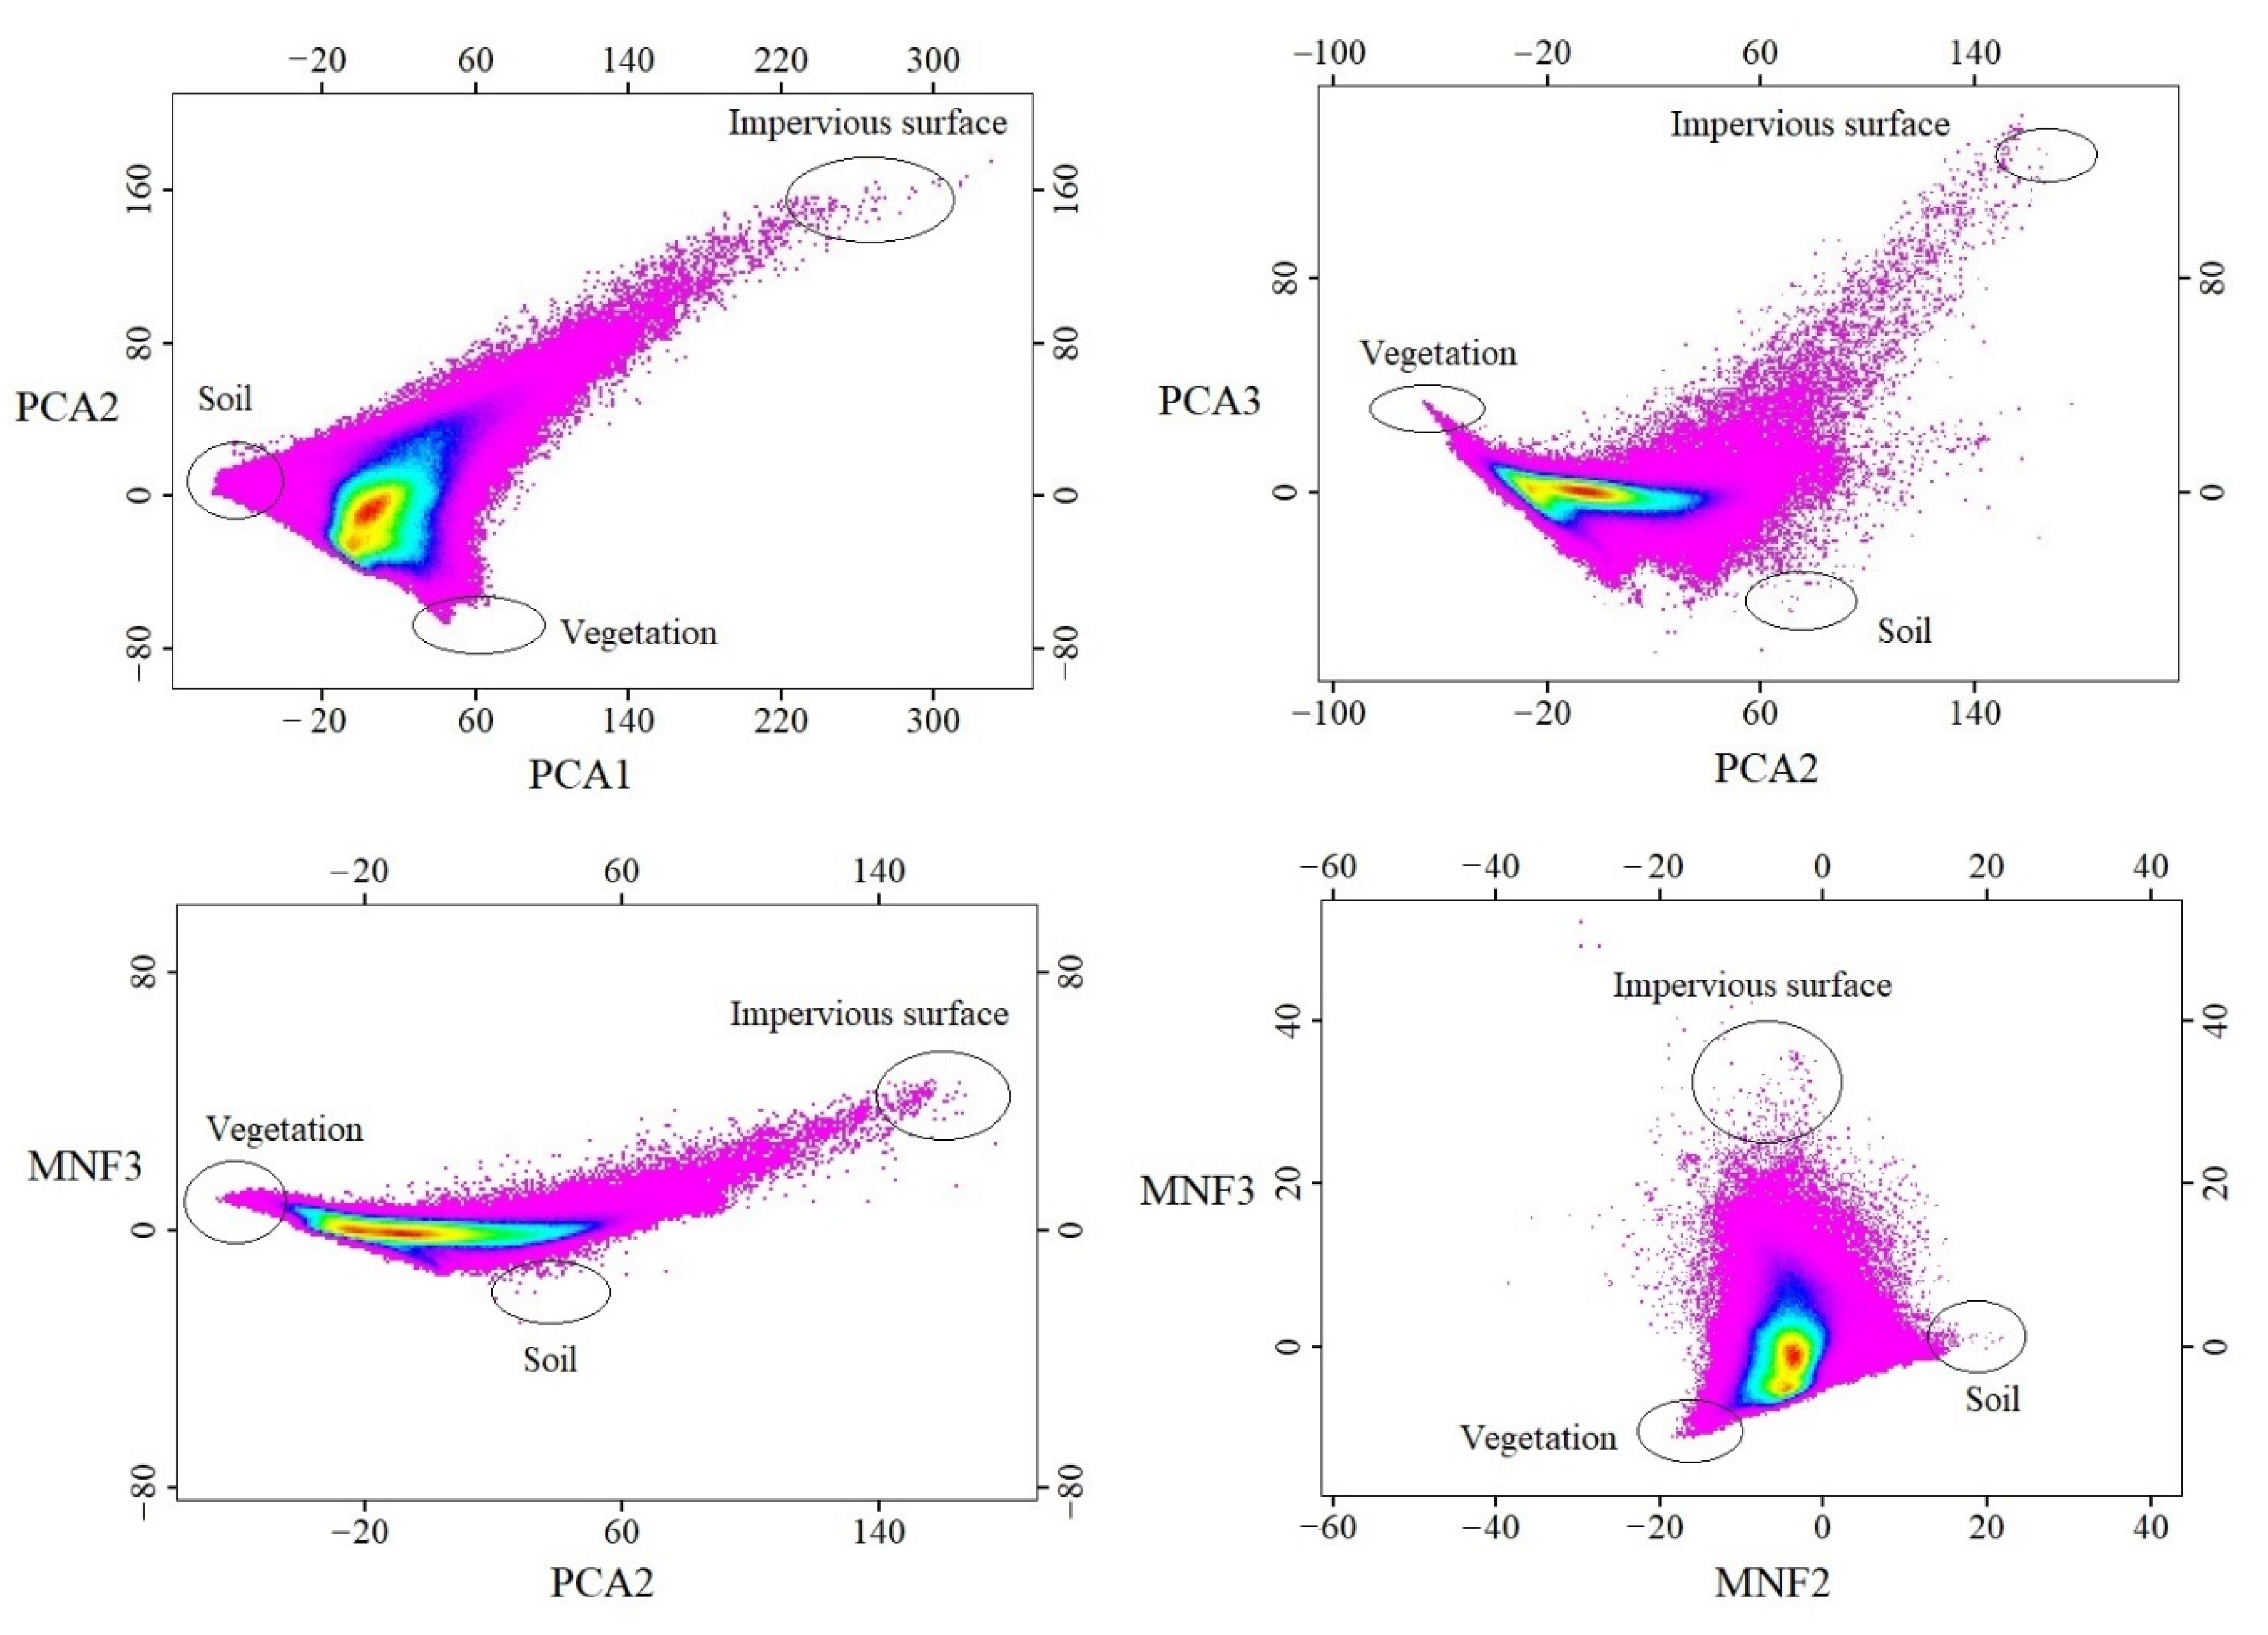
Endmember selection, including the selection of both endmembers and corresponding spectra, is one of the most important steps in spectral mixture analysis. In this study, with the generated scatterplots from the first three components of the PCA and MNF (PCA1, PCA2, PCA3, MNF1, MNF2, and MNF3), endmembers could be identified from the vertices of those feature space plots. In this study, three endmembers including impervious surface, soil, and vegetation were identified. With the identified endmembers, the next step is to extract pure endmember spectra of each identified endmember, 300 pure endmember spectra (100 for each endmember) were collected from the vertices of the generated 2-D scatter plot. To improve the quality of the selected endmember spectra, ground truth data have been obtained and used for verification purposes.
3.3. Fully Constrained Linear Spectral Mixture Analysis
To estimate the fraction of impervious surfaces, a fully constrained spectra mixture analysis was implemented with three identified endmember classes, impervious surface, soil, and vegetation, and the extracted pure spectra of each endmember class. The spectral mixture analysis assumes the spectrum of each pixel is a linear weighted total of the spectra of all various land use/covers, and the fraction of each endmember could be estimated with the least square convolution models. The fully constrained spectral mixture analysis model can be formulated as below.
where Sa is the mixed spectra for the band a of the remote-sensing image; N is the sum number of endmember classes (totally three included in this study, including vegetation, impervious surface, and soil); Ai is the resultant abundance of endmember class i, Si,a is pure spectra of endmember i at band a; ea is the estimation residual.
RMS error was usually applied to evaluate the discrepancy between the projected and reference values. In this study, it has also been included to evaluate the model fitness. The RMS error can be formulated as follows:
where b is the total number of bands in this image which is six for this study.
3.4. Comparative Analysis
For comparative purposes, conventional linear spectral mixture analysis has also been conducted where the original remote sensing image will be used for endmember selection and final unmixing analysis. Specifically, the pure reflectance spectra of all endmember classes were identified and collected from the 2-D scatter plot, and a fully constrained linear spectral mixture analysis was applied to estimate the fractions of the impervious surfaces. To evaluate the performance of the proposed statistical method-based spectral mixture analysis, the high spatial resolution images collected from the American Geographical Society (AGS) Library at the University of Wisconsin Milwaukee were used as reference data.
With the estimated fractional impervious surface from the statistical method-based spectral mixture analysis and the conventional linear spectral mixture analysis, accuracy assessment has been conducted using two widely applied measures, the systematic error (SE), and the mean absolute error (MAE). In particular, the systematic error is used to evaluate the estimated percentage variation between the estimated fractional impervious surface and the referenced fractional impervious surface, SE can reflect the general under or overestimation trend from the proposed method. Mean absolute error is the absolute percentage differences of fractional impervious surfaces between the mapped result and the observed true value, and the MAE reflects the relative mapping error generated by the proposed new method. The SE and MAE could be formulated as below.
where are the fractional impervious surfaces estimated for pixel j, is the reference fractional impervious surfaces generated from the high spatial resolution image for pixel j. M is the sum of all pixels.
In this study, the coefficient of determination has also been calculated to reflect the relationship between the estimated fraction of the impervious surface and the observed fraction of the impervious surface. The coefficient of determination R2 ranges from 0 to 1. If it gets closer to 1, this means better goodness of fit of the observations.
where R2 is the coefficient of determination, SSres is the sum of squares of residuals, SStot is the total sum of squares, A is the mean of the observed fraction of impervious surface value, and n is the number of observed data.
4. Results
4.1. The Spectral Variances Enhanced Images Generated by Principal Component Analysis (PCA) and Minimum Noise Fraction Rotation (MNF)
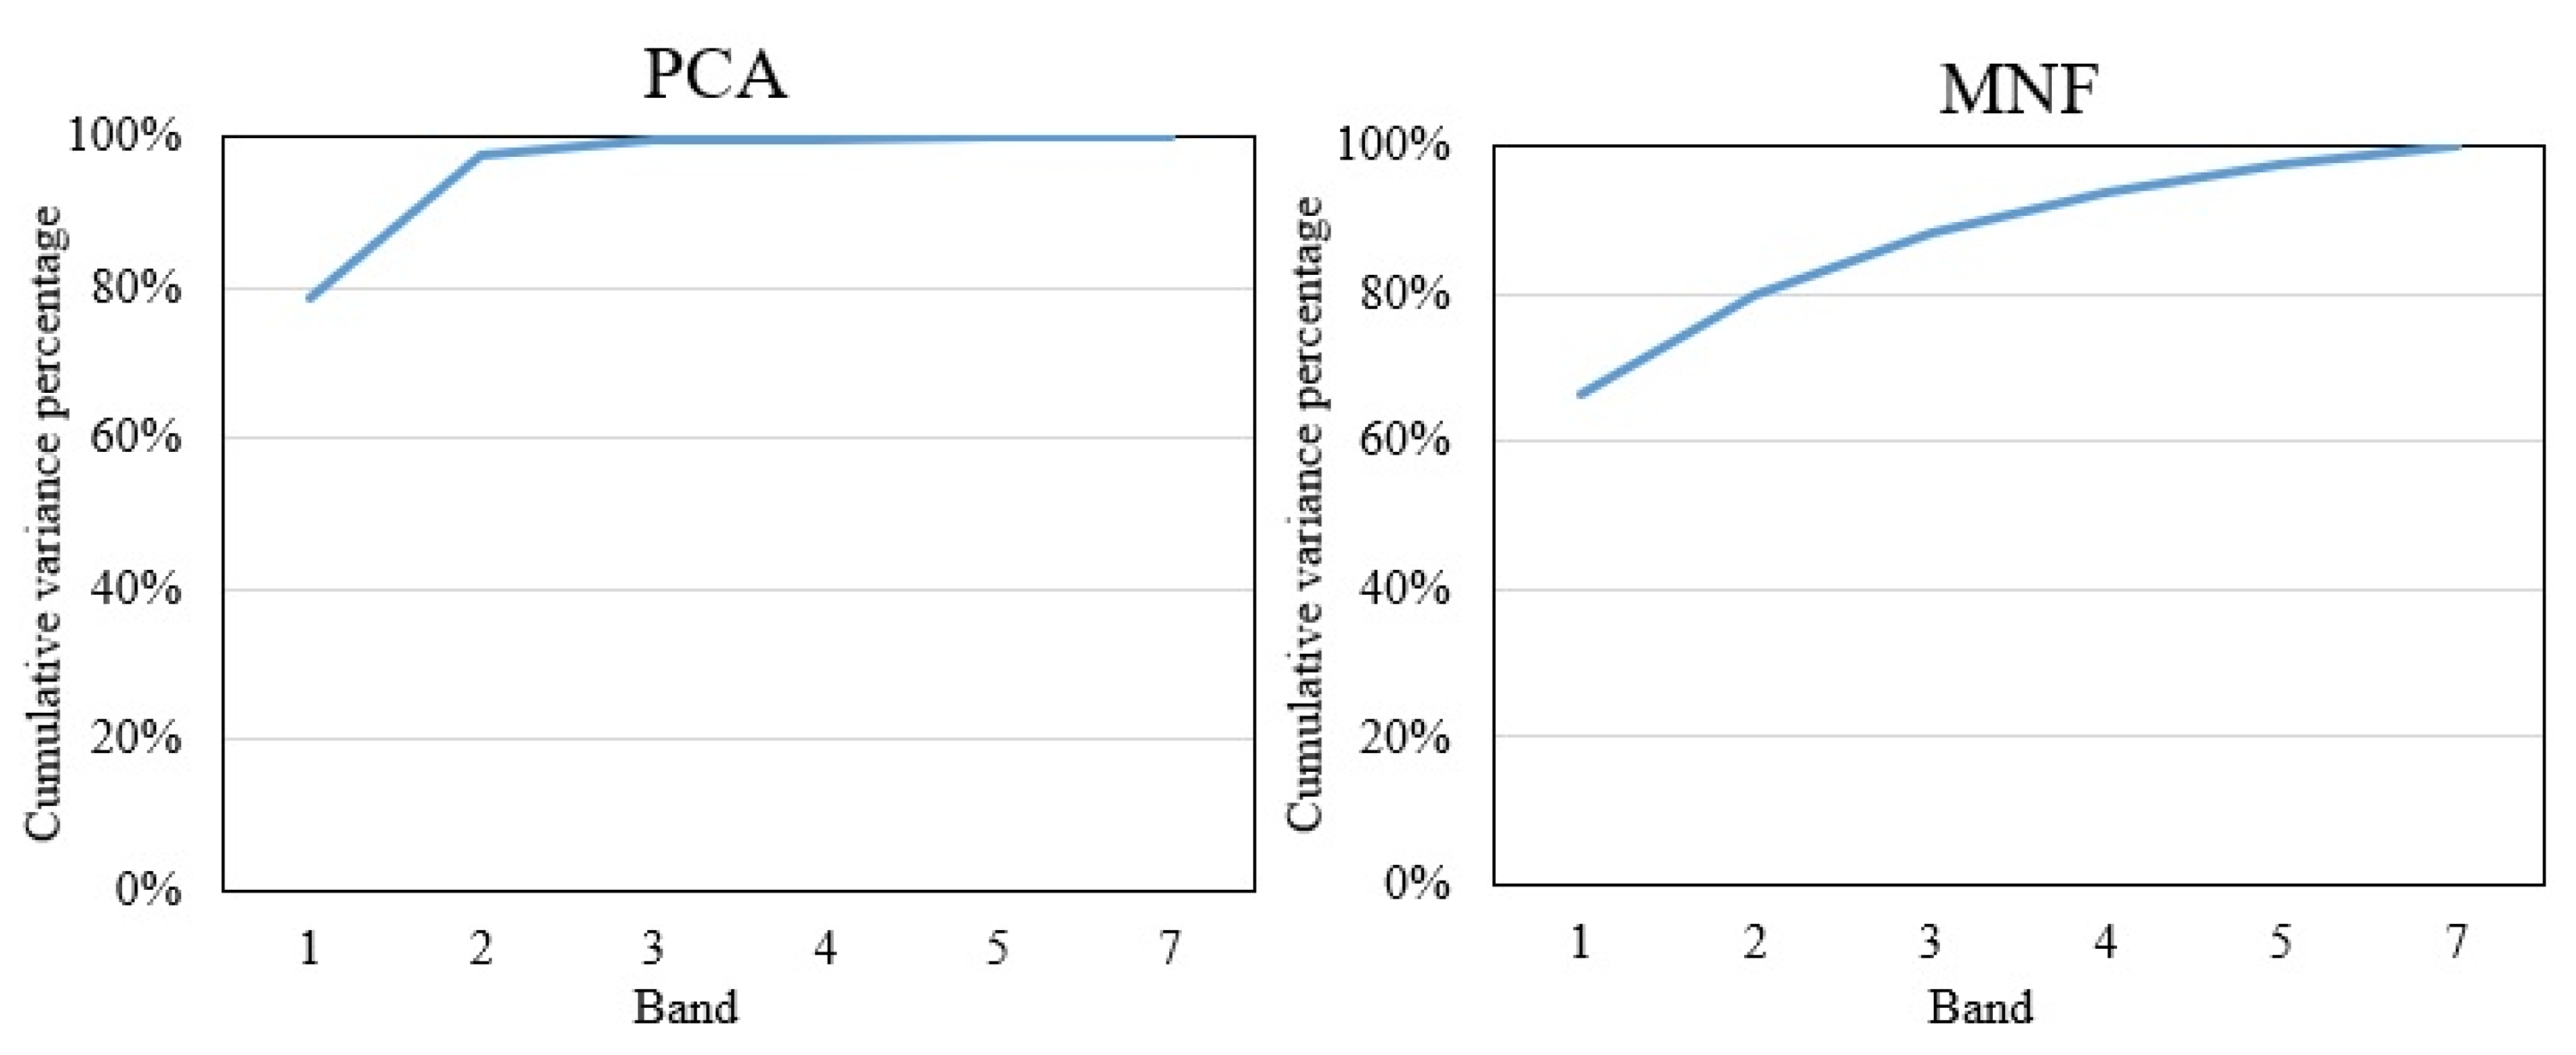
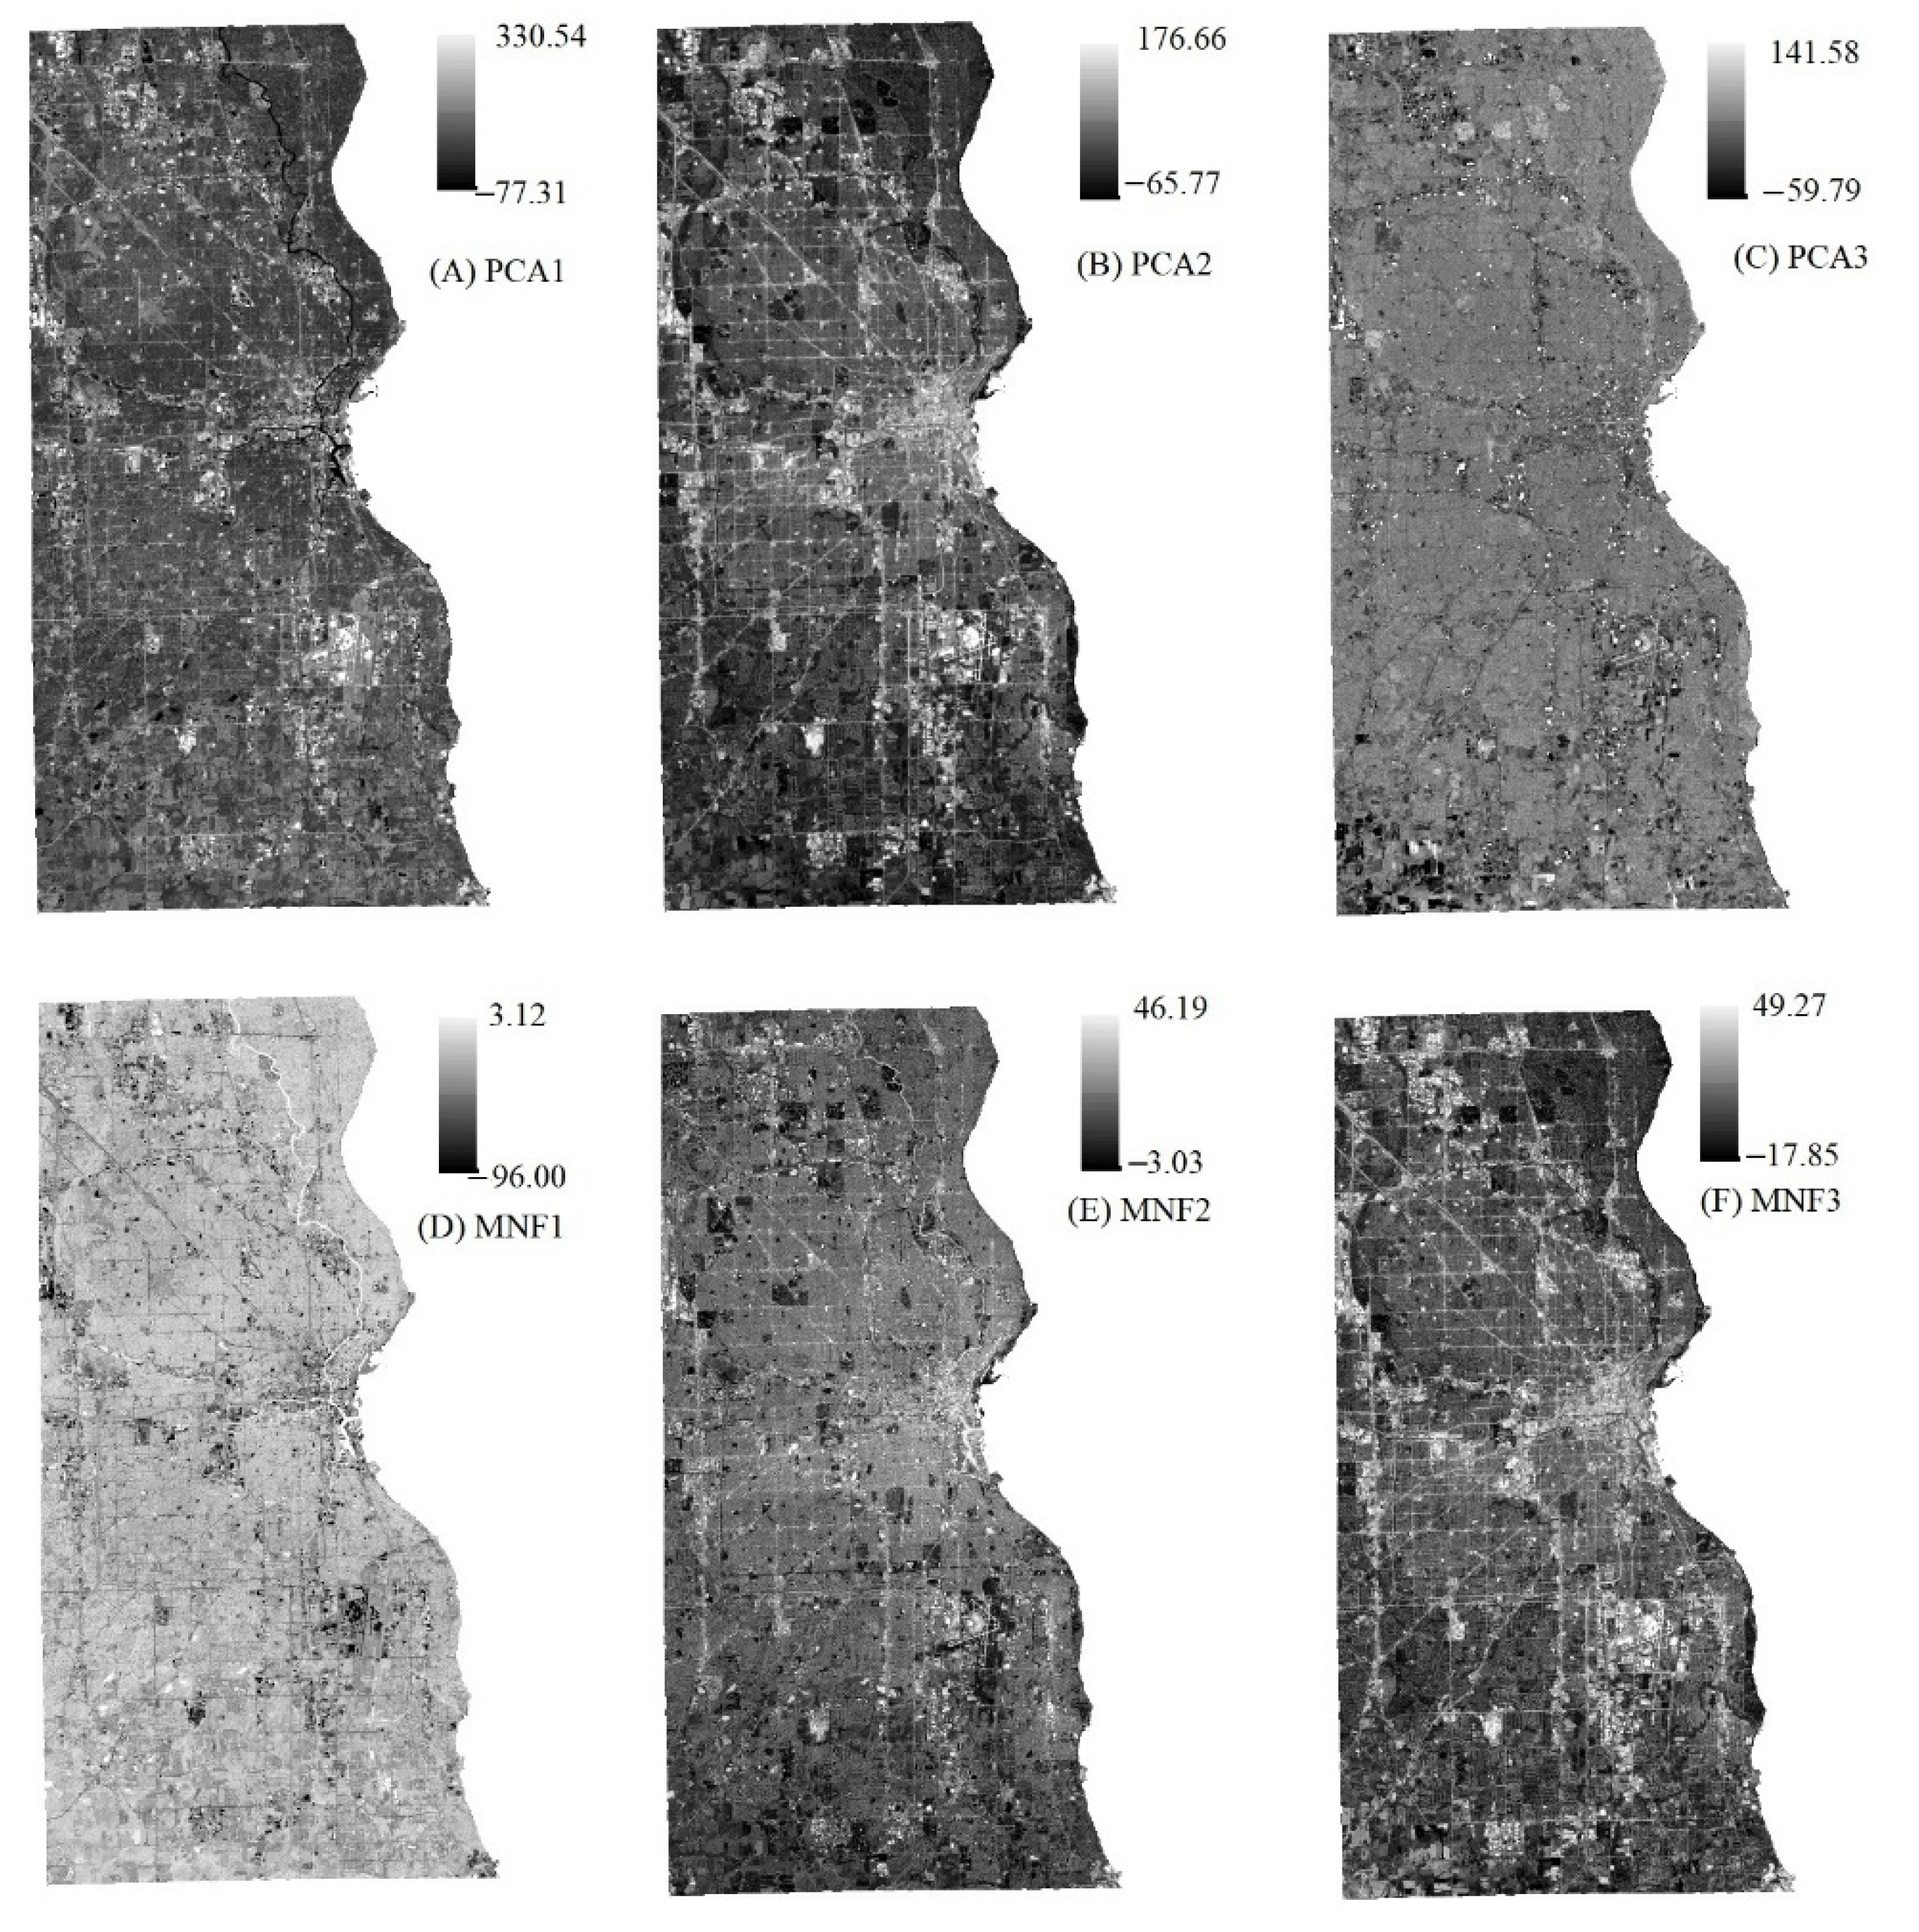
To highlight the spectral variances among land covers on the original images, the PCA and MNF were applied in this study. Figure 3 shows that over 95% of variances are included in the first three components of the PCA, and almost 90% of variances are included in the first three components of the MNF. Figure 4 shows that the first three PCA and MNF components (in a total of 6 components) can successfully display the major land covers, such as urban area, vegetation, and soil of the study area. Specifically, PCA2 and MNF3 illustrate significant spectral contrasts between the built-up and other land covers, and it is critical in recognizing the impervious surfaces. The PCA2 and MNF3 show the major built-up areas of Milwaukee County are distributed in the central east side of Milwaukee County, and the outskirts are covered by scattered built-up areas with a large amount of vegetation coverage. Other PCA and MNF components are also able to show the distribution of vegetation and soil. As we can see, the soil is distributed through the whole study area, and the vegetation (including both natural vegetation and crops) is located predominantly in the southeastern corner of Milwaukee County. With the generated first three components of PCA and MNF, a total of 15 feature space plots were generated using the software of ERDAS IMAGINE, and four of them have been selected and applied for the final endmember selection. Figure 5 shows all three endmembers, impervious surface, vegetation, and soil that could be derived from the plots.
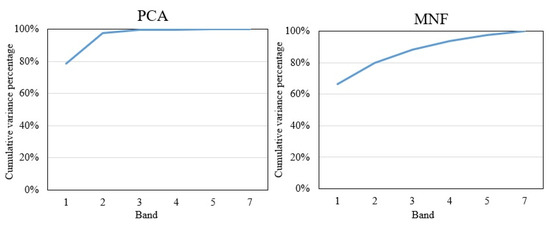
Figure 3.
Cumulative variance percentage of the principal component analysis (PCA) and minimum noise fraction rotation (MNF).

Figure 4.
The first three components generated from each of the statistical analysis methods, PCA and MNF.

Figure 5.
2-D scatter plots generated from the first three components of each of the statistical analysis methods, PCA and MNF.
4.2. Impervious Surface Generated by Integrating Statistical Method and Spectral Mixture Analysis (SMA)
The proposed statistical method based SMA was applied to generate the fraction of impervious surfaces for Milwaukee County (see Figure 6). The mapped impervious surface distributions are consistent with our current knowledge. In particular, high impervious surfaces are predominantly located in Milwaukee City, which is the most populous city and biggest city in both Milwaukee County and Wisconsin State. In addition, medium-sized cities and towns, such as Wauwatosa, Whitefish Bay, Fox Point, and Greendale, are featured at a lower impervious surface fraction. The southeastern part of Milwaukee County has relatively low impervious surface fractions and is mainly covered by vegetation including trees, grasses, and crops.
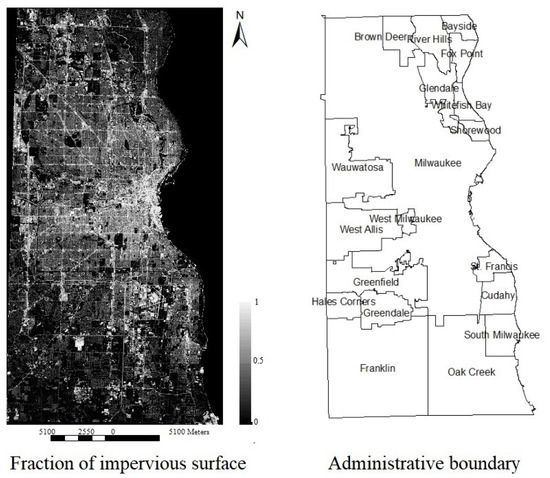
Figure 6.
The fraction of impervious surface generated by the proposed statistical method-based spectral mixture analysis (SMA).
In addition to the visual evaluation, a quantitative analysis has also been applied to assessing the overall performance of the proposed statistical method-based SMA for the whole study area, the developed areas, and the less-developed areas. Stratified random selection has been implemented to generate 200 sample points using the program, ArcGIS (see Figure 7). Moreover, ERDAS IMAGINE has been applied to digitize the impervious surfaces located within each sampled area, and the impervious surface fraction of each sampled area could be calculated using the total area of the digitized impervious surface within the sampled area over the total area of the sampled areas. To evaluate the mapping performance over the whole study area, developed area, and the less developed area, 30% has been applied as the threshold to distinguish the developed and less developed areas. Developed areas are defined as the impervious surface fraction equal to or over 30%, and the less-developed areas are defined as the impervious surface fraction is less than 30%. The 30% threshold is decided according to the National Land Cover Database (NLCD) definition of the developed lands. Three measures, SE, MAE, and R2 were calculated, and the results are reported in Table 1. Research results show that the proposed method has received a promising performance with an SE of −3.45%, an MAE of 11.52%, and R2 of 0.85. Much better performance has been found in less developed areas than the developed areas with the SE of 4.12% vs. −7.31% and MAE of 8.56% vs. 12.13%. In addition, overestimation of impervious surfaces in less-developed areas and underestimation of impervious surfaces could be detected in this study.

Figure 7.
Sample points over the study area.

Table 1.
Accuracy assessment of impervious surfaces derived with the proposed method and conventional SMA.
4.3. Comparative Analysis
For comparative purposes, the conventional linear spectral mixture analysis has also been implemented. The mapped results show that the generated impervious surface map has similar spatial patterns to the map from the proposed new method. In particular, a reasonably high fractional impervious surface is located on the middle west side of Lake Michigan, and it is surrounded by medium-level fractional impervious surfaces. The less urbanized area located in the southeastern part is covered by low-level imperious surface fractions. Visual examination shows similar estimation results generated by the proposed new method and the conventional linear spectral mixture analysis. Therefore, quantitative analysis and comparisons have been conducted as well. The estimation accuracy of the impervious surface from both statistical-based SMA and conventional SMA is included in Table 1. It indicates that the performance of the conventional SMA is worse than the proposed statistical method-based SMA, with a SE of −3.94% (vs. −3.45%) and an MAE of 12.74% (vs. 11.52%). Moreover, R2 also shows a better performance has been achieved by the proposed statistical method-based SMA with an R2 of 0.85 vs. 0.78. Detailed analysis shows that an underestimation can be found in the developed areas with significantly lower values of SE (−8.26% vs. −7.31%), and higher values of MAE (13.53% vs. 12.13%). For the less-developed areas, a comparable performance has been achieved by the proposed statistical method based SMA and the conventional SMA, and only a slightly better performance was achieved with the conventional SMA method with the SE of 4.01% (vs. 4.12%) and the MAE of 7.96% (vs. 8.56%). Moreover, compared with the conventional SMA, the estimation error was reduced by the proposed statistical method-based SMA. It shows that, with the proposed statistical method based SMA, the systematic error of the estimated impervious surfaces has been reduced by 14.20% for the whole study area and by 12.99% for the developed areas. In terms of the mean absolute error of the mapped impervious surface, it has been reduced by 10.59% and 11.54% for the whole study area and developed areas, respectively.
5. Conclusions and Future Research Direction
5.1. Conclusions
Impervious surfaces are a very important component of urbanized areas, and several methods have been proposed and applied for mapping urban impervious surfaces. However, if there is only a limited spectral variance available among land covers from the original remote-sensing images, estimation error will exist no matter whether advanced methods are proposed and applied. In this study, we started by highlighting the spectral variances among land covers from original remote sensing images using traditional statistical methods, principal component analysis, and minimum noise fraction rotation. Then, three endmembers, vegetation, impervious surface, and soil, were identified and selected based on the 2-D spectral plots generated by the first three components of each statistical analysis method, PCA and MNF. Finally, the first three components from the PCA and MNF (a total of six components) were stacked, and the fully constrained linear spectral mixture analysis was applied to map the fraction of impervious surfaces.
The visual and quantitative analysis results show that: (1) the high fraction of impervious surface was distributed in the City of Milwaukee as it is the largest and most populous city in Milwaukee County and Wisconsin State, the medium fraction of impervious surfaces was located in the nearby smaller cities or towns, such as Wauwatosa, Whitefish Bay, and Glendale. The low fraction of impervious surface is located in the southeastern part of Milwaukee County, which is predominantly covered by vegetation. (2) The quantitative analysis results show a good performance has been achieved by the proposed method with an overall SE of −3.45% and MAE of 11.52%. Detailed analysis results also in better performance in the less-developed areas with SE of 4.12% and MAE of 8.56% than the developed areas with SE of −7.31% and MAE of 12.13%. (3) Comparative analysis results indicate that the proposed statistical method-based SMA can successfully improve the estimation of urban impervious surfaces.
5.2. Future Research Direction
While this study has successfully improved the estimation of impervious surfaces by highlighting the spectral variances among land covers from the original remote-sensing images, there are still some issues it has not considered, such as the endmember variability issue. The land-use classes may distribute scientifically differently by space because of the spatial heterogeneity of landscapes, and fixed endmember classes adopted in the unmixing analysis process may result in estimation error. In addition, the endmember spectra may also be different spatially. For instance, an impervious surface may appear bright, medium, or dark as it may be composed of different materials, such as basalt, plastic, cement, and etc. Therefore, it is critical to investigate and develop a new method to address the issue of endmember variability. Moreover, this study only compared the performance of the proposed statistical method-based SMA with conventional SMA. In fact, lots of advanced techniques, such as machine learning and artificial neural networks, are available and widely used for classification work. Therefore, another research direction could be comparing the proposed statistical method-based SMA with other advanced techniques. In addition, both PCA and MNF have been applied in this study for improving the fractional impervious surfaces. However, the differences in the contributions that PCA and MNF make to the improvement of fractional impervious surface mapping are not clear in this study. Therefore, further investigation is needed in future research.
Funding
This research was supported by the New Faculty Grant from the University of North Carolina at Greensboro.
Institutional Review Board Statement
Not applicable.
Informed Consent Statement
Not applicable.
Data Availability Statement
Not applicable.
Acknowledgments
I would like to acknowledge the anonymous reviewers for their constructive and valuable suggestions on the earlier drafts of this manuscript.
Conflicts of Interest
The author declares no conflict of interest.
References
- United Nations. World Urbanization Prospects: 2020 Revision. Affairs UDoEaS, Ed.; 2020. Available online: https://population.un.org/wpp/Download/Standard/Population/ (accessed on 15 January 2021).
- Cai, J.; Li, X.; Liu, L.; Chen, Y.; Wang, X.; Lu, S. Coupling and coordinated development of new urbanization and agro-ecological environment in China. Sci. Total Environ. 2021, 776, 145837. [Google Scholar] [CrossRef]
- Gross, J.; Ouyang, Y. Types of urbanization and economic growth. Int. J. Urban Sci. 2021, 25, 71–85. [Google Scholar] [CrossRef]
- Egidi, G.; Salvati, L.; Falcone, A.; Quaranta, G.; Salvia, R.; Vcelakova, R.; Giménez-Morera, A. Re-Framing the Latent Nexus between Land-Use Change, Urbanization and Demographic Transitions in Advanced Economies. Sustainability 2021, 13, 533. [Google Scholar] [CrossRef]
- Egidi, G.; Salvati, L.; Vinci, S. The long way to tipperary: City size and worldwide urban population trends, 1950–2030. Sustain. Cities Soc. 2020, 60, 102148. [Google Scholar] [CrossRef]
- Supriyadi, A.; Wang, T.; Chu, S.; Ma, T.; Shaumirahman, R.G.; Cirella, G.T. Urbanization and Population Change: Banjar Municipality. In Sustainable Human–Nature Relations: Environmental Scholarship, Economic Evaluation, Urban Strategies; Cirella, G.T., Ed.; Springer Singapore: Singapore, 2020; pp. 205–223. [Google Scholar] [CrossRef]
- Javanbakht, M.; Boloorani, A.D.; Kiavarz, M.; Samany, N.N.; Zebardast, L.; Zangiabadi, M. Spatial-temporal analysis of urban environmental quality of Tehran, Iran. Ecol. Indic. 2021, 120, 106901. [Google Scholar] [CrossRef]
- Wu, W.; Li, C.; Liu, M.; Hu, Y.; Xiu, C. Change of impervious surface area and its impacts on urban landscape: An example of Shenyang between 2010 and 2017. Ecosyst. Health Sustain. 2020, 6, 1767511. [Google Scholar] [CrossRef]
- Greiner, P.T.; Shtob, D.A.; Besek, J.F. Is Urbanization Good for the Climate? A Cross-County Analysis of Impervious Surface, Affluence, and the Carbon Intensity of Well-Being. Socius 2020, 6. [Google Scholar] [CrossRef]
- Zhou, Y.; Chen, M.; Tang, Z.; Mei, Z. Urbanization, land use change, and carbon emissions: Quantitative assessments for city-level carbon emissions in Beijing-Tianjin-Hebei region. Sustain. Cities Soc. 2021, 66, 102701. [Google Scholar] [CrossRef]
- Anand, V.; Oinam, B. Future land use land cover prediction with special emphasis on urbanization and wetlands. Remote Sens. Lett. 2020, 11, 225–234. [Google Scholar] [CrossRef]
- Brabec, E.; Schulte, S.; Richards, P.L. Impervious surfaces and water quality: A review of current literature and its implications for watershed planning. J. Plan. Lit. 2002, 16, 499–514. [Google Scholar] [CrossRef]
- Brun, S.E.; Band, L.E. Simulating runoff behavior in an urbanizing watershed. Comput. Environ. Urban Syst. 2000, 24, 5–22. [Google Scholar] [CrossRef]
- Weng, Q.H. Modeling urban growth effects on surface runoff with the integration of remote sensing and GIS. Environ. Manag. 2001, 28, 737–748. [Google Scholar] [CrossRef] [PubMed]
- Weng, Q.H. Remote sensing of impervious surfaces: An overview. In Remote Sensing of Impervious Surfaces; Weng, Q.H., Ed.; CRC Press: Boca Raton, FL, USA, 2007; pp. XV–XXVI. [Google Scholar]
- Wang, Z.; Zhang, S.; Peng, Y.; Wu, C.; Lv, Y.; Xiao, K.; Zhao, J.; Qian, G. Impact of rapid urbanization on the threshold effect in the relationship between impervious surfaces and water quality in shanghai, China. Environ. Pollut. 2020, 267, 115569. [Google Scholar] [CrossRef] [PubMed]
- Ma, Y.; Zhang, S.; Yang, K.; Li, M. Influence of spatiotemporal pattern changes of impervious surface of urban megaregion on thermal environment: A case study of the Guangdong – Hong Kong – Macao Greater Bay Area of China. Ecol. Indic. 2021, 121, 107106. [Google Scholar] [CrossRef]
- Gluch, R.; Quattrochi, D.A.; Luvall, J.C. A multi-scale approach to urban thermal analysis. Remote Sens. Environ. 2006, 104, 123–132. [Google Scholar] [CrossRef]
- Imhoff, M.L.; Zhang, P.; Wolfe, R.E.; Bounoua, L. Remote sensing of the urban heat island effect across biomes in the continental USA. Remote Sens. Environ. 2010, 114, 504–513. [Google Scholar] [CrossRef] [Green Version]
- Yuan, F.; Bauer, M.E. Comparison of impervious surface area and normalized difference vegetation index as indicators of surface urban heat island effects in Landsat imagery. Remote Sens. Environ. 2007, 106, 375–386. [Google Scholar] [CrossRef]
- Zhang, H.; Li, T.-T.; Liu, Y.; Han, J.-J.; Guo, Y.-J. Understanding the contributions of land parcel features to intra-surface urban heat island intensity and magnitude: A study of downtown Shanghai, China. Land Degrad. Dev. 2021, 32, 1353–1367. [Google Scholar] [CrossRef]
- Li, L.; Zha, Y.; Wang, R. Relationship of surface urban heat island with air temperature and precipitation in global large cities. Ecol. Indic. 2020, 117, 106683. [Google Scholar] [CrossRef]
- Arnold, C.L.; Gibbons, C.J. Impervious surface coverage-The emergence of a key environmental indicator. J. Am. Plan. Assoc. 1996, 62, 243–258. [Google Scholar] [CrossRef]
- Huang, C.; Townshend, J. A stepwise regression tree for nonlinear approximation: Applications to estimating subpixel land cover. Int. J. Remote Sens. 2003, 24, 75–90. [Google Scholar] [CrossRef]
- Weng, Q.; Hu, X.; Lu, D. Extracting impervious surfaces from medium spatial resolution multispectral and hyperspectral imagery: A comparison. Int. J. Remote Sens. 2008, 29, 3209–3232. [Google Scholar] [CrossRef]
- Wu, C.; Murray, A.T. Estimating impervious surface distribution by spectral mixture analysis. Remote Sens. Environ. 2003, 84, 493–505. [Google Scholar] [CrossRef]
- Wu, C. Quantifying high-resolution impervious surfaces using spectral mixture analysis. Int. J. Remote Sens. 2009, 30, 2915–2932. [Google Scholar] [CrossRef]
- Zhang, X.; Liu, L.; Wu, C.; Chen, X.; Gao, Y.; Xie, S.; Zhang, B. Development of a global 30 m impervious surface map using multisource and multitemporal remote sensing datasets with the Google Earth Engine platform. Earth Syst. Sci. Data 2020, 12, 1625–1648. [Google Scholar] [CrossRef]
- Li, G.; Li, L.; Lu, D.; Guo, W.; Kuang, W. Mapping impervious surface distribution in China using multi-source remotely sensed data. GIScience Remote Sens. 2020, 57, 543–552. [Google Scholar] [CrossRef]
- Foody, G.M.; Cox, D.P. Sub-pixel land cover composition estimation using a linear mixture model and fuzzy membership functions. Int. J. Remote Sens. 1994, 15, 619–631. [Google Scholar] [CrossRef]
- Lu, D. Comparison of Land-Cover Classification Methods in the Brazilian Amazon Basin. Photogramm. Eng. Remote Sens. 2004, 70, 723–731. [Google Scholar] [CrossRef] [Green Version]
- Shanmugam, P.; Ahn, Y.-H.; Sanjeevi, S. A comparison of the classification of wetland characteristics by linear spectral mixture modelling and traditional hard classifiers on multispectral remotely sensed imagery in southern India. Ecol. Model. 2006, 194, 379–394. [Google Scholar] [CrossRef]
- Sarapirome, S.; Kulrat, C. Comparison on urban classifications using Landsat TM and linear spectral mixture analysis extracted images: Nakhon ratchasima municipal area, Thailand. Suranaree J. Sci. Technol. 2010, 17, 401–411. [Google Scholar]
- Goetz, S.; Fiske, G. Linking the diversity and abundance of stream biota to landscapes in the mid-Atlantic USA. Remote Sens. Environ. 2008, 112, 4075–4085. [Google Scholar] [CrossRef]
- Ranta, E.; Vidal-Abarca, M.R.; Calapez, A.R.; Feio, M.J. Urban stream assessment system (UsAs): An integrative tool to assess biodiversity, ecosystem functions and services. Ecol. Indic. 2021, 121, 106980. [Google Scholar] [CrossRef]
- Wu, C. Normalized spectral mixture analysis for monitoring urban composition using ETM+ imagery. Remote Sens. Environ. 2004, 93, 480–492. [Google Scholar] [CrossRef]
- Roberts, D.A.; Gardner, M.; Church, R.; Ustin, S.; Scheer, G.; Green, R.O. Mapping chaparral in the Santa Monica Mountains using multiple endmember spectral mixture models. Remote Sens. Environ. 1998, 65, 267–279. [Google Scholar] [CrossRef]
- Chang, C.I.; Ji, B.H. Weighted abundance-constrained linear spectral mixture analysis. IEEE Trans. Geosci. Remote Sens. 2006, 44, 378–388. [Google Scholar] [CrossRef]
- Deng, C.; Wu, C. A spatially adaptive spectral mixture analysis for mapping subpixel urban impervious surface distribution. Remote Sens. Environ. 2013, 133, 62–70. [Google Scholar] [CrossRef]
- Li, W.; Wu, C. Phenology-based temporal mixture analysis for estimating large-scale impervious surface distributions. Int. J. Remote Sens. 2014, 35, 779–795. [Google Scholar] [CrossRef]
- Deng, C.; Lin, W. Day and night synergy to improve subpixel urban impervious surface mapping in desert environments at 30-m Landsat resolution. Int. J. Remote Sens. 2020, 41, 9588–9605. [Google Scholar] [CrossRef]
- Tang, Y.; Shao, Z.; Huang, X.; Cai, B. Mapping Impervious Surface Areas Using Time-Series Nighttime Light and MODIS Imagery. Remote Sens. 2021, 13, 1900. [Google Scholar] [CrossRef]
- Schug, F.; Frantz, D.; Okujeni, A.; van der Linden, S.; Hostert, P. Mapping urban-rural gradients of settlements and vegetation at national scale using Sentinel-2 spectral-temporal metrics and regression-based unmixing with synthetic training data. Remote Sens. Environ. 2020, 246, 111810. [Google Scholar] [CrossRef]
- Wold, S.; Esbensen, K.; Geladi, P. Principal component analysis. Chemom. Intell. Lab. Syst. 1987, 2, 37–52. [Google Scholar] [CrossRef]
- Dadon, A.; Ben-Dor, E.; Karnieli, A. Use of Derivative Calculations and Minimum Noise Fraction Transform for Detecting and Correcting the Spectral Curvature Effect (Smile) in Hyperion Images. IEEE Trans. Geosci. Remote Sens. 2010, 48, 2603–2612. [Google Scholar] [CrossRef]
- Gao, F.; Masek, J.; Wolfe, R. Automated registration and orthorectification package for Landsat and Landsat-like data processing. J. Appl. Remote Sens. 2009, 3, 033515. [Google Scholar]

Publisher’s Note: MDPI stays neutral with regard to jurisdictional claims in published maps and institutional affiliations. |
© 2021 by the author. Licensee MDPI, Basel, Switzerland. This article is an open access article distributed under the terms and conditions of the Creative Commons Attribution (CC BY) license (https://creativecommons.org/licenses/by/4.0/).