Article

Interpretation of Spectral LiDAR Backscattering off the Florida Coast

1
NASA Goddard Space Flight Center, Ocean Biology Processing Group, Greenbelt, MD 20771, USA
2
Science Systems and Applications Inc. (SSAI), Lanham, MD 20706, USA
3
Ocean Visibility and Optics Laboratory, Harbor Branch Oceanographic Institute, Florida Atlantic University, Fort Pierce, FL 5600, USA
4
Indian River Lagoon Observatory, Harbor Branch Oceanographic Institute, Florida Atlantic University, Fort Pierce, FL 5600, USA
*
Author to whom correspondence should be addressed.
Remote Sens. 2021, 13(13), 2475; https://doi.org/10.3390/rs13132475
Submission received: 27 May 2021 / Accepted: 19 June 2021 / Published: 25 June 2021
(This article belongs to the Special Issue Monitoring Aquatic Environments Using LiDAR)

Abstract

:
A multispectral backscattering LiDAR (Light detection and range) system (hereafter Oculus) was integrated into a wave glider and used to estimate the scattering order (i.e., single vs multiple collisions) of LIDAR backscattering, the water inherent optical properties (IOPs), the biogeo-chemical characteristics of particulate scatterers (i.e., relative size, composition) and their motion) on shelf waters of South East Florida. Oculus has a dual-wavelength configuration (473 and 532 nm) and two detection geometries (off- and on-axis). Characteristics of scatterers were investigated based on two complementary LiDAR-derived proxies (the Structural Dissimilarity Index and the spectral slope of LiDAR backscattering). In March 2017, field measurements showed a covariation between direct and diffuse backscattering contributions during morning hours and away from shore. LiDAR attenuation coefficients explained up to 57% of IOPs variability. The analysis of LiDAR-derived proxies suggested higher turbidity and larger particulates near the coast

1. Introduction

The characterization of underwater scatterers based on light and range detection (LiDAR) measurements has been fundamental in studies related to the mapping of turbidity plumes [1] and thin scattering layers [2]. The main finding of these contributions was the differentiation of scattering layers in terms of vertical (e.g., nepheloid vs water column) and horizontal distributions (e.g., plankton patchiness). In that regard, the composition of scattering layers has been largely unknown for more than one decade due in part to the poor spectral resolution of LiDAR systems for water applications. To cope with this limitation, different techniques based on hybrid information (e.g., spectral reflectance and LiDAR backscattering) [3], relationships between optical properties derived from LiDAR waveforms [4], spatial statistics of LiDAR backscattering magnitude [5], signal thresholds (e.g., detection of fish schools) [6] and complementary use of hydrodynamic model simulations (e.g., Langmuir cells) [7] have been reported.
The accurate detection and identification of relatively large scatterers (i.e., size parameter = π D/λ >> 1, where D is the scatterer diameter and λ is the wavelength) [8] highly relies on how well the ‘background’ scattering of the optical medium is removed. This baseline signal is determined by the inherent optical properties (IOPs) of the waters under investigation and is critical for optimizing LiDAR-based imagers of underwater features [9]. Also, LiDAR-derived IOPs (e.g., beam attenuation coefficient, c) can be used in models for estimating signal scattering orders (i.e., single vs multiple collisions) [10] and apparent optical properties (e.g., Kd or diffuse attenuation coefficient of downwelling irradiance, Table 1) needed on image denoising [4].
The use of autonomous robotic platforms such as gliders has major potential for mapping large-scale (i.e., 500 km) distributions of optical properties (e.g., total backscattering coefficient (bb)) and derived biogeo-optical variables (e.g., chlorophyll-a concentration, phytoplankton composition) in marine waters at high spatial resolution (i.e., cm) [11]. Despite their scientific value, these glider-based optical determinations may be influenced by the light field (e.g., upward measurements near the surface during daytime) and glider-associated turbulence. Likewise, existing glider-based optical sensors do not provide range-resolved information and are unable to distinguish relatively large scatterers.
Here, a multi-FOV (Field-Of-View) and dual-wavelength LiDAR system (hereafter Oculus, Figure 1) is evaluated for characterizing IOPs and large scatterers in shelf waters of SE Florida. Oculus was developed for NOAA (National Oceanic and Atmospheric Administration) for studying the behavior of marine life and can be deployed in wave gliders (i.e., wave-propelled robotic platforms) [12]. The main advantages of using Oculus for detecting and discriminating scatterers are high spatial/temporal resolution (i.e., 100 waveforms per s, vertical resolution = 5.625 cm) [10] and the existence of two receivers (on- and off-axis) for estimating direct and diffuse scattering contributions to the total backscattering signal.
This study has three main goals: (1) to determine diel changes of direct and diffuse scattering components with respect to the distance to the shore, (2) to examine relationships between LiDAR optical properties (e.g., LiDAR or system attenuation coefficient, Ksys) and IOPs for shelf waters of South Florida having a wide range of turbidity (i.e., range of c at a wavelength of 532 nm 0.02–0.5 m−1), and (3) to evaluate two LiDAR-based and complementary proxies (the Structural Dissimilarity Index, SDI [13] and the spectral slope of LiDAR backscattering, mk [14] for discriminating different scatterers in terms of motion, relative size and composition. This contribution is organized into three main sections. In Section 1, LiDAR scattering contributions (direct and diffuse) are estimated based on Independent Component Analysis (ICA) [15] of waveforms arriving to off- and on-axis receivers. Also, the variability of these contributions in our study area was interpreted with respect to environmental factors. In Section 2, Oculus-derived Ksys values were related to c and total absorption coefficients (a) in relatively clear and turbid waters (i.e., ~c H = 3 optical depths, where H is the water depth in m). Lastly in Section 3, scatterers were classified based on 2-D structure patterns (spatial and temporal) and spectral backscattering changes linked to particle size spectra and organic/inorganic content of suspended particulates.

2. Materials and Methods

2.1. The LiDAR System

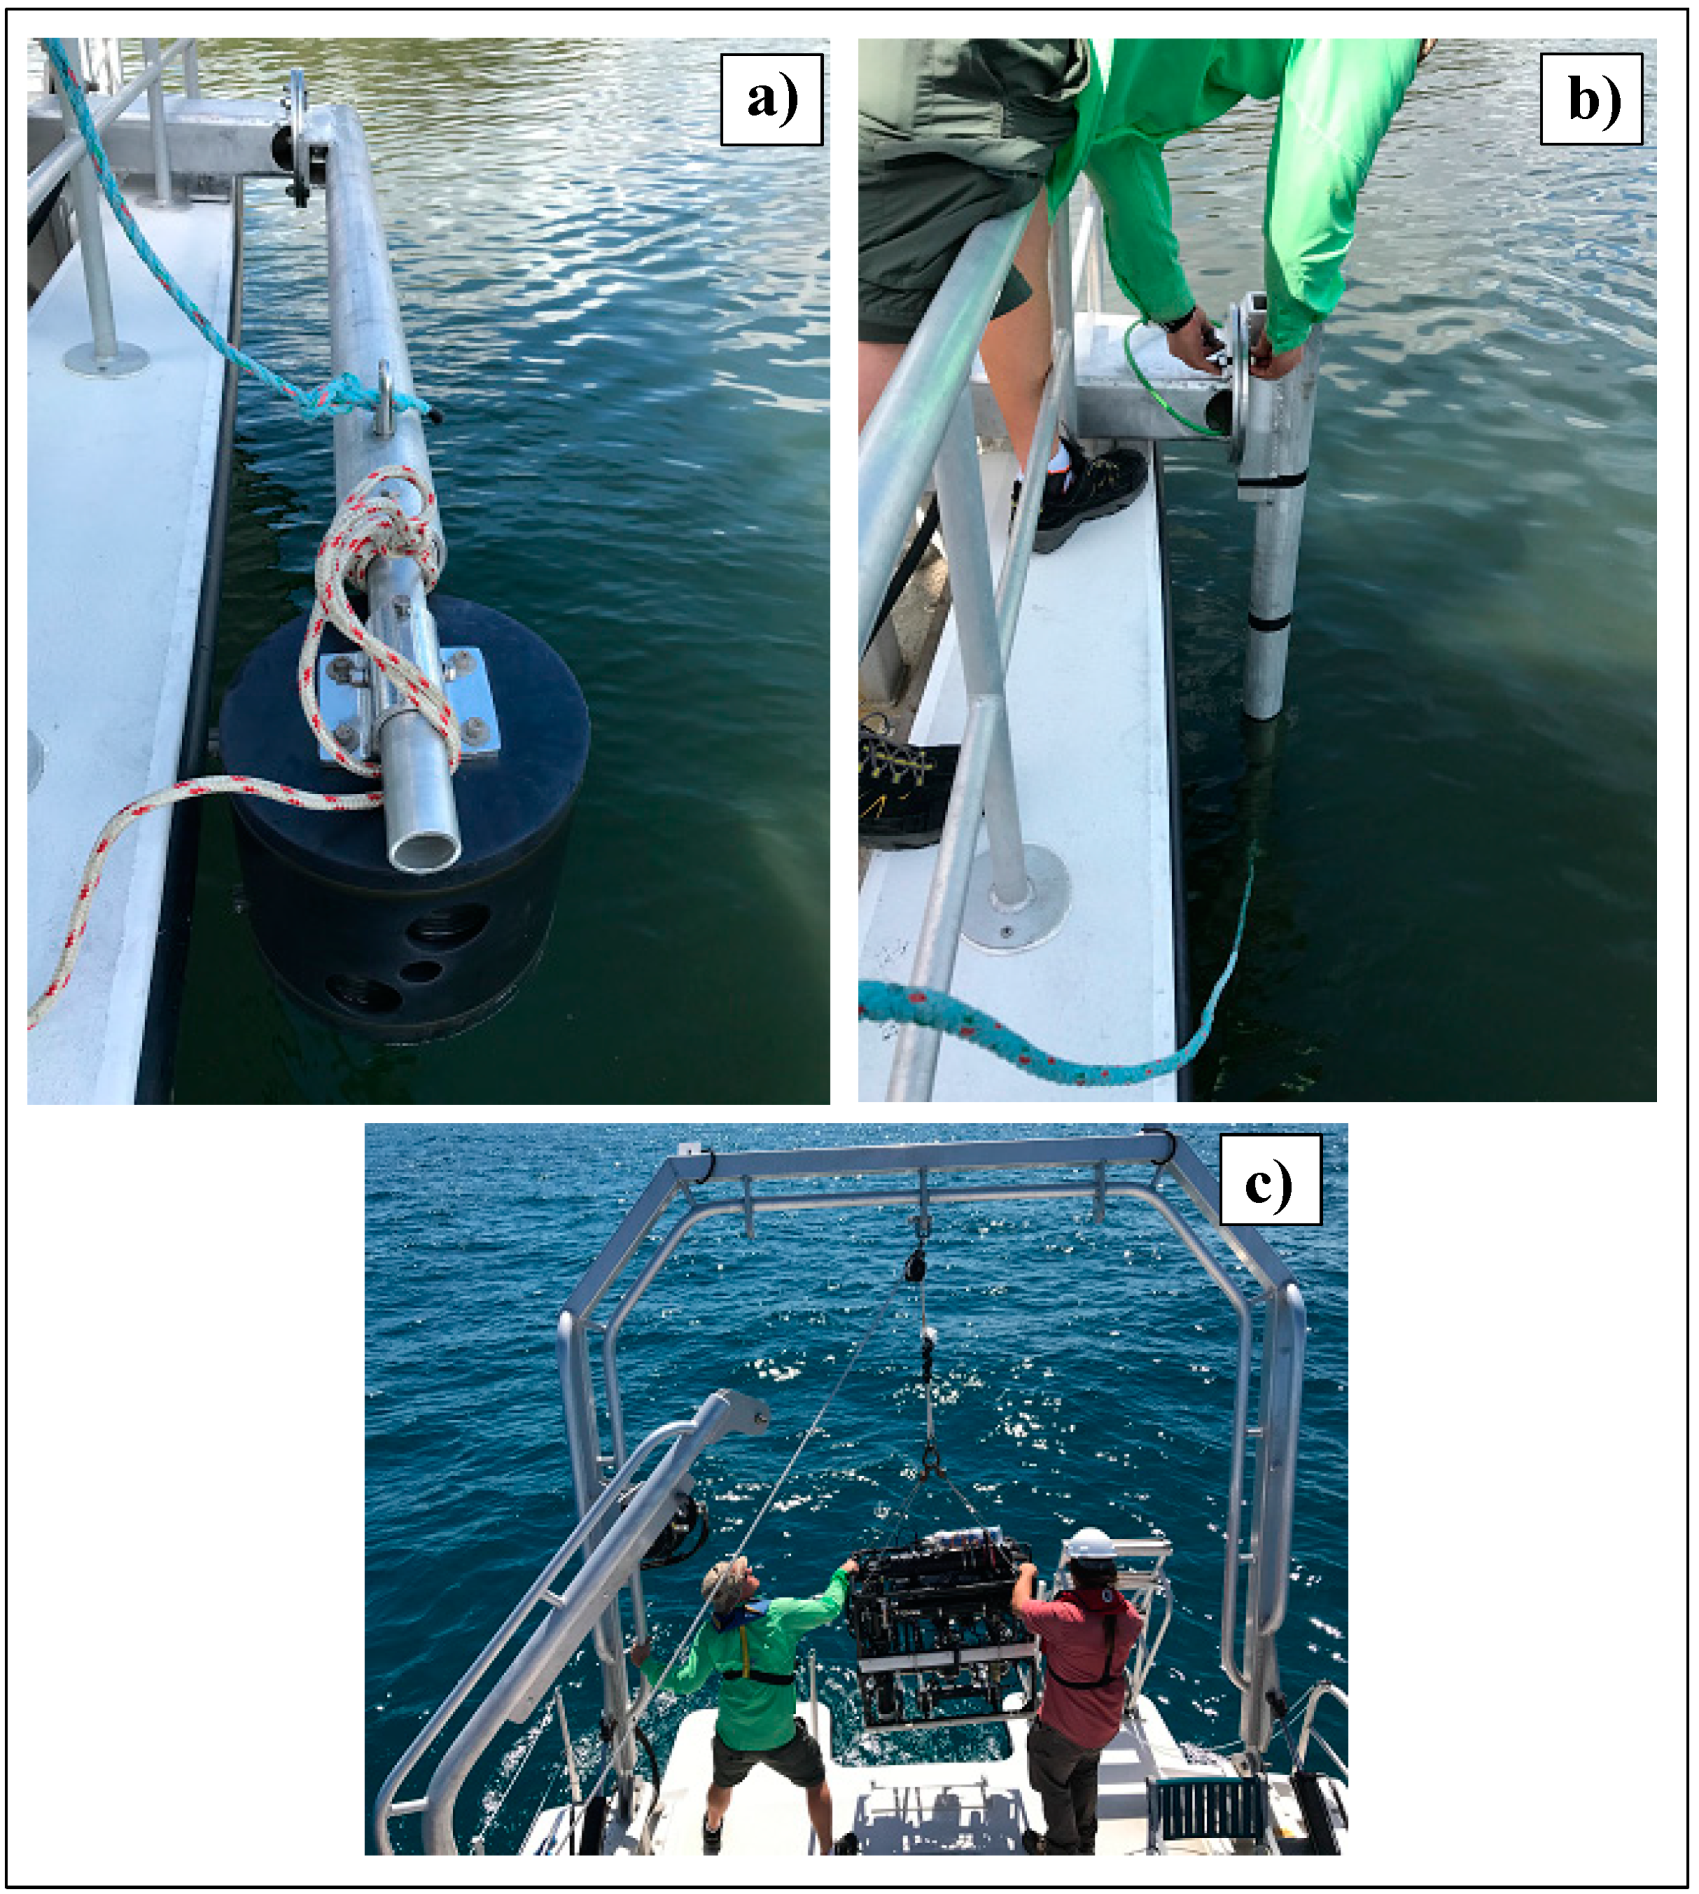
The instrument has two non-scanning lasers with wavelengths centered in the blue (λ = 473 nm) and green (λ = 532 nm) spectral range (Figure 1) [10]. The laser beams are parallel and were oriented at a nadir angle (i.e., perpendicular to the surface of the water and down-looking) (Figure 2).
The receivers have an angular separation of 174.5 mrad and a similar FOV of 34.9 mrad. This geometry enhances the detection and discrimination of optical targets by allowing a real-time baseline correction by measuring direct and diffuse backscattered photons (i.e., path-radiance) in a concurrent way. The beam divergence is 17.5 mrad and the source-receiver separation is 0.0606 m for both telescopes. This source-receiver (S-R) geometry is an important design feature as high frequencies (i.e., >108 Hz) and associated dephasing of backscattered photons are sensitive to changes in S-R distance [16]. Oculus has an averaged laser power of 10 mW and 23.1 mW at 473 nm and 532 nm, respectively, a pulse repetition rate of 100 Hz and a pulse length of 1.27 and 1.12 ns (blue and green channels, respectively). The sampling frequency (i.e., digitization rate) during all experiments was 0.5 GHz.

2.2. Field Experiments

Optical measurements were made on 10 March 2017 during daytime conditions. Surveys were done over shelf waters off Fort Lauderlade, Florida (26.1224° N, −80.1373° W). LiDAR measurements were obtained from a rotating pole attached to the stern of the ship (Newton 40) (Figure 2). LiDAR surveys were complemented with vertical profiles of c and a coefficients as derived from an absorption-attenuation meter (ac-9, accuracy ±0.001 m−1, sampling rate = 3 Hz, SEA-BIRD Scientific, Bellevue, WA, USA) at 9 wavelengths (λ = 412, 443, 488, 510, 532, 555, 650, 676 and 715 nm). Protocols describing processing and signal corrections applied to raw ac-9 measurements are reported in previous studies [17].
The sampling design encompassed a time series over relatively deep waters (i.e., bottom depth range = 13.2–30.5 m, 26.065° N, −80.077° W) and during the morning (9:36:10:03). Two transects (12:10–12:29 pm and 1:04–2:26 pm) perpendicular to the shore and over shallower areas (bottom depth range = 7.4–14.7 m, 26.09° N, −80.09° W and 26.085° N, −80.095° W, respectively) were done during the afternoon. To detect substantial changes (spatial and temporal) on scatterers’ characteristics, only the first second of each capture (i.e., the first 100 shots per radiometric channel) were used.

2.3. Direct and Diffuse Scattering Components

The backscattering signals arriving to on- and off-axis receivers can be interpreted as a linear sum of two variable backscattering contributions (direct and diffuse) associated with single and multiple scattering collisions, respectively. In that regard, ICA deals with the partition of a mixed-signal that is composed of linear contributions terms. Unlike principal components, ICA is assuming latent variables having ‘non-Gaussian’ distributions and independent components that are not necessarily orthogonal. Another important assumption of ICA is the independence between parameters that originated the mixed signal. The initial step of ICA is the whitening (i.e., the covariance of decorrelated variables is an identity matrix) of the original data [15]. The calculation of ICA signal sources is performed by rotating the whitened matrix to minimize the Gaussian distribution behavior (‘Gaussianity’) between variables. Indeed, the central limit theorem states that a mixed-signal is expected to be more Gaussian than its members.
In this study, ICA calculations were performed by assuming two receivers (i.e., on- and off-axis) for measuring two mixed LiDAR signals ( X 1 m i x and X 2 m i x ) with a variable contribution of direct and diffuse backscattering components:
X 1 m i x ( t ) = a 1 , 1 S 1 ( t ) + a 1 , 2 S 2 ( t )
X 2 m i x ( t ) = a 2 , 1 S 1 ( t ) + a 2 S 2 ( t )
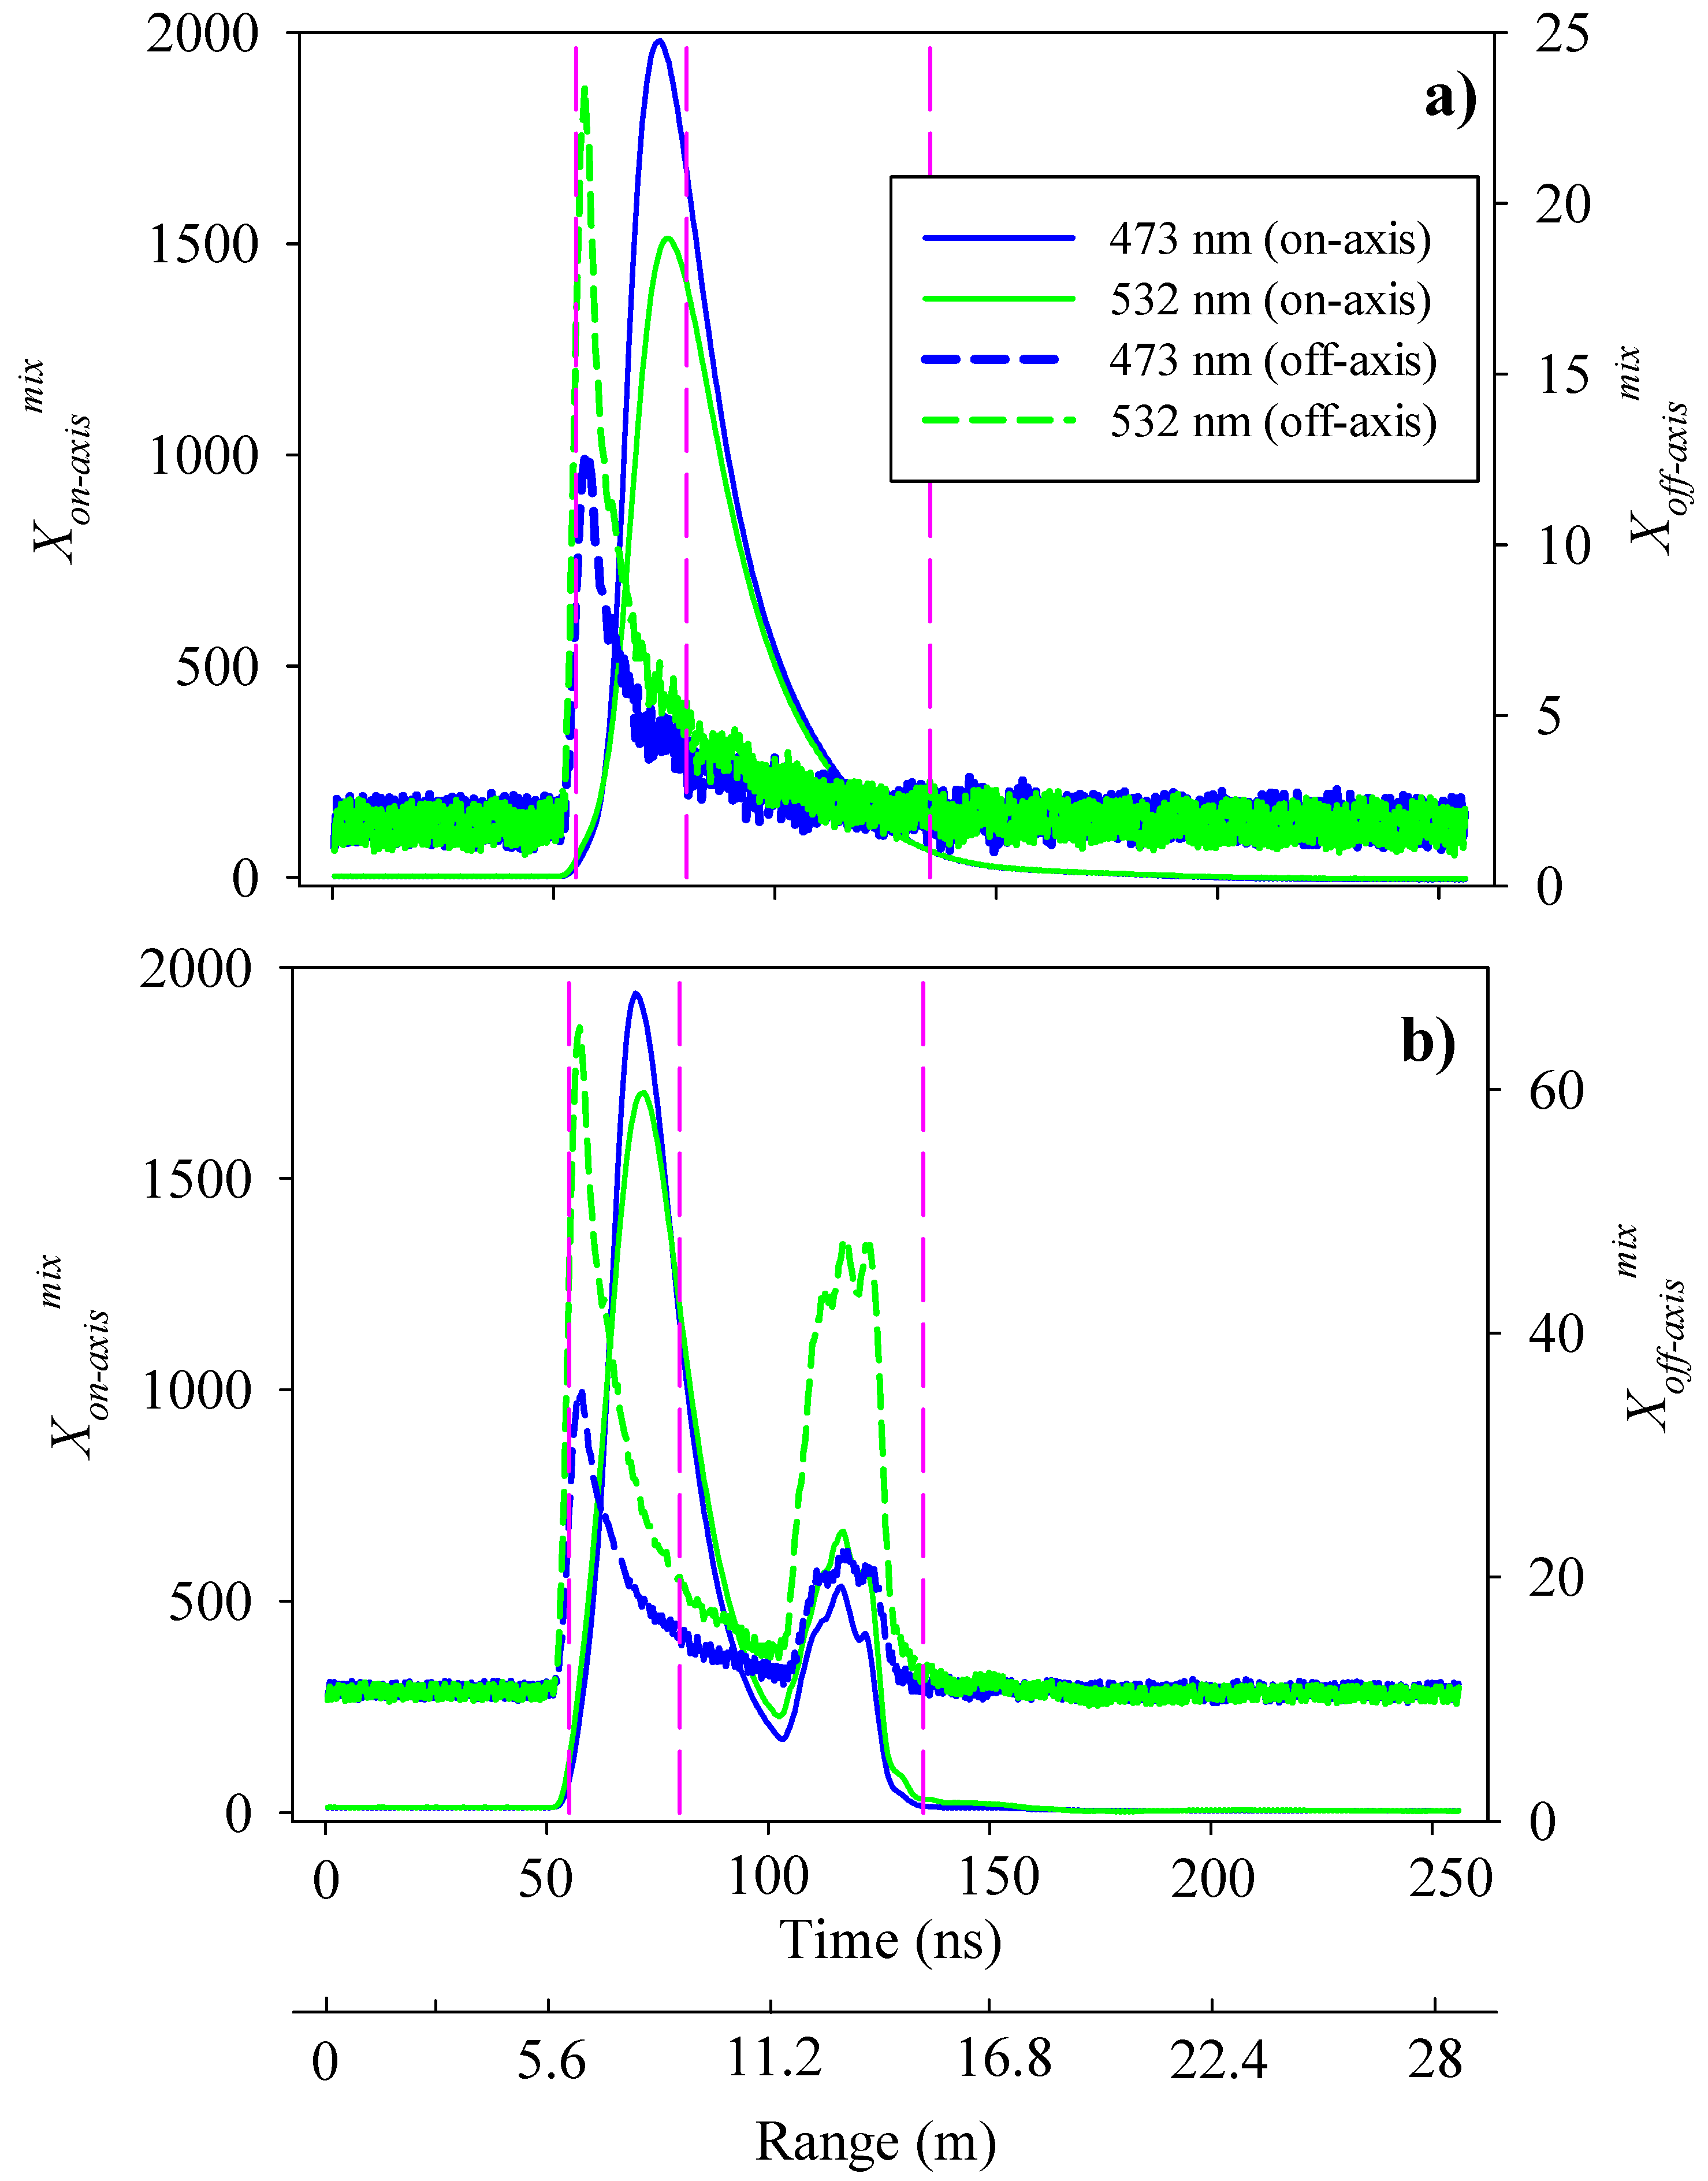
where S1 and S2 are original signal sources with a dominant direct and diffuse backscattering contribution, respectively, a1,1, a1,2, a2,1, and a2,2 are weighting coefficients that are influenced by the relative position and orientation of the receivers, and the type of photon interactions with the optical medium. The ICA analysis was restricted to three specific times (hereafter time bin = 110, 160, and 270 or time lags of 55, 80 and 135 ns with respect to the receiver, respectively) representing the leading, descending (i.e., exponential attenuation of power), and trailing portions of each waveform (Figure 3, Table 2). These portions correspond to different ‘energy attenuation regions’ where a and bb have different contributions to Ksys (e.g., bb >> a and a >> bb in leading and trailing portions, respectively). In other words, LiDAR waveforms are sensitive to different IOPs and energy attenuation processes (e.g., the dominance of direct and diffuse scattering in the leading and trailing portions, respectively) depending on range. The importance of scattering components (i.e., direct/diffuse) and IOPs (i.e., a and bb) for determining Ksys is more balanced as Xmix exponentially decreases with distance from the receiver.
Two case studies are presented showing the dominance of ‘soft’ backscattering features (i.e., np approximates to nw) at all detection times (Figure 3a) and the signal perturbation due to ‘hard’ backscattering features (np>> nw) at detection times between 100 and 150 ns (Figure 3b). The ICA algorithm used here, also known as FastICA [15], has four major processing steps: data centering by subtracting the mean (1), whitening of centered data based on singular vector decomposition (2), maximization of ‘non-Gaussianity’ of whitened mixed signals based on kurtosis (3), and normalization/decorrelation of weights used to obtain the ICA signal sources (4). The ICA analysis is unable to extract the amplitude of the signal sources, thus the arithmetic mean (μ) and standard deviation (σ) of X 1 m i x and X 2 m i x were used to reconstruct the magnitude of S1 and S2, respectively, by applying a z-scores transformation:
S k , λ r e c ( t ) = σ ( X k , λ m i x ( t ) ) I C k ( t ) + μ ( X k , λ m i x ( t ) )
where IC is the independent component and S k , λ r e c is the reconstructed signal for the signal source S with a dominant scattering contribution k. The proportion of the variability of S k , λ r e c explained by X 1 m i x and X 2 m i x was quantified using the coefficient of determination (r2).

2.4. Relationships between Ksys and IOPs

Optical measurements derived from the ac-9 sensor were useful to interpret the scattering processes determining the LiDAR attenuation coefficient and the identity of LiDAR-derived scatterers. Indeed, the magnitude of Ksys varies between c and Kd or the diffuse attenuation coefficient of downwelling irradiance [4,18,19]. As c and/or FOV decreases, the light field is expected to be less diffuse and Ksys tends to be c. Conversely, Ksys tends to be Kd when the water becomes more turbid, the FOV becomes larger, and/or the laser beam divergence increases. The final outcome of reducing Ksys to Kd is a greater contribution of multiple photon collisions to total scattering and a light field that is more diffuse [19]. For each wavelength and detection geometry, Ksys values were computed for on- and off-axis receivers (hereafter Ksys(on-axis) and Ksys(off-axis), respectively) as the slope of log-transform (e-base) backscattering power (Xmix) as a function of range (z):
X m i x ( z ) = A L e 2 K s y s z / n w
where AL is a constant related to the LiDAR system and nw is the mean refractive index of seawater (i.e., 1.44).
The range used for Ksys calculations was always within the exponential decay phase of the waveforms and differed between channels (i.e., 8.5–10.7 m and 10.03–12.3 m for on- and off-axis, respectively). For each Ksys estimate, the mean Xmix was computed based on the arithmetic average of the first 100 waveforms (i.e., 1 capture). The slope of each averaged waveform subset was derived by applying a linear regression model type-I [20] to Xmix changes as a function of range in m. Waveforms with the presence of strong backscattering features disrupting the exponential decrease of the LiDAR power with range were excluded from the regression analysis. The comparison of LiDAR attenuation coefficients with IOPs-derived from ac-9 measurements was made based on the arithmetic mean of a and c determinations within the water depths matching the LiDAR vertical range used for estimating Ksys. To avoid negative backscattering values, an offset of +100 was added to all signals (on- and off-axis) and the signal-to-noise ratio (S/N) was computed as the ratio of Xmix(on-axis)/Xmix(off-axis). The response of Ksys due to changes on IOPs was quantified by the coefficient of determination (r2) after adjusting a linear regression model type I.

2.5. SDI

The 2-D structure of Oculus-derived backscattering provides unique information regarding temporal changes on scatterers’ distributions that can be mainly attributed to the re-location of optical features due to passive or active motion. Notice that these changes may be associated with variations in backscattering intensity and/or blue/green ratios. The Structural Similarity index (SSI) is a technique widely used in image processing for measuring the similarity between images or 2-D matrices [13]. In our case, the 2-D array is a lidargram or matrix composed of 100 consecutive LiDAR waveforms. Thus, it was assumed that local temporal variability was small with respect to spatial changes of Xmix along the boat sampling track and as a function of water depth. Thus, the magnitude of SSI is representative of 200 waveforms (i.e., 100 profiles per lidargram) or 2 s (~5.1 m along the boat direction) and is computed for each element i,j of the lidargram (i.e., horizontal and vertical component, respectively). For each i,j element corresponds to the anomaly of each waveform computed with respect to the median of backscattering values between time bin 110 and 250 (i.e., range = 6.7–14 m). The SSI index was computed as the product of three metrics (luminance,lum, contrast,ct, and structure,st) that apply to each element i,j of lidargrams to be compared (i.e., L1 and L2):
S S I ( L 1 i , j , L 2 i , j ) k = l u m k α c t k β s t k γ
l u m k = ( 2 μ L 1 i , j , k μ L 2 i , j , k + c 1 ) ( μ L 1 i , j , k + μ L 2 i , j , k + c 1 )
c t k = ( 2 σ L 1 i , j , k 2 σ L 2 i , j , k 2 + c 2 ) ( σ L 1 i , j , k 2 + σ L 2 i , j , k 2 + c 2 )
s t k = ( σ L 1 L 2 i , j , k 2 + c 3 ) ( σ L 1 i , j , k 2 σ L 2 i , j , k 2 + c 3 )
where k is the capture time during the survey, α, β and γ are weights set to 1, σ 2 is the variance of element x (i.e., i or j) and σ i , j 2 is the covariance between element i and j, respectively. c1, c2, and c3 are constants used to avoid a very small denominator and are affected by the dynamic range. SSI is affected by the size and type of the local window used to smooth the lidargram. In our study, the dynamic range was 256 and the local window was a Gaussian low-pass filter with a size of 11 and a standard deviation of 1.5.
The absence or presence of scattering features between lidargrams was quantified based on two parameters derived from SSI:
< S S I > k = i , j S S I ( L 1 i , j , L 2 i , j ) k n i + n j
< S D I > k = 1 < S S I > k
S D I c t k = < S D I o n a x i s > k < S D I o f f a x i s > k < S D I o n a x i s > k + < S D I o f f a x i s > k
where ni and nk are the sum of i and j elements, respectively, <SDI> is the arithmetic average of the structural dissimilarity index. For each wavelength, SDIct in Equation (11) is equivalent to the relative contrast of the backscattering signal between on-axis and off-axis receivers. The range of values for <SDI> and SDIct is 0–1.

2.6. The Spectral Slope of LiDAR Backscattering

The benefits of using a LiDAR with multiple wavelengths in oceanographic applications have been already discussed by Gray et al. [21]. Given their spectral emission and wavelength-dependency on water optical composition, the penetration depth of these systems can be optimized in environments with variable turbidity. Likewise, LiDARs having a spectral resolution allows the identification of scatterers in terms of second-order properties (e.g., the mineral content of particulates). This later advantage was explored here by calculating the spectral slope of LiDAR backscattering (mk):
m k ( t ) = ln ( X k , 473 m i x ( t ) / X k , 532 m i x ( t ) ) / ln ( 473 / 532 )
where k is the receiver (on- or off-axis) with a centered wavelength λ. Notice that mk varies with range or time, thus spectral slopes were analyzed at those time bins described in Section 2.3 and encompassing different ‘energy attenuation regions’ along the waveforms. Expression (12) was derived by applying a log-transformation to a hyperbolic function proposed for modeling IOPs [22].

3. Results

3.1. Scattering Processes and Shape of Waveforms

Examples of waveforms obtained by Oculus at two wavelengths were shown in Figure 3. The common backscattering volume peak associated with the ‘blue’ and ‘green’ on-axis channels was not totally coincident (i.e., photons arriving sooner at the ‘blue’ receiver). This shift was attributed to the asymmetry of viewing sensor angles making photons arrive first at off-axis receivers (25.2 and 27.3 ns for ‘blue’ and ‘green’ channels, respectively) (Figure 3a). Notice that this arrival time difference varied with the water optical properties (e.g., turbidity) and the presence of ‘large-sized’ scatterers (i.e., ‘strong’ backscattering features present in on- and off-axis at the leading portion of the waveforms (e.g., 20.3 and 22.4 ns, respectively, Figure 3b). Despite the existence of these ‘high’ scattering events and differences between detectors in terms of gain and dynamic range (e.g., larger and wider for the green channel), no sensor saturation effects were observed. In a logarithmic space, the beginning of the leading portion of waveforms for on- and off-axis measurements was commonly visualized at 50 ns. For on-axis signals, the exponential decay phase was extended up to 210 ns after which the tail was characterized by a change of slope due likely to a greater contribution of multiple scattering. Conversely, time-resolved backscattering signals for off-axis waveforms were extinct (i.e., S/N < 1) earlier (~195 ns). Perturbations on LiDAR backscattering measurements by a ‘hard’ scatterers can be seen as a large bulge on the arriving signal (see the second peak at time bin 110 in Figure 3b). In general, the overall impact of this disturbance was related to an increase of signal attenuation after the scattering event and subsequent backscattering oscillations at longer arrival times due to larger contributions of photons having multiple collisions. These oscillations must not be confused with the ‘ringing’ of the signal (i.e., periodic noise variations after a backscattering saturation event).
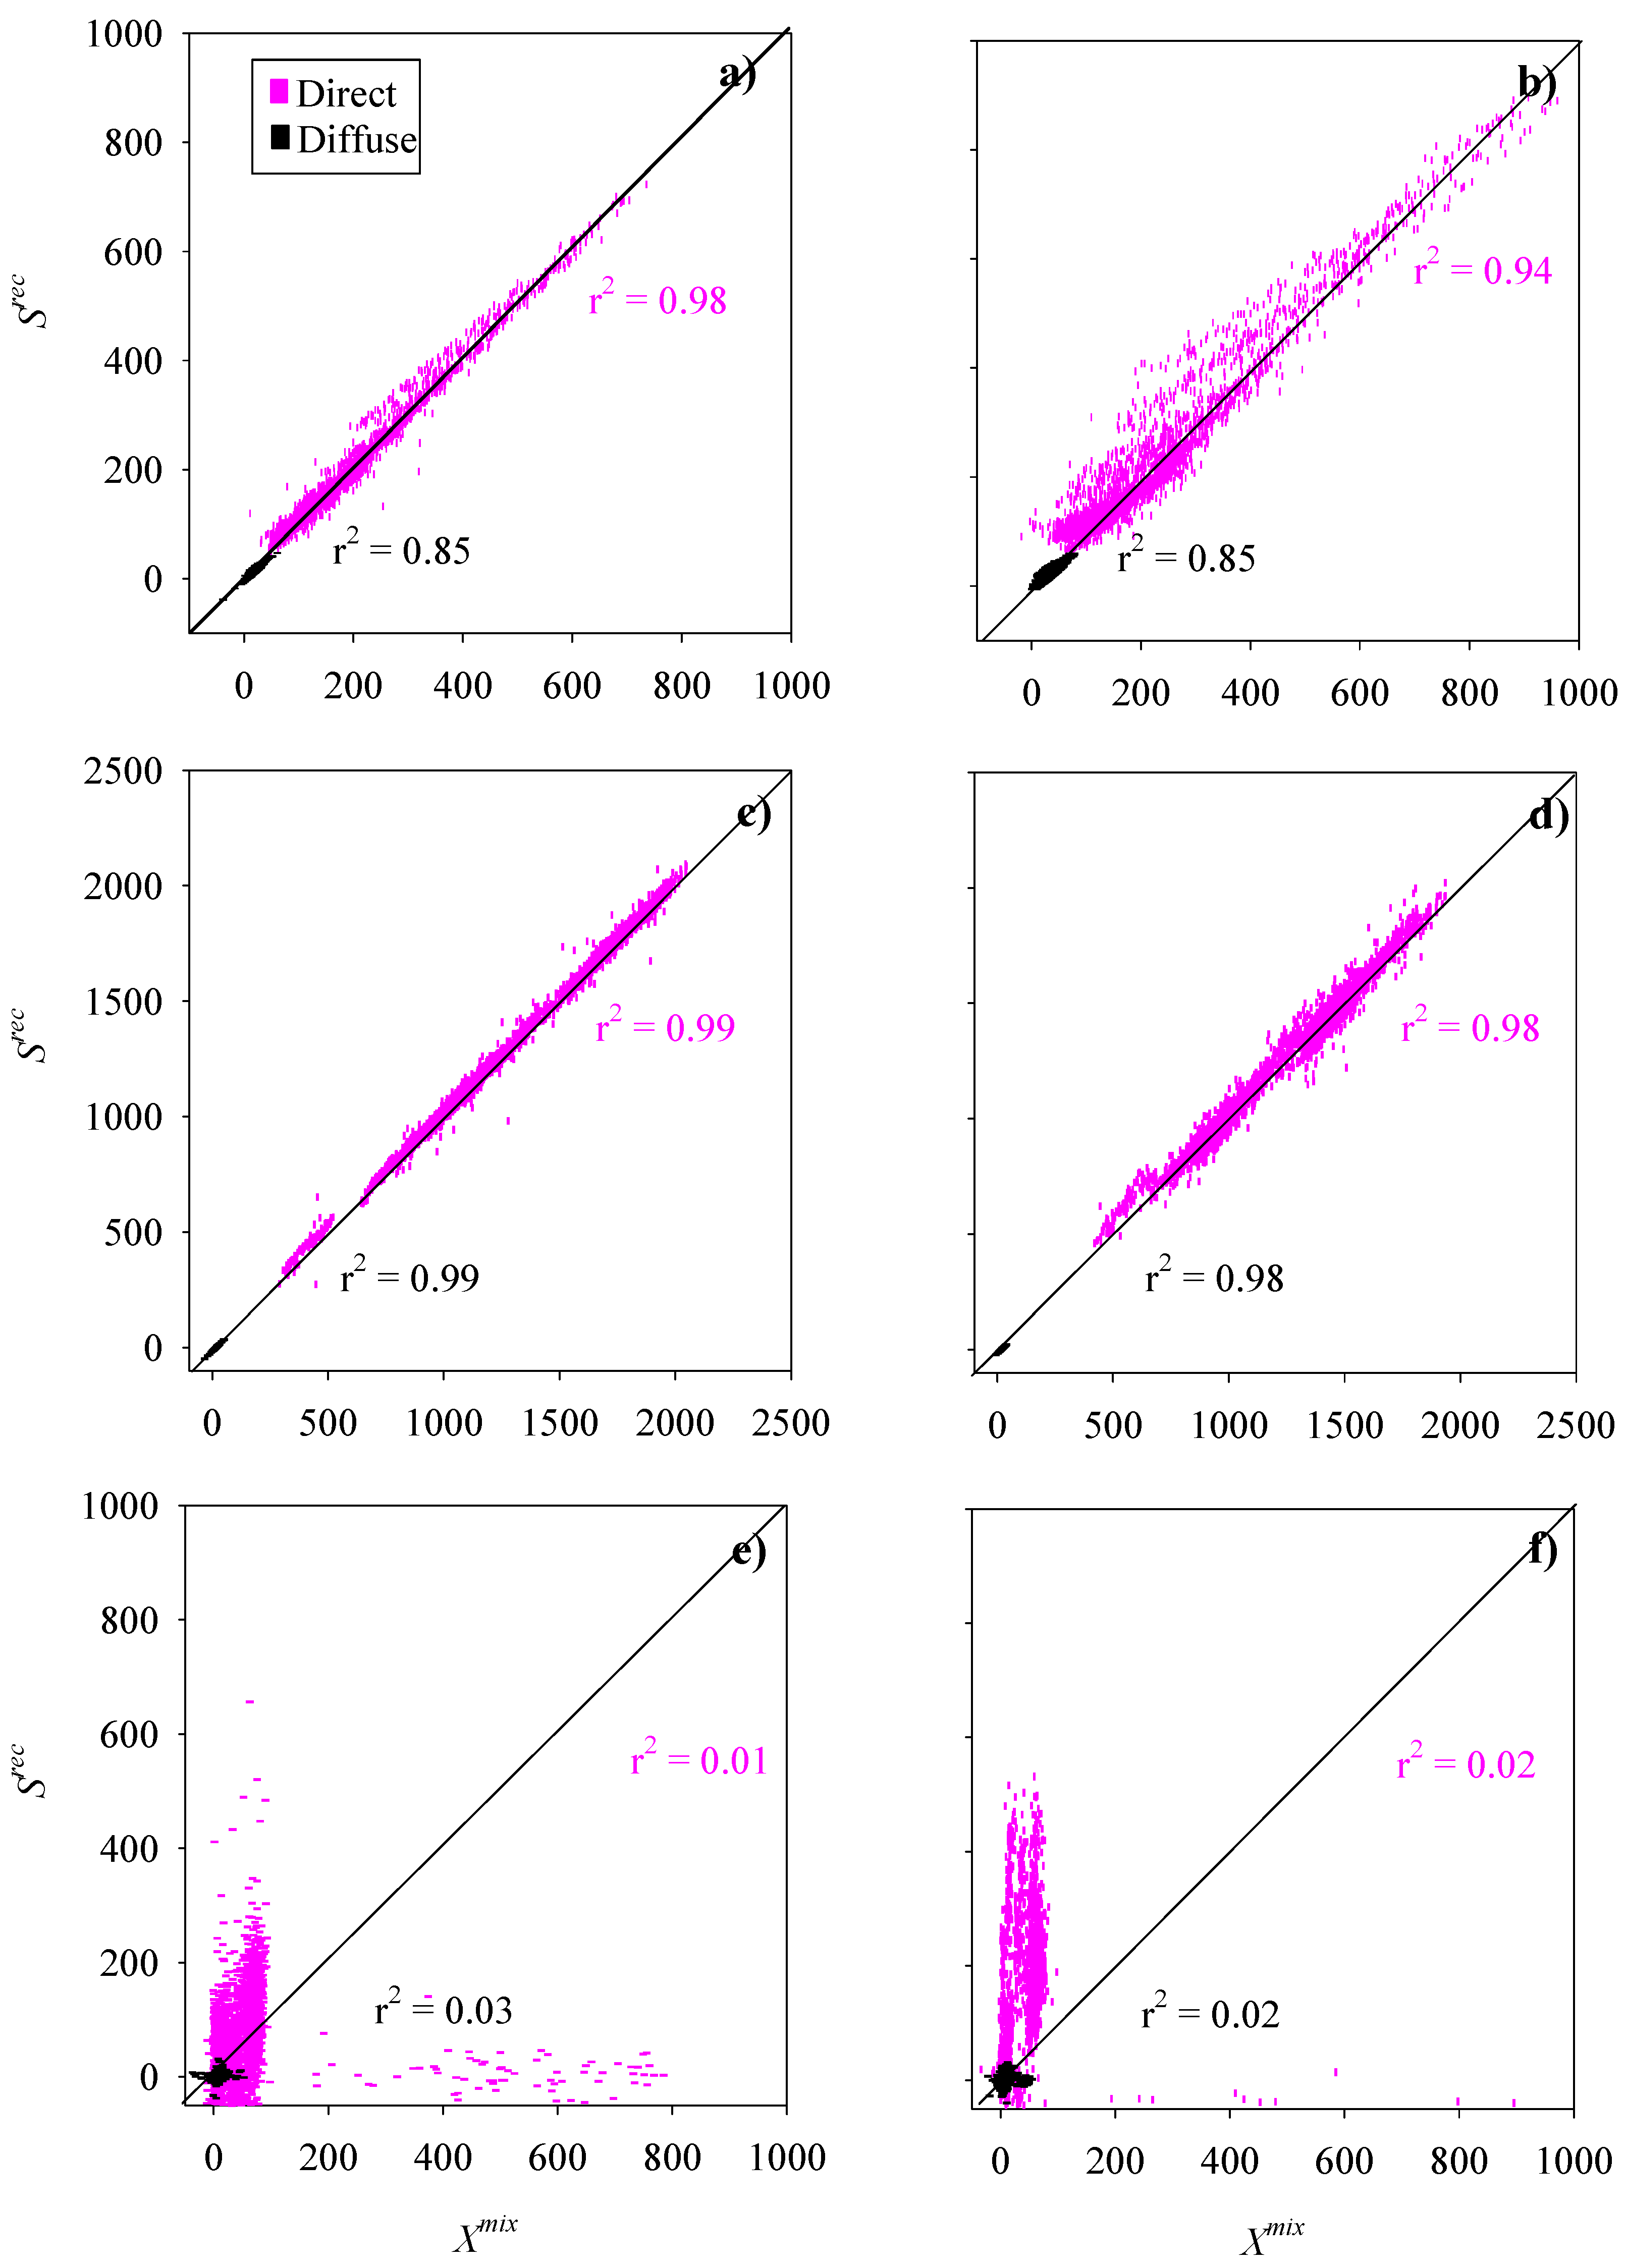
The discrimination of time-resolved diffuse and direct backscattering photon contributions to Xmix was investigated here based on a subset of waveforms obtained during different times of the day and distances to the shore. As expected, the raw signal for on-axis and off-axis channels was associated to direct- and diffuse-dominated backscattering contributions, respectively (Figure 4). In general, the signal reconstruction was larger (i.e., larger explained variability by the response variable) at time bin 160 followed by time bin 110 and 270 (r2 up to 0.99, 0.98, and 0.03 with p < 0.001). In the leading portion of the waveforms, the signal reconstruction of direct backscattering returns was higher with respect to that associated to diffuse photon contributions (e.g., explained variability difference up to 13% at λ = 473 nm, Figure 4a,b), and this difference decreased at longer λ. At intermediate detection times (i.e., time bin 160), the direct and diffuse backscattering contributions to Srec were comparable and not influenced by spectral changes. The ICA reconstruction of direct and diffuse backscattering components was at the tail of the waveforms was very poor or null (Figure 4e,f).
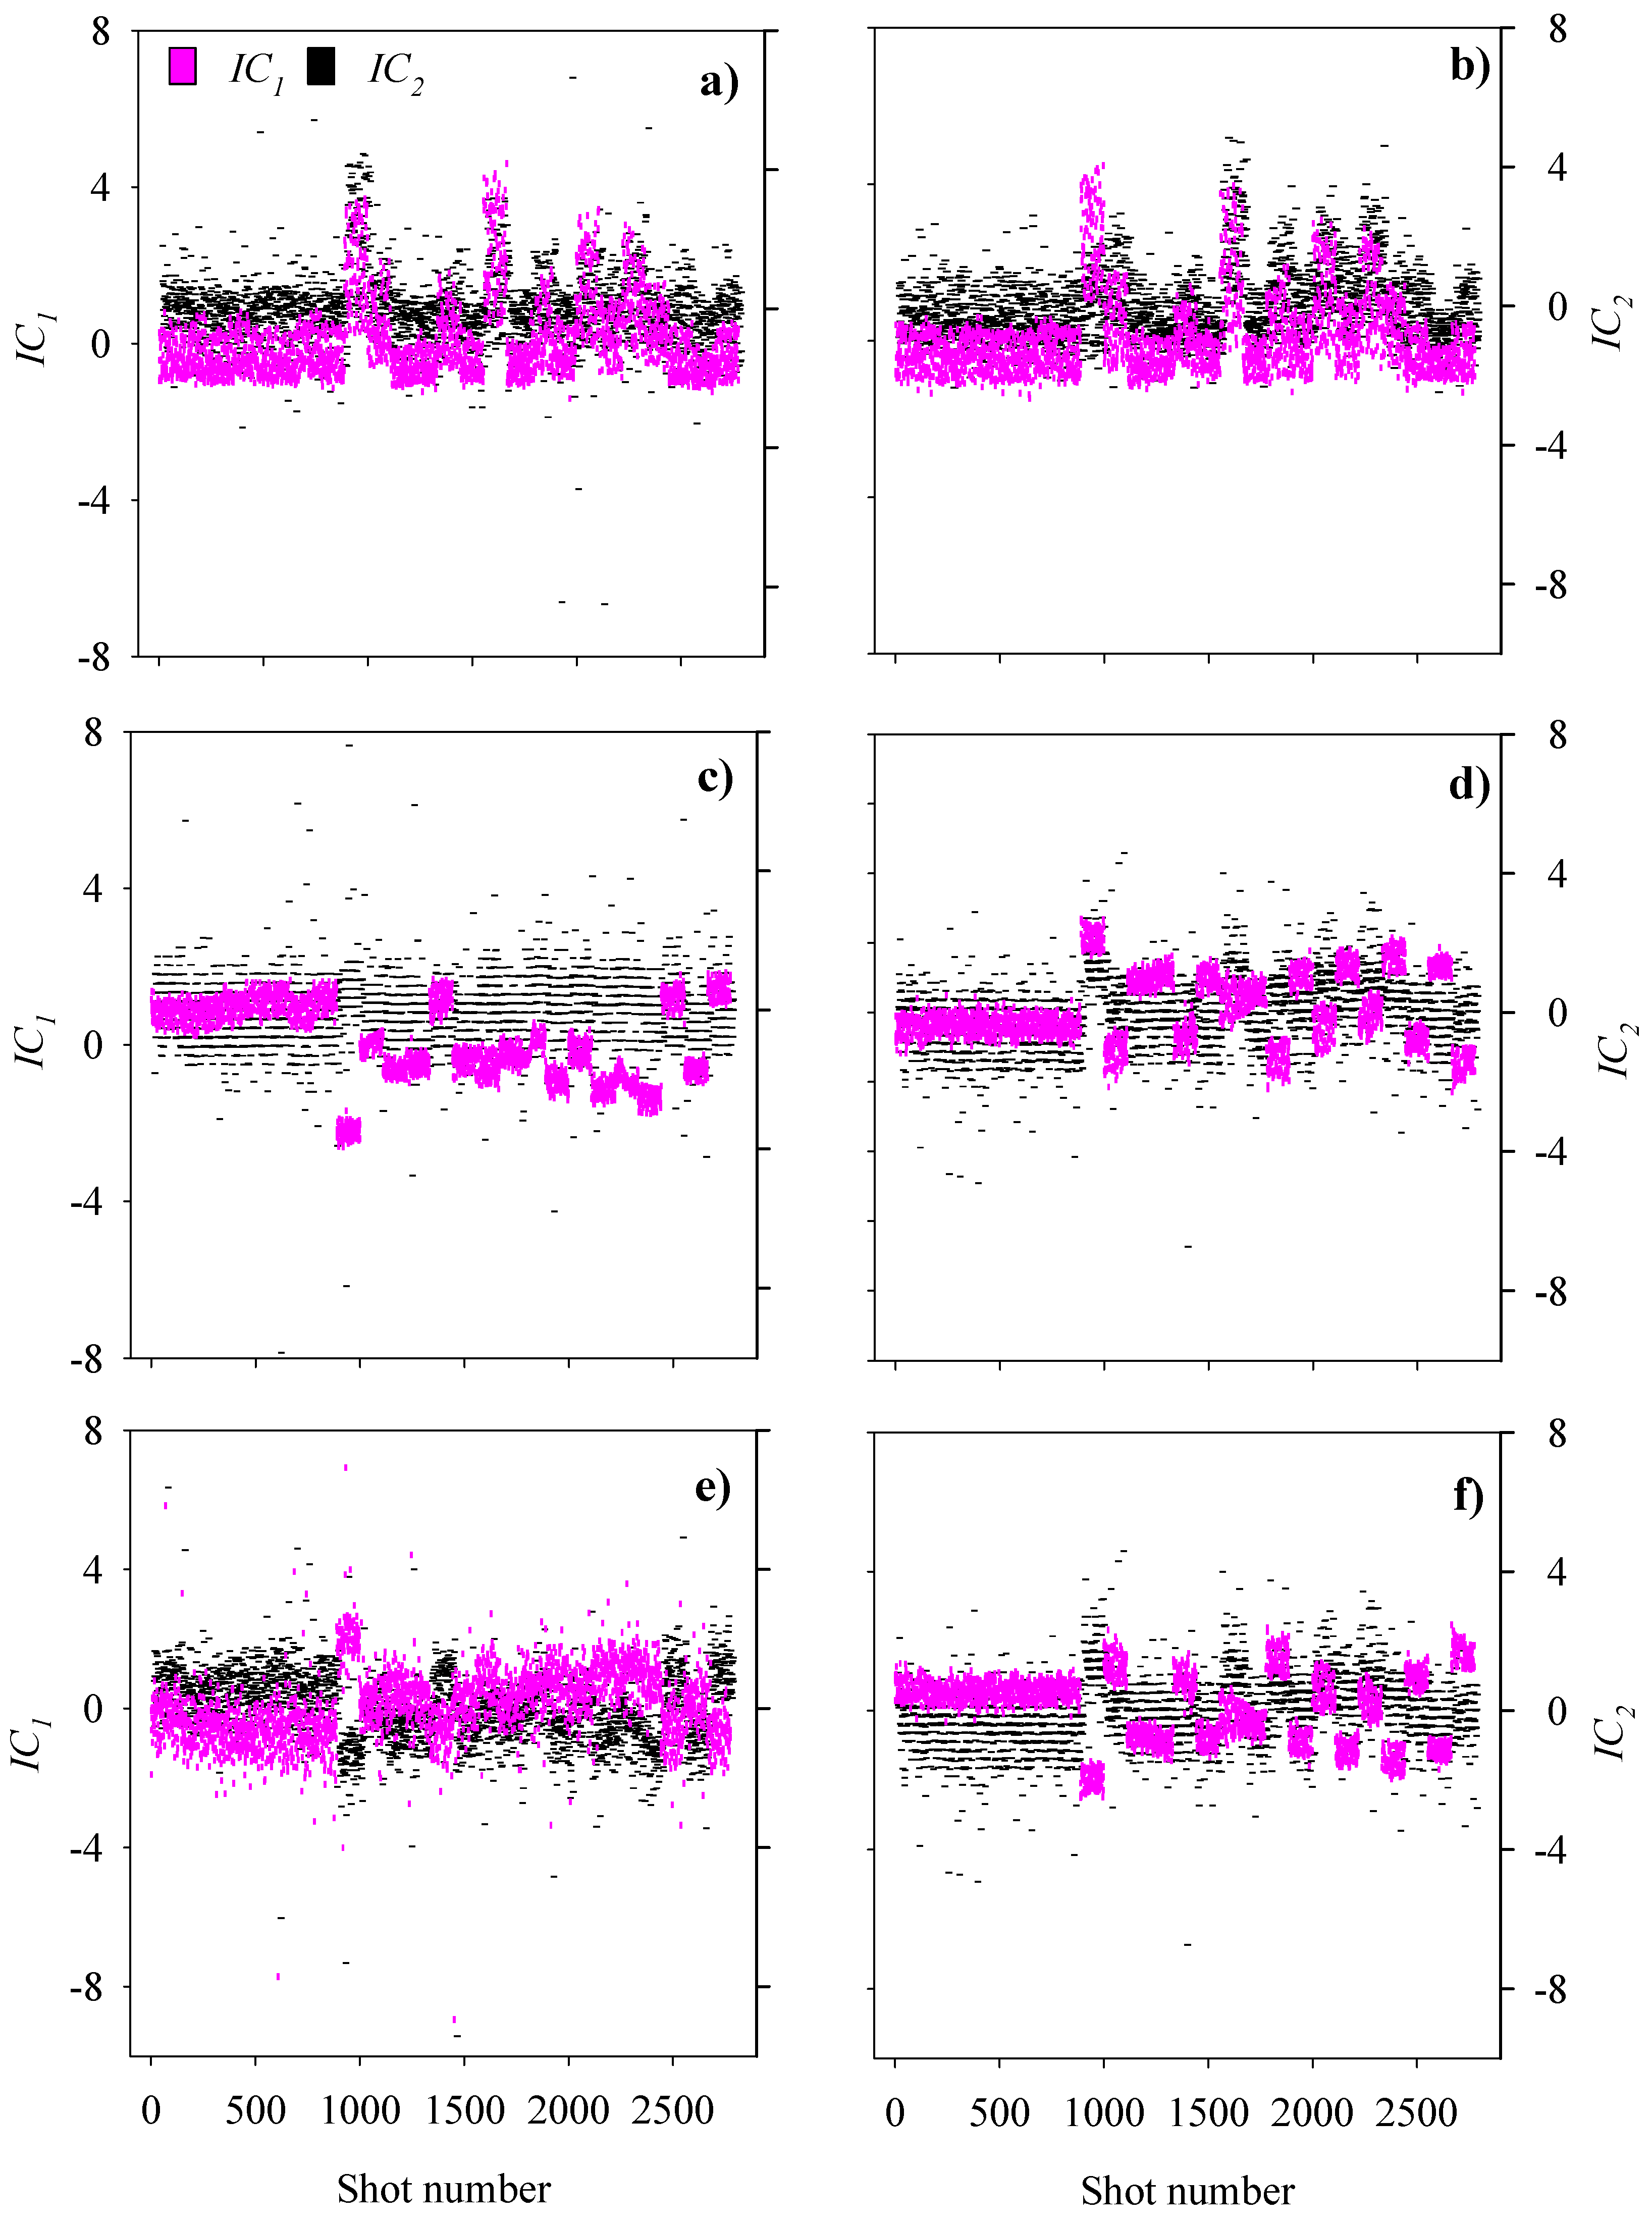
The spatio-temporal variability of ICA components is depicted in Figure 5. In general, ICA values for direct and diffuse scattering contributions were less variable during morning hours (i.e., shots 1–800). Also, ICA suggested that ‘direct and diffuse photons’ covaried positively in the leading portion of the waveforms (Figure 5a,b), a phenomenon that was no longer observed at larger distances from the receiver.

3.2. Response of Ksys to IOPs

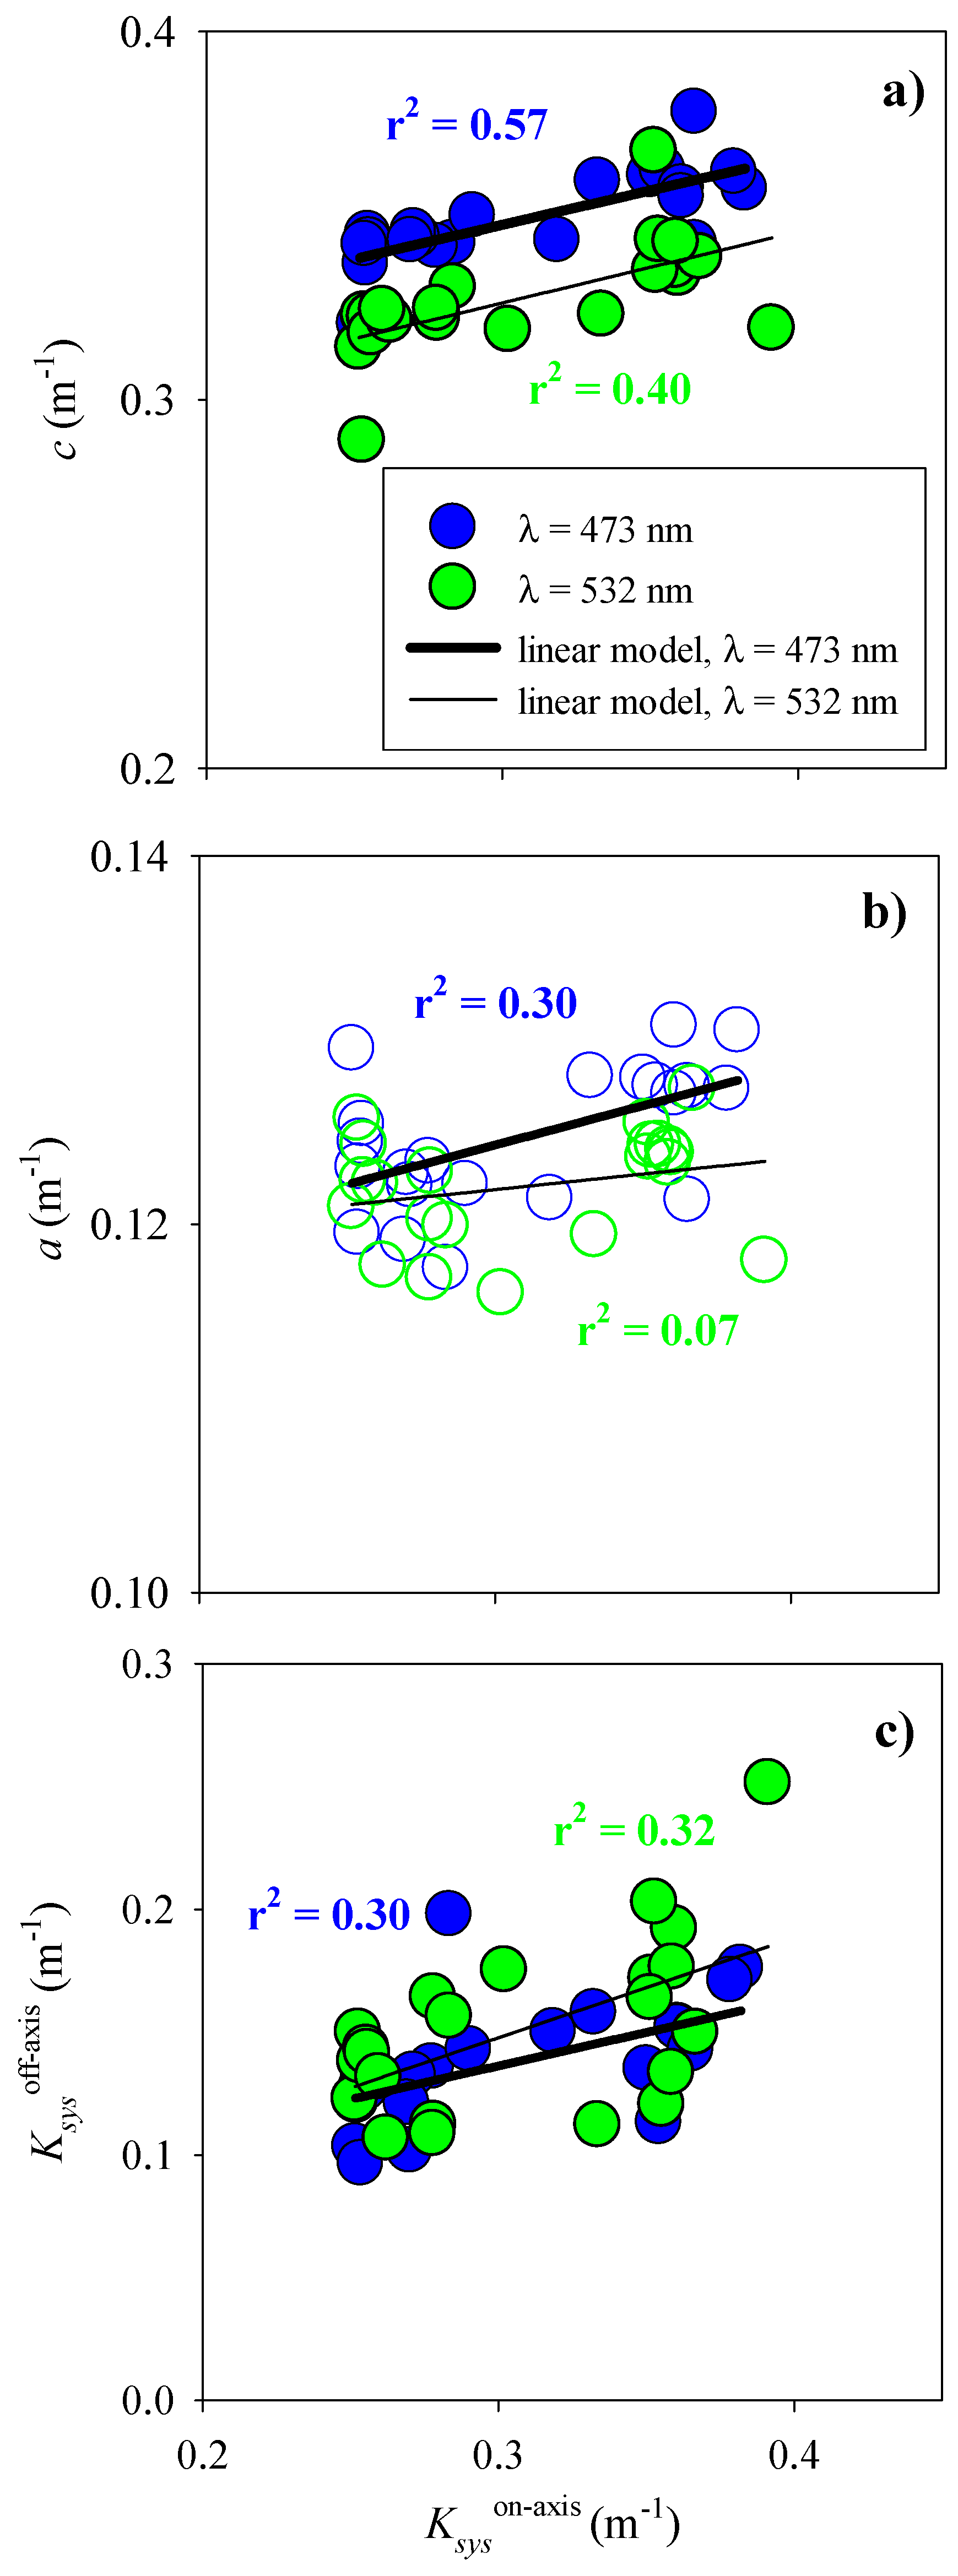
The attenuation of the LiDAR backscattering signal as a function of the range of on-axis waveforms was substantially influenced by changes in water optical properties (Figure 6). This influence was more remarkable with c and within the blue spectral range (p = 0.57, one-tailed t-Student, p = 0.004, Figure 6a). At λ = 473 nm, the a coefficient only explained one-third of attenuation changes on LiDAR backscattering (r2 = 0.30, p = 0.005, Figure 6b) and no clear relationships were established at the longer wavelength (r2 = 0.07, p = 0.126). Statistical relationships between Ksys(off-axis) and a values were weaker with respect to c-Ksys comparisons made at λ= 473 nm and 532 nm (p > 0.05). Covariations between Ksys(on-axis) and Ksys(off-axis) values were present (r2 up to 0.32) for waveforms measured within the ‘blue’ and ‘green’ spectral range (p = 0.004 and 0.003, respectively, Figure 6c). In general, Ksys(on-axis) was larger than Ksys(off-axis) (twice on average and up to 2.7-fold at λ = 473 nm).

3.3. Structural Dissimilarity

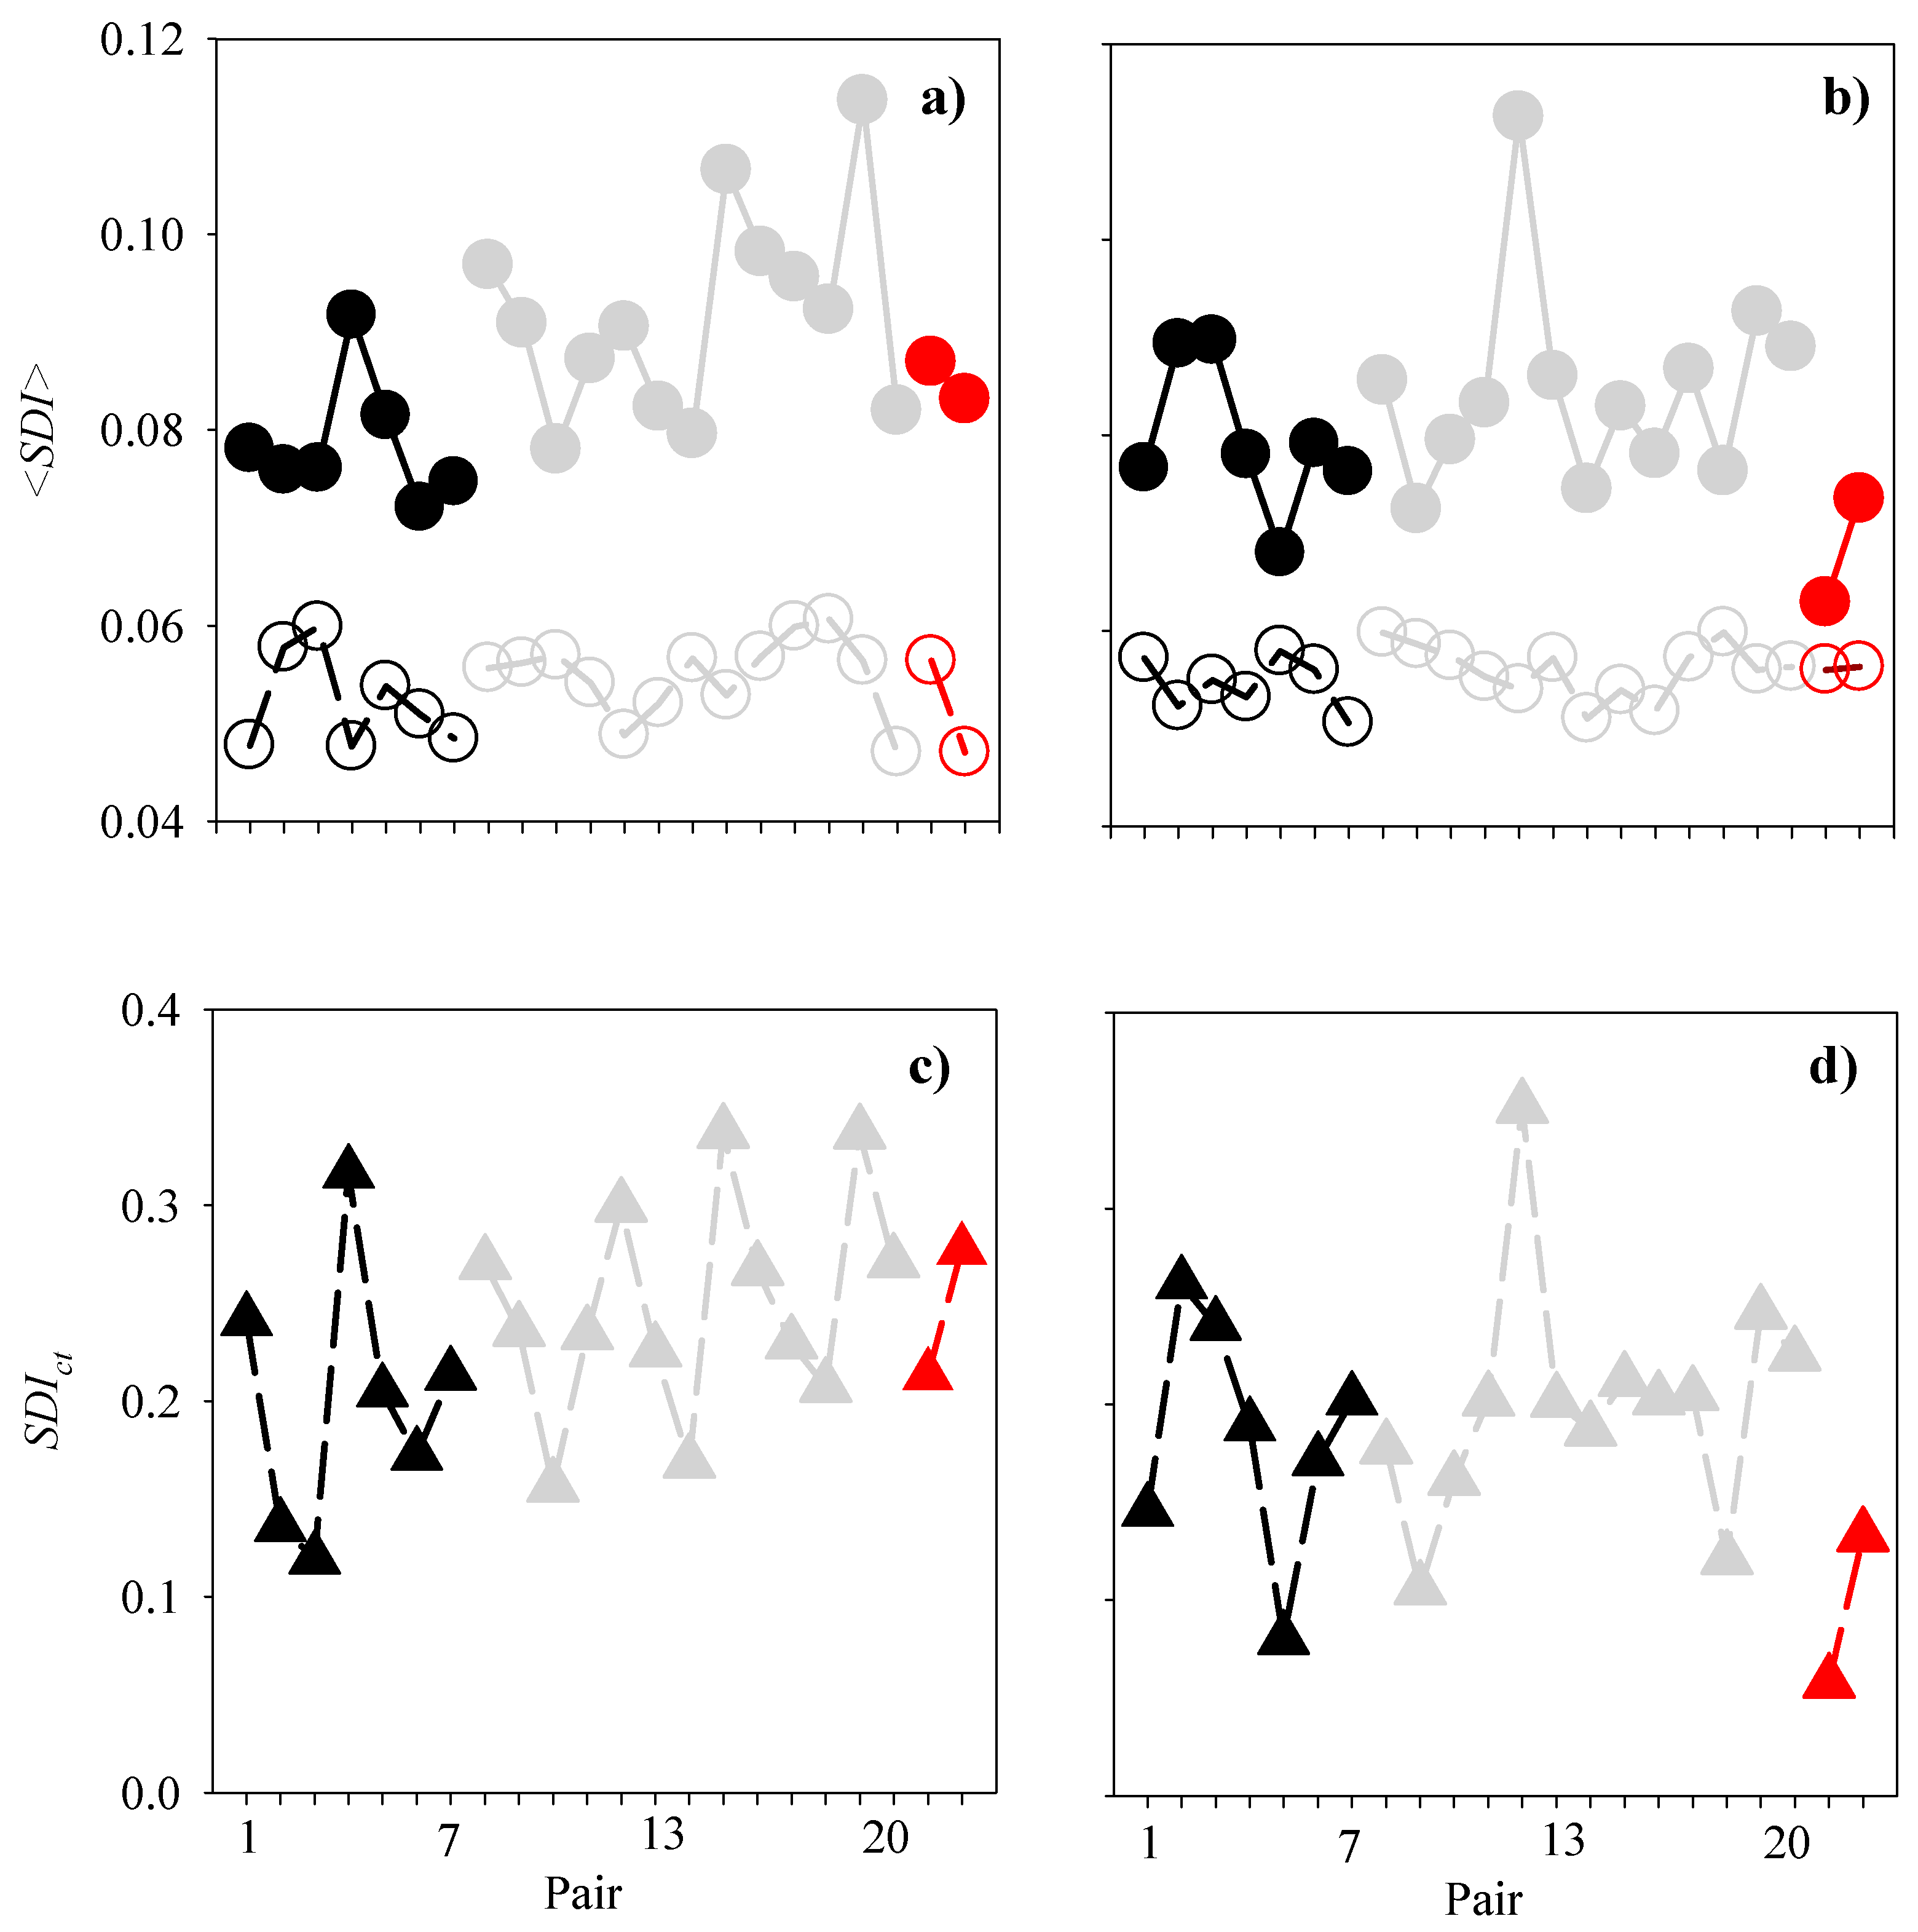
For on-axis measurements, the structural dissimilarity was highly variable between captures obtained in relatively deep waters (<SDI> = 0.08 ± 0.005, λ = 473 nm, and 0.08 ± 0.006, λ = 532 nm, 9:36–10:03 am) and shallow (<SDI> 0.09 ± 0.005, λ = 473 nm, and 0.08 ± 0.006, λ = 532 nm, 12:10–14:26 pm, arithmetic mean ±2 standard errors) (Figure 7a,b) waters. However, maximum <SDI> values (>0.11) were always observed over areas near the coast and with smaller bottom depths.
Morning LiDAR measurements were performed in waters having relatively low turbidity as inferred from c values (e.g., c(488) and c(532) up to 0.34 m−1 and 0.32 m−1, respectively). Conversely, during the noon and afternoon surveys (i.e., those in shallower areas), the water turbidity was higher (i.e., c(488) and c(532) up to 0.38 m−1 and 0.37 m−1, respectively) and lidargrams between consecutive captures were less alike. As expected, the mean structural dissimilarity values of waveforms obtained by off-axis receivers were relatively low (<SDI> range = 0.05 ± 0.03, arithmetic mean ±2 standard errors) with respect to those computed for on-axis measurements (t-Student = 13.46 and 11.55 for λ = 473 nm and 532 nm, respectively, two-tailed, p < 0.001, N = 22, Figure 7a,b). Similar to on-axis receivers, off-axis measurements did not show clear spectral differences on <SDI> as values for each wavelength were within the lower and upper bounds of two standard errors (i.e., 95% confidence level). Consistent with <SDI> variations, the SDI contrast between off-axis and on-axis signals tended to have relatively high and more variable values during the noon-afternoon hours (i.e., as high as 0.35) even though these changes were not statistically significant (e.g., SDIct(morning) vs SDIct(afternoon), t-Student = −1.82, two-tailed p = 0.083) (Figure 7c,d).

3.4. Spectral Slopes of LiDAR Backscattering

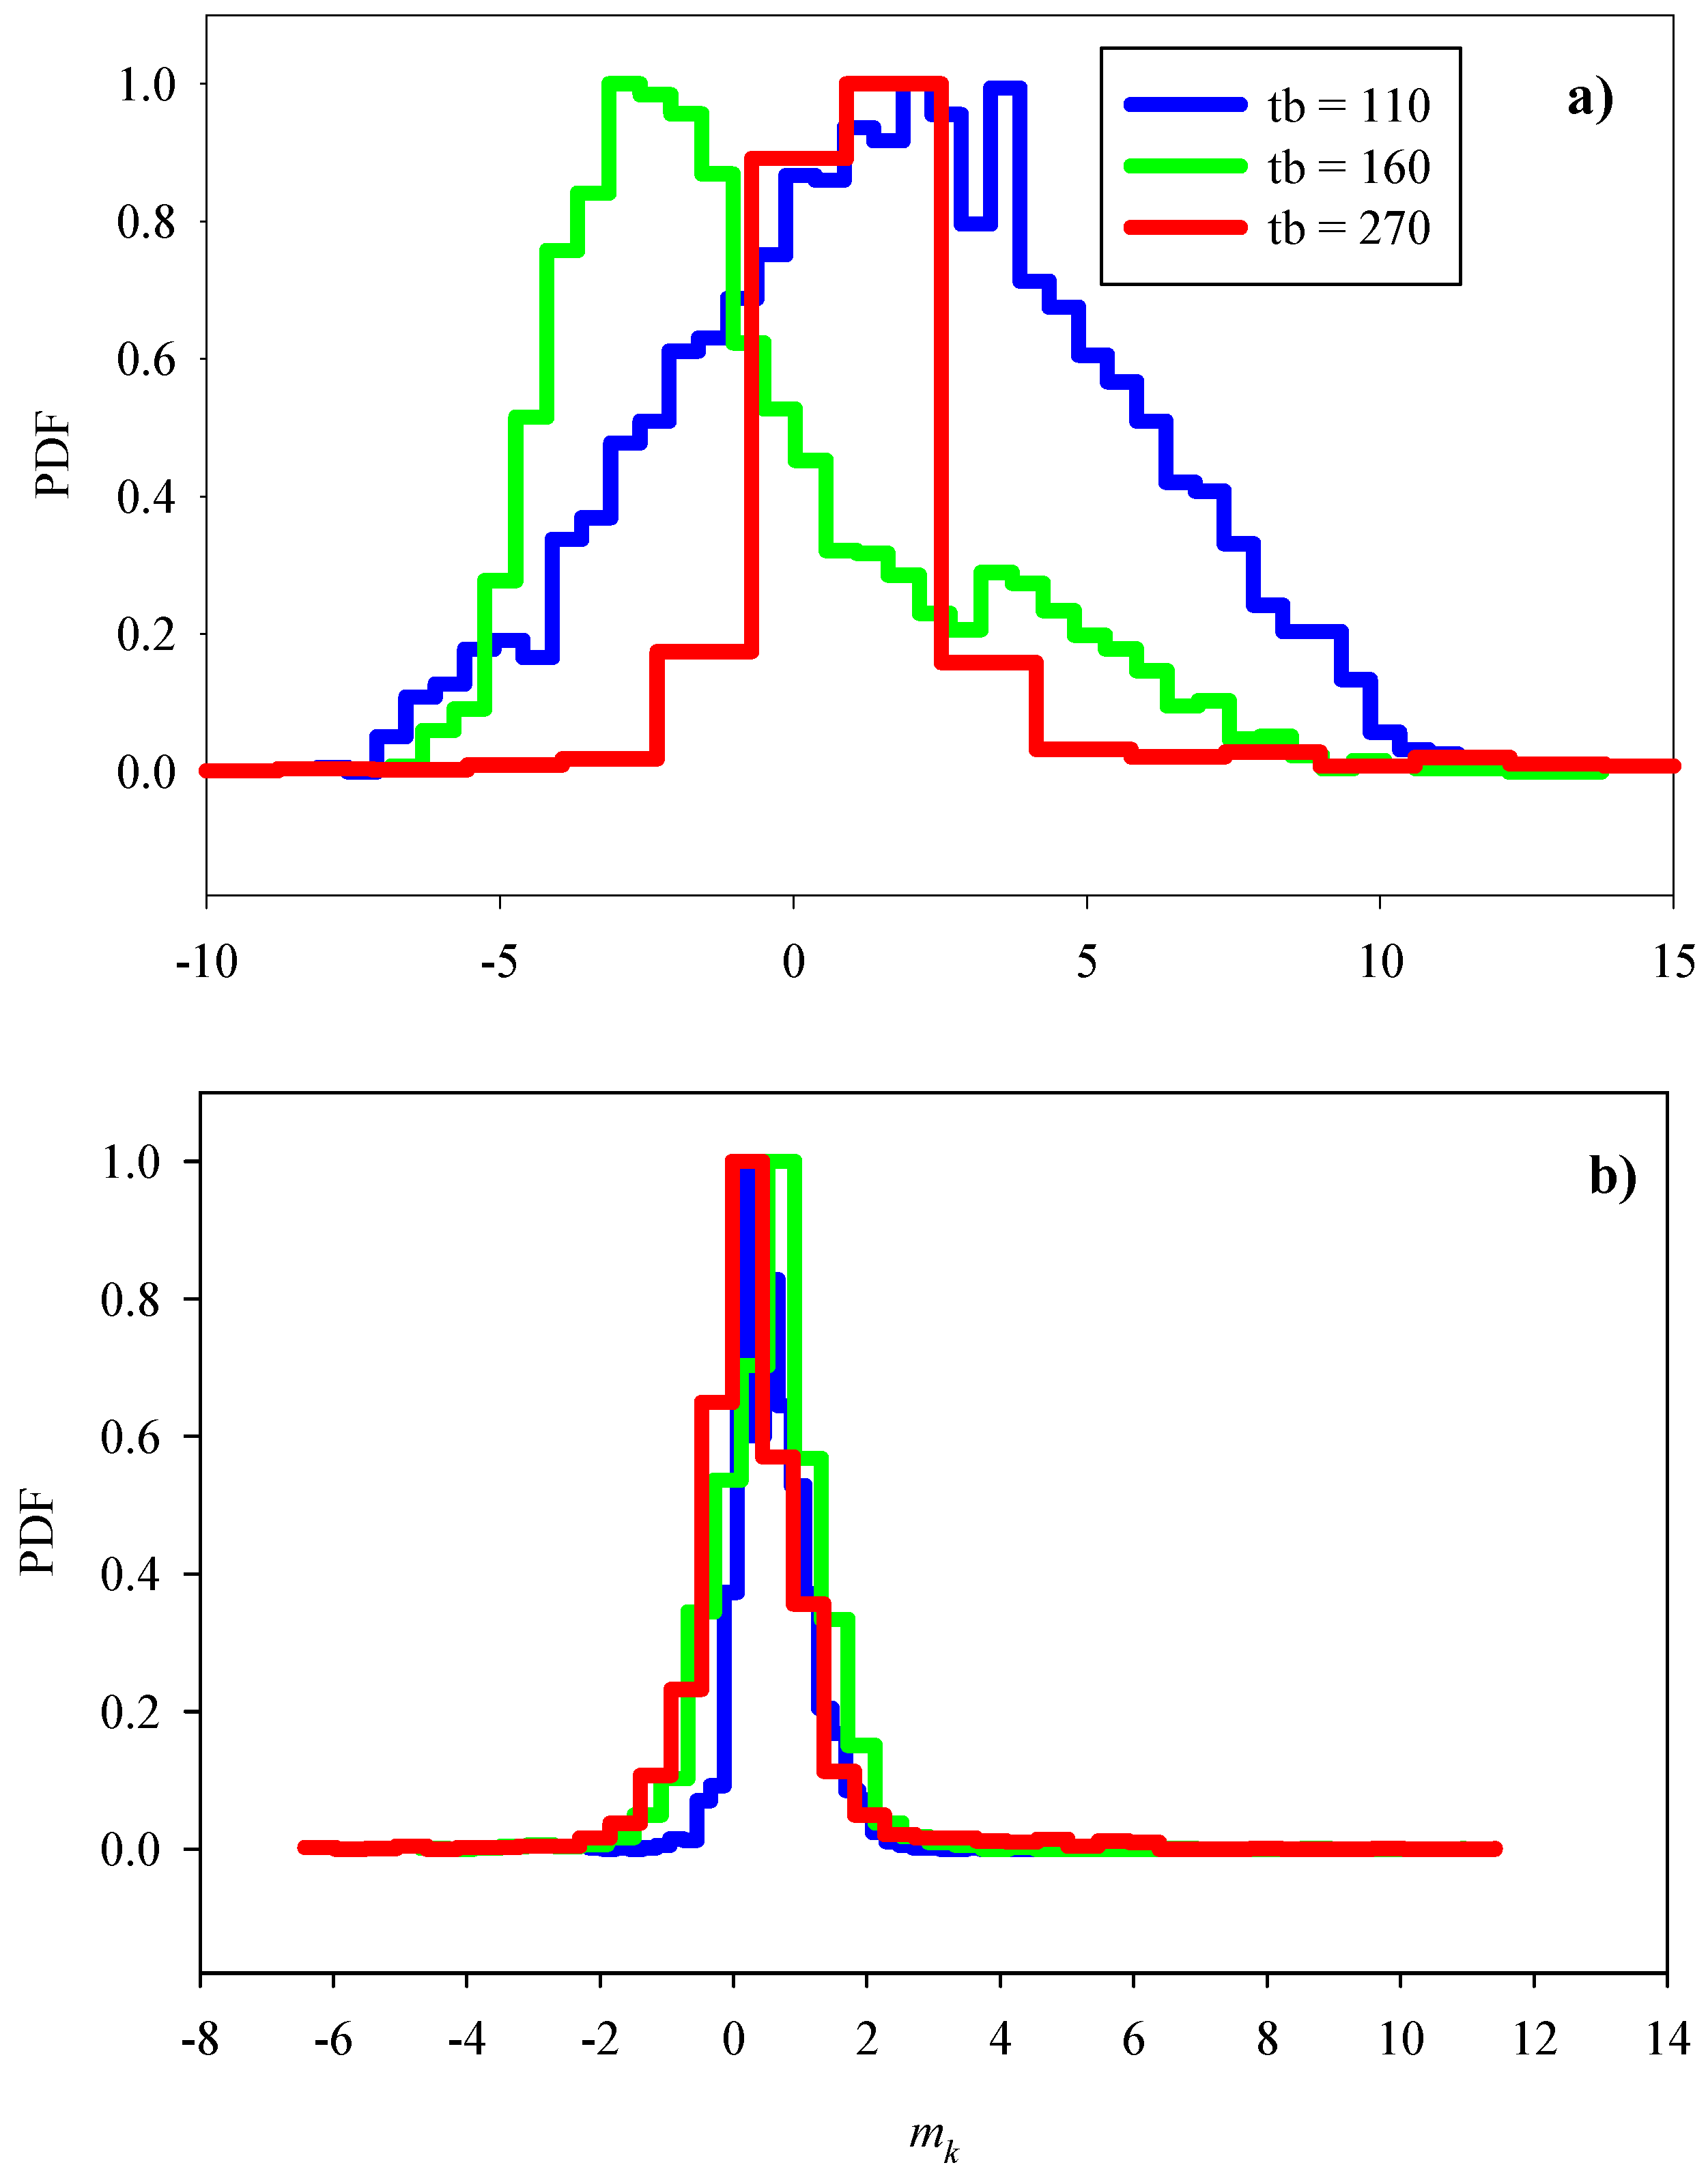
The probability distribution function (PDF) of mk values for on- and off-axis measurements obtained during the whole survey and at different detection times are presented in Figure 8. In general, the magnitude of the spectral backscattering slope for on-axis waveforms was substantially larger (i.e., more 100-fold for some samples) and more variable with respect to those corresponding to off-axis measurements.
Most mk values with a probability higher than 50% varied from −4.7 to +6.4 and from −0.5 to +1.3 for on- and off-axis receivers, respectively. For on-axis measurements, the distribution of mk values approximated a Gaussian function for time-bin 110 and 270 (Figure 8a). Conversely, the normalized PDF of spectral backscattering slopes for time-bin 160 was clearly left-skewed. Likewise, the magnitude of mk values at time bin 160 indicated a decrease of backscattering at longer wavelengths. For off-axis measurements, the shape of the normalized PDF was comparable between different detection times (Figure 8b). For time bins 110, 160, and 270, the arithmetic averages of mk during afternoon surveys were more positive (i.e., weaker decay of Xmix with range) with respect to those computed during morning hours (Table 3). In general, the S/N values for mk calculations were higher at time bin 160 followed in descending order by time bin 110 and 270.

4. Discussion

The interpretation of results is organized in four main sections encompassing the following topics: the advantages of using ICA for estimating direct and diffuse LiDAR-derived scattering components (1), the physical meaning of Ksys in terms of IOPs (2), the impact of environmental conditions (i.e., turbidity and water depth) on temporal and spatial variability of different types of LiDAR-derived scatterers (3), and interpretation of spectral backscattering variations in terms of size distribution and composition of suspended particulates based on published studies (4).

4.1. Direct/Diffuse Backscattering Components

The ICA algorithm was a useful technique to separate direct and diffuse scattering contributions at different time bins and wavelengths. Overall, ICA is a faster and more accurate technique for quantifying scattering sources than traditional Monte Carlo (MC) [9] and PCA (Principal Component Analysis) [23], respectively. Indeed, ICA does not need to follow the trajectory of each photon to elucidate its origin as MC simulations do and, unlike PCA methods, are capable to uncouple correlated interactions by discriminating different probability distributions as derived from higher moments around the mean. In this study, direct and diffuse backscattered photons were mainly associated with signals detected by on- and off-axis receivers, respectively. This can be explained by the larger proportion of photon collisions inside and outside the FOV, respectively. In terms of detection times, the largest reconstruction of direct and diffuse backscattering components corresponded to the exponential decay portion of waveforms where the S/N of backscattered photons was higher with respect to those values characteristics of the leading and tail waveform sections. Also, the better discrimination of direct and diffuse components at time bin 160 was attributed to the greater ‘Gaussianity’ of probability distribution functions for photons arriving at time bin 110 and 270 (i.e., where multiple scattering contributions increase).

4.2. LiDAR vs Ac-9 Optical Properties

The exponential decay of LiDAR backscattering power with range showed systematic differences among waveforms captured by off-axis and on-axis receivers. In general, the signal attenuation was more remarkable for on-axis waveforms and this was attributed to the dominance of single scattering (backscattering + forward-scattering). As multiple scattering increases and the light field becomes more diffuse (i.e., off-axis measurements), the magnitude of Ksys decreases approaching Kd [4,18,19]. For on-axis measurements, Ksys had a stronger covariation with c values and suggests that scattering rather than absorption is the driving process modulating Ksys in our measurements. As expected, this effect was more pronounced in the blue spectral range where backscattering of particulates and water generally increases with respect to green wavelengths.
The apparent insensitivity of Ksys(off-axis) to changes on IOPs distributions was likely attributed to the uncoupling of two important factors determining multiple scattering: path-length and water turbidity. For a constant c, multiple photon collisions are anticipated to augment at longer distances from the receiver. This multiple scattering regime is usually identified as a change on the backscattering slope (i.e., ln(Xmix) as a function of range). As c increases, this slope break is expected to move with the maximum path-radiance or common backscattering volume toward earlier detection times [23]. In fact, additional backscattering due to higher c values and greater contribution of multiple scattering leads to a shape deformation in the original waveform that is mainly characterized by backscattering slope changes in the leading and trailing sections and concurrent non-linear variations on Ksys. The optical configuration of the Oculus system is consistent with Ksys values that approximate c rather than Kd. Indeed, the composite product cR [19], where R is the illuminated spot at a specific range (e.g., 6.2, 9, and 15.1 m for time bins of 110, 160, and 270, respectively) was always very small (0.07 to 0.19) compared to 1. Likewise, light scattering was the dominant process determining LiDAR backscattering attenuation in our study and explained two important findings: (1) the response of Ksys(on-axis) to c changes was larger with respect to that associated with a variations, and (2) the larger magnitude of Ksys(on-axis) with respect to Ksys(off-axis). In the last case, the difference between Ksys values suggests that Ksys(on-axis) has an additional attenuation term due to scattering as Ksys(off-axis) is mainly driven by light absorption.

4.3. Diel and Spatial Patterns of Scatterers

A consistent pattern revealed by ICA at all detection times was the relatively low variability of ICA components during morning hours. This phenomenon was likely related to the sampling design and environmental differences regarding water types. In the first case, morning surveys were part of a time series and explain why transects (i.e., noon-afternoon profiles) were characterized by having larger changes on ICA values as spatial measurements include two sources of physical variability (local + advective). In the second case, the water optical properties of the morning dataset were different from those measured during the noon-afternoon datasets. Indeed, the water turbidity as inferred from c suggested a predominant oceanic (coastal) water type during morning (noon-afternoon) profiles. Since the average size of particulates increases with turbidity [17,24], larger backscattering features were likely more abundant late during the day when surveys were closer to the shore.
Assuming a negligible spatial variability between captures, the comparison of <SDI> and SDIct values for different sampling locations and times of the day suggested changes in mobility of scatterers during our surveys. Indeed, maximum values of similarity between lidargrams were found offshore. This observation was confirmed based on contrast index calculations (i.e., maximum SDIct values near the coast). The lack of coherence between LiDAR backscattering profiles near the coast was associated with higher water turbidity levels as inferred from c and associated changes in particle characteristics as discussed above. However, the motion of large-sized scatterers due to active swimmers (e.g., fish) [25] was likely another influencing factor. Reef fish along the south Florida shelf is known to be highly aggregated near the coast [26], thus it is likely that observed LiDAR backscattering patterns were partially related to fish distribution differences across the shelf. In general, <SDI> values associated with off-axis measurements were smaller with respect to those derived from on-axis measurements. This is not unexpected as off-axis measurements are dominated by diffuse scattering contributions that are less influenced by the presence of relatively ‘strong’, ‘large-sized’, and less common backscattering features (e.g., jellyfish) [27]. These relatively rare optical features were in part responsible for augmenting <SDI> associated with on-axis waveforms and preferentially those obtained nearshore and at shorter wavelengths.

4.4. Spectral Backscattering Variations

In general, on-axis waveforms were characterized by having a greater proportion of positive mk values (i.e., Xmix increases at longer wavelengths) with respect to those derived from off-axis measurements. This phenomenon was attributed to the greater sensitivity of on-axis measurements to ‘large-sized’ optical features (i.e., geometric cross-section much larger than LiDAR wavelength). Time-series off the Massachusetts coast have shown consistent differences in spectral backscattering between different particle size distributions as derived from backscattering meters [14]. Indeed, Slade et al. found more negative spectral backscattering slopes (λ = 488–715 nm) when suspended particulates within the size range 5–50 μm were dominated by finer size fractions. Loisel et al. [28] computed the spectral backscattering slopes for different marine regions around the globe based on satellite observations and concluded that most estimates vary between 0 and −3.5 with more positive values associated with eutrophic zones where suspended particulates are larger. Lastly, tank experiments using LiDAR [21] found that spectral backscattering slopes of Arizona dust (mean diameter = Dm = 4.5 μm) were generally smaller (−1.72 to 0.57) with respect to those (−0.24 to 2.17) derived from large-sized organic particles associated to a phytoplankton culture of I. galbana (Dm = 6.5 μm). Notice that LiDAR measurements made in [21] correspond to a biaxial geometry (i.e., detector and source are non-collocated), thus their resulting waveforms were more alike to our off-axis backscattering determinations.
The spectral composition of backscattered photons differed between relatively shallow and deep water locations (i.e., predominantly coastal and oceanic conditions, respectively) as mk values become more positive closer to the shore and during the afternoon (Table 3). This spatial trend was likely related to the greater proportion of ‘large-sized’ particulates and higher water turbidity near the shore. Spatial patterns on spectral beam attenuation, an optical proxy for particle size distribution [14], supports this hypothesis as high c(488)/c(532) ratios (i.e., a greater contribution of ‘small-sized’ particulates) tended to decrease closer to the shore (i.e., morning samples) (Figure A1, Appendix A). Gray et al. [21] pointed out a substantial increase of mk (e.g., −1.7 to −0.24 and 0.57 to 2.17 in clear and turbid waters, respectively) in turbid waters (i.e., up to a 6.5-fold increase of c(550)). Also, results on [21] showed composition effects on mk with more positive and negative values associated with organic-dominated (−0.24 to +2.17) and mineral-dominated (−1.72 to +0.57) particulates, respectively. In this study, the range of mk values derived from off-axis receivers suggests that particle assemblages had an intermediate chemical composition between inorganic-rich and organic-rich case studies. Likewise, the increase of mk values toward the coast in our surveys indicates that particle composition effects on mk were secondary with respect to those associated with PSD and/or turbidity changes.

5. Conclusions

The discrimination of underwater optical features and characterization of scatterers by standard LiDAR configurations is limited due to their relatively poor spectral resolution and low signal/noise ratios. In this study, Oculus, a new multispectral LiDAR system was applied to understand scattering sources and their relationships with IOPs and scatterer types in shelf waters off the South Florida coast. In general, ICA suggested a more defined separation between direct and diffuse scattering contributions along the exponential decay of Xmix due to a higher S/N and the ‘non-Gaussianity’ behavior of the probability distribution function. This waveform region is commonly used to compute Ksys (range or non-range resolved LiDAR attenuation coefficient) and estimate IOPs. In our case, Ksys variability was linked to c as supported by in situ measurements and theoretical considerations. The complimentary use of SDI/SDIct and mk was useful to identify scatterers in terms of their properties and distribution patterns. Indeed, structure dissimilarity indexes suggested a greater mobility of scatterers near the coast where mk also indicated a greater predominance of relatively large-sized particulates and more turbid conditions.

Author Contributions

Conceptualization, M.A.M. and A.K.V.; methodology, M.A.M.; software, B.B.; validation, B.M.; formal analysis, M.A.M.; investigation, M.A.M.; resources, A.K.V.; data curation, M.A.M.; writing—original draft preparation, M.A.M.; writing—review and editing, M.A.M. and A.K.V.; visualization, M.A.M.; supervision, A.K.V.; project administration, A.K.V.; funding acquisition, A.K.V. All authors have read and agreed to the published version of the manuscript.

Funding

This work was supported by the NOAA award NA140AR4320260 to the Cooperative Institute for Ocean Exploration, Research and Technology. The authors gratefully acknowledge support from the NOAA CIOERT at HBOI/FAU.

Institutional Review Board Statement

Not applicable.

Data Availability Statement

The raw/processed data required to reproduce these findings cannot be shared at this time as the data also forms part of an ongoing study.

Conflicts of Interest

The authors declare no conflict of interest. The funders had no role in the design of the study; in the collection, analyses, or interpretation of data; in the writing of the manuscript, or in the decision to publish the results.

Appendix A

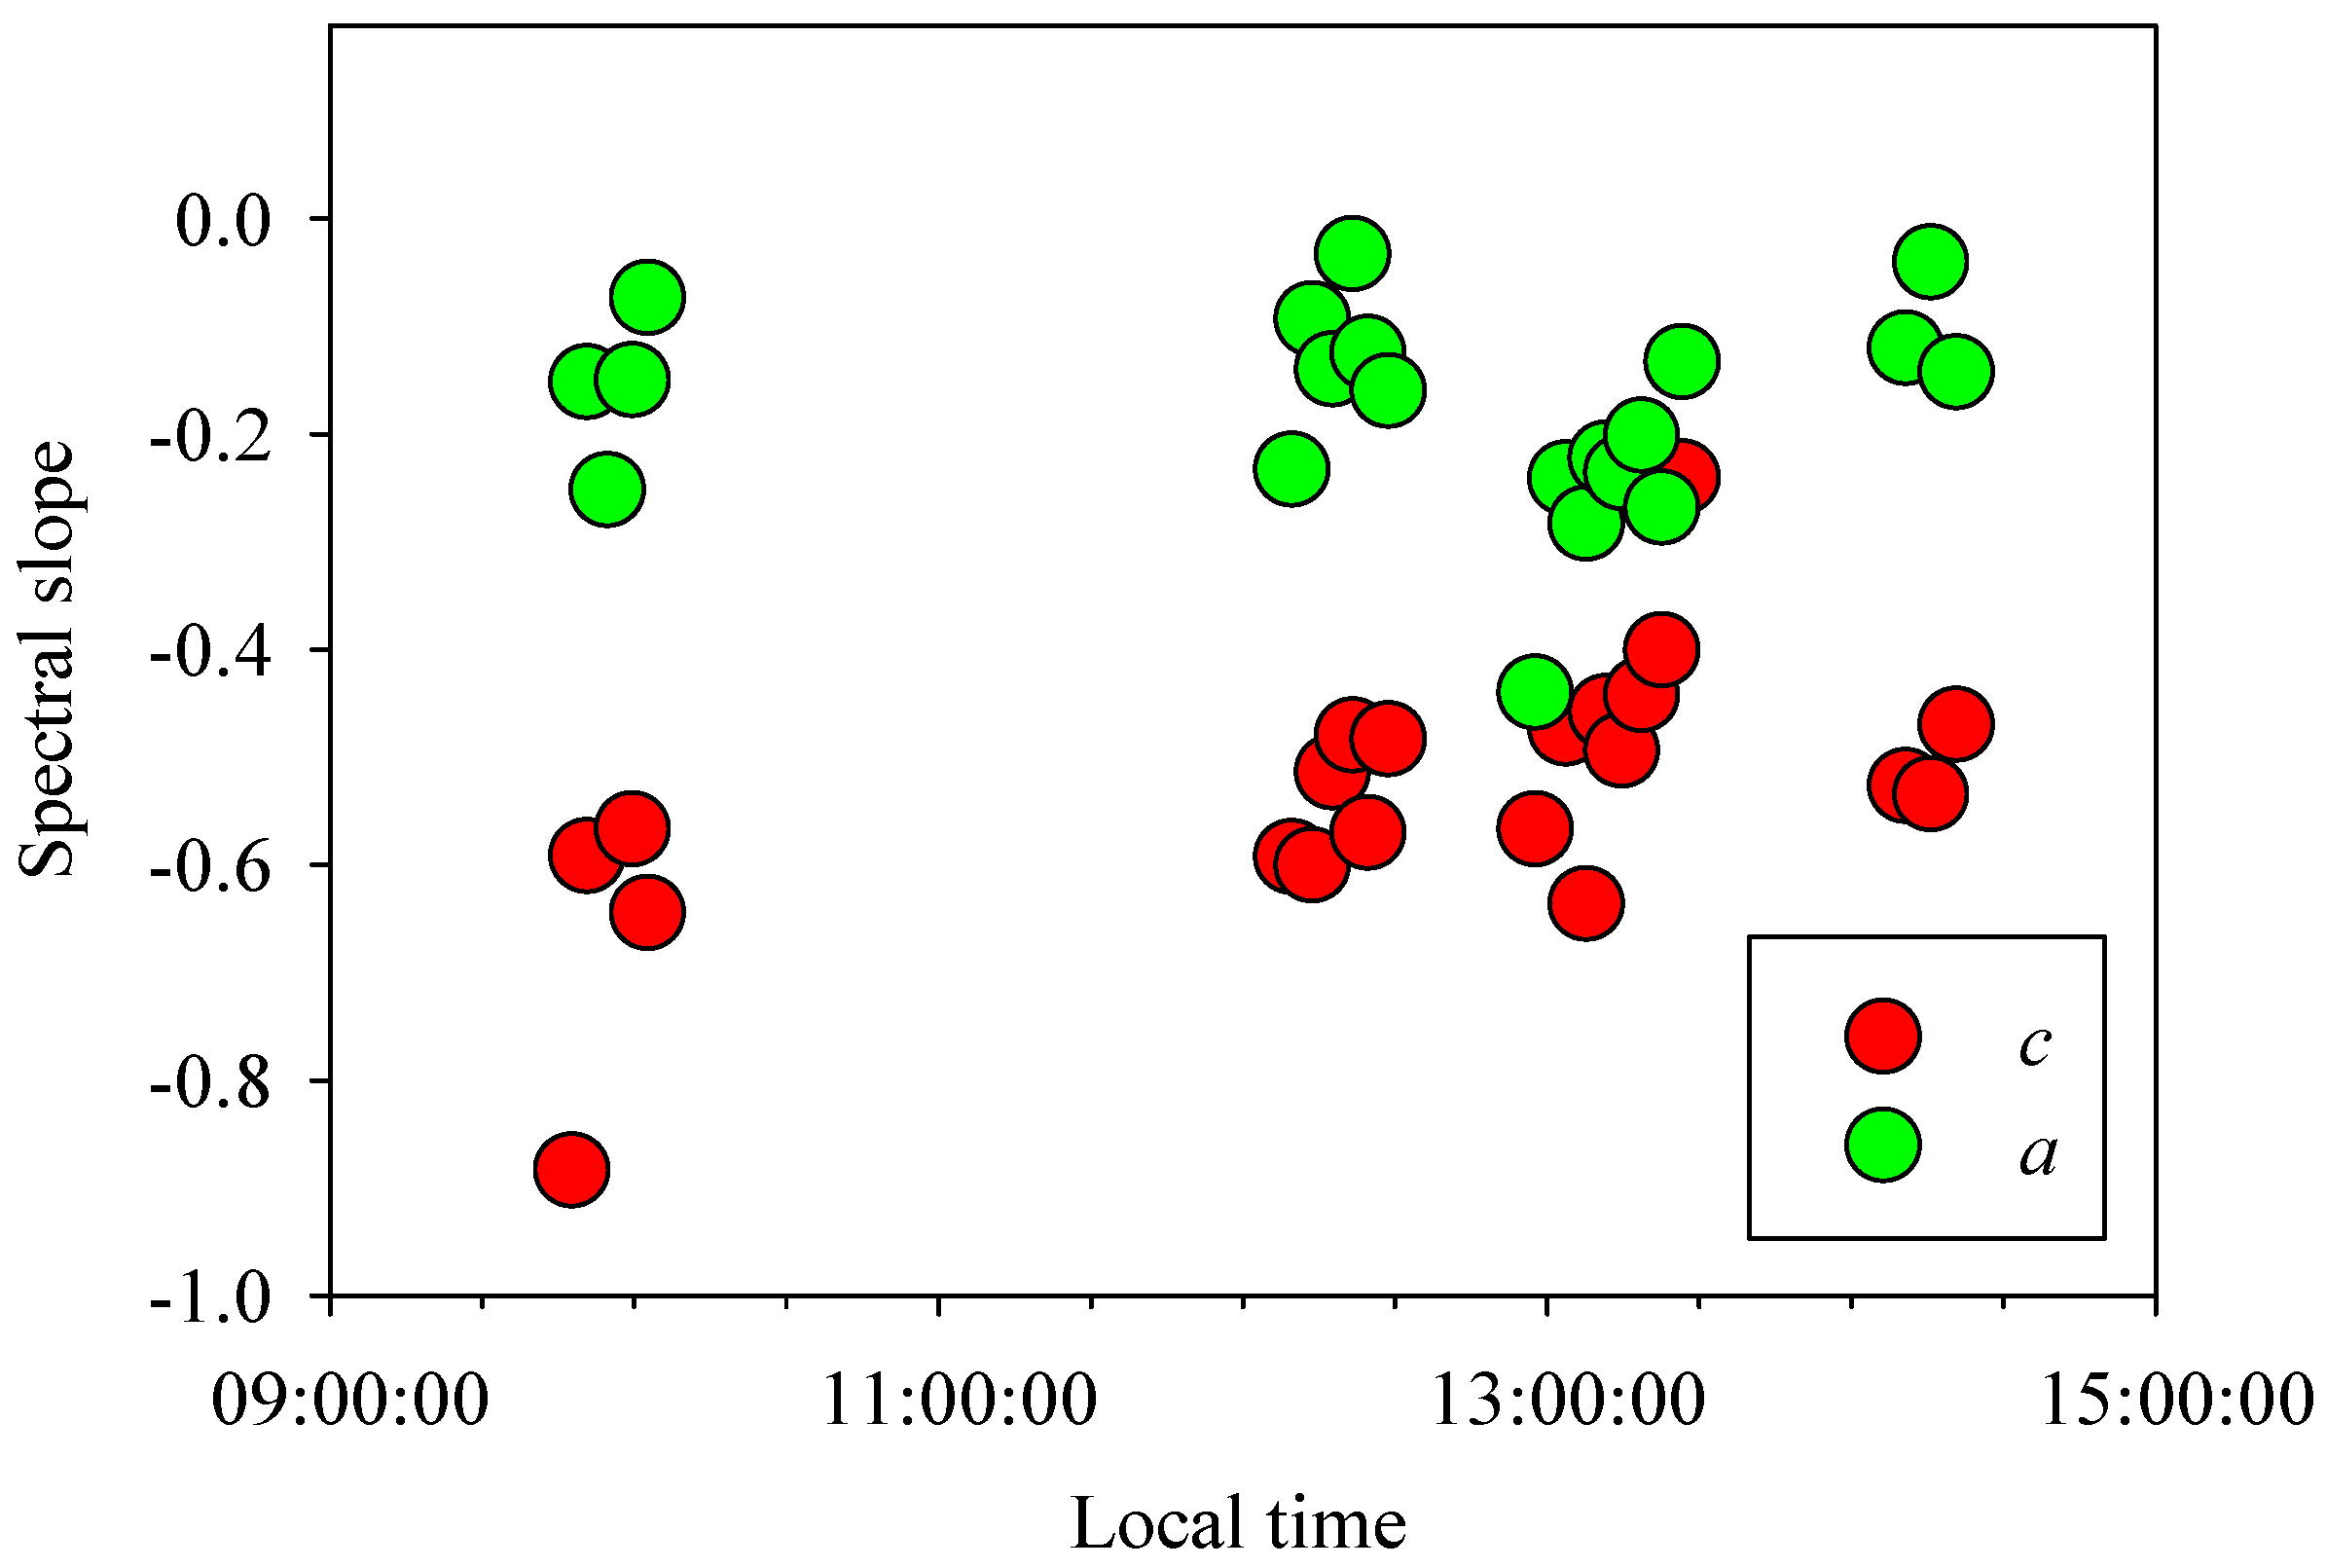
Figure A1. Temporal variability of spectral slopes for IOPs derived from ac-9 and based on Boss et References. Beam attenuation coefficient (red circles), total absorption (water + particulates) coefficient (red circles).
Remotesensing 13 02475 g0a1

References

  1. Hoge, C.W.F.E.; Wright, W.B.; Krabill, R.R.; Buntzen, G.D.; Gilbert, R.N.; Swift, R.N.; Yungel, J.K.; Berry, R.E. Airborne lidar detection of subsurface oceanic scattering layers. App. Opt. 1998, 27, 3969–3977. [Google Scholar] [CrossRef]
  2. Churnside, J.H.; Donaghay, P.L. Thin scattering layers observed by airborne lidar. ICES J. Mar. Sci. 2009, 66, 778–789. [Google Scholar] [CrossRef]
  3. Montes-Hugo, M.A.; Churnside, J.H.; Gould, R.W.; Arnone, R.A.; Foy, R. Spatial coherence between remotely sensed ocean color data and vertical distribution of lidar backscattering in coastal stratified waters. Remote Sens. Environ. 2010, 114, 2584–2593. [Google Scholar] [CrossRef]
  4. Montes, M.A.; Churnside, J.; Lee, Z.; Gould, R.; Arnone, R.; Weidemann, A. Relationships between water attenuation coefficients derived from active and passive remote sensing: A case study from two coastal environments. Appl. Opt. 2011, 50, 2990–2999. [Google Scholar] [CrossRef]
  5. Montes, M.A.; Vuorenkoski, A.K.; Dalgleish, F.R.; Ouyang, B. Characterization of underwater scattering layers based on variance components of LiDAR backscattering. Opt. Exp. 2019, 27, A1084–A1108. [Google Scholar] [CrossRef] [PubMed]
  6. Brown, E.D.; Churnside, J.H.; Collins, R.L.; Veenstra, T.; Wilson, J.J.; Abnett, K. Remote sensing of capelin and other biological features in the North Pacific using lidar and video technology. ICES J. Mar. Sci. 2002, 59, 1120–1130. [Google Scholar] [CrossRef]
  7. Churnside, J.H.; Marchbanks, R.D.; Donaghay, P.L.; Sullivan, J.M.; Graham, W.M.; Wells, R.J.D. Hollow aggregations of moon jellyfish (Aurelia spp.). J. Plank. Res. 2016, 38, 122–130. [Google Scholar] [CrossRef] [Green Version]
  8. Clavano, W.J.; Boss, E.S.; Karp-Boss, L. Inherent optical properties of non-spherical marine-like particles -from theory to observation. Oceanogr. Mar. Biol. 2007, 245, 11–38. [Google Scholar]
  9. Montes, M.; Carder, K. Monte Carlo simulations as a tool to optimize target detection by AUV/ROV laser line scanners. In Proceedings of the SPIE—The International Society for Optical Engineering, Orlando, FL, USA, 19 May 2005; p. 5799. [Google Scholar]
  10. Strait, C.; Twardowski, M.; Dalgleish, F.; Tonizzo, A.; Vuorenkoski, A. Development and assessment of lidar modeling to retrieve IOPs. In Proceedings of the SPIE: Ocean Sensing and Monitoring X, Orlando, FL, USA, 25 May 2018; p. 10631. [Google Scholar]
  11. Montes-Hugo, M.A.; Gould, R.; Arnone, R.; Ducklow, H.; Carder, K.; English, D.; Schofield, O.; Kerfoot, J. Beyond the first optical depth: Fusing optical data from ocean color imagery and gliders. In Proceedings of the SPIE 7459, Ocean Remote Sensing: Methods and Applications, San Diego, CA, USA, 19 August 2009; p. 74590N. [Google Scholar]
  12. Aulicino, G.; Cotroneo, Y.; Lacava, T.; Sileo, G.; Fusco, G.; Carlon, R.; Satriano, V.; Pergola, N.; Tramutoli, V.; Budillon, G. Results of the first Wave Glider experiment in the Southern Tyrrhenian Sea. Adv. Oceanogr. Limnol. 2016, 7, 16–35. [Google Scholar] [CrossRef] [Green Version]
  13. Wang, Z.; Bovik, A.; Sheikh, H.; Simoncelli, E. Image quality assessment: From error visibility to structural similarity. IEEE Trans. Image Process 2004, 13, 600–612. [Google Scholar] [CrossRef] [PubMed] [Green Version]
  14. Slade, W.H.; Boss, E. Spectral attenuation and backscattering as indicators of average particle size. App. Opt. 2015, 54, 7264–7277. [Google Scholar] [CrossRef] [PubMed]
  15. Hyvärinen, A.; Oja, E. Independent Component Analysis: Algorithms and Applications. Neural Netw. 2000, 13, 411–430. [Google Scholar] [CrossRef] [Green Version]
  16. Luchinin, A.G.; Kirillin, M.Y.; Dolin, L.S. Backscatter signals in underwater lidars: Temporal and frequency features. Appl. Opt. 2018, 57, 673–677. [Google Scholar] [CrossRef]
  17. Mohammadpour, G.; Gagné, J.P.; Larouche, P.; Montes-Hugo, M. Optical properties of size fractions of suspended particulate matter in littoral waters of Quebec. Biogeosciences 2017, 14, 5297–5312. [Google Scholar] [CrossRef] [Green Version]
  18. Walker, R.E.; McLean, J.W. Lidar equations for turbid media with pulse stretching. Appl. Opt. 1999, 38, 2384–2397. [Google Scholar] [CrossRef] [PubMed]
  19. Gordon, H.R. Interpretation of airborne oceanic lidar: Effects of multiple scattering. Appl. Opt. 1982, 21, 2996–3001. [Google Scholar] [CrossRef]
  20. Sokal, R.R.; Rohlf, J. Biometry: The Principles and Practices of Statistics in Biological Research, 3rd ed.; W.H. Freeman: New York, USA, 2009; 880p. [Google Scholar]
  21. Gray, D.; Anderson, J.; Nelson, J.; Edwards, J. Using a multiwavelength LiDAR for improved remote sensing of natural waters. Appl. Opt. 2015, 54, F232–F242. [Google Scholar] [CrossRef]
  22. Boss, E.; Pegau, W.S.; Lee, M.; Twardowski, M.; Shybanov, E.; Korotaev, G.; Baratange, F. Particulate backscattering ratio at LEO 15 and its use to study particle composition and distribution. J. Geophys. Res. Atm. 2004, 109. [Google Scholar] [CrossRef] [Green Version]
  23. Montes, M.; Vuorenkoski, A.K.; Dalgleish, F.R.; Ouyang, B. Weibull approximation of LiDAR waveforms for estimating the beam attenuation coefficient. Opt. Expr. 2016, 24, 22670–22681. [Google Scholar] [CrossRef] [PubMed]
  24. Boss, E.; Twardowski, M.S.; Herring, S. Shape of the particulate beam attenuation spectrum and its inversion to obtain the shape of particulate size distribution. Appl. Opt. 2001, 40, 4885–4893. [Google Scholar] [CrossRef]
  25. Dubrovinskaya, E.; Dalgleish, F.; Ouyang, B.; Casari, P. Underwater LiDAR Signal Processing for Enhanced Detection and Localization of Marine Life. In Proceedings of the MTS/IEEE OCEANS, Kobe, Japan, 28–31 May 2018. [Google Scholar]
  26. Lindeman, K.C. Development of Grunts and Snappers of Southeast Florida; Crossshelf Distributions and Effects of Beach Management Alternatives. Ph.D. Thesis, University of Miami, Coral Gables, FL, USA, 1997. Unpublished. [Google Scholar]
  27. Van der Zande, D.; Green, J.; Ruddick, K. JellySpec: Feasibility study for determining the spectral characteristics of jellyfish from Belgian waters. In Proceedings of the Ocean Optics XXII Conference, Portland, OR, USA, 26–31 October 2014. [Google Scholar]
  28. Loisel, H.; Nicolas, J.M.; Sciandra, A.; Stramski, D.; Poteau, A. Spectral dependency of optical backscattering by marine particles from satellite remote sensing of the global ocean. J. Geophys. Res. 2006, 111, C09024. [Google Scholar] [CrossRef]
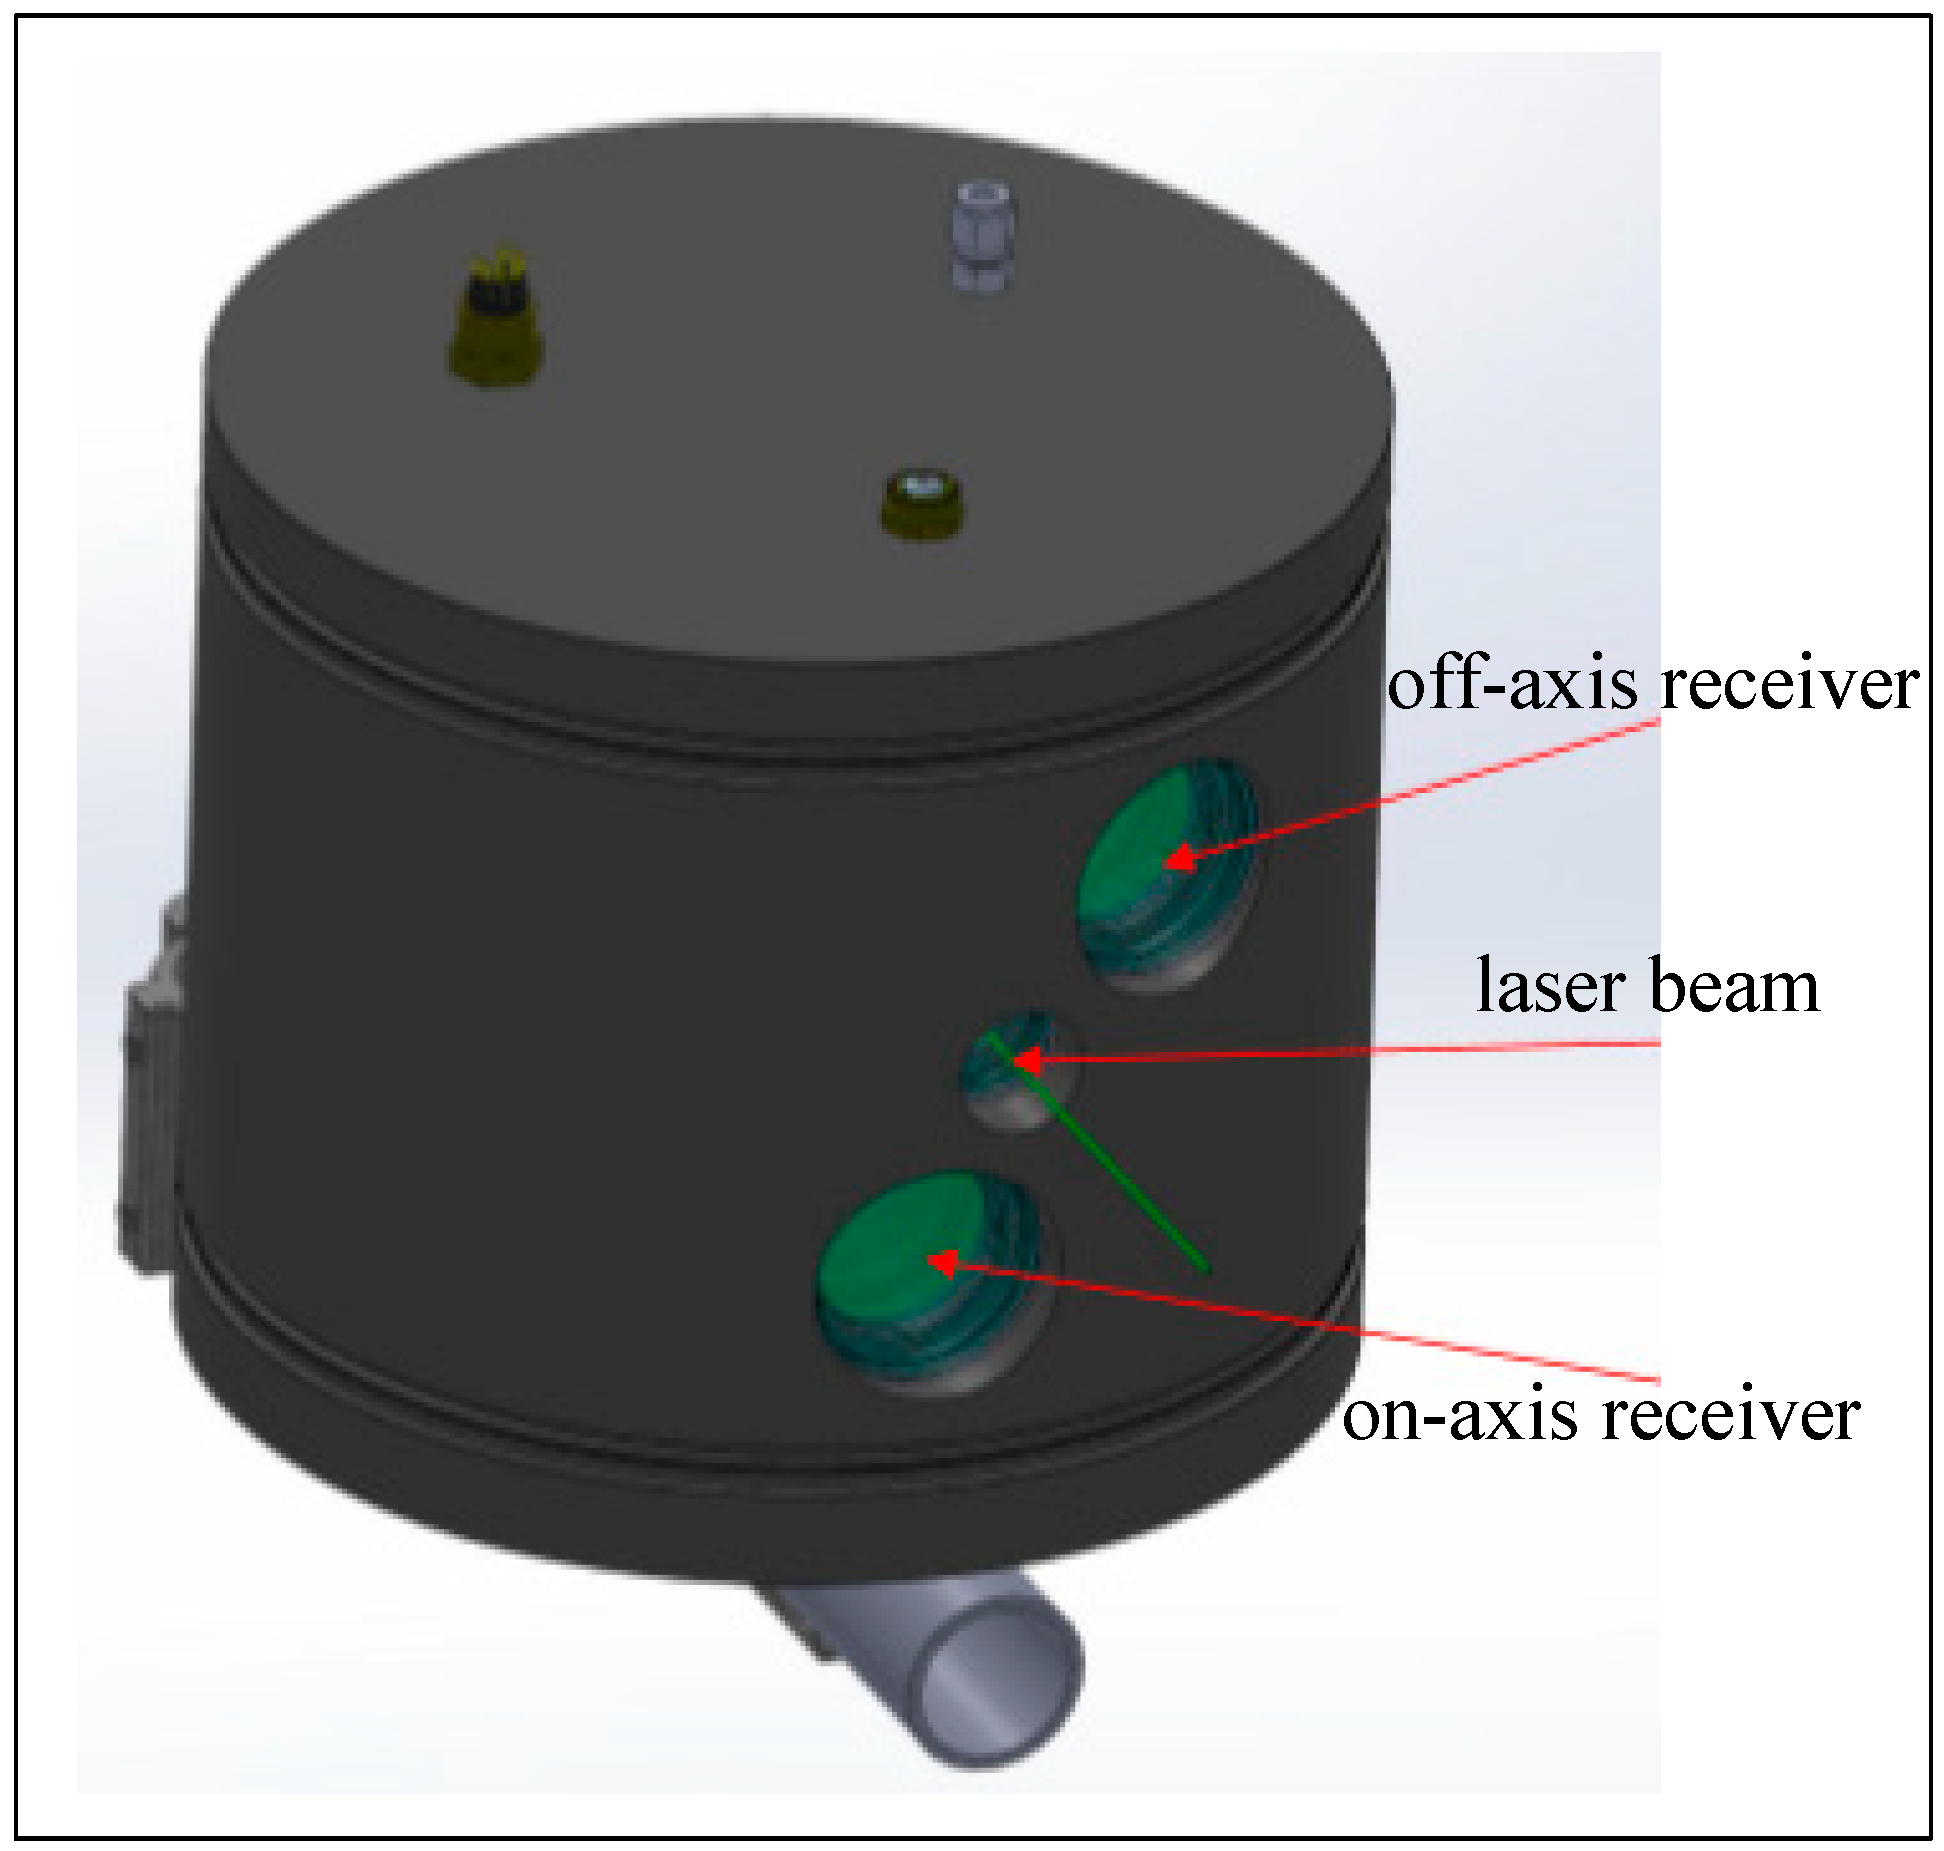
Figure 1. The Oculus system. The laser beam at each wavelength has the same origin.
Remotesensing 13 02475 g001
Figure 2. Oculus deployment. Standby position (a), operational position (b), optical package launch (c).
Remotesensing 13 02475 g002
Figure 3. Mean range-resolved waveforms per capture. (a) 9:36 a.m., (b) 12:58 p.m. Time bins 110, 160 and 270 (vertical magenta lines).
Remotesensing 13 02475 g003
Figure 4. Reconstructed S sources. λ = 473 nm (left panels), λ = 532 nm (right panels), time bin 110 (top panels, a,b), 160 (middle panels, c,d) and 270 (bottom panel, e,f); 1:1 relationships (solid line), r2 for direct (magenta) and diffuse (black) ICA components.
Remotesensing 13 02475 g004
Figure 5. ICA components associated with direct- (IC1, black dots) and diffuse-dominated (IC2,magenta dots) backscattering components. λ = 473 nm (left panels, a,c,e), λ = 532 nm (right panels, b,d,f), time bin 110 (top panels, a,b), 160 (middle panels, c,d) and 270 (bottom panels, e,f).
Remotesensing 13 02475 g005
Figure 6. Relationships between Ksys and IOPs. (a) c vs Ksys(on-axis), (b) a vs Ksys(on-axis), and (c) Ksys(off-axis) vs Ksys(on-axis). Regression functions (solid lines).
Remotesensing 13 02475 g006
Figure 7. Structural dissimilarity of lidargrams as a function of time. <SDI> (upper panels, a,b, circles), SDIct (lower panels, c,d, triangles). λ = 473 nm (left panels, a,c), λ = 532 nm (right panels, b,d), on-axis (solid circles), off-axis (empty circles); black (9:36–10:03 a.m.), grey (12:10–13:27) and red (14:11–14:21).
Remotesensing 13 02475 g007
Figure 8. The normalized probability distribution function of mk. (a) on-axis, (b) off-axis. tb is the time bin.
Remotesensing 13 02475 g008
Table 1. Summary of acronyms.
DefinitionUnits
FOVField-of-View
IOPInherent optical property
ICAIndependent Component Analysis
SSIStructural Similarity Indexdimensionless
SDIStructural Dissimilarity Indexdimensionless
SDIctSDI contrastdimensionless
lumLuminancedimensionless
ctContrastdimensionless
stStructuredimensionless
λWavelength of LiDAR sourceNm
ATotal absorption coefficientm−1
cBeam attenuation coefficientm−1
nwRefractive index of seawaterdimensionless
npRefractive index of particulatesdimensionless
KsysSystem attenuation coefficient m−1
KdDiffuse attenuation coefficient of downwelling irradiancem−1
XmixBackscattering powerRelative units
mkSpectral slope of Xmixdimensionless
SSource signalRelative units
SrecReconstructed source signalRelative units
Table 2. Segmentation of LiDAR measurements based on time-resolved power variation.
λ (nm)ReceiverWaveform PortionTime Bin Range
473On-axisLeading107–142
Off-axis 100–113
On-axisExponential attenuation138–300
Off-axis 115–200
On-axisTrailing240–363
Off-axis 139–290
532On-axisLeading104–146
Off-axis 105–115
On-axisExponential attenuation146–300
Off-axis 117–200
On-axisTrailing250–350
Off-axis 142–280
Table 3. Mean spectral slopes for different times of the day. <mk> arithmetic average of mk.
Time BinReceiverMorningNoon-Afternoon
<mk>S/N<mk>S/N
110on-axis1.842.23.922.8
off-axis0.64 1.20
160on-axis−3.1617.80.0612.5
off-axis0.16 0.42
270on-axis−0.381.61.401.4
off-axis−0.04 0.18
Publisher’s Note: MDPI stays neutral with regard to jurisdictional claims in published maps and institutional affiliations.