Article

The Impact of Climate Change on the Surface Albedo over the Qinghai-Tibet Plateau

1
College of Environment and Planning, Henan University, Kaifeng 475004, China
2
Qianyanzhou Ecological Research Station, Key Laboratory of Ecosystem Network Observation and Modeling, Institute of Geographic Sciences and Natural Resources Research, Chinese Academy of Sciences, Beijing 100101, China
*
Author to whom correspondence should be addressed.
Remote Sens. 2021, 13(12), 2336; https://doi.org/10.3390/rs13122336
Submission received: 17 April 2021 / Revised: 1 June 2021 / Accepted: 11 June 2021 / Published: 15 June 2021
(This article belongs to the Special Issue Remote Sensing of Ecosystems in Cold Regions)

Abstract

:
Albedo is a characterization of the Earth’s surface ability to reflect solar radiation, and control the amount of solar radiation absorbed by the land surface. Within the context of global warming, the temporal and spatial changes of the albedo and its response to climate factors remain unclear. Based on MCD43A3 (V005) albedo and meteorological data (i.e., temperature and precipitation), we analyzed the spatiotemporal variations of albedo (2000–2016) and its responses to climate change during the growing season on the Qinghai-Tibet Plateau (QTP). The results indicated an overall downward trend in the annual albedo during the growing season, the decrease rate was 0.25%/decade, and the monthly albedo showed a similar trend, especially in May, when the decrease rate was 0.53%/decade. The changes also showed regional variations, such as for the annual albedo, the areas with significant decrease and increase in albedo were 181.52 × 10³ km2 (13.10%) and 48.82 × 10³ km2 (3.52%), respectively, and the intensity of albedo changes in low-elevation areas was more pronounced than in high-elevation areas. In addition, the annual albedo-temperature/precipitation relationships clearly differed at different elevations. The albedo below 2000 m and at 5000–6000 m was mainly negatively correlated with temperature, while at 2000–4000 m it was mainly negatively correlated with precipitation. The contemporaneous temperature could negatively impact the monthly albedo in significant ways at the beginning of the growing season (May and June), whereas in the middle of the growing season (July and August), the albedo was mainly negatively correlated with precipitation, and at the end of the growing season (September), the albedo showed a weak correlation with temperature/precipitation.

Graphical Abstract

1. Introduction

Climate change is a global problem, and effectively mitigating and responding to global warming has always been the frontier and mission of global change science. The impacts of terrestrial ecosystems on global temperature mainly include the enhancement/mitigation of greenhouse gases (GHGs) in the atmosphere and changing the Earth’s surface energy budget. Albedo is the ratio of the reflected radiation from a surface to the total incident radiation on the Earth’s surface, and it is an important physical parameter that restricts the surface radiation balance [1,2,3]. It is also the most essential parameter for reflecting land surface characteristics in land surface process models [4]. In the ecosystem, albedo changes the physical, physiological, and biogeochemical processes (e.g., energy balance, evapotranspiration, photosynthesis, and respiration) of the ecosystem by affecting microclimate conditions and the radiation absorption of the plant canopy while thoroughly determining the soil-atmosphere heat cycle process [5,6,7].
Moreover, albedo can regulate regional climate events. Charney et al. [8] showed that an increase in albedo would lead to a decrease in radiation flux traveling from the land surface and thus reduce convective clouds and precipitation. Moreover, Knorr et al. [9] found that the increase in surface albedo was the main reason for the decrease in summer rainfall in the Sahel and the southern Sahara margins. In turn, changes in temperature and precipitation also had a profound impact on albedo. Due to the mutual feedback mechanism between the climate system and the surface albedo, the impact of climate change on albedo is of great significance, especially for systems that are highly sensitive to climate change, such as the Qinghai-Tibet Plateau (QTP) [10,11]. Previous studies have shown that global warming is more prominent in the QTP, and the warming rate is about twice the global average [12,13]. This rapid climate change, increasing human activities, and special geographical processes have strong impacts on the natural environment, resources, and energy allocation on the plateau and surrounding areas, also affecting the exchange of energy between the atmosphere and the biosphere.
In recent years, many scholars have studied the spatial and temporal distribution, variation, and influencing factors of surface albedo at different scales in view of regional energy balance changes [14,15,16]. These studies focus on land cover changes (such as snow/ice cover, green vegetation degree, etc.) and other factors (such as aerosol, clouds, etc.). However, temperature and precipitation change the albedo through the properties of the underlying surface (e.g., vegetation dynamics, soil moisture, soil color, etc.). Culf et al. [17] found that albedo decline in forests was due to the action of dark leaves and dark soil under wet conditions. Berbert and Costa [18] found that the albedo of pastures varied with dry and wet conditions throughout the year, but the variation was not as obvious as that of the forest landscape. Therefore, on the QTP, we do not know the effect of significant temperature increase and predicted change on the albedo. What will the synergistic changes between them be? Is there spatiotemporal consistency? It is critical to understand the characteristics of spatiotemporal variation in the albedo over the QTP. Exploring the correlation between surface albedo and climatic factors has important scientific significance for analyzing and predicting the future trend of global climate change.
In this study, MODIS albedo gap-filled snow-free products (MCD43A3 (V005)) and a meteorological dataset are used to investigate the spatiotemporal distribution characteristics of the albedo and discuss the correlation between albedo and temperature and precipitation on the QTP during the growing season. This discussion will reveal the response mechanism of the surface albedo to climatic factors and provide a reference for climate models.

2. Materials and Methods

2.1. Study Area and Data Source

The QTP (26.5–39.5°N, 78.3–103°E) is situated in southwest China and covers approximately 2.57 × 10⁶ km2 (Figure 1a). The growing season for most of the alpine vegetation is normally from May to September [19]. The total incoming radiation on the TP is between 5850 J/m2 and 7950 J/m2, and the average is higher than 6000 J/m2, which is the highest value in China. The mean annual temperature is 1.7 °C (the coldest month and the warmest month are approximately −10 °C and 10 °C, respectively), and the mean annual precipitation is 580 mm, which is mainly concentrated in the growing season. In terms of spatial distribution, temperature and precipitation gradually decrease from southeast to northwest. Our study focuses on the alpine grasslands, which occupy nearly 70% of the QTP [11]. From northwest to southeast, six grassland vegetation types stretch across the plateau: temperate steppe (3.61%), alpine meadow steppe (4.21%), low land meadow (6.74%), alpine desert steppe (7.41%), alpine steppe (30.98%), and alpine meadow (47.5%) [1] (Figure 1b).
A 16-day composite MCD43A3 (V005) albedo product with a 500 m spatial resolution was obtained from the Land Processes Distributed Active Archive Center (LPACC), and the time range of the data was the growing season (i.e., 1 May to 30 September) from 2000 to 2016 (http://reverb.echo.nasa.gov/reverb/, accessed on 3 June 2018). MCD43A3 provides black-sky albedo (BSA) (directional-hemispherical reflectance) and white-sky albedo (WSA) (bi-hemispherical reflectance) data at local solar noon for MODIS bands 1 through 7 and the visible, near-infrared (NIR), and shortwave bands [20]. Here, we chose the WSA-shortwave albedo products.
The meteorological dataset, which has a 1 km spatial resolution, was provided by the Resource and Environmental Science Data Center (http://resdc.cn/, accessed on 20 July 2018), and the time range of the data was from 2000 to 2015. This dataset was generated through spatial interpolation based on the daily observation data of weather stations. Here, the meteorological data were examined for the period from February to September. To keep the spatial resolution consistent with the albedo, we re-sampled the data to 500 m resolution.
The digital elevation model (DEM) data, which has a 90 m spatial resolution, was provided by the International Scientific and Technical Data Mirror Site, Computer Network Information Center, Chinese Academy of Sciences (http://www.gs-cloud.cn, accessed on 23 July 2018). With a similar operation process, we re-sampled elevation data to 500 m resolution. To explore the altitude-dependent patterns of the correlation between the albedo with temperature/precipitation, we divided the altitude into 6 gradients (<2000 m, 2000–3000 m, 3000–4000 m, 4000–5000 m, 5000–6000 m, >6000 m).

2.2. Methods

The monthly albedo and the annual mean albedo were calculated using Formulas (1) and (2), respectively:
albedo m i n = Min ( albedo a , albedo b )
albedo m e a n = 1 5 i = 1 5 a l b e d o m i n , i
where albedomin was the minimum albedo value of each month; albedoa and albedob were the 16-day-based MODIS product of each month, respectively; albedomean was the annual mean value in the growing season of the albedo; and i was the months of May, June, July, August, and September, respectively.
Linear regression was used to analyze the changing trends of the albedo. We calculated the average annual and monthly albedo to estimate the rate of change (i.e., the slope of a linear trend) for each pixel and tested the statistical significance of the slope of the regression equation with the t-test. The 99% (p < 0.01) and 95% (p < 0.05) confidence intervals were used as thresholds to classify the significance and intermediates of positive and negative trends, respectively, and when p > 0.05, there was “no apparent trend” [10]. The formula used was:
slope = i = 1 n X i Y i 1 n ( i = 1 n X i ) ( i = 1 n Y i ) i = 1 n Y i 2 1 n ( i = 1 n Y i ) 2
where n was the total number of years (17: 2000–2016); Yi was the different years (i = 1, 2, 3 … 17), and; Xi was the albedo in i year. Slope > 0 indicated that the albedo on the QTP was increasing trend; otherwise, it was decreasing trend.
Then, we used Pearson product-moment correlation coefficient to examine the relationship between annual albedo and temperature/precipitation on the QTP [21]. We calculated the correlation coefficient between the average annual albedo and temperature/precipitation. For the hysteresis of environmental impacts, we calculated the correlation coefficient between the monthly albedo and the temperature/precipitation in the current month (CM), the preceding month (PM), the month before last (MBL), and three previous months (TPM) (e.g., the albedo in May and the temperature in February, March, April, May). We also used the t-test for the statistical significance of the correlation coefficient. The equation is as follows:
  r x y = i = 1 n ( x i x ¯ ) ( y i y ¯ ) i = 1 n ( x i x ¯ ) 2 i = 1 n ( y i y ¯ ) 2
where n was the total number of years (16: 2000–2015); rxy was the correlation coefficient between xi and yi (i = 1, 2, 3 … 16), and; xi and yi were the values of the two variables in i year, respectively.
Finally, for monthly albedo and temperature/precipitation that had a significant correlation, we used linear regression to examine the relationship between monthly albedo and monthly temperature/precipitation on the QTP to test our hypothesis. Then we used residual error (RE) and root-mean-square-error (RMSE) to measure the deviation between the observed albedo values (MODIS-based albedo) and the predicted albedo values. The lower the RE and RMSE obtained, the smaller the error between the observed albedo values and the predicted albedo values. The RE and RMSE were calculated using Equations (5) and (6), respectively:
RE = y i y i ^
where yi and y i ^ (i = 1, 2, 3 … 16) were the observed albedo values and the predicted albedo values, respectively.
RMSE = 1 n i = 1 n ( y i y i ^ ) 2
where yi and y i ^ (i = 1, 2, 3 … 16), same as Equation (5), were the observed albedo values and the predicted albedo values, respectively.

3. Results

3.1. The Spatial Pattern of Albedo

The annual albedo ranged from 0.03 to 0.42, and the average value was 0.19 over the 17-year study period on the QTP (Figure 2a). The albedo values gradually increased from southeast to northwest. In the southeast, the low-elevation areas were the low-value center of albedo. Such as the Eastern Qinghai-Qilian mountains region and the Western-Sichuan and Eastern-Tibet mountains and valleys region in the eastern part of the study area, with their good hydrothermal conditions and high vegetation coverage, the albedo was mostly <0.15. In the Guoluo-Naqu Alpine region where the middle of the QTP is relatively low, the values were mostly distributed between 0.15 and 0.20. In the northwestern areas, the albedo values were >0.20 in most regions, especially in the Qiangtang plateau lake basin region, which reached 0.42, the high-value center of albedo on the QTP. Similar spatial distribution patterns were found for monthly albedo (Figure 2b–f). The highest monthly albedo was in May, when the values ranged from 0.08 to 0.53, with an average of 0.21 (Figure 2b); this was early in the growing season when the vegetation was not yet green in parts of the QTP. With the rapid growth of vegetation and the increase of soil moisture in June, the albedo decreased significantly, and the values were 0.12-0.38, with an average value of 0.19 (Figure 2c). In July and August, the albedo continued to decrease to 0.18 and 0.17, respectively (Figure 2d,e). In September, when vegetation began to wither in parts of the QTP, the albedo was slightly higher than in August, and the range was 0.13-0.34, with an average of 0.18 (Figure 2f).
For the elevation gradient, the annual albedo also showed spatial dependence (Figure 3). Below 2000 m, in over 85.89% of the area, the average albedo value was <0.15, and the lowest was 0.13. Between 3000–5000 m, the albedo was about 0.15–0.20. Between 5000–6000 m, the albedo increased rapidly, with an average value of 0.21, and with values between 0.20 and 0.25 in about 50.86% of the area. Over 6000 m, the albedo value showed large spatial variability, and the average was 0.31.

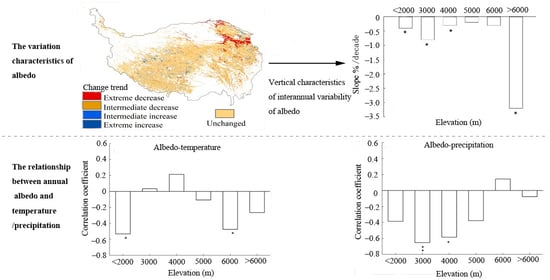
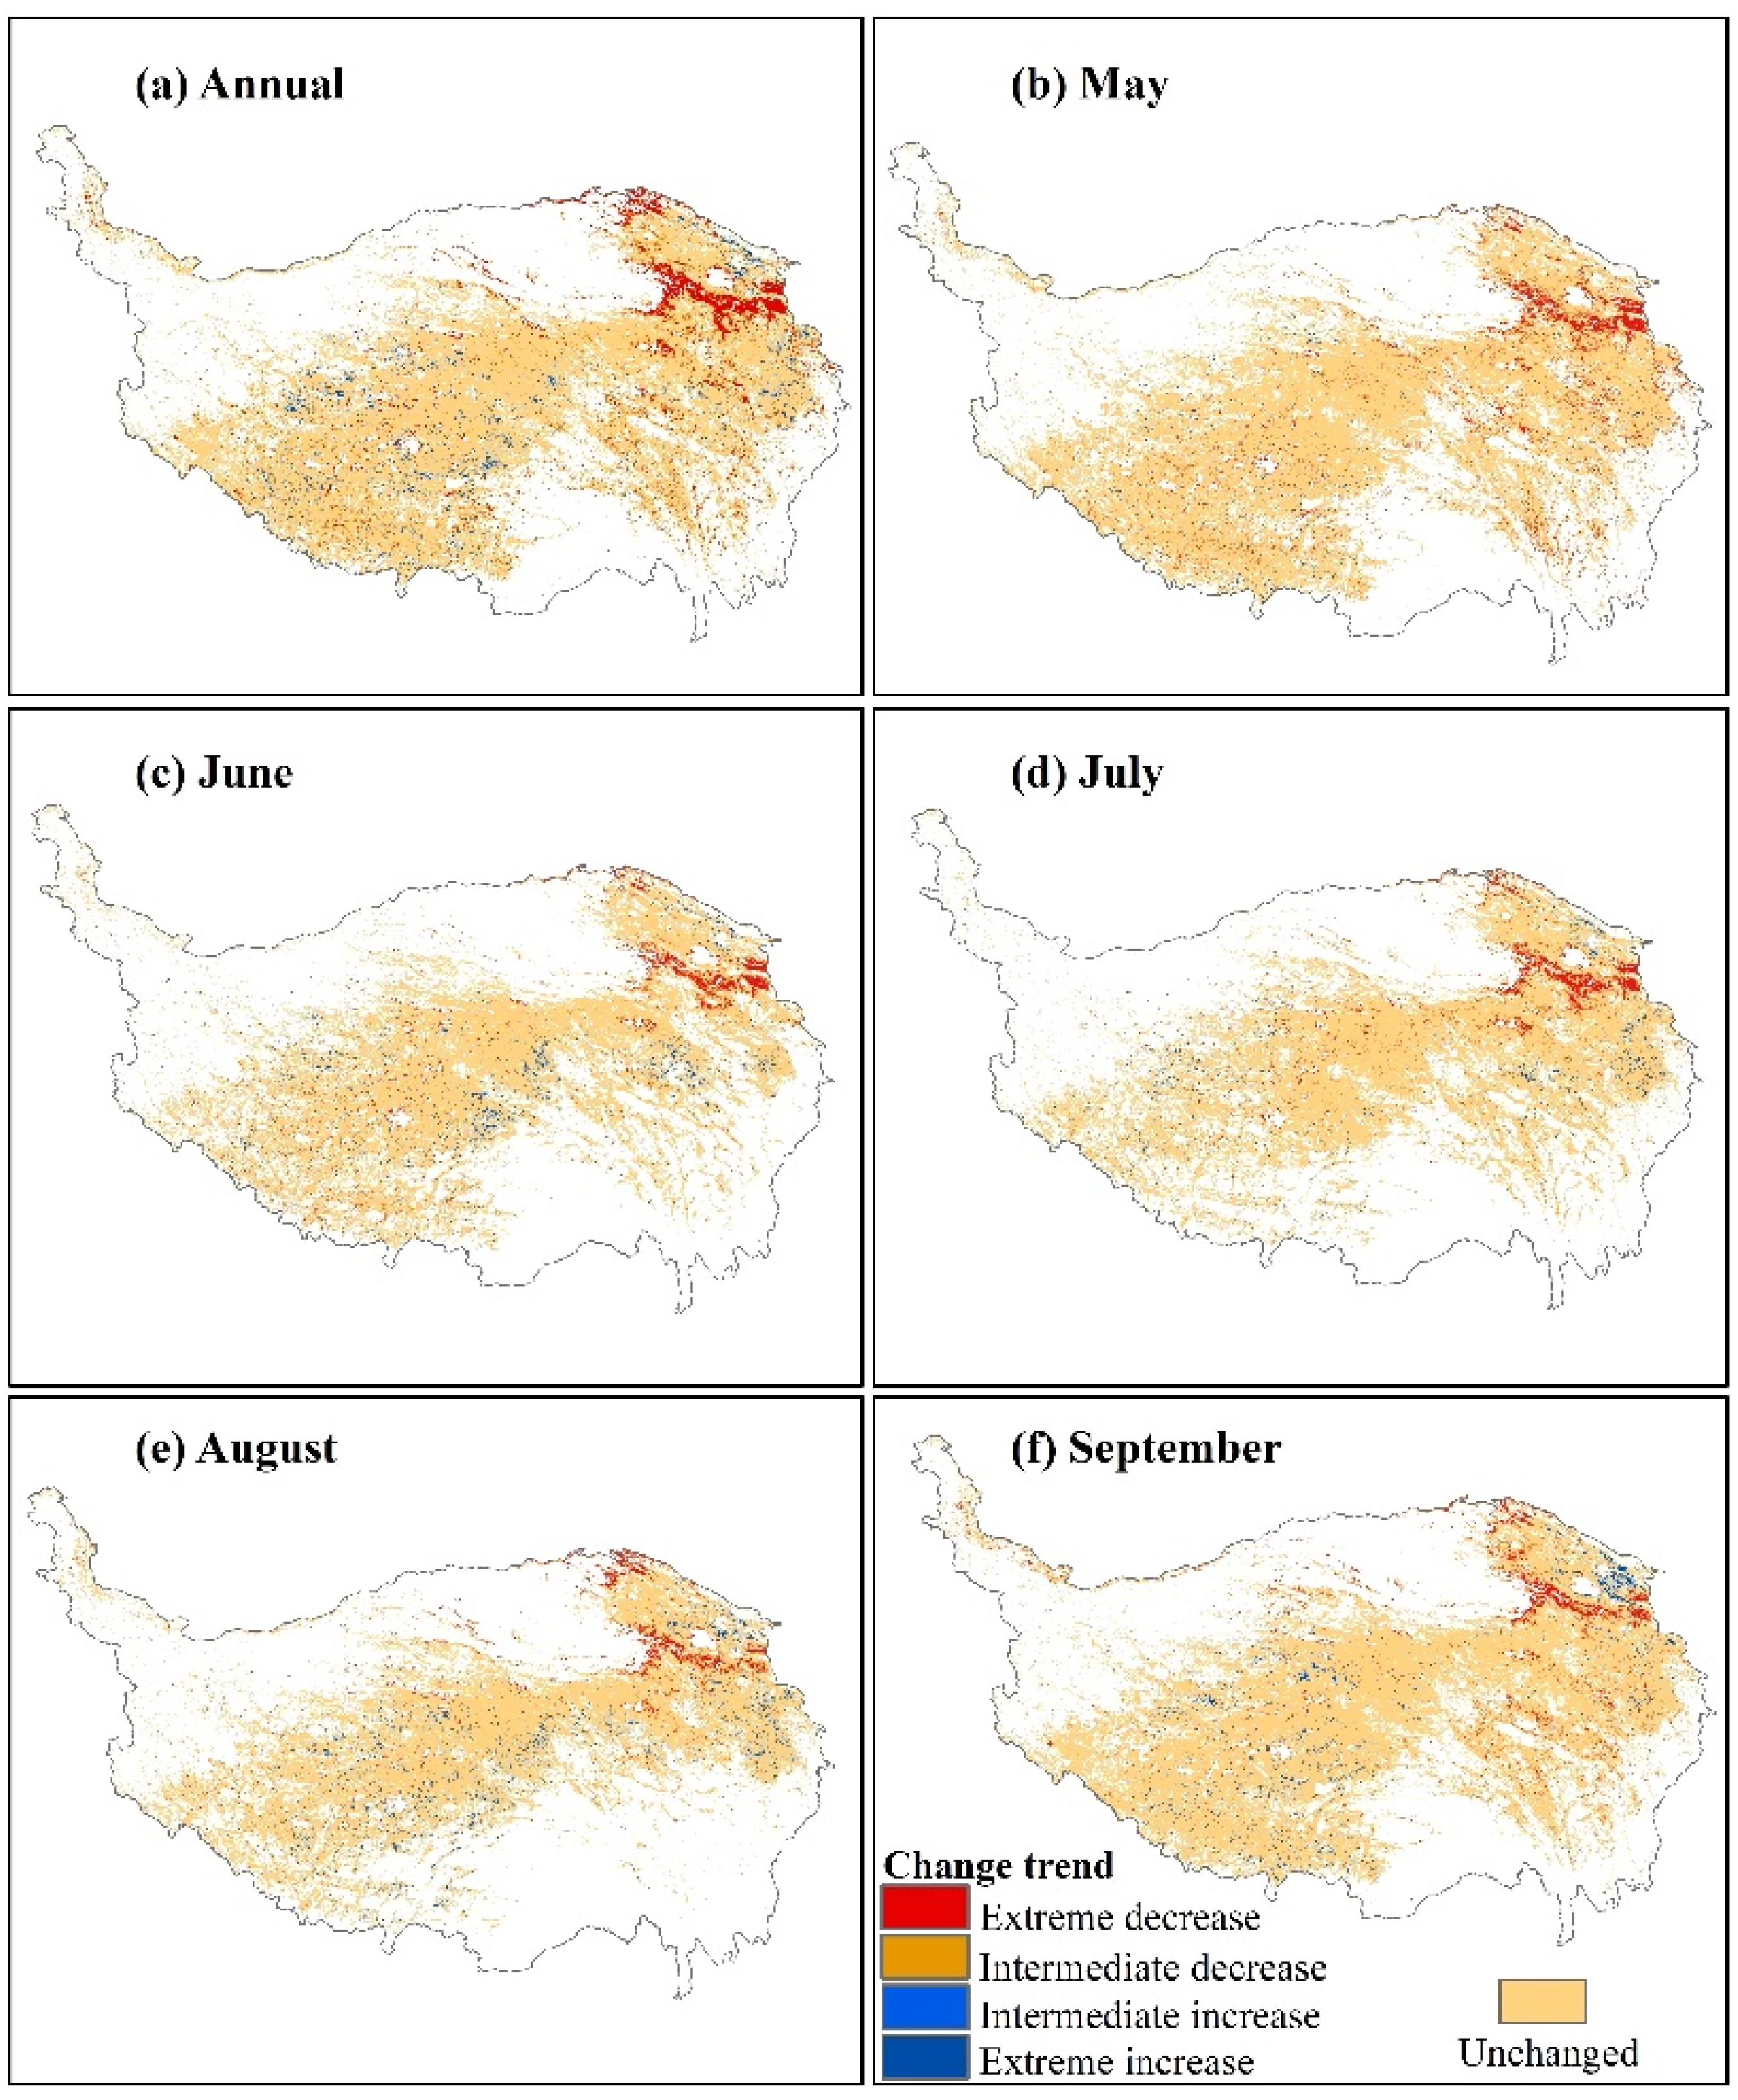
3.2. The Spatiotemporal Variation of Albedo

The changes in annual and monthly albedo showed great spatial variation during 2000–2016 (Figure 4). For the annual albedo, decreases were mainly found in the northeastern QTP (e.g., the Eastern Qinghai-Qilian mountains region), and increases were mainly found in the western QTP (e.g., the Qiangtang plateau lake basin region) (Figure 4a). On the QTP, the significantly decreased areas were about 181.52 × 10³ km2 (13.10% of the grassland-covered pixels), including 94.93 × 10³ km2 (6.85%) and 86.59 × 10³ km2 (6.25%) with extreme and intermediate decreases, respectively. The significantly increased areas were about 48.82 × 10³ km2 (3.52%), including 33.85 × 10³ km2 (2.44%) and 14.97 × 10³ km2 (1.08%) with intermediate and extreme increases, respectively (Table 1). Interestingly, the changes in monthly albedo unevenly contributed to the long-term changes in annual albedo (Figure 4b–f, Table 1). The decreased albedo in May (145.28 × 10³ km2, 10.94%) was more noticeable than in other months (74.44 × 10³ km2 in June, 87.44 × 10³ km2 in July, 69.82 × 10³ km2 in August, 98.62 × 10³ km2 in September), whereas the increased trend seemed more obvious in August (44.62 × 10³ km2, 7.30%) and September (40.38 × 10³ km2, 5.41%) than in May (14.77 × 10³ km2, 1.11%), June (36.60 × 10³ km2, 3.39%), and July (25.99 × 10³ km2, 2.37%) (Table 1).
The statistical analysis results showed that the annual albedo trend was significantly downward, with a slope of 0.25%/decade (p < 0.01) during the study period (Figure 5a, Table 2). The monthly albedo showed the largest decrease in May at the rate of 0.53%/decade (p < 0.05). For other months it also showed a downward tendency: the slope was 0.16%/decade in June, 0.23%/decade in July, 0.21%/decade in August, and 0.20%/decade in September (Figure 5a, Table 2). In the elevation gradient, the albedo also showed a decreasing trend, and the intensity of that decrease was altitude-dependent (Figure 5b). The results showed the decreased slope was 0.41%/decade, 0.80%/decade, 0.35%/decade, and 3.2%/decade in the areas <2000 m, 2000–3000 m, 3000–4000 m, and >6000 m, respectively, and all the results reached the statistical significance level (p < 0.01). At the 4000–5000 m and 5000–6000 m altitude ranges, the rates of albedo decrease were 0.20%/decade and 0.36%/decade, respectively, but these failed to reach the significance level.

3.3. The Response of Albedo to Climate Change

3.3.1. Spatial Correlation Analysis

The relationships between albedo and temperature/precipitation from 2000 to 2015 had strong spatial heterogeneities (Figure 6). For albedo and temperature, the significant positive correlation areas were 99.99 × 10³ km2 (7.21% of the grassland-covered pixels on the QTP), including 30.27 × 10³ km2 (2.18%) extremely positive correlation and 69.72 × 10³ km2 (5.03%) intermediate positive correlations (Table 3). The spatial distribution was mainly concentrated in the Eastern Qinghai-Qilian mountains region and the Qiangtang plateau lake basin region (Figure 6a). The significant negative correlations between albedo and temperature were 33.24 × 10³ km2 (2.40%), and only a few patches showed extremely negative correlations (9.22 × 10³ km2, or 0.66%) or intermediate negative correlations (24.02 × 10³ km2, or 1.73%) (Table 3). These patches were mainly distributed in the Southern-Qinghai plateau valley region and scattered in the Southern-Tibet mountains region (Figure 6a). For albedo and precipitation, there were mainly negative correlations (Figure 6b, Table 3), and the significant negative correlations areas were 158.37 × 10³ km2 (11.62%), including 60.36 × 10³ km2 (4.35%) extremely negative correlations and 98.01 × 10³ km2 (7.27%) intermediate negative correlations. While significantly positively affected areas were 19.69 × 10³ km2 (1.42%), only a few patches showed extremely positive correlations (4.49 × 10³ km2, or 0.32%) or intermediate positive correlations (15.20 × 10³ km2, or 1.10%).
In the altitude gradient, the correlations between albedo and temperature were significantly negative < 2000 m and at 5000–6000 m, and the correlation coefficients were −0.53 (p < 0.05) and −0.48 (p < 0.05), respectively (Figure 6c). The correlations between albedo and precipitation were also negative at elevations of 2000–3000 m and 3000–4000 m, and the values were −0.65 (p < 0.01) and −0.59 (p < 0.05), respectively (Figure 6d). The other altitudes all failed to reach a statistically significant level (Figure 6c,d).

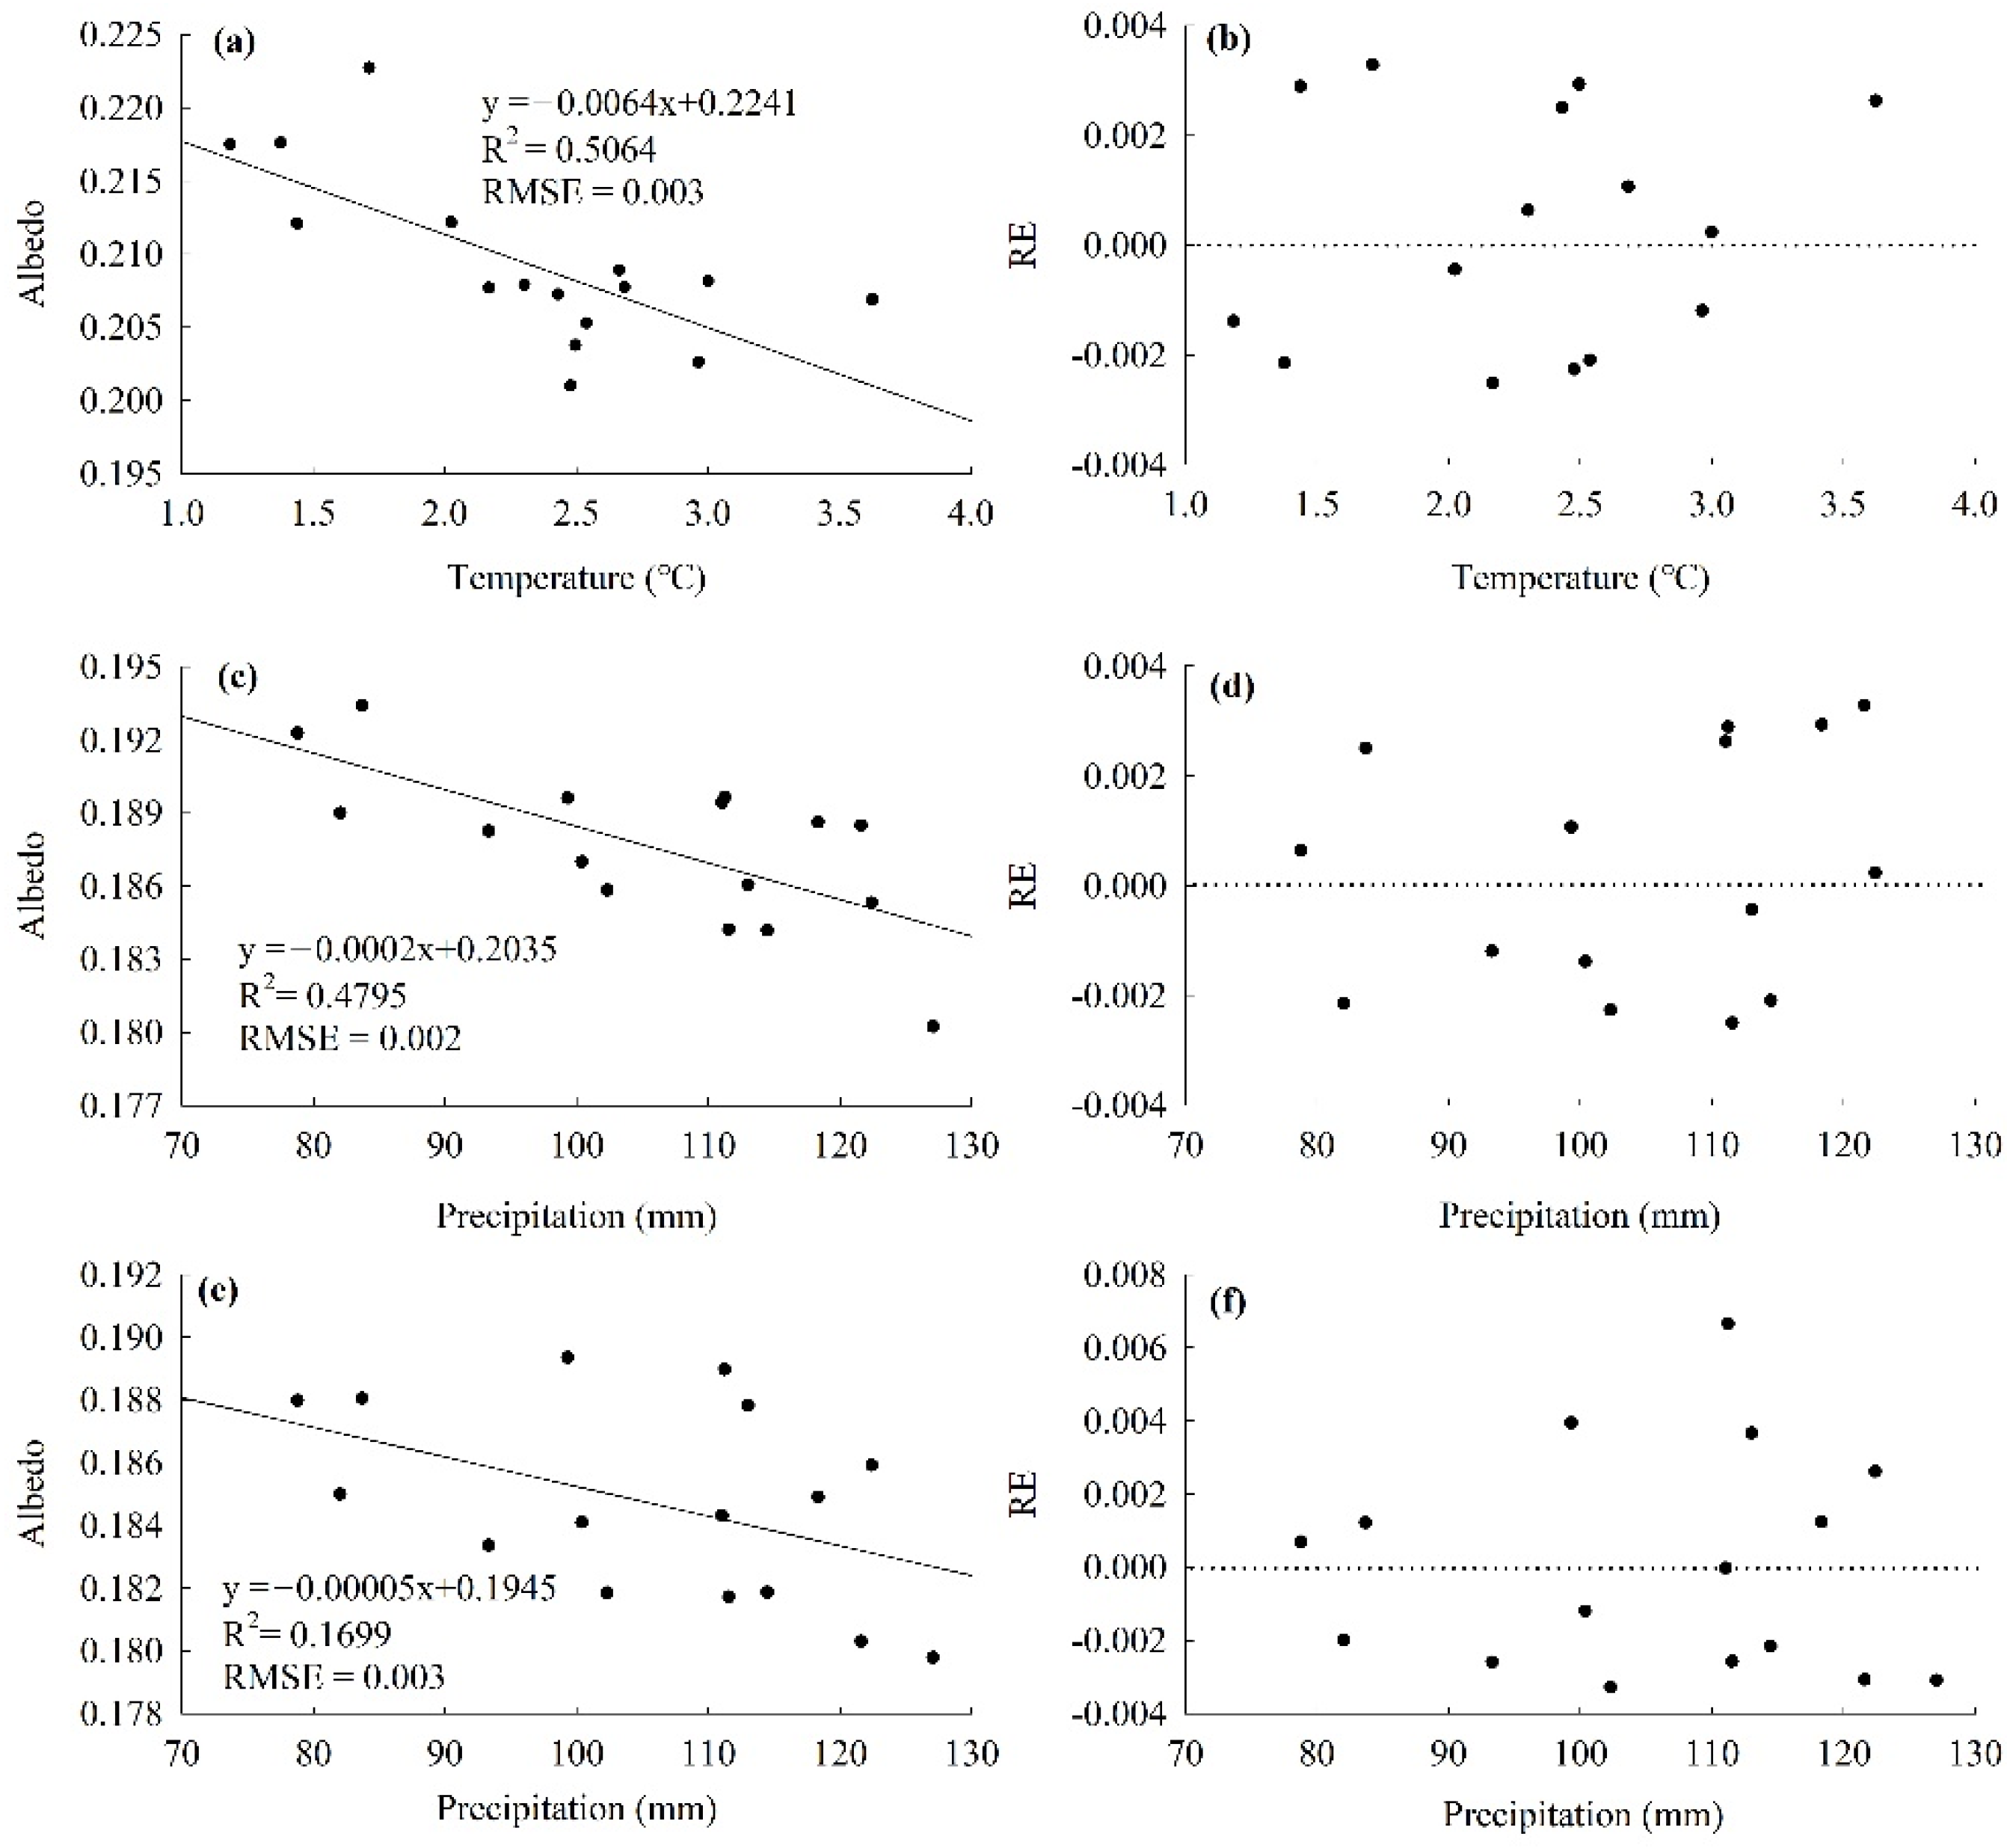
3.3.2. Temporal Correlation Analysis

For the monthly values, in May, the albedo was mainly affected by the temperature in CM; the correlation coefficient was −0.710 (p < 0.01), but had no significant correlations with the temperature in other months (i.e., PM, MBL, and TPM) or the precipitation (i.e., CM, PM, MBL, and TPM) (Table 4). Interestingly, in July, the albedo was mainly influenced by the precipitation in CM, while in August, the albedo was mainly influenced by the precipitation in PM; the correlation coefficients were −0.690 (p < 0.01) and −0.413 (p < 0.05), respectively (Table 4). In addition, in June and September, the correlations between albedo and temperature/precipitation failed to reach a statistically significant level (Table 4). Overall, in the early growing season (i.e., May and June), the albedo was mainly negatively affected by the temperature in the same period, in the mid-growing season (i.e., July, August), the albedo was mainly negatively affected by the precipitation, whereas at the end of the growing season (i.e., September), the albedo was affected by both temperature and precipitation.
The significant negative relationships illustrated in Table 4 between albedo and temperature/precipitation measures were modeled reasonably with linear equations (Figure 7). In May, as the temperature increased, the albedo decreased significantly, the errors between the predicted values and the observed values were small (RMSE = 0.003) and the REs presented random distribution (Figure 7a,b). In July, the albedo also decreased with the increase in precipitation, there was also a good consistency between the predicted values and observed values (RMSE = 0.002), and the REs presented random distribution (Figure 7c,d). More interesting, although the albedo in August decreased with the increase in precipitation in July, and the REs was randomly distributed, there were a few outliers (Figure 7e,f).

4. Discussion

The QTP has changed the climate pattern of Eurasia, and its surface changes have a significant impact on the Asian atmosphere and even global climate changes [22]. Albedo is a key variable of the Earth’s surface radiation budget [23]. A slight change in albedo over the QTP can result in significant changes in energy fluxes (e.g., latent heat, sensible heat, and soil heat fluxes) [10]. For example, the summer solar radiation on the plateau reaches 1000 W/m2, which means that the 1% decrease in albedo there that would intercept energy was 10 W/m2 [24]. Our results showed that the annual mean albedo decreased from 0.20 (2002) to 0.19 (2012) during the past 17 years on the QTP, and it had a markedly decreasing trend, with a slope of −0.25%/decade (p < 0.01) (Figure 5a, Table 2). Decreasing trends are also occurring in other places, such as the northern high latitude regions [25], France [26], the Arctic [27], the Swiss Alps in Europe [28], and Greenland [29]. The reduced albedo means more irradiance absorbed, which in turn leads to amplified warming. Sciusco et al. [30] argued that the global warming potential of a 2% albedo change could be equivalent to 15–25% of the carbon sink’s function in the Kalamazoo River watershed.
The monthly albedo also showed an obvious decreasing trend, especially in May, when the decrease rate of albedo was as high as 0.53%/decade (p < 0.05) (Figure 5a, Table 2). This phenomenon showed that albedo was more sensitive to climate change in the early growing season, which may be attributable to advancing spring phenology and increasing vegetation greenness in the early growing season [31,32,33]. Due to the significant decrease in albedo in May, the temperature in the early period of the growing season increased sharply, which in turn caused earlier vegetation greening and ultimately intensified summer drought, amplifying the frequency and intensity of summer heatwaves [34,35,36].
In terms of spatial variation, the annual albedo showed a significant decreasing trend that was mainly distributed in the northeastern part of the plateau, as well as a significant increase in areas mainly distributed in the western part of the plateau. This spatial long-term sequence change pattern was mainly caused by vegetation cover change [37,38,39,40]. Furthermore, in the past decades, the temperature in the low-elevation areas of the QTP has been rising at a faster rate. This faster increase has promoted the growth of vegetation [11], resulting in a more significant reduction in albedo in there (Figure 5b).
Increases in temperature and precipitation can cause a series of changes on the land surface (e.g., increased evapotranspiration, prolonged growing season, increased vegetation biomass, desertification, and glacial recession), and these changes have been proposed as an essential variable causing the changes in albedo [41,42,43]. In recent decades, the QTP experienced significant warming and wetting trends [44,45,46], and this phenomenon is expected to continue until the end of the 21st century [47]. Our results showed a weak correlation in space for temperature/precipitation and annual albedo (Figure 6a,b), but with a different degree of correlation by elevation (Figure 6c,d). Interestingly, in May, the albedo and the temperature had a significant negative correlation, and the correlation coefficient was 0.71 (p < 0.01). Accompanied by the temperature increase and the albedo decrease in May, the land absorbed more solar radiation and improved the growing conditions in alpine grasslands. As synergies go, this was positive feedback for the regional warming. Because there might be time lags in the correlation between vegetation and climate [21,48], we considered lags in our analysis of the correlation between albedo and temperature/precipitation, and our results confirmed this hypothesis (Table 4). The negative correlation was strong for albedo (August) and precipitation (July) (i.e., time lags of one month). Our error analysis results further confirmed these negative correlations between albedo and temperature/precipitation, and the random distribution of REs indicated that the regression equations we established were reasonable (Figure 7). However, there were a few outliers between REs of albedo in August and precipitation in July (Figure 7f), suggesting that substantial additional efforts in the form of observational and/or experimental investigations are needed to explore the relationships between albedo and temperature/precipitation.
Our results showed that climate factors (i.e., temperature and precipitation) had a significant impact on albedo, which were similar to the results of Zhang [49] and Guan et al. [50]. Although the MCD43 product had high inversion accuracy and good continuity of temporal and spatial distribution [51,52,53], the meteorological data was generated through spatial interpolation based on the daily observation data of weather stations, even so, there must be some deviations between MODIS-based albedo/meteorological interpolation data and ground-observed data, and these differences might have some effect on the result of the correlation analysis between albedo and temperature/precipitation. We will accumulate longer-term field albedo data to accurately test our hypothesis in future research.

5. Conclusions

The QTP is experiencing significant climate change and changing the region’s energy balance. Albedo is a primary controlling factor for the surface energy budget [53]. In this study, we analyzed the spatiotemporal changes in albedo and quantified the correlations between albedo and temperature/precipitation. For the total alpine grassland during the study period, the annual albedo in the growing season and the monthly albedo (especially in May) showed a significant decreasing trend. In the spatial distribution, the significantly decreasing areas were mainly found in the Eastern Qinghai-Qilian mountains (northeastern region), and the sparsely distributed increased areas were mainly in the Qiangtang plateau lake basin region (western region). In addition, the decreased rates of annual albedo also showed altitude dependence; the significantly decreased annual albedo regions were found at altitudes <4000 m. The correlation analysis showed a significantly negative correlation between annual albedo and temperature <2000 m and at 5000–6000 m. At elevations of 2000–3000 m and 3000–4000 m, the annual albedo and precipitation also showed a significant negative correlation. Moreover, at the beginning of the growing season (May and June), the albedo was mainly negatively correlated with the temperature of the same period; in the middle of the growing season (July and August), the albedo was mainly negatively correlated with precipitation, and there was a one-month time lag between albedo in August and precipitation in July; finally, at the end of the growing season (i.e., September), the albedo was affected by both temperature and precipitation.

Author Contributions

Conceptualization, L.T.; methodology, C.C.; software, C.C. and Y.Z.; validation, L.T. and L.Z.; formal analysis, C.C. and L.T.; investigation, C.C. and Y.Z.; resources, L.Z.; data curation, L.T.; writing—original draft preparation, C.C.; writing—review and editing, L.T. and L.Z.; visualization, C.C. and L.T.; supervision, L.T. and L.Z.; project administration, L.T. and L.Z.; funding acquisition, L.T. and L.Z. All authors have read and agreed to the published version of the manuscript.

Funding

This research was funded by the National Key Research and Development Program of China (Grant No. 2019YFC0507801). Basic Frontier Science Research Program of the Chinese Academy of Sciences Original innovation projects from 0 to 1 (ZDBS-LY-DQC023), the Foundation of President of the Zhongke-Ji’an Institute for Eco-Environmental Sciences (ZJIEES-2020-02) and Key Science and Technology Program of Ji’an City (2019).

Acknowledgments

We would like to thank the editor and anonymous reviewers for their comments, which helped improve the manuscript.

Conflicts of Interest

The authors declare no conflict of interest.

References

  1. Tian, L.; Chen, J.Q.; Zhang, Y.J. Growing season carries stronger contributions to albedo dynamics on the Tibetan Plateau. PLoS ONE 2017, 12, e0180559. [Google Scholar] [CrossRef] [Green Version]
  2. Zheng, L.; Zhao, G.S.; Dong, J.W.; Ge, Q.S.; Tao, J.; Zhang, X.Z.; Qi, Y.C.; Doughty, R.B.; Xiao, X.M. Spatial, temporal, and spectral variations in albedo due to vegetation changes in China’s grasslands. ISPRS J. Photogramm. Remote Sens. 2019, 152, 1–12. [Google Scholar] [CrossRef]
  3. Kuhle, M. A relief-specific model of the ice age on the basis of uplift-controlled glacier areas in Tibet and the corresponding albedo increase as well as their positive climatological feedback by means of the global radiation geometry. Clim. Res. 2002, 20, 1–7. [Google Scholar] [CrossRef]
  4. Li, Y.; Hu, Z. A study on parameterization of surface albedo over grassland surface in the northern Tibetan Plateau. Adv. Atmos. Sci. 2009, 26, 161–168. [Google Scholar] [CrossRef]
  5. Perkins, S. Albedo is a simple concept that plays complicated roles in climate and astronomy. Proc. Natl. Acad. Sci. USA 2019, 116, 25369–25371. [Google Scholar] [CrossRef] [Green Version]
  6. Guan, Y.L.; Lu, H.W.; Yin, C.; Xue, Y.X.; Jiang, Y.L.; Kang, Y.; He, L.; Heiskanen, J. Vegetation response to climate zone dynamics and its impacts on surface soil water content and albedo in China. Sci. Total Environ. 2020, 747, 141537. [Google Scholar] [CrossRef]
  7. Kala, J.; Hirsch, A.L. Could crop albedo modification reduce regional warming over Australia? Weather Clim. Extrem. 2020, 30, 100282. [Google Scholar] [CrossRef]
  8. Charney, J.; Quirk, W.J.; Chow, S.H.; Kornfield, J. Comparative-study of effects of albedo change on drought in semi-arid regions. J. Atmos. Sci. 1977, 34, 1366–1385. [Google Scholar] [CrossRef] [Green Version]
  9. Knorr, W.; Schnitzler, K.G.; Govaerts, Y. The role of bright desert regions in shaping North African climate. Geophys. Res. Lett. 2001, 28, 3489–3492. [Google Scholar] [CrossRef]
  10. Tian, L.; Chen, J.Q.; Shao, C.L. Interdependent dynamics of lai-albedo across the roofing landscapes: Mongolian and Tibetan Plateaus. Remote Sens. 2018, 10, 1159. [Google Scholar] [CrossRef] [Green Version]
  11. Tian, L.; Zhang, Y.J.; Zhu, J.T. Decreased surface albedo driven by denser vegetation on the Tibetan Plateau. Environ. Res. Lett. 2014, 9, 104001. [Google Scholar] [CrossRef]
  12. Li, J.C.; Yao, Q.; Zhou, N.; Li, F.H. Modern aeolian desertification on the Tibetan Plateau under climate change. Land Degrad. Dev. 2021, 32, 1908–1916. [Google Scholar] [CrossRef]
  13. Zhao, J.X.; Luo, T.X.; Wei, H.X.; Deng, Z.H.; Li, X.; Li, R.C.; Tang, Y.H. Increased precipitation offsets the negative effect of warming on plant biomass and ecosystem respiration in a Tibetan alpine steppe. Agric. For. Meteorol. 2019, 279, 107761. [Google Scholar] [CrossRef]
  14. Lang, J.; Lyu, S.; Li, Z.; Ma, Y.; Su, D. An investigation of ice surface albedo and its influence on the high-altitude lakes of the Tibetan Plateau. Remote Sens. 2018, 10, 218. [Google Scholar] [CrossRef]
  15. Yue, X.Y.; Zhao, J.; Li, Z.Q.; Zhang, M.J.; Fan, J.; Wang, L.; Wang, P.Y. Spatial and temporal variations of the surface albedo and other factors influencing Urumqi Glacier No. 1 in Ttien Shan, China. J. Glaciol. 2017, 63, 899–911. [Google Scholar] [CrossRef] [Green Version]
  16. Li, X.J.; Zhang, H.Y.; Qu, Y. Land surface albedo variations in SanJiang plain from 1982 to 2015: Assessing with glass data. Chin. Geogr. Sci. 2020, 30, 876–888. [Google Scholar] [CrossRef]
  17. Culf, A.D.; Fisch, G.; Hodnett, M.G. The albedo of Amazonian forest and ranch land. J.Clim. 1995, 8, 1544–1554. [Google Scholar] [CrossRef] [Green Version]
  18. Berbert, M.L.C.; Costa, M.H. Climate change after tropical deforestation: Seasonal variability of surface albedo and its effects on precipitation change. J. Clim. 2003, 16, 2099–2104. [Google Scholar] [CrossRef]
  19. Huang, K.; Zhang, Y.J.; Tagesson, T.; Brandt, M.; Wang, L.H.; Chen, N.; Zu, J.X.; Jin, H.X.; Cai, Z.Z.; Tong, X.W.; et al. The confounding effect of snow cover on assessing spring phenology from space: A new look at trends on the Tibetan Plateau. Sci. Total Environ. 2021, 756, 144011. [Google Scholar] [CrossRef]
  20. Schaaf, C.B.; Gao, F.; Strahler, A.H.; Lucht, W.; Li, X.W.; Tsang, T.; Strugnell, N.C.; Zhang, X.Y.; Jin, Y.F.; Muller, J.P.; et al. First operational BRDF, albedo nadir reflectance products from MODIS. Remote Sens. Environ. 2002, 83, 135–148. [Google Scholar] [CrossRef] [Green Version]
  21. Zhu, W.B.; Zhang, X.D.; Zhang, J.J.; Zhu, L.Q. A comprehensive analysis of phenological changes in forest vegetation of the Funiu Mountains, China. J. Geogr. Sci. 2019, 29, 131–145. [Google Scholar] [CrossRef] [Green Version]
  22. Yao, T.; Wu, F.; Ding, L.; Sun, J.; Zhu, L.; Piao, S.L.; Deng, T.; Ni, X.; Zheng, H.; Ouyang, H. Multispherical interactions and their effects on the Tibetan Plateau’s earth system: A review of the recent researches. Natl. Sci. Rev. 2015, 2, 468–488. [Google Scholar] [CrossRef] [Green Version]
  23. Kiehl, J.T.; Hack, J.J.; Hurrell, J.W. The energy budget of the NCAR Community Climate Model: CCM3. J. Clim. 1998, 11, 1151–1178. [Google Scholar] [CrossRef]
  24. Shao, C.L.; Li, L.h.; Dong, G.; Chen, J.Q. Spatial variation of net radiation and its contribution to energy balance closures in grassland ecosystems. Ecol. Proces. 2014, 3, D05107. [Google Scholar] [CrossRef] [Green Version]
  25. Loranty, M.M.; Berner, L.T.; Goetz, S.J.; Jin, Y.F.; Randerson, J.T. Vegetation controls on northern high latitude snow-albedo feedback: Observations and CMIP5 model simulations. Glob. Chang. Biol. 2014, 20, 594–606. [Google Scholar] [CrossRef] [PubMed]
  26. Planque, C.; Carrer, D.; Roujean, J.L. Analysis of MODIS albedo changes over steady woody covers in France during the period of 2001-2013. Remote Sens. Environ. 2017, 191, 13–29. [Google Scholar] [CrossRef]
  27. Pistone, K.; Eisenman, I.; Ramanathan, V. Observational determination of albedo decrease caused by vanishing Arctic sea ice. Proc. Natl. Acad. Sci. USA 2014, 111, 3322–3326. [Google Scholar] [CrossRef] [PubMed] [Green Version]
  28. Rangwala, I.; Miller, J.R. Climate change in mountains: A review of elevation-dependent warming and its possible causes. Clim. Chang. 2012, 114, 527–547. [Google Scholar] [CrossRef]
  29. He, T.; Liang, S.; Yu, Y.; Wang, D.; Gao, F.; Liu, Q. Greenland surface albedo changes in July 1981-2012 from satellite observations. Environ. Res. Lett. 2013, 8, 044043. [Google Scholar] [CrossRef]
  30. Sciusco, P.; Chen, J.Q.; Abraha, M.; Lei, C.; Robertson, G.P.; Lafortezza, R.; Shirkey, G.; Ouyang, Z.T.; Zhang, R.; John, R. Spatiotemporal variations of albedo in managed agricultural landscapes: Inferences to global warming impacts (GWI). Landsc. Ecol. 2020, 35, 1385–1402. [Google Scholar] [CrossRef]
  31. Zhang, Q.; Kong, D.D.; Shi, P.J.; Singh, V.P.; Sun, P. Vegetation phenology on the Qinghai-Tibetan Plateau and its response to climate change (1982–2013). Agric. For. Meteorol. 2018, 248, 408–417. [Google Scholar] [CrossRef]
  32. Ghatak, D.; Sinsky, E.; Miller, J. Role of snow-albedo feedback in higher elevation warming over the Himalayas, Tibetan Plateau and Central Asia. Environ. Res. Lett. 2014, 9, 114008. [Google Scholar] [CrossRef]
  33. Lin, X.W.; Wen, J.G.; Liu, Q.H.; You, D.Q.; Wu, S.B.; Hao, D.L.; Xiao, Q.; Zhang, Z.Y.; Zhang, Z.Z. Spatiotemporal variability of land surface albedo over the Tibet Plateau from 2001 to 2019. Remote Sens. 2020, 12, 1188. [Google Scholar] [CrossRef] [Green Version]
  34. Chuine, I.; Morin, X.; Bugmann, H. Warming, photoperiods, and tree phenology. Science 2010, 329, 277–278. [Google Scholar] [CrossRef]
  35. Lian, X.; Piao, S.L.; Li, L.Z.X.; Li, Y.; Huntingford, C.; Ciais, P.; Cescatti, A.; Janssens, I.A.; Penuelas, J.; Buermann, W.; et al. Summer soil drying exacerbated by earlier spring greening of northern vegetation. Sci. Adv. 2020, 6, eaax0255. [Google Scholar] [CrossRef] [Green Version]
  36. Fu, Y.S.; Li, X.X.; Zhou, X.C.; Geng, X.J.; Guo, Y.H.; Zhang, Y.R. Progress in plant phenology modeling under global climate change. Sci. China Earth Sci. 2020, 63, 1237–1247. [Google Scholar] [CrossRef]
  37. Xue, X.; Guo, J.; Han, B.; Sun, Q.; Liu, L. The effect of climate warming and permafrost thaw on desertification in the Qinghai-Tibetan Plateau. Geomorphology 2009, 108, 182–190. [Google Scholar] [CrossRef]
  38. You, Q.; Xue, X.; Peng, F.; Dong, S.; Gao, Y. Surface water and heat exchange comparison between alpine meadow and bare land in a permafrost region of the Tibetan Plateau. Agric. For. Meteorol. 2017, 232, 48–65. [Google Scholar] [CrossRef]
  39. Wang, S.Y.; Yang, B.J.; Yang, Q.C.; Lu, L.L.; Wang, X.Y.; Peng, Y.Y. Temporal trends and spatial variability of vegetation phenology over the northern hemisphere during 1982-2012. PLoS ONE 2016, 11, e0157134. [Google Scholar] [CrossRef]
  40. Yi, S.H.; Zhou, Z.Y.; Ren, S.L.; Xu, M.; Qin, Y.; Chen, S.Y.; Ye, B.S. Effects of permafrost degradation on alpine grassland in a semi-arid basin on the Qinghai-Tibetan Plateau. Environ. Res. Lett. 2011, 6, 045403. [Google Scholar] [CrossRef]
  41. Taylor, P.C.; Kato, S.; Xu, K.M.; Cai, M. Covariance between arctic sea ice and clouds within atmospheric state regimes at the satellite footprint level. J. Geophys. Res. Atmos. 2015, 120, 12656–12678. [Google Scholar] [CrossRef] [Green Version]
  42. Wild, M.; Hakuba, M.Z.; Folini, D.; Schar, C.; Long, C. New estimates of the earth radiation budget under cloud-free conditions and cloud radiative effects. In Radiation Processes in the Atmosphere and Ocean; Davies, R., Egli, L., Schmutz, W., Eds.; Amer Inst Physics: Melville, NY, USA, 2017; p. 1810. [Google Scholar]
  43. Chen, J.; Wan, S.; Henebry, G.; Gutman, G.; Sun, G.; Kappas, M. Dryland East Asia: Land Dynamics Amid Social and Climate Change; Higher Education Press: Beijing, China, 2013. [Google Scholar]
  44. Li, B.Q.; Zhou, W.; Zhao, Y.Y.; Ju, Q.; Yu, Z.B.; Liang, Z.M.; Acharya, K. Using the SPEI to assess recent climate change in the Yarlung Zangbo River Basin, South Tibet. Water 2015, 7, 5474–5486. [Google Scholar] [CrossRef] [Green Version]
  45. Huai, B.J.; Wang, J.Y.; Sun, W.J.; Wang, Y.T.; Zhang, W.Y. Evaluation of the near-surface climate of the recent global atmospheric reanalysis for Qilian Mountains, Qinghai-Tibet Plateau. Atmos. Res. 2021, 250, 105401. [Google Scholar] [CrossRef]
  46. Jin, Z.; You, Q.L.; Wu, F.Y.; Sun, B.; Cai, Z.Y. Changes of climate and climate extremes in the Three-Rivers Headwaters’ Region over the Tibetan Plateau during the past 60 years. Trans. Atmos. Sci. 2020, 43, 1042–1055. [Google Scholar]
  47. Hu, C.; Jiang, D.P.; Fan, G.Z. Climate change projection on the Tibetan Plateau: Results of CMIP5 models. Chin. J. Atmo. Sci. 2015, 39, 260–270. [Google Scholar]
  48. Tian, F.; Wigneron, J.P.; Ciais, P.; Chave, J.; Ogee, J.; Penuelas, J.; Raebild, A.; Domec, J.C.; Tong, X.Y.; Brandt, M.; et al. Coupling of ecosystem-scale plant water storage and leaf phenology observed by satellite. Nat. Ecol. Evol. 2018, 2, 1428–1435. [Google Scholar] [CrossRef] [PubMed] [Green Version]
  49. Zhang, X.Z. The responses of surface albedo to climatic changes in Xilin Gol grassland. Geogr. Res. Aust. 2012, 31, 299–310. [Google Scholar]
  50. Guan, Y.L.; Wang, R.H.; Yao, J.; Qin, J.K.; Zhu, M. Features of surface albedo of Tianshan Mountains area under the background of climate change. Arid Land Geogr. 2015, 38, 351–358. [Google Scholar]
  51. Wang, Z.S.; Schaaf, C.B.; Strahler, A.H.; Chopping, M.J.; Roman, M.O.; Shuai, Y.M.; Woodcock, C.E.; Hollinger, D.Y.; Fitzjarrald, D.R. Evaluation of MODIS albedo product (MCD43A) over grassland, agriculture and forest surface types during dormant and snow-covered periods. Remote Sens. Environ. 2014, 140, 60–77. [Google Scholar] [CrossRef] [Green Version]
  52. Roesch, A.; Schaaf, C.; Gao, F. Use of Moderate-Resolution Imaging Spectroradiometer bidirectional reflectance distribution function products to enhance simulated surface albedos. J. Geophys. Res. Atmos. 2004, 109, D12105. [Google Scholar] [CrossRef] [Green Version]
  53. Liu, J.C.; Schaaf, C.; Strahler, A.; Jiao, Z.T.; Shuai, Y.M.; Zhang, Q.L.; Roman, M.; Augustine, J.A.; Dutton, E.G. Validation of Moderate Resolution Imaging Spectroradiometer (MODIS) albedo retrieval algorithm: Dependence of albedo on solar zenith angle. J. Geophys. Res. Atmos. 2009, 114, D01106. [Google Scholar] [CrossRef]
Figure 1. (a) Topography of the Qinghai-Tibet Plateau (QTP) and (b) the study domain: grassland vegetation zones.
Remotesensing 13 02336 g001
Figure 2. Spatial distributions of albedo during 2000–2016 in the growing season (annual, May, June, July, August, and September) on the QTP.
Remotesensing 13 02336 g002
Figure 3. Vertical characteristics of average annual albedo during 2000–2016 in the growing season: the yellow line shows the mean annual albedo at different elevations and the numbers next to the various shades of blue in the legend refer to albedo ranges.
Remotesensing 13 02336 g003
Figure 4. The spatial distribution of albedo change trends in the growing season during 2000–2016. The significant changes include five categories: extreme decrease (slope < 0, p < 0.01); intermediate decrease (slope < 0, 0.01 < p < 0.05); failure to reach a statistically significant level, i.e., unchanged (p > 0.05); intermediate increase (slope > 0, 0.01 < p < 0.05); extreme decrease (slope > 0, p < 0.01).
Remotesensing 13 02336 g004
Figure 5. (a) The trends of the average annual and monthly albedo and (b) the interannual change rates of the average annual albedo for each 1000 m elevation bin on the grassland over the QTP (statistically significant results are indicated for a 99% confidence level (*)).
Remotesensing 13 02336 g005
Figure 6. The spatial distribution of annual albedo with (a) temperature and (b) precipitation and the vertical response model of average annual albedo to average annual (c) temperature and (d) precipitation for each 1000 m elevation bin during 2000–2015 for the grassland over the QTP (statistically significant results were indicated as for a 95% confidence level (*) and 99% confidence level (**)).
Remotesensing 13 02336 g006
Figure 7. The linear regressions of average monthly albedo and temperature/precipitation: (a) albedo and temperature in May (c) albedo in July and precipitation in June (e) albedo in August and precipitation in July; and the REs distribution with (b) temperature in May (d) precipitation in July and (f) precipitation in July.
Remotesensing 13 02336 g007
Table 1. The significant change areas in annual and monthly albedo during 2000–2016 on the QTP, The changes include four categories: extreme decrease (slope < 0, p < 0.01), intermediate decrease (slope < 0, 0.01 < p < 0.05), intermediate increase (slope > 0, 0.01 < p < 0.05), and extreme decrease (slope > 0, p < 0.01).
Sig. Area (103 km2)AnnualMayJuneJulyAug.Sept.
Decreasing
(%)
181.52
(13.10%)
145.28
(10.94%)
74.44
(6.89%)
87.44
(7.97%)
69.82
(11.43%)
98.62
(13.21%)
Extreme
(%)
94.93
(6.85%)
58.54
(4.41%)
34.75
(3.22%)
39.28
(3.58%)
33.80
(5.53%)
42.92
(5.75%)
Intermediate
(%)
86.59
(6.25%)
86.74
(6.53%)
39.69
(3.67%)
48.16
(4.39%)
36.02
(5.90%)
55.70
(7.46%)
Increasing
(%)
48.82
(3.52%)
14.77
(1.11%)
36.60
(3.39%)
25.99
(2.37%)
44.62
(7.30%)
40.38
(5.41%)
Extreme
(%)
14.97
(1.08%)
3.42
(0.26%)
8.73
(0.81%)
5.98
(0.55%)
11.01
(1.80%)
11.10
(1.49%)
Intermediate
(%)
33.85
(2.44%)
11.35
(0.85%)
27.87
(2.58%)
20.01
(1.82%)
33.61
(5.50%)
29.28
(3.92%)
Table 2. The regression trends in average annual and monthly albedo on the grasslands over the QTP during 2000–2016.
AnnualMayJuneJulyAug.Sept.
Slope(%/decade)−0.25−0.53−0.16−0.23−0.21−0.20
p0.010.050.220.140.390.05
R20.390.220.100.120.110.06
Table 3. The areas that showed significant correlations between annual albedo and temperature/precipitation during 2000–2015; the significant correlations include four categories: extreme negative correlation (r < 0, p < 0.01), intermediate negative correlation (r < 0, 0.01 < p < 0.05), intermediate positive correlation (r > 0, 0.01 < p < 0.05) and extreme positive correlation (r > 0, p < 0.01).
Sig. Area (103 km2) (%)Negative
Correlation
Extreme
Negative
Correlation
Intermediate Negative
Correlation
Positive
Correlation
Extreme
Positive
Correlation
Intermediate
Positive
Correlation
Albedo-33.249.2224.0299.9930.2769.72
Temperature(2.40%)(0.66%)(1.73%)(7.21%)(2.18%)(5.03%)
Albedo-158.3760.3698.0119.694.4915.2
Precipitation(11.62%)(4.35%)(7.27%)(1.42%)(0.32%)(1.10%)
Table 4. The correlation coefficient between the monthly albedo and the temperature/precipitation in the current month (CM), the preceding month (PM), the month before last (MBL), and three previous months (TPM) (statistically significant results are indicated as for a 95% confidence level (*) and 99% confidence level (**)).
MonthCMPMMBLTPM
Temp.Precip.Temp.Precip.Temp.Precip.Temp.Precip.
May−0.710 **0.089−0.0940.077−0.1570.2170.1030.353
June−0.4230.038−0.030−0.3500.078−0.0050.102−0.073
July0.113−0.690 **−0.1740.303−0.0890.173−0.1500.363
Aug.−0.163−0.2950.044−0.413 *0.1560.413−0.1280.293
Sept.−0.190−0.106−0.212−0.2050.2880.0550.240−0.097
Publisher’s Note: MDPI stays neutral with regard to jurisdictional claims in published maps and institutional affiliations.

