Artificial Neural Network Model of Soil Heat Flux over Multiple Land Covers in South America
Abstract
1. Introduction
2. Materials and Methods
2.1. Study Sites
2.2. Input Data
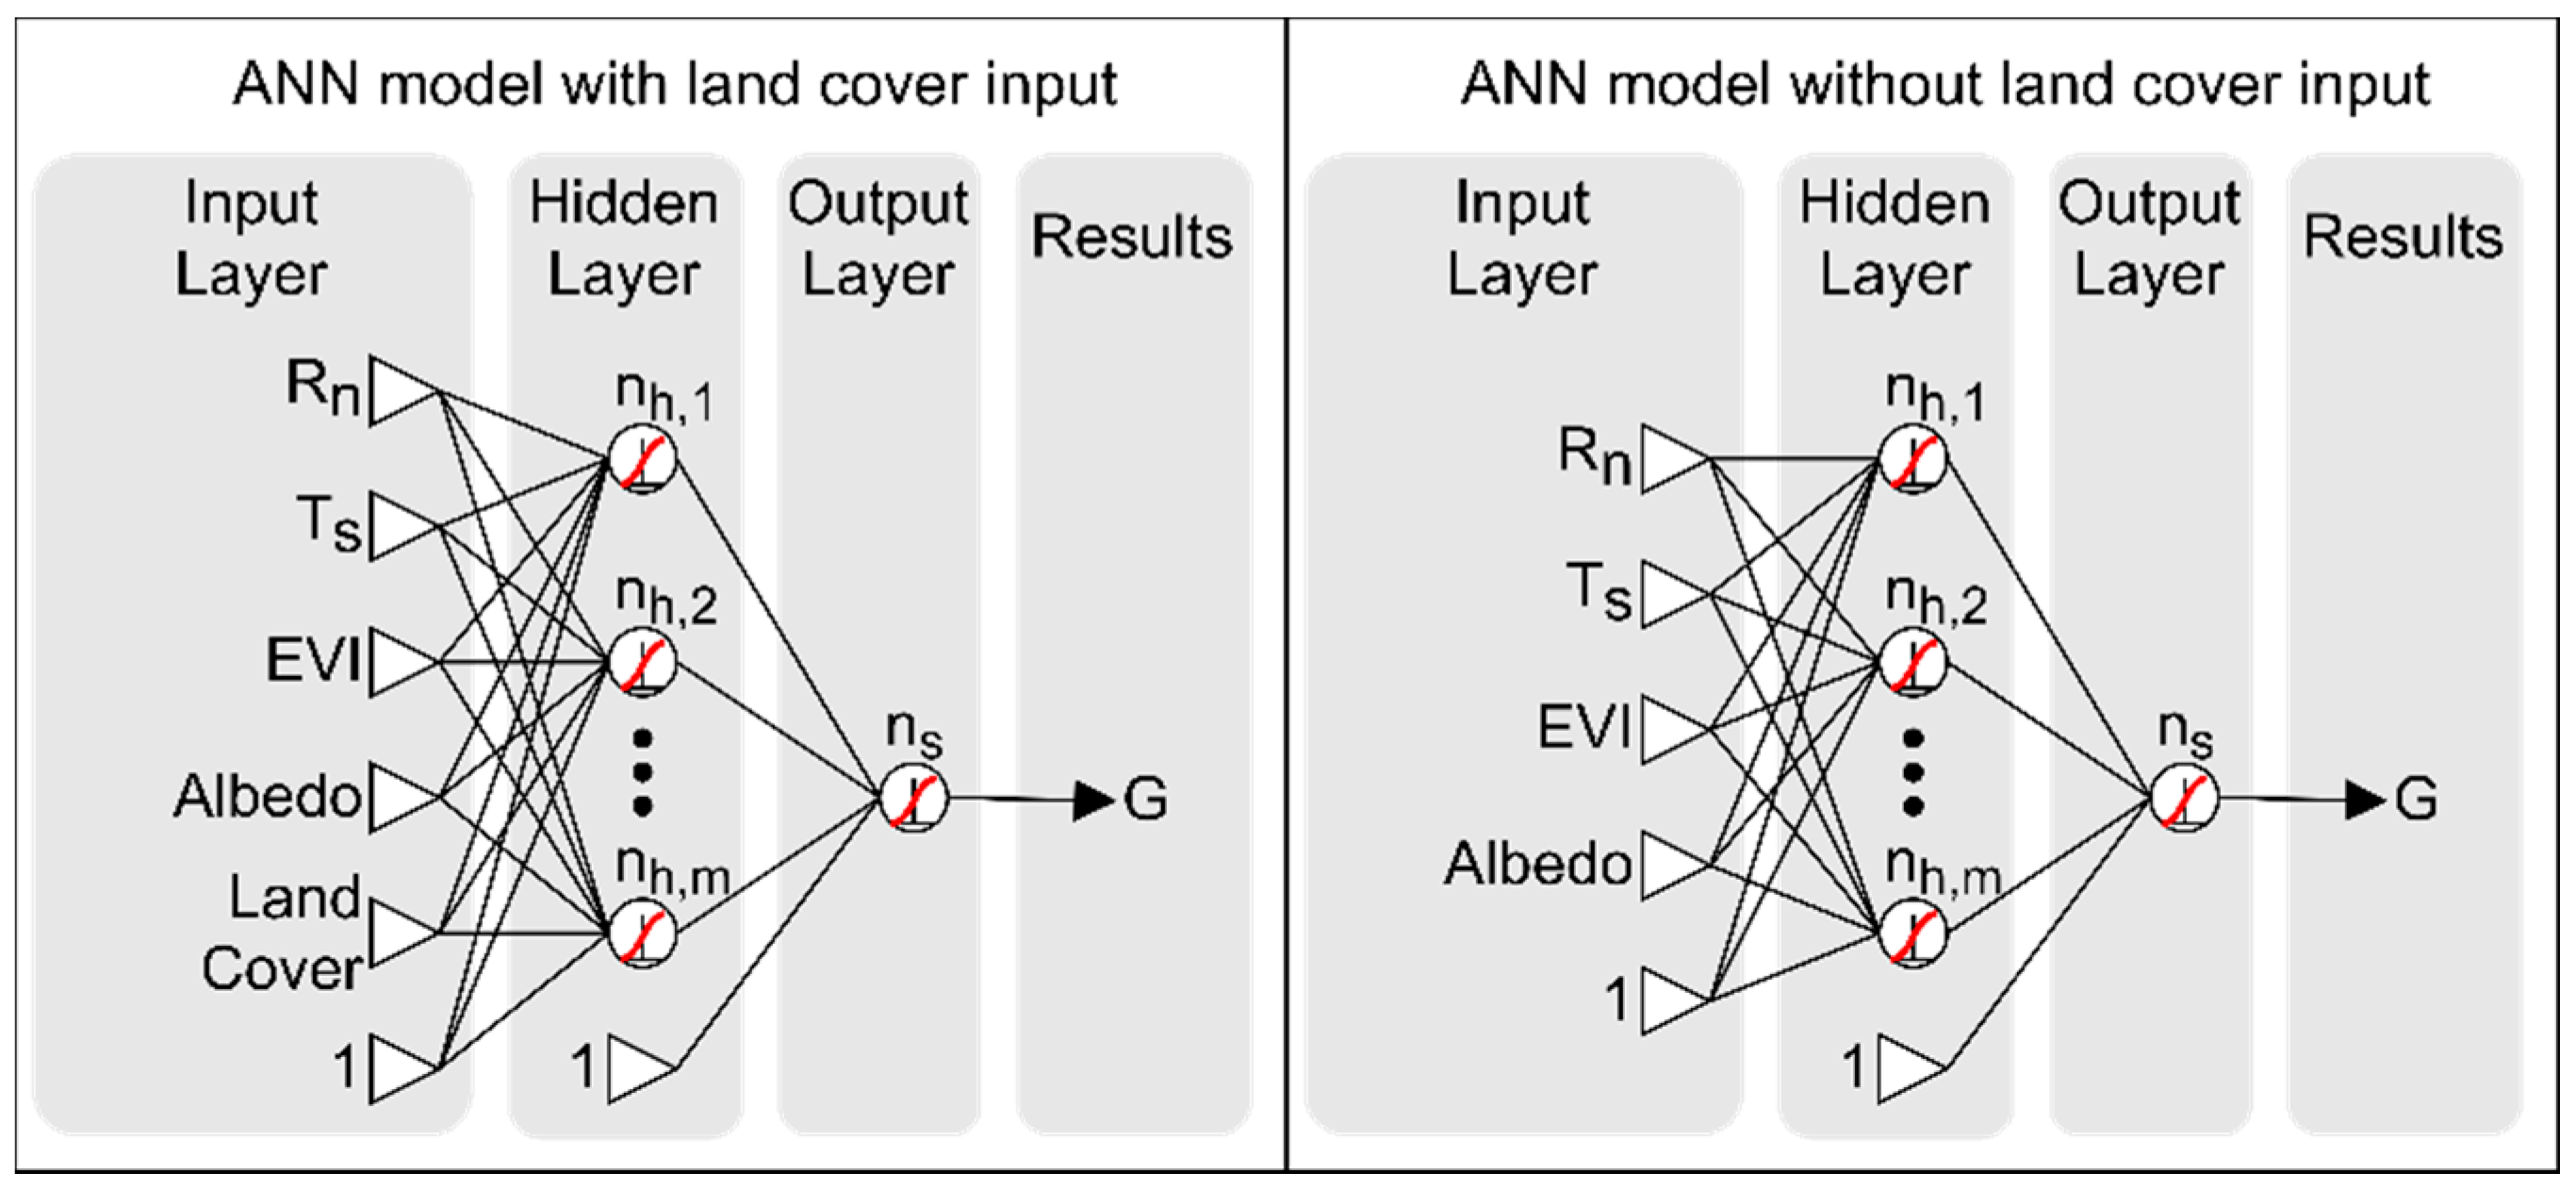
2.3. ANN’s Structure
2.4. ANN’s Training Process
2.5. Performance Assessment and Input Data Contribution Analysis
3. Results
3.1. ANN Training Process
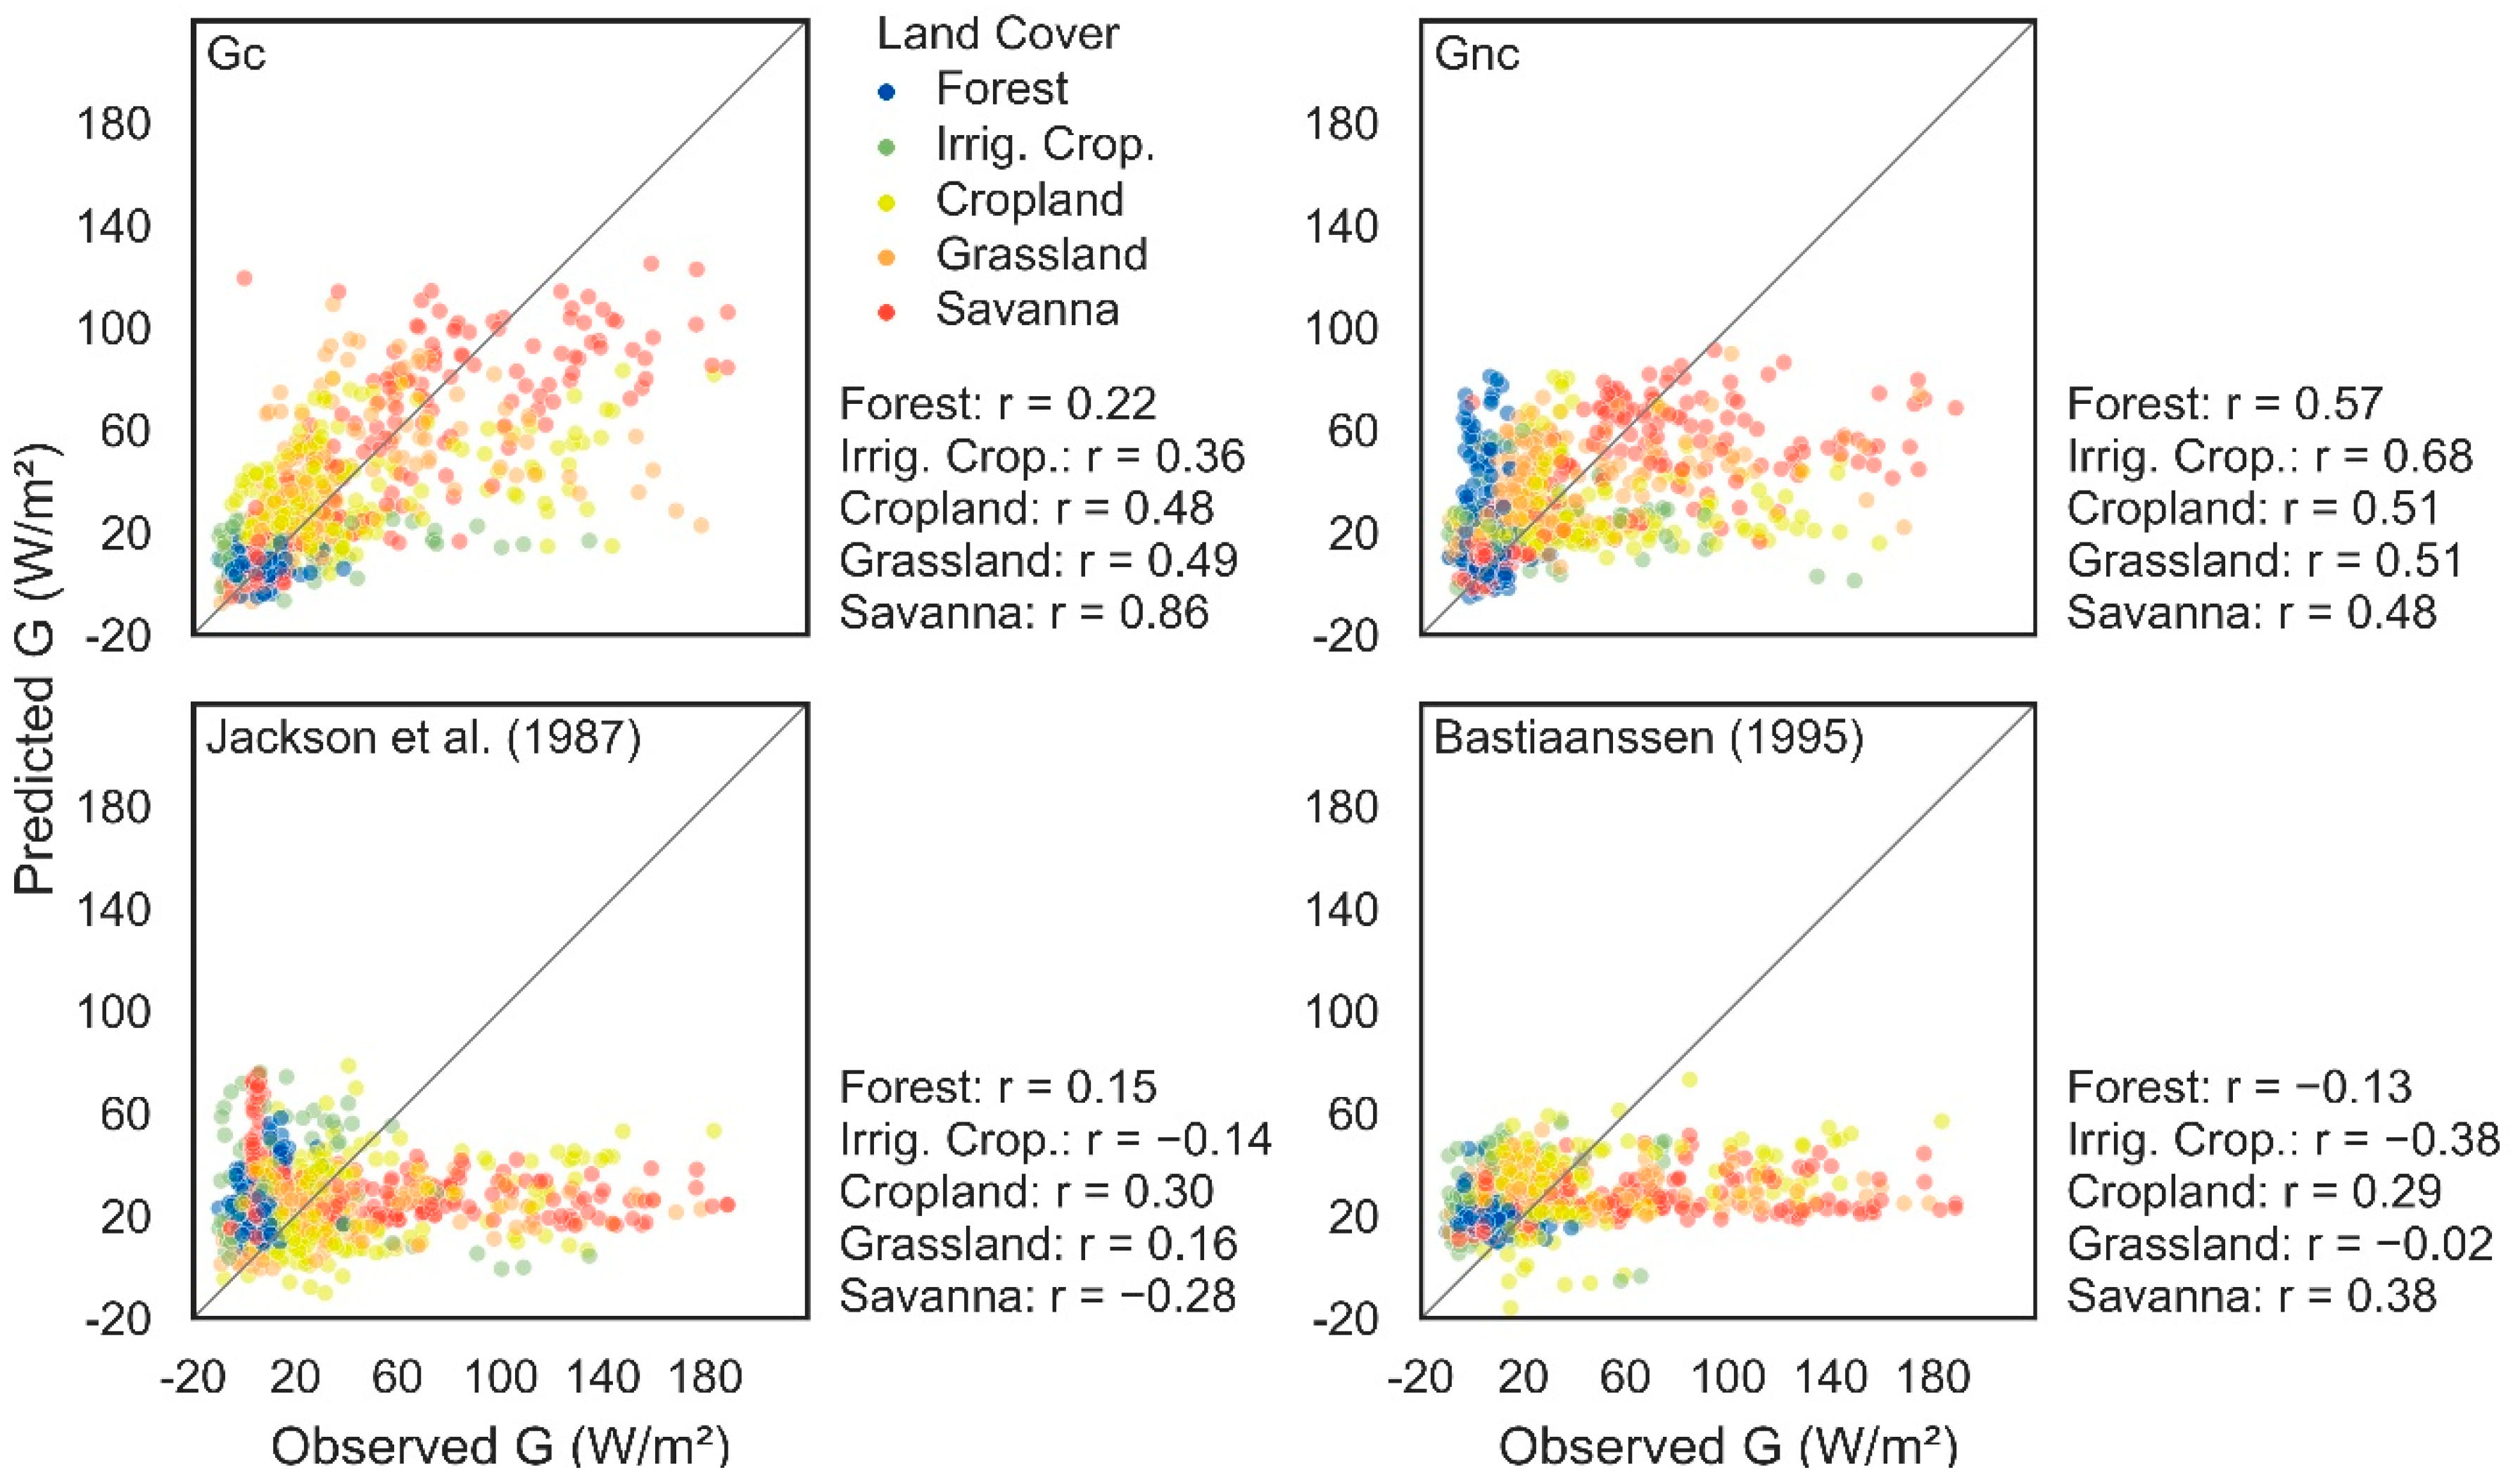
3.2. Model Performance Evaluation
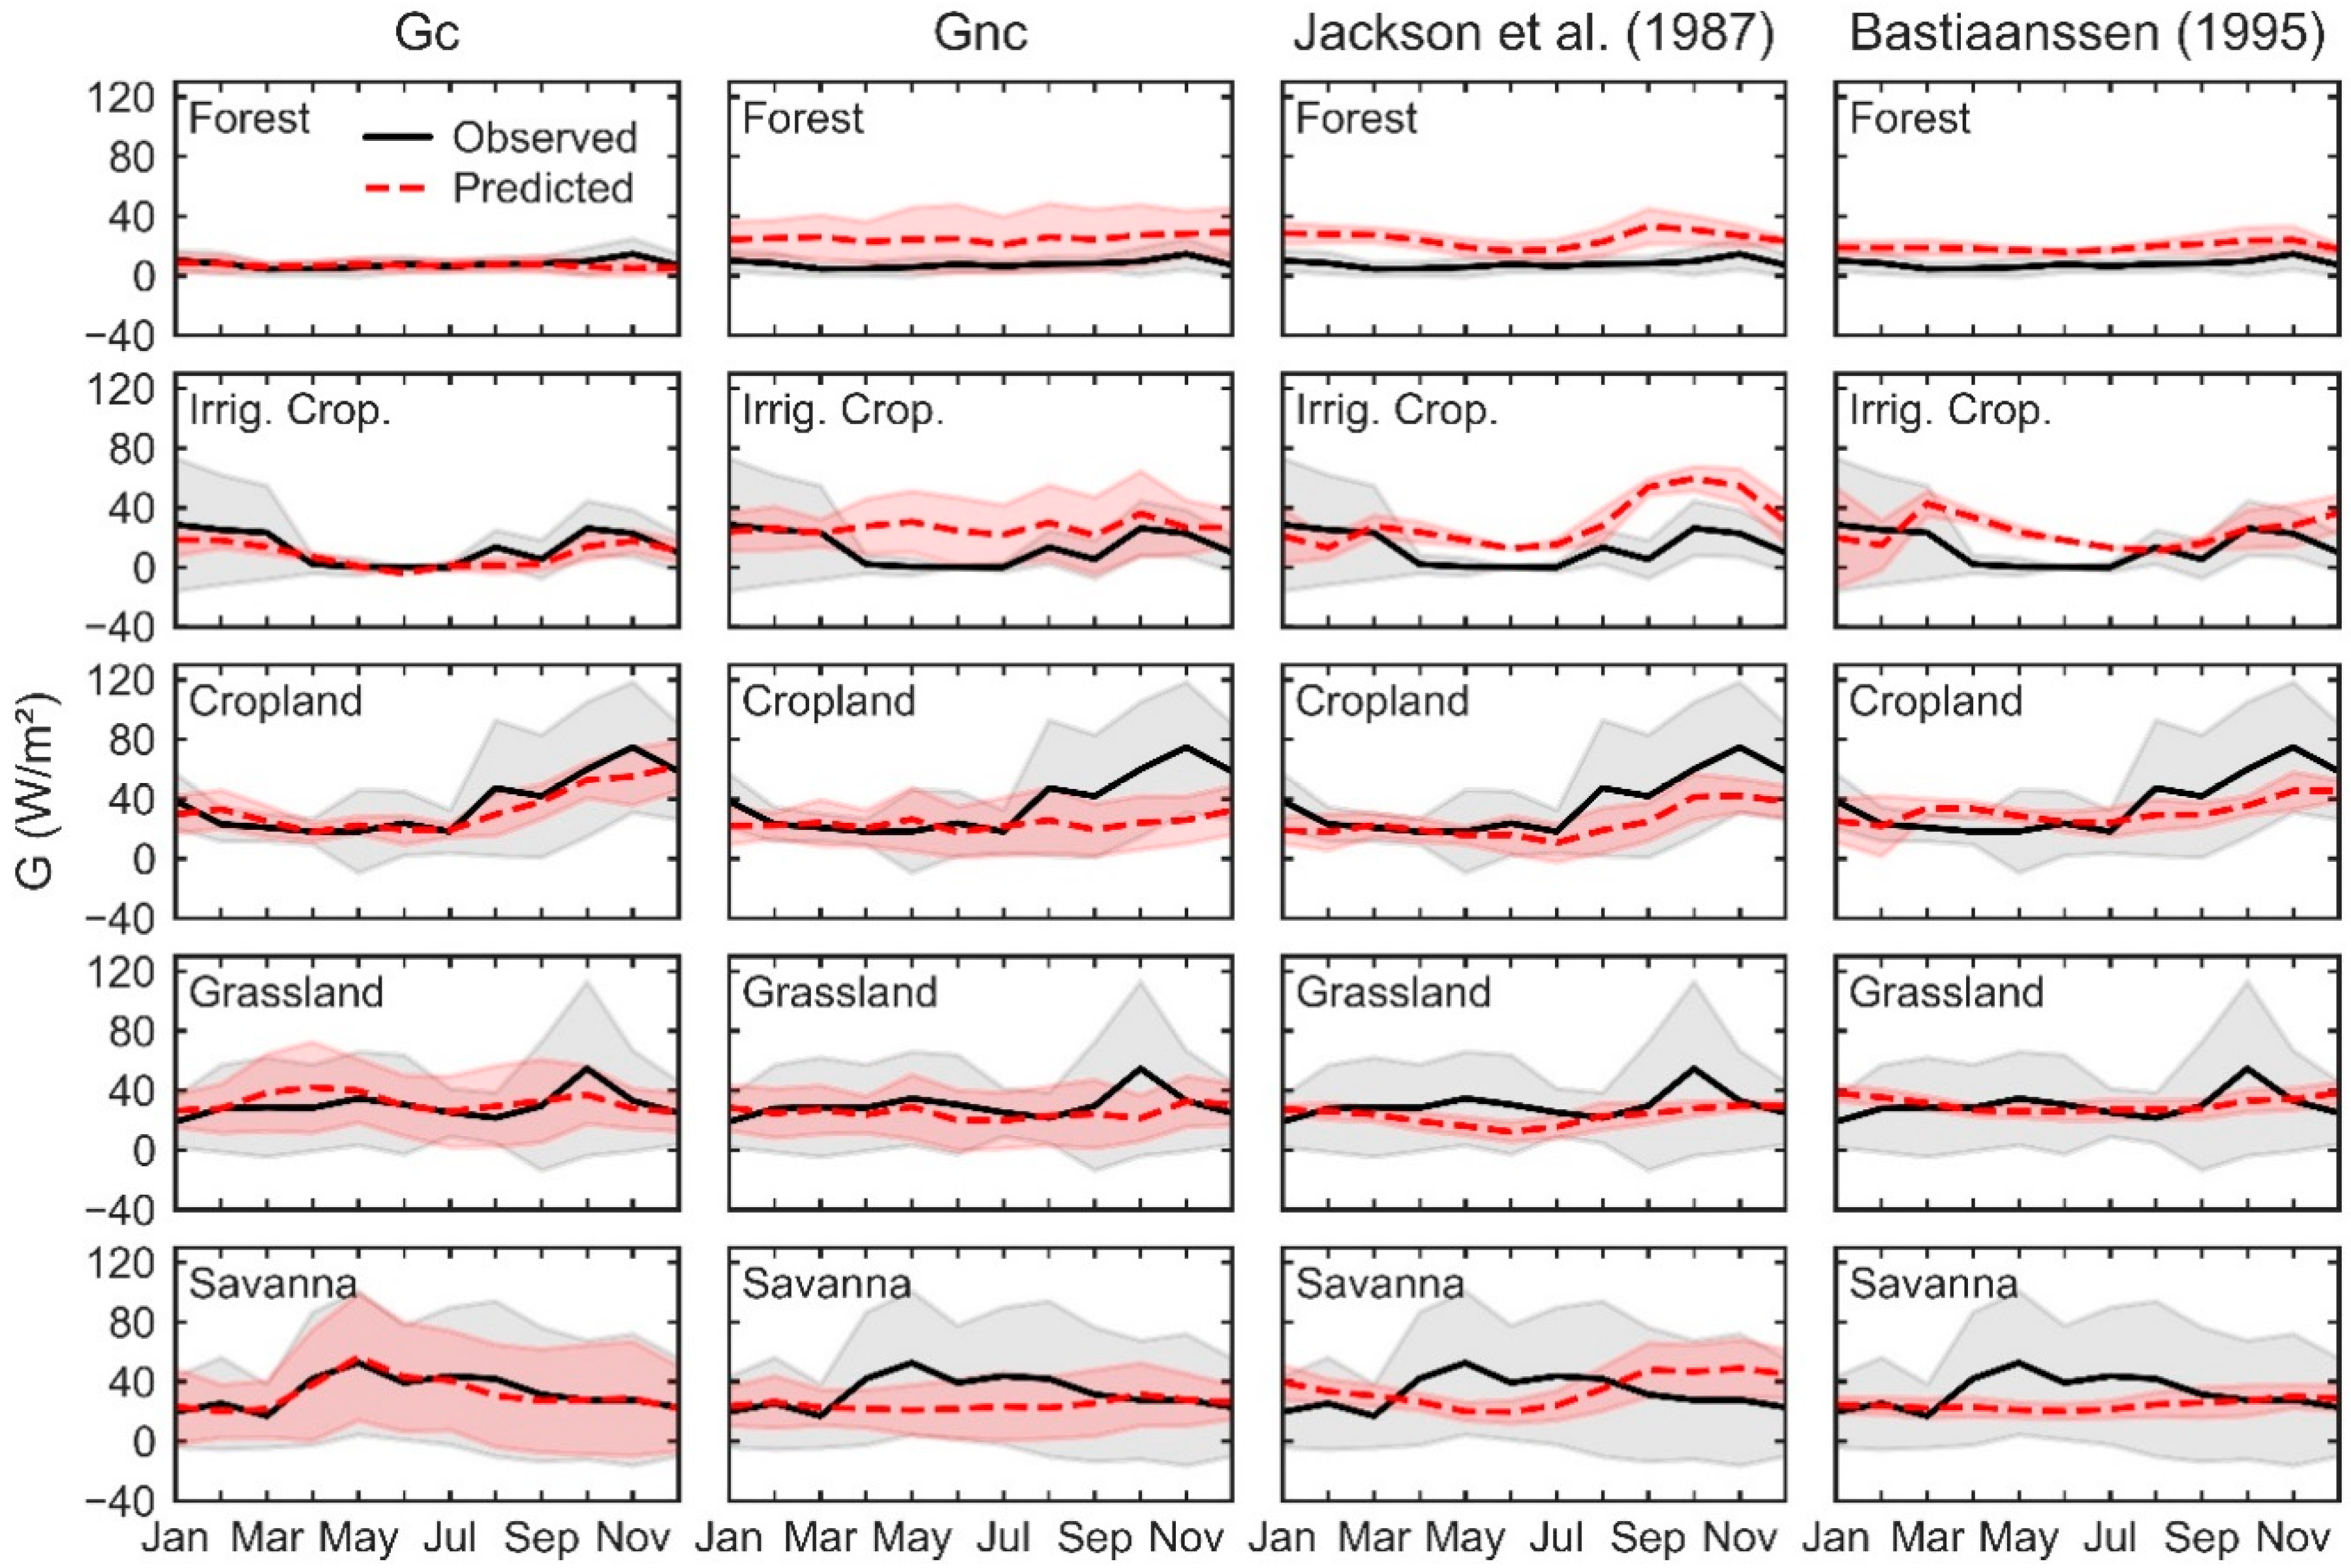
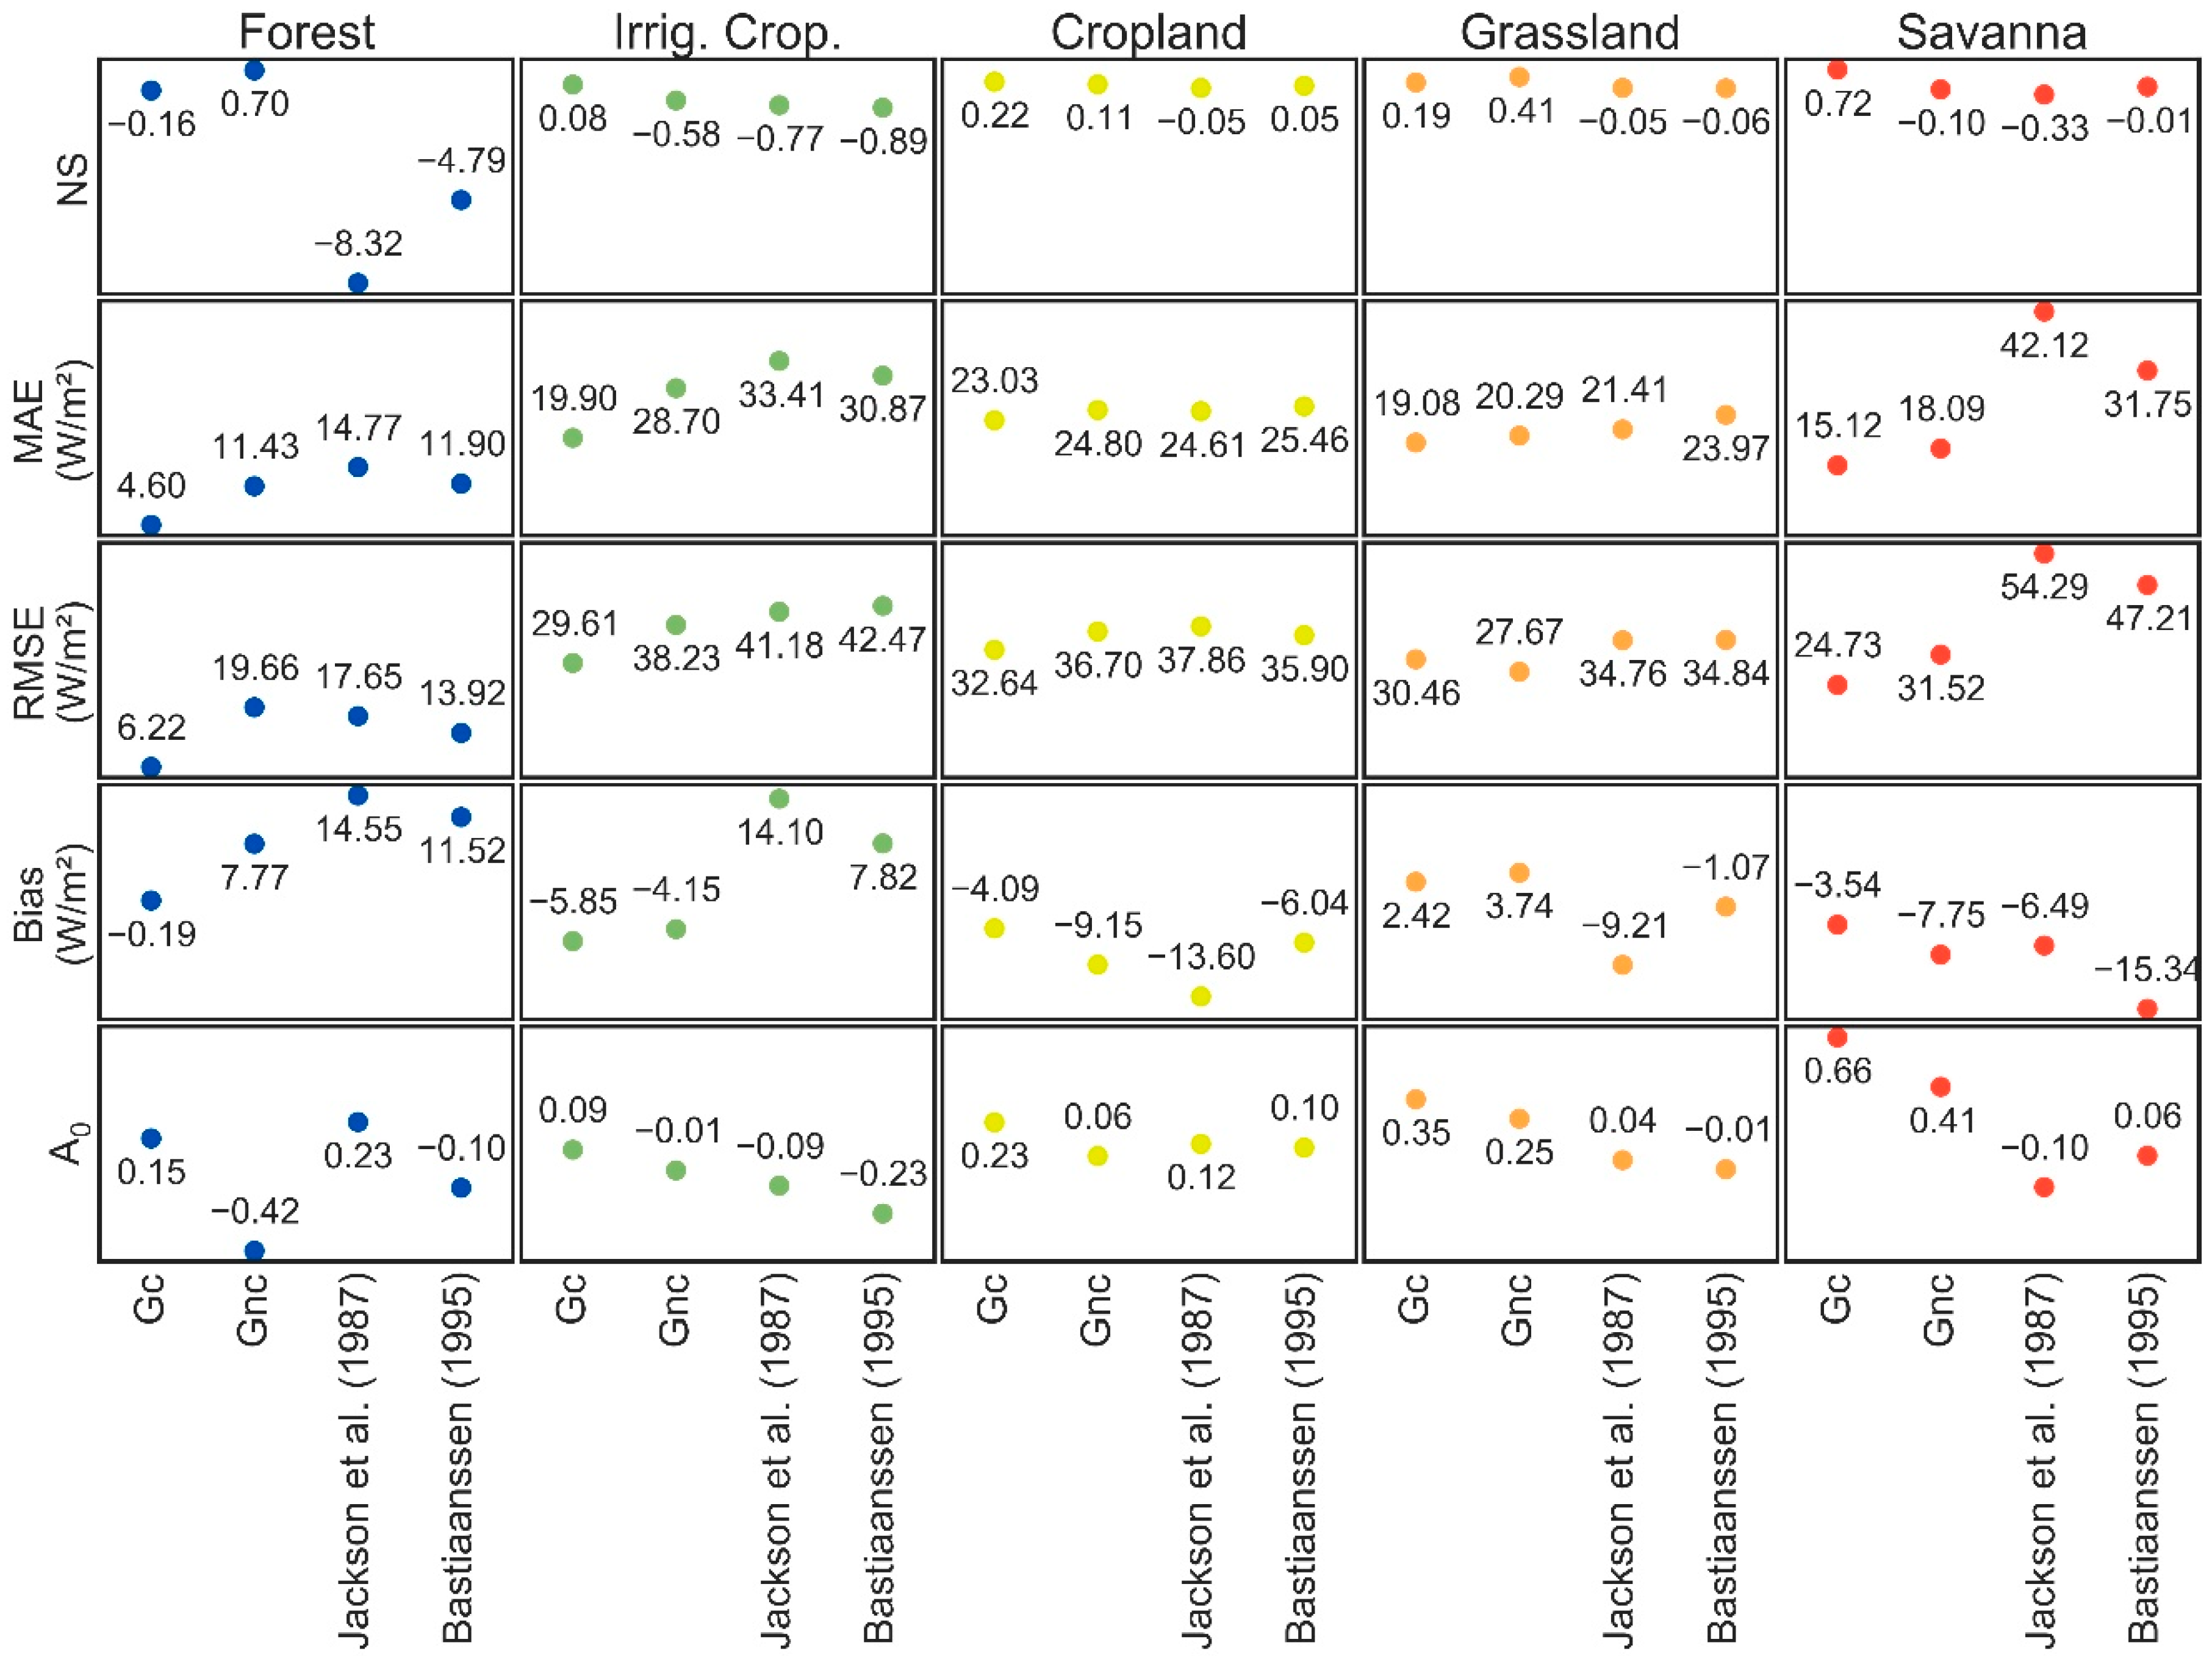
3.3. Model Performance by Land Cover
4. Discussion
5. Conclusions
Supplementary Materials
Author Contributions
Funding
Conflicts of Interest
References
- Kustas, W.P.; Norman, J.M. Evaluation of soil and vegetation heat flux predictions using a simple two-source model with radiometric temperatures for partial canopy cover. Agric. For. Meteorol. 1999, 94, 13–29. [Google Scholar] [CrossRef]
- Trenberth, K.E.; Fasullo, J.T.; Kiehl, J. Earth’s Global Energy Budget. Bull. Am. Meteorol. Soc. 2009, 90, 311–324. [Google Scholar] [CrossRef]
- Senay, G.B.; Bohms, S.; Singh, R.K.; Gowda, P.H.; Velpuri, N.M.; Alemu, H.; Verdin, J.P. Operational Evapotranspiration Mapping Using Remote Sensing and Weather Datasets: A New Parameterization for the SSEB Approach. JAWRA J. Am. Water Resour. Assoc. 2013, 49, 577–591. [Google Scholar] [CrossRef]
- Senay, G.B.; Schauer, M.; Friedrichs, M.; Velpuri, N.M.; Singh, R.K. Satellite-based water use dynamics using historical Landsat data (1984–2014) in the southwestern United States. Remote Sens. Environ. 2017, 202, 98–112. [Google Scholar] [CrossRef]
- Sauer, T.J.; Horton, R. Soil Heat Flux. In Micrometeorology in Agricultural Systems; Agronomy Monograph; American Society of Agronomy, Inc., Crop Science Society of America, Inc., Soil Science Society of America, Inc.: Madison, WI, USA, 2005; Volume 47, pp. 131–154. [Google Scholar]
- Heusinkveld, B.G.; Jacobs, A.F.G.; Holtslag, A.A.M.; Berkowicz, S.M. Surface energy balance closure in an arid region: Role of soil heat flux. Agric. For. Meteorol. 2004, 122, 21–37. [Google Scholar] [CrossRef]
- Kalma, J.D.; Jupp, D.L.B. Estimating evaporation from pasture using infrared thermometry: Evaluation of a one-layer resistance model. Agric. For. Meteorol. 1990, 51, 223–246. [Google Scholar] [CrossRef]
- Menenti, M.; Choudhury, B.J. Parameterization of land surface evaporation by means of location dependent potential evaporation and surface temperature range. In Exchange Processes at the Land Surface for a Range of Space and Time Scales, Proceedings of the Yokohama Symposium, Yokohama, Japan, 13–16 July 1993; International Association of Hydrological Sciences: Wallingford, UK, 1993; pp. 561–568. [Google Scholar]
- Norman, J.M.; Kustas, W.P.; Humes, K.S. Source approach for estimating soil and vegetation energy fluxes in observations of directional radiometric surface temperature. Agric. For. Meteorol. 1995, 77, 263–293. [Google Scholar] [CrossRef]
- Anderson, M.C.; Norman, J.M.; Diak, G.R.; Kustas, W.P.; Mecikalski, J.R. A two-source time-integrated model for estimating surface fluxes using thermal infrared remote sensing. Remote Sens. Environ. 1997, 60, 195–216. [Google Scholar] [CrossRef]
- Bastiaanssen, W.G.M.; Menenti, M.; Feddes, R.A.; Holtslag, A.A.M. A remote sensing surface energy balance algorithm for land (SEBAL) 1. Formulation. J. Hydrol. 1998, 212–213, 198–212. [Google Scholar] [CrossRef]
- Bastiaanssen, W.G.M.; Pelgrum, H.; Wang, J.; Ma, Y.; Moreno, J.F.; Roerink, G.J.; van der Wal, T. A remote sensing surface energy balance algorithm for land (SEBAL) 2. Validation. J. Hydrol. 1998, 212–213, 213–229. [Google Scholar] [CrossRef]
- Roerink, G.J.; Su, Z.; Menenti, M. S-SEBI: A simple remote sensing algorithm to estimate the surface energy balance. Phys. Chem. Earth Part B Hydrol. 2000, 25, 147–157. [Google Scholar] [CrossRef]
- Su, Z. The Surface Energy Balance System (SEBS) for estimation of turbulent heat fluxes. Hydrol. Earth Syst. Sci. 2002, 6, 85–100. [Google Scholar] [CrossRef]
- Allen, R.G.; Tasumi, M.; Trezza, R. Satellite-Based Energy Balance for Mapping Evapotranspiration with Internalized Calibration (METRIC)—Model. J. Irrig. Drain. Eng. 2007, 133, 380–394. [Google Scholar] [CrossRef]
- Senay, G.; Budde, M.; Verdin, J.; Melesse, A. A Coupled Remote Sensing and Simplified Surface Energy Balance Approach to Estimate Actual Evapotranspiration from Irrigated Fields. Sensors 2007, 7, 979–1000. [Google Scholar] [CrossRef]
- Anderson, M.C.; Kustas, W.P.; Norman, J.M.; Hain, C.R.; Mecikalski, J.R.; Schultz, L.; González-Dugo, M.P.; Cammalleri, C.; d’Urso, G.; Pimstein, A.; et al. Mapping daily evapotranspiration at field to continental scales using geostationary and polar orbiting satellite imagery. Hydrol. Earth Syst. Sci. 2011, 15, 223–239. [Google Scholar] [CrossRef]
- Senay, G.B.; Kagone, S.; Velpuri, N.M. Operational Global Actual Evapotranspiration: Development, Evaluation, and Dissemination. Sensors 2020, 20, 1915. [Google Scholar] [CrossRef]
- Bastiaanssen, W.G.M.; Noordman, E.J.M.; Pelgrum, H.; Davids, G.; Thoreson, B.P.; Allen, R.G. SEBAL Model with Remotely Sensed Data to Improve Water-Resources Management under Actual Field Conditions. J. Irrig. Drain. Eng. 2005, 131, 85–93. [Google Scholar] [CrossRef]
- Bastiaanssen, W.; Thoreson, B.; Clark, B.; Davids, G. Discussion of “Application of SEBAL Model for Mapping Evapotranspiration and Estimating Surface Energy Fluxes in South-Central Nebraska” by Ramesh, K. Singh, Ayse Irmak, Suat Irmak, and Derrel, L. Martin. J. Irrig. Drain. Eng. 2010, 136, 282–283. [Google Scholar] [CrossRef]
- Singh, R.K.; Irmak, A.; Irmak, S.; Martin, D.L. Application of SEBAL model for mapping evapotranspiration and estimating surface energy fluxes in south-central Nebraska. J. Irrig. Drain. Eng. 2008, 134, 273–285. [Google Scholar] [CrossRef]
- Zhang, S.W.; Lei, Y.P.; Li, H.J.; Wang, Z. Temporal-spatial variation in crop evapotranspiration in Hebei Plain, China. J. Food Agric. Environ. 2010, 8, 672–677. [Google Scholar]
- Ruhoff, A.L.; Paz, A.R.; Collischonn, W.; Aragao, L.E.O.C.; Da Rocha, H.R.; Malhi, Y.S. A MODIS-Based Energy Balance to Estimate Evapotranspiration for Clear-Sky Days in Brazilian Tropical Savannas. Remote Sens. 2012, 4, 703–725. [Google Scholar] [CrossRef]
- Liou, Y.-A.; Kar, S. Evapotranspiration Estimation with Remote Sensing and Various Surface Energy Balance Algorithms—A Review. Energies 2014, 7, 2821–2849. [Google Scholar] [CrossRef]
- Bhattarai, N.; Shaw, S.B.; Quackenbush, L.J.; Im, J.; Niraula, R. Evaluating five remote sensing based single-source surface energy balance models for estimating daily evapotranspiration in a humid subtropical climate. Int. J. Appl. Earth Obs. Geoinf. 2016, 49, 75–86. [Google Scholar] [CrossRef]
- Wagle, P.; Bhattarai, N.; Gowda, P.H.; Kakani, V.G. Performance of five surface energy balance models for estimating daily evapotranspiration in high biomass sorghum. ISPRS J. Photogramm. Remote Sens. 2017, 128, 192–203. [Google Scholar] [CrossRef]
- Purdy, A.J.; Fisher, J.B.; Goulden, M.L.; Famiglietti, J.S. Ground heat flux: An analytical review of 6 models evaluated at 88 sites and globally. J. Geophys. Res. Biogeosci. 2016, 121, 3045–3059. [Google Scholar] [CrossRef]
- Cammalleri, C.; La Loggia, G.; Loggia, A.; Maltese, A. Critical analysis of empirical ground heat flux equations on a cereal field using micrometeorological data. In Proceedings of the SPIE—The International Society for Optical Engineering, Berlin, Germany, 1–3 September 2009. [Google Scholar] [CrossRef]
- Kilic, A.; Singh, R.K.; Walter-Shea, E.A.; Verma, S.; Suyker, A.E. Comparison and Analysis of Empirical Equations for Soil Heat Flux for Different Cropping Systems and Irrigation Methods. Pap. Nat. Resour. 2011, 334, 67–80. [Google Scholar]
- Russell, E.S.; Liu, H.; Gao, Z.; Finn, D.; Lamb, B. Impacts of soil heat flux calculation methods on the surface energy balance closure. Agric. For. Meteorol. 2015, 214–215, 189–200. [Google Scholar] [CrossRef]
- Dhungel, S.; Barber, M. Estimating Calibration Variability in Evapotranspiration Derived from a Satellite-Based Energy Balance Model. Remote Sens. 2018, 10, 1695. [Google Scholar] [CrossRef]
- Laipelt, L.; Ruhoff, A.L.; Fleischmann, A.S.; Kayser, R.H.B.; Kich, E.; da Rocha, H.R.; Neale, C.M.U. Assessment of an Automated Calibration of the SEBAL Algorithm to Estimate Dry-Season Surface-Energy Partitioning in a Forest–Savanna Transition in Brazil. Remote Sens. 2020, 12, 1108. [Google Scholar] [CrossRef]
- Danelichen, V.H.M.; Biudes, M.S.; Souza, M.C.; Machado, N.G.; Silva, B.B.; Nogueira, J.S. Estimation of soil heat flux in a neotropical Wetland region using remote sensing techniques. Rev. Bras. Meteorol. 2014, 29, 469–482. [Google Scholar] [CrossRef][Green Version]
- Villarreal, S.; Vargas, R. Representativeness of FLUXNET sites across Latin America. J. Geophys. Res. Biogeosci. 2021, 126, e2020JG006090. [Google Scholar] [CrossRef]
- Saleska, S.R.; Da Rocha, H.R.; Huete, A.R.; Nobre, A.D.; Artaxo, P.E.; Shimabukuro, Y.E. LBA-ECO CD-32 Flux Tower Network Data Compilation, Brazilian Amazon: 1999–2006. ORNL Distributed Active Archive Center 2013. Available online: http://daac.ornl.gov/cgi-bin/dsviewer.pl?ds_id=1174 (accessed on 30 June 2020).
- Davidson, E.A.; Artaxo, P. Globally significant changes in biological processes of the Amazon Basin: Results of the Large-scale Biosphere–Atmosphere Experiment. Glob. Chang. Biol. 2004, 10, 519–529. [Google Scholar] [CrossRef]
- Borges, C.K.; dos Santos, C.A.C.; Carneiro, R.G.; da Silva, L.L.; de Oliveira, G.; Mariano, D.; Silva, M.T.; da Silva, B.B.; Bezerra, B.G.; Perez-Marin, A.M.; et al. Seasonal variation of surface radiation and energy balances over two contrasting areas of the seasonally dry tropical forest (Caatinga) in the Brazilian semi-arid. Environ. Monit. Assess. 2020, 192, 524. [Google Scholar] [CrossRef]
- Tabarelli, M.; da Rocha, C.F.D.; Romanowski, H.P.; Rocha, O.; de Lacerda, L.D. PELD—CNPq: Dez Anos do Programa de Pesquisas Ecológicas de Longa Duração do Brasil: Achados, Lições e Perspectivas; Universitária da UFPE: Recife, Brazil, 2013; p. 446. ISBN 978-85-415-0329-7. [Google Scholar]
- Biudes, M.S.; Vourlitis, G.L.; Machado, N.G.; de Arruda, P.H.Z.; Neves, G.A.R.; de Almeida Lobo, F.; Neale, C.M.U.; de Souza Nogueira, J. Patterns of energy exchange for tropical ecosystems across a climate gradient in Mato Grosso, Brazil. Agric. For. Meteorol. 2015, 202, 112–124. [Google Scholar] [CrossRef]
- Da Rocha, H.R.; Manzi, A.O.; Cabral, O.M.; Miller, S.D.; Goulden, M.L.; Saleska, S.R.; Coupe, N.; Wofsy, S.C.; Borma, L.S.; Artaxo, P.; et al. Patterns of water and heat flux across a biome gradient from tropical forest to savanna in Brazil. J. Geophys. Res. 2009, 114. [Google Scholar] [CrossRef]
- Eva, H.D.; Belward, A.S.; De Miranda, E.E.; Di Bella, C.M.; Gond, V.; Huber, O.; Jones, S.; Sgrenzaroli, M.; Fritz, S. A land cover map of South America. Glob. Chang. Biol. 2004, 10, 731–744. [Google Scholar] [CrossRef]
- Hornik, K.; Stinchcombe, M.; White, H. Multilayer feedforward networks are universal approximators. Neural Netw. 1989, 2, 359–368. [Google Scholar] [CrossRef]
- Silverman, D.; Dracup, J.A. Artificial Neural Networks and Long-Range Precipitation Prediction in California. J. Appl. Meteorol. 2000, 39, 57–66. [Google Scholar] [CrossRef]
- Zanetti, S.S.; Sousa, E.F.; Oliveira, V.P.; Almeida, F.T.; Bernardo, S. Estimating Evapotranspiration Using Artificial Neural Network and Minimum Climatological Data. J. Irrig. Drain. Eng. 2007, 133, 83–89. [Google Scholar] [CrossRef]
- Tabari, H.; Sabziparvar, A.-A.; Ahmadi, M. Comparison of artificial neural network and multivariate linear regression methods for estimation of daily soil temperature in an arid region. Meteorol. Atmos. Phys. 2010, 110, 135–142. [Google Scholar] [CrossRef]
- Canelón, D.J.; Chávez, J.L. Soil Heat Flux Modeling Using Artificial Neural Networks and Multispectral Airborne Remote Sensing Imagery. Remote Sens. 2011, 3, 1627–1643. [Google Scholar] [CrossRef]
- Jimeno-Sáez, P.; Senent-Aparicio, J.; Pérez-Sánchez, J.; Pulido-Velazquez, D. A Comparison of SWAT and ANN Models for Daily Runoff Simulation in Different Climatic Zones of Peninsular Spain. Water 2018, 10, 192. [Google Scholar] [CrossRef]
- Käfer, P.; Souza da Rocha, N.; Ribeiro Diaz, L.; Kaiser, E.; Santos, D.; Veeck, G.; Robérti, D.; Rolim, S.; Oliveira, G. Artificial neural networks model based on remote sensing to retrieve evapotranspiration over the Brazilian Pampa. J. Appl. Remote Sens. 2020, 14, 038504. [Google Scholar] [CrossRef]
- Adadi, A.; Berrada, M. Peeking inside the black-box: A survey on Explainable Artificial Intelligence (XAI). IEEE Access 2018, 52138–52160. [Google Scholar] [CrossRef]
- Borma, L.S.; Da Rocha, H.R.; Cabral, O.M.; von Randow, C.; Collicchio, E.; Kurzatkowski, D.; Brugger, P.J.; Freitas, H.; Tannus, R.; Oliveira, L.; et al. Atmosphere and hydrological controls of the evapotranspiration over a floodplain forest in the Bananal Island region, Amazonia. J. Geophys. Res. 2009, 114. [Google Scholar] [CrossRef]
- Santos, A.J.B.; Silva, G.T.D.A.; Miranda, H.S.; Miranda, A.C.; Lloyd, J. Effects of fire on surface carbon, energy and water vapour fluxes over campo sujo savanna in central Brazil. Funct. Ecol. 2003, 17, 711–719. [Google Scholar] [CrossRef]
- Aguiar, L.J.G.A. Fluxos de Massa e Energia Para a Cultura de Milho (Zea mays L.) no Rio Grande do Sul; Universidade Federal de Viçosa: Viçosa, Brazil, 2011. [Google Scholar]
- Moreira, V.S. Balanço de Água no Ciclo da Cultura se Soja: Representação no Modelo de Vegetação Dinâmica Agro-Ibis; Universidade Federal de Santa Maria: Santa Maria, Brazil, 2012. [Google Scholar]
- Carneiro, J.V. Estimativas das Trocas Líquidas de Carbono em Duas Áreas de Cultivo de Arroz Irrigado na Região Central do RS; Universidade Federal de Santa Maria: Santa Maria, Brazil, 2012. [Google Scholar]
- Souza, R.; Feng, X.; Antonino, A.; Montenegro, S.; Souza, E.; Porporato, A. Vegetation response to rainfall seasonality and interannual variability in tropical dry forests. Hydrol. Process. 2016, 30, 3583–3595. [Google Scholar] [CrossRef]
- Lathuillière, M.J.; Dalmagro, H.J.; Black, T.A.; Arruda, P.H.Z.d.; Hawthorne, I.; Couto, E.G.; Johnson, M.S. Rain-fed and irrigated cropland-atmosphere water fluxes and their implications for agricultural production in Southern Amazonia. Agric. For. Meteorol. 2018, 256–257, 407–419. [Google Scholar] [CrossRef]
- Brito, T.; Lima, J.; Oliveira, C.; Souza, R.; Antonino, A.; Medeiros, É.; Souza, E.; Alves, E. Mudanças no Uso da Terra e Efeito nos Componentes do Balanço Hídrico no Agreste Pernambucano. Rev. Bras. Geogr. Fís. 2020, 13, 870–886. [Google Scholar] [CrossRef]
- da Silva, P.F.; de Sousa Lima, J.R.; Antonino, A.C.D.; Souza, R.; Souza, E.S.; de Silva, J.R.I.; Alves, E.M. Seasonal patterns of carbon dioxide, water and energy fluxes over the Caatinga and grassland in the semi-arid region of Brazil. J. Arid. Environ. 2017, 147, 71–82. [Google Scholar] [CrossRef]
- Hasler, N.; Avissar, R. What Controls Evapotranspiration in the Amazon Basin? J. Hydrometeorol. 2007, 8, 380–395. [Google Scholar] [CrossRef]
- Araújo, A.C. Comparative measurements of carbon dioxide fluxes from two nearby towers in a central Amazonian rainforest: The Manaus LBA site. J. Geophys. Res. 2002, 107. [Google Scholar] [CrossRef]
- Dalmagro, H.J.; de Arruda, P.H.Z.; Vourlitis, G.L.; Lathuillière, M.J.; Nogueira, J.d.S.; Couto, E.G.; Johnson, M.S. Radiative forcing of methane fluxes offsets net carbon dioxide uptake for a tropical flooded forest. Glob. Chang. Biol. 2019, 25. [Google Scholar] [CrossRef] [PubMed]
- Rubert, G.C.R.; Roberti, D.R.; Diaz, M.B.; de Moraes, O.L.L. Estimativa da evapotranspiração em área de pastagem em Santa Maria—RS. Ciênc. Nat. 2016, 38, 300–304. [Google Scholar] [CrossRef]
- Oliveira, M.B.L.; Von Randow, C.; Manzi, A.O.; Alvala, R.; As, L.D.A.; Souza, A. Fluxos Turbulentos de Energia Sobre o Pantanal Sul Matogrossense. Rev. Bras. Meteorol. 2006, 21, 371–377. [Google Scholar]
- Da Rocha, H.R.; Freitas, H.C.; Rosolem, R.; Juárez, R.I.N.; Tannus, R.N.; Ligo, M.A.; Cabral, O.M.R.; Dias, M.A.F.S. Measurements of CO2 exchange over a woodland savanna (Cerrado Sensu stricto) in southeast Brasil. Biota Neotrop. 2002, 2, 1–11. [Google Scholar] [CrossRef]
- Timm, A.U.; Roberti, D.R.; Streck, N.A.; de Gonçalves, L.G.G.; Acevedo, O.C.; Moraes, O.L.; Moreira, V.S.; Degrazia, G.A.; Ferlan, M.; Toll, D.L. Energy partitioning and evapotranspiration over a rice paddy in Southern Brazil. J. Hydrometeorol. 2014, 15, 1975–1988. [Google Scholar] [CrossRef]
- Zimmer, T.; Stefanello, M.B.; Moreira, V.S.; Diaz, M.B.; Souza, V.D.A.; Roberti, D.R.; Maria, S. Estimating the soil thermal conductivity using experimental soil heat flux in a rice paddy area. Amer. J. Environ. Eng. 2016, 6, 103–108. [Google Scholar]
- Sakai, R.K.; Fitzjarrald, D.R.; Moraes, O.L.L.; Staebler, R.M.; Acevedo, O.C.; Czikowsky, M.J.; Da Silva, R.; Brait, E.; Miranda, V. Land-use change effects on local energy, water, and carbon balances in an Amazonian agricultural field. Glob. Chang. Biol. 2004, 10, 895–907. [Google Scholar] [CrossRef]
- Goulden, M.L.; Miller, S.D.; Da Rocha, H.R.; Menton, M.C.; De Freitas, H.C.; Michela, A.; Figueira, S.; Cleilim, A.; Dias, A.; Sousa, D. Diel and seasonal patterns of tropical forest CO2 exchange. Ecol. Appl. 2004, 14, 42–54. [Google Scholar] [CrossRef]
- Cabral, O.M.R.; Da Rocha, H.R.; Ligo, M.A.V.; Brunini, O.; Dias, M.A.S. Fluxos turbulentos de calor sensivel, vapor de água e CO2 sobre plantaçao de cana-de-açúcar (Saccharum sp.) em Sertãozinho-SP. Rev. Bras. Meteorol. 2003, 18, 61–70. [Google Scholar]
- Rodell, M.; Houser, P.R.; Jambor, U.; Gottschalck, J.; Mitchell, K.; Meng, C.-J.; Arsenault, K.; Cosgrove, B.; Radakovich, J.; Bosilovich, M.; et al. The Global Land Data Assimilation System, Bull. Amer. Meteor. Soc. 2004, 85, 381–394. [Google Scholar] [CrossRef]
- Wan, Z.; Hook, S.; Hulley, G. MOD11A2 MODIS/Terra Land Surface Temperature/Emissivity 8-Day L3 Global 1 km SIN Grid V006 Data Set. NASA EOSDIS Land Process. DAAC 2015. [Google Scholar] [CrossRef]
- Schaaf, C.; Wang, Z. MCD43A3 MODIS/Terra+Aqua BRDF/Albedo Daily L3 Global—500 m V006 Data Set. NASA EOSDIS Land Process. DAAC 2015. [Google Scholar] [CrossRef]
- Didan, K. MOD13Q1 MODIS/Terra Vegetation Indices 16-Day L3 Global 250m SIN Grid V006 [Data Set]. NASA EOSDIS Land Process. DAAC 2015. [Google Scholar] [CrossRef]
- Idso, S.B.; Aase, J.K.; Jackson, R.D. Net radiation—soil heat flux relations as influenced by soil water content variations. Bound. Layer Meteorol. 1975, 9, 113–122. [Google Scholar] [CrossRef]
- Kustas, W.P.; Daughtry, C.S.T. Estimation of the Soil Heat Flux/Net Radiation from Spectral Data. Agric. For. Meteorol. 1990, 49, 205–223. [Google Scholar] [CrossRef]
- Kustas, W.P.; Daughtry, C.S.T.; Van Oevelen, P.J. Analytical Treatment of the Relationships between Soil Heat Flux/Net Radiation and Vegetation Indices. Remote Sens. Environ. 1993, 46, 319–330. [Google Scholar] [CrossRef]
- Lucchese, L.V.; Oliveira, G.G.d.; Pedrollo, O.C. Attribute selection using correlations and principal components for artificial neural networks employment for landslide susceptibility assessment. Environ. Monit. Assess. 2020, 192, 129. [Google Scholar] [CrossRef] [PubMed]
- Rumelhart, D.E.; Hinton, G.E.; Williams, R.J. Learning representations by back-propagating errors. Nature 1986, 323, 533–536. [Google Scholar] [CrossRef]
- Widrow, B.; Hoff, M.E. Adaptive Switching Circuits. In 1960 IRE WESCON Convention Record, 4th ed.; Part 4; IRE: New York, NY, USA, 1960; pp. 96–104. [Google Scholar]
- Vogl, T.P.; Mangis, J.K.; Rigler, A.K.; Zink, W.T.; Alkon, D.L. Accelerating the convergence of the backpropagation method. Biol. Cybern. 1988, 59, 257–263. [Google Scholar] [CrossRef]
- Crowther, P.S.; Cox, R.J. A Method for Optimal Division of Data Sets for Use in Neural Networks. Knowl. Based Intell. Inf. Eng. Syst. 2005, 1–7. [Google Scholar] [CrossRef]
- Nash, J.E.; Sutcliffe, J.V. River flow forecasting through conceptual models part I—A discussion of principles. J. Hydrol. 1970, 10, 282–290. [Google Scholar] [CrossRef]
- Jackson, R.D.; Moran, M.S.; Gay, L.W.; Raymond, L.H. Evaluating evaporation from field crops using airborne radiometry and ground-based meteorological data. Irrig. Sci. 1987, 8, 81–90. [Google Scholar] [CrossRef]
- Bastiaanssen, W.G.M. Regionalization of Surface Flux Densities and Moisture Indicators in Composite Terrain. Ph.D. Thesis, Wageningem Agricultural University, Wageningen, The Netherlands, November 1995; p. 273. [Google Scholar]
- Willmott, C.J.; Matsuura, K. Advantages of the mean absolute error (MAE) over the root mean square error (RMSE) in assessing average model performance. Clim. Res. 2005, 30, 79–82. [Google Scholar] [CrossRef]
- Boylan, J.W.; Russell, A.G. PM and light extinction model performance metrics, goals, and criteria for three-dimensional air quality models. Atmos. Environ. 2006, 40, 4946–4959. [Google Scholar] [CrossRef]
- Sen, P.K. Estimates of the regression coefficient based on Kendall’s tau. J. Am. Stat. Assoc. 1968, 63, 1379–1389. [Google Scholar] [CrossRef]
- Wilks, D.S. Statistical Methods in the Atmospheric Sciences; Academic Press: London, UK, 2011; p. 676. [Google Scholar]
- Garson, G.D. Interpreting neural-network connection weights. Artif. Intell. Expert 1991, 6, 47–51. [Google Scholar]
- Goh, A.T.C. Back-propagation neural networks for modeling complex systems. Artif. Intell. Eng. 1995, 9, 143–151. [Google Scholar] [CrossRef]
- Alemohammad, S.H.; Fang, B.; Konings, A.G.; Aires, F.; Green, J.K.; Kolassa, J.; Miralles, D.; Prigent, C.; Gentine, P. Water, Energy, and Carbon with Artificial Neural Networks (WECANN): A statistically based estimate of global surface turbulent fluxes and gross primary productivity using solar-induced fluorescence. Biogeosciences 2017, 14, 4101–4124. [Google Scholar] [CrossRef] [PubMed]
- Feng, J.; Wang, W.; Xu, F.; Sun, S. Estimating surface heat and water vapor fluxes by combining two-source energy balance model and backpropagation neural network. Sci. Total. Environ. 2020, 729, 138724. [Google Scholar] [CrossRef] [PubMed]
- Walls, S.; Binns, A.D.; Levison, J.; MacRitchie, S. Prediction of actual evapotranspiration by artificial neural network models using data from a Bowen ratio energy balance station. Neural Comput. Appl. 2020. [Google Scholar] [CrossRef]
- Anderson, M.; Norman, J.; Kustas, W.; Houborg, R.; Starks, P.; Agam, N. A thermal-based remote sensing technique for routine mapping of land-surface carbon, water and energy fluxes from field to regional scales. Remote Sens. Environ. 2008, 112, 4227–4241. [Google Scholar] [CrossRef]
- de Teixeira, A.H.; Bastiaanssen, W.G.M.; Ahmad, M.D.; Bos, M.G. Reviewing SEBAL input parameters for assessing evapotranspiration and water productivity for the Low-Middle São Francisco River basin, Brazil. Agric. For. Meteorol. 2009, 149, 462–476. [Google Scholar] [CrossRef]
- Kim, Y.; Still, C.J.; Hanson, C.V.; Kwon, H.; Greer, B.T.; Law, B.E. Canopy skin temperature variations in relation to climate, soil temperature, and carbon flux at a ponderosa pine forest in central Oregon. Agric. For. Meteorol. 2016, 226–227, 161–173. [Google Scholar] [CrossRef]
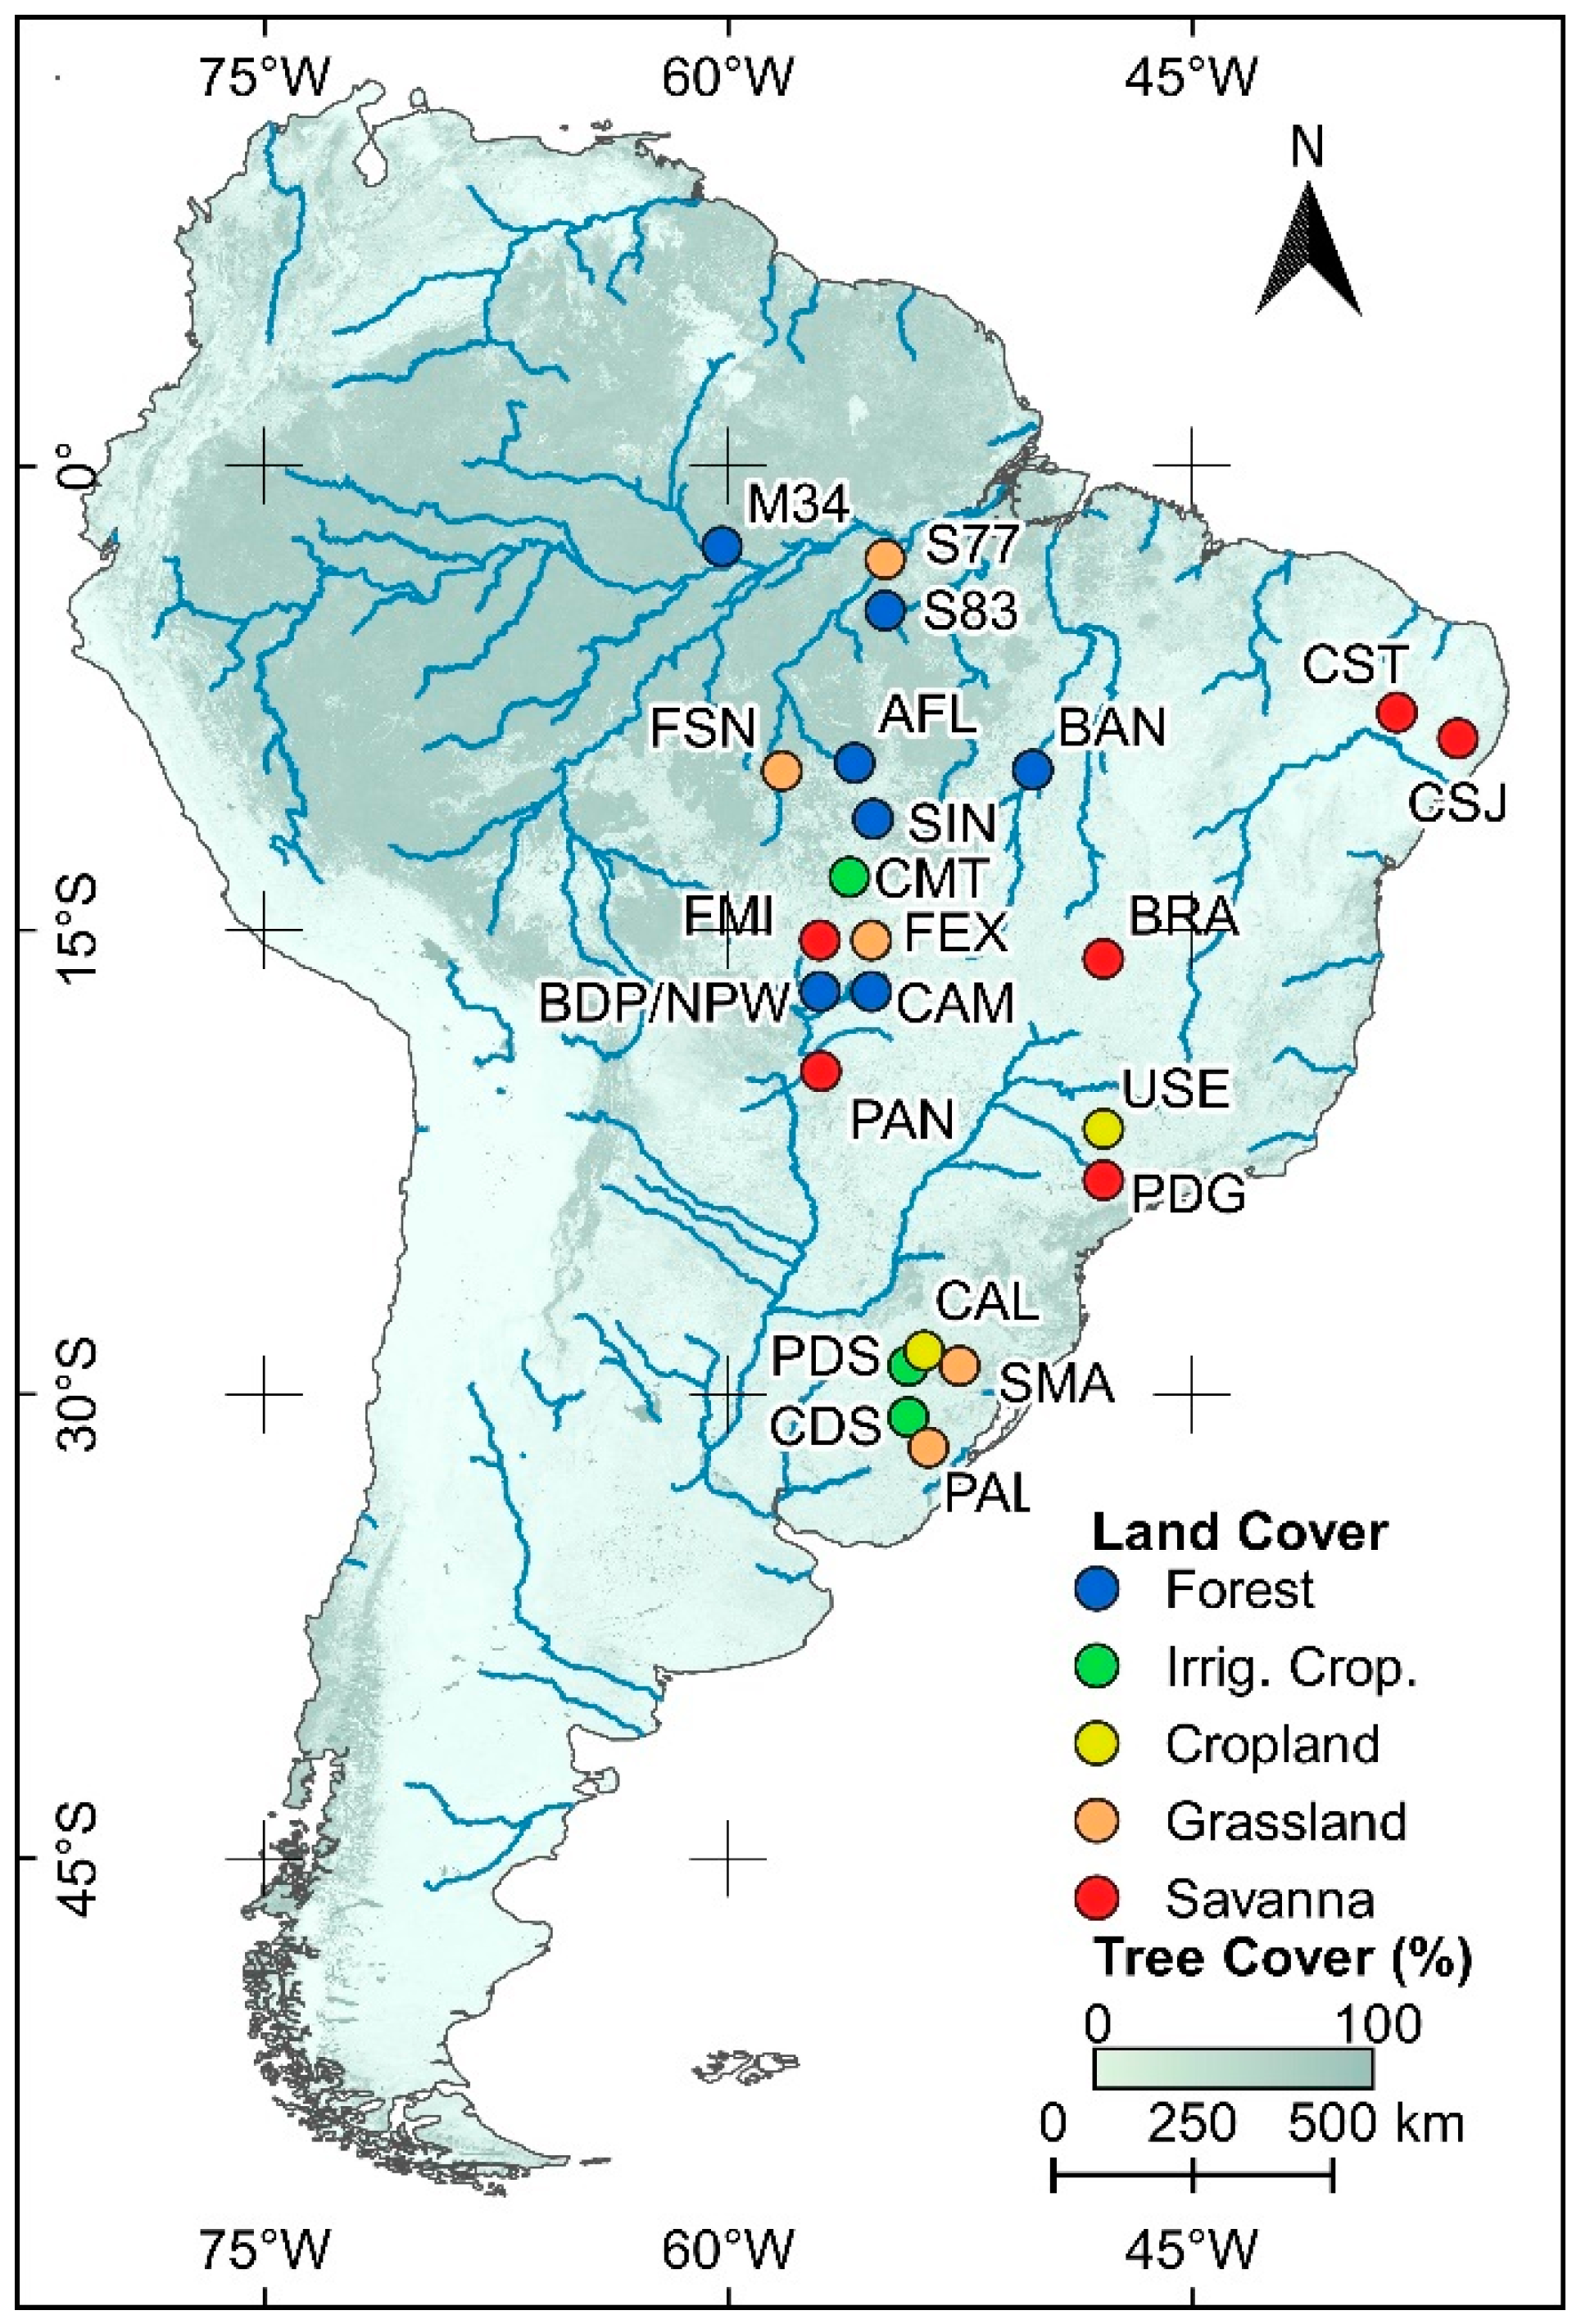

| Name | Land Cover | Main Land Cover | Available Data Period | Source |
|---|---|---|---|---|
| AFL | Rainforest | Forest | February 2003–March 2004 | [39] |
| BAN | Seasonally flooded forest | Forest | October 2003–December 2006 | [50] |
| BDP | Seasonally flooded forest | Forest | June 2011–August 2015 | [39] |
| BRA | Cerrado | Savanna | January 2011–December 2011 | [51] |
| CAL | Cropland (soy) | Cropland | January 2009–September 2014 | [52,53] |
| CAM | Seasonally flooded forest | Forest | January 2007–January 2009 | [38] |
| CDS | Cropland (flooded rice) | Irrigated cropland | January 2011–December 2014 | [54,55] |
| CMT | Irrigated cropland | Irrigated cropland | September 2015–February 2017 | [56] |
| CSJ | Caatinga | Savanna | April 2019–December 2019 | [57] |
| CST | Caatinga | Savanna | February 2014–March 2020 | [55,58] |
| FEX | Pasture | Grassland | September 2006–March 2010 | [39] |
| FMI | Cerrado | Savanna | April 2009–May2013 | [39] |
| FSN | Pasture | Grassland | March 2002–July 2003 | [59] |
| M34 | Tropical forest | Forest | January 2000–September 2006 | [60] |
| NPW | Seasonally flooded forest | Forest | January 2015–July 2017 | [61] |
| PAL | Grassland | Grassland | September 2013–September 2016 | [62] |
| PAN | Cerrado | Savanna | January 2001–December 2006 | [63] |
| PDG | Cerrado | Savanna | January 2001–December 2006 | [64] |
| PDS | Cropland (flooded rice) | Irrigated cropland | October 2003–March 2004 | [65,66] |
| SIN | Transitional forest (cerradão) | Forest | May2005–October 2008 | [39] |
| S77 | Pasture/agriculture | Grassland | August 2000–November 2005 | [67] |
| S83 | Tropical forest | Forest | June 2000–March 2004 | [68] |
| SMA | Grassland | Grassland | January 2013–December 2016 | [62] |
| USE | Cropland (sugarcane) | Cropland | January 2001–December 2002 | [69] |
| Data | Product | Spatiotemporal Resolution | Source |
|---|---|---|---|
| Net radiation (Rn) | GLDAS 2.1 | 0.25°/3 h | [70] |
| Land surface temperature (Ts) | MOD11A2.V6 | 1000 m/1 day | [71] |
| Albedo (α) | MCD43A3.V6 | 500 m/1 day | [72] |
| Enhanced vegetation index (EVI) | MOD13Q1.V6 | 250 m/16 days | [73] |
| Data | Bottom Limit | Top Limit |
|---|---|---|
| Soil heat flux (G) | −20.0 W/m2 | 200.0 W/m2 |
| Net radiation (Rn) | 150.0 W/m2 | 1000.0 W/m2 |
| Land surface temperature (Ts) | 275.0 K | 325.0 K |
| Albedo (α) | 0.1 | 0.5 |
| Enhanced vegetation index (EVI) | −0.1 | 1.0 |
| Land cover | 0.0 | 6.0 |
| Original Equations | Adjusted Equations |
|---|---|
| Jackson et al. (1987): | Jackson et al. (1987): |
| Bastiaanssen (1995): | Bastiaanssen (1995): |
| Metric | Gc | Gnc | Jackson et al. (1987) | Bastiaanssen (1995) | ||
|---|---|---|---|---|---|---|
| Original | Adjusted | Original | Adjusted | |||
| NS | 0.53 | 0.27 | −23.11 | −0.17 | −7.16 | 0.02 |
| MAE (W/m2) | 14.04 | 18.06 | 145.66 | 24.43 | 84.69 | 21.78 |
| MAE (%) | 56% | 70% | 603% | 101% | 351% | 90% |
| RMSE (W/m2) | 23.95 | 28.90 | 159.15 | 35.00 | 92.61 | 32.00 |
| RMSE (%) | 95% | 113% | 659% | 145% | 384% | 133% |
| Bias (W/m2) | −1.87 | −0.82 | 145.36 | 1.07 | 81.73 | 0.99 |
| Bias (%) | −7% | −3% | 602% | 4% | 339% | 4% |
| A0 | 0.52 | 0.30 | 0.08 | 0.01 | 0.12 | 0.08 |
| r | 0.73 | 0.53 | 0.04 | 0.02 | 0.12 | 0.21 |
| Source | Land Cover | Number of Samples | MAE (W/m2) | RMSE (W/m2) | r |
|---|---|---|---|---|---|
| [14] | Cropland, shrubland, and grassland | 620 | 4.5–41.5 | 5.4–46.3 | 0.96–0.97 |
| [23] | Savanna and cropland | 56 | 35.0–41.0 | - | 0.66–0.75 |
| [27] | Various | 100,234 | - | 26.9–42.1 | 0.32–0.46 |
| [32] | Forest | 12 | 108.3–108.9 | 109.3–110.0 | - |
| [33] | Croplands and forest | 131 | - | 29.2–45.3 | 0.06–0.76 |
| [46] | Croplands | 50 | - | - | 0.73–0.96 |
| [48] | Grasslands | 67 | 40.6 | 43.0 | 0.70 |
| [94] | Grasslands | 698 | - | 23.0–28.0 | 0.57–0.77 |
| [95] | Irrigated cropland and savanna | 18 | - | 13.3 | 0.90 |
Publisher’s Note: MDPI stays neutral with regard to jurisdictional claims in published maps and institutional affiliations. |
© 2021 by the authors. Licensee MDPI, Basel, Switzerland. This article is an open access article distributed under the terms and conditions of the Creative Commons Attribution (CC BY) license (https://creativecommons.org/licenses/by/4.0/).
Share and Cite
de Andrade, B.C.C.; Pedrollo, O.C.; Ruhoff, A.; Moreira, A.A.; Laipelt, L.; Kayser, R.B.; Biudes, M.S.; dos Santos, C.A.C.; Roberti, D.R.; Machado, N.G.; et al. Artificial Neural Network Model of Soil Heat Flux over Multiple Land Covers in South America. Remote Sens. 2021, 13, 2337. https://doi.org/10.3390/rs13122337
de Andrade BCC, Pedrollo OC, Ruhoff A, Moreira AA, Laipelt L, Kayser RB, Biudes MS, dos Santos CAC, Roberti DR, Machado NG, et al. Artificial Neural Network Model of Soil Heat Flux over Multiple Land Covers in South America. Remote Sensing. 2021; 13(12):2337. https://doi.org/10.3390/rs13122337
Chicago/Turabian Stylede Andrade, Bruno César Comini, Olavo Correa Pedrollo, Anderson Ruhoff, Adriana Aparecida Moreira, Leonardo Laipelt, Rafael Bloedow Kayser, Marcelo Sacardi Biudes, Carlos Antonio Costa dos Santos, Debora Regina Roberti, Nadja Gomes Machado, and et al. 2021. "Artificial Neural Network Model of Soil Heat Flux over Multiple Land Covers in South America" Remote Sensing 13, no. 12: 2337. https://doi.org/10.3390/rs13122337
APA Stylede Andrade, B. C. C., Pedrollo, O. C., Ruhoff, A., Moreira, A. A., Laipelt, L., Kayser, R. B., Biudes, M. S., dos Santos, C. A. C., Roberti, D. R., Machado, N. G., Dalmagro, H. J., Antonino, A. C. D., Lima, J. R. d. S., de Souza, E. S., & Souza, R. (2021). Artificial Neural Network Model of Soil Heat Flux over Multiple Land Covers in South America. Remote Sensing, 13(12), 2337. https://doi.org/10.3390/rs13122337


