
Evaluating the Differenced Normalized Burn Ratio for Assessing Fire Severity Using Sentinel-2 Imagery in Northeast Siberian Larch Forests

 , , , , and
Abstract
1. Introduction
2. Materials and Methods
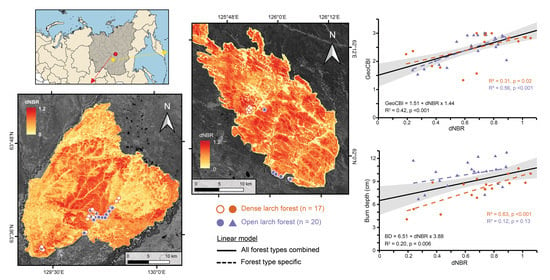
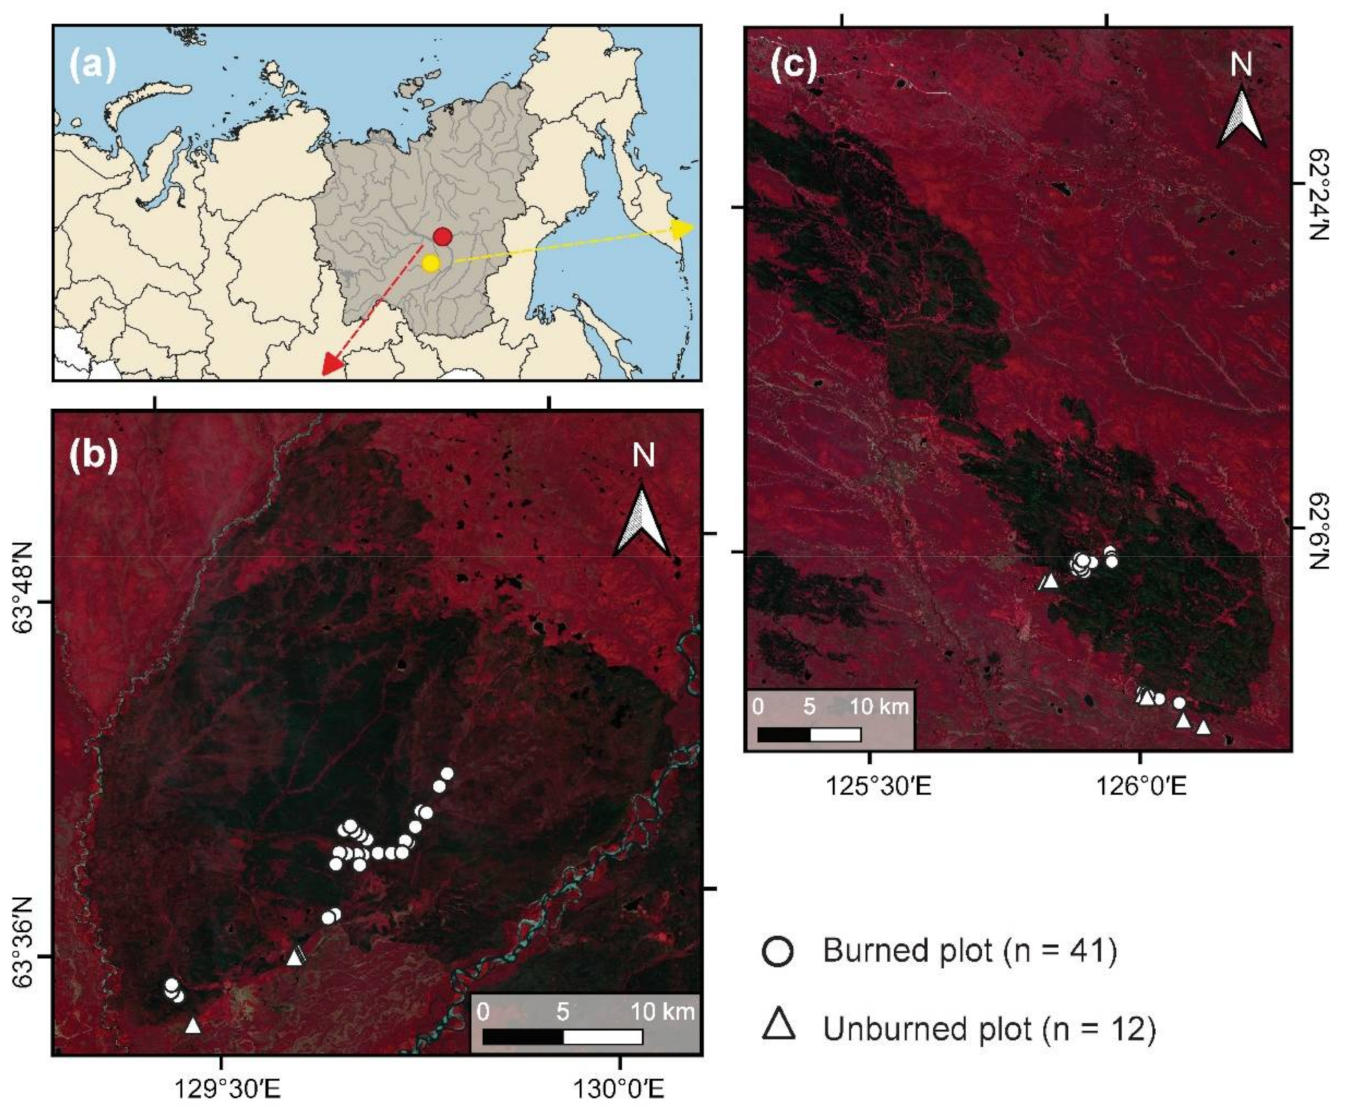
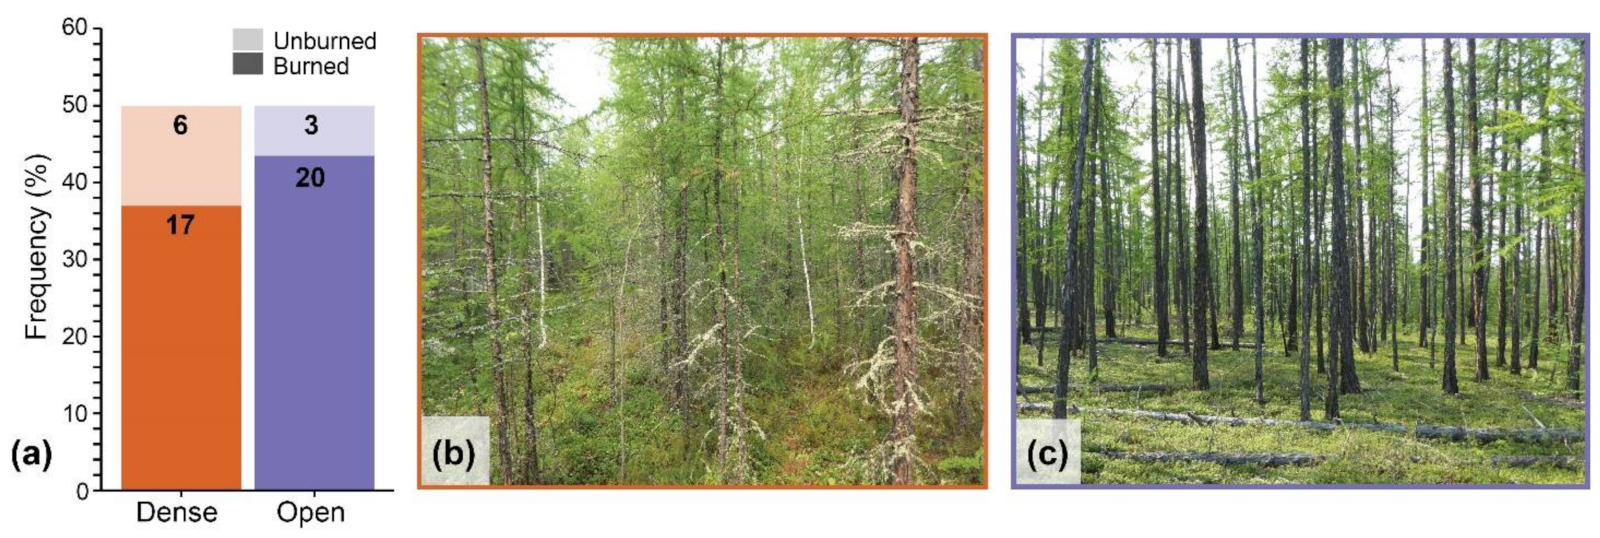
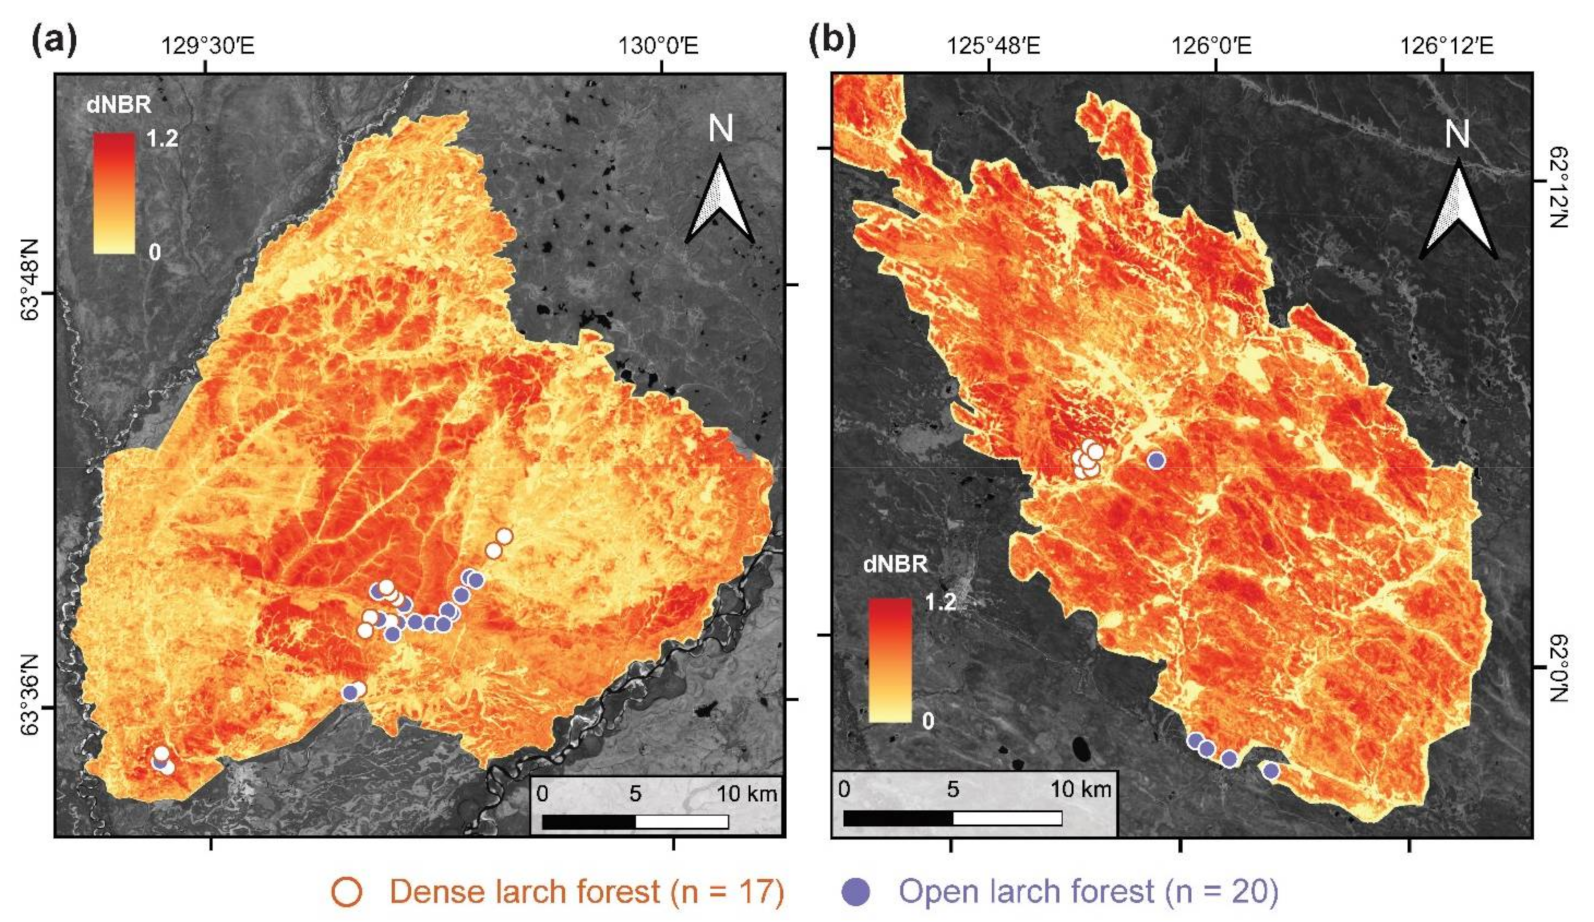
2.1. Study Area
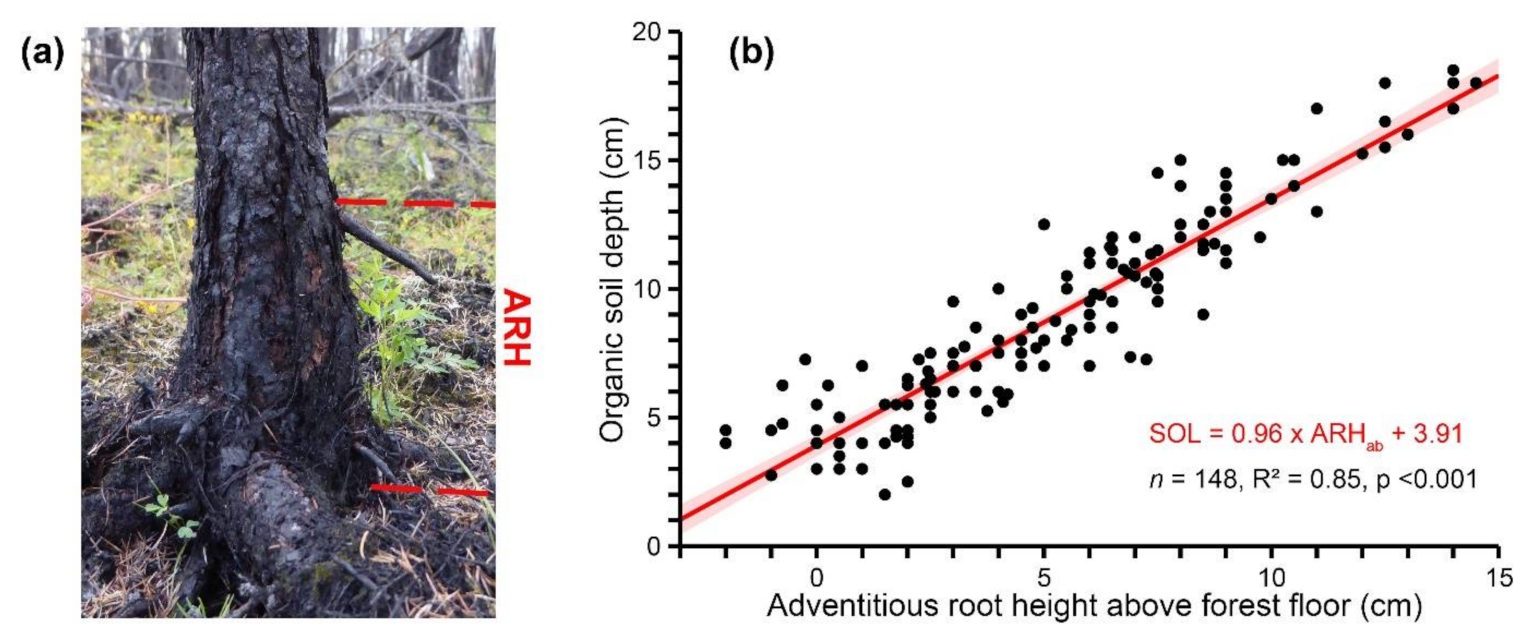
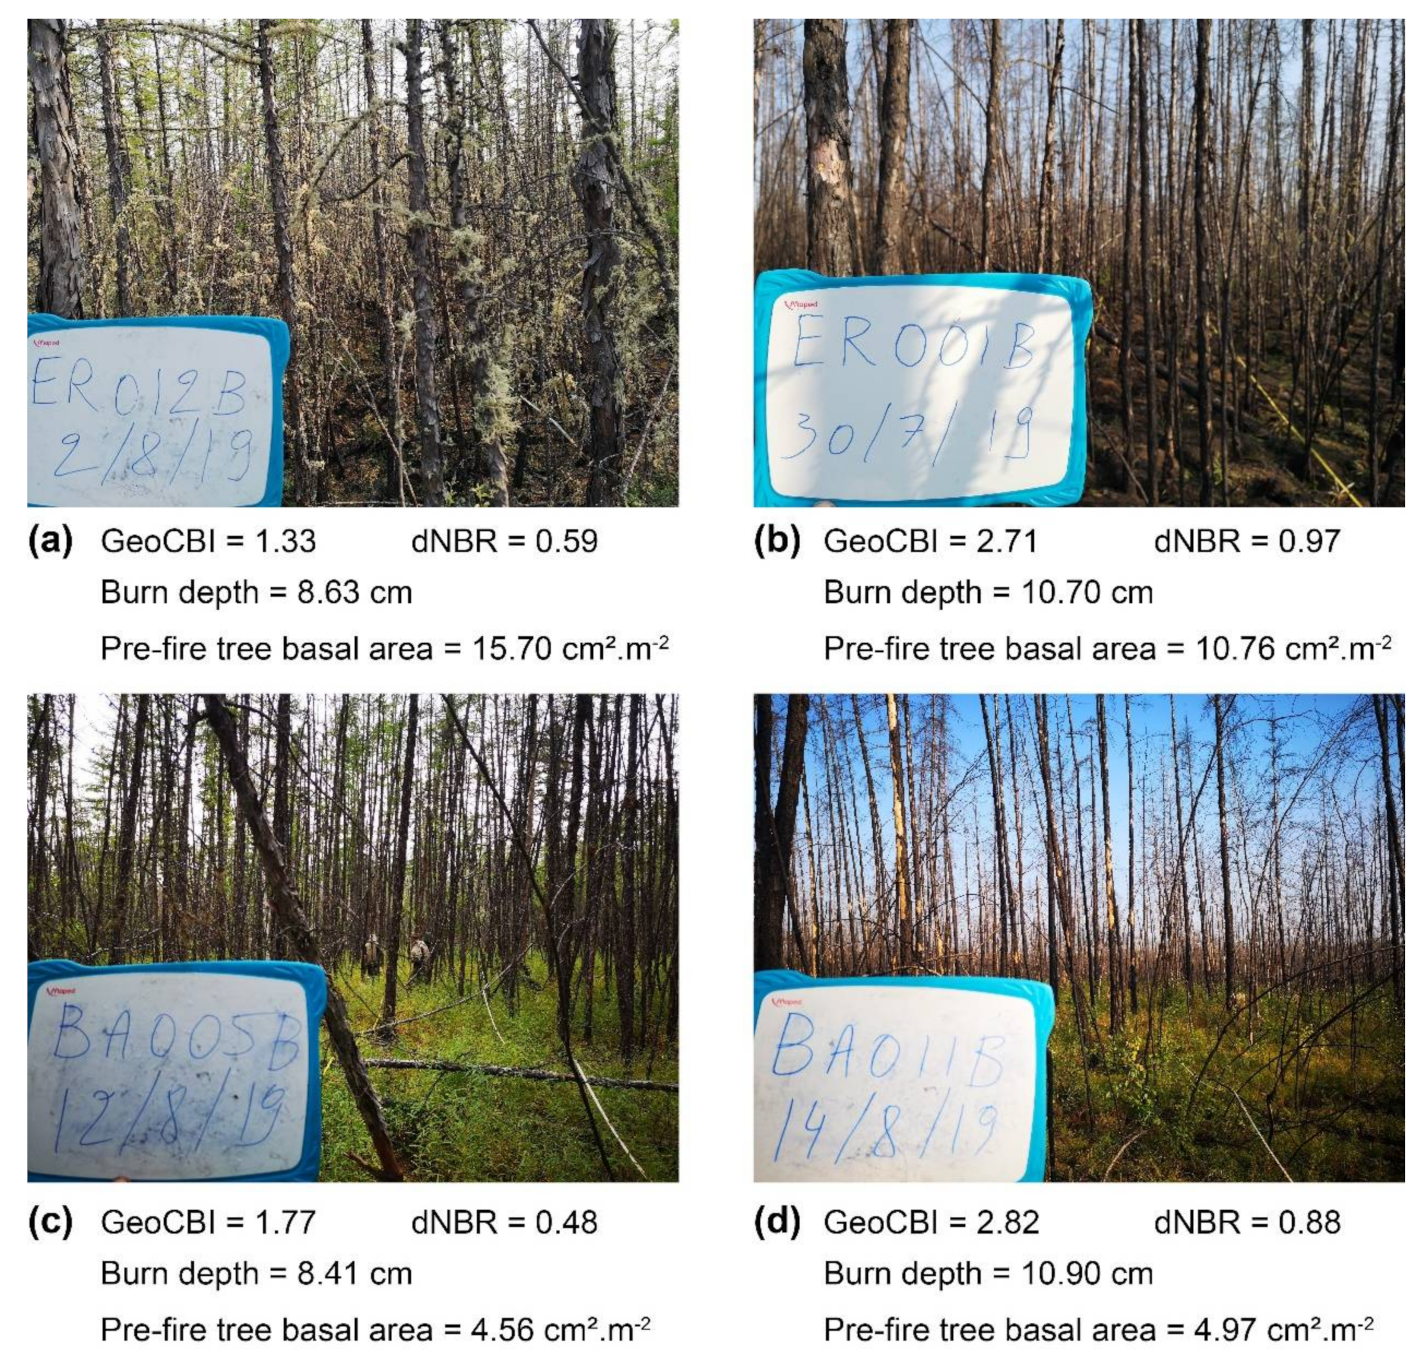
2.2. Field Data
2.3. Imagery and Pre-Processing
2.4. Statistical Analysis
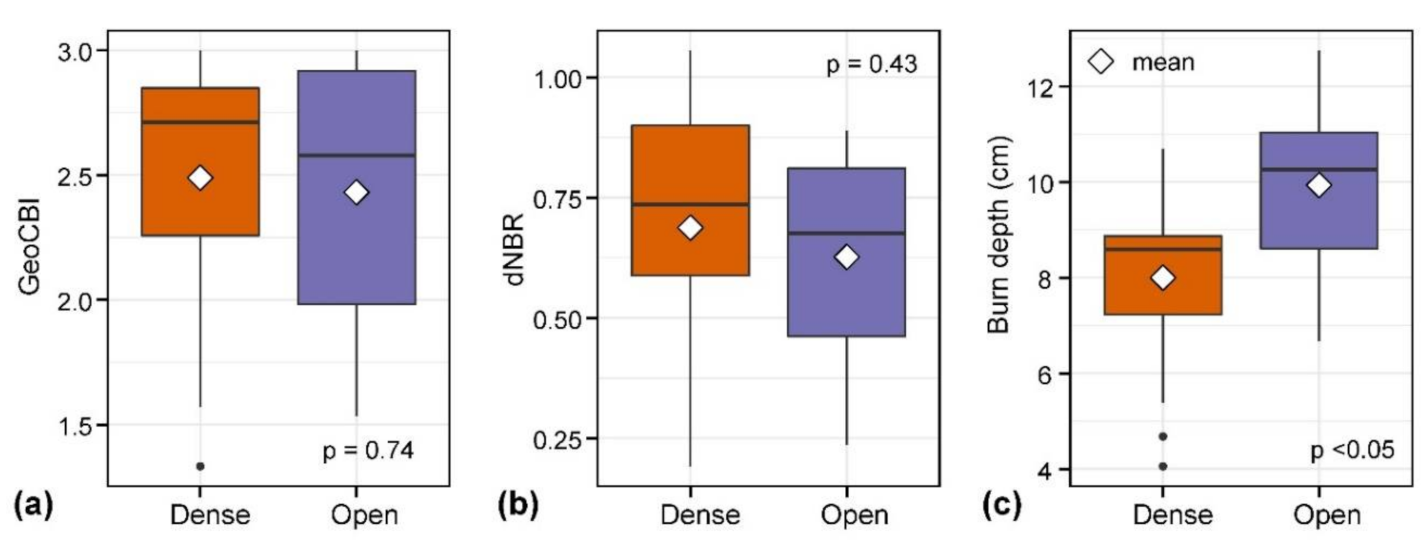
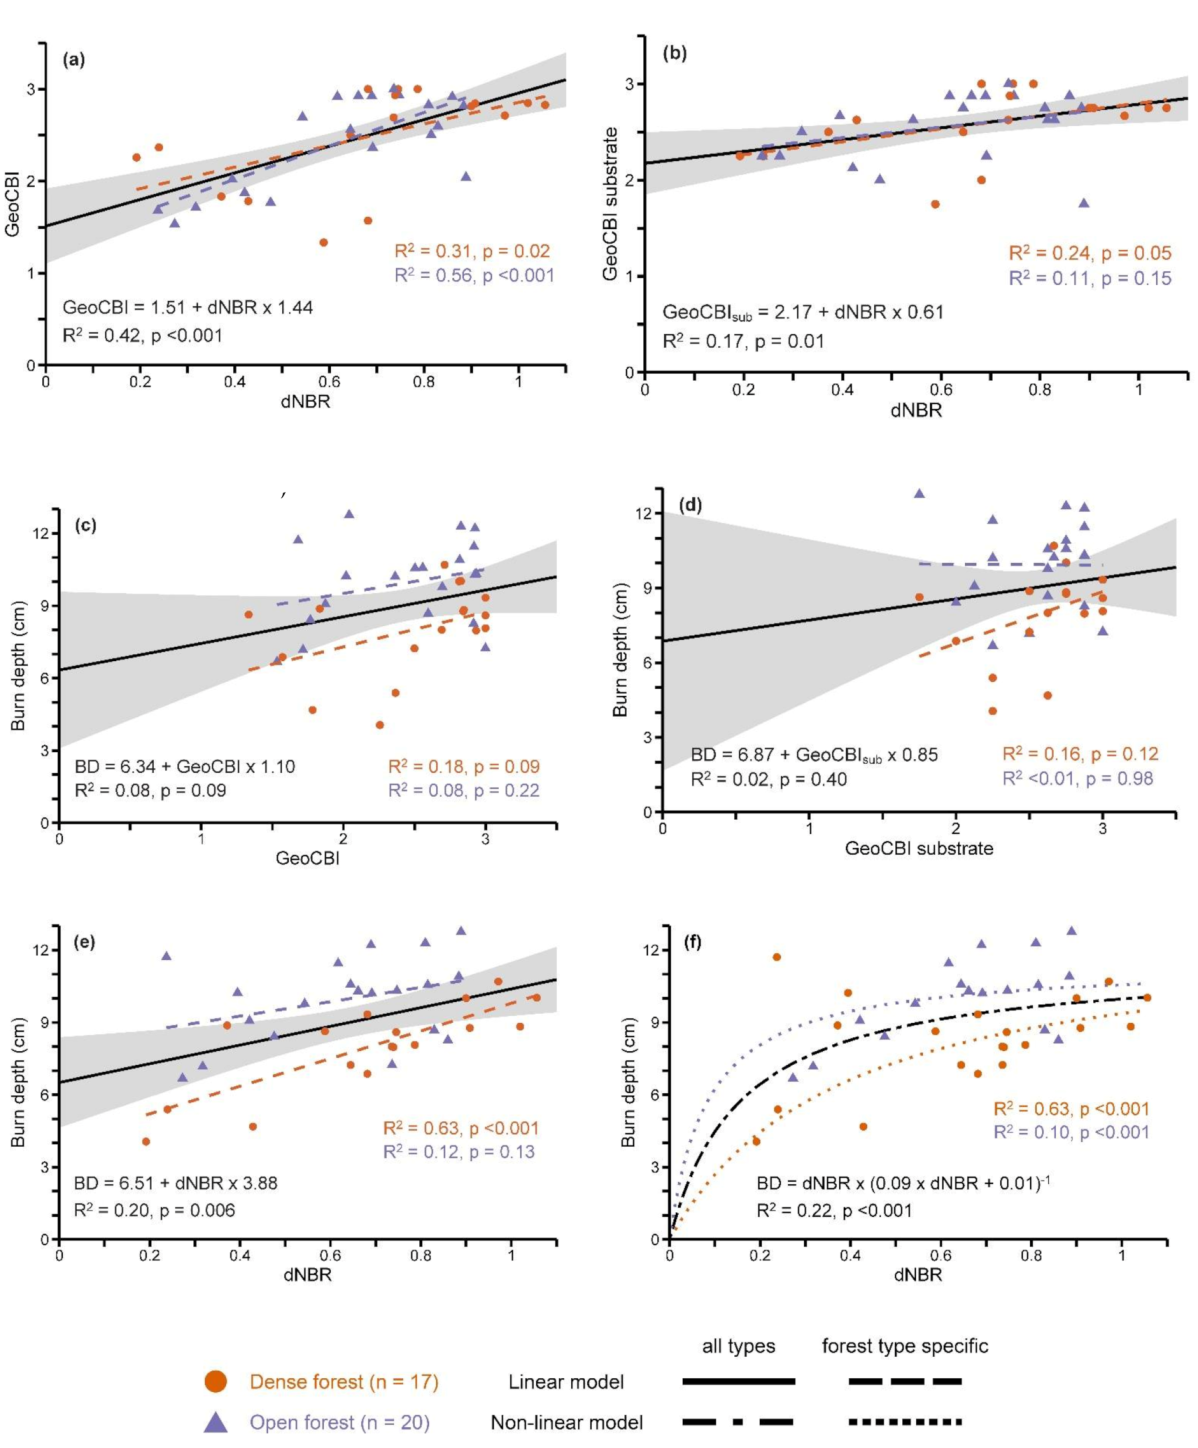
3. Results
4. Discussion
5. Conclusions
Author Contributions
Funding
Institutional Review Board Statement
Informed Consent Statement
Data Availability Statement
Conflicts of Interest
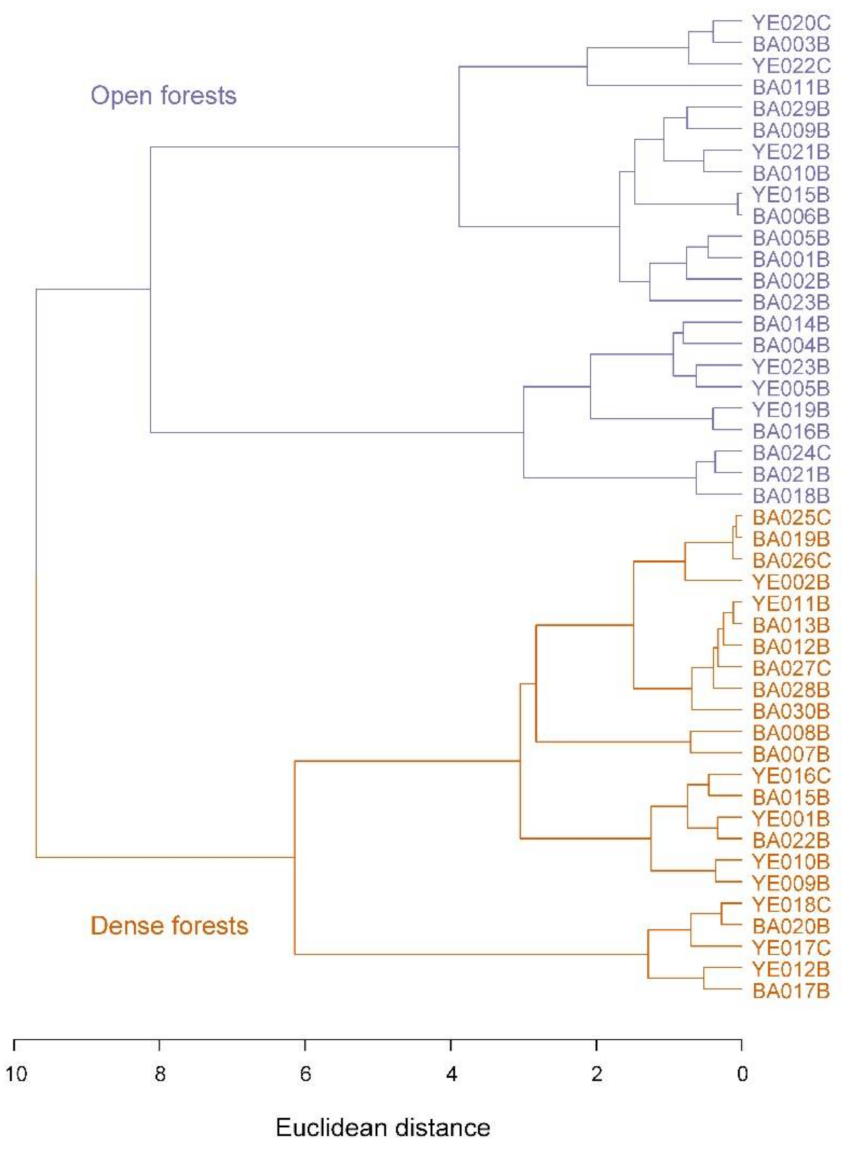
Appendix A. Hierarchical Agglomerative Clustering Results

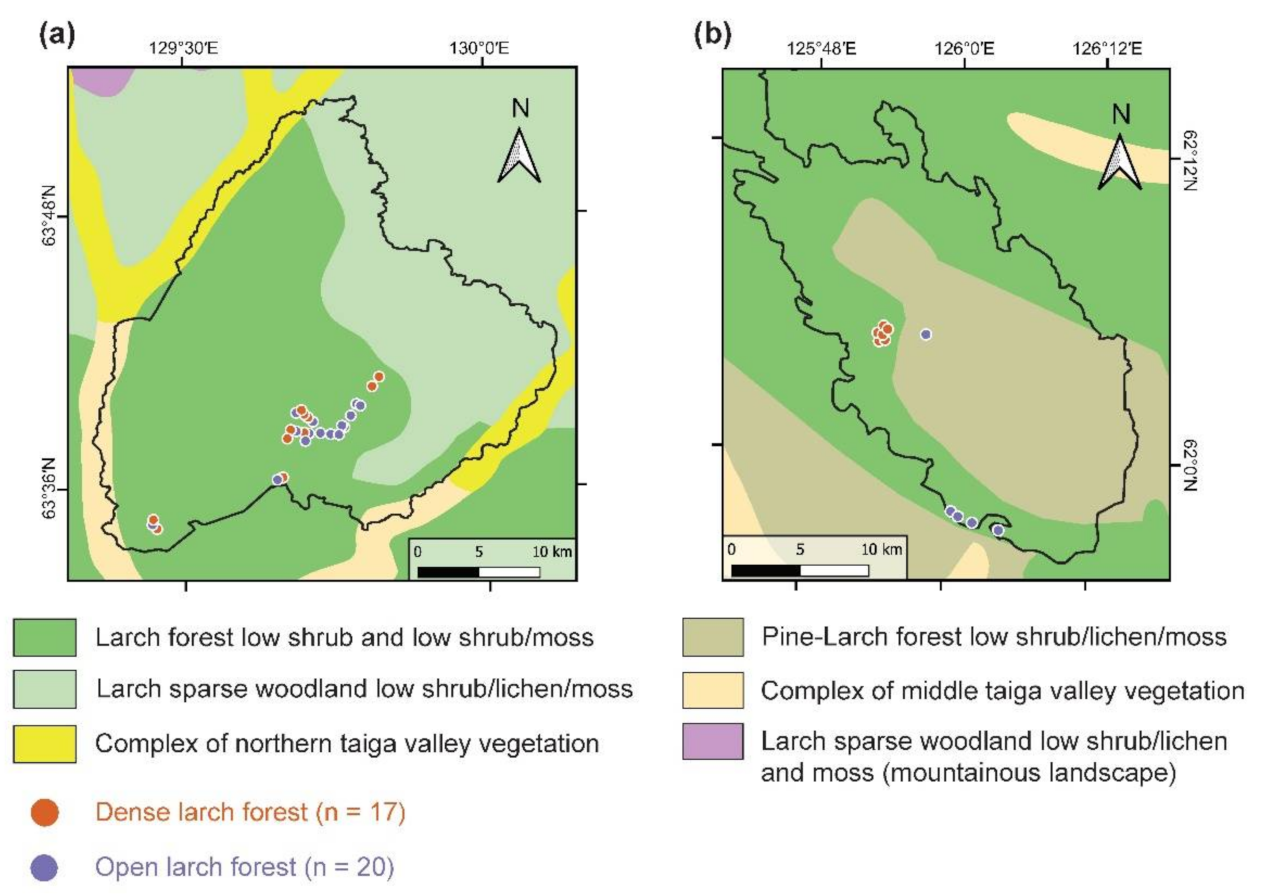
Appendix B. Spatial Distribution of Forest Types within Both Fire Scars

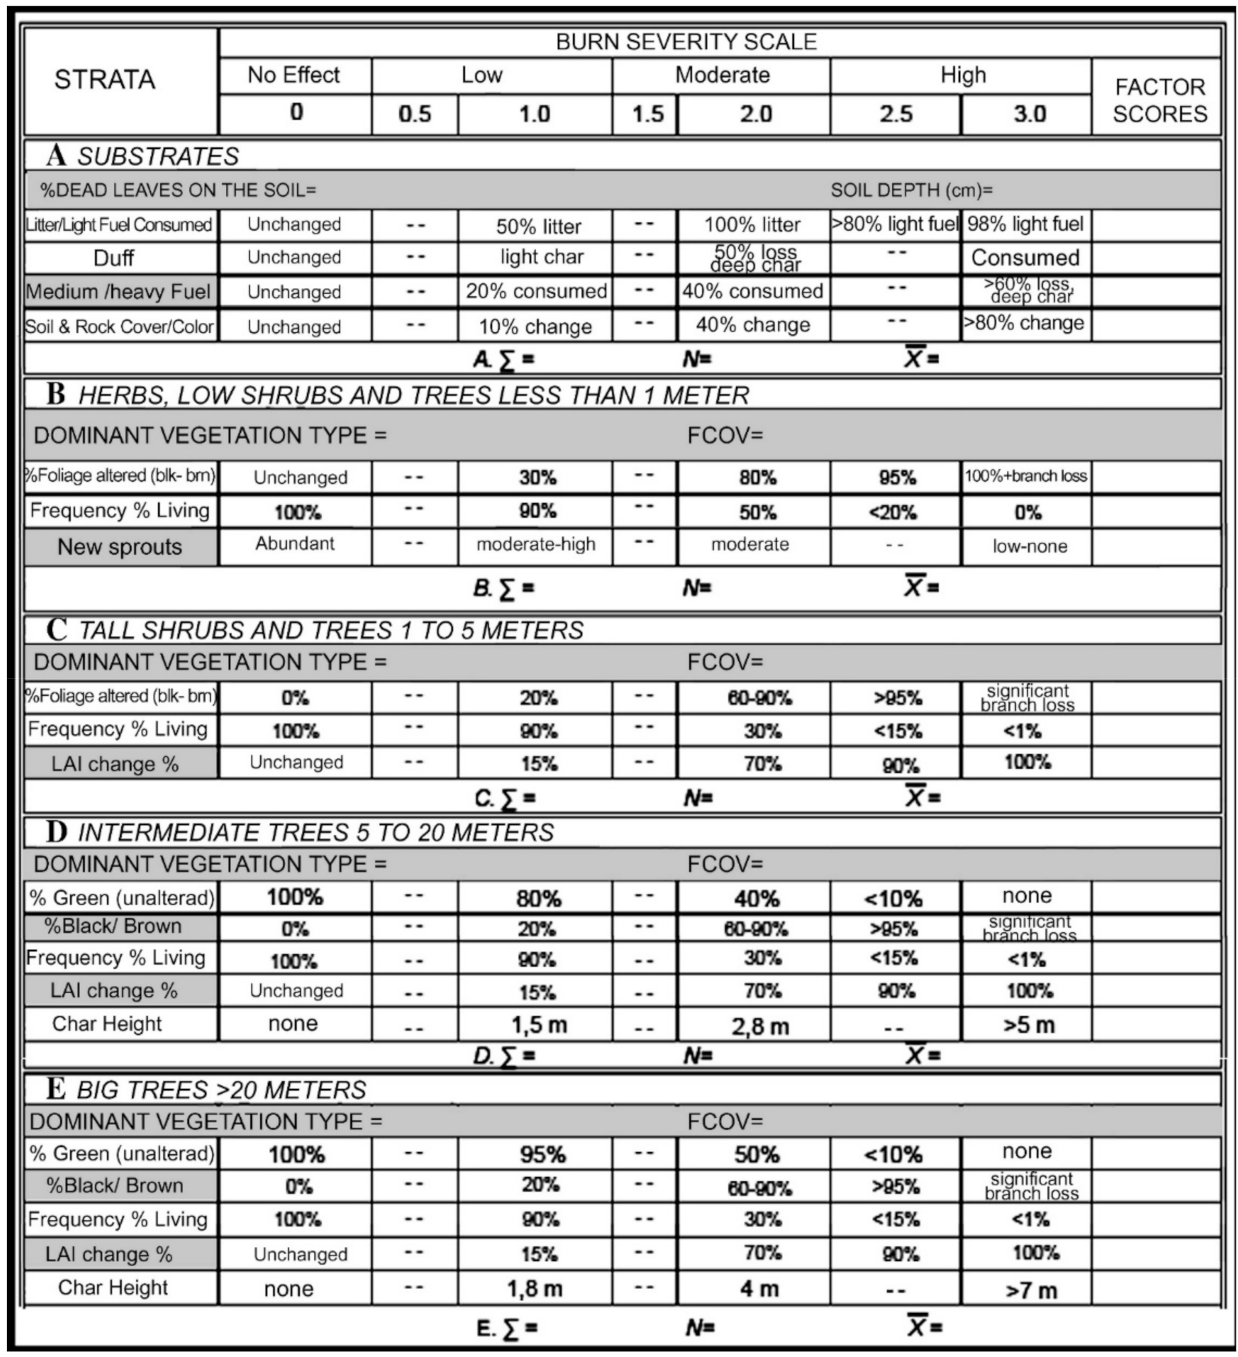
Appendix C. Geometrically Structured Composite Burn Index Feld Protocol

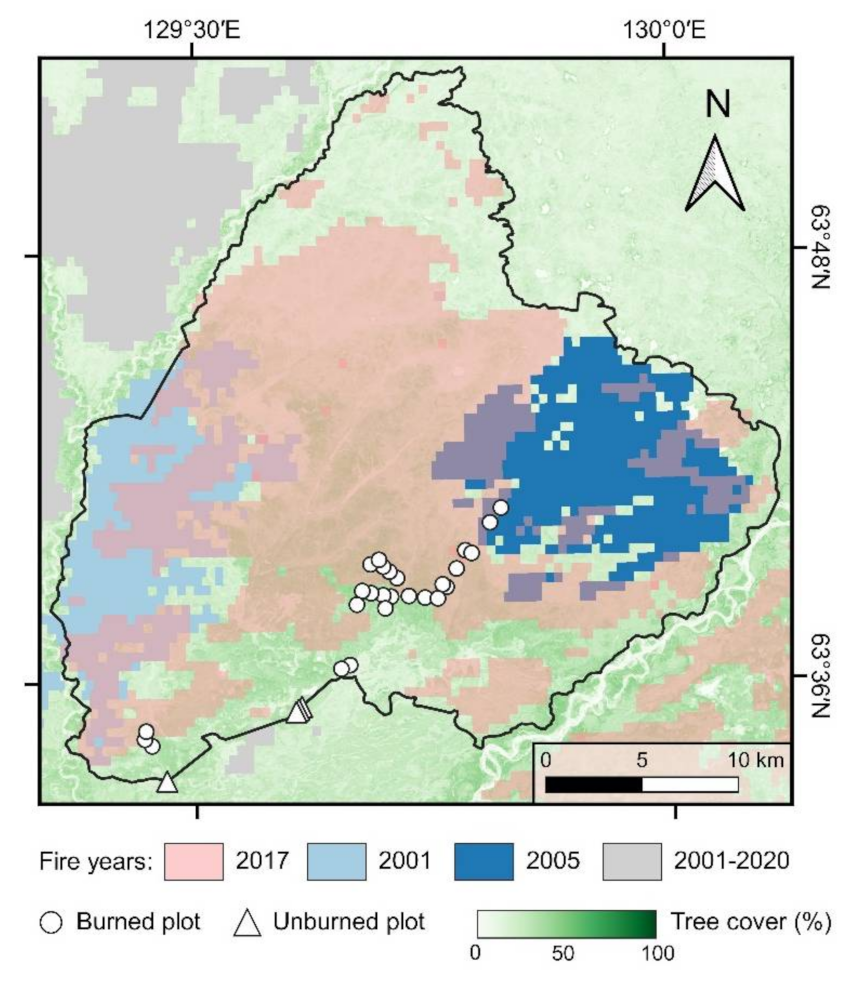
Appendix D. Fire History within Batamay Area

References
- Harden, J.W.; Trumbore, S.E.; Stocks, B.J.; Hirsch, A.; Gower, S.T.; O’Neill, K.P.; Kasischke, E.S. The role of fire in the boreal carbon budget. Glob. Chang. Biol. 2000, 6, 174–184. [Google Scholar] [CrossRef]
- Flannigan, M.D.; Stocks, B.J.; Wotton, B.M. Climate change and forest fires. Sci. Total Environ. 2000, 262, 221–229. [Google Scholar] [CrossRef]
- Walker, X.J.; Baltzer, J.L.; Cumming, S.G.; Day, N.J.; Ebert, C.; Goetz, S.; Johnstone, J.F.; Potter, S.; Rogers, B.M.; Schuur, E.A.G.; et al. Increasing wildfires threaten historic carbon sink of boreal forest soils. Nature 2019, 572, 520–523. [Google Scholar] [CrossRef]
- Veraverbeke, S.; Rogers, B.M.; Goulden, M.L.; Jandt, R.R.; Miller, C.E.; Wiggins, E.B.; Randerson, J.T. Lightning as a major driver of recent large fire years in North American boreal forests. Nat. Clim. Chang. 2017, 7, 529–534. [Google Scholar] [CrossRef]
- Bradshaw, C.J.A.; Warkentin, I.G. Global estimates of boreal forest carbon stocks and flux. Glob. Planet. Change 2015, 128, 24–30. [Google Scholar] [CrossRef]
- Flannigan, M.; Stocks, B.; Turetsky, M.; Wotton, M. Impacts of climate change on fire activity and fire management in the circumboreal forest. Glob. Chang. Biol. 2009, 15, 549–560. [Google Scholar] [CrossRef]
- French, N.H.F.; Kasischke, E.S.; Hall, R.J.; Murphy, K.A.; Verbyla, D.L.; Hoy, E.E.; Allen, J.L. Using Landsat data to assess fire and burn severity in the North American boreal forest region: An overview and summary of results. Int. J. Wildl. Fire 2008, 17, 443–462. [Google Scholar] [CrossRef]
- Key, C.H.; Benson, N.C. Landscape assessment (LA): Sampling and analysis methods. In FIREMON: Fire Effects Monitoring and Inventory System; Gen. Tech. Rep. RMRS-GTR-164; Lutes, D.C., Keane, R.E., Caratti, J.F., Key, C.H., Benson, N.C., Sutherland, S., Gangi, L.J., Eds.; USDA Forest Service, Rocky Mountain Research Station: Ogden, UT, USA, 2005. [Google Scholar]
- Lentile, L.B.; Holden, Z.A.; Smith, A.M.S.; Falkowski, M.J.; Hudak, A.T.; Morgan, P.; Lewis, S.A.; Gessler, P.E.; Benson, N.C. Remote sensing techniques to assess active fire characteristics and post-fire effects. Int. J. Wildl. Fire 2006, 15, 319–345. [Google Scholar] [CrossRef]
- De Santis, A.; Chuvieco, E. Burn Severity Estimation from Remotely Sensed Data: Performance of Simulation versus Empirical Models. Remote Sens. Environ. 2007, 108, 422–435. [Google Scholar] [CrossRef]
- Gorham, E. Northern Peatlands: Role in the Carbon Cycle and Probable Responses to Climatic Warming. Ecol. Appl. 1991, 1, 182–195. [Google Scholar] [CrossRef]
- Hobbie, S.E.; Schimel, J.P.; Trumbore, S.E.; Randerson, J.R. Controls over carbon storage and turnover in high-latitude soils. Glob. Chang. Biol. 2000, 6, 196–210. [Google Scholar] [CrossRef]
- Kasischke, E.S.; Christensen, N.L., Jr.; Stocks, B.J. Fire, Global Warming, and the Carbon Balance of Boreal Forests. Ecol. Appl. 1995, 5, 437–451. [Google Scholar] [CrossRef]
- Amiro, B.D.; Stocks, B.J.; Alexander, M.E.; Flannigan, M.D.; Wotton, B.M. Fire, climate change, carbon and fuel management in the Canadian boreal forest. Int. J. Wildl. Fire 2001, 10, 405–413. [Google Scholar] [CrossRef]
- Boby, L.A.; Schuur, E.A.G.; Mack, M.C.; Verbyla, D.; Johnstone, J.F. Quantifying fire severity, carbon, and nitrogen emissions in Alaska’s boreal forest. Ecol. Appl. 2010, 20, 1633–1647. [Google Scholar] [CrossRef]
- Miyanishi, K.; Johnson, E.A. Process and patterns of duff consumption in the mixedwood boreal forest. Can. J. For. Res. 2002, 32, 1285–1295. [Google Scholar] [CrossRef]
- Kasischke, E.S.; Johnstone, J.F. Variation in postfire organic layer thickness in a black spruce forest complex in interior Alaska and its effects on soil temperature and moisture. Can. J. For. Res. 2005, 35, 2164–2177. [Google Scholar] [CrossRef]
- Harden, J.W.; Manies, K.L.; Turetsky, M.R.; Neff, J.C. Effects of wildfire and permafrost on soil organic matter and soil climate in interior Alaska. Glob. Chang. Biol. 2006, 12, 2391–2403. [Google Scholar] [CrossRef]
- van Leeuwen, T.T.; van Der Werf, G.R.; Hoffmann, A.A.; Detmers, R.G.; Rücker, G.; French, N.H.F.; Archibald, S.; Carvalho, J.A.; Cook, G.D.; De Groot, W.J.; et al. Biomass Burning Fuel Consumption Rates: A Field Measurement Database. Biogeosciences 2014, 11, 7305–7329. [Google Scholar] [CrossRef]
- Swanson, D.K. Susceptibility of permafrost soils to deep thaw after forest fires in interior Alaska, U.S.A., and some ecologic implications. Arct. Alp. Res. 1996, 28, 217–227. [Google Scholar] [CrossRef]
- Jafarov, E.E.; Romanovsky, V.E.; Genet, H.; McGuire, A.D.; Marchenko, S.S. The effects of fire on the thermal stability of permafrost in lowland and upland black spruce forests of interior Alaska in a changing climate. Environ. Res. Lett. 2013, 8. [Google Scholar] [CrossRef]
- Minsley, B.J.; Pastick, N.J.; Wylie, B.K.; Brown, D.R.N.; Kass, M.A. Evidence for nonuniform permafrost degradation after fire in boreal landscapes. J. Geophys. Res. Earth Surf. 2016, 121, 320–335. [Google Scholar] [CrossRef]
- Kasischke, E.S.; Verbyla, D.L.; Rupp, T.S.; McGuire, A.D.; Murphy, K.A.; Jandt, R.; Barnes, J.L.; Hoy, E.E.; Duffy, P.A.; Calef, M.; et al. Alaska’s changing fire regime—Implications for the vulnerability of its boreal forests. Can. J. For. Res. 2010, 40, 1360–1370. [Google Scholar]
- Turetsky, M.R.; Kane, E.S.; Harden, J.W.; Ottmar, R.D.; Manies, K.L.; Hoy, E.; Kasischke, E.S. Recent acceleration of biomass burning and carbon losses in Alaskan forests and peatlands. Nat. Geosci. 2010, 4, 27–31. [Google Scholar] [CrossRef]
- Walker, X.J.; Rogers, B.M.; Baltzer, J.L.; Cumming, S.G.; Day, N.J.; Goetz, S.J.; Johnstone, J.F.; Schuur, E.A.G.; Turetsky, M.R.; Mack, M.C. Cross-scale controls on carbon emissions from boreal forest megafires. Glob. Chang. Biol. 2018, 24, 4251–4265. [Google Scholar] [CrossRef] [PubMed]
- Walker, X.J.; Rogers, B.M.; Veraverbeke, S.; Johnstone, J.F.; Baltzer, J.L.; Barrett, K.; Bourgeau-Chavez, L.; Day, N.J.; de Groot, W.J.; Dieleman, C.M.; et al. Fuel availability not fire weather controls boreal wildfire severity and carbon emissions. Nat. Clim. Chang. 2020. [Google Scholar] [CrossRef]
- Ponomarev, E.I.; Kharuk, V.I.; Ranson, K.J. Wildfires dynamics in Siberian larch forests. Forests 2016, 7, 125. [Google Scholar] [CrossRef]
- Hanes, C.C.; Wang, X.; Jain, P.; Parisien, M.-A.; Little, J.M.; Flannigan, M.D. Fire-regime changes in Canada over the last half century. Can. J. For. Res. 2019, 49, 256–269. [Google Scholar] [CrossRef]
- De Santis, A.; Chuvieco, E. GeoCBI: A modified version of the Composite Burn Index for the initial assessment of the short-term burn severity from remotely sensed data. Remote Sens. Environ. 2009, 113, 554–562. [Google Scholar] [CrossRef]
- López García, M.J.; Caselles, V. Mapping burns and natural reforestation using thematic Mapper data. Geocarto Int. 1991, 6, 31–37. [Google Scholar] [CrossRef]
- Epting, J.; Verbyla, D.; Sorbel, B. Evaluation of remotely sensed indices for assessing burn severity in interior Alaska using Landsat TM and ETM+. Remote Sens. Environ. 2005, 96, 328–339. [Google Scholar] [CrossRef]
- Verbyla, D.; Lord, R. Estimating post-fire organic soil depth in the Alaskan boreal forest using the Normalized Burn Ratio. Int. J. Remote Sens. 2008, 29, 3845–3853. [Google Scholar] [CrossRef]
- Key, C.H. Ecological and Sampling Constraints on Defining Landscape Fire Severity. Fire Ecol. 2006, 2, 34–59. [Google Scholar] [CrossRef]
- Allen, J.L.; Sorbel, B. Assessing the differenced Normalized Burn Ratio’s ability to map burn severity in the boreal forest and tundra ecosystems of Alaska’s national parks. Int. J. Wildl. Fire 2008, 17, 463–475. [Google Scholar] [CrossRef]
- Rogers, B.M.; Veraverbeke, S.; Azzari, G.; Czimczik, C.I.; Holden, S.R.; Mouteva, G.O.; Sedano, F.; Treseder, K.K.; Randerson, J.T. Quantifying Fire-Wide Carbon Emissions in Interior Alaska Using Field Measurements and Landsat Imagery. J. Geophys. Res. Biogeosci. 2014, 119, 1608–1629. [Google Scholar] [CrossRef]
- Hare, F.K.; Ritchie, J.C. The Boreal Bioclimates. Geogr. Rev. 1972, 62, 333–365. [Google Scholar] [CrossRef]
- Veraverbeke, S.; Delcourt, C.J.F.; Kukavskaya, E.; Mack, M.; Walker, X.; Hessilt, T.; Rogers, B.; Scholten, R.C. Direct and longer-term carbon emissions from arctic-boreal fires: A short review of recent advances. Curr. Opin. Environ. Sci. Health 2021. [Google Scholar] [CrossRef]
- Hoy, E.E.; French, N.H.F.; Turetsky, M.R.; Trigg, S.N.; Kasischke, E.S. Evaluating the potential of Landsat TM/ETM+ imagery for assessing fire severity in Alaskan black spruce forests. Int. J. Wildl. Fire 2008, 17, 500–514. [Google Scholar] [CrossRef]
- Hall, R.J.; Freeburn, J.T.; de Groot, W.J.; Pritchard, J.M.; Lynham, T.J.; Landry, R. Remote sensing of burn severity: Experience from western Canada boreal fires. Int. J. Wildl. Fire 2008, 17, 476–489. [Google Scholar] [CrossRef]
- Barrett, K.; Kasischke, E.S.; McGuire, A.D.; Turetsky, M.R.; Kane, E.S. Modeling fire severity in black spruce stands in the Alaskan boreal forest using spectral and non-spectral geospatial data. Remote Sens. Environ. 2010, 114, 1494–1503. [Google Scholar] [CrossRef]
- Murphy, K.A.; Reynolds, J.H.; Koltun, J.M. Evaluating the ability of the differenced Normalized Burn Ratio (dNBR) to predict ecologically significant burn severity in Alaskan boreal forests. Int. J. Wildl. Fire 2008, 17, 490–499. [Google Scholar] [CrossRef]
- Johnson, E.A. Fire and Vegetation Dynamics: Studies from the North American Boreal Forest; Cambridge University Press: Cambridge, UK, 1992; ISBN 978-051-162-351-6. [Google Scholar]
- Zhu, Z.; Key, C.; Ohlen, D.; Benson, N. Evaluate Sensitivities of Burn Severity Mapping Algorithms for Different Ecosystems and Fire Histories in the United States; Final Report to the Joint Fire Science Program, Project JFSP 01–1-4–12; USGS, National Center for Earth Resources Observation and Science: Sioux Falls, SD, USA, 2006.
- van Wagtendonk, J.W.; Root, R.R.; Key, C.H. Comparison of AVIRIS and Landsat ETM+ detection capabilities for burn severity. Remote Sens. Environ. 2004, 92, 397–408. [Google Scholar] [CrossRef]
- Miller, J.D.; Thode, A.E. Quantifying burn severity in a heterogeneous landscape with a relative version of the delta Normalized Burn Ratio (dNBR). Remote Sens. Environ. 2007, 109, 66–80. [Google Scholar] [CrossRef]
- Rogers, B.M.; Soja, A.J.; Goulden, M.L.; Randerson, J.T. Influence of tree species on continental differences in boreal fires and climate feedbacks. Nat. Geosci. 2015, 8, 228–234. [Google Scholar] [CrossRef]
- Kharuk, V.I.; Ponomarev, E.I.; Ivanova, G.A.; Dvinskaya, M.L.; Coogan, S.C.P.; Flannigan, M.D. Wildfires in the Siberian taiga. Ambio 2021. [Google Scholar] [CrossRef] [PubMed]
- Nikolov, N.; Helmisaari, H. Silvics of the circumpolar boreal forest tree species. In A Systems Analysis of the Global Boreal Forest; Shugart, H.H., Leemans, R., Bonan, G.B., Eds.; Cambridge University Press: Cambridge, UK, 1992; pp. 13–84. ISBN 978-051-156-548-9. [Google Scholar]
- Richardson, D.M.; Rundel, P.W. Ecology and biogeography of Pinus: An introduction. In Ecology and Biogeography of Pinus; Richardson, D.M., Ed.; Cambridge University Press: New-York, USA, 1998; pp. 3–46. ISBN 978-052-155-176-2. [Google Scholar]
- Fedorov, A.N.; Konstantinov, P.Y.; Vasilyev, N.F.; Shestakova, A.A. The influence of boreal forest dynamics on the current state of permafrost in Central Yakutia. Polar Sci. 2019, 22. [Google Scholar] [CrossRef]
- Zyryanova, O.A.; Abaimov, A.P.; Bugaenko, T.N.; Bugaenko, N.N. Recovery of Forest Vegetation After Fire Disturbance. In Permafrost Ecosystems; Osawa, A., Zyryanova, O.A., Matsuura, Y., Kajimoto, T., Wein, R.W., Eds.; Springer Netherlands: Dordrecht, The Netherlands, 2010; Volume 209, pp. 83–96. ISBN 978-1-4020-9692-1. [Google Scholar]
- Ivanova, G.A.; Kukavskaya, E.A.; Ivanov, V.A.; Conard, S.G.; McRae, D.J. Fuel Characteristics, loads and consumption in Scots pine forests of central Siberia. J. For. Res. 2020, 31, 2507–2524. [Google Scholar] [CrossRef]
- Dieleman, C.M.; Rogers, B.M.; Potter, S.; Veraverbeke, S.; Johnstone, J.F.; Laflamme, J.; Solvik, K.; Walker, X.J.; Mack, M.C.; Turetsky, M.R. Wildfire combustion and carbon stocks in the southern Canadian boreal forest: Implications for a warming world. Glob. Chang. Biol. 2020, 26, 6062–6079. [Google Scholar] [CrossRef] [PubMed]
- Johnstone, J.F.; Hollingsworth, T.N.; Chapin, F.S. A Key Predicting Postfire Successional Trajectories in Black Spruce Stands of Interior Alaska; General Technical Report No. PNW-GTR-767; U.S. Department of Agriculture, Forest Service, Pacific Northwest Research Station: Portland, OR, USA, 2008.
- Manies, K.L.; Harden, J.W.; Silva, S.R.; Briggs, P.H.; Schmid, B.M. Soil Data from Picea mariana Stands near Delta Junction, Alaska of Different Ages and Soil Drainage Type; Open-File Report 2004-1271; U.S. Department of the Interior, U.S. Geological Survey: Anchorage, AK, USA, 2004. Available online: https://pubs.usgs.gov/of/2004/1271/ (accessed on 6 April 2021).
- Kajimoto, T.; Matsuura, Y.; Osawa, A.; Prokushkin, A.S.; Sofronov, M.A.; Abaimov, A.P. Root system development of Larix gmelinii trees affected by micro-scale conditions of permafrost soils in central Siberia. Plant Soil 2003, 255, 281–292. [Google Scholar] [CrossRef]
- Kajimoto, T. Root System Development of Larch Trees Growing on Siberian Permafrost. In Permafrost Ecosystems; Osawa, A., Zyryanova, O.A., Matsuura, Y., Kajimoto, T., Wein, R.W., Eds.; Springer Netherlands: Dordrecht, The Netherlands, 2010; Volume 209, pp. 303–330. ISBN 978-1-4020-9692-1. [Google Scholar]
- Walker, X.J.; Baltzer, J.L.; Cumming, S.G.; Day, N.J.; Johnstone, J.F.; Rogers, B.M.; Solvik, K.; Turetsky, M.R.; Mack, M.C. Soil organic layer combustion in boreal black spruce and jack pine stands of the Northwest Territories, Canada. Int. J. Wildl. Fire 2018, 27, 125–134. [Google Scholar] [CrossRef]
- Ward, J.H., Jr. Hierarchical Grouping to Optimize an Objective Function. J. Am. Stat. Assoc. 1963, 58, 236–244. [Google Scholar] [CrossRef]
- Szekely, G.J.; Rizzo, M.L. Hierarchical Clustering via Joint Between-Within Distances: Extending Ward’s Minimum Variance Method. J. Classif. 2005, 22, 151–183. [Google Scholar] [CrossRef]
- Fedorov, A.N.; Vasilyev, N.F.; Torgovkin, Y.I.; Shestakova, A.A.; Varlamov, S.P.; Zheleznyak, M.N.; Shepelev, V.V.; Konstantinov, P.Y.; Kalinicheva, S.S.; Basharin, N.I.; et al. Permafrost-Landscape Map of the Republic of Sakha (Yakutia) on a Scale 1:1,500,000. Geosciences 2018, 8, 465. [Google Scholar] [CrossRef]
- Main-Knorn, M.; Pflug, B.; Louis, J.; Debaecker, V.; Müller-Wilm, U.; Gascon, F. Sen2Cor for Sentinel-2. In Image and Signal Processing for Remote Sensing XXIII, Proceedings of the Society of Photo-Optical Instrumentation Engineers Remote Sensing, Warsaw, Poland, 4 October 2017; International Society for Optics and Photonics: Bellingham, WA, USA; Volume 10427. [CrossRef]
- Richter, R.; Schläpfer, D.; Müller, A. An automatic atmospheric correction algorithm for visible/NIR imagery. Int. J. Remote Sens. 2006, 27, 2077–2085. [Google Scholar] [CrossRef]
- Mayer, B.; Kylling, A. Technical note: The libRadtran software package for radiative transfer calculations-description and examples of use. Atmos. Chem. Phys. 2005, 5, 1855–1877. [Google Scholar] [CrossRef]
- Kaufman, Y.J.; Sendra, C. Algorithm for automatic atmospheric corrections to visible and near-IR satellite imagery. Int. J. Remote Sens. 1988, 9, 1357–1381. [Google Scholar] [CrossRef]
- Schläpfer, D.; Borel, C.C.; Keller, J.; Itten, K.I. Atmospheric Precorrected Differential Absorption Technique to Retrieve Columnar Water Vapor. Remote Sens. Environ. 1998, 65, 353–366. [Google Scholar] [CrossRef]
- Ahern, F.J.; Erdle, T.; Maclean, D.A.; Kneppeck, I.D. A quantitative relationship between forest growth rates and thematic mapper reflectance measurements. Int. J. Remote Sens. 1991, 12, 387–400. [Google Scholar] [CrossRef]
- R Core Team. R: A Language and Environment for Statistical Computing v. 4.0.3; R Foundation for Statistical Computing: Vienna, Austria, 2020. [Google Scholar]
- Kaufman, L.; Rousseeuw, P.J. Agglomerative Nesting (Program AGNES). In Finding Groups in Data: An Introduction to Cluster Analysis; Wiley Series in Probability and Statistics; John Wiley & Sons, Inc.: Hoboken, NJ, USA, 1990; pp. 199–252. ISBN 978-047-173-578-6. [Google Scholar]
- Maechler, M.; Rousseeuw, P.J.; Struyf, A.; Hubert, M.; Hornik, K. Cluster: Cluster Analysis Basics and Extensions. R package version 2.1.2. For new features, see the ‘Changelog’ file (in the package source). 2021. Available online: https://CRAN.R-project.org/package=cluster (accessed on 6 April 2021).
- Fox, J.; Weisberg, S. An R Companion to Applied Regression, 3rd ed.; Sage: Thousand Oaks, CA, USA, 2019. [Google Scholar]
- Mallinis, G.; Mitsopoulos, I.; Chrysafi, I. Evaluating and comparing Sentinel 2A and Landsat-8 Operational Land Imager (OLI) spectral indices for estimating fire severity in a Mediterranean pine ecosystem of Greece. GIsci. Remote Sens. 2018, 55, 1–18. [Google Scholar] [CrossRef]
- García-Llamas, P.; Suárez-Seoane, S.; Fernández-Guisuraga, J.M.; Fernández-García, V.; Fernández-Manso, A.; Quintano, C.; Taboada, A.; Marcos, E.; Calvo, L. Evaluation and comparison of Landsat 8, Sentinel-2 and Deimos-1 remote sensing indices for assessing burn severity in Mediterranean fire-prone ecosystems. Int. J. Appl. Earth Obs. Geoinf. 2019, 80, 137–144. [Google Scholar] [CrossRef]
- Veraverbeke, S.; Rogers, B.M.; Randerson, J.T. Daily burned area and carbon emissions from boreal fires in Alaska. Biogeosciences 2015, 12, 3579–3601. [Google Scholar] [CrossRef]
- Hudak, A.T.; Morgan, P.; Bobbitt, M.J.; Smith, A.M.S.; Lewis, S.A.; Lentile, L.B.; Robichaud, P.R.; Clark, J.T.; McKinley, R.A. The relationship of multispectral satellite imagery to immediate fire effects. Fire Ecol. 2007, 3, 64–90. [Google Scholar] [CrossRef]
- Kasischke, E.S.; Turetsky, M.R.; Ottmar, R.D.; French, N.H.F.; Hoy, E.E.; Kane, E.S. Evaluation of the composite burn index for assessing fire severity in Alaskan black spruce forests. Int. J. Wildl. Fire 2008, 17, 515–526. [Google Scholar] [CrossRef]
- Giglio, L.; Boschetti, L.; Roy, D.P.; Humber, M.L.; Justice, C.O. The Collection 6 MODIS burned area mapping algorithm and product. Remote Sens. Environ. 2018, 217, 72–85. [Google Scholar] [CrossRef] [PubMed]
- Global Forest Cover Change (GFCC) Tree Cover Multi-Year Global 30 m V003. NASA EOSDIS Land Processes DAAC. Available online: https://doi.org/10.5067/MEaSUREs/GFCC/GFCC30TC.003 (accessed on 6 April 2021).


| Descriptive Statistic | Dense Forest | Open Forest | ||||
|---|---|---|---|---|---|---|
| LC Density (Trees m−2) | LC Prop. (0–1) | Stand Age (Years) | LC Density (Trees m−2) | LC Prop. (0–1) | Stand Age (Years) | |
| n | 17 | 17 | 17 | 20 | 20 | 20 |
| Mean | 2.00 | 0.80 | 55.30 | 0.55 | 0.65 | 112.00 |
| Standard deviation | 1.30 | 0.13 | 17.70 | 0.44 | 0.35 | 33.30 |
| Minimum | 0.63 | 0.51 | 9.00 | 0.07 | 0.09 | 63.00 |
| Maximum | 4.63 | 1.00 | 67.00 | 1.35 | 1.00 | 214.00 |
| Fire Event | Data | Image Date | Row | Tile | Satellite |
|---|---|---|---|---|---|
| Batamay (2017) | Pre-fire | 29/06/2016 | 32 | T52VER | S2A |
| Post-fire | 09/06/2018 | 32 | T52VER | S2A | |
| Yert (2018) | Pre-fire | 17/06/2017 | 75 | T51VXJ | S2A |
| 17/06/2017 | 75 | T51VXK | S2A | ||
| Post-fire | 12/06/2019 | 75 | T51VXJ | S2B | |
| 12/06/2019 | 75 | T51VXK | S2B |
| Descriptive Statistic | Dense Forest | Open Forest | ||||
|---|---|---|---|---|---|---|
| GeoCBI | dNBR | Burn Depth (cm) | GeoCBI | dNBR | Burn Depth (cm) | |
| n | 17 | 17 | 17 | 20 | 20 | 20 |
| Mean | 2.49 | 0.69 | 8.00 | 2.43 | 0.63 | 9.94 |
| Standard deviation | 0.54 | 0.26 | 1.86 | 0.51 | 0.21 | 1.77 |
| Minimum | 1.33 | 0.19 | 4.06 | 1.53 | 0.24 | 6.68 |
| Maximum | 3.00 | 1.06 | 10.7 | 3.00 | 0.89 | 12.8 |
| y–x | Dense Forest (n = 17) | Open Forest (n = 20) | Combined (n = 37) | ||||||||||||
|---|---|---|---|---|---|---|---|---|---|---|---|---|---|---|---|
| y = a + b(x) | a | b | R2 | RMSE | p | a | b | R2 | RMSE | p | a | b | R2 | RMSE | p |
| GeoCBI–dNBR(a) | 1.69 | 1.17 | 0.31 | 0.44 | 0.02 | 1.29 | 1.81 | 0.56 | 0.33 | <0.001 | 1.51 | 1.44 | 0.42 | 0.39 | <0.001 |
| GeoCBIsub–dNBR(b) | 2.13 | 0.67 | 0.24 | 0.30 | 0.05 | 2.22 | 0.55 | 0.11 | 0.32 | 0.15 | 2.17 | 0.61 | 0.17 | 0.31 | 0.01 |
| BD–GeoCBI(c) | 4.41 | 1.44 | 0.18 | 1.63 | 0.09 | 7.52 | 0.99 | 0.08 | 1.65 | 0.22 | 6.34 | 1.10 | 0.08 | 1.92 | 0.09 |
| BD–GeoCBIsub(d) | 2.61 | 2.08 | 0.16 | 1.65 | 0.12 | 10.02 | -0.03 | <0.01 | 1.72 | 0.98 | 6.87 | 0.85 | 0.02 | 1.98 | 0.40 |
| BD–dNBR(e) | 4.06 | 5.73 | 0.63 | 1.09 | <0.001 | 8.07 | 2.97 | 0.12 | 1.61 | 0.13 | 6.51 | 3.88 | 0.20 | 1.80 | 0.006 |
| y = x × (a[x] + b)-1 | |||||||||||||||
| BD–dNBR(f) | 0.08 | 0.03 | 0.63 | 1.09 | <0.001 | 0.09 | 0.01 | 0.10 | 1.63 | <0.001 | 0.09 | 0.01 | 0.22 | 1.77 | <0.001 |
Publisher’s Note: MDPI stays neutral with regard to jurisdictional claims in published maps and institutional affiliations. |
© 2021 by the authors. Licensee MDPI, Basel, Switzerland. This article is an open access article distributed under the terms and conditions of the Creative Commons Attribution (CC BY) license (https://creativecommons.org/licenses/by/4.0/).
Share and Cite
Delcourt, C.J.F.; Combee, A.; Izbicki, B.; Mack, M.C.; Maximov, T.; Petrov, R.; Rogers, B.M.; Scholten, R.C.; Shestakova, T.A.; van Wees, D.; et al. Evaluating the Differenced Normalized Burn Ratio for Assessing Fire Severity Using Sentinel-2 Imagery in Northeast Siberian Larch Forests. Remote Sens. 2021, 13, 2311. https://doi.org/10.3390/rs13122311
Delcourt CJF, Combee A, Izbicki B, Mack MC, Maximov T, Petrov R, Rogers BM, Scholten RC, Shestakova TA, van Wees D, et al. Evaluating the Differenced Normalized Burn Ratio for Assessing Fire Severity Using Sentinel-2 Imagery in Northeast Siberian Larch Forests. Remote Sensing. 2021; 13(12):2311. https://doi.org/10.3390/rs13122311
Chicago/Turabian StyleDelcourt, Clement J. F., Alisha Combee, Brian Izbicki, Michelle C. Mack, Trofim Maximov, Roman Petrov, Brendan M. Rogers, Rebecca C. Scholten, Tatiana A. Shestakova, Dave van Wees, and et al. 2021. "Evaluating the Differenced Normalized Burn Ratio for Assessing Fire Severity Using Sentinel-2 Imagery in Northeast Siberian Larch Forests" Remote Sensing 13, no. 12: 2311. https://doi.org/10.3390/rs13122311
APA StyleDelcourt, C. J. F., Combee, A., Izbicki, B., Mack, M. C., Maximov, T., Petrov, R., Rogers, B. M., Scholten, R. C., Shestakova, T. A., van Wees, D., & Veraverbeke, S. (2021). Evaluating the Differenced Normalized Burn Ratio for Assessing Fire Severity Using Sentinel-2 Imagery in Northeast Siberian Larch Forests. Remote Sensing, 13(12), 2311. https://doi.org/10.3390/rs13122311