Abstract
In this study, we analyze the 2009–2013 uplift phenomenon at Campi Flegrei (CF) caldera in terms of temporal and spatial variations in the stress/strain field due to the effect of an inflating source. We start by performing a 3D stationary finite element (FE) modeling of X-band COSMO-SkyMed DInSAR and GPS mean velocities to retrieve the geometry and location of the deformation source. The modeling results suggest that the best-fit source is a three-axis oblate spheroid ~3 km deep, which is mostly elongated in the NE–SW direction. Furthermore, we verify the reliability of model results by calculating the total horizontal derivative (THD) of the modeled vertical velocity component; the findings emphasize that the THD maxima overlap with the projection of source boundaries at the surface. Then, we generate a 3D time-dependent FE model, comparing the spatial and temporal distribution of the shear stress and volumetric strain with the seismic swarms beneath the caldera. We found that low values of shear stress are observed corresponding with the shallow hydrothermal system where low-magnitude earthquakes occur, whereas high values of shear stress are found at depths of about 3 km, where high-magnitude earthquakes nucleate. Finally, the volumetric strain analysis highlights that the seismicity occurs mainly at the border between compression and dilatation modeled regions, and some seismic events occur within compression regions.
1. Introduction
The Campi Flegrei (CF) volcanic area is a collapsed caldera with a well-documented and long history of ground inflation and deflation (bradyseismic activity). In the last 15 ka, ground deformations at long (resurgence) and short timescales have affected the inner caldera region [1,2,3,4]. Since 1905, ground-based topographic leveling networks, recently integrated with a global positioning system (GPS) monitoring network and satellite data, have recorded the unrest episodes of the Neapolitan Yellow Tuff (NYT) caldera. The major uplifts of 1.7 and 1.8 m were estimated at Pozzuoli harbor in 1970–1971 and 1982–1984, respectively [5,6,7,8]. After two decades of prevailing subsidence, the CF area experienced uplift periods (e.g., 2005–2006; 2012–2013), alternating with subsidence phases or stationary deformation trends [7,9,10,11]. The pattern of recent uplifts was almost radially symmetric with decreasing deformation velocity values moving from the Pozzuoli harbor towards the borders of the NYT caldera (Figure 1) [12,13,14].
One uplift episode occurred between 2012 and 2013, reaching ~11 cm with a maximum rate of 3 cm/month [15]. This event started on 7 September 2012 with a seismic swarm and the ground deformation observed from 2012 to 2013 has been interpreted by analyzing satellite interferometry and GPS measurements as resulting from a magmatic sill intrusion of 0.0042 km3 at shallow depth (~3.1 km) [10]. This is a major departure from other episodes of caldera deformation that occurred in the last 28 years, almost exclusively driven by shallow hydrothermal processes [13,16].
In the last few decades, many attempts have been made to reconstruct and identify the source(s) of the observed ground deformation of this significant uplift episode [13,14,16,17]. In particular, Amoruso et al. [17] showed the existence of pressurization thin quasi-horizontal ~4 km deep source with a negligible contribution of a shallower source underneath the Solfatara crater; Trasatti et al. [14] inverted COSMO-SkyMed (CSK) data, identifying their best fit model as a north-dipping mixed-mode dislocation source lying at a ~5 km depth.
The purpose of this study is to model and analyze the deformation source responsible for the unrest episode by exploiting the X-band CSK satellite SAR data and GPS measurements of 11 inner NYT caldera stations. We model the pressure change evolution of the source and evaluate the spatial and temporal variations in the acting stress/strain field beneath the caldera. In particular, we follow two main modeling steps: (I) we search for a 3D elastic source model responsible for the observed ground velocity occurring in the 2011–2013 time interval by jointly inverting the mean velocity deformation from DInSAR [15], retrieved from CSK images acquired along ascending and descending orbits, and GPS stations [11]. (II) After the location, geometry, and pressure change of the source underneath the CF caldera are inferred, we model, through a time pressure change function, the displacement time series between 2009 and the end of 2013, recorded by cGPS stations. The final aim of this study is to analyze the modeled spatial and temporal distribution of the shear stress (τMAX) and volumetric strain (εv), investigating their link with the seismic swarms, which occurred between 2009 and the end of 2013.
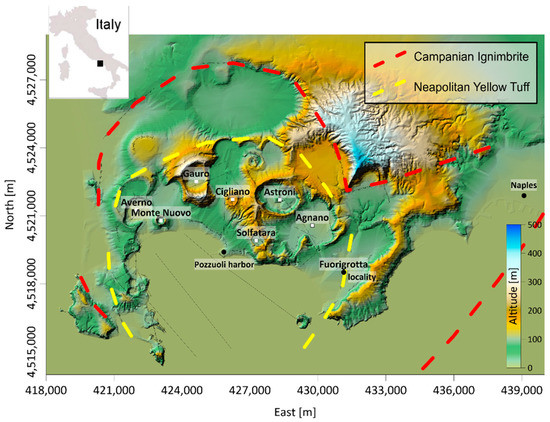
Figure 1.
Campi Flegrei caldera. SRTM DEM of the area with red and yellow dotted lines indicating the Campanian Ignimbrite (CI) and Neapolitan Yellow Tuff (NYT) caldera borders, respectively (modified or adapted from [18]). The black lines show the faults and outer/inner rims [19]. The white squares indicate the locations of the caldera main eruptive centers. The UTM-WGS84 projection zone is 33 N.
2. Deformation Data and 3D Source Model
We inverted DInSAR and GPS mean velocities deformation to infer the location, geometry, and pressure change of the 2001–2013 active source underneath the CF caldera. The DInSAR data are obtained from CSK images acquired along ascending and descending orbits from February 2011 to December 2013 and are the same data set used in [15]. We used 11 of the 14 available GPS stations [11] (Figure 2b); in particular, we did not consider the data from LICO, QUAR, and FRUL because their deformation velocities are too low to be considered in the modeling procedures (≤2.5 mm/year) and localized outside the NYT caldera border.
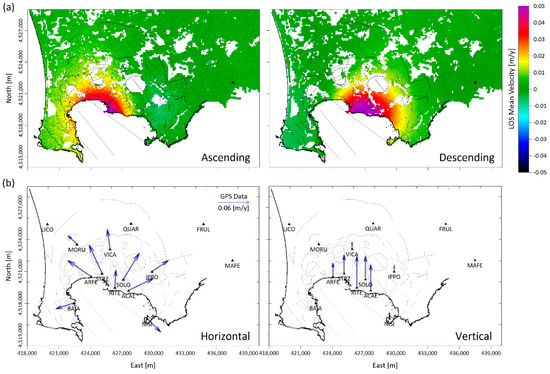
Figure 2.
Ground deformation data. (a) The 2011–2013 LOS mean deformation velocity retrieved along ascending (left panel) and descending (right panel) orbits from CSK SAR images (data from [15]). The black lines indicate the faults and outer/inner rims of the CF caldera; the reference point is marked by a black rectangle. (b) Blue arrows indicate 2011–2013 horizontal (left panel) and vertical (right panel) GPS deformation velocity components (calculated from [11]) of the considered stations: RITE, MORU, VICA, ARFE, IPPO, ACAE, BAIA, SOLO, STRZ, NISI; all the measurements refer to MAFE station. The black triangles represent the INGV permanent GPS network taken from [11].
Both the ascending and descending LOS mean deformation velocity maps (Figure 2a) record a maximum of about 0.06 m/year at the Pozzuoli harbor, with the velocity pattern accommodated within the NYT caldera boundaries. This pattern is in agreement with the vertical velocity of GPS data (Figure 2b), which is equal to 0.065 ± 0.003 m/year at Pozzuoli harbor (RITE station), and exhibits a progressive decrease in velocity with distance, measured by GPS stations.
2.1. Model Strategy
The 3D finite element (FE) model [20] allows us to use the geophysical information available over the considered area. We employed the structural mechanical module within the COMSOL Multiphysics software package [21], and we performed a stationarity study, in isothermal conditions, by considering the medium as linearly elastic. In addition, we estimated the heterogeneities of elastic parameters by using seismic tomography [22] (Figure 3a).
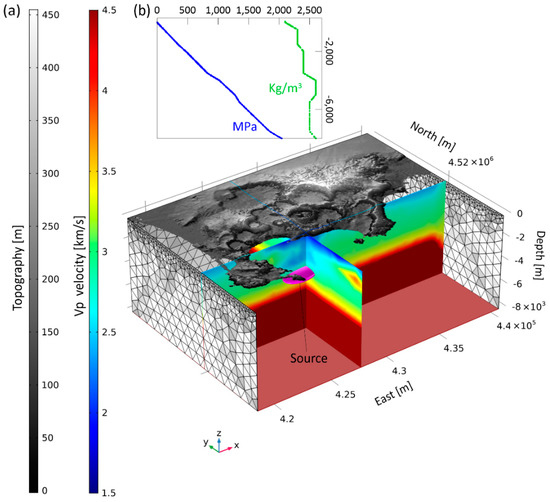
Figure 3.
Finite element model setting. (a) Discretized model domains (source and surrounding rocks) through tetrahedral elements. The boundary conditions are (1) free conditions on the top, where the SRTM DEM of the area is considered; (2) roller conditions imposed on the four lateral sides; (3) fixed model bottom at a depth of 8 km. Physical parameters are inferred from the Vp-Vs seismic tomography [22]. (b) Initial model condition related to the density and lithostatic stress along depth.
Several authors [10,14,17,23] have assumed that the effects on the deformation of the hydrothermal system were negligible at shallow depth during the 2011–2013 uplift episode and that the medium surrounding the source exhibited linear elastic behavior. In particular, Troiano et al. [24] demonstrated the validity of this assumption, showing that the ground deformation associated with the uplift phase is nearly linear while the subsiding phase is characterized by a nonlinear viscosity-controlled trend. We built a 3D geometry of the area below the CF caldera, which extends for about 22 km × 16 km along the east and north, respectively, to a depth of 8 km; it also includes the topographic gradients at the CF ground surface (Figure 3). For such a computation, the caldera FE volume is discretized into a mesh of tetrahedral elements, with denser sampling in the source region. The use of a tetrahedral element discretization leads to the generation of a fine mesh that is readily aligned to the source and to the topographic surface. In particular, the entire numerical domain is discretized by considering 217,100 tetrahedral elements (Figure 3a) and by using a quadratic shape function, with the element size ranging from 200 to 800 m. As external boundary conditions, we apply a free surface condition for the upper boundary domain, which corresponds to the caldera topography; the bottom face is held fixed, while rollers are applied at the four lateral faces of the considered numerical domain. For the initial condition, we assume that the stress field is reproduced by applying gravity acceleration under elastic conditions: this condition allows the model to be compacted under the weight of the rock successions (gravity loading) until it reaches a stable equilibrium. This pressure distribution represents the lithostatic stress, starting from an atmospheric value at the surface and linearly increasing with depth (Figure 3b).
Subsequently, to model the observed deformation field, we considered the hydrostatic load applied to the 3-axis spheroidal filled source, also taking into account its internal body force. In order to retrieve the best-fit geometrical source features and pressure change, we performed an optimization procedure based on the Monte Carlo method allowing us to combine the efficiency of the derivative-based algorithm and the robustness of the random search algorithm [25]. We searched for the 3-axis spheroidal source (Rx,y,z), source center (Cx,y,z), source orientation (dip and strike), and pressure change value (Table 1) by exploiting 18,270 and 17,349 DInSAR points for ascending and descending LOS mean velocity maps (Figure 2a), respectively. Simultaneously, we took into account the horizontal and vertical velocity components of 11 GPS stations (Figure 2b). The best-fit solution was selected from 1500 forward models (ascii file named TableS1_OBJ in Supplementary Material) via the Root-Mean-Square Error (RMSE) criterion:
where n is the number of data points, m denotes the model, d the data, and w represents the inverse-variance weight for each data set. We considered on average DInSAR velocity uncertainty equal to 0.003 m/year [26]; for GPS data, the uncertainty is equal to 0.001 m/year for northward and eastward velocities and 0.003 m/year for vertical velocity [11]. The comparisons between the optimized model and DInSAR and GPS velocities are shown in Figure 4.

Table 1.
Source parameters. Rx,y,z: spheroidal axes; Cx,y,z: source center; dip and strike: source orientation and pressure. Second and third columns: bounding of unknown parameters. Fourth column: estimated values with the related error.
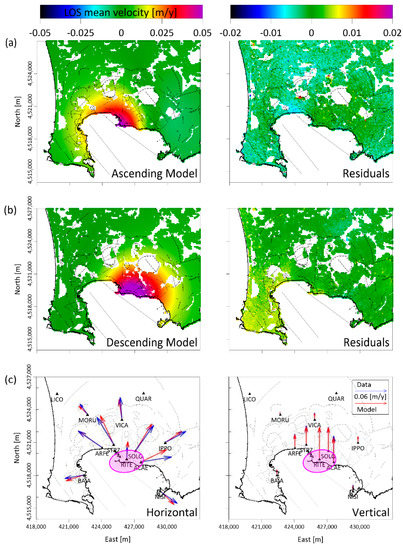
Figure 4.
Stationary FE model results. Comparison between observed (see Figure 2a) and modeled (a) ascending and (b) descending LOS mean velocity of 2011–2013 DInSAR measurements; LOS mean velocity model (left panel) and velocity residuals (right panel). (c) Horizontal (left panel) and vertical (right panel) components of the observed (blue) and modeled (red) GPS mean velocities. The magenta ellipse is the retrieved source projection on the map.
2.2. Stationary Model Results
The inferred source is an oblate-like spheroid, located beneath Pozzuoli harbor at a depth of about 3 km b.s.l., ENE–WSW orientated and almost horizontal (about 4.5° west-dipping). Its hydrostatic pressure change is equal to 24 MPa. We specify that this value represents the modeled source pressure change necessary to overcome the lithostatic stress and allows the upper FE domain crust to instantaneously deform. All the search bounds and the estimated source parameters are reported in Table 1.
The estimated parameter errors are acceptable in a very narrow range of 10%, except for the dip angle that, although characterized by higher uncertainty, does not significantly change the spatial orientation of the inferred source, which appears to be sub-horizontal.
The modeled ascending and descending DInSAR LOS mean deformation velocity, the horizontal and vertical velocity components of GPS, and the associated residual maps are depicted in Figure 4a–c, respectively. The RMSE values for the LOS components are 0.0034 m/year for ascending and 0.0025 m/year for descending maps; for GPS, velocities are 0.0049 m/year for horizontal and 0.0013 m/year for vertical components. These results indicate a good fit between the data and the model for both LOS and GPS mean velocity components. Predominantly in the ACAE GPS station, a difference between the modeled and measured horizontal and vertical components is evident; it could be associated with the hydrothermal shallow source beneath the Solfatara crater, as proposed by Amoruso et al. [17].
In addition, in Figure 5a, we compare the measured and modeled DInSAR LOS mean velocities along an E–W profile (with 4520 km N, UTM coordinate), crossing the maximum deforming area, where a good fit is observed. As a further comparison, we show in Figure 5b the vertical section of the Vp seismic tomography [22] along the above-mentioned profile and the retrieved active spheroidal source; this highlights that the source is located just below the low-velocity zone of Vp < 2.8 km/s, which corresponds to a fractured region filled by hydrothermal fluids. This finding may support the hypothesis that the observed ground deformation is ascribed to a magmatic-related source rather than to the action of shallow pressured hydrothermal fluids; this is in agreement with previous analysis [27], in which the authors demonstrate that magmatic volatiles released by decompressing magmas at a critical degassing pressure (CDP) can drive volcanic unrest.
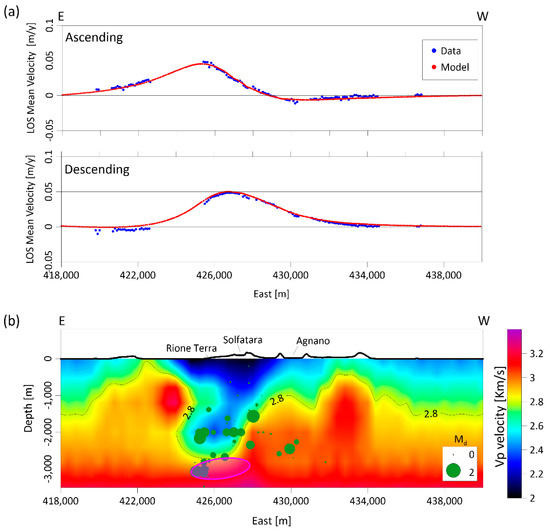
Figure 5.
Stationary FE model results. (a) Comparison between observed (blue points) and modeled (red points) ascending (top panel) and descending (bottom panel) LOS mean velocity of DInSAR measurements along E–W profile (coordinate N = 4520 km). (b) E–W vertical section with the projection of the retrieved source (magenta spheroid), the Vp seismic tomography [22], and the 2011–2013 seismicity. Exaggerated ×2 vertical scale.
Finally, to fully interpret the achieved results, we computed the total horizontal derivative (THD) of the vertical component of the modeled velocity field (see THDmod in Figure 6). We recall that the THD technique is an edge detection filter commonly employed for analyzing potential field data [28,29] and is based on analyzing the maxima of the horizontal gradient magnitude, as computed from the first-order x- and y-derivatives of the field. Accordingly, we used the THD technique to perform a basic detection of the deformation source boundaries. The results, reported in Figure 6, show high values of THD that overlap with the projection of oblate-like spheroid source boundaries at the surface, both for the modeled (THDmod) and measured (THDobs) fields already proposed by Pepe et al. [15]. The goodness of fit between THDmod and THDobs is also highlighted along an NNW–SSE profile, as shown in Figure 6b.
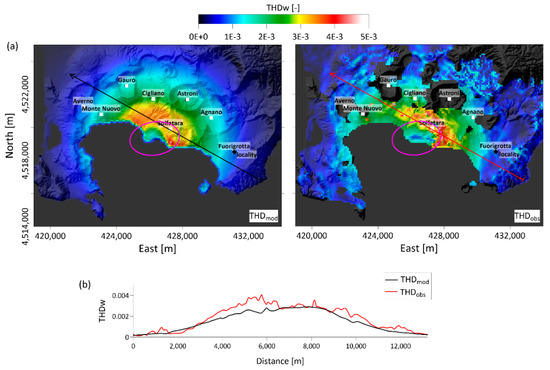
Figure 6.
Stationary FE model results. (a) THDmod results calculated for the modeled vertical velocity deformation field (left) and for data THDobs (right) (see Figure 4 in [15]). The magenta ellipse is the retrieved source projection on the map. The results are superimposed on the SRTM DEM of the area. (b) THD profiles from (a).
3. Stress and Strain Time-Dependent Study
In order to simulate the stress and strain field evolution generated by the retrieved active source, we performed a time-dependent modeling in elastic and isothermal conditions by exploiting the high temporal rate of cGPS measurements between 2009 and the end of 2013 [11]. In detail, assuming that the oblate-like spheroid source shape had not changed, we first extracted the time-dependent function from the GPS RITE signal by normalizing its vertical component (see Figure 7a), and then we multiplied this function by an unknown scalar value of pressure change (ΔP). To determine this unknown value, a linear method was used, estimating a ΔP equal to 78 MPa, and the retrieved ΔP time function that reproduces the observed cGPS measurements is reported in the upper panel of Figure 7b. The FE temporal analysis was performed by considering a time step equal to 0.1 year.
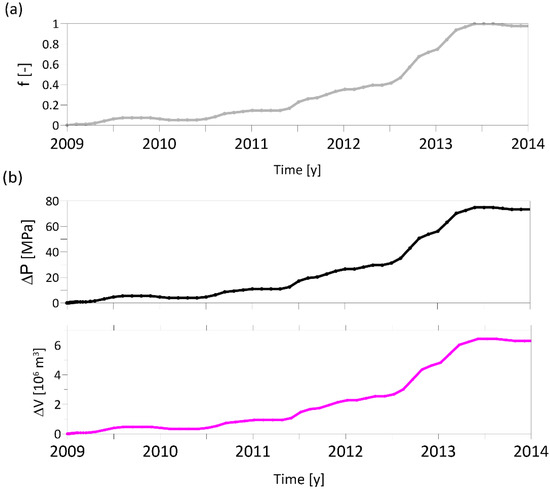
Figure 7.
Time-dependent FE model results. (a) Modulating time function used for the FE time-dependent study(f [-] refers to adimensional quantities). (b) Source ΔP (top panel) and ΔV (bottom panel) time series.
Subsequently, in order to estimate the ΔV time history, we calculated the source volume increase by considering the time-dependent FE modeled volumetric strain field. More specifically, the volumetric strain (εv) is given by εv = εx + εy + εz = ΔV/V, where V is the original volume, ΔV is the change in volume due to the deformation, and εi with (i = x, y, z) are the principal strain components. The bottom panel of Figure 7b shows the retrieved ΔV curve that slightly grows up to June 2012 (2012.5), then accelerates between June 2012 (2012.5) and March 2013 (2013.2) time interval, after which a plateau tendency is observed until the beginning of 2014. The total source volume variation is about 6∙106 m3, with a peak of 6.5∙106 m3 reached during the summer of 2013, when the maximum ground deformation is observed. These values are in agreement with those from other studies based on the same data set (i.e., ΔVPTE in [17]).
In Figure 8, we compared the selected cGPS displacement time series of the three components (vertical, east–west, and north–south), plotted with triangles, with the time-dependent FE modeled components represented by the continuous lines. The results are generally good in the whole part of the NYT inner caldera, although some residuals are observed for the north–south component (blue triangles and lines). This discrepancy is particularly evident at the ACAE GPS station, as already highlighted in the previous stationary model results (Figure 4c).
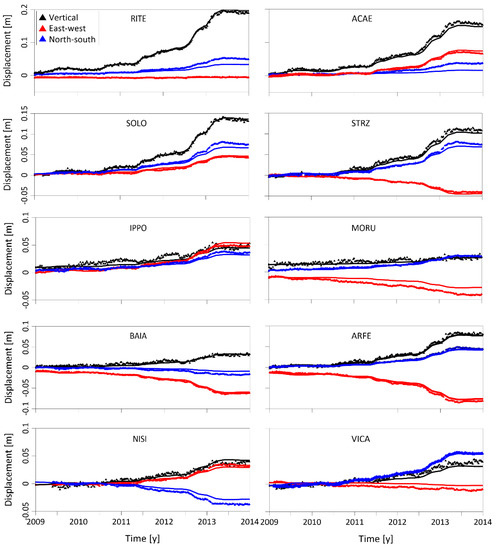
Figure 8.
Time-dependent FE model results. The 2009–2013 cGPS displacement (RITE, ACAE, SOLO, STRZ, IPPO, MORU, BAIA, ARFE, NISI, VICA) time series of the three deformation components: vertical in black, east–west in red, and north–south in blue. All the measurements refer to MAFE station. The triangles are the data [11,17], while the continuous lines represent the time-dependent model results.
Starting from the retrieved time-dependent FE model results, we evaluated the spatial and temporal three-dimensional distribution of the stress and strain fields generated by the active source to evaluate their possible link with the seismic swarms that occurred between 2009 and the end of 2013. In relation to the stress, the theory states that failure can occur when the maximum shear stress is equal to the maximum simple tension, and it is represented by the difference between the principal stresses (τMAX):
In this case, the shear stress was calculated by removing the lithostatic stress (σ* = σtot − σlith). Figure 9 shows a time-lapse of the modeled shear stress and ground deformation at the end of 2013 (see also Video S1 in the Supplementary Material for the movie of the deformation and stress fields between 2009 and 2013).
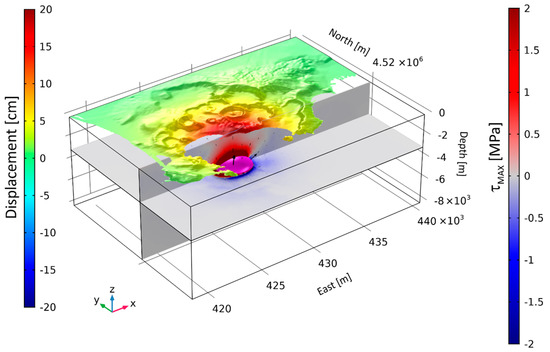
Figure 9.
Time-dependent FE model results. Three-dimensional view of the modeled τMAX at the end of 2013: horizontal slice at depth of 2500 m b.s.l. and vertical slice at N = 4520 km. On the top, the displacement field is superimposed on the SRTM shaded relief map of the CF caldera. The black arrows represent the displacement field; the magenta isosurface represents the inflating deformed source.
The evolution of shear stress is shown in Figure 10a. It shows that the shear stress release, due to the source effect, is characterized by slightly alternating phases of low and high values between 2009 and the end of 2013. By comparing the temporal evolution of shear stress with the observed seismicity (M > 0) underneath the CF caldera, it seems that the shallow seismic clusters (blue and light blue filled circles) occur before the peaks, showing no link with the modeled shear stress, while the deeper seismic cluster (black filled circles) appears at the beginning of the first significant increase in the shear stress curve (see 2012.7 in Figure 10a). The 3D shear stress distribution allows us to discriminate the different causes of the recorded seismic clusters. Indeed, the 2010.3 and 2012.4 shallow seismic clusters (between 1 and 2 km of depth) may be interpretable as the effect induced by the fluid in the hydrothermal reservoir [16], and they are located between the Solfatara and Agnano craters. There is no evidence of these events in the modeled shear stress. Conversely, the August 2012 (2012.7) seismic cluster, characterized by deeper hypocenters (deeper than 2.5 km), is mainly associated with the stress induced by the modeled source; this last event, characterized by high earthquake magnitude, is located in an area with high shear stress. In the map shown in Figure 10d, the main spatial correspondence between the modeled stress and seismic cluster is evident at the NW of the source, where a negative value of τmax is found. Although the August 2012 (2012.7) cluster is not directly generated by the source, we interpret it as the effect of stress concentration along preexisting structures or old volcanic chimneys that feed the monogenic cones, as in the case of the Gauro and Cigliano [30].
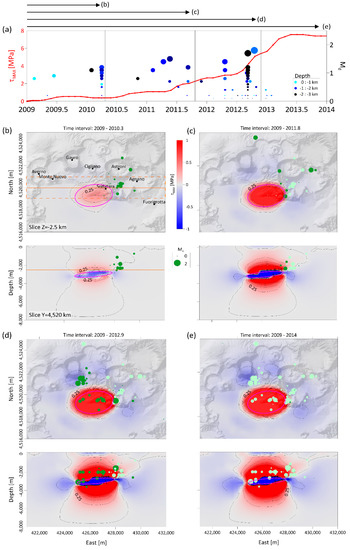
Figure 10.
Shear stress analysis. (a) The 2009–2013 time series of modeled τMAX at point (E = 426 km; N = 4520 km; Z = −2.5 km); the CF caldera seismicity history, represented by circles with different color (depth) and size (magnitude), is superimposed. (b–e) Stress field evolution and earthquake distribution with M > 0 related to four time periods: (b) 2009–2010.3; (c) 2009–2011.8; (d) 2009–2012.9; (e) 2009–2014. The dark green circles indicate the successive earthquakes with respect to the previous ones (light green). The orange lines represent the locations of the vertical and horizontal sections. In these cross-sections, only the seismic events that fall within the dashed rectangle (buffer ± 1 km) in panel (b) are shown.
A further implication of the time-dependent three-dimensional analysis concerns the volumetric strain field [31,32,33]. Where a material is compressed, the changes in strain and length are negative; conversely, where a material is dilated, the changes in strain and length are positive. In Figure 11, we show the strain fields (volumetric strain) related to the source effect only and the seismicity distribution between 2009 and November 2012 (2012.9) with M > 0. A clear correspondence does not seem to emerge from this analysis in any of the horizontal maps (slices at z = −2.5 km) of Figure 11b–e between the occurrence of seismicity and the areas with different strain anomalies (positive or negative) induced by the modeled source. On the contrary, a good correspondence seems to exist, at depth of about −2 km along the sections, between the compression and dilatation regions and the considered earthquakes; we observe that the seismicity occurs mainly at the border between compression and dilatation regions and some events fall within the compression regions.
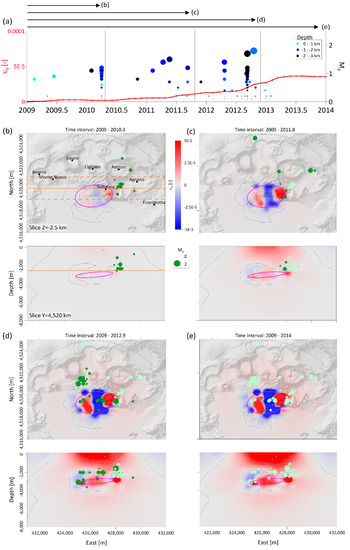
Figure 11.
Volumetric strain field analysis. (a) The 2009–2013 time series of modeled strain at point (E = 426 km; N = 4520 km; Z = –2.5 km); the CF caldera seismicity history, represented by circles with different color (depth) and size (magnitude), is superimposed. (b–e) Volumetric strain field evolution and earthquake distribution with M > 0 related to four periods: (b) 2009–2010.3; (c) 2009–2011.8; (d) 2009–2012.9; (e) 2009–2014. The dark green circles indicate the successive earthquakes with respect to the previous ones (light green). The orange lines represent the location of the vertical and horizontal sections. In these cross-sections, only the seismic events that fall within the dashed rectangle (buffer ± 1 km) in panel (b) are shown.
4. Discussion
In this study, we have analyzed the 2009–2013 uplift at the CF caldera in terms of temporal and spatial variations in the stress/strain field due to an inflating source. We started by searching for a spheroidal source via stationary FE optimization modeling of CSK DInSAR LOS and GPS mean velocities. To reproduce the structural and lithological complexity conditions of the crust beneath the CF caldera region, we built a 3D FE model by considering a realistic distribution of rock heterogeneities derived from seismic tomography. This allowed us to evaluate the impact both of the source geometric anisotropy (as the three-axis best-fit spheroid) and the mechanical heterogeneity of the surrounding rocks on the distribution of the shear stress from 2009 to the end of 2013. The optimization procedure suggests that the deformation best source is a three-axis spheroid compatible with a mostly elongated NE–SW ellipsoid (Figure 4 and Figure 5, Table 1). Its shape, an oblate-like spheroid, and depth (~3 km) are similar to what was found by D’Auria et al. [10], even if these authors found a narrower source. On the other hand, Amoruso et al. [17] and Trasatti et al. [14] found a pressurization sill at ~4 km deep and a north-dipping mixed-mode dislocation source lying at a ~5 km depth. Our retrieved source is located just below the low-velocity zone of Vp < 2.8 km/s (Figure 5), which corresponds to a fractured region filled by hydrothermal fluids [22,34]. This evidence suggests that the observed ground deformation may be ascribed to a magmatic-related source rather than to the action of shallow pressurized hydrothermal fluids. The hypothesis on the source nature is also supported by the seismic attenuation imaging performed by De Siena et al. in 2010 [34] and by fluid-dynamic analysis performed by D’Auria et al. [10].
To verify the reliability of the FE model results, we also performed a THD analysis on the modeled deformation vertical component at the surface (Figure 6a). The THD maxima overlaps with the projection of source boundaries at the surface, although we found some differences between the THDobs and THDmod along the selected profile (Figure 6b); this discrepancy can be attributed to the effects of pre-existing caldera structures (that have disjointed the intracaldera volcanic deposit), which were not considered in the proposed FE modeling setup.
To investigate any mechanical effects of the retrieved source on the surrounding crust, we developed a 3D stress/strain time-dependent FE model of the area below the CF caldera during the 2009–2013 unrest episode by comparing the retrieved results with the occurrence of seismicity (Figure 10 and Figure 11). The spatial distribution of the modeled shear stress reflects the different origins of the recorded seismic clusters. We observe that these clusters are substantially localized above the magmatic-related source and along its external edges. In particular, the clusters occurring up to June 2012 (2012.5) are concentrated in the region between the Solfatara and Agnano craters. In this region, no significant values of the shear stresses directly associable to the retrieved source have been found (see cross-sections of Figure 10b,c). According to several studies [16,35,36], these observed clusters could represent the effect of the active hydrothermal system. This interpretation is also supported by the ambient noise tomography and radar interferometry study proposed by Pepe et al. [15], which recognized the existence of a subvolcanic structure at a depth of 0.8–1 km. In particular, the rising of the pressurized hydrothermal fluids along this structure could justify the location of the seismic shallow cluster, the high rate of observed ground deformation, and the modeled shear stress (τmax of about −0.3 MPa in Figure 10b). However, the August 2012 (2012.7) seismicity affects two distinctive areas: the first is located along the coastline, between Bagnoli and Pozzuoli harbor, with depth ranging between 2.5 and 3 km; the second is clustered in an area south of the Cigliano and Gauro craters, where a relevant negative value of shear stress (τmax of about −1 MPa) is observed (see map in Figure 10d). We interpret this last seismic cluster as the effects of the modeled stress source along a pre-existing structure or volcanic chimney that led to the formation of the Cigliano and Gauro eruptive centers. Finally, high positive values of shear stress are found at depths of about 3 km surrounding the source, where high-magnitude earthquakes occur.
In respect of the strain field analysis (Figure 11), we observe that the rupture phenomena generating the seismicity seem to predominantly occur between compression (negative values) and dilatation (positive values) areas, emphasizing the role of the magmatic-related source in the nucleation of earthquakes during the uplift trend. This behavior has also been observed in other volcanic contexts [37]. In any case, the analysis of this finding is beyond the scope of this paper, but it may be a suitable subject to be investigated in the future by studying, for example, the trend and distribution of the following seismicity to verify if this correspondence is also confirmed in the last seven years.
Finally, we have summarized, based on the achieved modeling results, the Campi Flegrei volcanic system in a conceptual model. Specifically, from west to east, the uppermost crust beneath the caldera down to an 8 km depth is illustrated in Figure 12. We interpret that the retrieved intermediate magmatic-related source (deformation source #2 in Figure 12) acts as an interconnection between the deeper magmatic reservoir (thermal source #1 in Figure 12), already proposed by Castaldo et al. [38] by exploiting the thermal data, and the hydrothermal shallow system (hydrothermal source #3 in Figure 12). Furthermore, the existence of a magmatic-related source at about 3 km of depth is also confirmed by Chiodini et al. [27], where the authors demonstrate that magmatic volatiles released by decompressing magmas at a critical degassing pressure (CDP) can drive volcanic unrest towards a critical state, indicating that the magma could approach the CDP at Campi Flegrei.
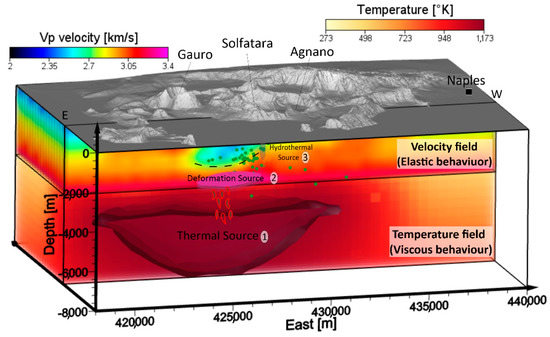
Figure 12.
Conceptual model of the Campi Flegrei volcanic system. Schematic view of the caldera system with three different sources and the Vp velocity/conductive thermal field. (1) Thermal deep source from [38,39] represented by the isothermal surface of 1173 K; (2) deformation source from this study and also from [10]; (3) hydrothermal system and fluid source from [16,34]. The green circles represent the earthquake hypocenters for the 2011–2013 time interval. Exaggerated ×2 vertical scale.
On the other hand, hot fluids rising from the intermediate source through the highly fractured crustal zones feed the shallow hydrothermal source.
This shallow structure of the CF caldera is also in accordance with what was proposed by Kilburn et al. [23].
5. Conclusions
In this work, we created a physically based FE model of a volcanic system beneath the CF caldera following two steps: (i) modeling of LOS DInSAR and GPS mean velocities between 2011 and 2013 in order to retrieve the best geometrical features of the active source and (ii) analyzing the evolution of the stress/strain field distribution between 2009 and the end of 2013 by exploiting the high temporal rate of cGPS measurements. Our modeling approach allowed investigation of the possible mechanical effects of the retrieved source on the surrounding crust. The main findings are as follows:
- The DInSAR and GPS observed deformation velocity patterns can be explained by the action of an oblate-like spheroid source, slightly ENE–WSW oriented and represented by a filled hydrostatic pressurized source at ~3 km deep.
- The maxima of the calculated THD correspond to the projection at the surface of source boundaries, emphasizing the main incidence of the source on the observed deformation, although some discrepancies have been identified at the western region of the caldera where the influence of shallow structures probably becomes predominant in modulating the deformation pattern.
- The spatial distribution of the modeled shear stress during the 2009–2013 unrest episode reflects the different origins of the recorded seismic clusters. Indeed, low values of modeled shear stress are related to the shallow hydrothermal system, where low-magnitude earthquakes occur (0 < M < 1), while high values of shear stress are found at depths of about 3 km, where high-magnitude earthquakes (M > 1) nucleate.
- The volumetric strain analysis highlights that the seismicity occurs mainly at the border between the compression (negative values) and dilatation (positive values) regions, and some earthquakes fall within compression regions.
- The retrieved source (3 km deep), interpreted as magmatic-related, lies between the low Vp tomographic velocity anomaly (hydrothermal system) and the deep thermal anomalous region. It acts as an interconnection between the deeper magmatic reservoir (at about a 5 km depth) and the shallower hydrothermal system (0–2 km depth). Accordingly, the deformation source possibly accumulates magma batches from a deeper magma reservoir.
Finally, we remark that our FE approach allows us to distinguish the induced stress/strain effects attributable to the action of the intermediate magmatic-related source from those attributable to the action of the hydrothermal source. This result is relevant particularly for highly structured resurgent calderas, such as the CF, in which a deep magmatic system, an intermediate region, and a shallow hydrothermal system establish the complexity of the volcano plumbing system.
Supplementary Materials
The following are available online at https://www.mdpi.com/article/10.3390/rs13122298/s1, Table S1: Forward models; Video S1: 2009–2013 shear stress analysis.
Author Contributions
Conceptualization, R.C., P.T. and G.S.; methodology and modeling analysis, R.C.; writing—original draft and revised version preparation, R.C., P.T. and G.S. All authors have read and agreed to the published version of the manuscript.
Funding
This research received no external funding.
Institutional Review Board Statement
Not applicable.
Informed Consent Statement
Not applicable.
Data Availability Statement
The DEM of the investigated zone was acquired from the SRTM archive. The DInSAR measurements are taken from Pepe et al., 2014 and the GPS data from De Martino et al., 2014. The seismic tomography was acquired from Chiarabba et al., 2006.
Acknowledgments
This research has been partially supported by the project “Detection and tracking of crustal fluid by multi-parametric methodologies and technologies” of the Italian PRIN-MIUR program (grant No. 20174X3P29) and by the Dipartimento Protezione Civile della Presidenza del Consiglio dei Ministri of Italy. The authors thank the three anonymous reviewers whose suggestions helped to improve the paper. Finally, the authors thank F. Parisi for his technical support.
Conflicts of Interest
The authors declare no conflict of interest.
References
- Cinque, A.; Rolandi, G.T.; Zamparelli, V. L’estensione dei depositi marini olocenici nei Campi Flegrei in relazione alla vulcano–tettonica. Boll. Della Soc. Geol. Ital. 1985, 104, 327–348. [Google Scholar]
- Isaia, R.; Marianelli, P.; Sbrana, A. Caldera unrest prior to intense volcanism in Campi Flegrei (Italy) at 4.0 ka B.P.: Implications for caldera dynamics and future eruptive scenarios. Geophys. Res. Lett. 2009, 36, 21303. [Google Scholar] [CrossRef]
- Orsi, G.; Civetta, L.; Del Gaudio, C.; de Vita, S.; Di Vito, M.; Isaia, R.; Petrazzuoli, S.; Ricciardi, G.; Ricco, C. Short-term ground deformations and seismicity in the resurgent Campi Flegrei caldera Italy/: An example of active block-resurgence in a densely populated area. J. Volcanol. Geotherm. Res. 1999, 91, 415–451. [Google Scholar] [CrossRef]
- Di Vito, M.; Isaia, R.; Orsi, G.; Southon, J.; de Vita, S.; D’Antonio, M.; Pappalardo, L.; Piochi, M. Volcanism and deformation since 12,000 years at the Campi Flegrei caldera (Italy). J. Volcanol. Geotherm. Res. 1999, 91, 221–246. [Google Scholar] [CrossRef]
- Battaglia, M.; Troise, C.; Obrizzo, F.; Pingue, F.; De Natale, G. Evidence for fluid migration as the source of deformation at Campi Flegrei caldera (Italy). Geophys. Res. Lett. 2006, 33, 01307. [Google Scholar] [CrossRef]
- Dvorak, J.; Berrino, G. Recent ground movement and seismic activity in Campi Flegrei, southern Italy, episodic growth of a resurgent dome. J. Geophys. Res. 1991, 96, 2309–2323. [Google Scholar] [CrossRef]
- Del Gaudio, C.; Aquino, I.; Ricciardi, G.P.; Ricco, C.; Scandone, R. Unrest episodes at Campi Flegrei: A reconstruction of vertical ground movements during 1905–2009. J. Volc. Geoth. Res. 2010, 195, 48–56. [Google Scholar] [CrossRef]
- De Natale, G.; Troise, C.; Pingue, F.; Mastrolorenzo, G.; Pappalardo, L.; Battaglia, M.; Boschi, E. The Campi Flegrei caldera: Unrest mechanisms and hazard. Geol. Soc. Lond. Spéc. Publ. 2006, 269, 25–45. [Google Scholar] [CrossRef]
- Bottiglieri, M.; Falanga, M.; Tammaro, U.; De Martino, P.; Obrizzo, F.; Godano, C.; Pingue, F. Characterization of GPS time series at the Neapolitan volcanic area by statistical analysis. J. Geophys. Res. 2010, 115, B10416. [Google Scholar] [CrossRef]
- D’Auria, L.; Pepe, S.; Castaldo, R.; Giudicepietro, F.; Macedonio, G.; Ricciolino, P.; Tizzani, P.; Casu, F.; Lanari, R.; Manzo, M.; et al. Magma injection beneath the urban area of Naples: A new mechanism for the 2012–2013 volcanic unrest at Campi Flegrei caldera. Sci. Rep. 2015, 5, 13100. [Google Scholar] [CrossRef]
- De Martino, P.; Tammaro, U.; Obrizzo, F. GPS time series at Campi Flegrei caldera (2000–2013). Ann. Geoph. 2014, 57. [Google Scholar] [CrossRef]
- Iuliano, S.; Matano, F.; Caccavale, M.; Sacchi, M. Annual rates of ground deformation (1993–2010) at Campi Flegrei, Italy, revealed by Persistent Scatterer Pair (PSP)—SAR interferometry. Int. J. Remote. Sens. 2015, 36, 6160–6191. [Google Scholar] [CrossRef]
- Samsonov, S.V.; Tiampo, K.F.; Camacho, A.; Fernández, J.; Gonzalez, P.J. Spatiotemporal analysis and interpretation of 1993–2013 ground deformation at Campi Flegrei, Italy, observed by advanced DInSAR. Geophys. Res. Lett. 2014, 41, 6101–6108. [Google Scholar] [CrossRef]
- Trasatti, E.; Polcari, M.; Bonafede, M.; Stramondo, S. Geodetic contraints to the source mechanism of the 2011–2013 unrest at Campi Flegrei (Italy) caldera. Geoph. Res. Lett. 2015, 42, 3847–3854. [Google Scholar] [CrossRef]
- Pepe, S.; de Siena, L.; Barone, A.; Castaldo, R.; D’Auria, L.; Manzo, M.; Casu, F.; Fedi, M.; Lanari, R.; Bianco, F.; et al. Volcanic structures investigation through SAR and seismic interferometric methods: The 2011–2013 Campi Flegrei unrest episode. Remote Sens. Environ. 2019, 234, 111440. [Google Scholar] [CrossRef]
- Chiodini, G.; Vandemeulebrouck, J.; Caliro, S.; D’Auria, L.; de Martino, P.; Mangiacapra, A.; Petrillo, Z. Evidence of thermal-driven processes triggering the 2005–2014 unrest at Campi Flegrei caldera. Earth Planet. Sc. Lett. 2015, 414, 58–67. [Google Scholar] [CrossRef]
- Amoruso, A.; Crescentini, L.; Sabbetta, I.; De Martino, P.; Obrizzo, F.; Tammaro, U. Clues to the cause of the 2011–2013 Campi Flegrei caldera unrest, Italy, from continuous GPS data. Geophys. Res. Lett. 2014, 41, 3081–3088. [Google Scholar] [CrossRef]
- Orsi, G.; De Vita, S.; di Vito, M. The restless, resurgent Campi Flegrei nested caldera (Italy): Constraints on its evolution and configuration. J. Volcanol. Geotherm. Res. 1996, 74, 179–214. [Google Scholar] [CrossRef]
- De Siena, L.; Chiodini, G.; Vilardo, G.; Del Pezzo, E.; Castellano, M.; Colombelli, S.; Tisato, N.; Ventura, G. Source and dynamics of a volcanic caldera unrest: Campi Flegrei, 1983–84. Sci. Rep. 2017, 7, 8099. [Google Scholar] [CrossRef] [PubMed]
- Fagan, M. Finite Element Analysis. Theory and Practice; Longman Pub Group: New York, NY, USA; Wiley: Hoboken, NJ, USA, 1992; 344p. [Google Scholar]
- COMSOL, Inc. 1 New England Executive Park; Suite 350: Burlington, MA, USA. Available online: http://www.comsol.com (accessed on 1 February 2021).
- Chiarabba, C.; Moretti, M. An insight into the unrest phenomena at the Campi Flegrei caldera from Vp and Vp/Vs tomography. Terra Nova 2006, 18, 373–379. [Google Scholar] [CrossRef]
- Kilburn, C.R.; De Natale, G.; Carlino, S. Progressive approach to eruption at Campi Flegrei caldera in southern Italy. Nat. Commun. 2017, 8, 15312. [Google Scholar] [CrossRef]
- Troiano, A.; Di Giuseppe, M.G.; Petrillo, Z.; Troise, C.; De Natale, G. Ground deformation at calderas driven by fluid injection: Modelling unrest episodes at Campi Flegrei (Italy). Geoph. J. Int. 2011, 187, 833–847. [Google Scholar] [CrossRef]
- Sen, M.K.; Stoffa, P.L. Global Optimization Methods in Geophysical Inversion, 2nd ed.; Cambridge University Press: Cambridge, UK, 2013. [Google Scholar]
- Casu, F.; Manzo, M.; Lanari, R. A quantitative assessment of the SBAS algorithm performance for surface deformation retrieval from DInSAR data. Remote Sens. Environ. 2006, 102, 195–210. [Google Scholar] [CrossRef]
- Chiodini, G.; Paonita, A.; Aiuppa, A.; Costa, A.; Caliro, S.; De Martino, P.; Acoella, V.; Vandemeulebrouck, J. Magma near the critical degassing pressure drive volcanic unrest towards a critical state. Nat. Commun. 2016. [Google Scholar] [CrossRef]
- Blakely, R.J. Potential Theory in Gravity and Magnetic Application; Cambridge University Press: Cambridge, UK, 1996. [Google Scholar]
- Florio, G.; Fedi, M.; Cella, F.; Rapolla, A. The Campanian Plain and Phlegrean Fields: Structural setting from potential field data. J. Volcanol. Geotherm. Res. 1999, 91, 361–379. [Google Scholar] [CrossRef]
- Rosi, M.; Sbrana, A. Quaderni de “La Ricerca Scientifica”. Progett. Final. Geodin. 1987, 9, 89. [Google Scholar]
- Ranalli, G. Rheology of the Earth, 2nd ed.; Chapman & Hall: London, UK, 2001. [Google Scholar]
- Sadd, M. Theory, Applications, and Numerics Elasticity, 2nd ed.; Academic Press: Cambridge, MA, USA, 2009; ISBN 9780123744463. [Google Scholar]
- Johnson, A.M. Physical Processes in Geology: A Method for Interpretation of Natural Phenomena; Intrusions in Igneous Rocks, Fractures, and Folds, Flow of Debris and Ice, 1st ed.; Freeman, Cooper: San Francisco, CA, USA, 1970. [Google Scholar]
- De Siena, L.; Del Pezzo, E.; Bianco, F. Seismic attenuation imaging of Campi Flegrei: Evidence of gas reservoirs, hydrothermal basins, and feeding systems. J. Geophys. Res. 2010, 115, B09312. [Google Scholar] [CrossRef]
- Siniscalchi, A.; Tripaldi, S.; Romano, G.; Chiodini, G.; Improta, L.; Petrillo, Z.; D’Auria, L.; Caliro, S.; Avino, R. Reservoir structure and hydraulic properties of the Campi Flegrei geothermal system inferred by audiomagnetotelluric, geochemical, and seismicity study. J. Geophys. Res. Solid Earth 2019, 124, 5336–5356. [Google Scholar] [CrossRef]
- Giudicepietro, F.; Chiodini, G.; Caliro, S.; De Cesare, W.; Esposito, A.M.; Galluzzo, D.; Bascio, D.L.; Macedonio, G.; Orazi, M.; Ricciolino, P.; et al. Insight into Campi Flegrei Caldera Unrest through seismic tremor measurements at Pisciarelli Fumarolic Field. Geochem. Geophys. Geosyst. 2019, 20, 5544–5555. [Google Scholar] [CrossRef]
- Norini, G.; Carrasco-Núñez, G.; Camargo, F.C.; Lermo, J.; Rojas, J.H.; Castro, C.; Bonini, M.; Montanari, D.; Corti, G.; Moratti, G.; et al. The structural architecture of the Los Humeros volcanic complex and geothermal field. J. Volcanol. Geotherm. Res. 2019, 381. [Google Scholar] [CrossRef]
- Castaldo, R.; D’Auria, L.; Pepe, S.; Solaro, G.; De Novellis, V.; Tizzani, P. The impact of crustal rheology on natural seismicity: Campi Flegrei caldera case study. Geosci. Front. 2019. [Google Scholar] [CrossRef]
- Wohletz, K.; Civetta, L.; Orsi, G. Thermal evolution of the Phlegraean magmatic system. J. Volcanol. Geotherm. Res. 1999, 91, 414. [Google Scholar] [CrossRef]
Publisher’s Note: MDPI stays neutral with regard to jurisdictional claims in published maps and institutional affiliations. |
© 2021 by the authors. Licensee MDPI, Basel, Switzerland. This article is an open access article distributed under the terms and conditions of the Creative Commons Attribution (CC BY) license (https://creativecommons.org/licenses/by/4.0/).