Article

Novel Model-Based Approaches for Non-Homogenous Atmospheric Compensation of GB-InSAR in the Azimuth and Horizontal Directions

1
School of Land Science and Technology, China University of Geosciences, Beijing 100083, China
2
Global Navigation Satellite System (GNSS) Research Center, Wuhan University, Wuhan 430079, China
3
The Department of Systems Design Engineering, University of Waterloo, Waterloo, ON N2L 3G1, Canada
*
Author to whom correspondence should be addressed.
Remote Sens. 2021, 13(11), 2153; https://doi.org/10.3390/rs13112153
Submission received: 29 April 2021 / Revised: 23 May 2021 / Accepted: 25 May 2021 / Published: 31 May 2021
(This article belongs to the Special Issue Advances in InSAR Imaging and Data Processing)

Abstract

:
Atmospheric disturbance is a main interference for deformation monitoring by GB-InSAR. Most approaches for atmospheric correction are based on the homogenous atmospheric medium assumption that usually does not hold due to complex topography and various environmental factors, leading to low atmospheric correction accuracy. This study proposes two novel model-based approaches for non-homogenous atmospheric compensation in the azimuth and horizontal directions. The conception of a coordinate system is introduced to design the model for the first time. The 2D atmospheric compensation method designed based on the polar coordinate system can address the non-homogenous atmospheric phase screen (APS) correction in the azimuth direction. The 3D atmospheric compensation method based on the rectangular coordinate system deals with the non-homogenous APS in all three directions, and can better address the non-homogenous APS in the elevation direction than the 2D method. Compared with conventional models, the 2D and 3D models consider the other non-homogenous APS conditions in their respective coordinate systems, which helps to broaden the application of model-based approaches. Experiments using different equipment over two study areas are conducted to test the efficiency of the proposed models. The results demonstrate that the proposed approaches can eliminate non-homogenous atmospheric disturbance and enhance the accuracy of GB-InSAR atmospheric compensation, leading to great improvements in slope deformation estimation.

Graphical Abstract

1. Introduction

Ground-based SAR (GB-SAR) interferometry is an active microwave detection technology that originated from Interferometry Synthetic Aperture Radar (InSAR) [1]. GB-SAR is characterized by small scale, high flexibility, and high time-space resolution, so it is an effective alternative to InSAR in deformation monitoring. In the past decades, GB-SAR interferometry shows great potential in the monitoring of landslide [2,3], glacier motion [4], mining area subsidence [5], and civil structures [6,7]. However, the APS seriously affects the monitoring accuracy. Research shows that a measurement error of 2 mm can be caused by the relative humidity change of 1% occurred 1 km away from radar at 20 °C [8]. In order to improve the observation accuracy of GB-SAR, the APS should be removed thoroughly.
The APS correction is mainly done by three approaches. The first one is based on the meteorological information. It simulates the atmospheric delay coefficient (ADC) by the relationship between the refractive index of the electromagnetic wave propagation and the in-situ data of temperature, humility, and air pressure. Then, the APS is calculated on the basis of ADC [9]. This approach has been improved by calibrating the humility using the known control points [10]. Despite the improvement, this approach needs meteorological data, and its accuracy depends on the location of meteorological stations, and the amount and accuracy of the acquired meteorological data.
A more efficient and commonly used approach for APS correction is to establish a model using motionless high-coherence scatterers [11,12], ground control points [12], or permanent scatterers (PS) [1,13,14]. In the places with simple atmospheric conditions, a linear [13] or quadric model [15] can be built between the slant range and atmospheric phase of the control points, which is called the model-based approach. For the mountainous areas with steep topography, the ADC changes linearly with height, and this relationship has been described by the multiple-regression model [16], which has been improved by considering the similarity of APS and deformation later [17]. In addition, these approaches are based on an unwrapped interferogram. The extra phase unwrapping error may be introduced in the low-coherence area when phase unwrapping is performed. Therefore, the APS compensation approaches based on wrapped interferogram are also developed by using phase difference [18] or spectral analysis [19].
These approaches all depend on the assumption of a homogenous atmospheric medium. In fact, the atmospheric medium is non-homogenous due to complex topography and various environmental factors. Some recent research has proved that addressing the non-homogenous effect can improve the atmospheric correction accuracy, which is the third kind of approach. For example, filtering and interpolation are used for compensating the non-homogenous APS after discerning the deformation zone by deformation velocity map [20] or the K-means method [21]. Huang et al. compensated non-homogenous APS by performing polynomial fitting in two horizontal directions, respectively [22]. Karunathilake and Sato analyzed and corrected the non-homogeneous APS over the areas with steep terrains by different models for different ranges [23].
The non-homogenous APS was also computed by the intrinsic random function of order k (IRF-k) Kriging interpolation after iteration for removing the moving pixel candidate [24], or by modeled median profiles of time-series cluster according to temporal APS behavior [25]. Overall, the research on the non-homogenous atmospheric correction issue is very limited and insufficient, although this problem is important.
Model-based approaches are easy to implement and have been demonstrated to be effective [14,15,16]. However, they either rely strongly on the assumption of a homogeneous atmospheric medium [10,13], or assume that the atmospheric medium is non-homogenous only in the slant range [15] or height [16] direction. Actually, due to wind, turbulence [10], and the local water vapor changes [26], the atmospheric medium is also non-homogeneous in the azimuth or horizontal directions [24,25]. Thus, conventional model-based approaches cannot compensate the APS accurately.
This paper, therefore, presents two novel model-based approaches for non-homogenous APS compensation, referred to as the 2D APS model and the 3D APS model hereafter. The 2D APS model based on the polar coordinate deals with the non-homogeneous APS in the azimuth direction. This model divides the ADC along each azimuth degree. It is suitable for the 2D observation scenario for flat terrain and small range. In the 3D observation scenario with steep topography and large range, the 3D APS model divides the ADC into three directions (a vertical direction and two horizontal directions) to address the non-homogenous APS in these directions under the rectangular coordinate system, as the APS variation is non-linear in the polar coordinate system due to the influence of steep topography. The non-linear correction problem in the polar coordinate system is transformed into a linear problem by the rectangular coordinate system. Two experiments with different equipment over two study areas are conducted to test the efficiency of the proposed approaches. The experiment results show that the accuracy of APS correction is improved by the 2D model in a 2D observation scenario, and the 3D model in a 3D observation scenario. These two models improve the slope monitoring accuracy to the sub-millimeter scale.
This paper is organized as follows. Section 2 gives a general description of the test sites, the railway slope in the Linjiaping area and the open-pit in the Malanzhaung area, and the GB-SAR systems. Section 3 presents the methodology, including the analysis of APS, the proposed models, the APS compensation, and the GB-SAR interferometry chain. The results, including the APS correction and time series analysis, are shown in Section 4. Section 5 and Section 6 draw the discussion and conclusion, respectively.

2. Testing Sites

We use two test sites and two GB-SAR systems to validate the two models for different observation scenarios separately.

2.1. The Railway Slope in the Linjiaping Area

The first validation experiment was carried out on a railway slope (N37°41′12.6″, E110°51′44.8″) located in Linjiaping, Shanxi Province, China (Figure 1b), from 22 January to 24 January 2015. Ninety-three single look complex (SLC) images were collected with an acquisition duration of one hour. The terrain is relatively flat and the observation range is small, so we define this area as the 2D observation scenario. The wind is sometimes strong due to the open terrain. The railway has a loess landslide that has been treated. This area has sparse vegetation coverage and the landslide is stable because of the treatment, suitable for the APS correction test. The GB-SAR instrument is the SDMR-1 GB-SAR system (Figure 1a) at Ku band. It was developed by the China University of Geosciences (Beijing) and Beijing Institute of Technology. The parameters of the SDMR-1 GB-SAR system are listed in Table 1.

2.2. The Open-Pit in the Malanzhuang Area

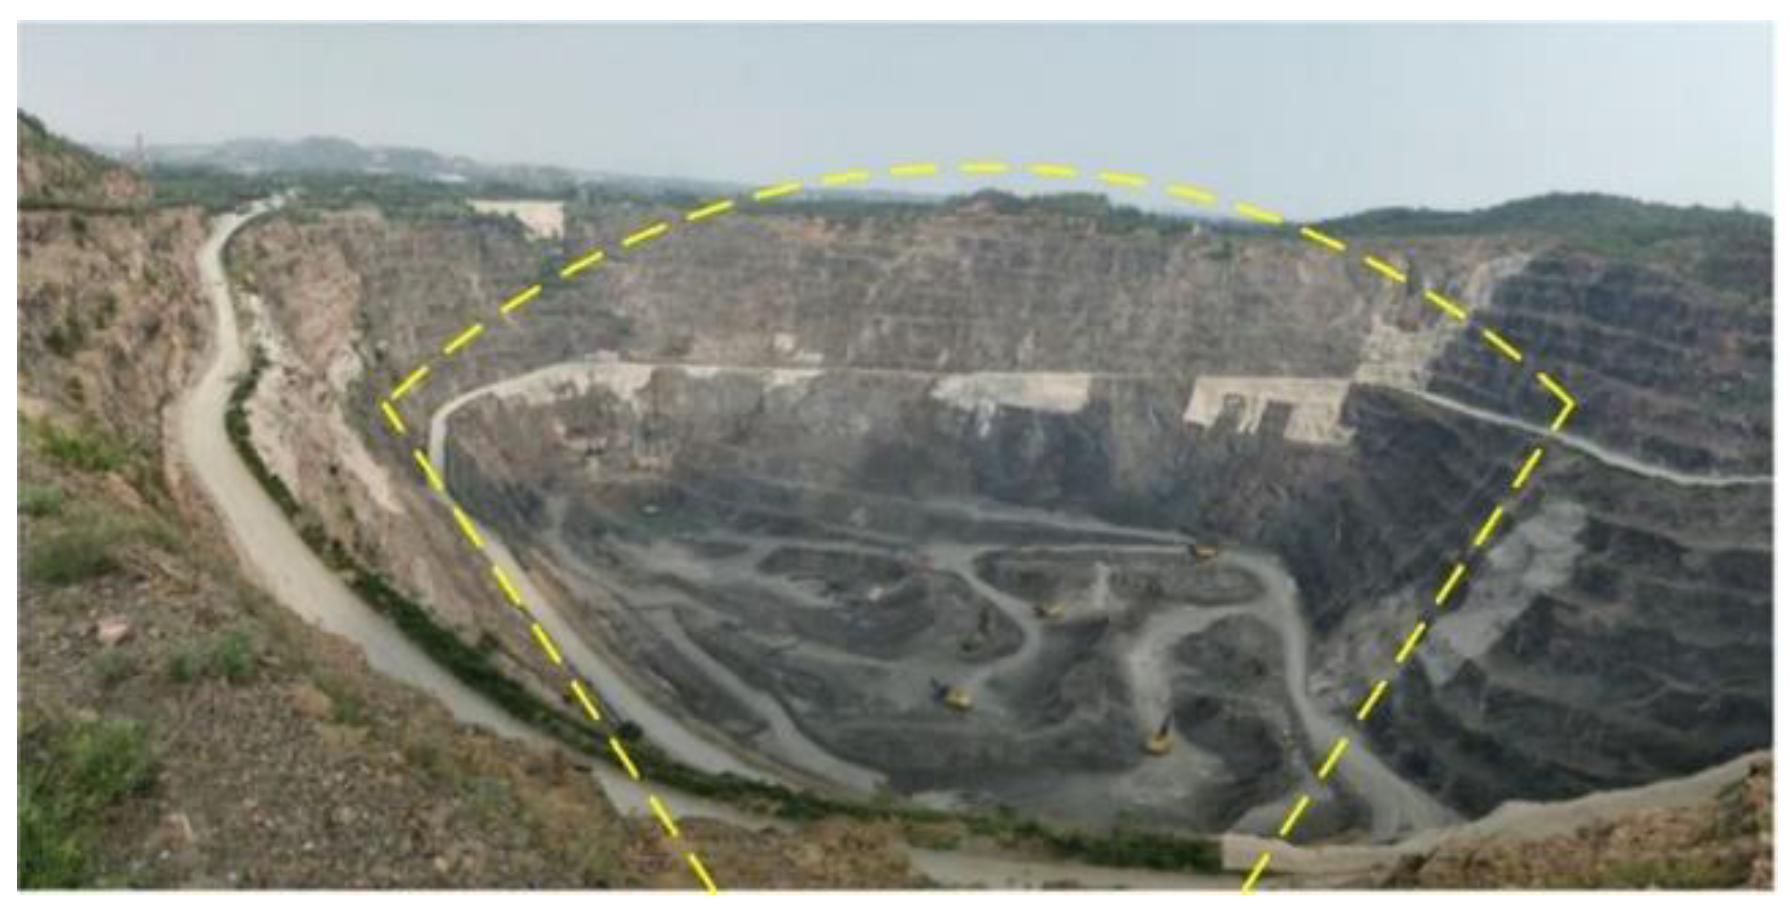
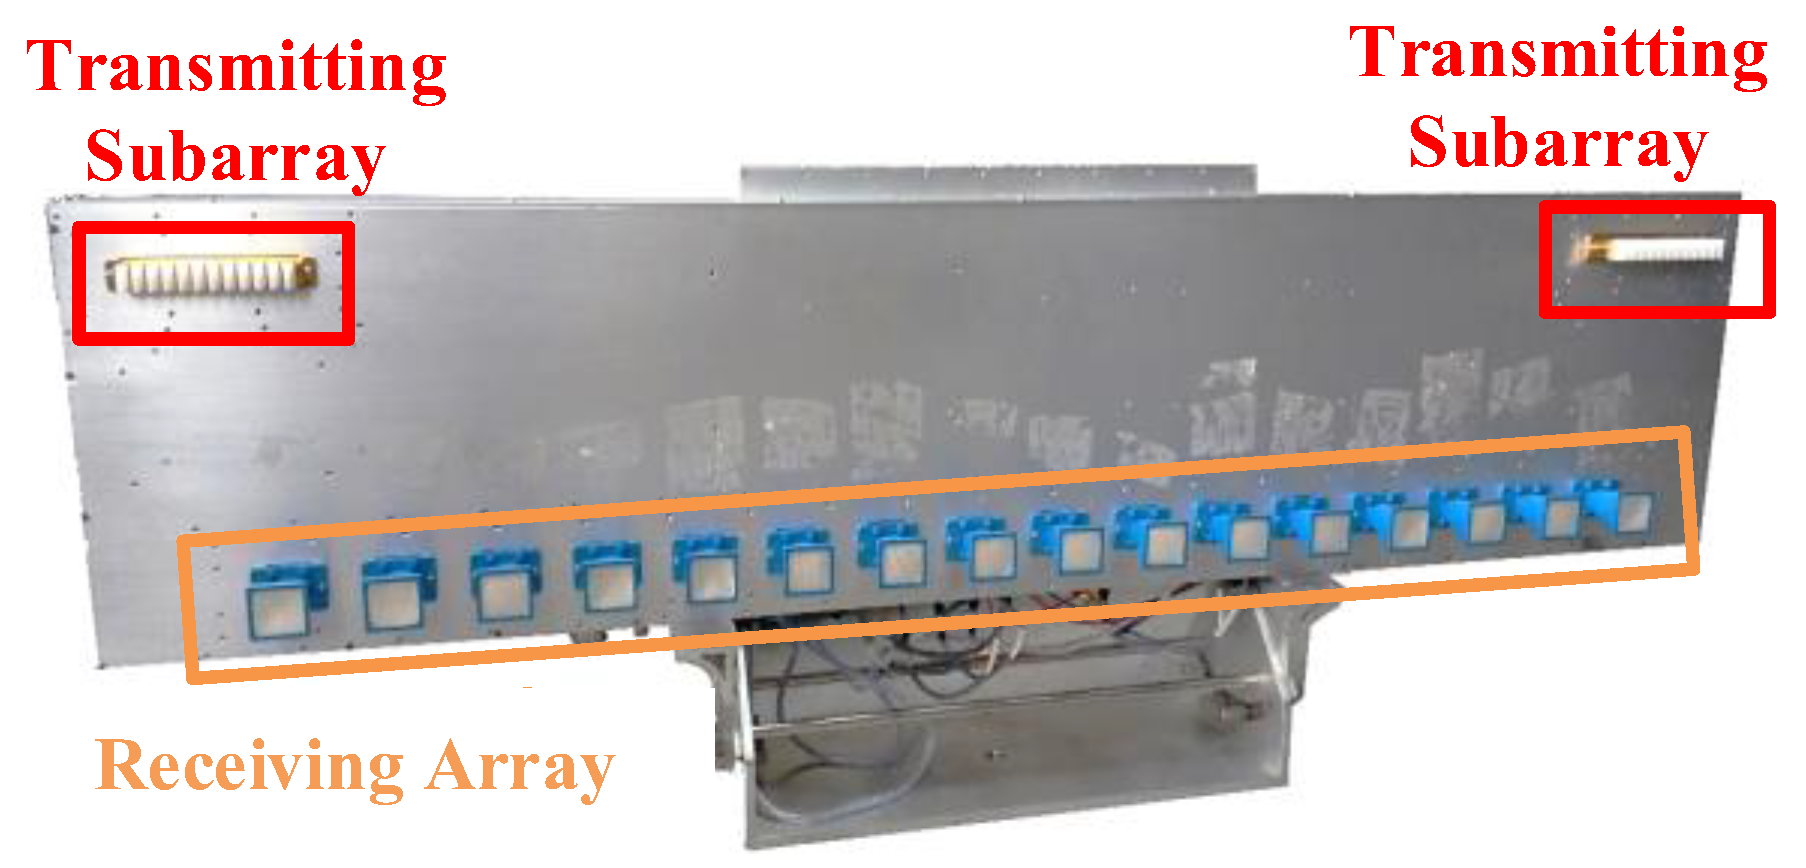
The second validation experiment site is an oval-shaped open-pit (N40°06′44″, E118°36′23″) in Malanzhuang, Hebei province, China (Figure 2). The height difference between the top and bottom of the slope is over 200 m. The slope is a typical rock slope with sparse vegetation cover. This area is defined as the 3D observation scenario. The monitoring data used in this paper were collected in the week from 14 August to 20 August 2018. The temporal baseline is one hour and one dataset consists of 144 images. The GB-SAR instrument is the MIMO at Ku band (see Figure 3), developed by Beijing Institute of Technology and China University of Geosciences (Beijing, China). Table 2 summarizes the main parameters of the MIMO system.

3. Methodology

This section analyzes the APS first, then introduces the corresponding models. Finally, the APS compensation and GB-SAR interferometry chain are presented.

3.1. The APS Analysis

As is shown in Figure 4c, electromagnetic waves were emitted from the radar, forming a fan-shaped observation area with the slant range as the radius and the azimuth direction as the angle. The resolution unit is divided according to the slant range resolution (in meters) and azimuth degree (in rad), which is called the polar coordinate system hereinafter. The pixel resolution gradually becomes smaller as the distance increases.
In the interferogram, the obtained differential phase φ d i f f consists of four parts, the APS φ a p s , the deformation phase φ d e f , the noise phase φ n o i s e , and integer phase ambiguity k , which can be expressed as:
φ d i f f = φ d e f + φ a p s + φ n o i s e + 2 k π
φ d e f results from the target scatterer motion in the radar line of sight (LOS) direction. φ n o i s e is caused by thermal noise, changes in target scatterer characteristics, or other factors. The APS phase φ a p s is mainly due to the meteorology changes during the acquisition of the reference and second images. If the electromagnetic wave with a wavelength of λ emitted at time t travels a distance of r i from the radar to the target pixel i and returns, its echo phase can be expressed as follows:
ϕ a t m i t = 4 π λ 0 r i n r , t d r
where ϕ a t m t is the atmospheric delay in the original interferogram obtained at time t and n r , t is ADC, and n strictly depends on temperature T (in kelvin), pressure P (in millibars), and relative humidity H (%) at each point, as follows [11]:
n r , t = 1 + 10 6 × 77.6 P r , t T r , t + 600 P r , t T ( r , t ) 2 H r , t 10 12.22 log 10 ( P r , t ) 2360 T r , t
Under the assumption of atmospheric homogeneity, T , P , and H of each point is the same. n r , t is only related to time t and it is independent from the position of the target [13].
Therefore, Equation (2) can be simplified as:
ϕ a t m i t = 4 π λ n t r
Then, the APS phase in differential interferogram is:
φ a p s i t 12 = 4 π λ n t 2 n t 1 r i + 2 k π
We use β t 12 to represent 4 π λ n t 2 n t 1 .
Finally, the atmospheric model, which is called the range-related model in the following, under the assumption of homogenous APS is:
φ a p s i t 12 = β t 12 r i + 2 k π
In practice, the assumption of homogenous APS is difficult to hold and n r , t usually changes with the target location parameters, such as the slant range [15] or height [16], that is, the APS shows inhomogeneity in the slant range or height directions. Besides, affected by wind or turbulence, the non-homogenous APS also appears in the azimuth or horizontal directions.
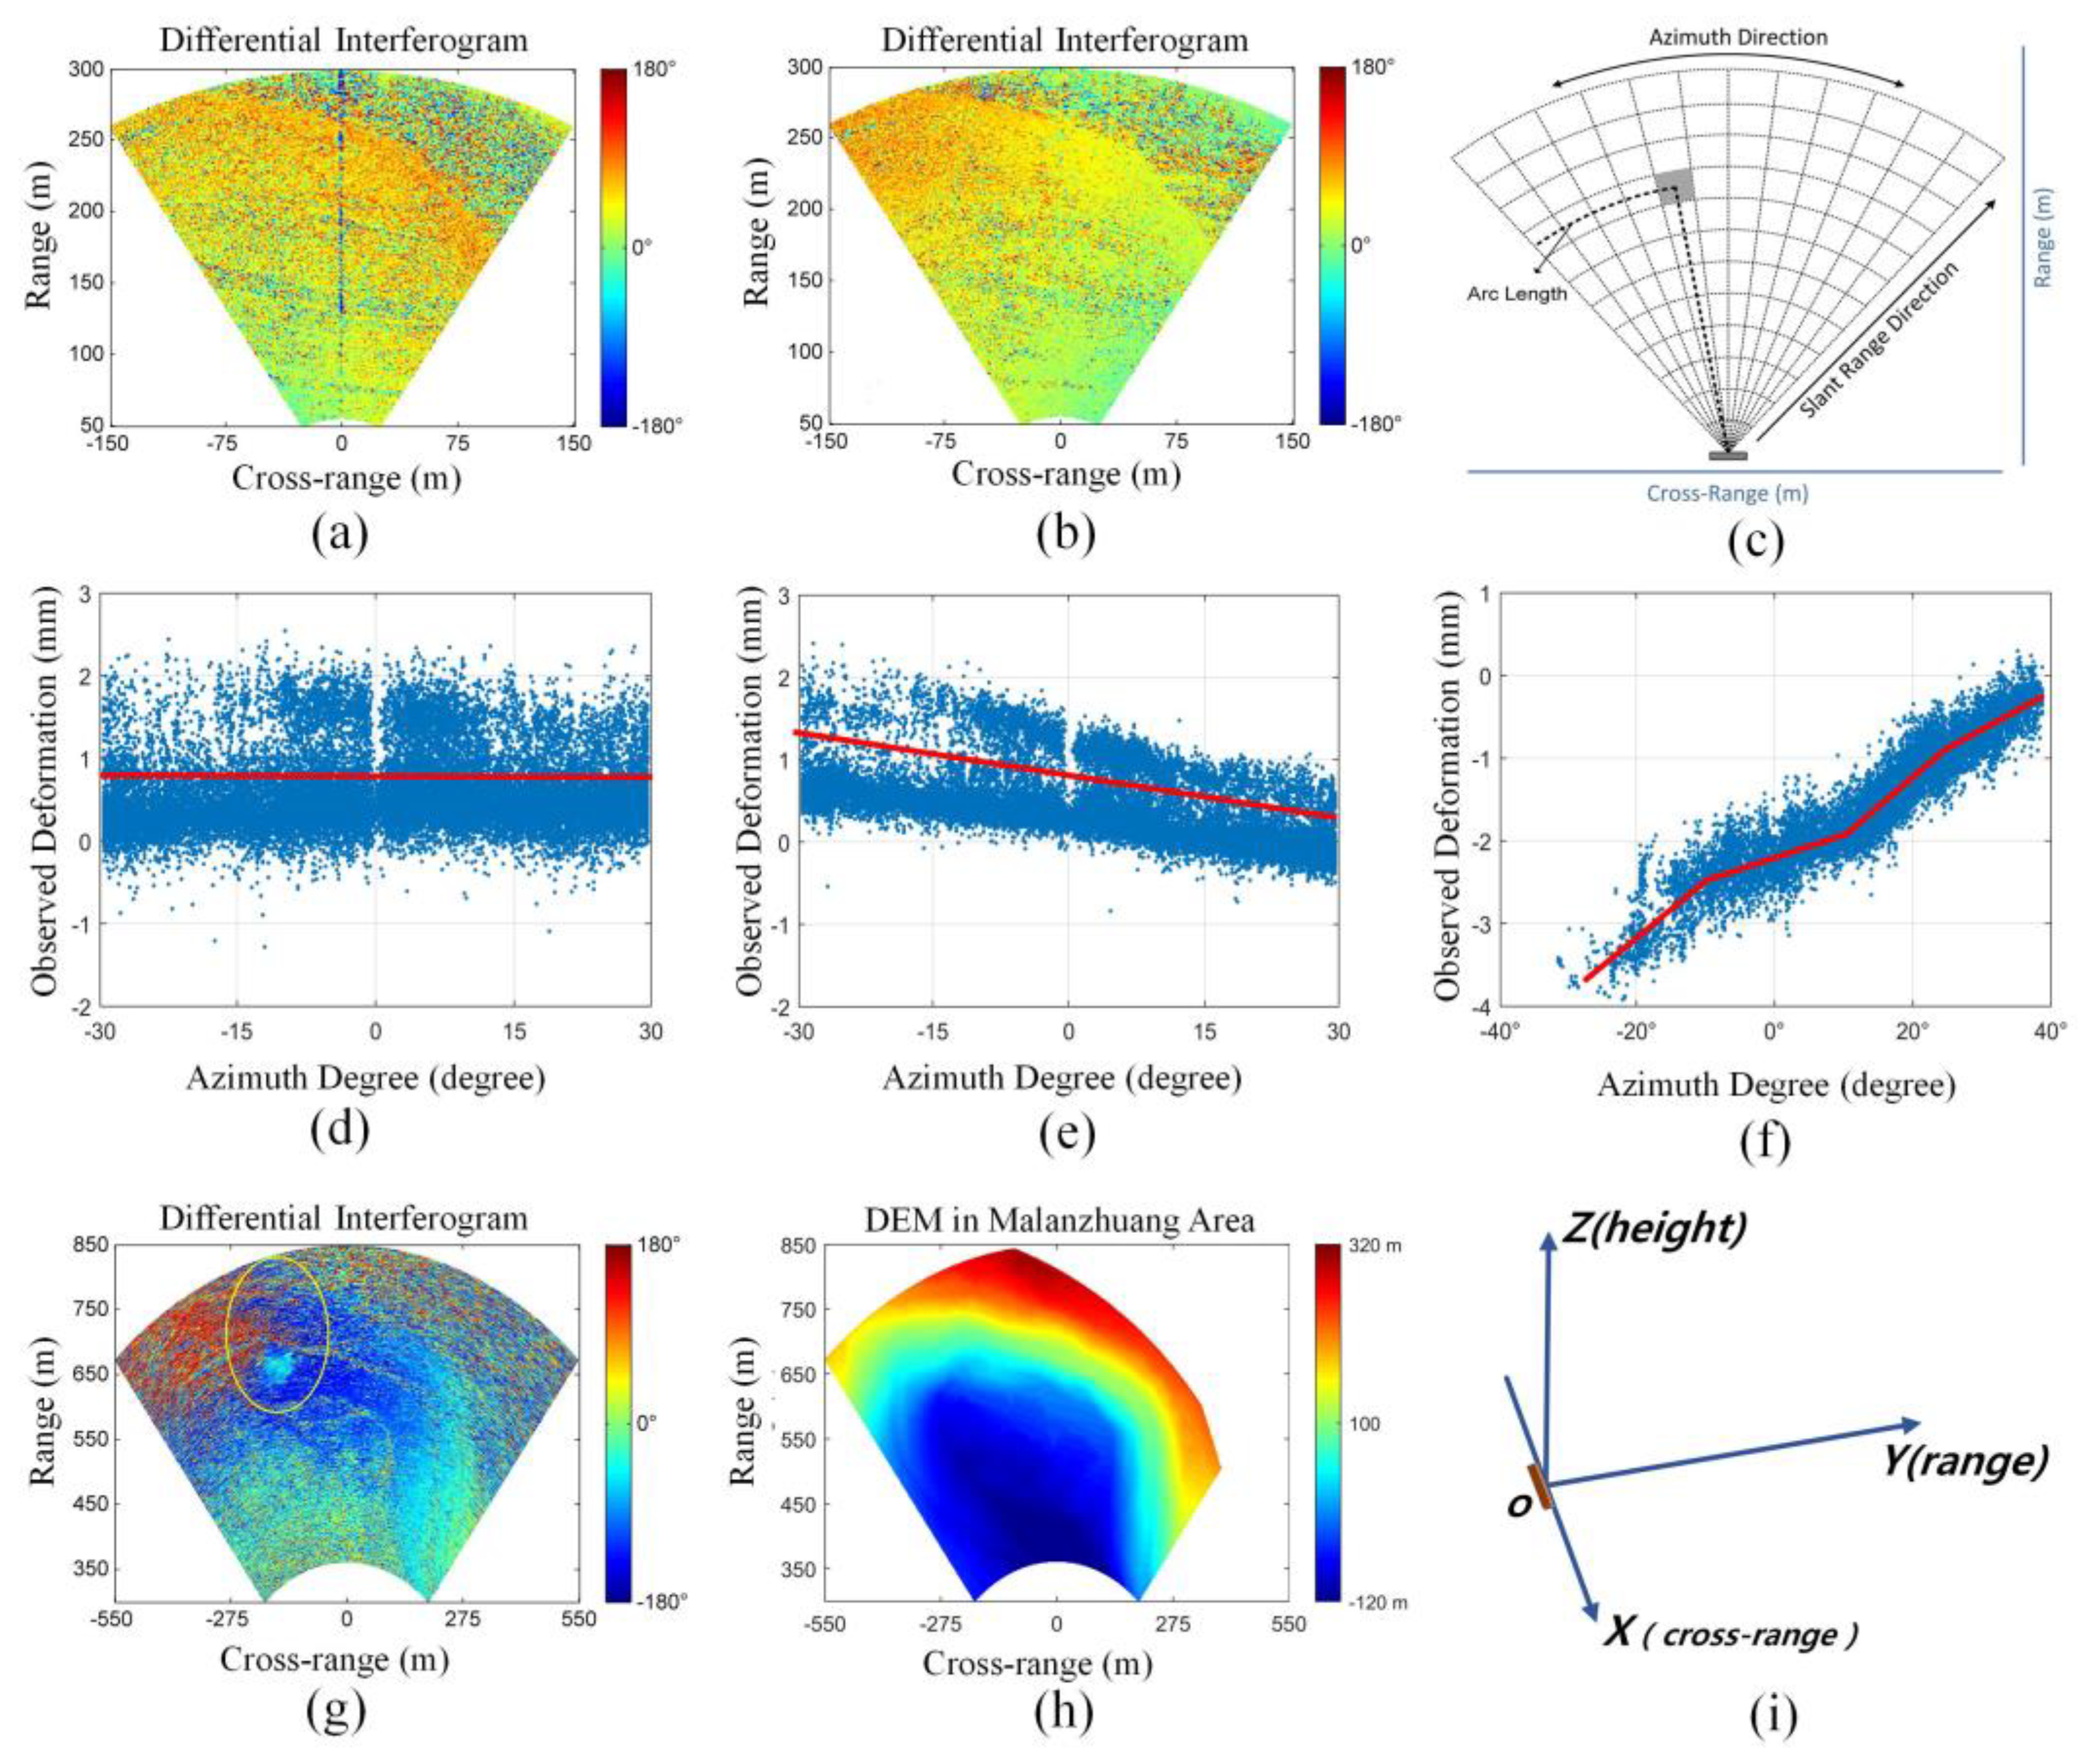
Figure 4a–e shows the 2D observation scenario, where the terrain is relatively flat and the non-homogenous APS is characterized by a linear tread along the azimuth direction under the polar coordinate system. Figure 4a,b shows the interferograms with homogenous and non-homogenous APS, respectively, for the Linjiaping area. The temporal baseline for the interferograms is one hour. Since no deformation happened and orbit error was avoided by the carefully fixed instrument, the interferogram only contained APS. As Figure 4a shows, the APS increased with the slant range but remained the same in the azimuth direction. To illustrate it better, we plotted the phase of some high-quality points along the azimuth direction in Figure 4d. The trend denoted by the red line is flat, indicating that the APS is homogenous in this direction. However, in Figure 4b, the APS increased with the slant range and varied in the azimuth direction. As the phase of high-quality points along the azimuth direction in Figure 4e show, the APS presents a linear trend, indicating that the APS is non-homogenous, which could be caused by wind or turbulence. Therefore, in the 2D observation scenario with a small range and soft terrain, the non-homogenous APS can be treated as having a linear effect along the azimuth direction under the polar coordinate system.
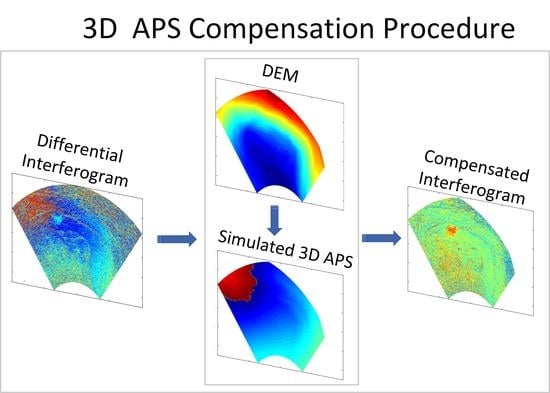
Figure 4f–i shows the 3D observation scenario in the Malanzhuang area, where the terrain is steep. The DEM in the radar coordinate system derived by LiDAR is shown in Figure 4h. The height difference was large, over 200 m. The upper right part of the DEM was vacant, since there was no radar echo from the sky. For the same reason, the simulated APS using DEM for the upper right part was vacant. Figure 4g is the differential interferogram with non-homogenous APS and the temporal baseline of one hour. The interferogram was affected by APS seriously and there were phase reversals, as denoted by the yellow circle. The phase reversals were not along the slant range or height directions, suggesting that the APS was non-homogenous and also affected by other directions, besides the height direction. The phase of some high-quality points along the azimuth direction is plotted in Figure 4f. Nevertheless, affected by the steep terrain and large observation range, the non-homogenous APS tended to be non-linear along the azimuth direction under the polar coordinate system. In order to transfer the non-linear APS correction in the polar coordinate system into a linear problem, we introduced the rectangular coordinate system (X, Y, Z(h)), as illustrated in Figure 4i. The origin of the rectangular coordinate system is defined as the center of the GB-SAR instrument. The X (cross-range) direction is defined as the direction of the GB-SAR rail, and the Y (range) direction is perpendicular to the X and Z (height) directions. We assumed that the APS was non-homogenous in all three directions (not just in height) and the non-linear effect in the polar system was attributable to the coupling of non-homogenous APS in the three directions. Using the rectangular coordinate system, the non-linear problem could be transformed into a linear problem to deal with the non-homogenous APS in the 3D observation scenario.
In the next two parts, the 2D APS model and 3D APS model will be presented to tackle the non-homogenous APS correction problem in 2D and 3D observation scenarios, respectively.

3.2. The 2D Model

The high-frequency electromagnetic wave usually adopted in GB-SAR is prone to atmospheric disturbances. Traditional methods assume the APS is homogenous in the azimuth direction [13,15,16]. However, influenced by the water vapor changes or wind, the atmospheric phase shows slight differences in the azimuth direction [22,26]. This characteristic has also been observed in Linjiaping slope case (see Figure 4a–e), and the APS was linearly variable with the azimuth direction. From Equation (4), we know that the APS directly corresponds to ADC. So, due to the small observation range of GB-SAR and high correlation of atmospheric medium in each azimuth direction, in this paper, we assumed the ADC changes linearly in the azimuth direction under the polar coordinate system. The ADC in each azimuth direction is:
n r , t = n r t + α n α t
where n r and n α are unknown coefficients, α is the azimuth degree of each azimuth direction.
So, Equation (2) is rewritten as:
ϕ a t m i t = 4 π λ 0 r i n r t + α n α t d r
and simplified as:
ϕ a t m i t = 4 π λ n r t r i + α i n α t r i
α i r i is the angle multiplied by the range, which is the arc length, written as r i α in the following, and shown as Arc Length in Figure 4c.
So, Equation (6) can be rewritten as:
ϕ a t m i t = 4 π λ n r t r i + n α t r i α
Then, the phase in the differential interferogram is:
φ a p s i t 12 = 4 π λ n r t 2 n r t 1 r i + n α t 2 n α t 1 r i α + 2 k π
We use β 1 t 12 and β 2 t 12 to represent 4 π λ n r t 2 n r t 1 and 4 π λ n α t 2 n α t 1 , respectively.
Finally, the 2D atmospheric model is:
φ a p s i t 12 = β 1 t 12 r i + β 2 t 12 r i α + 2 k π
Compared with the range-related model (Equation (6)), the 2D model better addressed the non-homogenous APS in the azimuth direction.

3.3. The 3D Model

The 2D model presented in the last part was designed for the 2D observation scenario with soft topography. In this part, a 3D model is presented for the 3D observation scenario with steep topography and large range.
The ADC changes linearly with height in the area with steep topography [16], so the influence of height changes on APS should be taken into consideration in the observation. When the observation is affected by wind or complicated terrains, the atmospheric medium is non-homogenous in the height direction or the horizontal direction, i.e., X, Y directions (shown in Figure 4i), causing non-linear variation under the polar coordinate system (Figure 4f). To solve this problem, we proposed a 3D model to address the non-homogenous APS in the X, Y, and Z directions under the rectangular coordinate (Figure 4i) for transforming the APS correction into a linear problem.
Defining h as the height from the horizontal ground of the GB-SAR instrument, the spatial distribution of the atmospheric delay coefficient n can be modeled as a multilayer medium with the following characteristics [27]:
n h , t = n 0 t exp ( δ h )
where n 0 is the ADC in h = 0, δ is the height scale factor. The first-order Taylor series expansion of the above formula is:
n h , t = n 0 t 1 δ h = n 0 t + n 1 t h
Substituting Equation (14) into Equation (2), the height-related model is as follows [16]:
φ a p s i t 12 = β 1 t 12 r i + β 2 t 12 h i r i + 2 k π
However, for the areas with complicated terrains or affected by wind or turbulence, the atmospheric medium not only changed in the height direction, but also in other directions. Due to the high correlation of atmospheric medium in space, we assume that the ADC also changed linearly in the X direction and Y direction under the rectangular system (Figure 4i):
n h , t = n 0 t + h n 1 t + x n 2 t + y n 3 t
where x and y are the coordinates in the rectangular system.
Substituting Equation (16) into Equation (2), we get:
ϕ a t m i t = 4 π λ 0 r i n 0 t + h i n 1 t + x i n 2 t + y i n 3 t d r
which can be simplified as:
ϕ a t m i t = 4 π λ n 0 t + h i n 1 t + x i n 2 t + y i n 3 t r i
The differential phase of time t 1 and t 2 is:
φ a p s i t 12 = 4 π λ n 0 t 2 n 0 t 1 + h i n 1 t 2 n 1 t 1 + x i n 2 t 2 n 2 t 1 + y i n 3 t 2 n 3 t 1 r i + 2 k π
We use β 1 t 12 , β 2 t 12 , β 3 t 12 and β 4 t 12 to represent 4 π λ n 0 t 2 n 0 t 1 , 4 π λ n 1 t 2 n 1 t 1 , 4 π λ n 2 t 2 n 2 t 1 and 4 π λ n 3 t 2 n 3 t 1 , respectively.
So, Equation (19) can be rewritten as:
φ a p s i t 12 = β 1 t 12 r i + β 2 t 12 h i r + β 3 t 12 x i r i + β 4 t 12 y i r i + 2 k π
This is the 3D model. This model considers the non-homogenous APS in three directions under the rectangular coordinate system. Using the rectangular coordinate system, the 3D model can better address the non-homogenous APS for the 3D observation scenario.

3.4. The APS Compensation

The proposed models, Equations (12) and (20), for dealing with the non-homogenous APS both satisfy a multiple-regression model. The atmospheric phase compensation procedures for the two models are almost the same, except for the coefficient matrix and unknown parameters. Here, we just take the 3D model, Equation (20), as an example to show the correction of the GB-SAR interferometry.
From Equation (20), the unwrapped differential phase φ u n w i at point i is:
φ u n w i = β 1 r i + β 2 h i r i + β 3 x i r i + β 4 y i r = β 1 c 1 i + β 2 c 2 i + β 3 c 3 i + β 4 c 4 i
where c 1 i = r i , c 2 i = h i r i , c 3 i = x i r i and c 4 i = y i r i are the known parameters. The 3D model can be expressed by the matrix as:
ψ = C β + ε
where
ψ = φ u n w 1 φ u n w 2 φ u n w q
C = r 1 r 1 h 1 r 1 x 1 r 1 y 1 r 2 r 2 h 2 r 2 x 2 r 2 y 2 r q r q h q r q x q r q y q = c 11 c 12 c 13 c 14 c 21 c 22 c 23 c 24 c q 1 c q 2 c q 3 c q 4
β = β 1 β 2 β 3 β 4
ε = ε 1 ε 2 ε q
where ψ and ε are q × 1 matrices containing the observed unwrapped phase of q reliable points and random errors, respectively. C is a q × 4 matrix with known variables and β is a 4 × 1 matrix with unknown parameters and can be derived from a least squares regression by:
β = ( C * C ) 1 C * ψ
where * indicates the transposed conjugate of the matrix C . Consequently, the estimated atmospheric phase of the 3D model is given by:
ψ ^ = C β
We use high-quality points to solve the unknown parameters, but the phases of these points are also affected by noise or unexpected deformation, causing biases between the model and the observed phase. Of course, this case is rare. To increase the model accuracy, an unbiased estimator of the difference between the observed phase and estimated phase was adopted to remove the biased points, which is [28]:
σ = | Δ ψ ^ * Δ ψ ^ Δ ψ * Δ ψ | q 3
Then, the points satisfying the following expression will be used for regressing again to obtain the unknown parameters:
| Δ φ ^ i Δ φ i | < 2 σ
For the 2D model, we only need to change the coefficient matrix and unknown parameter according to Equation (22).
Eventually, the compensated phase can be computed by subtracting the estimated atmospheric phase from the observed unwrapped phase.

3.5. GB-SAR Interferometry Chain

The procedure to compensate the APS by the proposed models for GB-SAR interferometry is shown in Figure 5, including interferogram generation, high-quality point selection, APS compensation, and time series analysis. In interferogram generation, for reducing the impact of atmospheric disturbance and redundant observation, the interferograms were formed as the SBAS method [29]. The two nearby SLC images in the time series are used in the interferometry. 2N-3 interferograms can be derived from N SLC images.
The APS compensation and deformation analysis are based on high-quality points (referred to as HQP in Figure 5), such as permanent scatterers or high coherence points. The phase quality for these points is very reliable. In the APS compensation, the high-quality points were assumed to be motionless, as they can reflect the APS truly. APS compensation has no requirement on the number of high-quality points, but the deformation analysis needs as many high-quality points in the deformation zone as possible to reflect the deformation information in detail. Therefore, two different strategies are adopted for selecting the high-quality points for the two tasks. We set the threshold of amplitude deviation index (ADIs) and coherence to get two sets of high-quality points. The intersection of these two sets were used for APS compensation, and the points in the deformation zone are removed. For the deformation analysis, the union set of these two sets was utilized, which can meet the density and quality requirements at the same time. After that, the phase unwrapping of the least square method based on the Delaunay triangle was adopted to process the high-quality points. Then, the APS for 2N-3 interferograms is estimated and compensated. Finally, a traditional SBAS method [29] was used for time series analysis and the deformation time series and accumulated deformation could be derived.

4. Results

To validate the 2D and 3D models, the datasets of the Linjiaping area and the Malanzhuang area, were used, respectively. A cross-comparison analysis between the conventional model and proposed model is also presented. The compensated interferograms were used for the time series analysis over the two areas.

4.1. Atmospheric Correction by the 2D Model

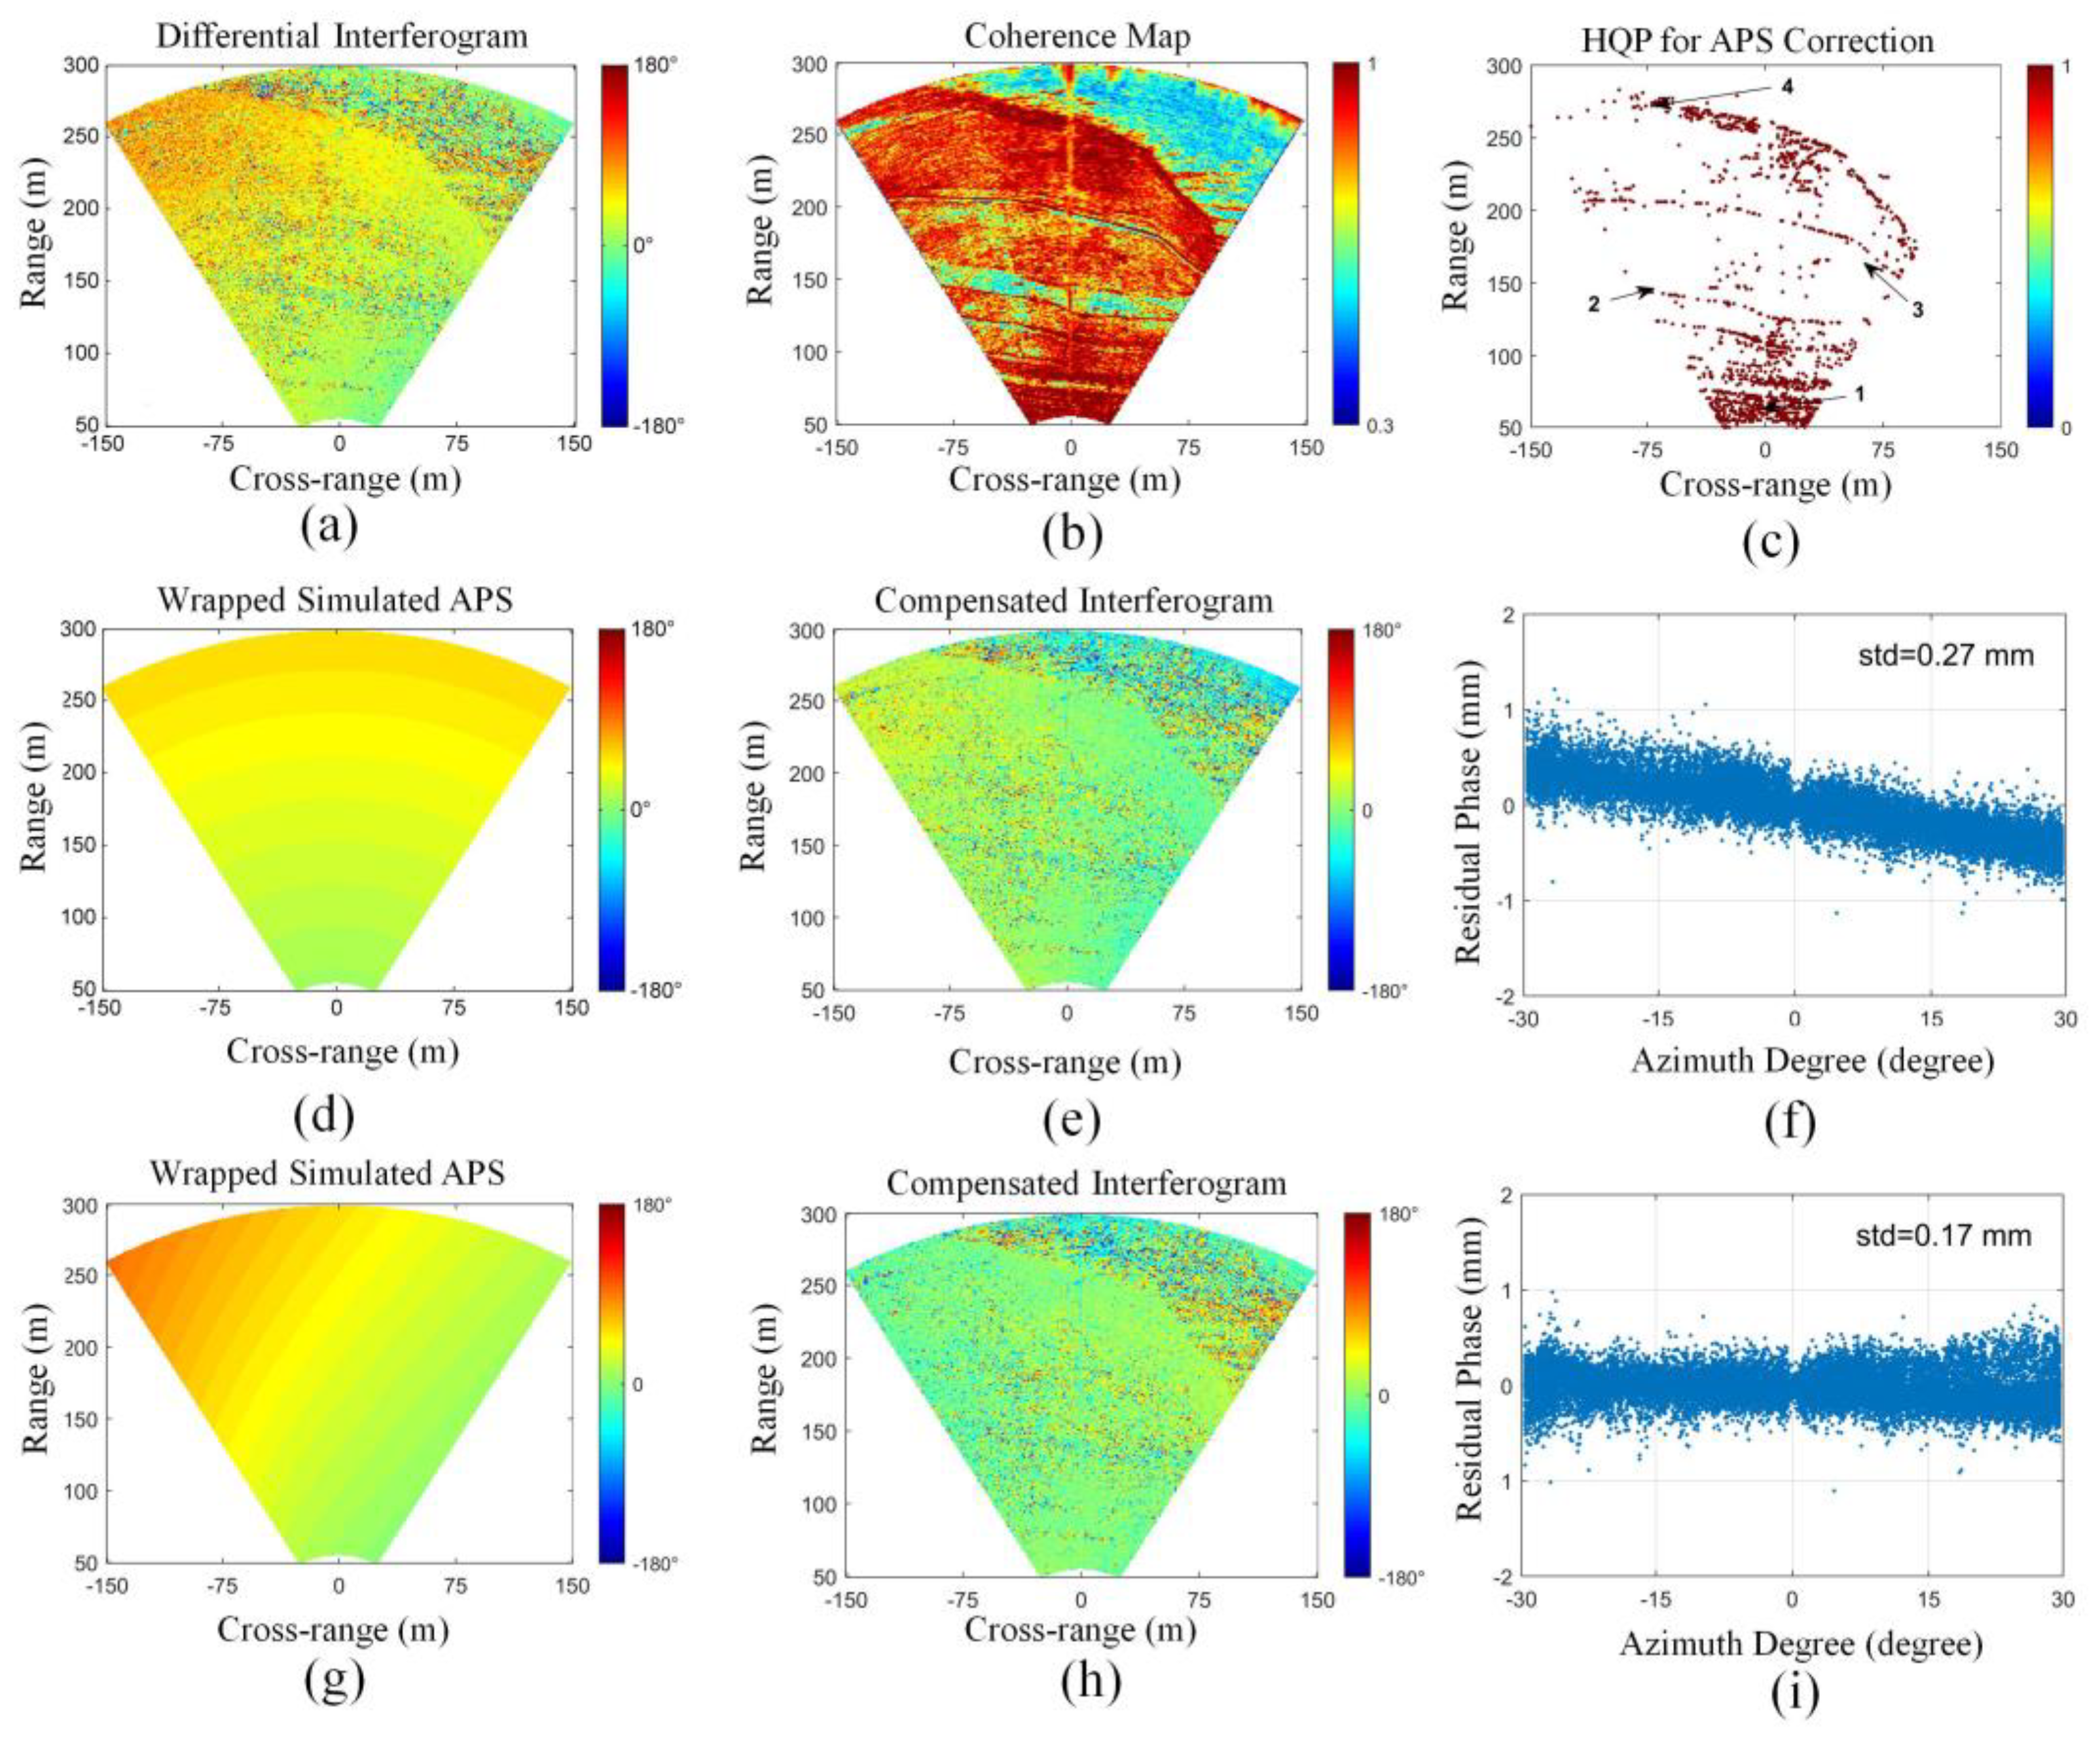
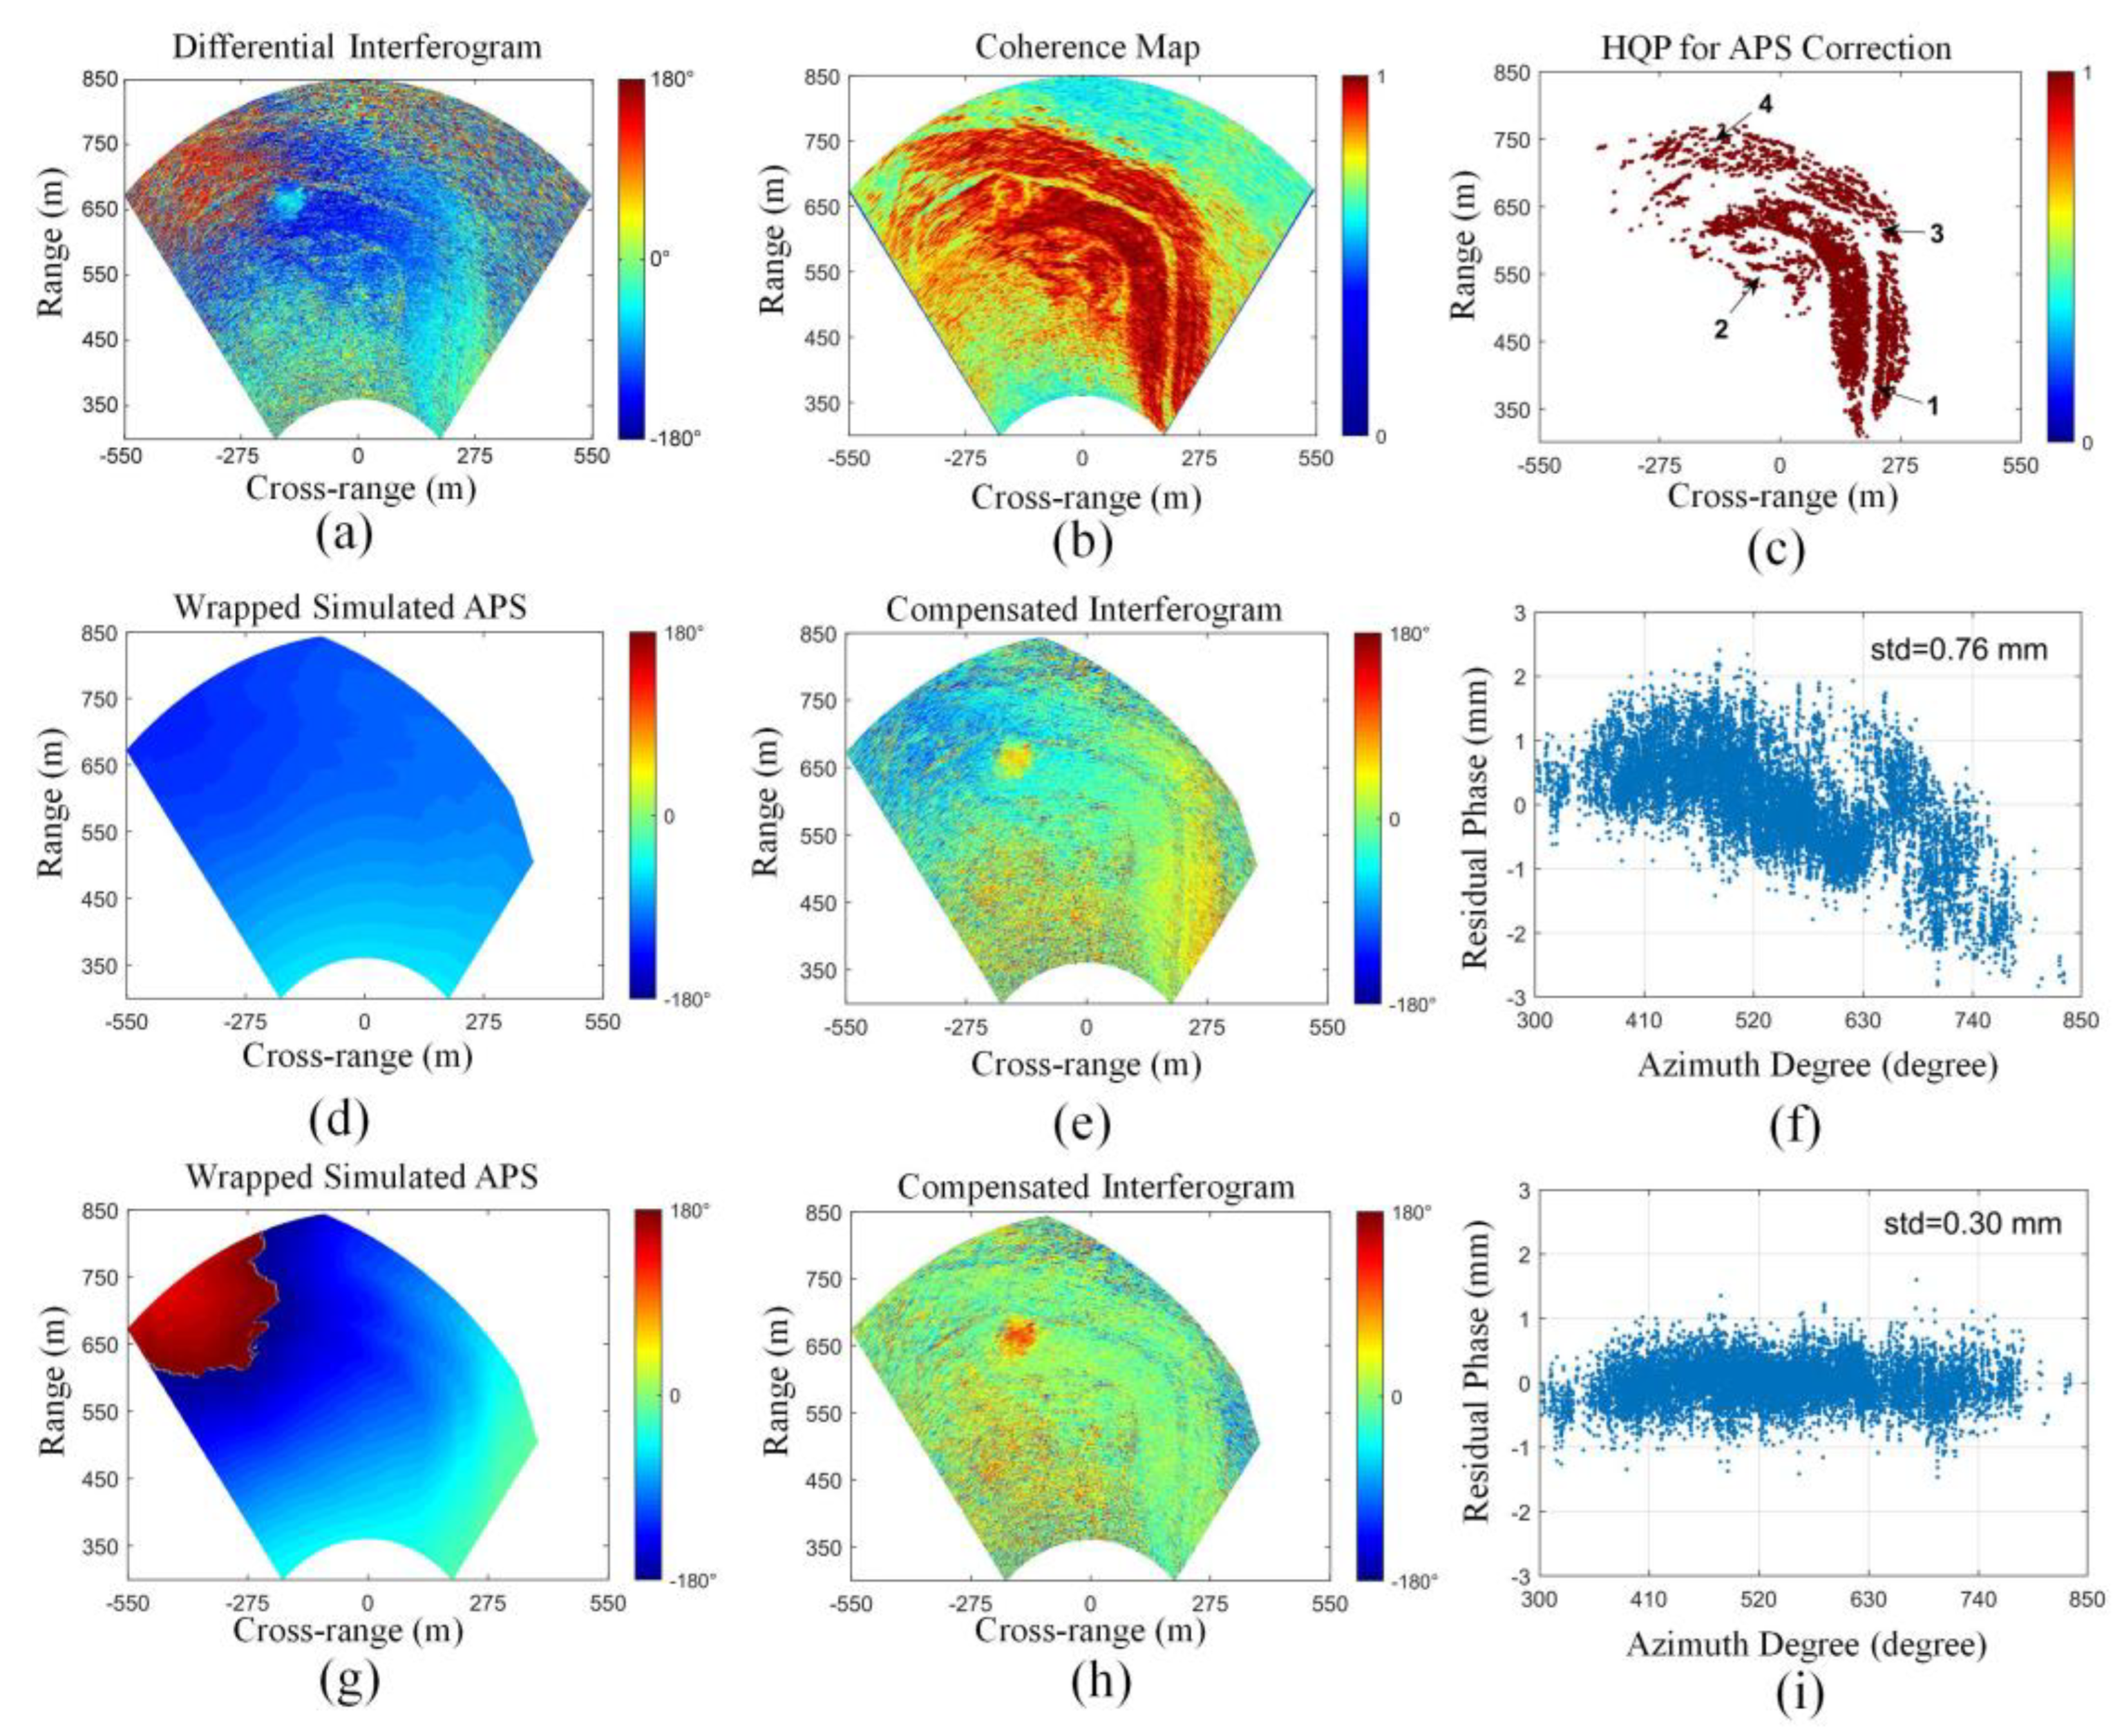
We used the GB-SAR dataset from the Linjiaping railway slope to validate the 2D model, as the observation range was small and the terrain was flat. We collected 48 SLC images with the temporal baseline of one hour to form 93 interferograms. The thresholds of ADIs and coherence (Figure 6b) were calculated, which were 0.1 and 0.98, respectively, to select high-quality points and form two sets. Then, 16,087 high-quality points were selected from the intersection of the two sets (Figure 6c). One interferogram (see Figure 4b and Figure 6a) was chosen to validate the 2D model.
We compare the 2D model with the range-related model (Equation (6)). Figure 6d–f shows the simulated APS, the compensated interferogram, and the residual phase (compensated phase) along the azimuth direction for the range-related model, respectively. Figure 6g–i shows those of the 2D model. The standard deviation of the residual phases of the two models were calculated to assess the accuracy (Figure 6f,i). The APS simulated by the 2D model was more consistent with the phase in the interferogram than that of the range-related model (Figure 6d,g). The range-related model was based on the assumption of APS homogeneity, so the APS in different azimuth degrees was considered the same, which makes the interferogram over-corrected in the azimuth degree of 0°~−30° and under-corrected in 0°~30° (Figure 6f). However, the residue phase of the 2D model was constant in the azimuth direction (Figure 6i), neither over- nor under-corrected, which means the APS was accurately corrected. Furthermore, the standard deviation for the range-related model and the 2D model were 0.27 and 0.17 mm, respectively, which also shows the higher accuracy of the 2D model.

4.2. Time Series Analysis for the Linjiaping Area

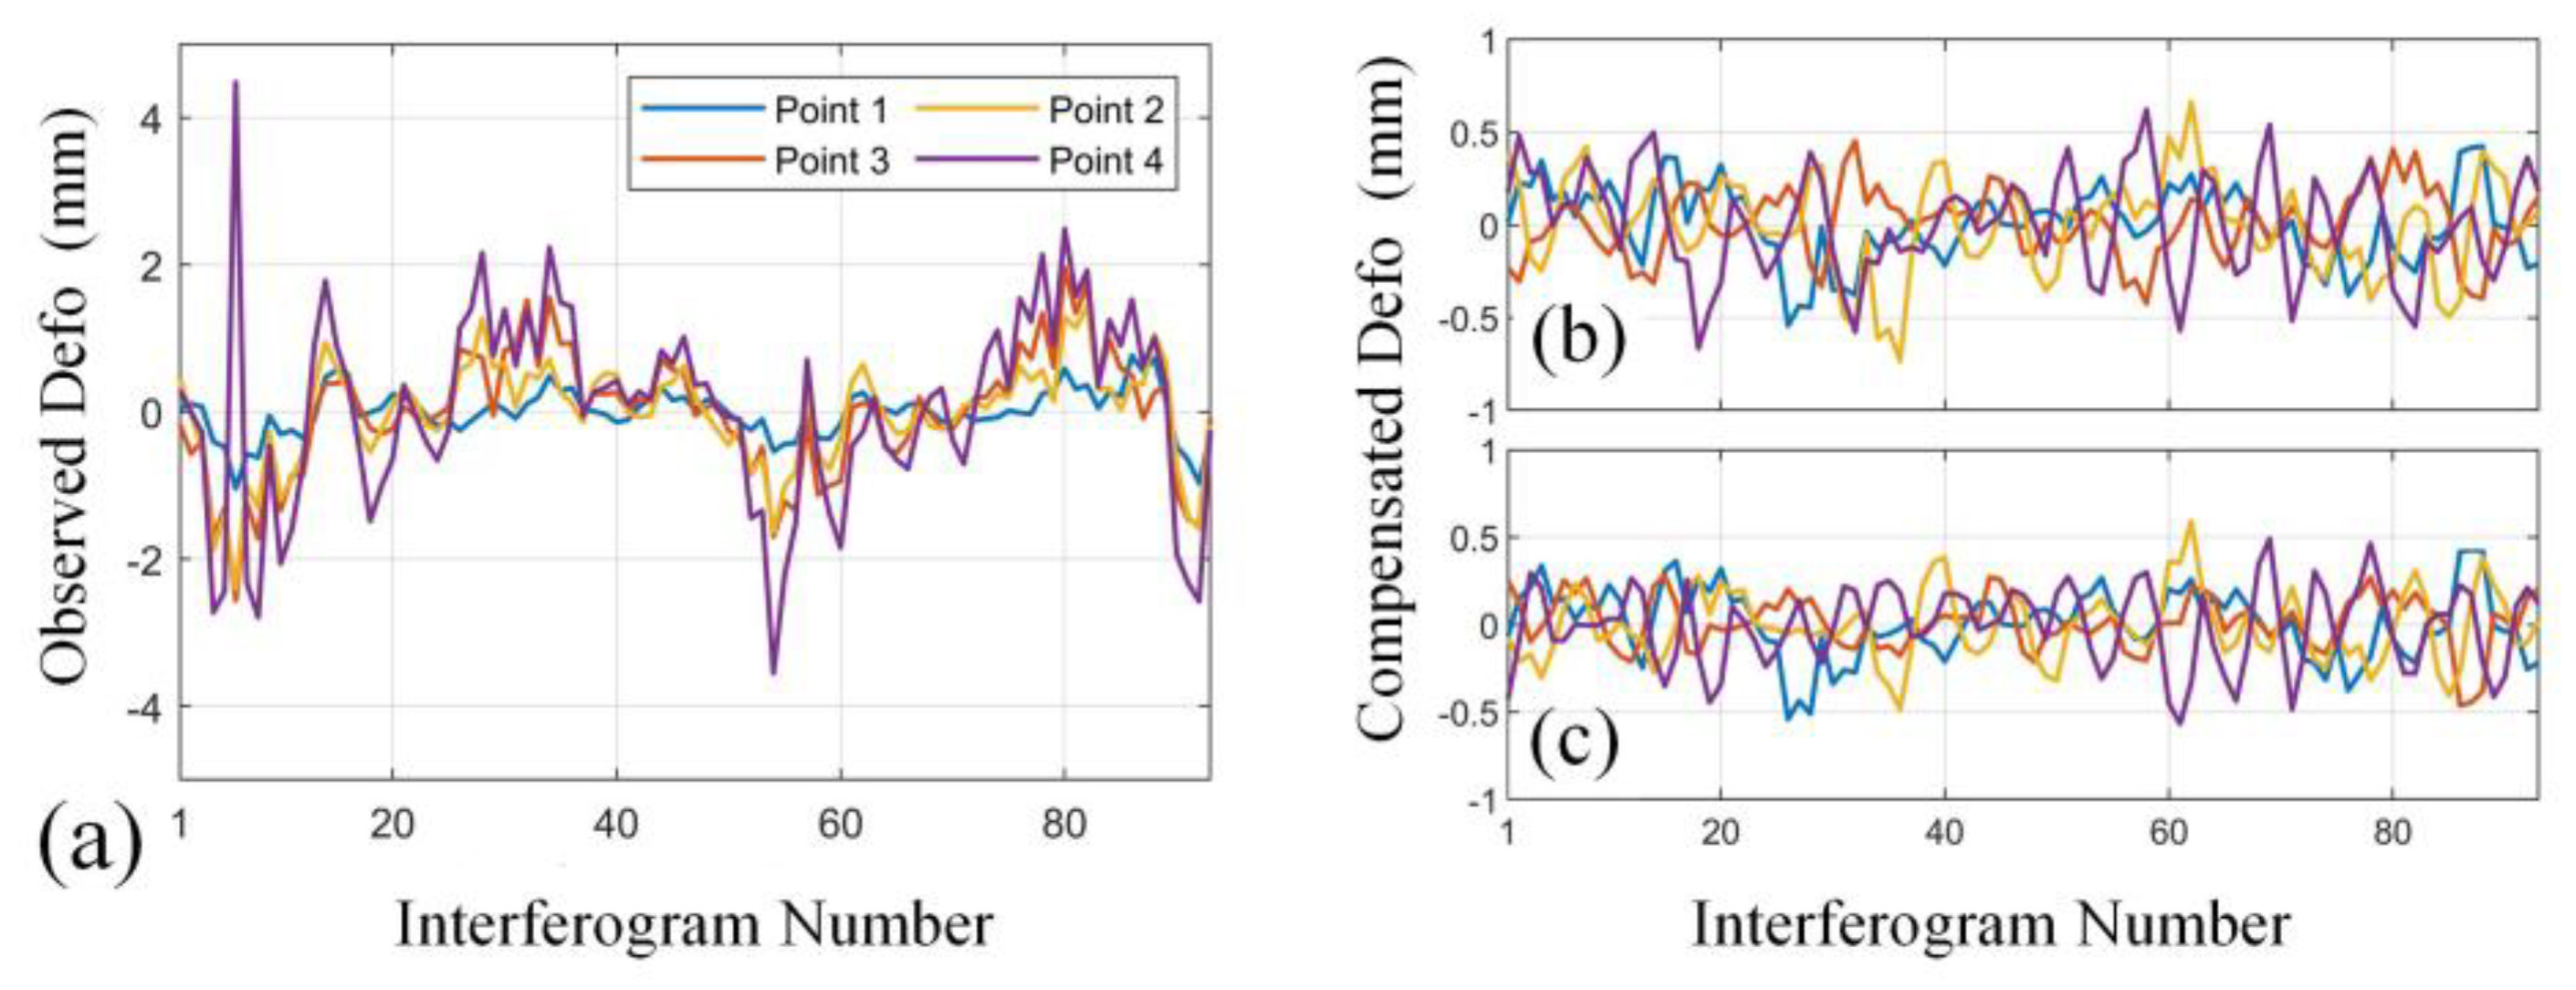
For time series analysis, all the 93 interferograms were compensated by the 2D model and the range-related model separately. Four points in Figure 6c were chosen to compare the accuracy. The interferometric phase of the four points is shown in Figure 7a and the phase compensated by the range-related model and the 2D model are shown in Figure 7b,c, respectively. The standard deviations of the residual phase for the four points in the time series are listed in Table 3. The compensation accuracy of the four points was improved by the 2D model to different degrees. For Point 1, located in the near range, the accuracy of the two models was similar, because the influence of non-homogenous APS was not obvious in the near range (about 50 m). For the rest three points, the improvement was larger due to the farther range.
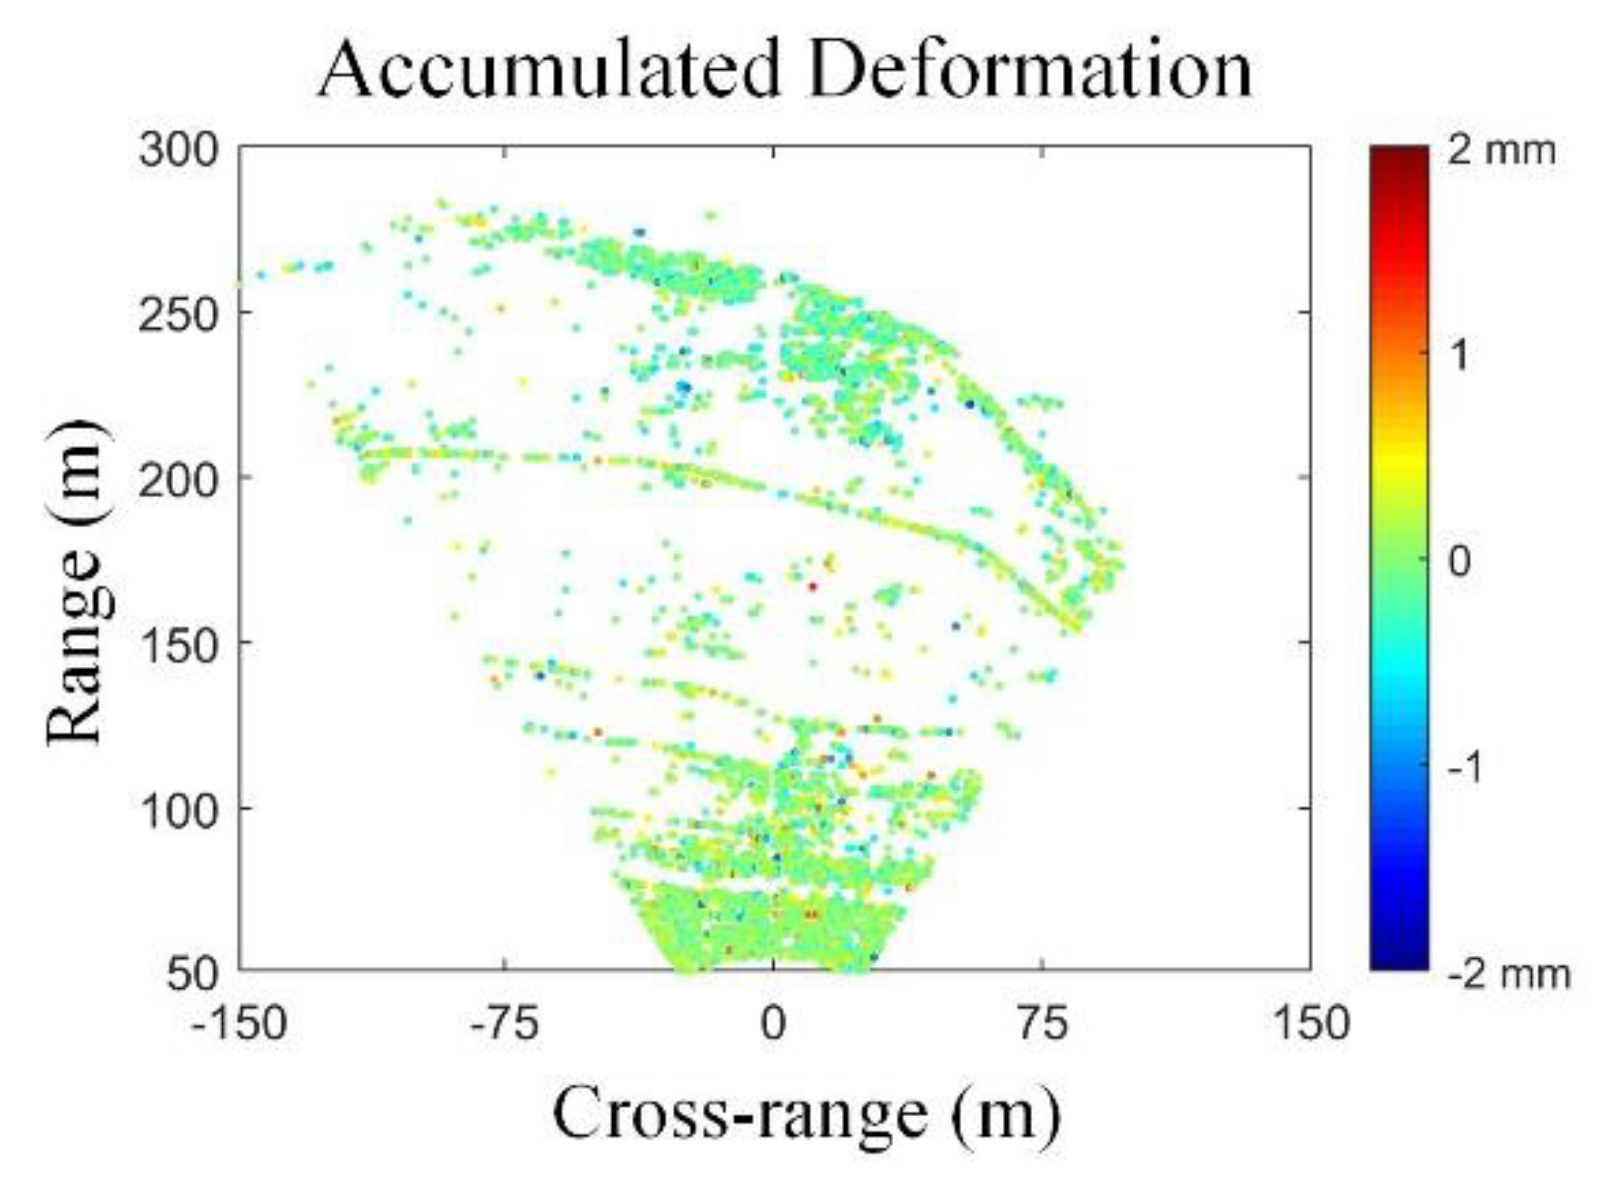
Then, 56,993 high-quality points were chosen for the deformation analysis. The deformation time series was calculated. As Figure 8 shows, the accumulated deformation was almost within 1 mm, which was consistent with the information we have mentioned in Section 2 that there was no deformation in the slope.

4.3. Atmospheric Correction by the 3D Model

In the areas with a large range or complicated topography, the APS was complicated. In Section 3, we used an interferogram (Figure 4g) of the Malanzhuang area as an example to show the influence of non-homogenous APS. In this section, we use the same interferogram (Figure 9a) to validate the 3D model. In total, 287 interferograms were derived from the SLC images. The high-quality points (13,405 pints) for APS correction (Figure 9c) were selected by the threshold of 0.12 for ADIs and 0.98 for coherence (see Figure 9b). For validation, we compared the 3D model results with the height-related model (Equation (15)) results. The wrapped simulated atmospheric phase and compensated interferogram of the height-related model are shown in Figure 9d,e, respectively. The residual phase of the height-related model is shown in Figure 9f and the standard deviation was 0.76 mm. The compensation was not successful, because there was over-correction and under-correction in the upper-left part and bottom-right part in Figure 9e. Some residual phase values in Figure 9f were bigger than 1 mm, which cannot satisfy the accuracy requirement of GB-SAR. The wrapped simulated atmospheric phase and compensated interferogram by the 3D model are shown in Figure 9g,h, respectively. The phase simulated by the 3D model was consistent with the APS in the interferogram, and the positions of phase reversals were nearly the same. The residual phase of the high-quality points is shown in Figure 9i. The standard deviation was 0.30 mm, much smaller than that of the height-related model. The residual phase for the 3D model was almost within 1 mm and it was a great improvement over the height-related model. The 3D model considers the non-homogenous APS in three directions, so it achieved a better result.

4.4. Time Series Analysis for the Malanzhuang Area

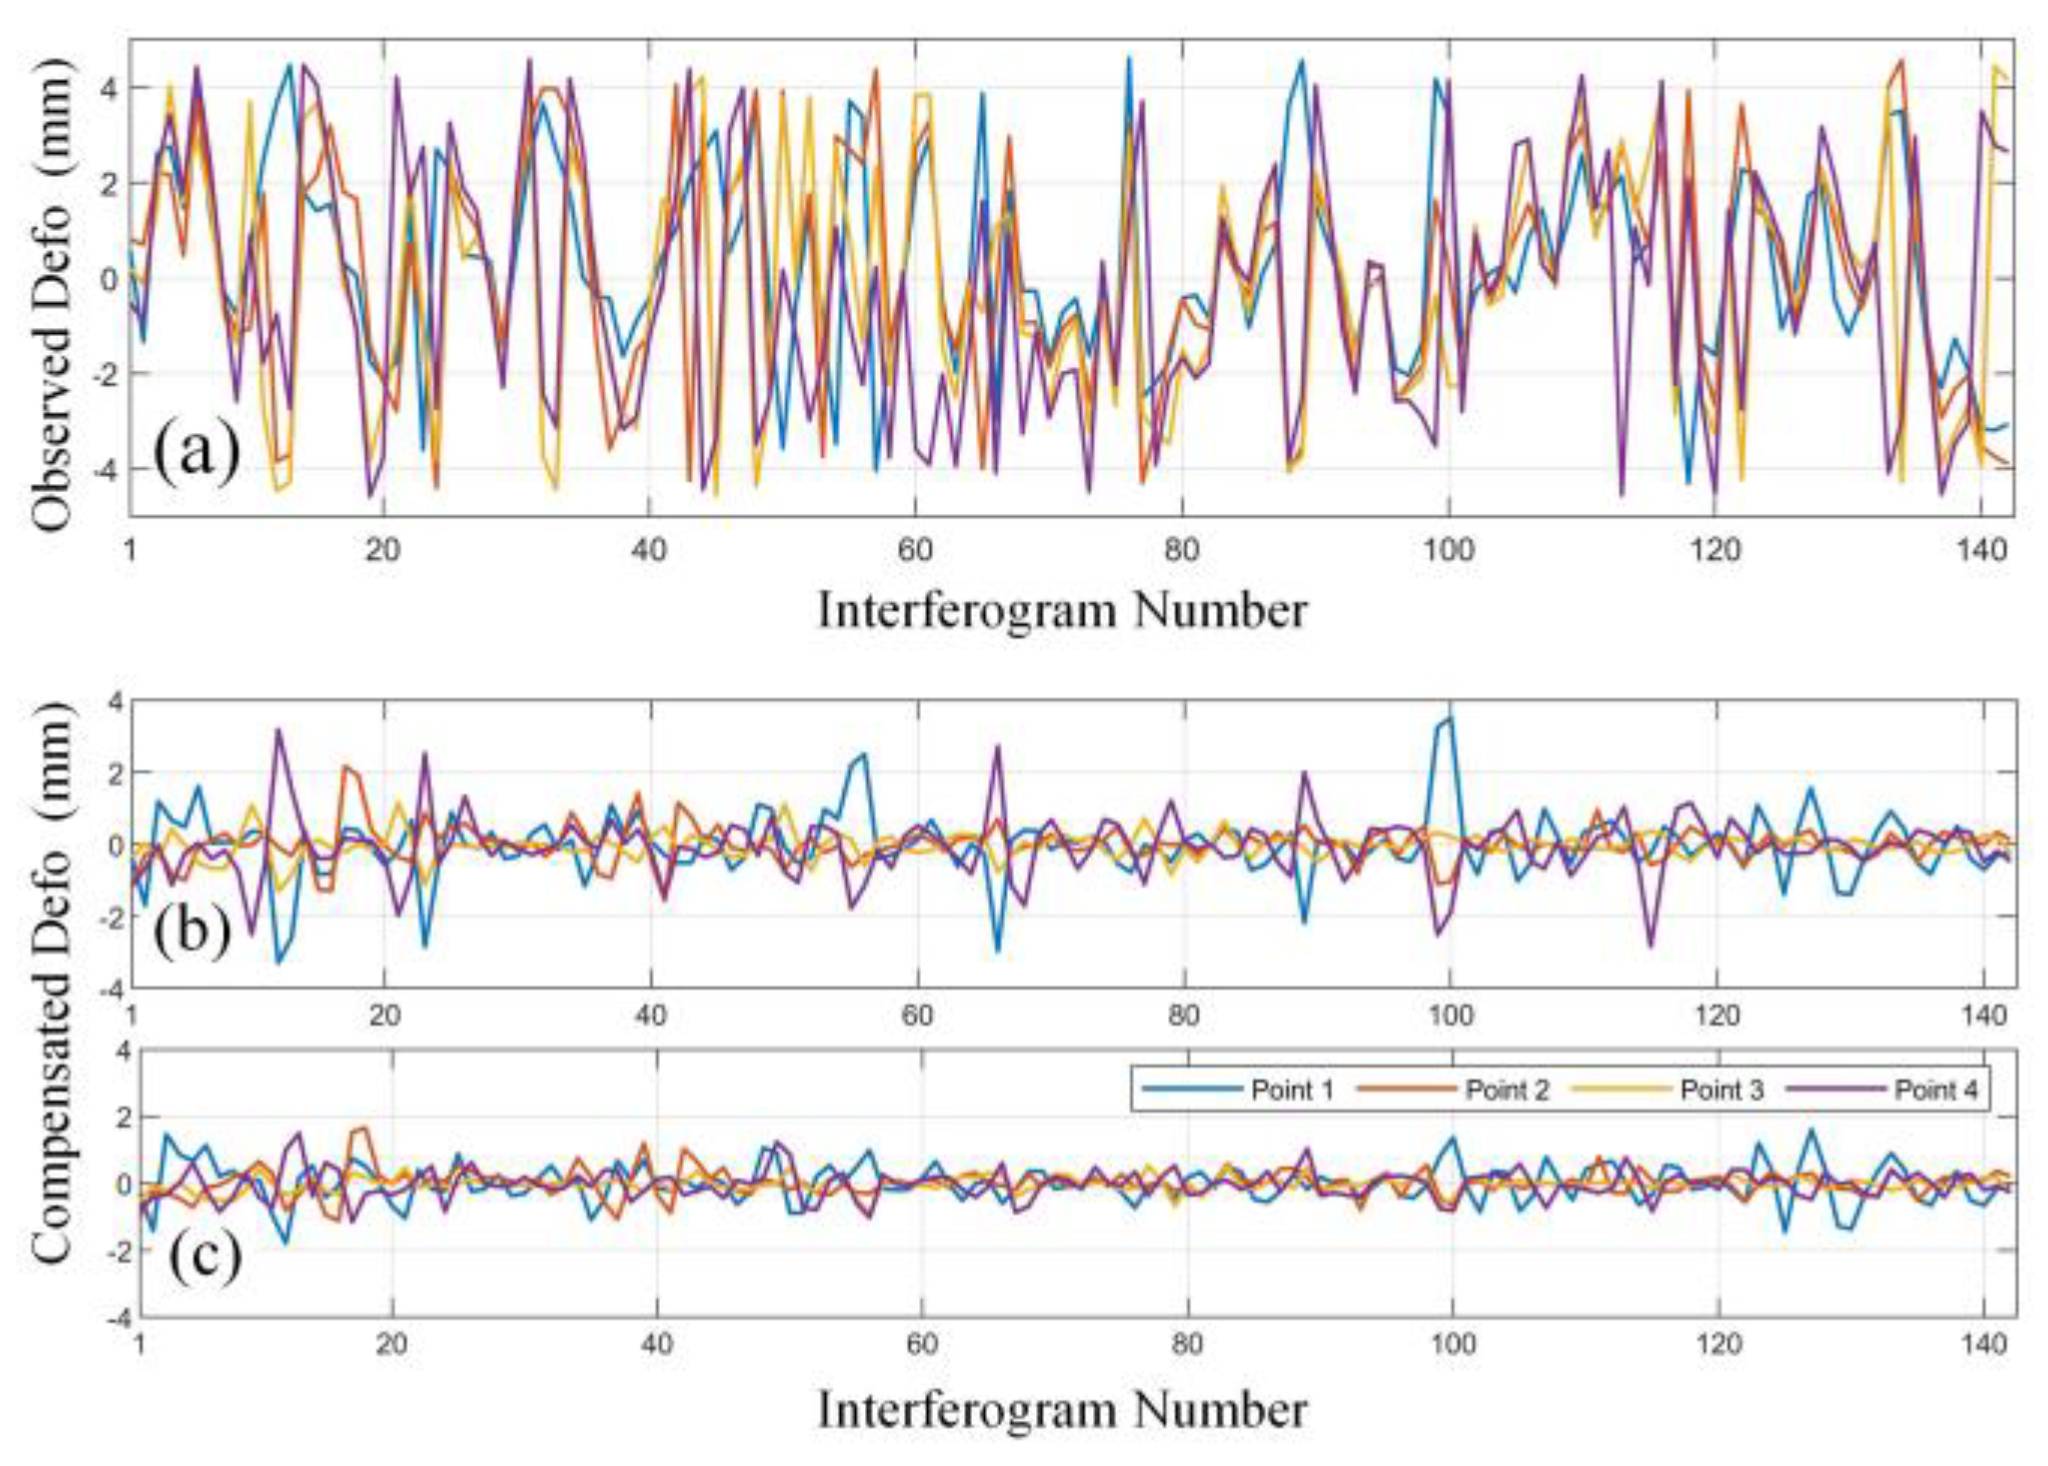
We compensated for the 287 interferograms by the 3D model for time series analysis. We also selected four stable points in Figure 10c to compare the compensation accuracy with that of the height-related model (Figure 10). For simplicity, we only show half of the interferograms. The standard deviation of the four points is listed in Table 4. The 3D model had higher accuracy than the height-related model for all the four points, especially for Point 1 and Point 4 that were over- or under-corrected by the height-related model (Figure 9e).
We selected 48,735 high-quality points for deformation analysis. The accumulated deformation in the Malanzhuang area is shown in Figure 11a, and the biggest deformation reached 94 mm. Three points were chosen from different areas to analyze the deformation (Figure 11b). Point A located in the bottom part of the slope was stable. The deformation at this point was around zero during the observation duration. Point B is in the middle of the slope, which shows deformation in a short time (three hours) before becoming stable. The deformation was 11 mm. Point C was located in the deformation zone, which moves continuously during the whole observation period with the accumulated deformation of 85 mm. The deformation map was projected into a 3D terrain cloud to identify the location of the deformation zone (Figure 12). The deformation pattern at these three points was consistent with the field investigation [20]. In the open-pit, daily blasting led to strong vibrations. Then, deformation happened in the vulnerable place on the slope.

5. Discussion

In this article, two models for non-homogenous atmospheric correction of GB-SAR are proposed. The proposed models consider the non-homogenous atmospheric phase in the azimuth direction or horizontal direction respectively. The two models are based on different coordinate systems because they are focused on different types of non-homogenous APS. To show the difference between the proposed models and conventional models, Table 5 lists the conventional models and proposed models, including their coordinate systems and the types of APS that they aim to solve. The first and second models in Table 5 pay attention to the homogenous APS. The rest of the models address the non-homogenous APS in one or several directions under different coordinates. Under the polar coordinate system, ADC can be divided by slant range or azimuth direction, the conventional quadratic model φ = β 1 r + β 2 r 2 and the 2D model consider the non-homogenous APS along slant range and azimuth direction, respectively. Under the rectangular coordinate system, the height-related model φ = β 1 r + β 2 h r considers the non-homogenous APS affected by height, whereas the 3D model further addresses the non-homogenous APS in the other directions. The 2D and 3D models consider the other non-homogenous APS conditions in their respective coordinate systems, which helps to broaden the application of model-based approaches.

6. Conclusions

This paper presents 2D and 3D model-based approaches for the non-homogenous atmospheric compensation in the azimuth and horizontal directions. The 2D atmospheric compensation model is designed for the 2D observation scenario with soft topography and a small range, based on the polar coordinate system. The experiment in the Linjiaping area shows that the 2D model can achieve a higher accuracy than the conventional model. The 3D atmospheric compensation model is designed for the 3D observation scenario with steep topography and large range, based on the rectangular coordinate system, which deals with the non-homogenous atmosphere in all three directions. The experiment in the Malanzhuang area validates the effectiveness of the 3D model and demonstrates the great improvement of the 3D model over the conventional model. The results demonstrate that the proposed approaches can enhance the accuracy of GB-InSAR atmospheric compensation, leading to great improvements in slope deformation estimation.
Extreme weather or very special terrain may cause non-homogenous APS in a local place, which is very difficult to compensate. Future research could focus on the correction of the APS in such cases.

Author Contributions

Conceptualization, J.L. and H.Y.; methodology, J.L.; validation, J.L. and H.Y.; formal analysis, T.L.; investigation, J.L.; resources, H.Y.; writing—original draft preparation, J.L.; writing—review and editing, L.X.; supervision, H.Y.; funding acquisition, H.Y. All authors have read and agreed to the published version of the manuscript.

Funding

National Natural Science Foundation of China: 61427802, National Natural Science Foundation of China: 41330634, 41374016, National Natural Science Foundation of China: 41804027, the Open Fund of State Key Laboratory of Coal Resources and Safe Mining: SKLCRSM20KFA12, the Science and Technology Project of the State Grid (Research and Application on Intelligent Monitoring and Early Warning Technology of Geological Hazards for Power Transmission Line Based on InSAR): GCB17201700121.

Conflicts of Interest

The authors declare no conflict of interest.

References

  1. Ferretti, A.; Prati, C.; Rocca, F. Permanent scatterers in SAR interferometry. IEEE Trans. Geosci. Remote Sens. 2001, 39, 8–20. [Google Scholar] [CrossRef]
  2. Pieraccini, M.; Casagli, N.; Luzi, G.; Tarchi, D.; Mecatti, D.; Noferini, L.; Atzeni, C. Landslide monitoring by ground-based radar interferometry: A field test in Valdarno (Italy). Int. J. Remote Sens. 2003, 24, 1385–1391. [Google Scholar] [CrossRef]
  3. Leva, D.; Nico, G.; Tarchi, D.; Fortuny-Guasch, J.; Sieber, A. Temporal analysis of a landslide by means of a ground-based SAR interferometer. IEEE Trans. Geosci. Remote Sens. 2003, 41, 745–752. [Google Scholar] [CrossRef]
  4. Noferini, L.; Mecatti, D.; Macaluso, G.; Pieraccini, M.; Atzeni, C. Monitoring of Belvedere Glacier Using a Wide Angle GB-SAR Interferometer. J. Appl. Geophys. 2009, 68, 289–293. [Google Scholar] [CrossRef]
  5. Pipia, L.; Aguasca, A.; Fabregas, X.; Mallorqui, J.J.; Marturia, J. Mining Induced Subsidence Monitoring in Urban Areas with a Ground-Based SAR. In Proceedings of the 2007 Urban Remote Sensing Joint Event, Paris, France, 11–13 April 2007. [Google Scholar]
  6. Hu, J.; Guo, J.; Xu, Y.; Zhou, L.; Zhang, S.; Fan, K. Differential Ground-Based Radar Interferometry for Slope and Civil Structures Monitoring: Two Case Studies of Landslide and Bridge. Remote Sens. 2019, 11, 2887. [Google Scholar] [CrossRef] [Green Version]
  7. Nolesini, T.; Frodella, W.; Bianchini, S.; Casagli, N. Detecting Slope and Urban Potential Unstable Areas by Means of Multi-Platform Remote Sensing Techniques: The Volterra (Italy) Case Study. Remote Sens. 2016, 8, 746. [Google Scholar] [CrossRef] [Green Version]
  8. Sabine, R.; Gwendolyn, L.; Gerstenecker, C.; Becker, M. Monitoring of displacements with ground-based microwave interferometry: IBIS-S and IBIS-L. J. Appl. Geod. 2010, 4, 41–54. [Google Scholar]
  9. Rödelsperger, S. Real-Time Processing of Ground Based Synthetic Aperture Radar (GB-SAR) Measurements. Ph.D. Thesis, Technische Universität Darmstadt, Darmstadt, Genmany, 2011. [Google Scholar]
  10. Iannini, L.; Guarnieri, A.M. Atmospheric Phase Screen in Ground-Based Radar: Statistics and Compensation. IEEE Geosci. Remote Sens. Lett. 2011, 8, 537–541. [Google Scholar] [CrossRef] [Green Version]
  11. Pipia, L.; Fabregas, X.; Aguasca, A.; Lopez-Martinez, C. Atmospheric Artifact Compensation in Ground-Based DInSAR Applications. IEEE Geosci. Remote Sens. Lett. 2008, 5, 88–92. [Google Scholar] [CrossRef]
  12. Long, S.; Tong, A.; Yuan, Y.; Li, Z.; Wu, W.; Zhu, C. New Approaches to Processing Ground-based SAR (GBSAR) Data for Deformation Monitoring. Remote Sens. 2018, 10, 1936. [Google Scholar] [CrossRef] [Green Version]
  13. Luzi, G.; Pieraccini, M.; Mecatti, D.; Noferini, L.; Guidi, G.; Moia, F.; Atzeni, C. Ground-Based Radar Interferometry for Landslides Monitoring: Atmospheric and Instrumental Decorrelation Sources on Experimental Data. IEEE Trans. Geosci. Remote Sens. 2004, 42, 2454–2466. [Google Scholar] [CrossRef]
  14. Zha, Z.; Yang, Y.; Chen, X.; Long, K.; Wan, Q. An Improved Atmospheric Phase Compensation Approach to Ground-based SAR Interferometry for Landslide Monitoring. J. Phys. Conf. Ser. 2019, 1169, 012031. [Google Scholar] [CrossRef]
  15. Noferini, L.; Pieraccini, M.; Mecatti, D.; Luzi, G.; Atzeni, C.; Tamburini, A.; Broccolato, M. Permanent scatterers analysis for atmospheric correction in ground-based SAR interferometry. IEEE Trans. Geosci. Remote Sens. 2005, 43, 1459–1471. [Google Scholar] [CrossRef]
  16. Iglesias, R.; Fabregas, X.; Aguasca, A.; Mallorqui, J.J.; Lopez-Martinez, C.; Gili, J.A.; Corominas, J. Atmospheric Phase Screen Compensation in Ground-Based SAR with a Multiple-Regression Model Over Mountainous Regions. IEEE Trans. Geosci. Remote Sens. 2014, 52, 2436–2449. [Google Scholar] [CrossRef]
  17. Zhao, X.; Lan, H.; Li, L.; Zhang, Y.; Zhou, C. A Multiple-Regression Model Considering Deformation Information for Atmospheric Phase Screen Compensation in Ground-Based SAR. IEEE Trans. Geosci. Remote Sens. 2020, 58, 777–789. [Google Scholar] [CrossRef]
  18. Liu, J.; Yang, H.; Cai, J.; Zhao, B.; Peng, J.; Gao, Z.; Yang, W. Validation of the phase difference method for atmospheric correction in GB-SAR. J. Spat. Sci. 2020, 1–14. [Google Scholar] [CrossRef]
  19. Falabella, F.; Perrone, A.; Stabile, T.A.; Pepe, A. Atmospheric Phase Screen Compensation on Wrapped Ground-Based SAR Interferograms. IEEE Trans. Geosci. Remote Sens. 2021, 15, 1–15. [Google Scholar] [CrossRef]
  20. Yang, H.; Liu, J.; Peng, J.; Wang, J.; Zhao, B.; Zhang, B. A method for GB-InSAR temporal analysis considering the atmospheric correlation in time series. Nat. Hazards 2020, 104, 1465–1480. [Google Scholar] [CrossRef]
  21. Hu, C.; Deng, Y.; Tian, W.; Zhao, Z. A Compensation Method for a Time–Space Variant Atmospheric Phase Applied to Time-Series GB-SAR Images. Remote Sens. 2019, 11, 2350. [Google Scholar] [CrossRef] [Green Version]
  22. Huang, Z.; Sun, J.; Li, Q.; Tan, W.; Huang, P.; Qi, Y. Time- and Space-Varying Atmospheric Phase Correction in Discontinuous Ground-Based Synthetic Aperture Radar Deformation Monitoring. Sensors 2018, 18, 3883. [Google Scholar] [CrossRef] [Green Version]
  23. Karunathilake, A.; Sato, M. Atmospheric Phase Compensation in Extreme Weather Conditions for Ground-Based SAR. IEEE J. Sel. Top. Appl. Earth Obs. Remote Sens. 2020, 13, 3806–3815. [Google Scholar] [CrossRef]
  24. Izumi, Y.; Zou, L.; Kikuta, K.; Sato, M. Iterative Atmospheric Phase Screen Compensation for Near-Real-Time Ground-Based InSAR Measurements over a Mountainous Slope. IEEE Trans. Geosci. Remote Sens. 2020, 58, 5955–5968. [Google Scholar] [CrossRef] [Green Version]
  25. Izumi, Y.; Nico, G.; Sato, M. Time-Series Clustering Methodology for Estimating Atmospheric Phase Screen in Ground-Based InSAR Data. IEEE Trans. Geosci. Remote Sens. 2021. [Google Scholar] [CrossRef]
  26. Zhou, X. Research on The Theory and Method of Environment Correction and Data Processing of GB-SAR. Ph.D. Thesis, Wuhan University, Wuhan, China, 2015. [Google Scholar]
  27. Hall, M. Effects of the Troposphere on Radio Communications. Annales Des Télécommunications 1980, 8, 298–299. [Google Scholar]
  28. Montgomery, D.C.; Runger, G.C. Applied Statistics and Probability for Engineers, 3rd ed.; John Wiley & Sons: New York, NY, USA, 2003; p. 434. [Google Scholar]
  29. Lanari, R.; Casu, F.; Manzo, M.; Zeni, G.; Berardino, P.; Manunta, M.; Pepe, A. An overview of the small baseline subset algorithm: A DInSAR technique for surface deformation analysis. Pure Appl. Geophys. 2017, 164, 637–661. [Google Scholar] [CrossRef]
Figure 1. (a) a photo of the SDMR-1 GB-SAR system, (b) a photo of the Linjiaping railway slope. The observation range is in the yellow dashed line box. Since the terrain is relatively flat and observation range is small, we define this area as a 2D observation scenario.
Remotesensing 13 02153 g001
Figure 2. A photo of the Malanzhuang open-pit. This monitoring area is defined as the 3D observation scenario due to the steep topography.
Remotesensing 13 02153 g002
Figure 3. The MIMO system.
Remotesensing 13 02153 g003
Figure 4. (ae) illustrate the APS in the 2D observation scenario in the Linjiaping area. (a,d) are the differential interferogram and the phase of high-quality points in the azimuth direction for a homogenous APS, and (b,e) are those for a non-homogenous APS. In (d), the phase is a constant along the azimuth direction that indicates the homogenous APS, whereas in (e) it changes linearly along the azimuth direction, indicating the non-homogenous APS. The azimuth direction, under the polar coordinate system, is illustrated in (c). (fi) illustrate non-homogenous APS in the 3D observation scenario in the Malanzhuang area. (g) is differential interferogram, (f) is the unwrapped phase of the high-quality points along the azimuth direction for (g). (h) is the DEM in the radar geometry for the Malanzhuang area. The APS is also non-homogenous in (g), as the phase reversal, indicated by the yellow circle, happens in neither the slant range nor the height direction. However, different from the linear trend of the APS in (e), the APS in (f) shows non-linear change along the azimuth direction due to the steep topography. To transform the non-linear APS correction in the polar coordinate system into a linear problem, the rectangular coordinate system (i) is introduced.
Remotesensing 13 02153 g004
Figure 5. The procedure of compensating the APS by the proposed models. HQP stands for the high-quality points selected by coherence and amplitude deviation index. Unw is the unwrapped phase. Defo means deformation.
Remotesensing 13 02153 g005
Figure 6. The validation experiment for the 2D observation scenario in the Linjiaping railway slope. (a) The differential interferogram, (b) the coherence image, and (c) the selected high-quality points for APS correction. (df) are the wrapped simulated APS, the compensated interferogram, and the residual phase (compensated phase) along the azimuth direction of the range-related model, and (gi) are those of the 2D model. The APS simulated by the 2D model is more consistent with the phase in the interferogram. The residual phase (i) also shows the higher accuracy of the 2D model, since the standard deviation is smaller than that (f) of the range-related model and neither over- nor under-correction occurs.
Remotesensing 13 02153 g006
Figure 7. (a) The observed deformation in the interferograms of four points in the Linjiaping area. (b) The deformation compensated by the range-related model. (c) The deformation compensated by the 2D model.
Remotesensing 13 02153 g007
Figure 8. The accumulated deformation in the Linjiaping area.
Remotesensing 13 02153 g008
Figure 9. The validation experiment for the 3D observation scenario in the Malanzhuang open-pit. (a) The differential interferogram, (b) the coherence image, and (c) the selected high-quality points for APS correction. (df) show the wrapped simulated APS, the compensated interferogram, and the residual phase along the slant range of the height-related model, respectively. (gi) are those of the 3D model. The height-related model has over-correction and under-correction in the upper-left part and bottom-right part in (e), respectively. The correction by the 3D model is more accurate due to the accurate APS simulation (g). The residual phase (i) also shows the higher accuracy of the 3D model, compared with the residual phase (f) of the height-related model.
Remotesensing 13 02153 g009
Figure 10. (a) The observed deformation in the interferograms for the four points of the Malanzhuang area in Figure 9c. (b) the deformation compensated by the height-related model. (c) the deformation compensated by 3D model.
Remotesensing 13 02153 g010
Figure 11. (a) The accumulated deformation in the Malanzhaung area. (b) The deformation time series of the three points in (a). Point A is located in the stable area and its deformation is around zero over the observation duration. Point B shows deformation in a short time (three hours) and becomes stable. The deformation is 11 mm. Point C is located in the deformation center, which moves continuously during the observation period with the accumulated deformation of 85 mm.
Remotesensing 13 02153 g011
Figure 12. The deformation map geocoded over LiDAR data.
Remotesensing 13 02153 g012
Table 1. The SDMR-1 GB-SAR system parameters.
ParametersValue
Bandwidth500 MHz
Slant Range Resolution0.3 m
Azimuth Angle Resolution3.5 mrad
Acquisition Duration1 h
BandKu
Synthetic Aperture Length2 m
Observation Range50~300 m
Table 2. The MIMO system parameters.
ParametersValue
Bandwidth400 MHz
Slant Range Resolution0.3 m
Azimuth Angle Resolution5.7 mrad
Acquisition Duration1 h
BandKu
Observation Range300~850 m
Table 3. The standard deviations of the residual phase for the four points in time series obtained by the range-related model and the 2D model (mm).
ModelPoint 1Point 2Point 3Point4
The 2D Model0.120.130.100.15
The Range-related Model0.130.180.130.19
Table 4. The standard deviations of the residual phase for the four points in time series obtained by the range-related model and the 3D model (mm).
ModelPoint 1Point 2Point 3Point 4
The 3D Model0.380.280.150.29
The Height-related Model0.620.350.230.57
Table 5. The comparison of existing and proposed models.
ModelCoordinate SystemThe Direction of Non-Homogenous APSReference
φ = β r Polar or Rectangular-Rödelsperger. 2011
φ = β Δ r Polar or Rectangular-Jie et al., 2020
φ = β 1 r + β 2 r 2 PolarRangeNoferini et al., 2005
φ = β 1 r + β 2 r α PolarAzimuthThis Paper
φ = β 1 r + β 2 r h RectangularHeightIglesias et al., 2014
φ = β 1 r + β 2 h r + β 3 x r + β 4 y r RectangularHorizontal and HeightThis Paper
- Indicates a homogenous APS model.
Publisher’s Note: MDPI stays neutral with regard to jurisdictional claims in published maps and institutional affiliations.