Article

Night-Time Light Remote Sensing Mapping: Construction and Analysis of Ethnic Minority Development Index

1
School of Earth Sciences, Yunnan University, Kunming 650500, China
2
Engineering Research Center of Domestic High-Resolution Satellite Remote Sensing Geology for Universities of Yunnan Province, Kunming 650500, China
3
Kunming Municipal People’s Congress Standing Committee, Kunming 650500, China
4
School of Resources and Environmental Science, Wuhan University, Wuhan 430079, China
5
Institute of International Rivers and Eco-Security, Yunnan University, Kunming 650500, China
*
Author to whom correspondence should be addressed.
Remote Sens. 2021, 13(11), 2129; https://doi.org/10.3390/rs13112129
Submission received: 22 April 2021 / Revised: 25 May 2021 / Accepted: 27 May 2021 / Published: 28 May 2021
(This article belongs to the Special Issue Remote Sensing of Night-Time Light)

Abstract

:
Using toponym data, population data, and night-time light data, we visualized the development index of the Yi, Wa, Zhuang, Naxi, Hani, and Dai ethnic groups on ArcGIS as well as the distribution of 25 ethnic minorities in the study area. First, we extracted the toponym data of 25 ethnic minorities in the study area, combined with night-time light data and the population proportion data of each ethnic group, then we obtained the development index of each ethnic group in the study area. We compared the development indexes of the Yi, Wa, Zhuang, Naxi, Hani, and Dai ethnic groups with higher development indexes. The results show that the Yi nationality’s development index was the highest, reaching 28.86 (with two decimal places), and the Dai nationality’s development index was the lowest (15.22). The areas with the highest minority development index were concentrated in the core area of the minority development, and the size varied with the minority’s distance. According to the distribution of ethnic minorities, we found that the Yi ethnic group was distributed in almost the entire study area, while other ethnic minorities had obvious geographical distribution characteristics, and there were multiple ethnic minorities living together. This research is of great significance to the cultural protection of ethnic minorities, the development of ethnic minorities, and the remote sensing mapping of lights at night.

Graphical Abstract

1. Introduction

Ethnic minorities refer to ethnic groups other than the main ethnic group in a multi-ethnic country. The proportion of their population is smaller than that of the main ethnic group. There are currently more than 2000 ethnic groups in the world, and the total number of Asian ethnic groups is more than 1000, accounting for about half of the total number of ethnic groups in the world. Among them, the total number of ethnic groups in China, India, the Philippines, and Indonesia exceeds 50. There are about 170 ethnic groups in Europe, and there are about 20 basically single-ethnic countries. There are 55 ethnic minorities in China except for the main ethnic group. The distribution of ethnic minorities in China is relatively wide, mainly showing the distribution of “large mixed residences and small settlements”. The indicators to measure the development level of a region include education level [1], regional GDP [2,3,4], population [5,6], poverty index [7], etc. Among them, the most direct and quantifiable one is economic development. The most direct connection between a nation and a country is the consistency of economic interests [8]. The distribution of ethnic minorities is different, their ecological environment, cultural diversity (such as living habits, languages, religious beliefs, etc.), the technology used in production, the allocation of resources is different, so their economic development is also different [9]. The economic development of ethnic minorities is part of the country’s economic development and contributes to the economic development of the entire country. If there is a problem with the economic development of ethnic minorities, it will directly affect the country’s economic development to a certain extent. Due to differences in living environment and life concepts, there are different economic development models in economic development, leading to better ethnic development in some places and poorer ethnic development in other places. However, the economic development of China’s ethnic minority areas is generally unbalanced. China is a multi-ethnic country, and the common development and mutual assistance of all ethnic groups can make our country stronger and more prosperous. However, due to the different levels of economic development of different ethnic groups, studying the development of ethnic minorities plays an important role in formulating and adjusting corresponding policies. It is very important to understand and discover the development status of each ethnic group. This study helps to understand the development status of ethnic minorities through a simple and quick method.
At present, it mainly studies the economic development index of ethnic minorities from gross domestic product (GDP). A study of the economic development status of the five western ethnic autonomous regions in Inner Mongolia, Guangxi, Tibet, Ningxia, and Xinjiang found that the GDP of the five ethnic minorities regions lagged behind the national level, and there were also significant differences in the economic development level of ethnic minorities in the prefectures regions. The urban–rural per capita income ratio exceeded 2.5:1, and the highest urban–rural per capita income ratio reached 5.6:1, which far exceeded the international standard (according to the general international situation, the per capita GDP is between US$800 and US$1000, and the urban–rural per capita income ratio is 1.7:1 or so) [10]. Li [11] found that the income gap between urban and rural areas in ethnic minorities regions is large, as was the gap between GDP and the national level. The absolute difference in the per capita GDP of the ethnic minorities in Northwest China is gradually expanding, and the absolute difference in the economic development level of the ethnic minorities is expanding [12,13]. Zheng [14] pointed out in his research that both in terms of innovation and economic development, ethnic minority areas lagged behind the national level, and there were large differences in economic development among ethnic minority areas. Luo and Zhuang [15] conducted research on the economic development of the two provinces of Guangxi and Yunnan in the past 15 years, and found that the higher the proportion of the minority population in the total population, the lower the economic development level of the county-level region. Although there are many studies on the development of ethnic minorities, there are very few studies on the development index of ethnic minorities, and the research on the GDP of ethnic minorities only stays at the level of statistical yearbook research and qualitative analysis. The use of more scientific methods to study the development index of ethnic minority regions is of reference significance for understanding the development of ethnic minority regions, the development differences of various ethnic minorities, and the state’s formulation of corresponding policies.
Night-time light data refer to the capture of town lights, fishery lights, etc. at night without clouds [16]. The currently widely used night-time light data include: (1) The Defense Meteorological Satellite Program’s Operational Linescan System (DMSP-OLS) satellite, which provides data from 1992 to 2013; (2) The Suomi National Polar-Orbiting Partnership’s Visible Infrared Imaging Radiometer Suite (NPP-VIIRS), which provides data from 2012 to the present; and (3) China’s first professional night-time light remote sensing satellite “Luojia-1”, jointly developed and produced by the Wuhan University team and related institutions, which provides data from 2018 to the present.
The level of human activities and economic development can be better reflected by night-time light remote sensing data, so it is widely used in social and economic fields [17,18,19] such as economic activity monitoring [20] and economic development research [21]. Doll et al. [22] used night-time light data to assess socio-economic development and found that it was highly correlated with GDP on a national scale (R2 = 0.85, when R2 is greater than 0.8, it can be considered that the two variables are highly correlated), and simulated the spatial distribution of GDP. Elvidge et al. [23] used DMSP-OLS data to analyze the relationship between night lighting area and GDP in 200 countries and found that there was a good linear relationship between night-time light area and GDP. Henderson et al. [24] used a DMSP stabilized light source and radiometric correction images, which correctly reflected the differences in the social and economic development levels of San Francisco, Beijing, and Lhasa. Henderson et al. [25] found that the brightness of night lights in a country had an obvious linear relationship (R2 = 0.8) with the country’s GDP development level. Michalopoulos et al. [26] used a similar method (similar to Henderson et al.) to study the correlation between night-time light data and GDP in Africa, and got good results. Wu et al. [27] used DMSP-OLS data to estimate GDP and the results were satisfactory. Jiang et al. [28] used DMSP-OLS data and NPP-VIIRS data to perform regression simulations on multiple socio-economic parameters, and found that using NPP-VIIRS night-time light data to regress with the whole city’s GDP, R2 reached 0.9102. This proves that night-time light data have a good linear correlation with GDP and power consumption, and found that NPP-VIIRS had higher accuracy and more advantages. Zhu et al. [29] found that compared with traditional socio-economic indicators (GDP, oil and gas production, etc.), night light data are more sensitive and more intuitively reflects social and economic development.
Some scholars have also used night-time light data to study the poverty index of a region. This method can also reflect the development status of the region to a certain extent. Li et al. [30] used the method of machine learning, combined with the robust features of the night light image spatial characteristics to identify China’s high-poor counties. The overall accuracy of the results was greater than 82%, and the user accuracy was greater than 63%. Andreano et al. [31] used DMSP-OLS data to perform spatial classification and continuous time estimation of poverty gap, number of people, and Gini index in 20 Latin American and Caribbean countries. It was found that combining night-time light data helped to better understand poverty and its temporal and spatial dynamics. Pokhriyal et al. [32] used environmental data and call data records to accurately predict the global multidimensional poverty index. This method has high accuracy in predicting health, education, and living standards (Pearson’s correlation coefficient is 0.84–0.86). Li et al. [33] used the principal component analysis method to establish a comprehensive multi-dimensional poverty index, and showed the temporal and spatial heterogeneity of multi-dimensional poverty in 2311 counties in China. It was found that the mountainous areas of Southwest, North China, Northwest China, and the plateau areas of Southeast China had higher levels of economic development.
A large number of studies have proven that the night-time light data reflect the development level of a region, so it is feasible to use it to construct a development index. Compared with traditional statistical yearbook research and qualitative analysis, this paper used night-time light data to construct the development index of ethnic minority areas, which is more accurate and saves resources.

2. Materials and Methods

2.1. Materials

2.1.1. Study Area

Yunnan Province is located on the border of southwestern China. Its geographic location is between 21°8′–29°15′ N and 97°31′–106°11′ E. Yunnan Province is the province with the largest number of ethnic minorities in China. According to the statistics of the sixth national census in 2010, there are 25 ethnic minorities in Yunnan Province, among which the population of Yi, Bai, and Dai are larger. Among the 25 ethnic minorities in Yunnan Province, 15 ethnic minorities are unique to Yunnan such as the Bai, Hani, Lisu, Dulong, etc. The development of ethnic minorities in Yunnan Province has made great contributions to the socio-economic development of the entire Yunnan Province. Yunnan Province is a mountainous plateau. Compared with provinces in plain areas, its topographic features are unfavorable for its development. However, at the same time, Yunnan Province is located on the border of southwest China and is a key area for the development of the “Belt and Road” initiative. There are 16 prefecture-level administrative regions in Yunnan Province including eight prefecture-level cities, eight autonomous prefectures, 17 county-level cities, and 129 county-level districts. Among the 16 prefecture-level administrative regions, there are eight ethnic minority core areas. The administrative division and specific geographical location of Yunnan Province are shown in Figure 1.

2.1.2. Data Sources

The data used in this article are as follows (Table 1): (1) NPP-VIIRS composite data; (2) toponym data; (3) Yunnan Province census statistics; (4) Yunnan Province county level Administrative division boundaries; and (5) Yunnan Statistical Yearbook Data.
The NPP-VIIRS night-time light data adopt the monthly average data of the global cloudless Day–Night Band (DNB) composite data in 2018, and the spatial resolution of NPP-VIIRS data is 500 m. Studies have shown that the DNB of the NPP satellite system is widely used to estimate social and economic parameters, and the in-orbit radiation correction can improve data quality [34,35]. Finally, monthly average data were used to synthesize annual average data for research. The data were downloaded from the Earth Observation Group (EOG) (https://eogdata.mines.edu/download_dnb_composites.html, accessed on 28 May 2020).
The toponym data used in the study come from the results of the second national toponym data census, which mainly includes the meaning of toponyms, that is, the ethnic types of toponyms, the feature type of toponyms, the historical sources of toponyms, the spatial location, and other information, which can be downloaded from the China National Geographical Names Information Database (http://dmfw.mca.gov.cn/, accessed on 20 May 2020).
The census statistics of Yunnan Province use the data of the sixth national census, and the data can be downloaded from the sixth census data of Yunnan Province on the China Social Big Data Research Platform (http://data.cnki.net/, accessed on 14 June 2020). In the data, detailed statistics are made on the population of all ethnic groups in the county-level regions of Yunnan Province.
The county-level administrative divisions of Yunnan Province are derived from the 1:4 million vector data provided by the National Basic Geographic Information Center. In order to make the research more convenient, all the data in this paper were converted into the Lambert projection (Asia_Lambert_Conformal_Conic) based on WGS_1984. In order to make the research more accurate, combined with the geographic location of the study area, the central meridian was set to 102°, the first standard latitude was 22°, and the second standard latitude was 28.3°.
The statistical yearbook data contain a large amount of socio-economic data such as regional GDP per capita, regional total GDP, and regional employees. The development data and production methods of a region can be obtained from the statistical yearbook. The statistical yearbook data of Yunnan Province from 2013 to 2018 was used to verify the feasibility of the method in this paper.

2.2. Methods

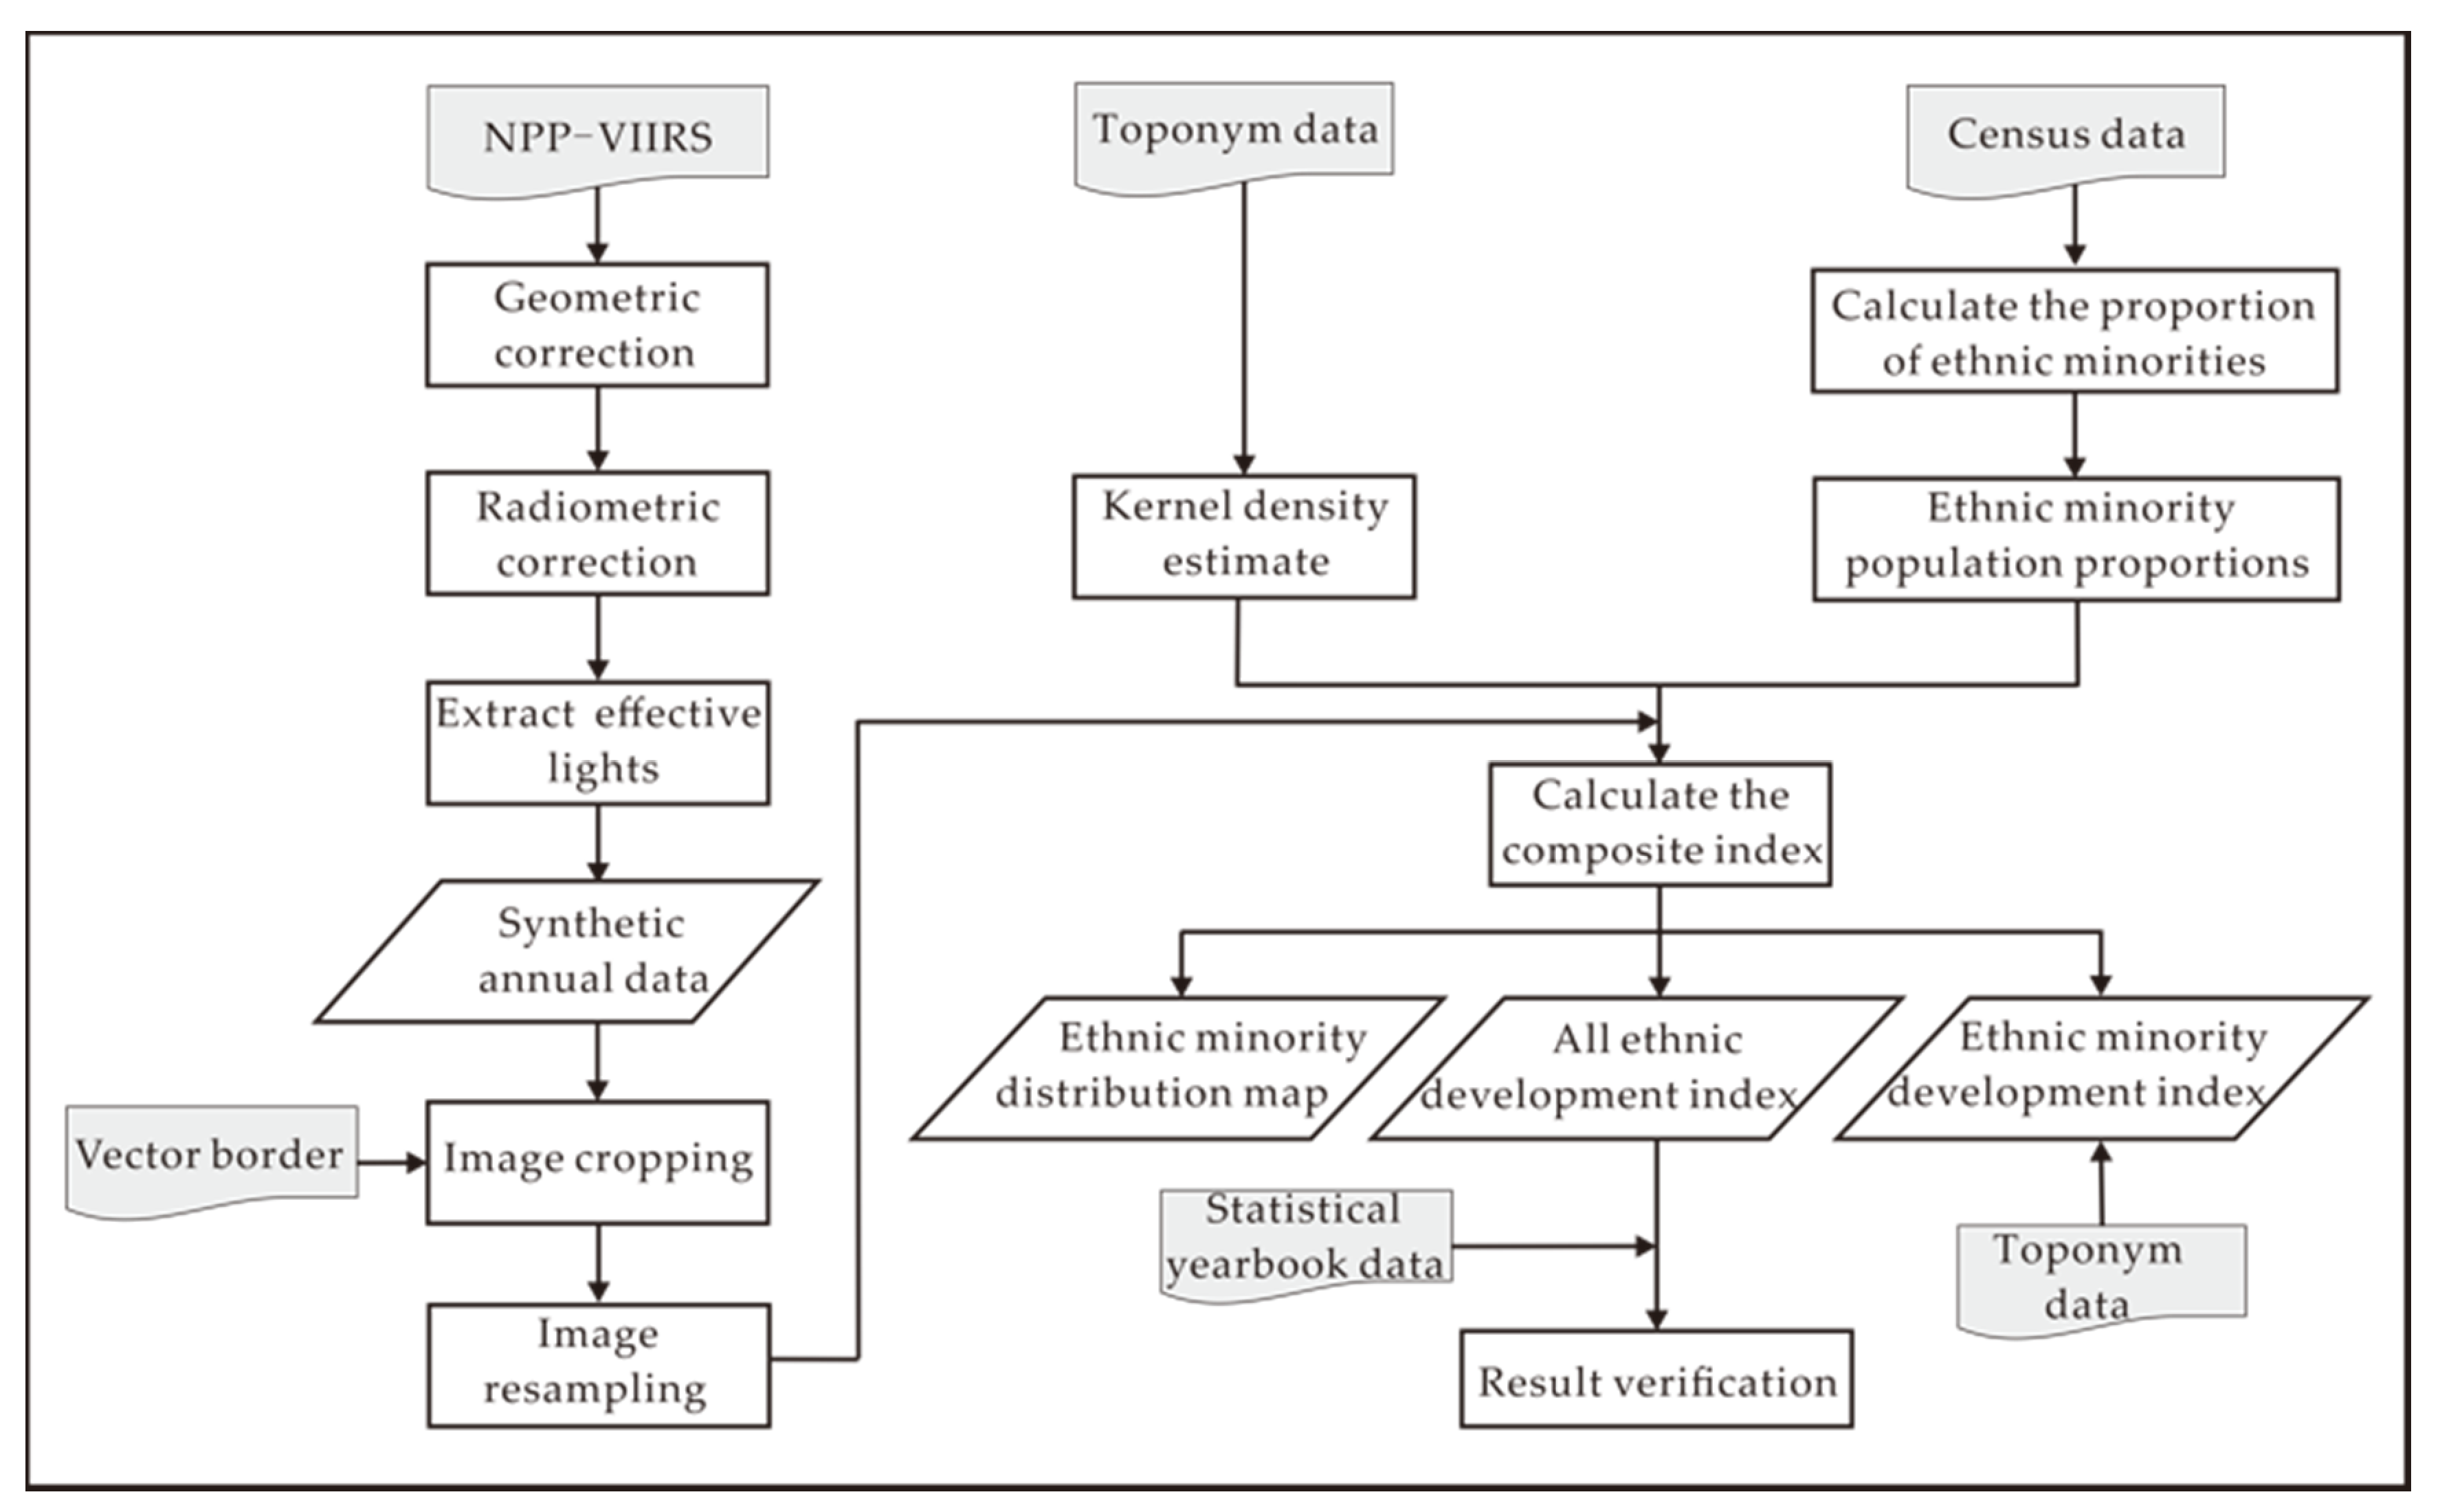
Using the 2018 NPP-VIIRS night-time light data to construct the Yunnan Minority Development Index requires the following three steps. First, preprocess the downloaded NPP-VIIRS cloudless DNB composite monthly average data to obtain stable night light data. Second, extract the toponym data that contain minority information in the toponym data to obtain the Yunnan Province minority toponym dataset, and conduct a kernel density analysis on each type of ethnic minority toponym data in Yunnan Province. Calculate the minority development index using the results of kernel density analysis combined with the results of the minority population proportion grid results and the NPP-VIIRS night-time light data. Finally, in order to more clearly reflect the distribution of ethnic minorities, combine the toponym data and the results of the minority development index to obtain the research area distribution of 25 ethnic minorities. The specific process is shown in Figure 2.

2.2.1. NPP-VIIRS Data Preprocessing

In order to avoid the influence of grid deformation, sensors, and other factors on the research results, first, geometric correction was performed on the 2018 NPP-VIIRS monthly cloudless DNB composite data using the geometric correction tool in ENVI. Since the geographic coordinate system of the acquired NPP-VIIRS data is WGS_1984, set the projection parameter to the WGS_1984 geographic coordinate system, set the output pixel size to 1000 m, and select the cubic convolution method as the resampling method. The NPP-VIIRS night-time light data obtained include fires, aurora, and other noises. Therefore, it needs to be radiated to eliminate the influence of background noise. The process of radiant correction can be referred to in [36]. Load the data to be corrected in ENVI and use the RPC orthorectification workflow tool for correction. First, select the average radiance value of the cloud in the low reflectivity area of the sea surface as the calibration value for removing scattered light, and then subtract the calibration value from the entire image to remove the cloud scattering. Second, using the method of adjacent aberrations, a threshold was set to obtain a stable surface area, and the obtained stable surface area was used as a mask, and the radiation value of the mask area was statistically analyzed. Finally, three times the average radiation value of the statistical analysis was taken as the confidence interval to remove the surface scattered light. After radiant correction, effective night-time light data can be obtained. Then, use the data after geometric correction and radiometric correction to synthesize the 2018 annual average data. The calculation formula is:
D N j = i = 1 12 D N i 12 ,
where DNi represents the light brightness value in month i, and DNj represents the average light brightness value in year j.
After synthesizing the 2018 NPP-VIIRS annual data, we used the administrative divisions of Yunnan Province as a mask to trim the night-time light data to obtain the study area. In order to make subsequent research more convenient, the coordinates were unified into the Lambert projection based on WGS_1984. Finally, using the cubic convolution interpolation method to resample the NPP-VIIRS data to a grid size from the original pixel size of 500 m × 500 m to 1000 m × 1000 m, and obtained stable night light data in 2018. The results are shown in Figure 3.

2.2.2. Construction of the Development Index of Various Ethnic Minorities

Gelling stated that toponyms are “road signs to understand the past” [37] as toponyms are used to indicate the names of specific geographic areas and contain rich information such as the ethnic type of the local residents and the interpretation of the geographical environment by local people at the time of naming [38,39]. Studying toponyms is the basis for understanding the national culture and local characteristics of a region [40]. From toponym data, the ethnic types, language and culture, and religious beliefs of a region [41], spatial location, and the environmental evolution process related to history [42,43], environment, and landforms [44] can be extracted. This is of great significance for understanding ethnic minority settlements and the distribution of ethnic minorities.
The national census is a census about the population of the whole country. The contents of the census mainly include gender, age, ethnicity, etc. The subjects of the census are mainly natural persons living in the People’s Republic of China (except Hong Kong, Macau, and Taiwan). From the census data, information about ethnic minorities can be extracted such as the place of residence of the ethnic minority population, and information about the proportion of the ethnic minority population can also be further extracted.
The distribution of ethnic minorities in China mainly shows the distribution of “large mixed residences and small settlements”. Therefore, the toponym of ethnic minorities will be unevenly distributed, and the toponym data obtained are discrete measured values. Kernel density estimation (KDE) is used to calculate the unit density of the measured value of point and line elements within a specified area. It can intuitively reflect the distribution of discrete measured values in a continuous area. Kernel density estimation can obtain the weighted average density of all data points in the study area [45]. The weight assigned is related to the distance of the center point of the data point. The farther away from the center point, the smaller the weight is assigned, and vice versa [46]. The formula for calculating the kernel density Pi at any point i in space is:
P i = 1 n π R 2 × j = 1 n K j 1 D i j 2 R 2 2 ,
where R is the search radius (bandwidth) of the selected area (Dij < R); Kj is the weight of the research data point j; Dij is the distance between the space point i and the research data point j; and n is the number of research data points j within the search radius R. The search radius R has a direct impact on the results of kernel density analysis [47].
In this study, 25 ethnic minority geographic names were used for kernel density analysis. Because the area of an ethnic minority gathering area in the study area is about one square kilometer. According to this feature, through comparative analysis, the search radius of kernel density estimation is constantly changed, and finally, it was found that when the search radius was 1000 m, the effect was better, and can distinguish ethnic minority gathering areas. Considering that there are places with ethnic minority toponyms, but no ethnic minorities living in them, this paper used census data to calculate the proportion of 25 ethnic minorities in the study area, and obtained a grid map of the proportion of 25 ethnic minorities for future use.
The development of a region or a nation is often affected by many factors such as population, economy, environment, geographical location, etc. In addition, there are differences in the development of different regions of the same ethnic group and between different ethnic groups in the same region. Therefore, it is necessary to construct a development index that can reflect this difference in order to quantitatively analyze the development of ethnic minorities. This article used population, toponym data, and NPP-VIIRS data combined with the literature [48,49] as well as the formula form of the spatialization of population data to propose a method to calculate the development index of various ethnic minorities. The calculation formula is shown in Equation (3):
C P S i = P R i × K D E i × N P P i
where CPSi is the development index of minority i; PRi is the population proportion of minority i; KDEi is the kernel density analysis result of minority i; and NPPi is the night light radiance value of minority i.

2.2.3. Distribution of Ethnic Minorities

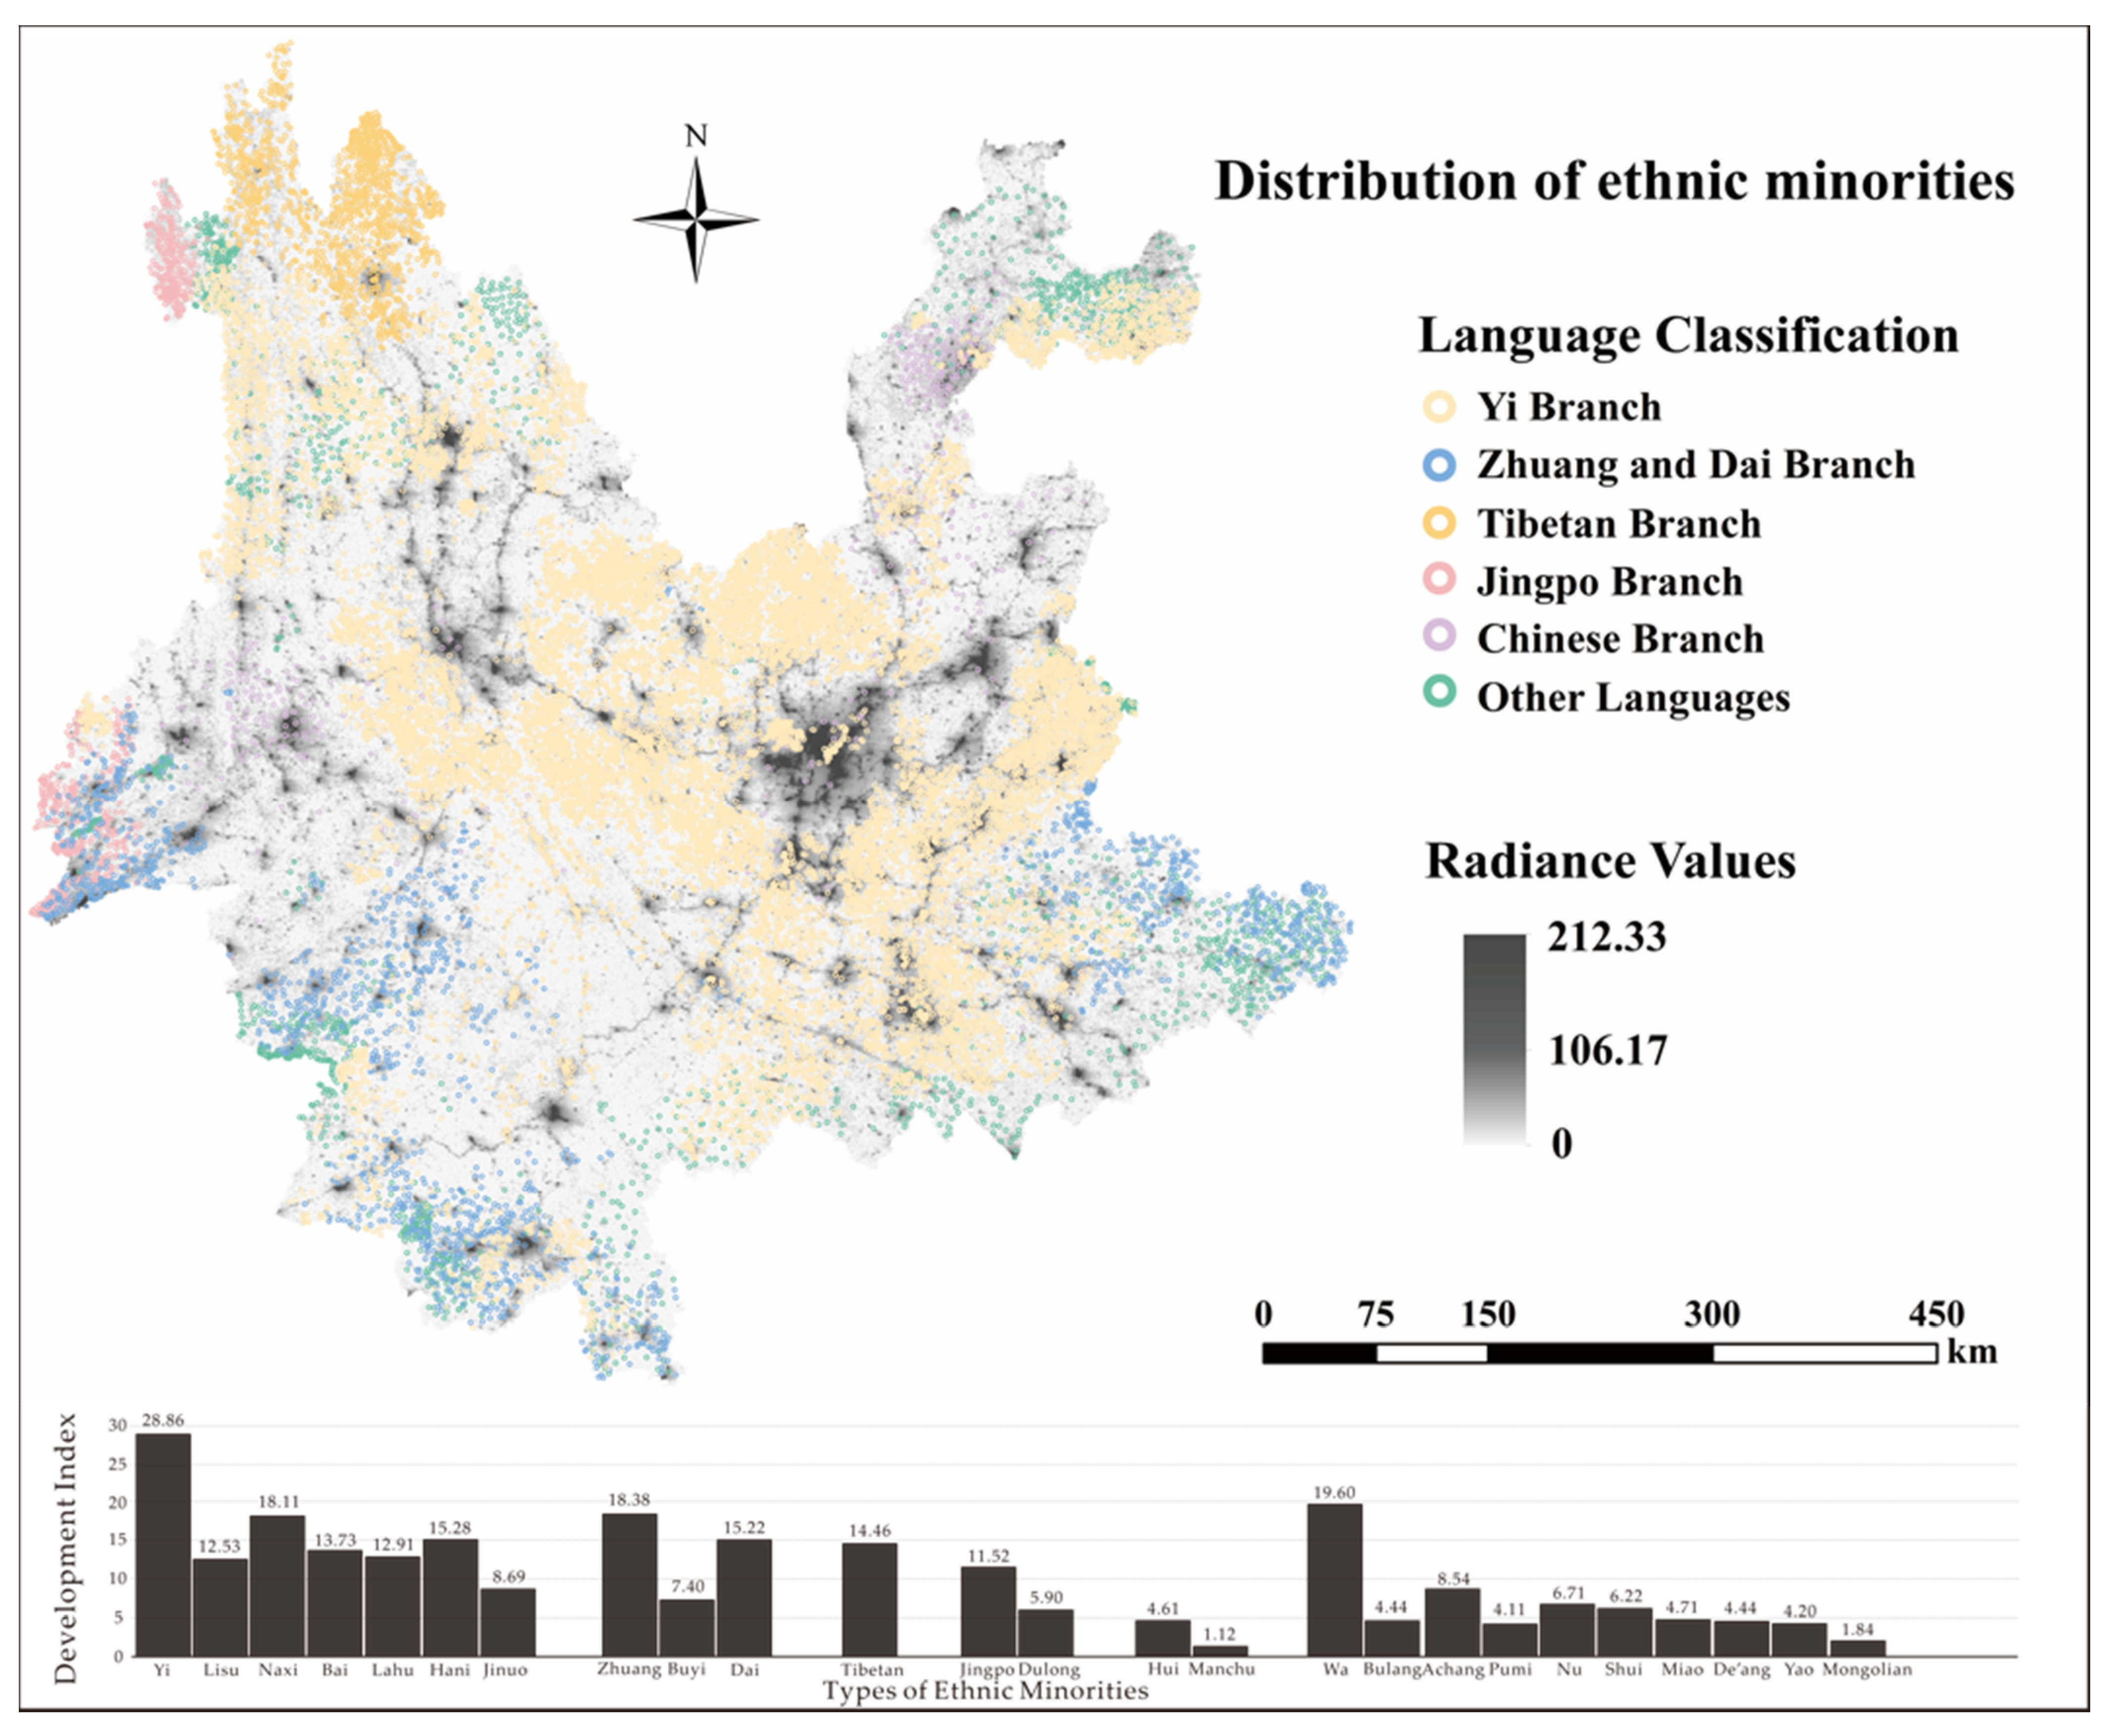
In order to clearly understand the distribution of each ethnic group, we used the obtained ethnic development index combined with ethnic toponym data. We used the 2018 NPP-VIIRS data as a base map, and used the point method to show the distribution of 25 ethnic minorities. Due to the large number of ethnic minorities, it was difficult to distinguish between ethnic groups using only different colors. This paper applied the literature [50] on the classification of language affiliation, and used the language branches of different ethnic minority languages to classify 25 ethnic minorities into 13 categories. Since the 13 categories were difficult to distinguish on the map, the 13 categories were merged into six categories based on the language branch classification. The specific classification is shown in Table 2.
Since the development index of the Yi nationality was the highest, but less than 30, the 0–30 was divided into five categories by the equal interval: higher development index, high development index, medium development index, low development index, and lower development index. According to the development index range of each type of development level, 25 ethnic minority development indexes were classified.

3. Results and Accuracy Verification

3.1. Ethnic Minority Development Index

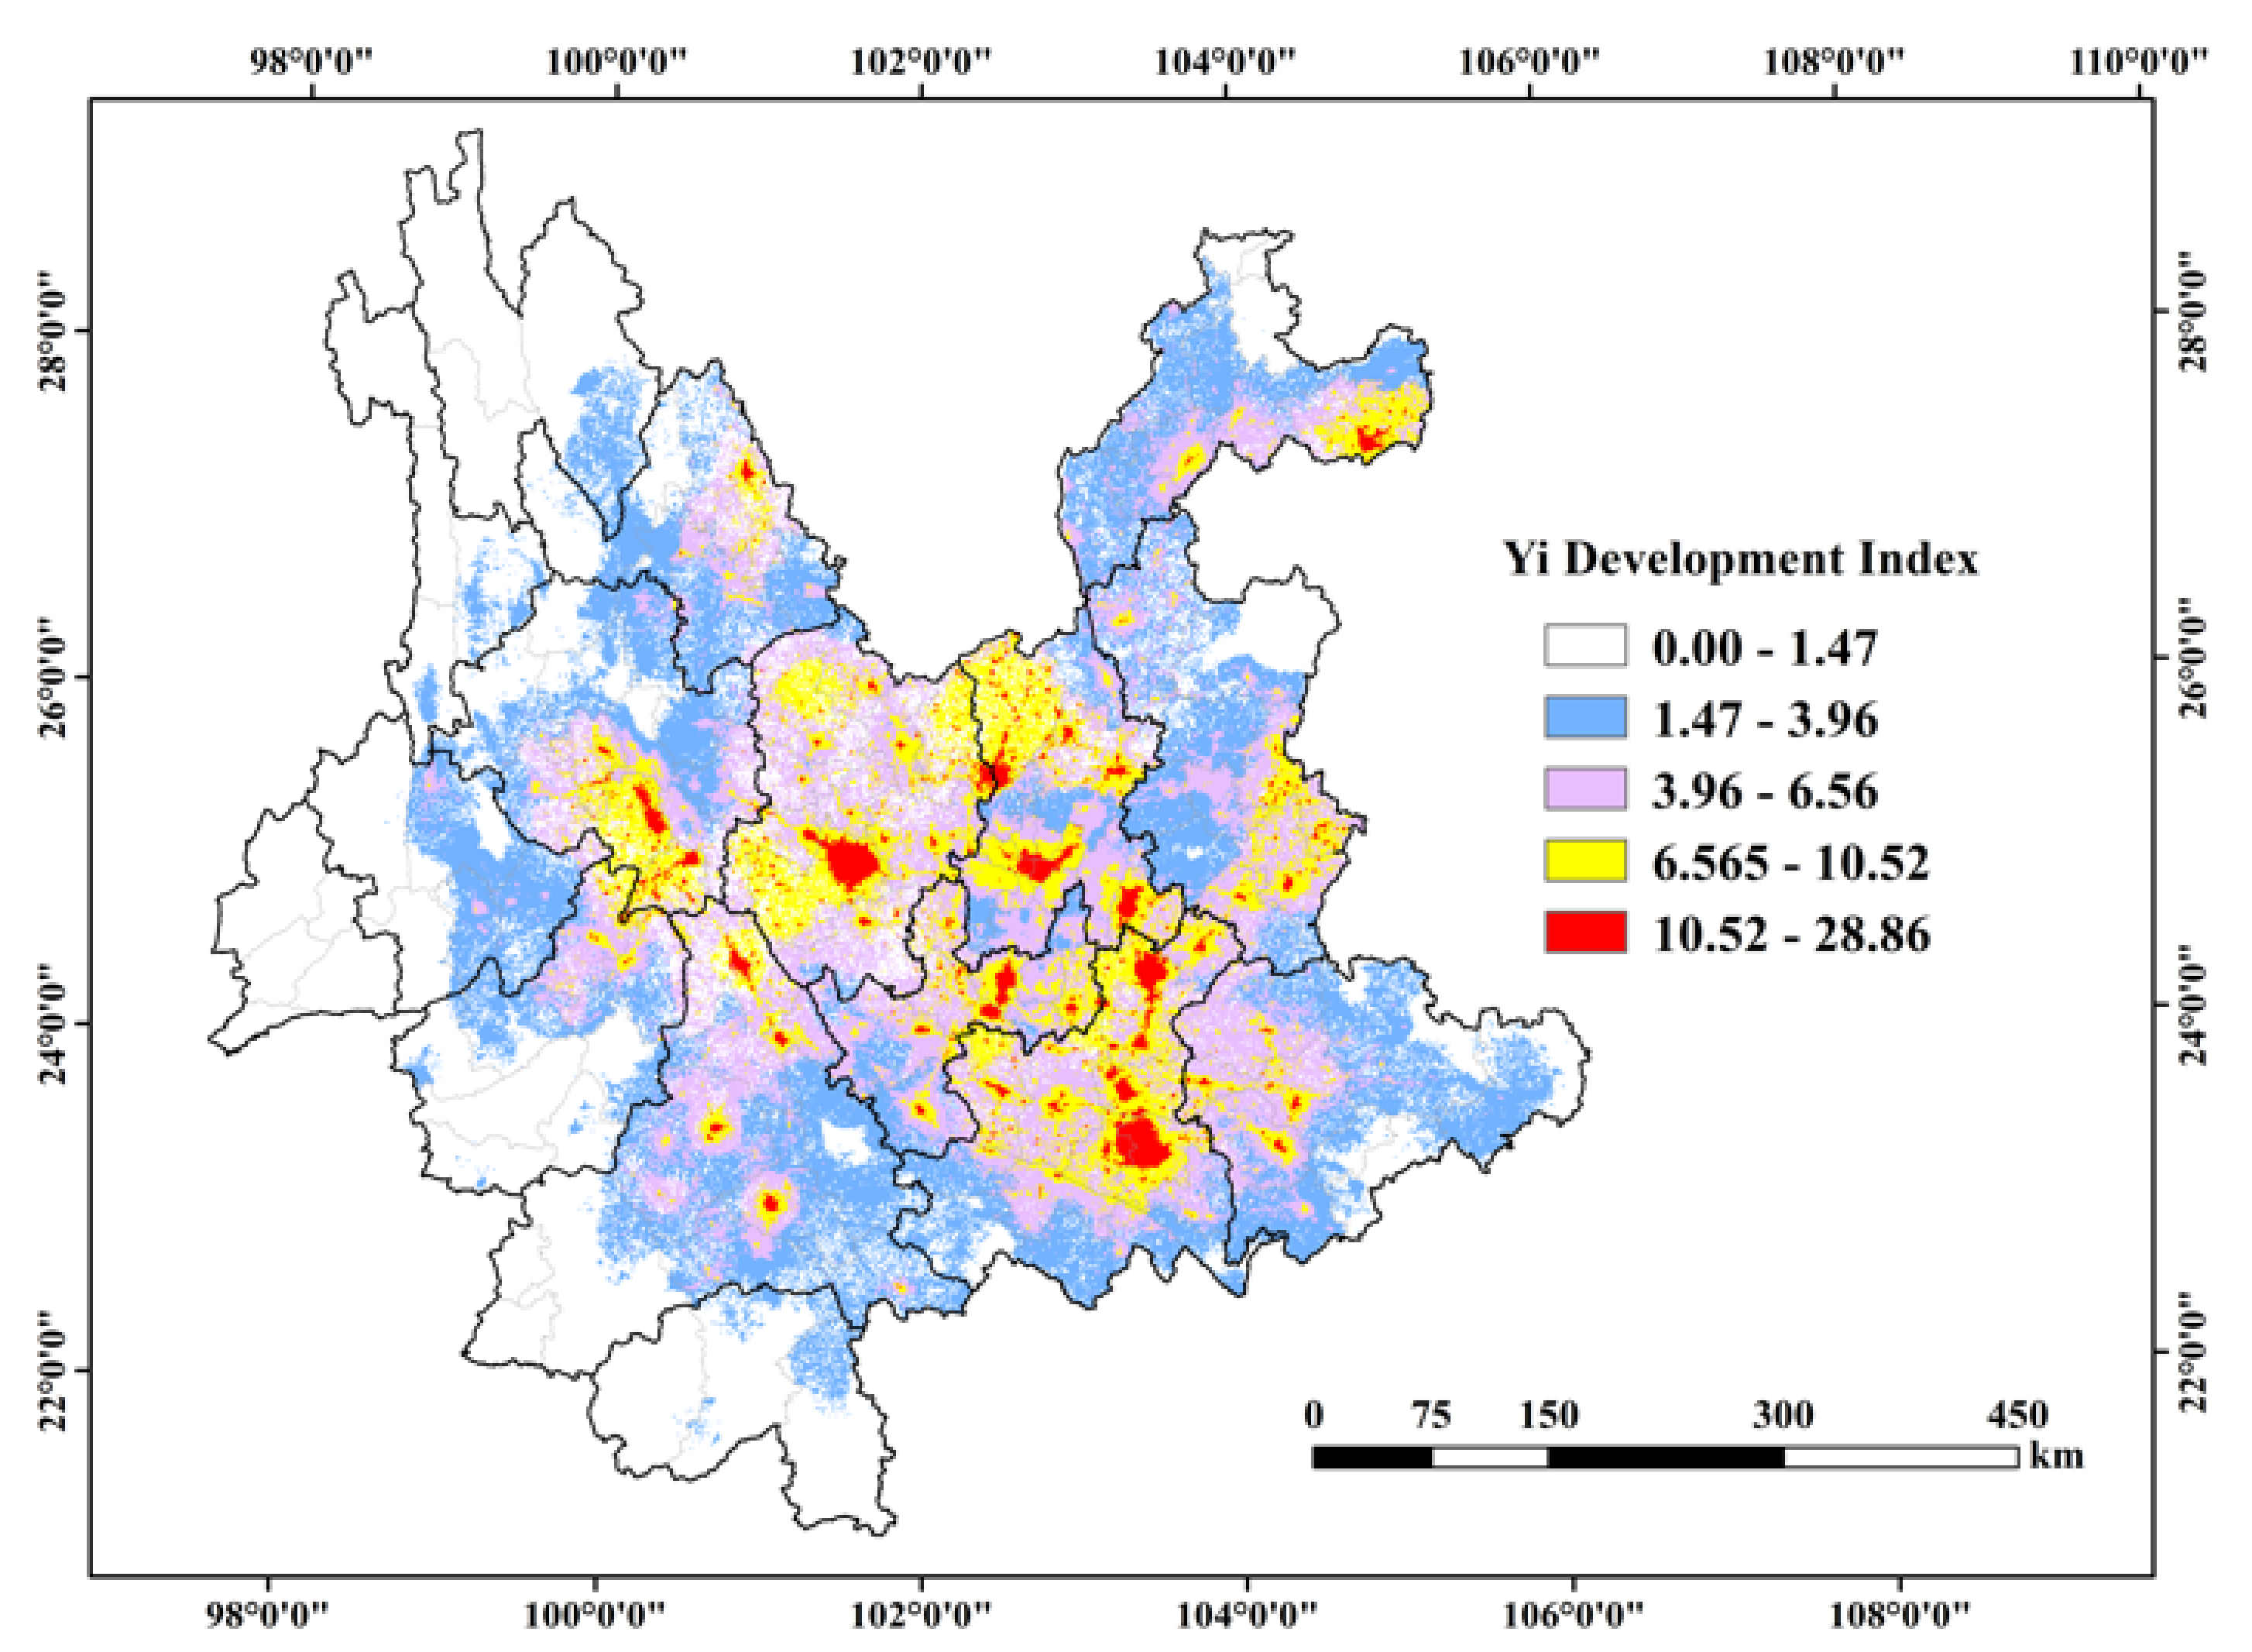
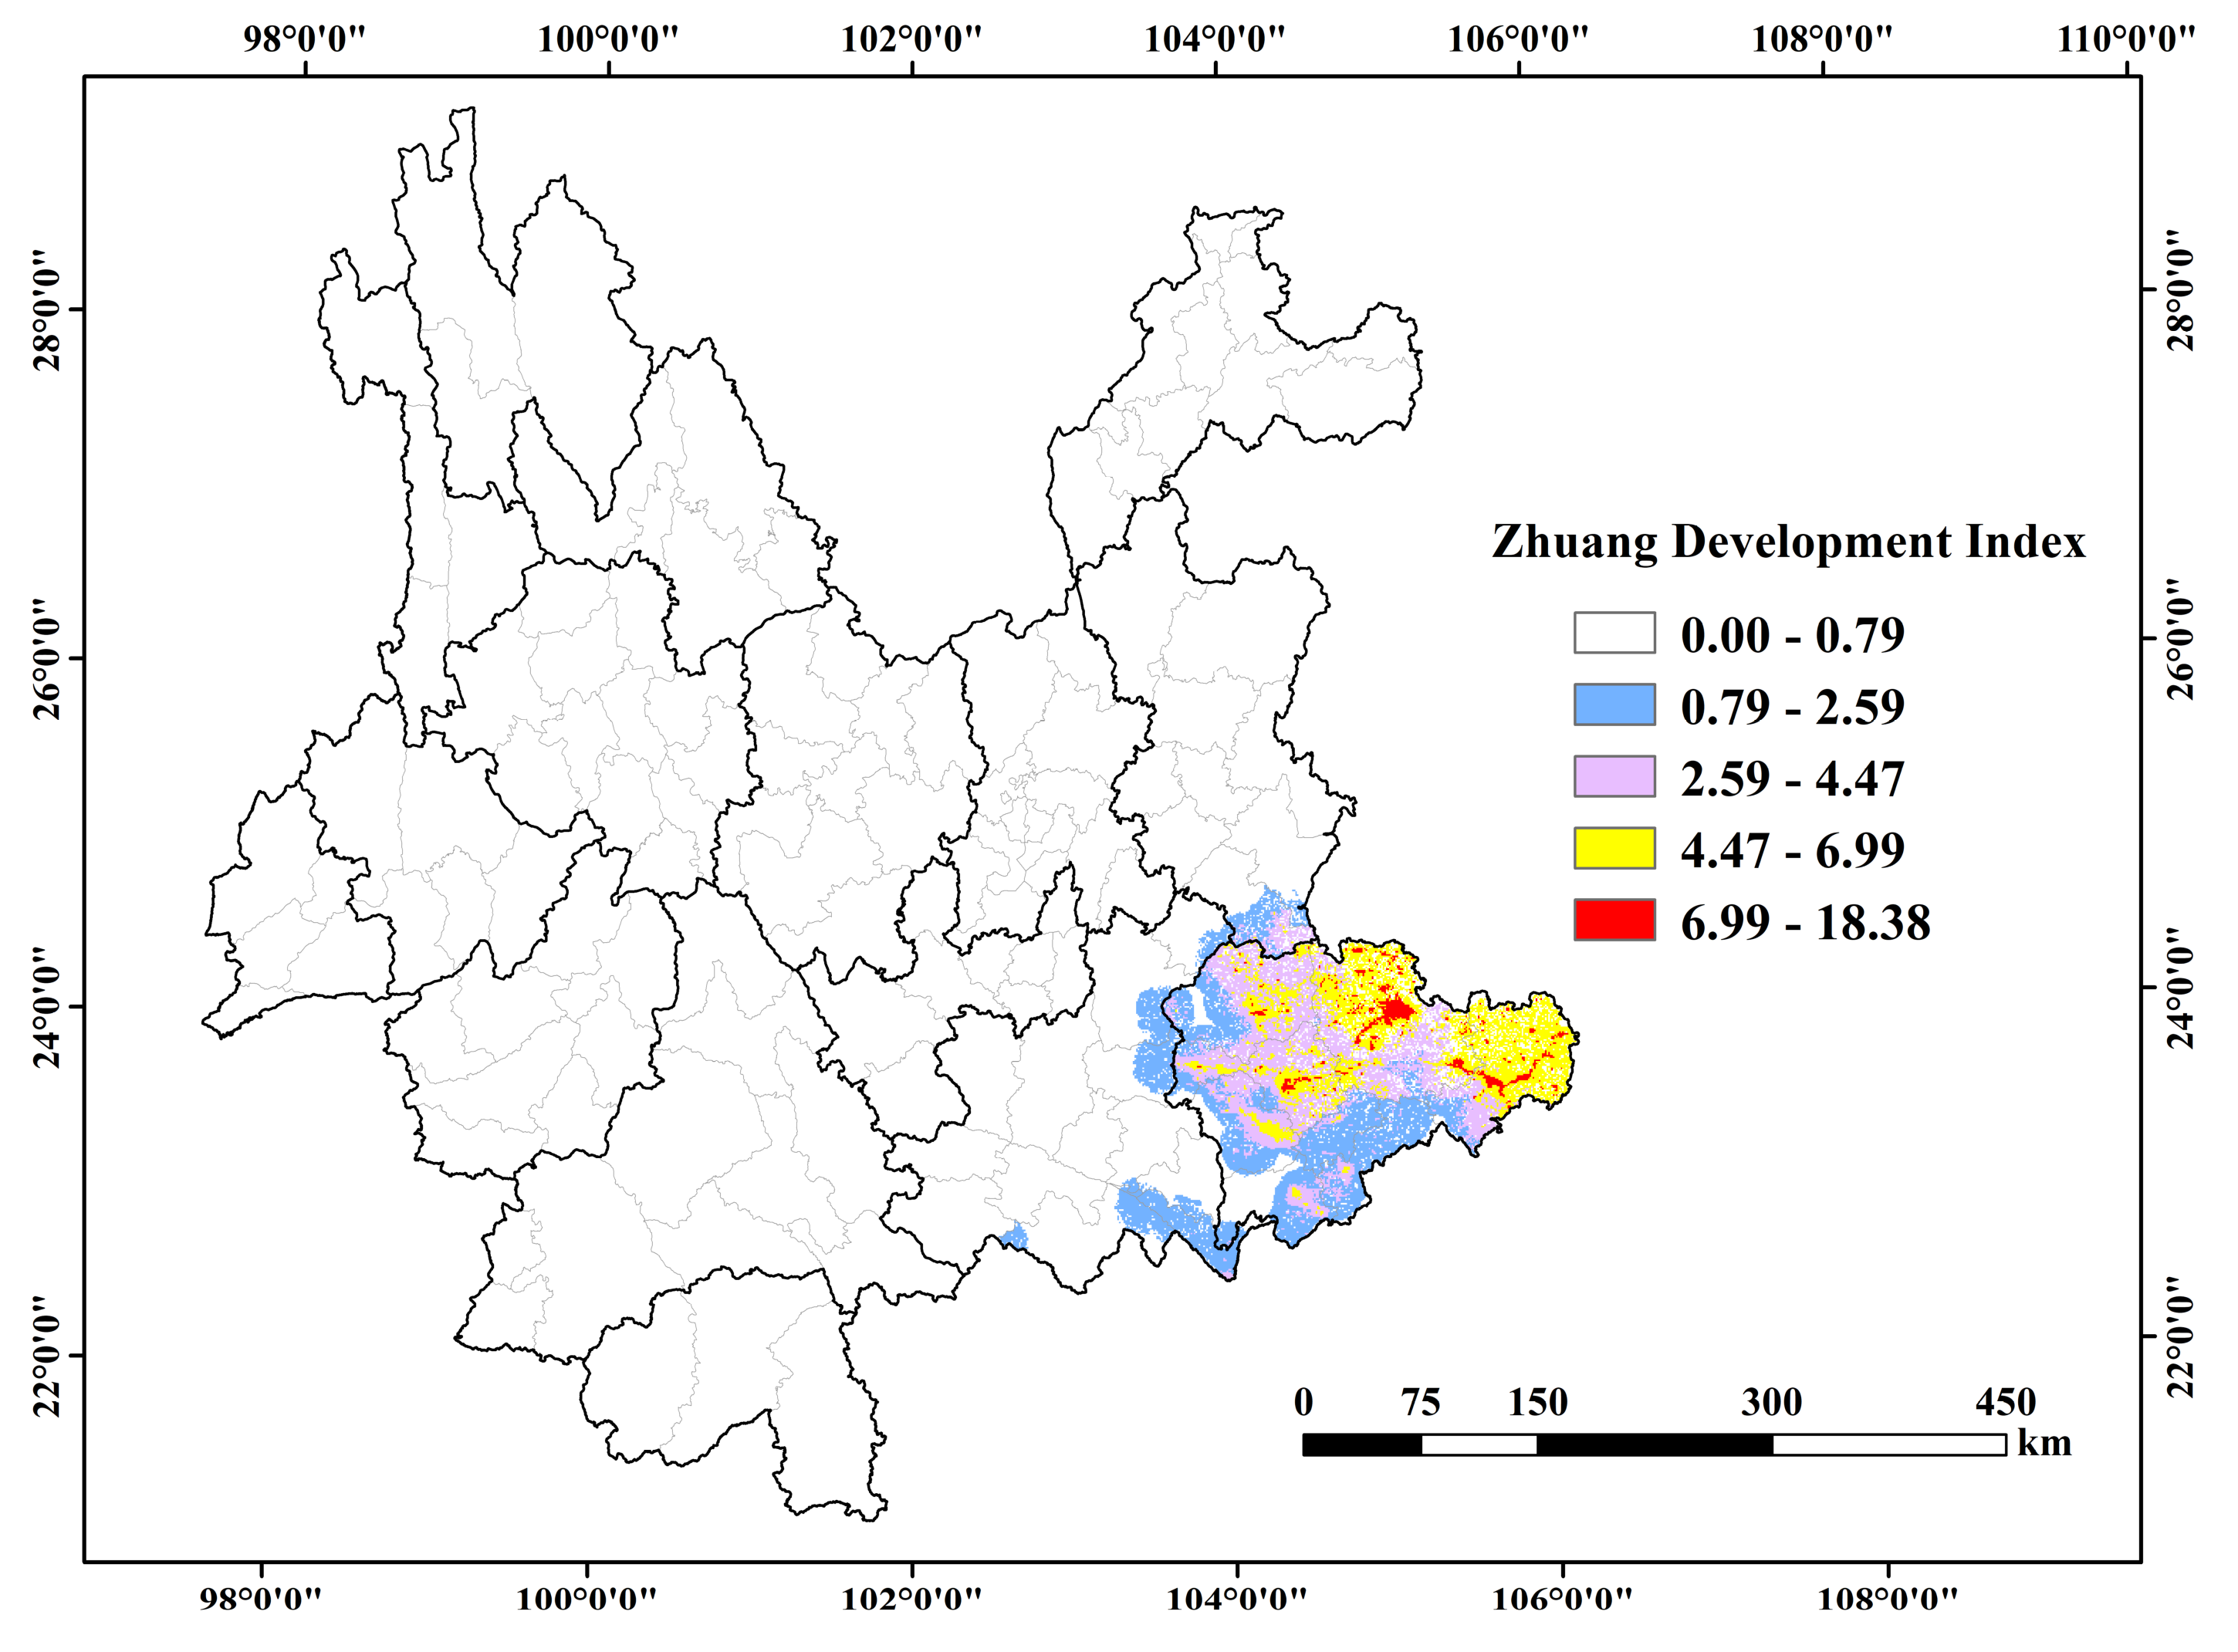
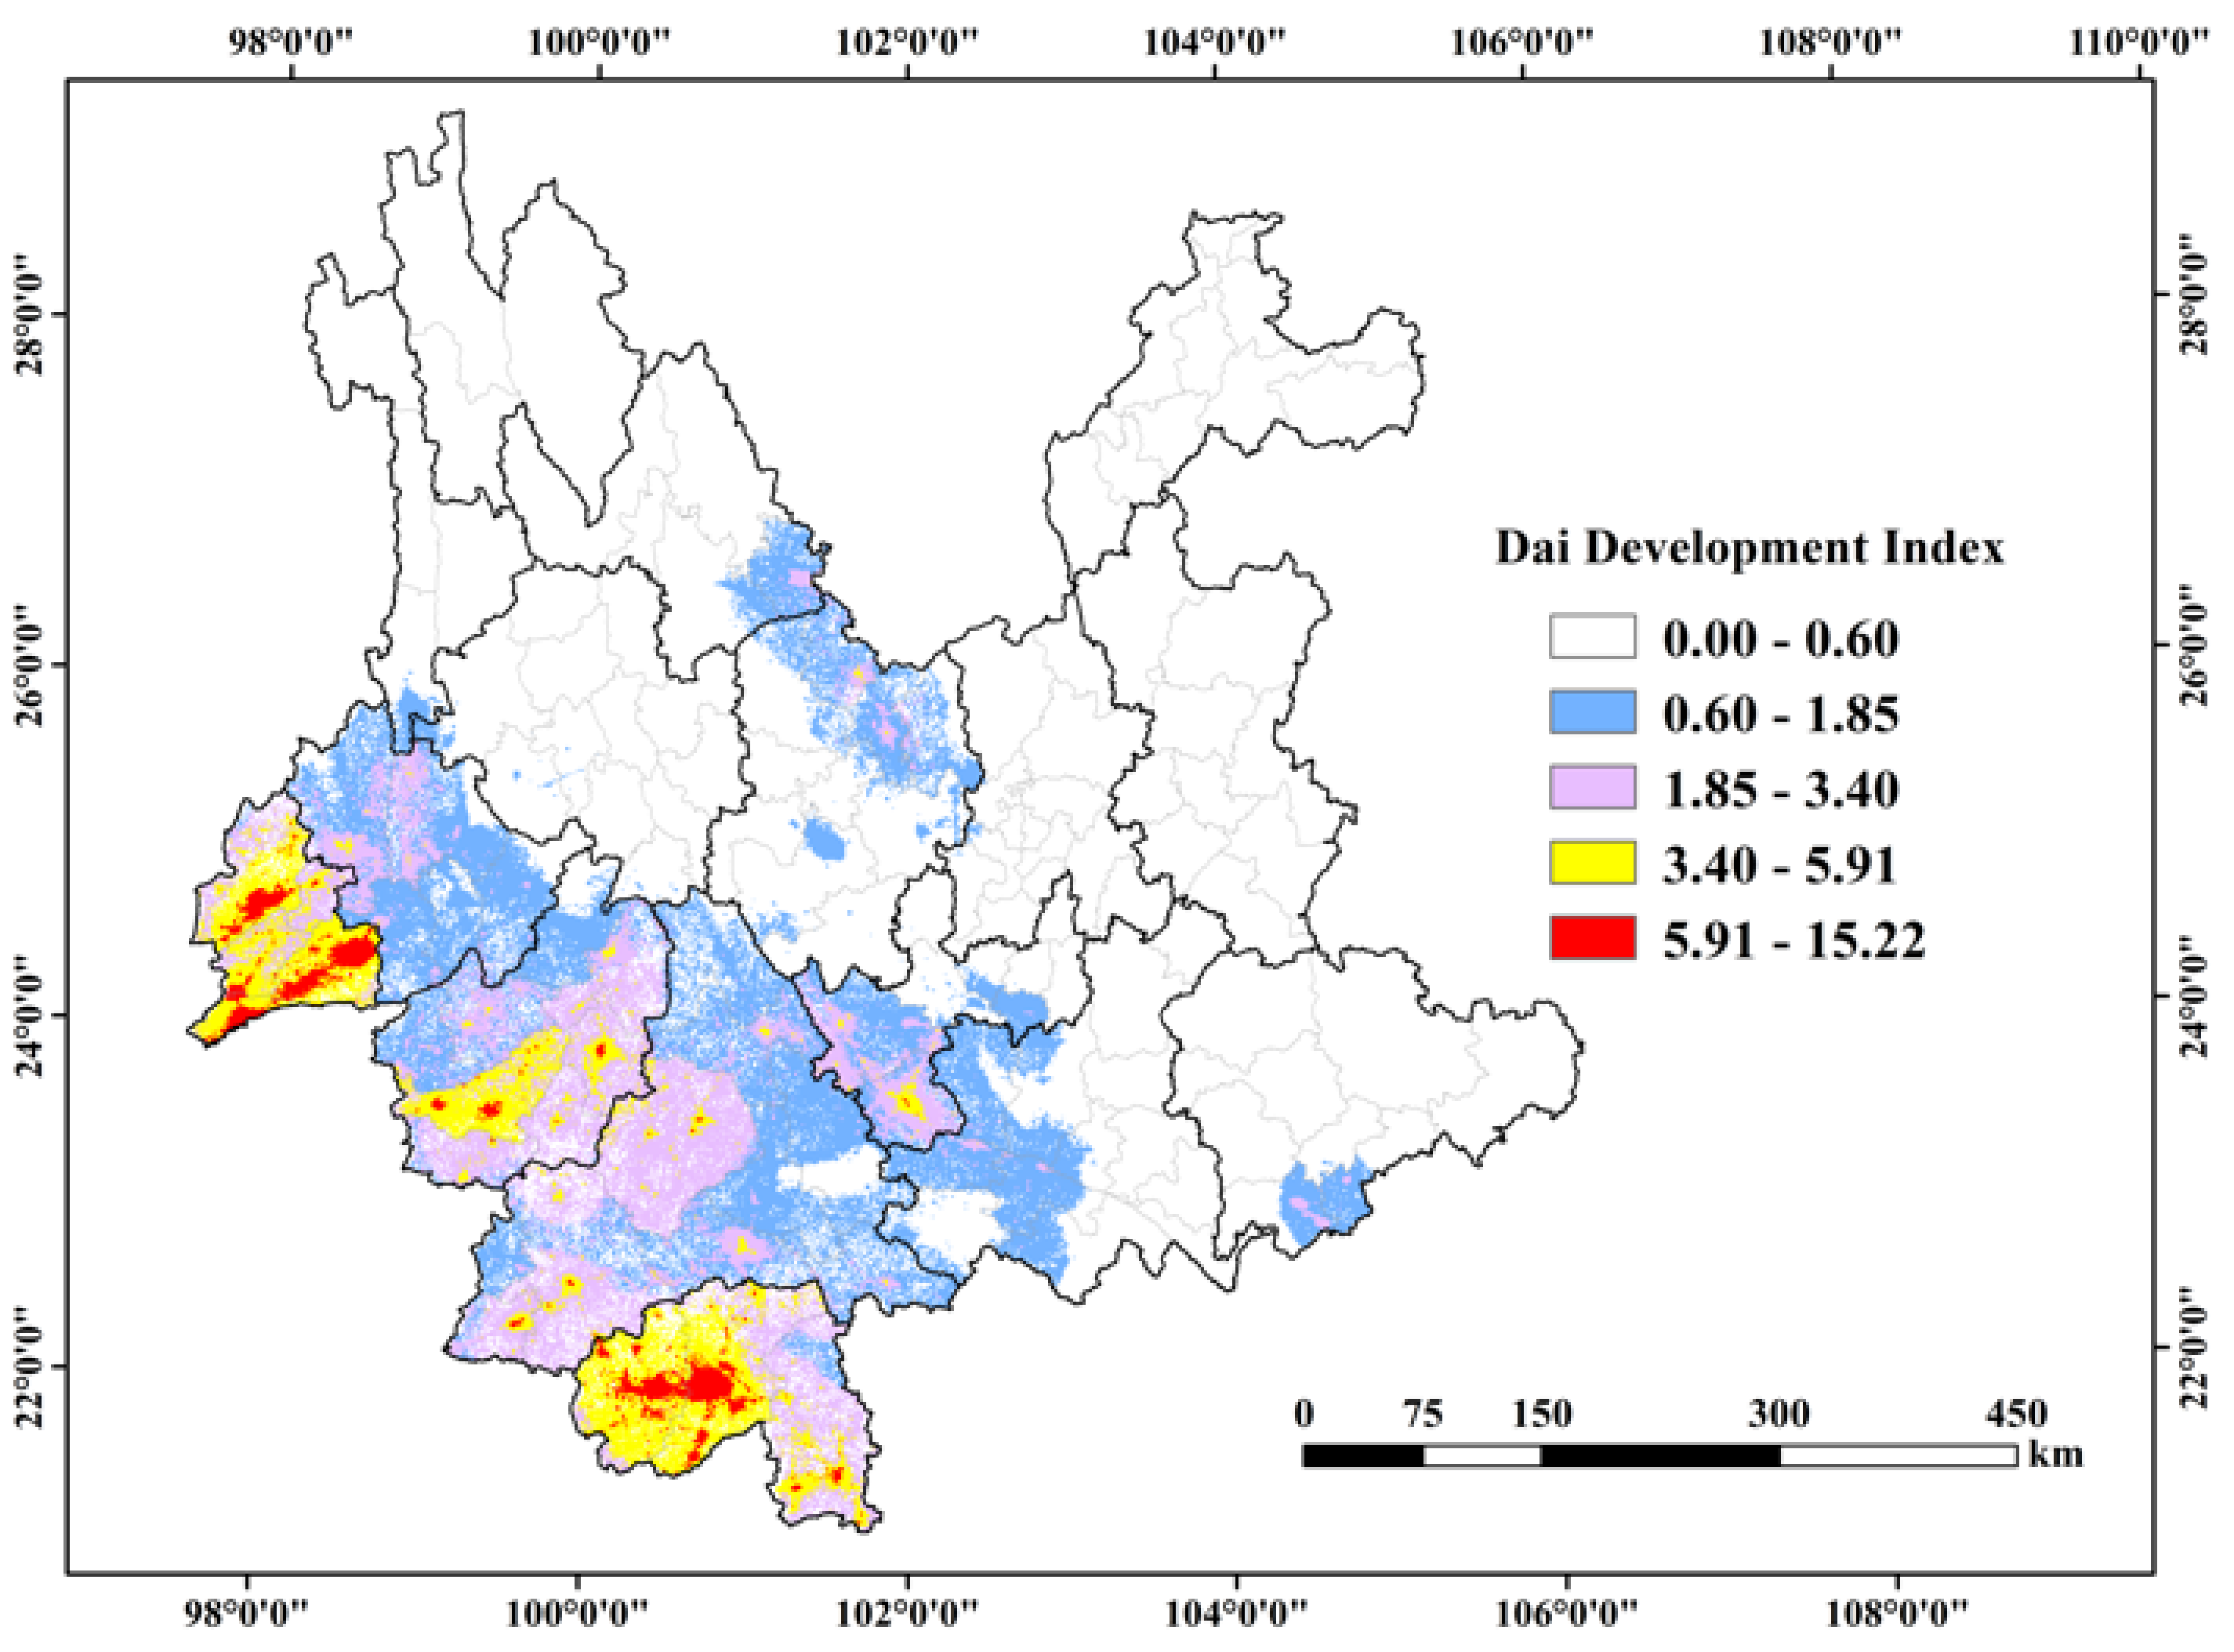
In order to better reflect the development index of ethnic minorities, this article selecteed the Yi, Wa, Zhuang, Naxi, Hani, and Dai, six ethnic minorities with higher development indexes, for cartographic analysis. By comparing the development index calculated by Equation (3), and reference [49], the natural fracture method can most appropriately group similar values and maximize the difference between each class, so we compared the three methods of using the natural breaks method, average classification method, and manual breaks method, and found that the method using natural breaks method worked the best. This article divided the development index into five categories. The first category indicates areas with extremely poor development of the ethnic minorities, which are directly regarded as areas without the distribution of ethnic minorities. The second category indicates areas with poor development of the ethnic minority. The third category indicates areas with a moderate development. The fourth category indicates areas where the ethnic minority has developed well. The fifth category indicates areas with excellent development of the ethnic minority. The results are shown in Figure 4, Figure 5, Figure 6, Figure 7, Figure 8 and Figure 9.
It can be seen from Figure 4, Figure 5, Figure 6, Figure 7, Figure 8 and Figure 9 that among the six ethnic minorities with high development indexes in Yunnan Province, the development indexes from high to low were: Yi, Wa, Zhuang, Naxi, Hani, and Dai. Moreover, the development index of Hani and Dai, Zhuang and Naxi were not much different. In other words, among the six ethnic minorities, the Yi ethnic group had the best development (the Yi ethnic group had the highest development index, and there were many areas with high development indexes), and the Dai ethnic group had the worst development compared to the other five ethnic minorities.
It can be seen from Figure 4 that the Yi nationality was distributed almost throughout Yunnan Province. The areas with higher Yi development index were: (1) the northeast area of Nanjian Yi County in Dali Bai Prefecture and the east area of Weishan Yi Hui County; (2) the eastern part of Chuxiong City, Chuxiong Yi Prefecture; (3) the junction of Wuhua District, Xishan District, Guandu District, and Panlong District of Kunming City, the western part of Shilin Yi County, and the southern part of Luquan Yi and Miao County; (4) the southeast area of Eshan Yi County, Yuxi City, and the east area of Yuxi City; and (5) the northern area of Mile County, the western area of Kaiyuan City, the western area of Mengzi County, and the eastern area of Gejiu City in Honghe Hani and Yi Prefecture.
It can be seen from Figure 5 that the distribution of the Wa nationality had regional characteristics, mainly in Cangyuan Wa County in Lincang City and Ximeng Wa County in Pu’er City. Between them, the Wa development index was the highest in the southern area of Cangyuan Wa County.
It can be seen from Figure 6 that the Zhuang nationality was mainly distributed in Wenshan Zhuang and Miao Prefecture. The areas with higher Zhuang development index were: (1) Qiubei County and the central area of Yanshan County; (2) the northern part of Funing County; and (3) the northwestern part of Guangnan County.
It can be seen from Figure 7 that the Naxi nationality was mainly distributed in the western region of Lijiang City. The development index of the Naxi nationality was higher in the southern area of Lijiang urban and the southern area of Yulong Naxi County.
It can be seen from Figure 8 that the Hani nationality was mainly distributed in Xishuangbanna Dai Prefecture, southwest of Honghe Hani and Yi Prefecture, and southeast of Pu’er City. The areas with higher Hani development index were: (1) the western area of Jinghong City and the eastern area of Menghai County; (2) the central area of Hani and Yi County in Jiangyu; and (3) Honghe County, Yuanyang County, and Luchun County. It has the characteristics of not being concentrated and more scattered.
It can be seen from Figure 9 that the Dai nationality was mainly distributed in Dehong Dai Jingpo Prefecture, Lincang City, Xishuangbanna Dai Prefecture, Pu’er City, Baoshan City, and the western area of Yuxi City. The areas with higher Dai development index were: (1) Yingjiang County and Ruili City’s southern area, and Mang City’s central area; (2) the central area of Menghai County and Jinghong City; (3) Lincang city center and the central area of Gengma Dai and Wa County; (4) the central area of Yuanjiang County; and (5) the central areas of Menglian County, Lancang County, and Jinggu County.

3.2. Ethnic Minority Distribution Results

We used the method of in Section 2.2.3 to obtain the distribution results of 25 ethnic minorities in Yunnan Province (Figure 10).
It can be seen from Figure 10 that the coverage of the Yi ethnic group was the widest, involved the most counties, and was concentrated in Chuxiong Prefecture, the southeastern area of Qujing City, and the northern area of Kunming. The Jingpo branch is mainly distributed in Dehong Prefecture and Gongshan County. Zhuang Dai language branch was mainly distributed in Wenshan Prefecture, Dehong Prefecture, Xishuangbanna Prefecture, and Lincang Prefecture. The Chinese branch was mainly distributed in Zhaotong City and Baoshan City. Other language branches were mainly distributed in the east of Zhaotong and the north of Zhaotong, the east of Wenshan Prefecture, Nujiang Prefecture, Lijiang City, Dehong Prefecture, Xishuangbanna Prefecture, and the south of Lincang Prefecture.
From the perspective of development index, the higher developed ethnic minority was the Yi. The high-developed index ethnic minorities included the Naxi, Zhuang, and Wa. The medium-developed ethnic minorities included the Hani, Bai, Lahu, Lisu, Dai, and Tibetan. The low-developed ethnic minorities included the Jingpo, Jinuo, Buyi, Achang, Nu, and Shui. The lower-developed ethnic minorities included Dulong, Bulang, Pumi, Miao, Hui, Manchu, De’ang, Yao, and Mongolian.
From the perspective of the language branch, the overall development index of ethnic minorities in the Yi, Zhuang, Dai, and Tibetan branch was relatively high, which may be related to the inheritance and development of these language branches.
Several ethnic minorities lived together in most areas. Among them, the mixed living of ethnic minorities in Dehong Prefecture was more obvious. Areas where the phenomenon of multi-ethnic mixed living was more obvious were: (1) Zhaotong City has mixed living of Yi branch, Chinese Branch, and other languages; (2) Funing County and Guangnan County in Wenshan Prefecture had mixed living of the Zhuang and Dai branch, and other languages; (3) Fumin County in Kunming City had mixed living of the Yi branch, Chinese Branch, and other languages; (4) Mengla County in Xishuangbanna Prefecture had mixed living of the Zhuang and Dai branches and other languages. (5) Jinghong City in Xishuangbanna Prefecture has mixed living of Zhuang and Dai branches and other languages, Yi branch, and Jingpo branch; (6) Longchuan County in Dehong Prefecture had mixed living of Zhuang and Dai branches, other languages, and Jingpo branch; (7) Yingjiang County in Dehong Prefecture had mixed living of Zhuang and Dai branches, other languages, Yi branch, and Jingpo branch; and (8) Lushui County in Nujiang Prefecture had mixed living of other languages and the Yi branch.
There are currently 25 ethnic minorities in Yunnan Province, among which the Yi nationality is the most widely distributed and relatively scattered. Among the six selected ethnic minorities with the highest development index, from the perspective of each development index, the Yi nationality’s development index was the highest, reaching 28.86 (to two decimal places). The Wa nationality had the second development index, reaching 19.60, but was far from the Yi nationality, which had the highest ranked development index. The Zhuang nationality had the third development index, reaching 18.38. The Naxi nationality had the fourth development index, reaching 18.11. The Hani nationality had the fifth development index, reaching 15.28. The Dai nationality’s development index was the lowest at 15.22.
From the perspective of the relationship between the development index of each ethnic group and the geographic location of the ethnic group: the six areas with higher development indexes of ethnic minorities were located in the corresponding ethnic minority states, counties, or the city center of each city. Ethnic minorities had the highest development index in their corresponding minority prefecture or county, and the further the distance from the minority prefecture or county, the smaller the development index. The minority development index decreased as the distance between the minority nationality and its core development zone increased.
From the perspective of the relationship between each ethnic development index and the corresponding ethnic minority prefecture and county, areas with a higher ethnic development index were concentrated in the ethnic minority prefecture or county, but the development of the ethnic minority in the prefecture was better than that in the county.

3.3. Accuracy Verification

In order to verify the correctness of the development index calculated by the method used in this article, the method used in this article was compared with the method of the traditional research statistical yearbook. Considering that the development of a region is affected by many factors such as rural population, urban population, employment rate, average resident salary, etc., it is difficult to verify the correctness of the results of this article by selecting only one indicator. Comprehensively referenced in [51,52,53], this article selected eight indicators for the study area from 2013 to 2018. These were the total output value of agriculture, forestry, animal husbandry, and fishery in each county, and the per capita disposable income of rural residents in each county. County GDP per capita, GDP index of each county, rural employees in each county, rural population in each county, average salary of employees in each county, and number of employees in each county. Since the magnitudes of the eight indicators were different, the indicators were normalized first. The normalized formula is shown in Equation (4):
X = x min max >− min ,
where X is the standardized result of the index; x is the original value of the index; max is the maximum value of the sample data; and min is the minimum value of the sample data.
After obtaining the normalized results of the indicators, a comprehensive development index was established according to the method of establishing a comprehensive poverty index in the literature [53,54]. First, the entropy method was used to determine the weight of the eight indicators. In the entropy method, the larger the amount of information, the smaller the uncertainty of the information, and the smaller the entropy value, so the greater the weight. Using the entropy method to calculate the weight of each indicator, we can obtain the comprehensive development index. The calculation formula is shown in Equations (5)–(8):
Z = i = 1 n w j X i ,
f i j = y i j i = 1 m y i j ,
H j = ( 1 / lnm ) i = 1 m f i j ln f i j ,
w j = ( 1 H j ) j = 1 n ( 1 H j ) ,
where fij is the index value weight of the i evaluation object under the j index; m is the 129 counties included in the study area; n is the eight indicators to construct the comprehensive development index; Z is the comprehensive development index; Xi is the standardized result of i evaluation object; Hj is the entropy value of the j index; and wj is the weight of the j index.
The weights of the eight indicators in 2013–2018 calculated by the formula are shown in Table 3 (with four decimal places).
According to the calculation results of the weight of each index, the comprehensive development index of each county in the study area was obtained, as shown in Table 4.
Using the method developed in this article to calculate the comprehensive development index of all ethnic minorities and Han nationality in the study area from 2013 to 2018, we performed district statistics on the development index of each county on ArcMap, and took the average value of the development index of each county as the statistical value. The development index of each county from 2013 to 2018 is shown in Table 5.
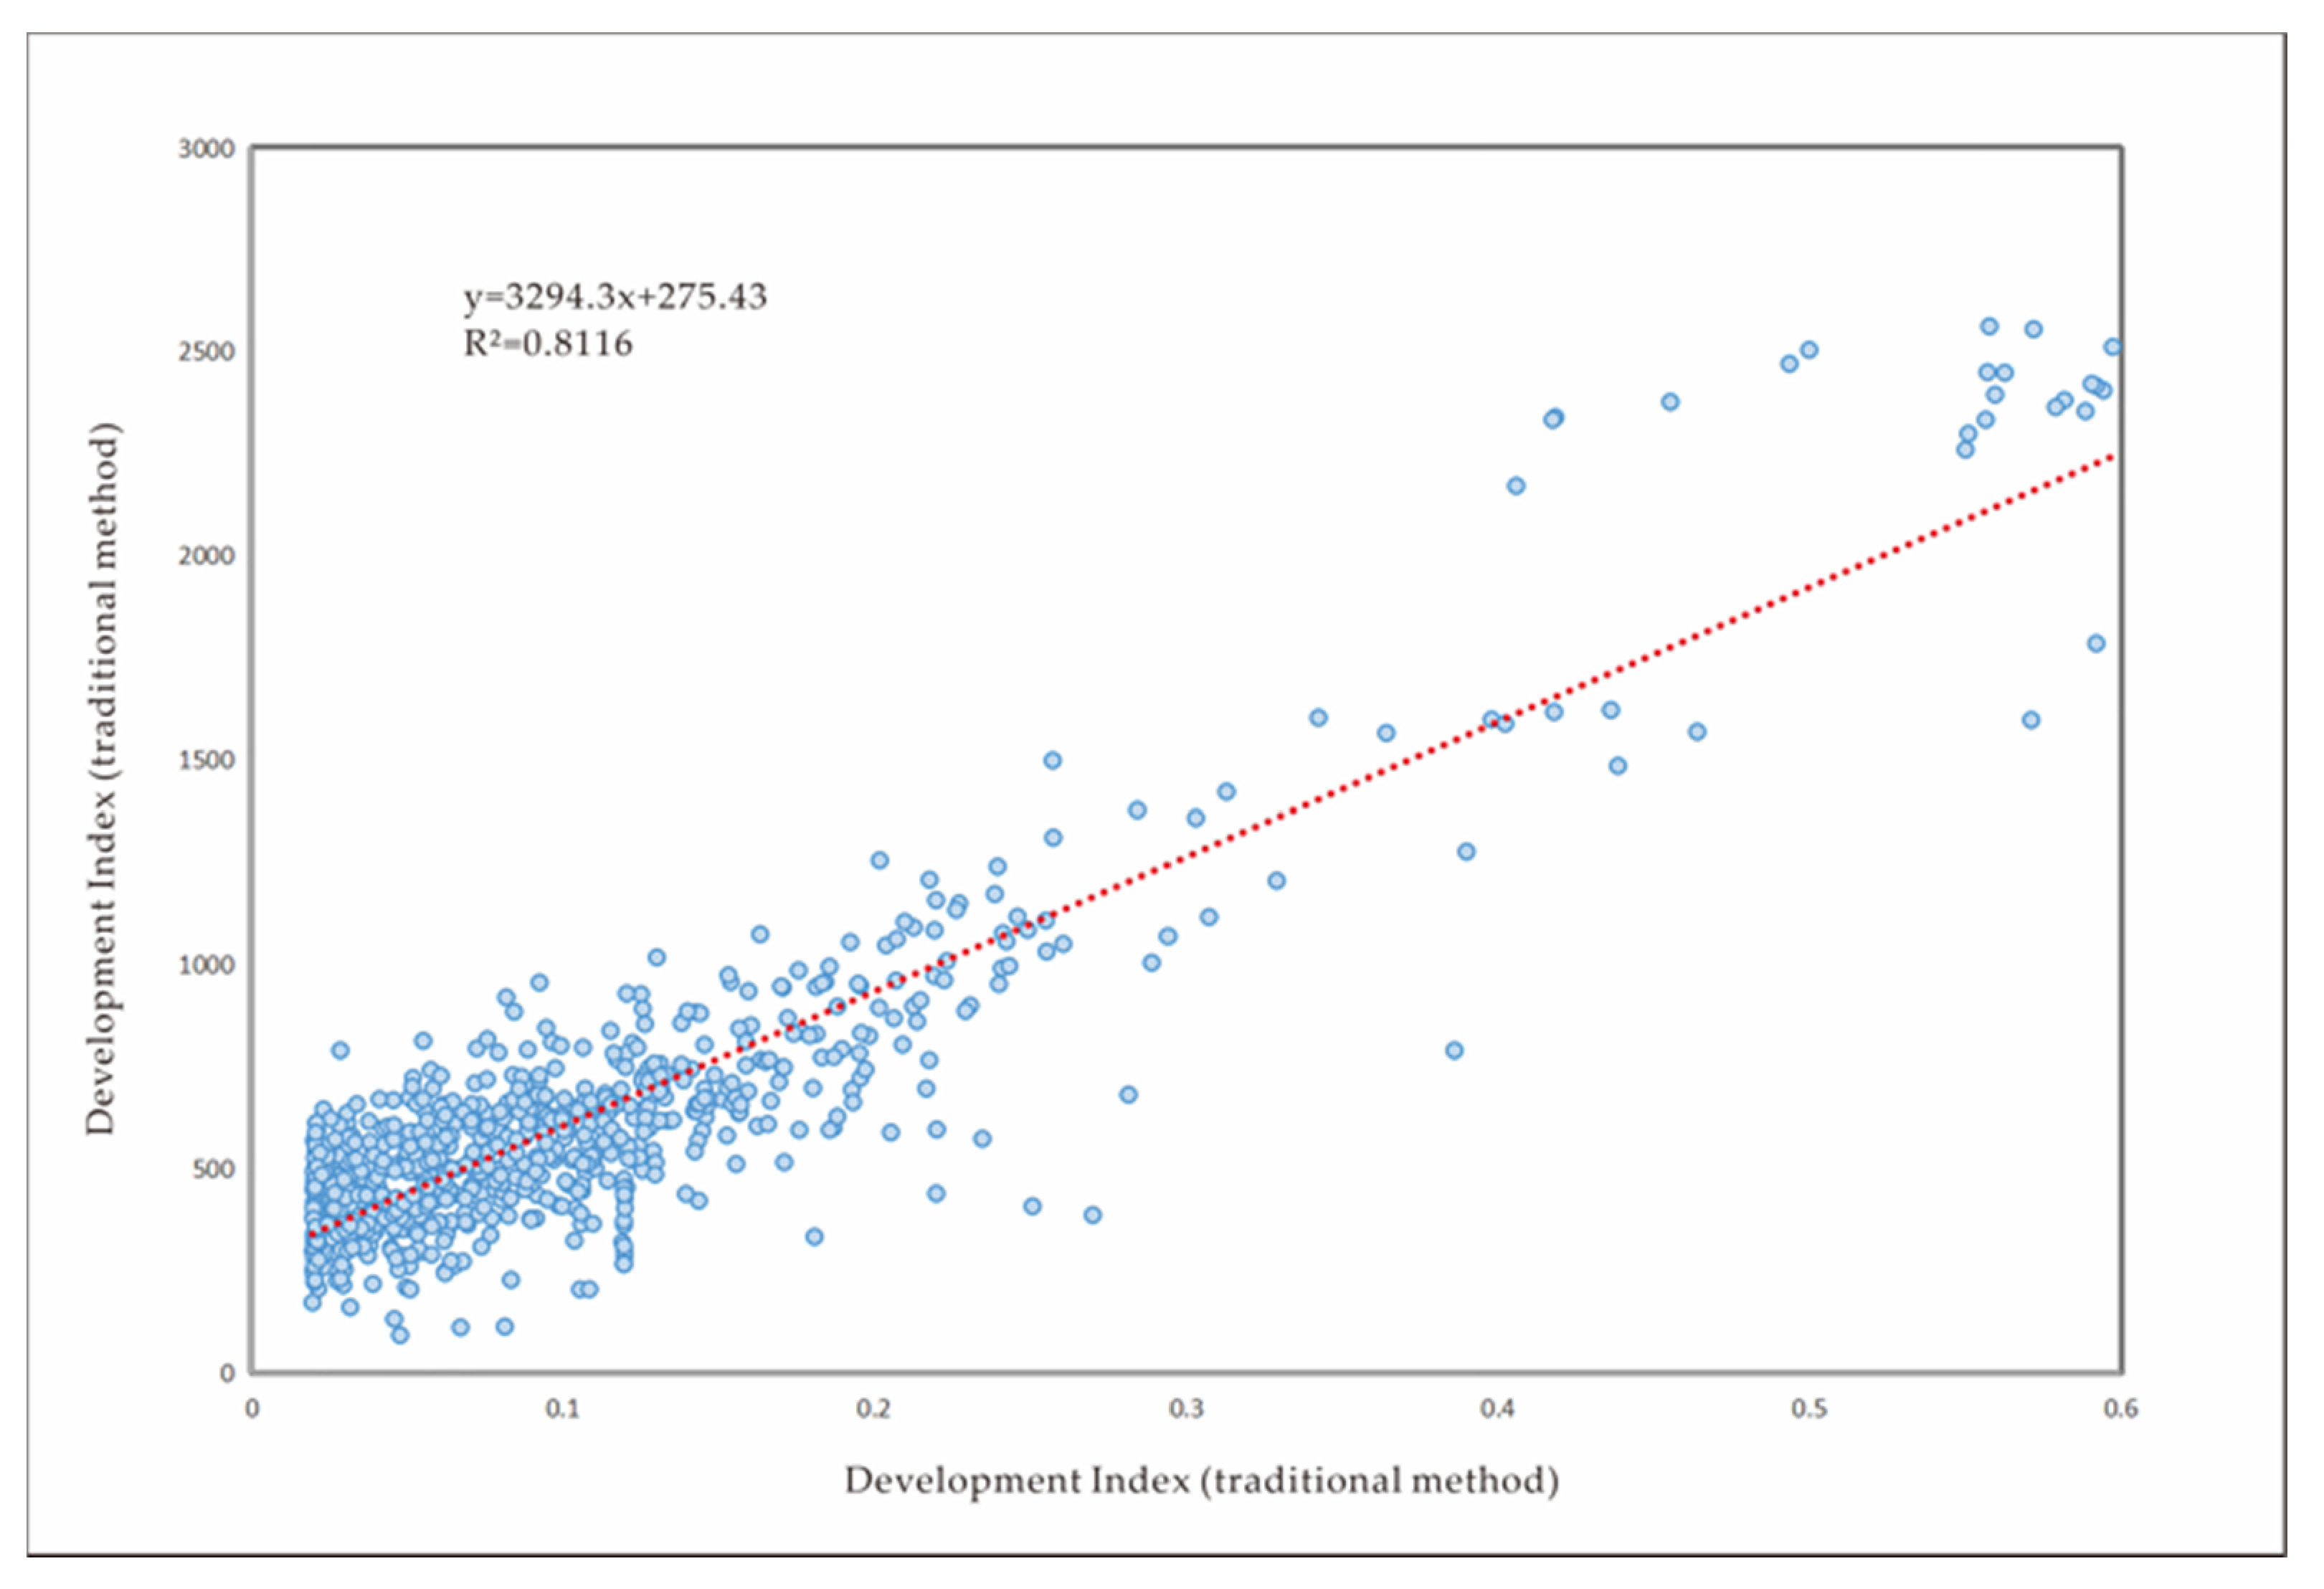
Then, we performed linear regression analysis on the comprehensive development index calculated by the traditional method and the development index calculated by the method in this paper to obtain the regression analysis result, as shown in Equation (9) and Figure 11.
y = 3294.3 x + 275.43
where x is the development index calculated by the traditional method; y is the development index calculated by the method in this paper; and R2 is the correlation coefficient of the regression.
It can be seen from Figure 11 that the regression coefficient R2 of the development index calculated using the method of this article and the development index calculated using the traditional method was 0.8116. When R2 is greater than 0.8, it can be considered that the two variables are highly correlated. Therefore, the correctness of the method in this paper was proven.

4. Discussion

4.1. Significance to the Development of Ethnic Minorities

There are obvious differences in the development of different ethnic minorities and the development of the same ethnic minorities in different regions. This paper used the relationship between night-time light remote sensing data, economy, and population to establish the development index of ethnic minorities. The results can be analyzed by (1) the size of development differences among different ethnic minorities; (2) differences of the same minority in different minority prefectures and counties; and (3) the relationship between the development index of various ethnic minorities and geographical location. The factors in the ethnic development index model constructed in this paper can be changed, and more factors can be added according to different research purposes. This lays the foundation for the future development direction of ethnic minorities and the formulation of development policies.
Compared with the traditional research on statistical yearbooks, the method in this paper was faster, saved time, and could obtain the long-term national development status in time. In this way, we can quickly understand the development of each nation in time and space. For a multi-ethnic country, timely access to the development status of each ethnic group is conducive to adjusting policies on ethnic population, economic, and other fields to achieve coordinated and balanced development of all ethnic groups to the greatest extent, thereby reducing ethnic conflicts. The method studied in this article can not only target different ethnic groups, but can also be extended to different races and special groups (for example, using the method of this article to study the development of Blacks and Whites, and make a spatial distribution map), or different species. This is of great significance for the sustainable development and coordinated development of the world.
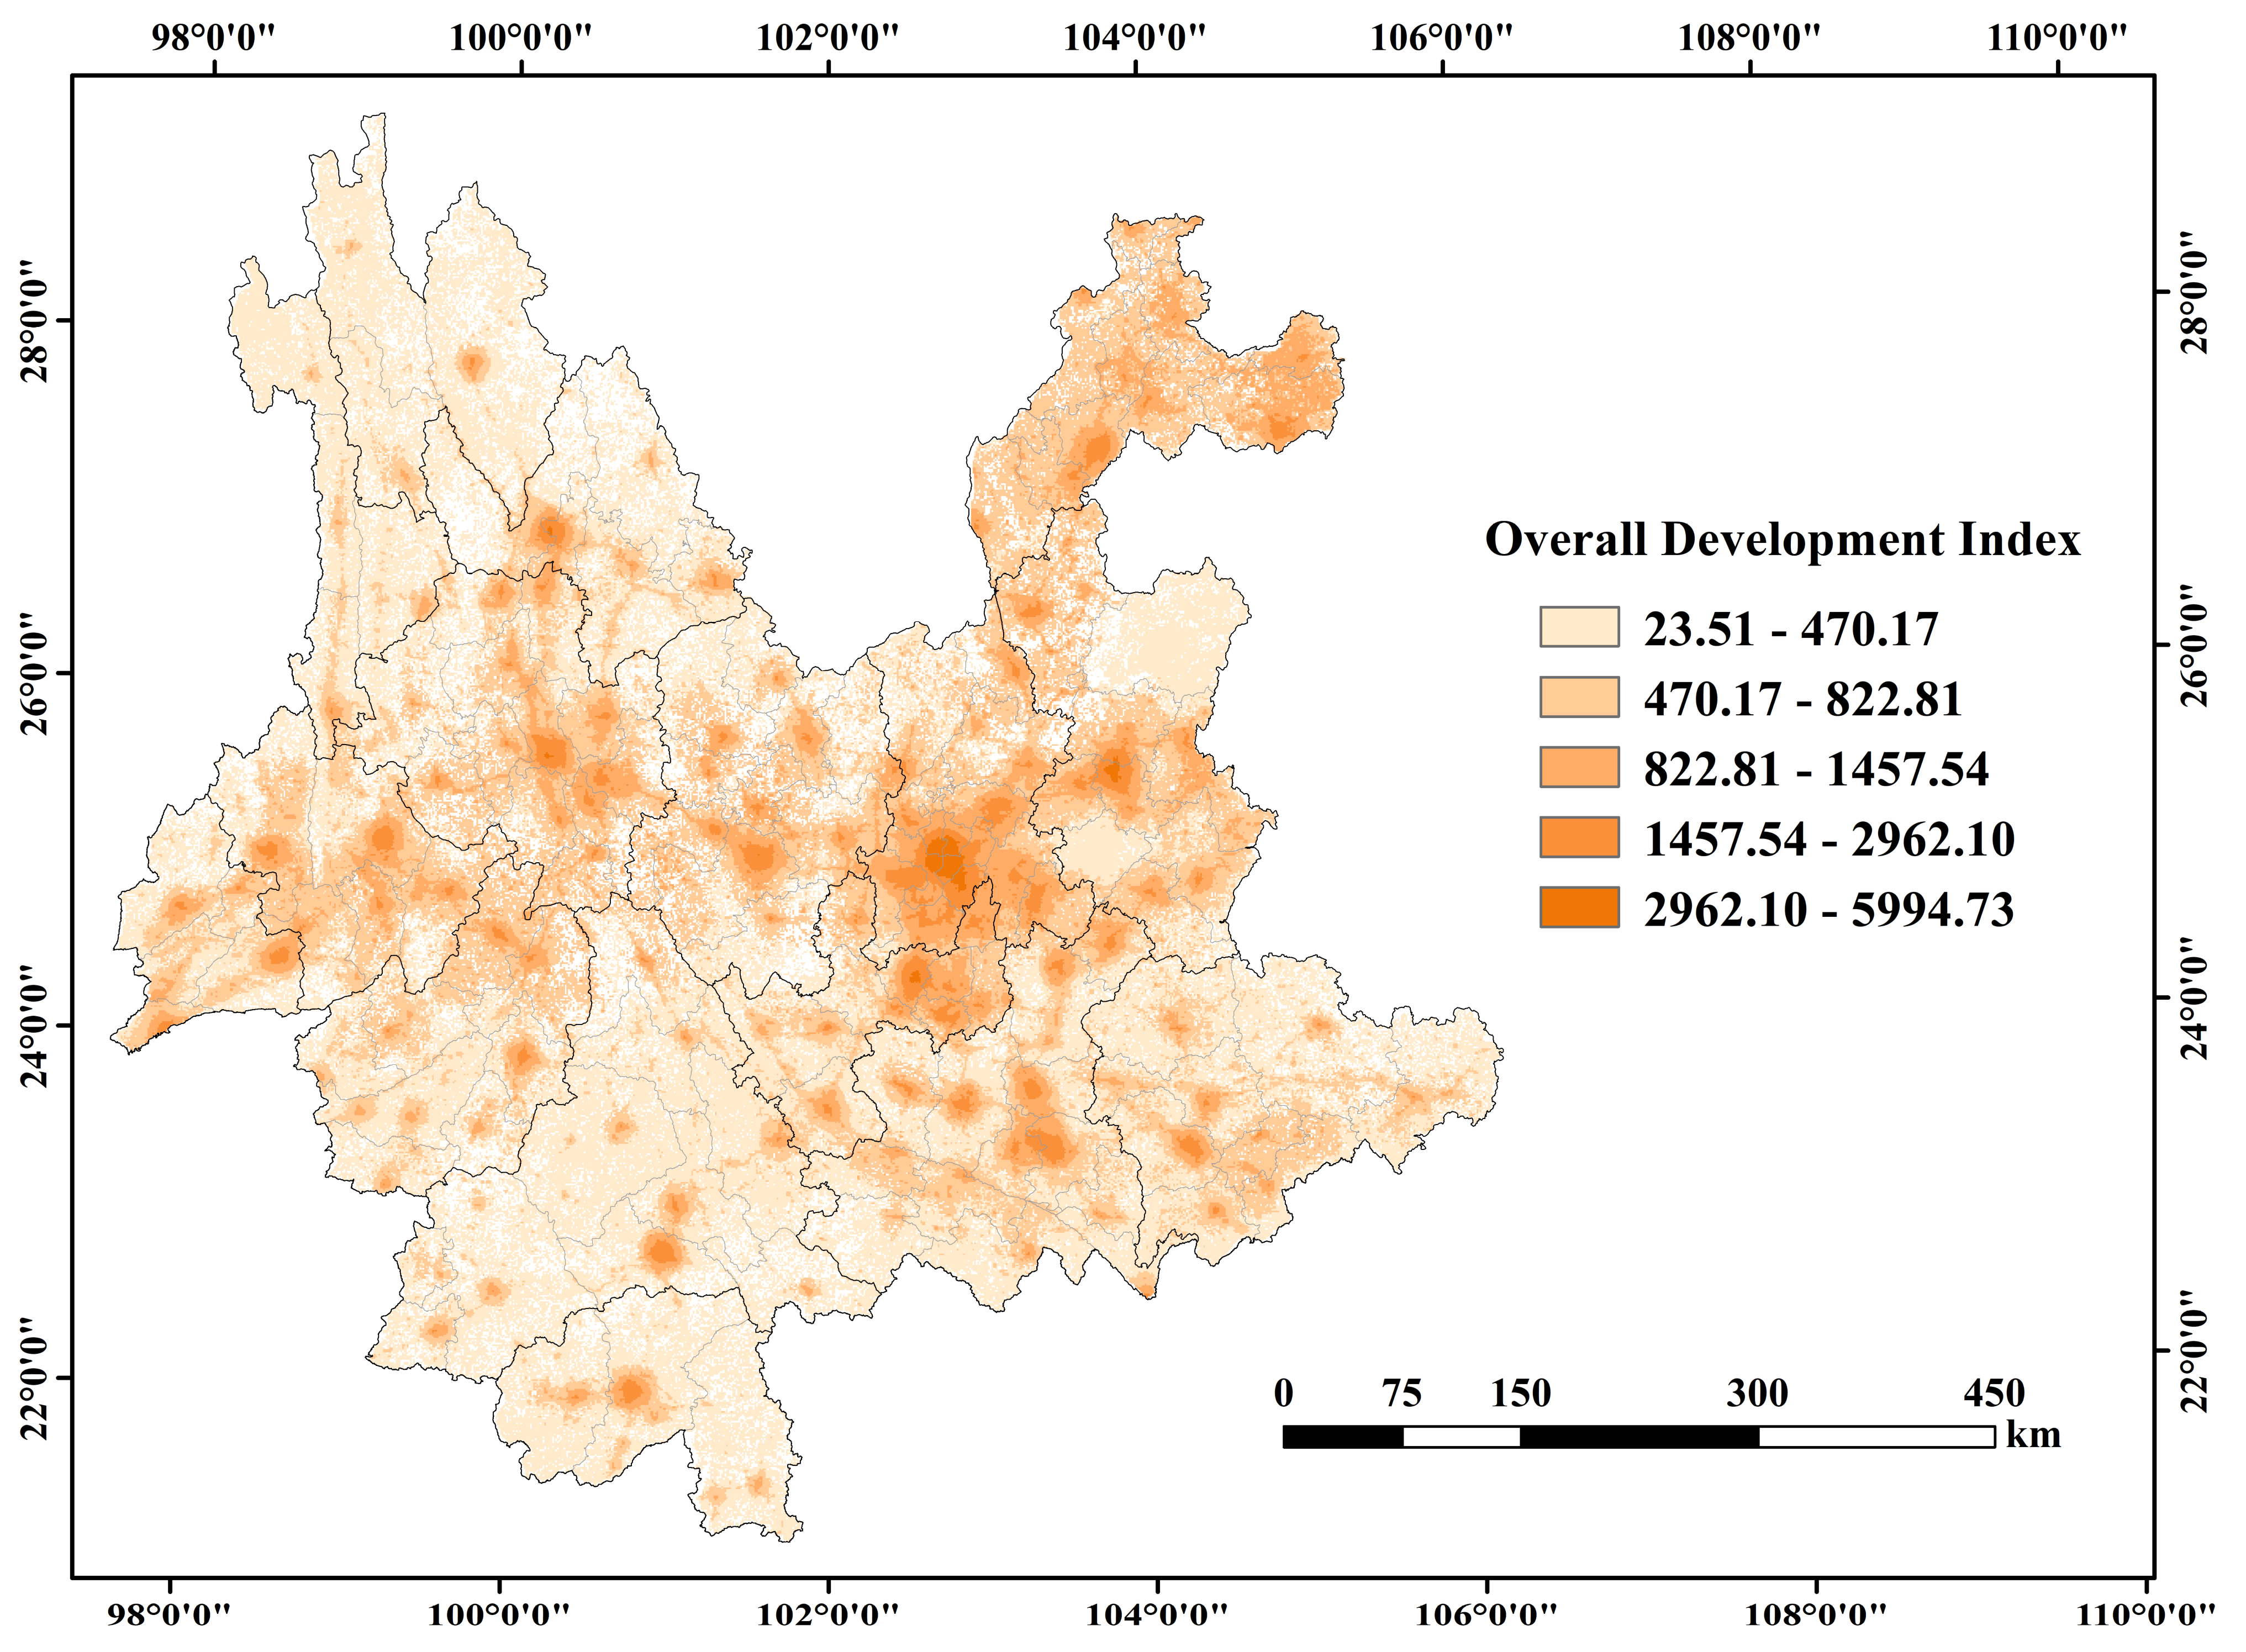
We used the method described in this article to calculate the development index of all ethnic groups in Yunnan Province, and used the natural discontinuity method to divide the development index into five categories. The first category was excellent-developed areas, the second category was well-developed areas, the third category was medium-developed areas, the fourth category was poor-developed areas, and the fifth category was very poor-developed areas. The classification results are shown in Figure 12.

4.2. The Relationship between National Development and Government

It can be roughly seen from the figure that the areas with higher national development index were mainly concentrated in the center of the county. We then counted the average distance from each type of grid to the nearest government by county. The average distance from each type of grid to the nearest government is shown in Table 6.
It can be seen from Table 6 that the area with excellent ethnic development is the closest to the local government. The farther the ethnic development zone is from the local government, the smaller the development index. The area with excellent ethnic development is about 3 km away from the local government, because in China, the development circle of a region is basically centered on the government and spreads around that. With the government as the center and a radius of 3 km, the higher the level of national development. With the continuous increase in the radius, the lower the level of development. Therefore, the government’s assistance has played a very important role in the development of the nation.
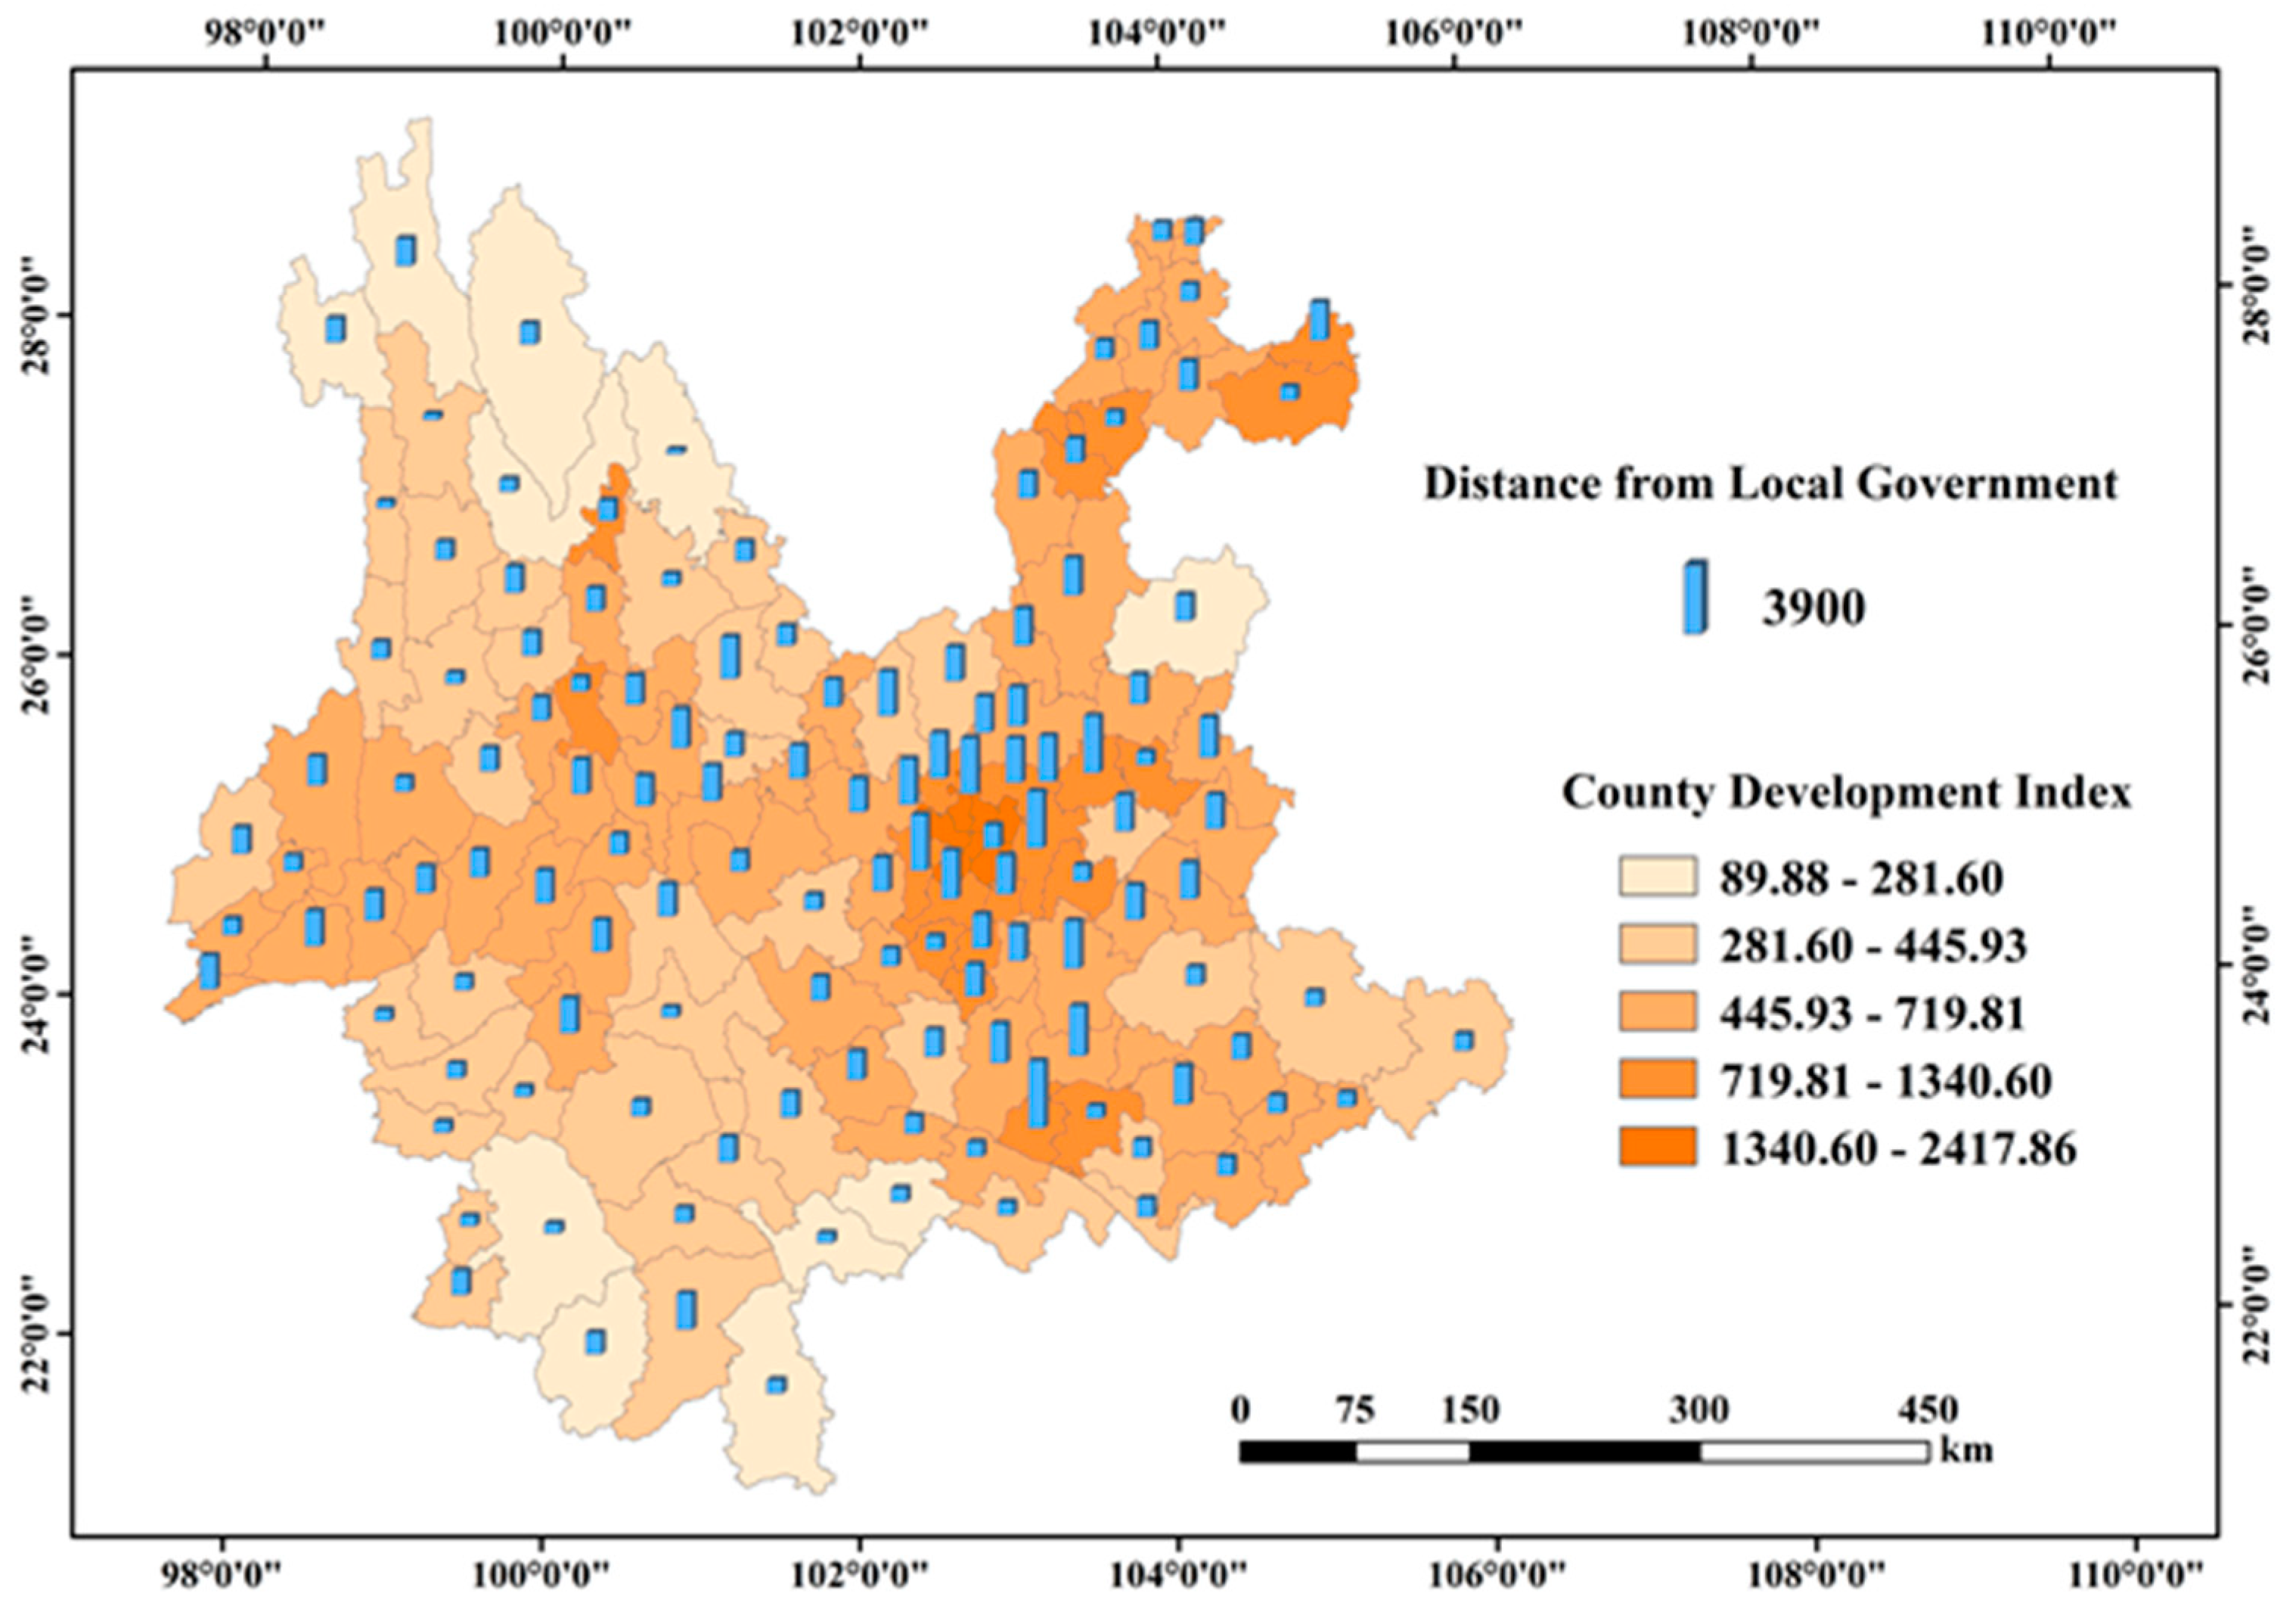
First, we carried out regional statistics on the development index of each county, selected the average development index of each county as the benchmark, and classified the overall development index according to the county level. A grid map of the development of each county was obtained. Then, we extracted the best-developed grid center in each county, and calculated the distance between the grid center and the nearest local government. Finally, the development of each county and the distance between the best-developed areas of each county and the local government are shown on a map in Figure 13.
Generally speaking, the better-developed areas were closer to the local government. However, there were two situations on the map. First, the development of the region is better, but far from the government. The reason for this phenomenon is that the development strength of these regions is relatively strong, and the role of the government is not the main one relative to the development of the region. Second, the development of the region is poor, but is closer to the government. This phenomenon occurs because the government has not maximized its leading role in the development process of the region. In future development, we should pay attention to government assistance.
In the future development of nationalities, we must pay attention to giving play to the leading role of the government, mobilize the strength of all nationalities, and unite and assist each other in order to achieve better development.

4.3. Influence on Night-Time Light Remote Sensing Mapping

Night-time light remote sensing images have been widely used in economic monitoring, population mobility, environmental protection, and other fields, but there are relatively few studies [52] on night-time light remote sensing and the development of ethnic minorities. There is basically no literature on the study of ethnic minorities combined with night-time light data. This article fills this research gap to a certain extent. This paper combines toponym data, population data, and night-time light remote sensing data, considering the development of ethnic minorities from multiple perspectives. This mapping method provides a reference for subsequent similar studies. Special thematic mapping for ethnic minorities is also not common. The establishment of the ethnic minority development index plays a supporting role in dynamically monitoring the development of ethnic minorities and narrowing the development differences between ethnic minorities in various regions.
However, there are many development indexes that affect a region such as topography, population, and production patterns. Using the method in this article cannot reflect the importance of multiple variables, but can only be reflected by the brightness of night light illumination of night-time light data. The method in this article is more efficient for calculating the overall development index of a nation, but is not suitable to reflect the importance of each variable.

4.4. Significance of Cultural Protection of Ethnic Minorities

Due to industrialization and continuous economic development, people’s production and lifestyles have undergone great changes, which has also caused many ethnic minority cultures to face crises. Therefore, we need to find the point of convergence between ethnic minority culture and economic development [55]. This article can understand the development of ethnic minorities by establishing the minority development index, which is conducive to summarizing the development laws of ethnic minorities, and has a positive effect on the protection and inheritance of ethnic minority cultures. It also responds to the call of General Secretary Xi Jinping to pay attention to the protection and inheritance of ethnic minority cultural heritage.

5. Conclusions

This article used ethnic toponym data, population data, and NPP-VIIRS night-time light data to obtain the development index of each ethnic group, and analyzed the six ethnic minorities with high development index as examples. The results showed that among the six ethnic minorities, the Yi nationality had the highest development index (28.86), and the Dai had the lowest development index (15.22). After in-depth analysis, we found the relationship between the minority development index and the minority prefecture, county, and geographic location, that is, the minority development index decreased as the distance between the minority nationality and its core development prefecture and county increased. According to the obtained development indexes of ethnic minorities, combined with the toponym data of ethnic minorities, the 25 ethnic minorities were divided into 13 categories according to the language branch classification method. Each ethnic minority was classified according to the level of the development index, and a map of the distribution of ethnic minorities in Yunnan Province was obtained. The Yi were distributed in almost the entire study area, and the distribution of other ethnic minorities had obvious regional characteristics. The overall development index of ethnic minorities in the Yi, Zhuang. and Dai, and Tibetan branch was higher, and the overall development index of ethnic minorities in other language branches was lower. In most areas, multiple ethnic minorities lived together. Among them, this phenomenon was most obvious in Dehong Prefecture, which may be related to the geographical location and cultural precipitation of Dehong Prefecture. In Yunnan Province, the two ethnic minorities, Yi and Dai, live together more often with other ethnic minorities.
All in all, this paper constructed a method to calculate the development index of ethnic minorities based on NPP-VIIRS night-time light data. This method is faster and more intuitive than other qualitative analysis methods that have focused on research and statistical yearbooks. On one hand, this method makes up for the lack of corresponding economic data in rural areas and ethnic minority areas to a certain extent. On the other hand, this article provides a new idea to study the mapping of ethnic minorities and night-time light remote sensing data. This is of great significance to the development of ethnic minorities and the protection of ethnic minority culture.

Author Contributions

Conceptualization, F.Z.; Methodology, F.Z.; Validation, F.Z., L.S. and Z.P.; Formal analysis, L.S., Z.P., J.Y. and G.L.; Resources, Z.X.; Data curation, F.Z., L.S., J.Y. and Z.P.; Writing—original draft preparation, F.Z. and L.S.; Writing—review and editing, F.Z., Z.X., L.S., Z.P., J.Y., J.D., G.L., C.C., S.F. and Y.J.; Visualization, L.S.; Supervision, F.Z. All authors have read and agreed to the published version of the manuscript.

Funding

This research was funded by the National Natural Science Foundation of China (Grant No. 41961064); the Yunnan Department of Science and Technology application of basic research project (Grant No. 202001BB050030); Plateau Mountain Ecology and Earth’s Environment Discipline Construction Project [Grant No.C1762101030017]; Joint Foundation Project between Yunnan Science and Technology Department and Yunnan University [Grants C176240210019]; Yunnan University Graduate Research and Innovation Fund Project (Grant No. 2020188).

Acknowledgments

The authors express their sincere gratitude to the Earth Observation Team, BigeMap Downloader, the National Geomatics Center of China, and the China Social Big Data Research Platform for providing the NPP-VIIRS images, POI data, toponym data, research area vector data, and census data.

Conflicts of Interest

The authors declare no conflict of interest.

References

  1. Ray, A.K. Measurement of social development: An international comparison. Soc. Indic. Res. 2008, 86. [Google Scholar] [CrossRef]
  2. Fan, Q.; Lv, J.D.; Li, M. Prediction of GDP in Northeast China Based on Nighttime Light Data. Remote Sens. Environ. 2019, 34, 3–10. [Google Scholar]
  3. Shi, K.F.; Yu, B.L.; Huang, Y.X.; Hu, Y.J.; Yin, B.; Chen, Z.Q.; Chen, L.J.; Wu, J.P. Evaluating the Ability of NPP-VIIRS Nighttime Light Data to Estimate the Gross Domestic Product and the Electric Power Consumption of China at Multiple Scales: A Comparison with DMSP-OLS Data. Remote Sens. 2014, 6, 1705–1724. [Google Scholar] [CrossRef] [Green Version]
  4. Wang, J.N.; Lu, Y.T.; Zhou, J.S.; Li, Y.; Cao, D. Analysis of China resource-environment Gini coefficient based on GDP. China Environ. Sci. 2006, 26, 111–115. [Google Scholar]
  5. Liang, Y.J.; Xu, Z.M. Modeling the Spatial Distribution of Population Based on Night Light Radiation and LUCC: A Case Study in Ganzhou District, Zhangye Municipality. J. Glaciol. Geocryol. 2012, 34, 999–1006. [Google Scholar]
  6. Doll, C.N.; Pachauri, S. Estimating rural populations without access to electricity in developing countries through night-time light satellite imagery. Energy Policy 2010, 38, 5661–5670. [Google Scholar] [CrossRef]
  7. Wang, Z.; Chen, J.H.; Cui, M.J. Prediction of GDP in Northeast China Based on Nighttime Light Data. Mine Surv. 2018, 46, 27–33. [Google Scholar]
  8. Li, X.H.; Chen, J.Z. Study on the Economic Development Model of Ethnic Minorities from the Perspective of International Comparison Reg. Reg. Econ. Rev. 2020, 3, 18–24. [Google Scholar] [CrossRef]
  9. Lu, M. A Study on the Status Quo and Countermeasures of Economic Development in China’s Ethnic Minority Regions. Mod. Econ. Inf. 2020, 3, 186–187. [Google Scholar]
  10. Jing, C.M. Status Quo of Income Gap in Western Ethnic Area and Strategy Analysis. J. Northwest Univ. Natl. 2005, 6, 80–86. [Google Scholar]
  11. Li, J.J. A Case Study of Economic Disparity in Ethnic Autonomous Regions and Its Countermeasures. J. Cent. Univ. Natl. 2008, 1, 14–24. [Google Scholar] [CrossRef]
  12. Gao, Z.G.; Liu, W. Regional Economic Differences and Coordinated Development in Northwest Minority Areas: Taking Xinjiang as an Example. Nankai J. 2016, 3, 147–160. [Google Scholar]
  13. Dai, M.; Wang, P.; Li, Y.X. Analysis of Economic Disparities and Influencing Factors in Northwest Minority Regions. Financ. Account. Mon. 2017, 12, 108–113. [Google Scholar] [CrossRef]
  14. Zheng, C.D. A Study on the “Five Development Concepts” and Comprehensive Development of the Social Economy in Ethnic Areas. J. Ethnol. 2017, 8, 1–21, 94–97. [Google Scholar] [CrossRef]
  15. Luo, J.; Zhuang, Z.X. The variation trend of economic development in the ethnic minority regions of southwest borderland since the launch of western development in china—Based on Empirical Studies in Guangxi and Yunnan from 1995 to 2014. Guangxi Ethn. Stud. 2017, 5, 156–164. [Google Scholar]
  16. Croft, T.A. Nighttime images of the earth from space. Sci. Am. 1978, 239, 86–98. [Google Scholar] [CrossRef]
  17. Li, D.R.; Li, X. An Overview on Data Mining of Nighttime Light Remote Sensing. Acta Surv. Mapp. 2015, 44, 591–601. [Google Scholar] [CrossRef]
  18. Elvidge, C.D.; Baugh, K.E.; Kihn, E.A.; Kroehl, H.W.; Davis, E.R.; Davis, C.W. Relation between satellite observed visible-near infrared emissions, population, economic activity and electric power consumption. Int. J. Remote Sens. 1997, 18, 1373–1379. [Google Scholar] [CrossRef]
  19. Elvidge, C.D.; Baugh, K.E.; Dietz, J.B.; Bland, T.; Sutton, P.C.; Kroehl, H.W. Radiance calibration of DMSP-OLS low-light imaging data of human settlements. Remote Sens. Environ. 1999, 68, 77–88. [Google Scholar] [CrossRef]
  20. Ghosh, T.; Anderson, S.; Powell, R.L.; Sutton, P.C.; Elvidge, C.D. Estimation of Mexico’s informal economy and remittances using nighttime imagery. Remote Sens. 2009, 1, 418–444. [Google Scholar] [CrossRef] [Green Version]
  21. Li, X.; Xu, H.M.; Chen, X.L.; Li, C. Potential of NPP-VIIRS Nighttime Light Imagery for Modeling the Regional Economy of China. Remote Sens. 2013, 5, 3057–3081. [Google Scholar] [CrossRef] [Green Version]
  22. Doll, C.H.; Muller, J.P.; Elvidge, C.D. Night-time imagery as a tool for global mapping of socioeconomic parameters and greenhouse gas emissions. Ambio J. Hum. Environ. 2000, 29, 157–162. [Google Scholar] [CrossRef]
  23. Elvidge, C.D.; Imhoff, M.L.; Baugh, K.E.; Hobson, V.R.; Nelson, I.; Safran, J.; Dietz, J.B.; Tuttle, B.T. Night-time Lights of the World: 1994–1995. ISPRS J. Photogramm. Remote Sens. 2001, 56, 81–99. [Google Scholar] [CrossRef]
  24. Henderson, M.; Yeh, E.T.; Gong, P.; Elvidge, C.; Baugh, K. Validation of urban boundaries derived from global night-time satellite imagery. Int. J. Remote Sens. 2003, 24, 595–609. [Google Scholar] [CrossRef]
  25. Henderson, J.V.; Storeygard, A.; Weil, D.N. Measuring Economic Growth from Outer Space. Am. Econ. Rev. 2012, 102. [Google Scholar] [CrossRef] [Green Version]
  26. Michalopoulos, S.; Papaioannou, E. Pre-colonial Ethnic Institutions and Contemporary African Development. Econom. J. Econom. Soc. 2013, 81, 113–152. [Google Scholar] [CrossRef] [Green Version]
  27. Wu, J.S.; Wang, Z.; Li, W.F.; Peng, J. Exploring factors affecting the relationship between light consumption and GDP based on DMSP/OLS nighttime satellite imagery. Remote Sens. Environ. 2013, 134, 111–119. [Google Scholar] [CrossRef]
  28. Jiang, W.; He, G.J.; Liu, H.C. Modelling Regional Socio-economic Parameters Based on Comparison of NPP/VIIRS and DMSP/OLS Nighttime Light Imagery. Remote Sens. Inf. 2016, 31, 28–34. [Google Scholar]
  29. Zhu, H.; Zhang, Q.L.; Zhang, S. Analysis of the temporal and spatial characteristics of social and economic development in Central Asia based on night-time light remote sensing from 1992 to 2017. J. Geo-Inf. Sci. 2020, 22, 1449–1462. [Google Scholar] [CrossRef]
  30. Li, G.E.; Cai, Z.L.; Liu, X.J.; Liu, J.; Su, S.L. A comparison of machine learning approaches for identifying high-poverty counties: Robust features of DMSP/OLS night-time light imagery. Int. J. Remote Sens. 2019, 40, 5716–5736. [Google Scholar] [CrossRef]
  31. Andreano, M.S.; Benedetti, R.; Piersimoni, F.; Savio, G. Mapping Poverty of Latin American and Caribbean Countries from Heaven through Night-Light Satellite Images. Soc. Indic. Res. 2020, 1–30. [Google Scholar] [CrossRef]
  32. Pokhriyal, N.; Jacques, D.C. Combining disparate data sources for improved poverty prediction and mapping. Proc. Natl. Acad. Sci. USA 2017, 114. [Google Scholar] [CrossRef] [PubMed] [Green Version]
  33. Li, G.E.; Cai, Z.L.; Liu, J.; Liu, X.J.; Su, S.L.; Huang, X.R.; Li, B.Z. Multidimensional Poverty in Rural China: Indicators, Spatiotemporal Patterns and Applications. Soc. Indic. Res. 2019, 144. [Google Scholar] [CrossRef]
  34. Donald, H.; Thomas, K.; Thomas, L.; Daniel, L.; Curtis, S.; Steven, M.; Jeremy, S.; Stanley, K.; Scott, B.; Tommy, J.; et al. First-light imagery from Suomi NPP VIIRS. Bull. Am. Meteorol. Soc. 2013, 94, 1019–1029. [Google Scholar] [CrossRef]
  35. Jing, X.; Shao, X.; Cao, C.Y.; Fu, X.D.; Yan, L. Comparison between the Suomi-NPP Day-Night Band and DMSP-OLS for Correlating Socio-Economic Variables at the Provincial Level in China. Remote Sens. 2015, 8, 17. [Google Scholar] [CrossRef] [Green Version]
  36. Elvidge, C.D.; Zhizhin, M.; Baugh, K.; Hsu, F.C. Automatic boat identification system for VIIRS low light imaging data. Remote Sens. 2015, 7, 3020–3036. [Google Scholar] [CrossRef] [Green Version]
  37. Fox, H.S.A.; Gelling, M. “book-review” Signposts to the past. Place-Names and the History of England. Geogr. Rev. 1981, 71, 231. [Google Scholar] [CrossRef]
  38. Chu, Y.; Yin, J.; Sun, D. Basic Tutorial of Toponyms; Surveying and Mapping Press: Beijing, China, 2009. [Google Scholar]
  39. Conedera, M.; Vassere, S.; Neff, C.; Meurer, M.; Krebs, P. Using toponymy to reconstruct past land use: Acase study of ‘brusada’ (burn) in southern Switzerland. J. Hist. Geogr. 2007, 33, 729–748. [Google Scholar] [CrossRef]
  40. Jett, S.C. Place-Naming, Environment, and Perception among the Canyon De Chelly Navajo of Arizona. Prof. Geogr. 1997, 49, 481–493. [Google Scholar] [CrossRef]
  41. Evereet-Health, J. Place Names of the World—Europe; Palgrave Macmillan: London, UK, 2000. [Google Scholar]
  42. Adrian, R. Placenames of the World: Origins and Meanings of the Names for 6600 Countries, Cities, Territories, Natural Features and Historic Sites, 2nd ed.; Choice Reviews Online; McFarland: Jefferson, NC, USA, 2006; Volume 43. [Google Scholar] [CrossRef]
  43. Ray, I. Linguistic Geography of Chinese Dialects. Cah. Linguist. Asie Orient. 1995, 24, 195–227. [Google Scholar] [CrossRef]
  44. Hartmann, J.F. The Power to Name Places: Ban, Muang, Chiang, Viang, Nakon, Krung. In Studies in Tai and Southeast Asian Linguistics; Harris, J., Burusphat, S., Eds.; Ekphimthai Ltd.: Bangkok, Thailand, 2007; pp. 139–154. [Google Scholar]
  45. Xu, Z.N.; Gao, X.L. A novel method for identifying the boundary of urban build-up areas with POI data. Acta Geogr. Sin. 2016, 71, 928–939. [Google Scholar] [CrossRef]
  46. Liu, Q.Y.; Zhan, Q.M.; Li, J.S.; Yang, C.; Liu, W. Extracting Built-up Areas Using Luojia-1A Nighttime Light Imageries in Wuhan, China. Geomat. Inf. Sci. Wuhan Univ. 2021, 46, 30–39. [Google Scholar] [CrossRef]
  47. Heidenreich, N.B.; Schindler, A.; Sperlich, S. Bandwidth selection for kernel density estimation:A review of fully automatic selectors. Adv. Stat. Anal. 2013, 97, 403–433. [Google Scholar] [CrossRef] [Green Version]
  48. Li, F.; Yan, Q.W.; Zou, Y.J.; Liu, B.L. Improving the Accuracy of Built-up Area Extraction Based on Nighttime Light Data and POI: A Case Study of NPP/VIIRS and Luojia 1-01 Nighttime Light Images. J. Wuhan Univ. Inf. Sci. Ed. 2019, 46, 1–14. [Google Scholar]
  49. Zhao, F.; Ding, J.Y.; Zhang, S.J.; Luan, G.Z.; Song, L.; Peng, Z.Y.; Du, Q.Y.; Xie, Z.Q. Estimating Rural Electric Power Consumption Using NPP-VIIRS Night-Time Light, Toponym and POI Data in Ethnic Minority Areas of China. Remote Sens. 2020, 12, 2836. [Google Scholar] [CrossRef]
  50. Zhou, Z.H.; You, R.J. Dialects and Chinese Culture; Shanghai People’s Publishing House: Shanghai, China, 1986; pp. 7–9. [Google Scholar]
  51. Liu, Y.H.; Xu, Y. Geographical Identification and Type Classification of Multidimensional Poverty in Rural China. Acta Geogr. Sin. 2015, 70, 993–1007. [Google Scholar] [CrossRef]
  52. Zhang, E.M.; Deng, J.; Song, X.J.; Dai, K.R.; Shi, X.L. Multi-dimensional poverty identification and evolution analysis based on night-time light data. Hubei Agric. Sci. 2019, 58, 126–133. [Google Scholar] [CrossRef]
  53. Shen, D.; Zhou, L.; Wang, P.A. Analysis of Poverty Spatial Differentiation Characteristics in Liupanshan Contiguous Destitute Area Based on Night Light Data. Remote Sens. Inf. 2018, 33, 42–48. [Google Scholar] [CrossRef]
  54. Zhang, J.Q.; Wu, Y.J.; Ge, Y.; Wang, C.H.; Kung, H. Comprehensive Evaluation of Ecological Security in Poor Areas Based on Grey Relational Model—Taking Enshi Poor Area as an Example. Geogr. Res. 2014, 33, 1457–1466. [Google Scholar] [CrossRef]
  55. Wen, K.Z. Thoughts on the Protection and Development of Ethnic Minority Culture. J. Guangdong Inst. Social. 2007, 28, 49–54. [Google Scholar]
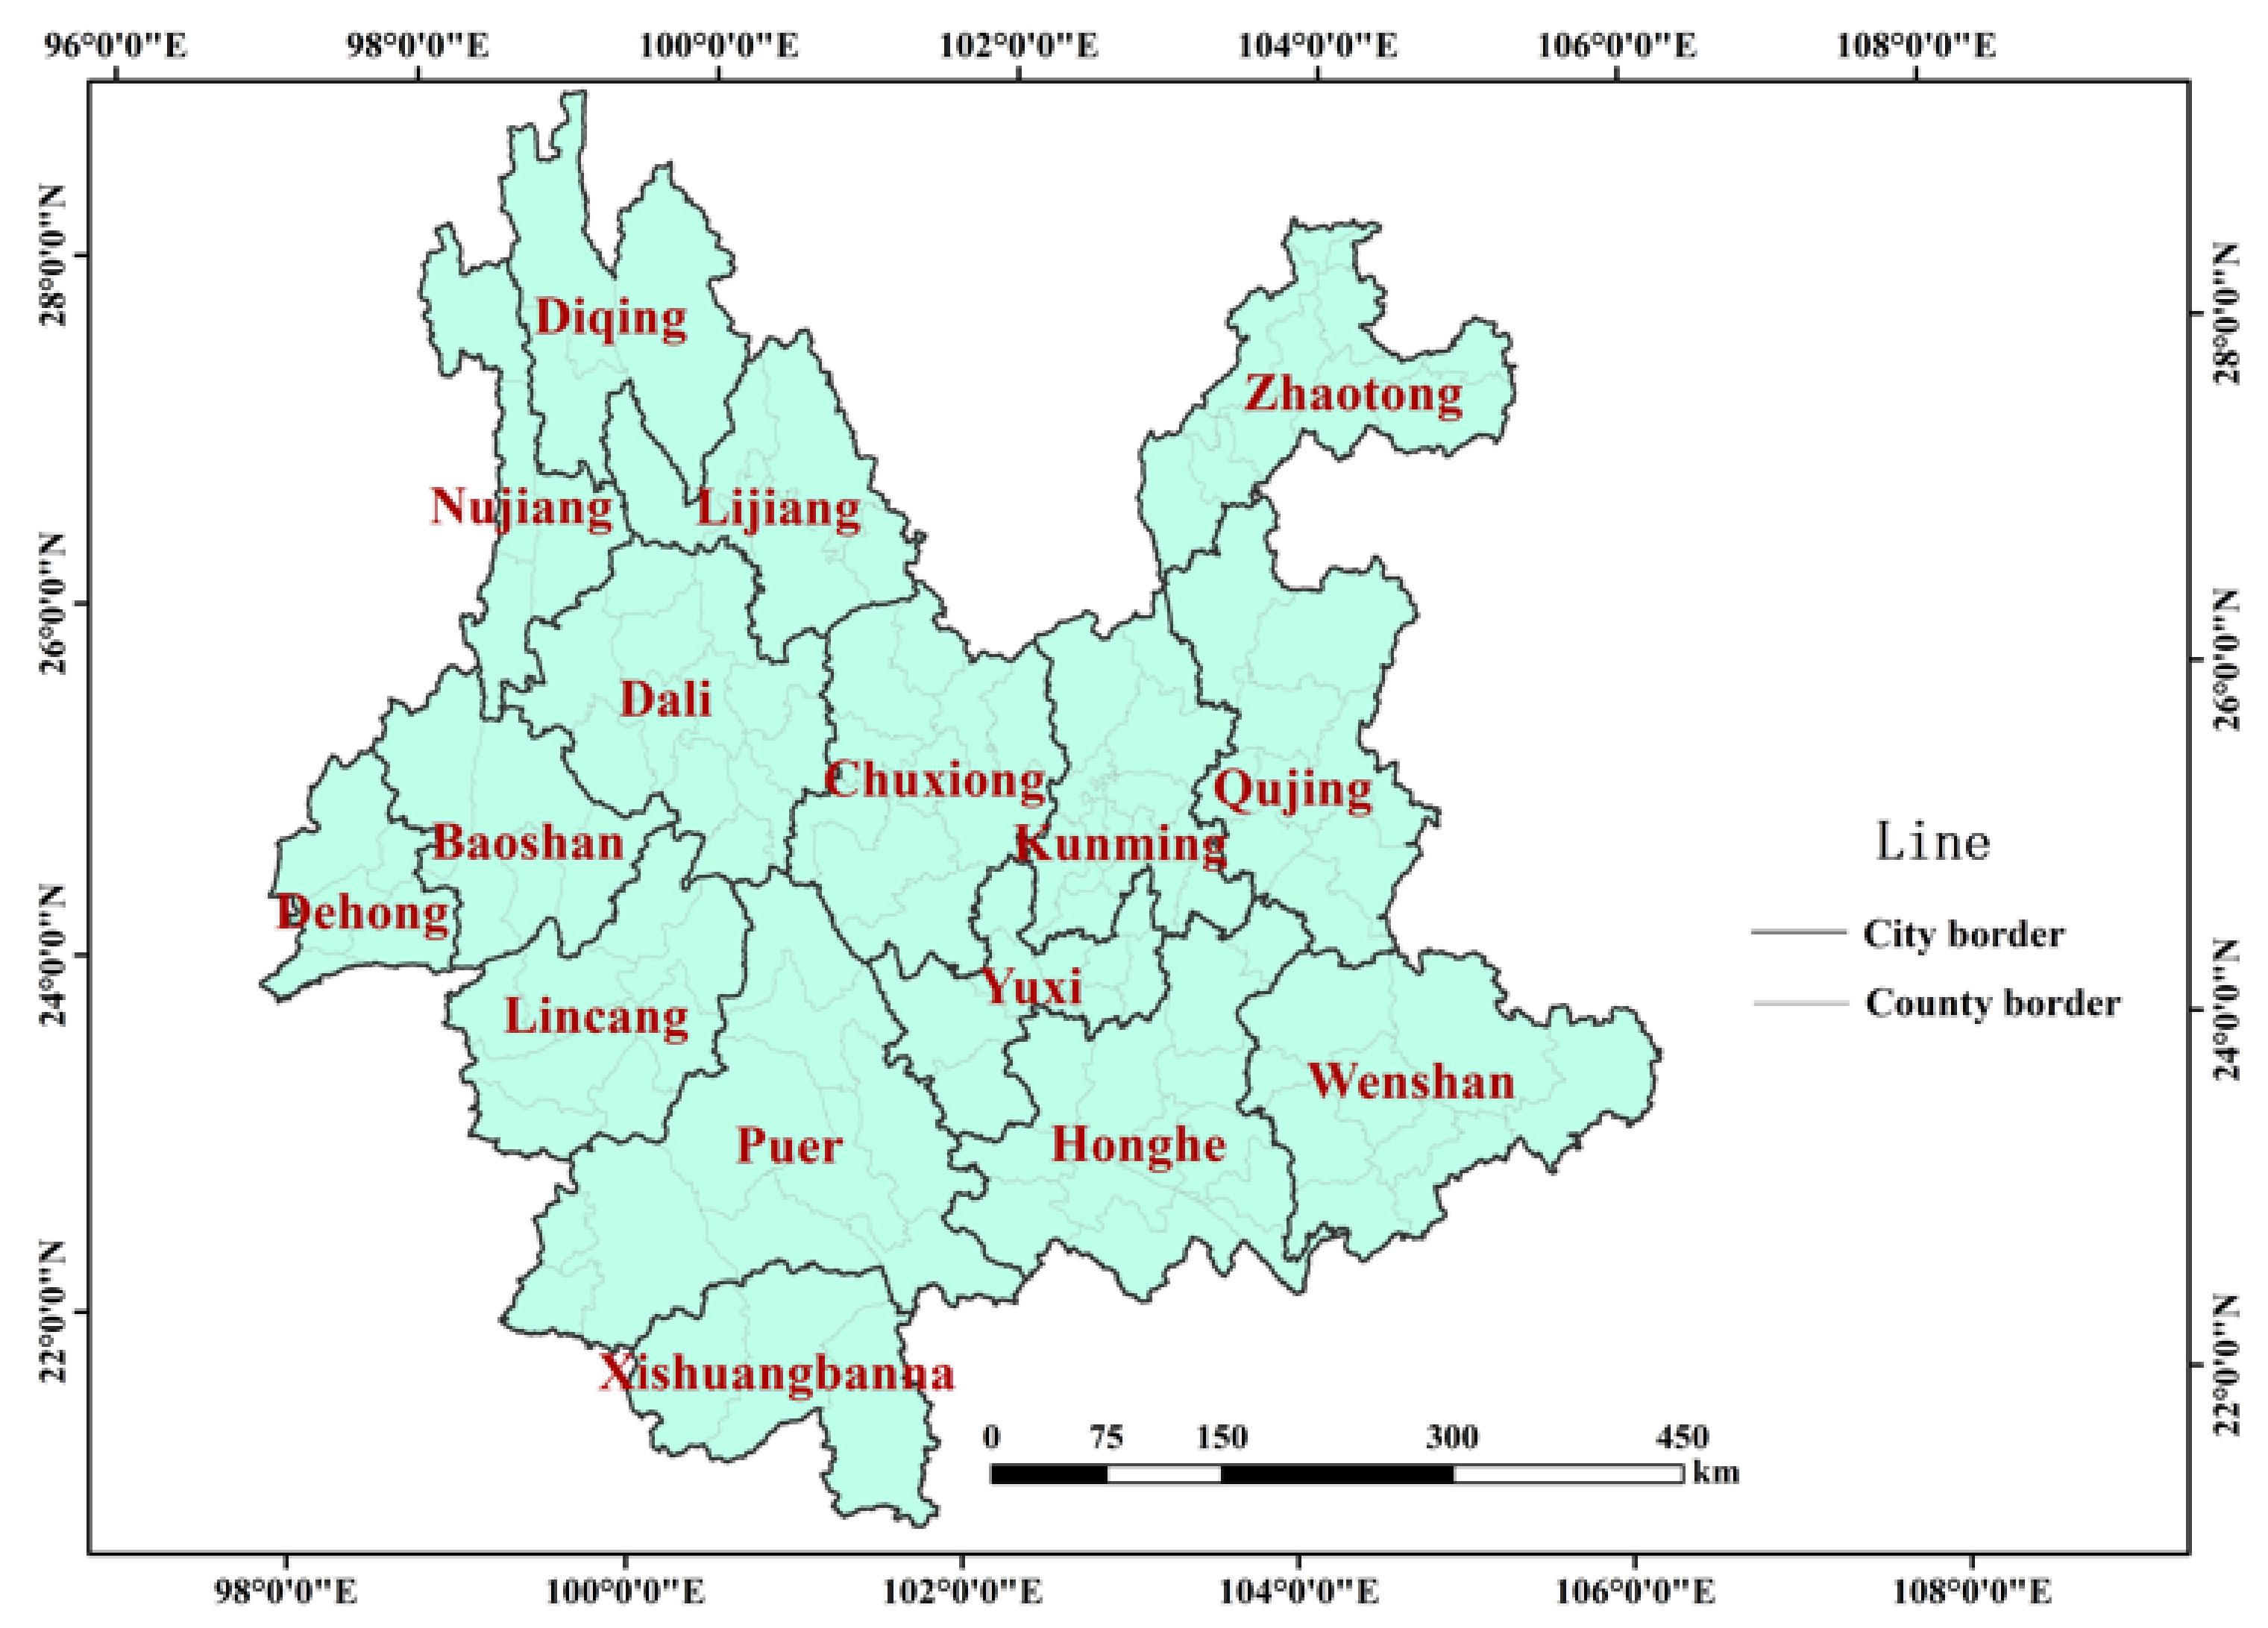
Figure 1. Geographical location and administrative boundaries of Yunnan Province.
Remotesensing 13 02129 g001
Figure 2. Flowchart of the methodology.
Remotesensing 13 02129 g002
Figure 3. Data processing results of NPP-VIIRS in 2018.
Remotesensing 13 02129 g003
Figure 4. Yi nationality development index classification results.
Remotesensing 13 02129 g004
Figure 5. Wa nationality development index classification results.
Remotesensing 13 02129 g005
Figure 6. Zhuang nationality development index classification results.
Remotesensing 13 02129 g006
Figure 7. Naxi nationality development index classification results.
Remotesensing 13 02129 g007
Figure 8. Hani nationality development index classification results.
Remotesensing 13 02129 g008
Figure 9. Dai nationality development index classification results.
Remotesensing 13 02129 g009
Figure 10. Distribution of ethnic minorities in Yunnan Province.
Remotesensing 13 02129 g010
Figure 11. Linear regression results.
Remotesensing 13 02129 g011
Figure 12. Yunnan Province nationality overall development index.
Remotesensing 13 02129 g012
Figure 13. The development status of each county and the distance from the area with the highest development index of each county to the local government.
Remotesensing 13 02129 g013
Table 1. Details of the data sources in this study.
DataData InformationYearSource
NPP-VIIRSNPP-VIIRS cloudless DNB compound monthly average data2018Earth Observation Group (EOG)
(https://eogdata.mines.edu/download_dnb_composites.html, accessed on 28 May 2020)
ToponymResults of the Second National Toponymic Census of China2019China National Geographical Names Database (http://dmfw.mca.gov.cn/, accessed on 20 May 2020)
Statistics of Yunnan Province CensusData from the Sixth Census of Yunnan Province2010China Social Big Data Research Platform (http://data.cnki.net/, accessed on 14 June 2020)
Boundaries of county-level administrative divisions in Yunnan ProvinceCounty-level vector data in Yunnan Province2017National Basic Geographic Information Center (http://www.ngcc.cn/ngcc/, accessed on 13 May 2019)
Yunnan Statistical Yearbook DataSocio-economic indicators of Yunnan Province2013–2018People’s Government of Yunnan Province (www.yn.gov.cn, accessed on 2 May 2021)
Table 2. Language branch classification.
BranchEthnic Minority
Yi BranchYi, Lisu, Naxi, Bai, Lahu, Hani, Jinuo
Zhuang and Dai BranchZhuang, Buyi, Dai
Tibetan BranchTibetan
Jingpo BranchJingpo, Dulong
Chinese BranchHui, Manchu
Other LanguagesAchang (Burmese branch), Shui (Dong Shui branch), Pumi; Nu; Mongolian, Deang (Undecided language), Miao (Miao branch), Yao (Yao branch), Wa; Bulang (Benglong language branch)
Table 3. The calculation results of the weight of each indicator from 2013 to 2018.
Year201320142015201620172018
Indicators
GDP per capita0.14460.14010.13500.13040.13210.1330
GDP Index0.04190.01520.02520.01830.01440.0277
Number of employees 0.35970.36300.37520.37320.37550.3716
Average salary of employees0.00570.00590.00520.00860.00900.0093
Per capita disposable income of rural residents0.01710.02390.02320.02300.02250.0222
Total output value of agriculture, forestry, animal husbandry and fishery0.15690.15030.14560.14530.14440.1438
Rural population0.16360.16460.16490.16670.16410.1665
Rural workers0.15200.15070.15070.15260.15230.1533
Table 4. The results of the comprehensive development index of each county from 2013 to 2018.
Year201320142015201620172018
County
Wuhua0.5565 0.4184 0.4553 0.5595 0.5919 0.5626
Panlong0.4935 0.5719 0.4175 0.5943 0.4999 0.5973
Guandu0.4058 0.5501 0.5886 0.5818 0.5571 0.5577
Xishan0.4362 0.5920 0.3979 0.3641 0.5711 0.3423
Dongchuan0.2069 0.1855 0.1970 0.1763 0.1263 0.1595
Chenggong0.1706 0.2412 0.3289 0.5510 0.5790 0.5906
Jinning0.2200 0.1880 0.1278 0.1258 0.1740 0.1603
Fumin0.0309 0.1454 0.1275 0.0793 0.0285 0.1881
Yiliang0.0802 0.1650 0.1813 0.2292 0.2224 0.2432
Shilin0.1635 0.3860 0.0723 0.1983 0.1256 0.1756
Songming0.2307 0.1250 0.1700 0.1531 0.2550 0.2424
Luquan0.1190 0.0354 0.0404 0.2198 0.0635 0.0625
Xundian0.0482 0.0228 0.1243 0.1005 0.0759 0.0975
Anning0.1812 0.0925 0.1538 0.2232 0.2606 0.2492
Qilin0.2941 0.2193 0.2126 0.3072 0.2386 0.2395
Malong0.1123 0.1928 0.1693 0.0839 0.1293 0.2136
Luliang0.1289 0.1170 0.0310 0.0507 0.1856 0.0680
Shizong0.0929 0.0283 0.1104 0.0220 0.0602 0.1154
Luoping0.0533 0.0200 0.1049 0.1091 0.1217 0.1467
Fuyuan0.1455 0.1421 0.1275 0.1070 0.1327 0.1951
Huize0.1337 0.1262 0.0275 0.0728 0.0610 0.0458
Zhanyi0.1868 0.1564 0.1065 0.0506 0.0582 0.1565
Xuanwei0.1228 0.1014 0.1931 0.0926 0.1288 0.1064
Hongta0.3898 0.2574 0.2017 0.2177 0.3029 0.2844
Jiangchuan0.2124 0.2147 0.1954 0.1948 0.2097 0.2263
Chengjiang0.2890 0.2553 0.2037 0.1633 0.2272 0.2198
Tonghai0.1425 0.0818 0.1842 0.2408 0.2071 0.2459
Huaning0.0806 0.0789 0.1427 0.0529 0.1255 0.1587
Yimen0.0270 0.1556 0.1092 0.0388 0.0239 0.1186
Eshan0.1073 0.1150 0.0641 0.1003 0.0377 0.1089
Xinping0.0507 0.1436 0.0201 0.0203 0.1204 0.1154
Yuanjiang0.0563 0.0205 0.0623 0.0751 0.0713 0.1310
Longyang0.0422 0.0615 0.1098 0.0220 0.0541 0.0646
Shidian0.0196 0.0898 0.0342 0.0203 0.0542 0.1068
Tengchong0.0290 0.0575 0.0766 0.0439 0.0550 0.1588
Longling0.1197 0.0751 0.0888 0.0423 0.0244 0.0209
Changning0.0450 0.0403 0.0283 0.0782 0.0783 0.1131
Zhaoyang0.1454 0.0551 0.1440 0.1380 0.1399 0.1832
Ludian0.0938 0.1802 0.1376 0.1312 0.1831 0.2062
Qiaojia0.1017 0.0723 0.0385 0.0712 0.0211 0.1004
Yanjin0.0391 0.0204 0.0759 0.0422 0.1075 0.1131
Daguan0.1040 0.0895 0.0613 0.1594 0.1380 0.1172
Yongshan0.1071 0.1135 0.0575 0.1412 0.0964 0.0843
Suijiang0.1458 0.0706 0.0896 0.0864 0.0877 0.0756
Zhenxiong0.0600 0.0408 0.0878 0.0424 0.0297 0.0558
Yiliang0.1195 0.1198 0.1100 0.0821 0.0885 0.1049
Weixin0.0859 0.0209 0.0809 0.1667 0.1223 0.0757
Shuifu0.0223 0.0302 0.0634 0.0380 0.0706 0.1554
Gucheng0.0924 0.0613 0.0887 0.0946 0.1542 0.1332
Yulong0.0197 0.0201 0.0578 0.0211 0.0302 0.0342
Yongsheng0.0447 0.0215 0.0626 0.0393 0.0251 0.0568
Huaping0.0271 0.0917 0.0322 0.0201 0.0556 0.0243
Ninglang0.0247 0.0216 0.0632 0.0393 0.1433 0.0790
Simao0.0651 0.0913 0.0317 0.0801 0.0302 0.0564
Ning’er0.0214 0.0308 0.0895 0.0216 0.0480 0.1134
Mojiang0.0253 0.0327 0.0297 0.0344 0.0605 0.0199
Jingdong0.0474 0.1037 0.0204 0.1062 0.1195 0.0205
Jinggu0.1055 0.1084 0.0374 0.0449 0.0464 0.0528
Zhenyuan0.0360 0.0397 0.0409 0.0687 0.0601 0.0623
Jiangcheng0.0264 0.0302 0.0202 0.0435 0.1008 0.0237
Menglian0.0294 0.0202 0.0457 0.0207 0.0453 0.0267
Lancang0.0671 0.0458 0.0204 0.0510 0.0640 0.1807
Ximeng0.0813 0.0196 0.0208 0.0767 0.0207 0.2507
Linxiang0.0295 0.0204 0.1297 0.0450 0.0535 0.0206
Fengqing0.0199 0.1145 0.0513 0.0888 0.0207 0.1274
Yunxian0.0334 0.0656 0.0211 0.0209 0.0321 0.0962
Yongde0.0273 0.0264 0.0206 0.0403 0.1061 0.1245
Zhenkang0.1196 0.0242 0.1059 0.0640 0.0198 0.0520
Shuangjiang0.0833 0.0486 0.0206 0.0440 0.0528 0.0883
Gengma0.0389 0.0459 0.0480 0.0325 0.0205 0.0563
Cangyuan0.0317 0.0201 0.0312 0.0276 0.0352 0.0569
Chuxiong0.0251 0.0231 0.1089 0.0338 0.2816 0.1152
Shuangbo0.0299 0.0536 0.0210 0.1057 0.0997 0.0580
Mouding0.1196 0.0204 0.1000 0.1567 0.2166 0.1957
Nanhua0.0581 0.0204 0.1086 0.0968 0.1148 0.1205
Yao’an0.0496 0.0685 0.0392 0.0620 0.0336 0.0608
Dayao0.0471 0.0208 0.0578 0.0443 0.0625 0.0219
Yongren0.0384 0.0339 0.0499 0.0897 0.0200 0.0800
Yuanmou0.0200 0.0208 0.0824 0.0914 0.0456 0.0410
Wuding0.0621 0.0281 0.0825 0.0366 0.0553 0.2346
Lufeng0.0287 0.0322 0.0937 0.0561 0.1170 0.1709
Mengzi0.0761 0.0203 0.0214 0.0760 0.1079 0.0890
Gejiu0.0284 0.1278 0.1015 0.0870 0.1264 0.1201
Kaiyuan0.0455 0.1137 0.1624 0.1265 0.1662 0.1792
Mile0.0906 0.1955 0.1257 0.1705 0.1895 0.1721
Pingbian0.0353 0.0507 0.0206 0.0807 0.1048 0.0269
Jianshui0.0201 0.0705 0.0245 0.0418 0.1063 0.0564
Shiping0.0199 0.0380 0.1395 0.0611 0.1143 0.0946
Luxi0.1447 0.0652 0.0994 0.0891 0.0717 0.0992
Yuanyang0.0199 0.0638 0.0708 0.0309 0.0922 0.0706
Honghe0.0230 0.1195 0.0217 0.0256 0.0238 0.1657
Jinping0.0509 0.0202 0.0208 0.0207 0.0317 0.0206
Luchun0.0477 0.0621 0.0290 0.0359 0.0618 0.0369
Hekou0.0678 0.0488 0.0540 0.0390 0.0466 0.0206
Wenshan0.1196 0.0734 0.0784 0.0527 0.1758 0.1454
Yanshan0.0590 0.0655 0.0204 0.0804 0.0204 0.1157
Xichou0.1082 0.0495 0.0737 0.0613 0.0949 0.1313
Malipo0.1195 0.1039 0.0898 0.0211 0.1296 0.2052
Maguan0.0538 0.0537 0.0206 0.0208 0.0878 0.1211
Qiubei0.0212 0.0522 0.0347 0.0264 0.0746 0.0210
Guangnan0.1195 0.0275 0.0352 0.0208 0.0579 0.0204
Funing0.0200 0.0202 0.0390 0.0370 0.0244 0.0225
Jinghong0.0339 0.0985 0.1048 0.1219 0.1242 0.0996
Menghai0.0286 0.0216 0.0309 0.0324 0.0738 0.0533
Mengla0.0546 0.1012 0.1310 0.1316 0.0516 0.1163
Dali0.2015 0.1204 0.2399 0.2192 0.1301 0.1922
Yangbi0.0202 0.0489 0.0407 0.0577 0.1129 0.0841
Xiangyun0.0971 0.0307 0.0752 0.0860 0.1438 0.1869
Binchuan0.0358 0.1710 0.0278 0.0977 0.1210 0.0878
Midu0.0577 0.1017 0.0822 0.1511 0.0946 0.1239
Nanjian0.0218 0.0967 0.0246 0.0510 0.1526 0.0868
Weishan0.0534 0.1220 0.0705 0.1026 0.0599 0.0919
Yongping0.0740 0.0848 0.0351 0.0952 0.0422 0.0622
Yunlong0.0422 0.1352 0.0734 0.1527 0.1387 0.2176
Eryuan0.0214 0.0419 0.0310 0.0206 0.0202 0.1260
Jianchuan0.0379 0.0366 0.0211 0.0832 0.1196 0.0851
Heqing0.0715 0.0213 0.0658 0.0636 0.0688 0.0851
Mangshi0.0200 0.1012 0.1463 0.1428 0.1542 0.0607
Ruili0.0626 0.1126 0.0557 0.0518 0.1487 0.2090
Lianghe0.0343 0.1255 0.0221 0.0202 0.1423 0.1570
Yingjiang0.1195 0.0694 0.1095 0.0374 0.2701 0.0613
Longchuan0.0256 0.0949 0.0204 0.0198 0.0495 0.1184
Lushui0.0209 0.0219 0.0874 0.1034 0.0254 0.0943
Fugong0.0289 0.0288 0.0217 0.0427 0.0465 0.0644
Gongshan0.0204 0.0498 0.0332 0.1214 0.0707 0.0924
Lanping0.0272 0.0383 0.0282 0.0199 0.0686 0.0912
Shangri-La0.3128 0.4385 0.2572 0.4639 0.4023 0.4179
Deqin0.0506 0.0309 0.0282 0.0950 0.0798 0.0859
Weixi0.0772 0.0261 0.0730 0.1198 0.0490 0.0460
Table 5. The development index result calculated by the method in this paper.
Year201320142015201620172018
County
Wuhua2333.1825 2339.1373 2376.7834 2394.4854 2415.8620 2448.1288
Panlong2470.0052 2554.7521 2333.1047 2404.9305 2504.0174 2511.2501
Guandu2170.9487 2259.7741 2353.8594 2381.0156 2449.4958 2561.8397
Xishan1621.7904 1784.9426 1598.3018 1565.5310 1597.4138 1602.9692
Dongchuan960.6572 994.8467 742.9193 836.3549 854.5164 934.8275
Chenggong943.5753 1076.5617 1205.3264 2298.8631 2363.8025 2420.8939
Jinning595.8789 627.4076 688.4572 711.8920 830.7505 850.9899
Fumin612.8931 695.4732 746.5198 784.6463 789.6833 897.2893
Yiliang625.2049 761.7744 830.1322 886.5681 962.0898 996.5625
Shilin766.8347 789.6061 794.6279 825.1524 891.7881 985.6760
Songming899.6777 927.3485 946.6784 973.7795 1107.7790 1056.7363
Luquan320.2183 364.9809 400.2450 438.9507 448.5508 576.7864
Xundian517.4374 522.8907 539.6836 574.8628 601.3995 746.0349
Anning945.3103 955.8508 957.5187 1008.2649 1050.5527 1084.9657
Qilin1069.2507 1084.1809 1090.9449 1116.4519 1172.8232 1240.0189
Malong649.2351 693.1274 712.2659 729.2838 757.7143 860.7674
Luliang543.4304 554.4877 576.5027 589.5539 595.1228 638.4553
Shizong483.0773 485.1854 500.8513 519.5551 526.3722 657.7111
Luoping491.1515 417.1506 518.5569 531.6147 554.2872 672.6678
Fuyuan633.7029 641.5798 652.7819 663.3065 674.2953 782.7485
Huize617.1130 647.3857 481.3886 507.0445 558.0216 605.9378
Zhanyi600.3138 635.8879 660.7369 673.4620 696.3811 843.4202
Xuanwei623.7029 656.5798 662.7819 673.3065 684.2953 796.7485
Hongta1276.6486 1310.7777 1255.3083 1207.8354 1358.3035 1377.4974
Jiangchuan897.7480 912.4791 947.5681 952.9043 1104.6690 1133.9384
Chengjiang1004.5388 1031.8054371047.2230821074.1575441149.892661157.818511
Tonghai883.0552 919.5813 957.5814 990.6898 1062.5763 1117.2477
Huaning585.7714 595.2825 640.7928 658.2505 715.3348 811.3422
Yimen494.4001 511.3989 532.8776 551.4176 555.8165 693.6572
Eshan489.2267 549.9414 580.4157 593.6294 615.8568 664.5724
Xinping260.6868 421.3788 415.0625 415.7112 453.7176 537.3233
Yuanjiang486.8459 539.9640 559.4845 596.8433 624.0441 689.0722
Longyang433.3167 507.6858 521.9453 535.2050 590.8690 664.5847
Shidian297.5054 455.6399 417.2362 473.0716 502.3391 582.7547
Tengchong381.8499 569.4589 552.5687 604.0656 669.7669 753.0422
Longling283.7437 472.8197 460.4084 499.1058 498.2598 612.5852
Changning299.6858 441.3997 467.5553 447.8070 469.2807 565.8577
Zhaoyang803.7647 813.1024 880.7033 856.9120 885.1878 954.2087
Ludian640.0504 697.3706 741.4808 756.5885 772.3398 868.5031
Qiaojia461.1212 479.4775 498.7038 540.6888 592.3084 670.8998
Yanjin427.3850 495.8935 540.4706 557.9826 565.5458 616.2725
Daguan529.7191 622.5744 655.1364 689.8198 755.0185 767.3721
Yongshan696.0273 684.1769 741.3797 744.1170 810.3069 884.5728
Suijiang626.3479 600.9896 614.0467 641.6444 706.0032 718.7469
Zhenxiong448.4068 454.1750 578.5055 497.7722 473.2344 564.0579
Yiliang455.5056 426.6301 535.4907 578.2334 588.6284 642.6751
Weixin649.2141 576.1327 623.3148 665.7798 808.1880 817.0238
Shuifu477.7044 536.3990 554.4428 565.6362 624.9817 672.7901
Gucheng715.5696 656.3005 791.5617 844.6705 659.9559 730.8966
Yulong249.8526 278.7471 289.6164 322.6217 348.7171 434.7898
Yongsheng306.8789 315.7225 339.0830 358.6972 367.6797 455.4456
Huaping398.2136 435.1668 448.9292 465.1374 473.1283 529.3849
Ninglang483.3725 499.1192 503.1318 532.7423 568.5116 556.7700
Simao262.0737 378.4076 411.3063 423.9178 428.7674 515.5211
Ning’er205.7700 345.3506 377.4181 363.9567 380.2126 492.3221
Mojiang294.4344 320.0161 345.7805 360.6149 368.5020 492.5927
Jingdong285.6620 323.7440 442.4544 445.8952 451.9286 557.7185
Jinggu204.1723 204.5097 286.7719 300.7873 279.4673 347.8470
Zhenyuan316.8741 345.1779 366.7534 369.0427 369.2104 463.5557
Jiangcheng259.2867 353.5767 385.5516 390.8240 468.7765 490.3128
Menglian214.4475 261.5678 354.3153 353.2323 388.4604 440.2223
Lancang111.0612 131.2043 226.3668 288.6047 273.7476 333.1441
Ximeng112.9200 172.0400 326.1849 337.2044 349.1749 407.7943
Linxiang306.9635 462.6050 515.0650 507.7827 502.8663 588.0734
Fengqing380.4210 587.8980 589.8904 608.2613 611.0447 714.5013
Yunxian315.0365 499.6152 461.8195 532.8510 521.2354 619.7606
Yongde226.1955 423.5674 434.0769 478.3543 459.3394 528.0003
Zhenkang297.1114 355.5066 364.0461 370.0390 376.3777 433.9040
Shuangjiang227.5567 287.2707 326.3009 387.4047 401.0221 468.4001
Gengma217.7960 347.9124 396.2941 372.3042 356.5077 406.0964
Cangyuan160.4840 309.5874 338.4399 339.9750 354.0869 416.7235
Chuxiong433.2826 645.2557 653.4692 657.8736 681.1811 837.8980
Shuangbo252.8526 303.8850 379.6348 390.3115 407.8300 520.8493
Mouding310.4608 560.9061 615.7034 638.1917 696.1406 832.3970
Nanhua480.4072 505.4462 609.2866 625.6880 638.3771 782.9123
Yao’an209.0912 390.8838 467.7279 486.7033 523.6015 651.2314
Dayao252.5988 349.5919 369.2466 413.5369 424.8047 538.7005
Yongren345.9574 362.8734 373.2791 374.4745 446.5159 482.9805
Yuanmou339.6947 476.3847 520.1060 529.2911 571.1880 670.1142
Wuding247.2879 375.7019 384.2886 436.3690 459.5321 573.1000
Lufeng478.5784 580.9119 586.9430 591.4193 655.7322 748.1127
Mengzi457.9591 464.1473 470.5014 506.2215 511.0077 613.6647
Gejiu572.3553 600.1590 591.4074 642.3799 690.1944 748.6155
Kaiyuan668.0048 673.1953 604.3685 624.1396 766.4539 826.0011
Mile671.0291 722.1276 726.0442 747.2656 792.8220 868.9230
Pingbian305.4681 375.1979 417.6111 443.0900 444.3564 572.0882
Jianshui399.9278 458.7829 479.0721 504.5566 511.8208 618.5614
Shiping321.6694 424.4328 438.0587 446.9695 470.7730 563.0486
Luxi592.6135 609.4124 631.0997 645.3875 709.2802 801.2388
Yuanyang333.5136 363.3037 451.0659 478.7271 523.0667 617.0672
Honghe258.5071 372.6793 447.6026 464.3542 490.1732 609.1840
Jinping204.2935 221.5390 339.2894 356.5964 360.8186 465.1307
Luchun91.9753 243.7047 264.9559 309.4107 322.8647 434.3615
Hekou272.5834 350.7499 384.7263 391.4023 396.9577 475.4815
Wenshan474.0788 490.4182 499.7623 533.9054 594.8506 672.3611
Yanshan421.5922 437.0946 445.0354 464.4252 494.4376 596.4948
Xichou508.0878 515.4572 575.0413 617.1873 628.6801 727.9660
Malipo266.5631 402.8942 460.5780 461.5752 485.8210 588.7415
Maguan293.9284 356.8797 399.5391 404.3396 448.7799 523.6682
Qiubei331.6157 347.3116 384.0514 401.5665 404.9738 504.4938
Guangnan266.2608 293.2710 311.7878 352.7943 359.1112 454.3619
Funing240.5025 324.5929 340.5920 348.3029 363.3480 485.1750
Jinghong399.9671 410.0248 452.5865 539.5053 556.8493 620.9858
Menghai229.7981 276.6386 298.5195 306.0052 308.7728 339.3909
Mengla562.3500 597.2580 617.6430 697.8365 700.8417 782.5778
Dali894.2742 929.0856 952.3336 972.2778 1017.5021 1054.9061
Yangbi409.4086 504.7738 535.1718 541.4113 592.4125 669.4222
Xiangyun521.8522 635.7725 637.0776 639.2351 659.8403 773.7537
Binchuan477.8487 515.6735 532.8143 547.7162 554.5976 662.9385
Midu515.8058 614.6749 661.6881 669.8814 676.4856 796.9106
Nanjian410.8299 532.0153 545.4751 554.5118 581.0947 724.9630
Weishan495.9411 521.2475 521.6193 521.8876 559.1663 680.8504
Yongping440.5821 478.1848 494.3199 528.8982 518.7397 631.0074
Yunlong598.6572 619.4169 655.4769 698.7190 716.7159 765.8410
Eryuan365.9509 434.7853 446.9512 463.0531 471.9941 590.1621
Jianchuan312.4686 377.2469 403.1285 427.2047 436.7856 538.2106
Heqing398.3198 406.8919 437.4106 440.9969 508.3256 571.2813
Mangshi568.9163 643.5718 655.0890 658.2708 709.8286 727.3277
Ruili585.2299 621.4004 640.0733 722.0235 729.4622 804.0055
Lianghe343.3566 495.8395 512.3878 525.5199 542.1922 656.7071
Yingjiang361.4221 362.8221 365.1339 366.4192 386.2395 472.1552
Longchuan396.3737 424.4385 447.7375 450.1162 503.5420 574.8163
Lushui338.0632 425.1091 511.3545 528.6956 621.6195 678.0960
Fugong281.9702 301.0313 317.7124 378.3484 428.1135 499.3321
Gongshan449.5138 542.8045 564.2108 653.6538 657.6125 728.4643
Lanping379.1665 394.9759 399.0575 403.1246 427.0084 492.5050
Shangri-La1421.7904 1484.9426 1498.3018 1568.5310 1588.4138 1616.9692
Deqin491.5996 556.1296 606.6776 630.9152 639.8685 696.2319
Weixi378.2066 389.1270 389.1924 403.1409 415.1711 494.6600
Table 6. The relationship between the level of national development and its average distance to the nearest government.
National Development LevelAverage Distance to the Nearest Government (Unit: m)
Excellent-Developed3352.28
Well-Developed4695.77
Medium-Developed6043.98
Poor-Developed8728.84
Very Poor-Developed12,411.90
Publisher’s Note: MDPI stays neutral with regard to jurisdictional claims in published maps and institutional affiliations.