Article

Low-Altitude Remote Sensing Opium Poppy Image Detection Based on Modified YOLOv3

1
National Engineering Research Center for Information Technology in Agriculture, Beijing 100097, China
2
School of Information Science and Technology, Hebei Agricultural University, Baoding 071001, China
3
Beijing Research Center for Information Technology in Agriculture, Beijing 100097, China
4
Hebei Key Laboratory of Agricultural Big Data, Baoding 071001, China
5
School of Mechanical and Electrical Engineering, Hebei Agricultural University, Baoding 071001, China
*
Author to whom correspondence should be addressed.
Remote Sens. 2021, 13(11), 2130; https://doi.org/10.3390/rs13112130
Submission received: 21 April 2021 / Revised: 18 May 2021 / Accepted: 25 May 2021 / Published: 28 May 2021

Abstract

:
Poppy is a special medicinal plant. Its cultivation requires legal approval and strict supervision. Unauthorized cultivation of opium poppy is forbidden. Low-altitude inspection of poppy illegal cultivation through unmanned aerial vehicle is featured with the advantages of time-saving and high efficiency. However, a large amount of inspection image data collected need to be manually screened and analyzed. This process not only consumes a lot of manpower and material resources, but is also subjected to omissions and errors. In response to such a problem, this paper proposed an inspection method by adding a larger-scale detection box on the basis of the original YOLOv3 algorithm to improve the accuracy of small target detection. Specifically, ResNeXt group convolution was utilized to reduce the number of model parameters, and an ASPP module was added before the small-scale detection box to improve the model’s ability to extract local features and obtain contextual information. The test results on a self-created dataset showed that: the mAP (mean average precision) indicator of the Global Multiscale-YOLOv3 model was 0.44% higher than that of the YOLOv3 (MobileNet) algorithm; the total number of parameters of the proposed model was only 13.75% of that of the original YOLOv3 model and 35.04% of that of the lightweight network YOLOv3 (MobileNet). Overall, the Global Multiscale-YOLOv3 model had a reduced number of parameters and increased recognition accuracy. It provides technical support for the rapid and accurate image processing in low-altitude remote sensing poppy inspection.

1. Introduction

Opium poppy is an important source of narcotic analgesics, morphine, codeine, and semi-synthetic analogs (such as oxycodone, hydrocodone, buprenorphine, and naltrexone). Therefore, there are strict international restrictions on opium poppy cultivation. Any unauthorized cultivation of opium poppy in mainland China is an illegal act. For this reason, the supervisory department must carry out the monitoring of illegal opium poppy cultivation in the jurisdiction every year. The use of remote sensing images to inspect illegal cultivation of opium poppy plants is an important technique in the combat against drugs, while satellite remote sensing plays a critical role in detecting opium poppy cultivation. Liu et al. [1] proposed a method based on the single-shot multi-box detection model SSD to detect illegal poppy cultivation in Laos by utilizing Ziyuan-3 Satellite. He et al. [2] applied spectral matching classification based on images obtained by the hyperspectral imaging technology to identify opium poppy cultivation areas. Zhou J. et al. [3] improved the single-stage detection algorithm YOLOv3 to realize the detection of opium poppy images of low altitude UAV. Earlier researchers have attempted to detect large-scale opium poppy cultivation areas on satellite remote sensing images and achieved good results. However, driven by profits, small-scale illegal poppy cultivation still exists in some village areas. Compared with satellite remote sensing, the images captured by unmanned aerial vehicles (UAV) have higher spatial resolution and can acquire images of opium poppy grown in village areas and courtyards in a flexible way. Meanwhile, by changing the equipped camera, it is also possible to capture finer texture features. In response to illegal opium poppy cultivation in village areas, the UAV system is a good substitute for satellite images. The features of poppy in certain growth stages may be confused with vegetables and other plants, and are difficult to be distinguished in remote-sensing images. A skilled expert usually takes 30 s to identify the poppy from an image. In recent years, with the intensification of the crackdown on illegal cultivation of drug sources, a huge amount of image data have been captured by UAV every year, and it takes a great deal of manpower and material resources to screen and identify opium poppy cultivation sites from these images. Thus, there is an urgent need for an intelligent method to improve the detection efficiency and accuracy. For this reason, the target detection technology based on deep learning has shown promising development prospects.
Deep learning was first proposed by AlexNet [4] and succeeded in ImageNet [5] classification tasks in 2012. Then in 2014, Girshick R. et al. proposed R-CNN [6] on the basis of the convolutional neural network and the sliding window concept, since when the target detection technology has been developed rapidly. The target detection technology based on deep learning incorporates the convolutional neural network and uses the end-to-end self-learning of target features in the image to replace the traditional manual process of feature selection and extraction. Then, the candidate box or the direct regression method is applied to detect the target. The application of CNN in image classification tasks has also promoted the development of target detection. Target detection has wide applications in a number of fields, including face detection [7,8,9], pedestrian detection [10,11,12,13], vehicle detection [14,15], and important feature detection in remote sensing images [16]. The traditional target detection technology is generally based on a sliding window. This method divides a whole image into several sub-images with different sizes and positions, so as to allow the use of a classifier to determine the position of the target. Therefore, these methods require manual design of different feature extractions and classifiers. The target detection technology based on deep learning is mainly composed of two categories, i.e., two-stage methods and one-stage methods. Two-stage detection is also known as region-based method. It first generates a candidate box and then identifies the objects in the frame. Typical representatives of this type of methods include Faster R-CNN [17], Fast R-CNN [18], and Mask-RCNN [19]. The two-stage method mainly relies on the color, texture, edge or other information of the target in the image to determine a possible position first, and then uses CNN to classify the obtained position features. It has good accuracy, but is difficult to use in real-time detection tasks. The one-stage detection methods, such as YOLO [20] and SSD [21], are to directly generate detection results by classifying and predicting the boundary boxes of different positions of the target in an image using CNN. Meanwhile, the one-stage method is also an end-to-end method, which can greatly accelerate the speed of target detection.
The target detection method based on deep learning has been widely used in remote sensing images. Gao J. et al. improved the YOLOv3 feature extraction network to achieve the detection of specific buildings in remote sensing images [22]. Xu D. et al. applied the dense connection method to YOLOv3, and achieved higher accuracy on the RSOD data set and UCS-AOD data set [23]. Wu X. et al. proposed a MsRi-CCF detection method, which uses an outlier removal strategy to minimize the impact of negative detection results [24]. Avola D achieved the detection and tracking of objects and targets by improving Faster R-CNN [25]. Zhao et al. designed a self-learning neural network structure Fire_Net on the basis of DCNN, which used images containing fire for wildfire recognition [26]. Ammour et al. studied vehicle recognition in UAV images by combining CNN and support vector machine (SVM) [16]. Bejiga et al. also combined CNN with SVM and used UAV images to detect victims and their related objects after avalanches [27]. Bazi et al. proposed a new convolutional support vector machine (CSVM) and used two UAV datasets for experiments (vehicle and solar panel detection); the results demonstrated good capabilities of the CSVM network [28]. Ampatzidis et al. used the YOLOv3 model with normalized differential vegetation index (NDVI) data to detect trees in low-altitude UAV photos [29].
YOLOV3 is one of the advanced one-stage detection models, which is featured with the advantages of fast detection speed and high detection accuracy. It has been successfully applied in the field of remote sensing and UAV. This study aimed to improve the poppy detection technology based on the YOLOV3 network. First, on the basis of the original YOLOv3, we added the 104 × 104 prediction stage to improve the model’s ability to predict small targets and proposed a modified YOLOv3 poppy detection network, which provided a new solution for the rapid and accurate detection of poppy cultivation in residential areas. As a matter of fact, by adding the ResNeXt module, the proposed method could avoid the necessity to improve accuracy by increasing the depth and width dimensions. It therefore reduced the number of training parameters and provided ideas for the deployment of the model on edge devices. Finally, the ASPP module was added before the 13 × 13 prediction stage, which improved the accuracy of model detection by enhancing the multiscale extraction capability of the model.

2. Materials and Methods

2.1. Data Collection

In most areas of China, the best season to plant and harvest opium poppy is from March to August. In view of safety considerations (e.g., obstacles such as buildings and power lines) of UAV during the flight time, the flying height of UAV is set between 120 m and 200 m. The dataset used in this study was captured by the Halo PRO1600 fixed-wing UAV equipped with Sony A7R second-generation SLR camera with a 50-mm lens during 2019–2020. The flying height of UAV is set to 120 m above the ground and parameters of camera on UAV are shown in Table 1.
A total of 451 images containing illegal poppy cultivation sites were manually selected from all images collected by the UAV. Each selected images contained at least one poppy cultivation site. Then, the original image was divided into numerous sub-images with equal area, and the samples containing poppy were further screened from these sub-images. The sub-images with no poppy were discarded. Eventually, 851 sub-images were labeled and used as the initial dataset.

2.2. Data Processing

2.2.1. Remote Sensing Image

Compared with the satellite remote sensing, the images captured by UAV have higher resolution and lower cost, for which they are advantageous in the detection of illegal poppy cultivation. The SLR camera captured images at a height of 120 m from a direction perpendicular to the ground. The image captured by UAV is shown in Figure 1 below, and the metadata of the image is shown in Table 2.
To evade supervision, illegal poppy cultivation is usually organized in a concealed manner, such as single-plant planting, small-area planting, covered planting or mixed planting. Different poppy planting strategies make the features of poppy in the images obscure and difficult to distinguish, bringing extreme difficulties to target detection. The various poppy planting strategies are shown in Figure 2.

2.2.2. Data Segmentation

The size of the original image captured by UAV is around 30 M/piece, and the resolution is 7952 × 5304 pixels. In most of the images, the content of poppy occupies less than 5% of the entire image. If resizing original images in high-resolution and directly inputting them into the model for training, the number of pixels of the poppy part in the image will be greatly reduced, which is not conducive to the detection. In order to avoid this situation, a more rational strategy is to segment the original image into numerous segments of the same size (416 × 416 pixels for each segment). To achieve the above purpose, two segmentation methods can be used: simple segmentation and overlapping segmentation. The simple segmentation method is shown in Equation (1).
N = O w × O h T 2
where O w and O h represent the width and height of the original image, T represents the width and height pixel value after the block, and N represents the total number of blocks. The main drawback of this method is that there is a high probability that the same or more poppy plants in the original image will be cut into different blocks, and the target that is cut will become smaller, which will lead to unclear features, and ultimately reduce the accuracy of the target detection.
The overlapping segmentation method is shown in Equation (2).
N = O w T 1 x 1 × O h T 1 x 2
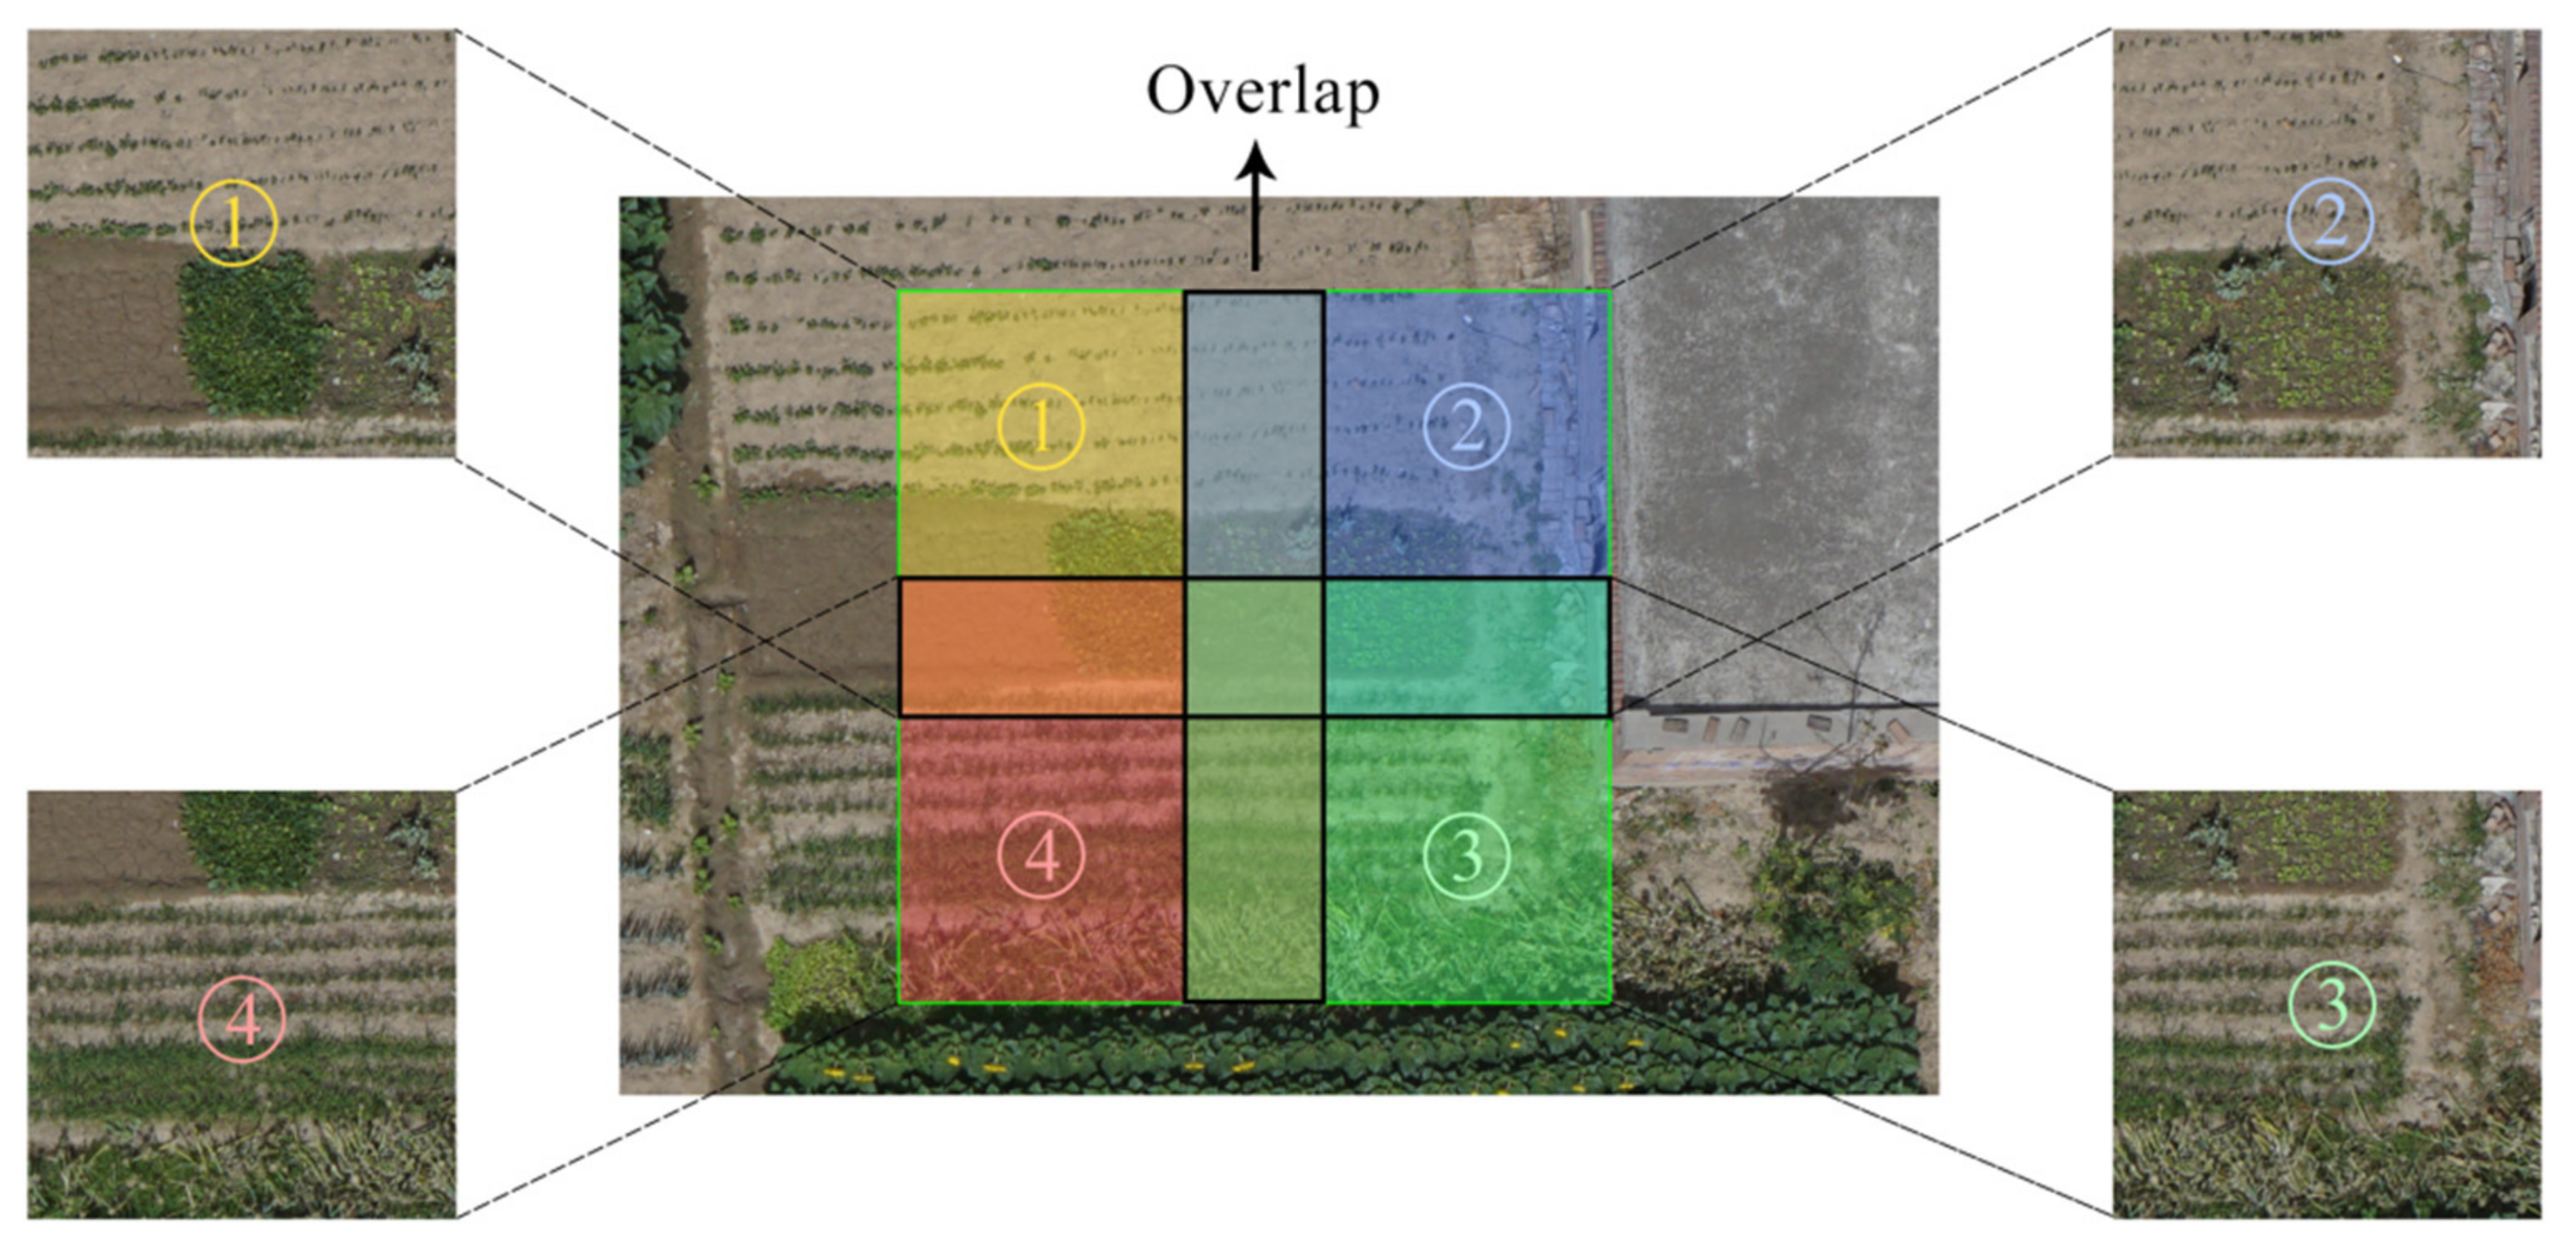
where O w and O h represent the width and height of the original image, T represents the pixel value of width and height after blocking, and N represents the total number of blocks. x 1 represents the overlap degree of the wide dimension of the image, and x 2 represents the overlap degree of the high dimension of the image. The degree of overlap we use makes x 1 and x 2 equal, that is, 1/3 overlap is used in both the width and height dimensions. The advantages of overlapping segmentation method include: (1) reducing the probability of dividing the same or multiple poppy plant into different blocks, (2) it makes the same target appear in different blocks, and realizes the sample augmentation to a certain extent.
In our work, the segmentation process was conducted following the strategy described in Equation (2). In both the height and width directions, the segmentation has a certain degree of overlap. Specifically, the degree of overlap was set to 1/3 and the value of overlapped pixels was 138. The degree of overlap was determined by comprehensively considering the workload of manual selection in preliminary work and the poppy segmentation effect. This method could ensure that the poppy in the original image would not be divided into different segments as far as possible, as shown in Figure 3. The black area is the overlapping part of the adjacent images.
The poppy cultivation sites in the image were represented by vector polygons. We labeled these vector polygons with Axis-aligned Bounding Box. For real ground data after segmentation, we manually screened each image. The sample file with no poppy after segmentation was discarded. Each sample image in the training dataset contained at least one poppy target, and each sample image corresponded to a target position file containing the coordinates of one bounding box (saved in xml format). Finally, 80% of the enhanced data in the dataset were used for training and 20% for testing.

2.2.3. Data Enhancement

The entire YOLO v3 network contains 61,523,734 parameters for training, requiring a large amount of labeled image data. However, our dataset had a limited size and could not satisfy the regular training requirement of the model. In this study, a data enhancement method was applied to augment the existing data.
To enhance the data of each sample image, the following operations were implemented to generate new samples: (1) perform transformation on brightness, contrast, and color; (2) perform horizontal mirror flip and vertical flip by 20%; (3) apply the Mosaic method for image zooming [30]. The data enhancement method can help improve the model’s feature extraction ability and generalization ability to increase detection accuracy.

2.2.4. Mosaic Enhancement

The Mosaic enhancement method for YOLOv4 used in this study referenced to the data enhancement method of CutMix [31]. CutMix enhancement uses two images for stitching, while the Mosaic method performs flipping, zooming, and color gamut transformation first, and then arranges the images according to the four directions to generate combinations of images and boxes, to enrich the background of the object to be detected. However, in the actual testing process, it was found that the detection accuracy using combined images decreased instead. Thus, only uncombined images after transformation were used as the enhanced data in this study.

3. Model Improvement

3.1. Basic YOLOv3 Network

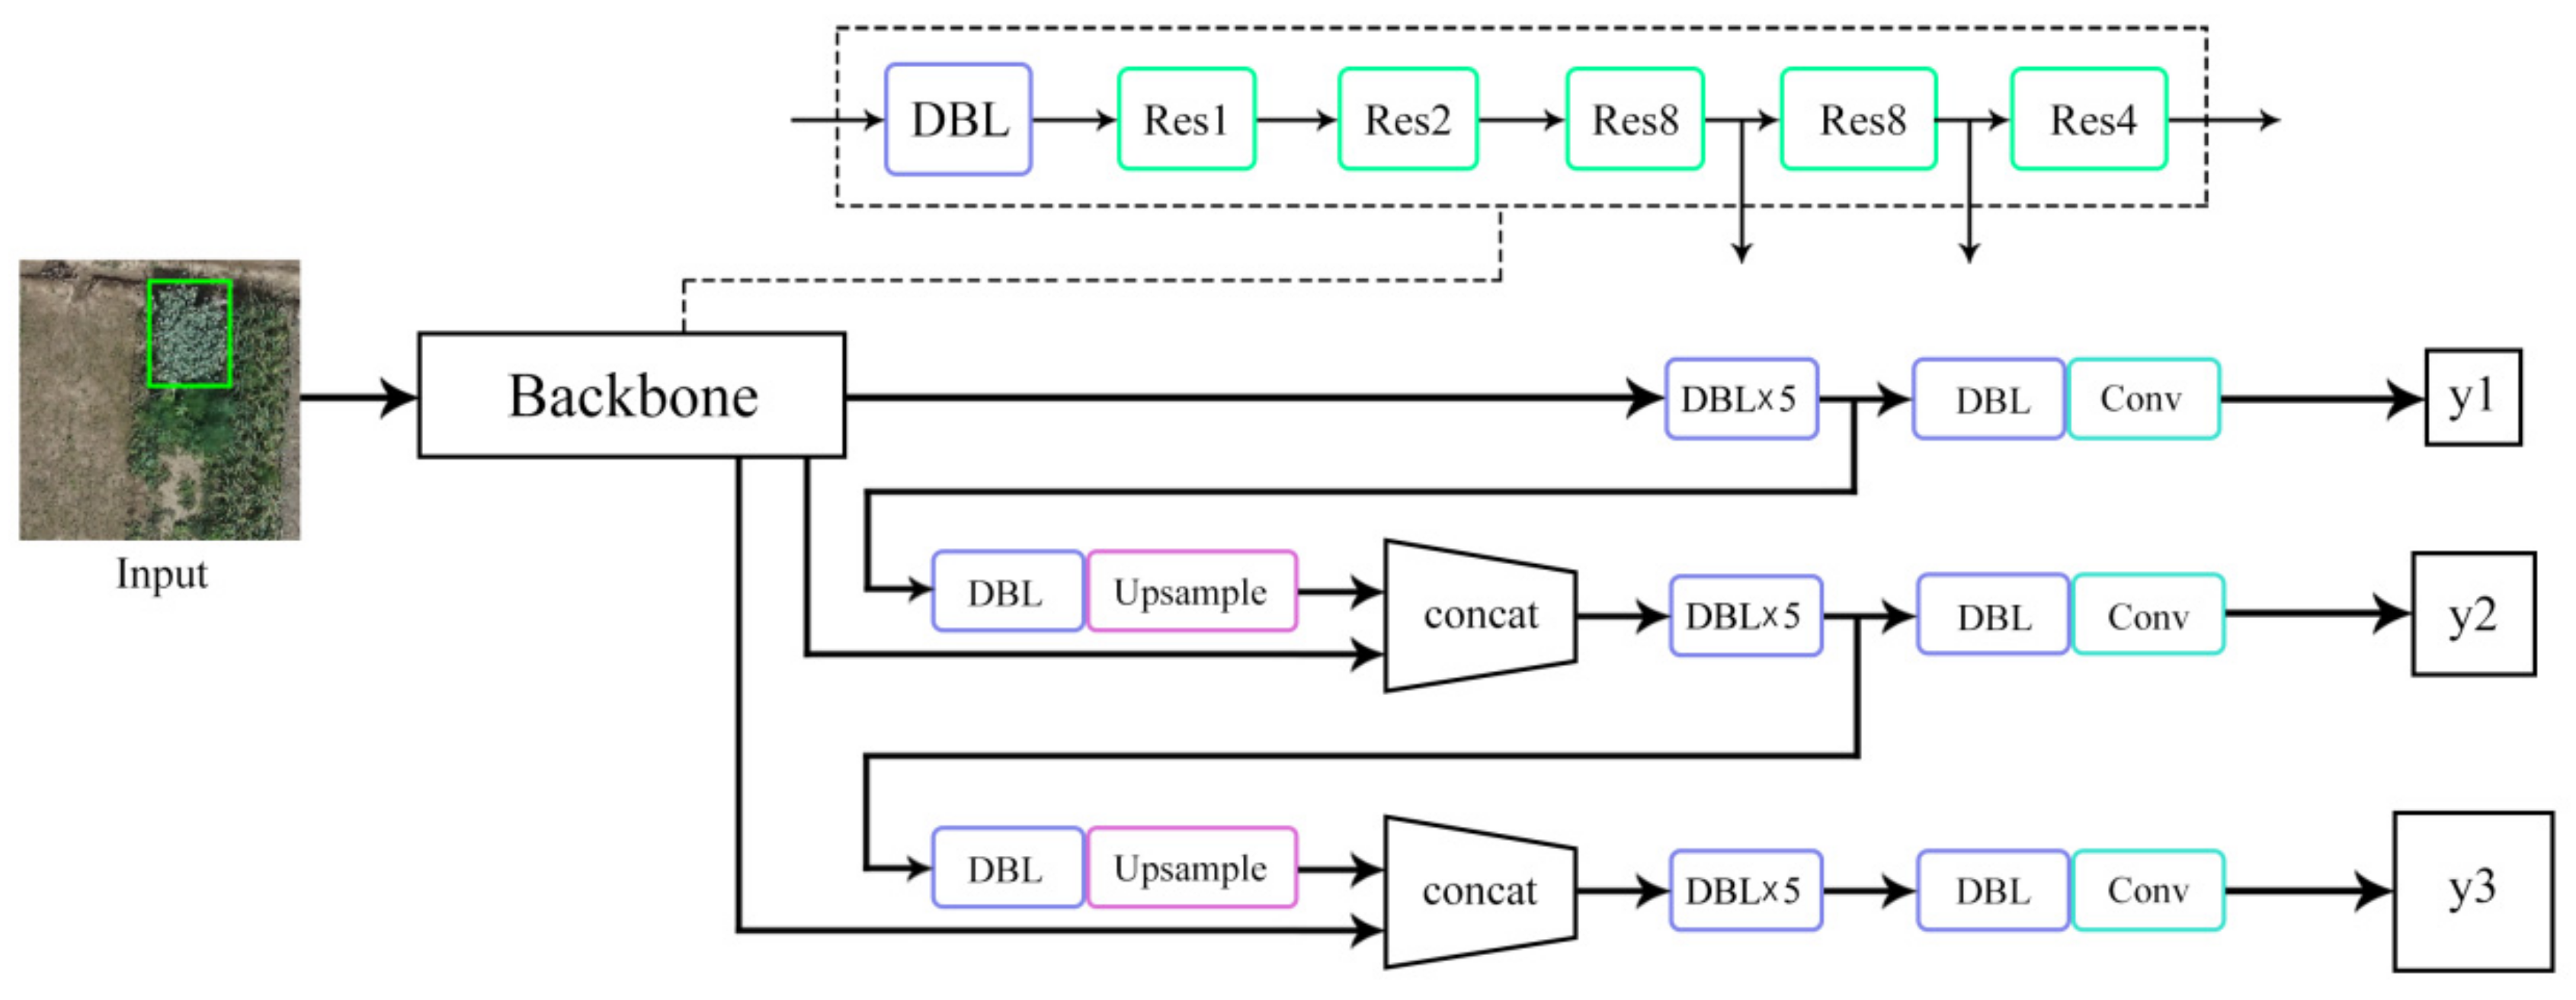
The YOLO-series target detection algorithms are mainstream one-stage detection algorithms. With improvement from YOLOv1 to YOLOv3, the detection speed and accuracy have been significantly improved. YOLOv3 is mainly based on darknet53 as the backbone network. The original network structure of YOLOv3 is shown in Figure 4. The convolution operation in this network utilizes the idea of residual structure in ResNet [32] and combines continuous 1 × 1 and 3 × 3 convolutions. Further, YOLOv3 adds a batch normalization (BN) layer after each convolution layer, and eventually connects three global multiscale features for prediction. However, YOLOv3 is still subjected to the shortcomings of large number of model parameters, high storage cost, and high calculation cost in the process of poppy detection.

3.2. Improved YOLOv3 Model

3.2.1. Construction of the Network for Poppy Detection in Villages

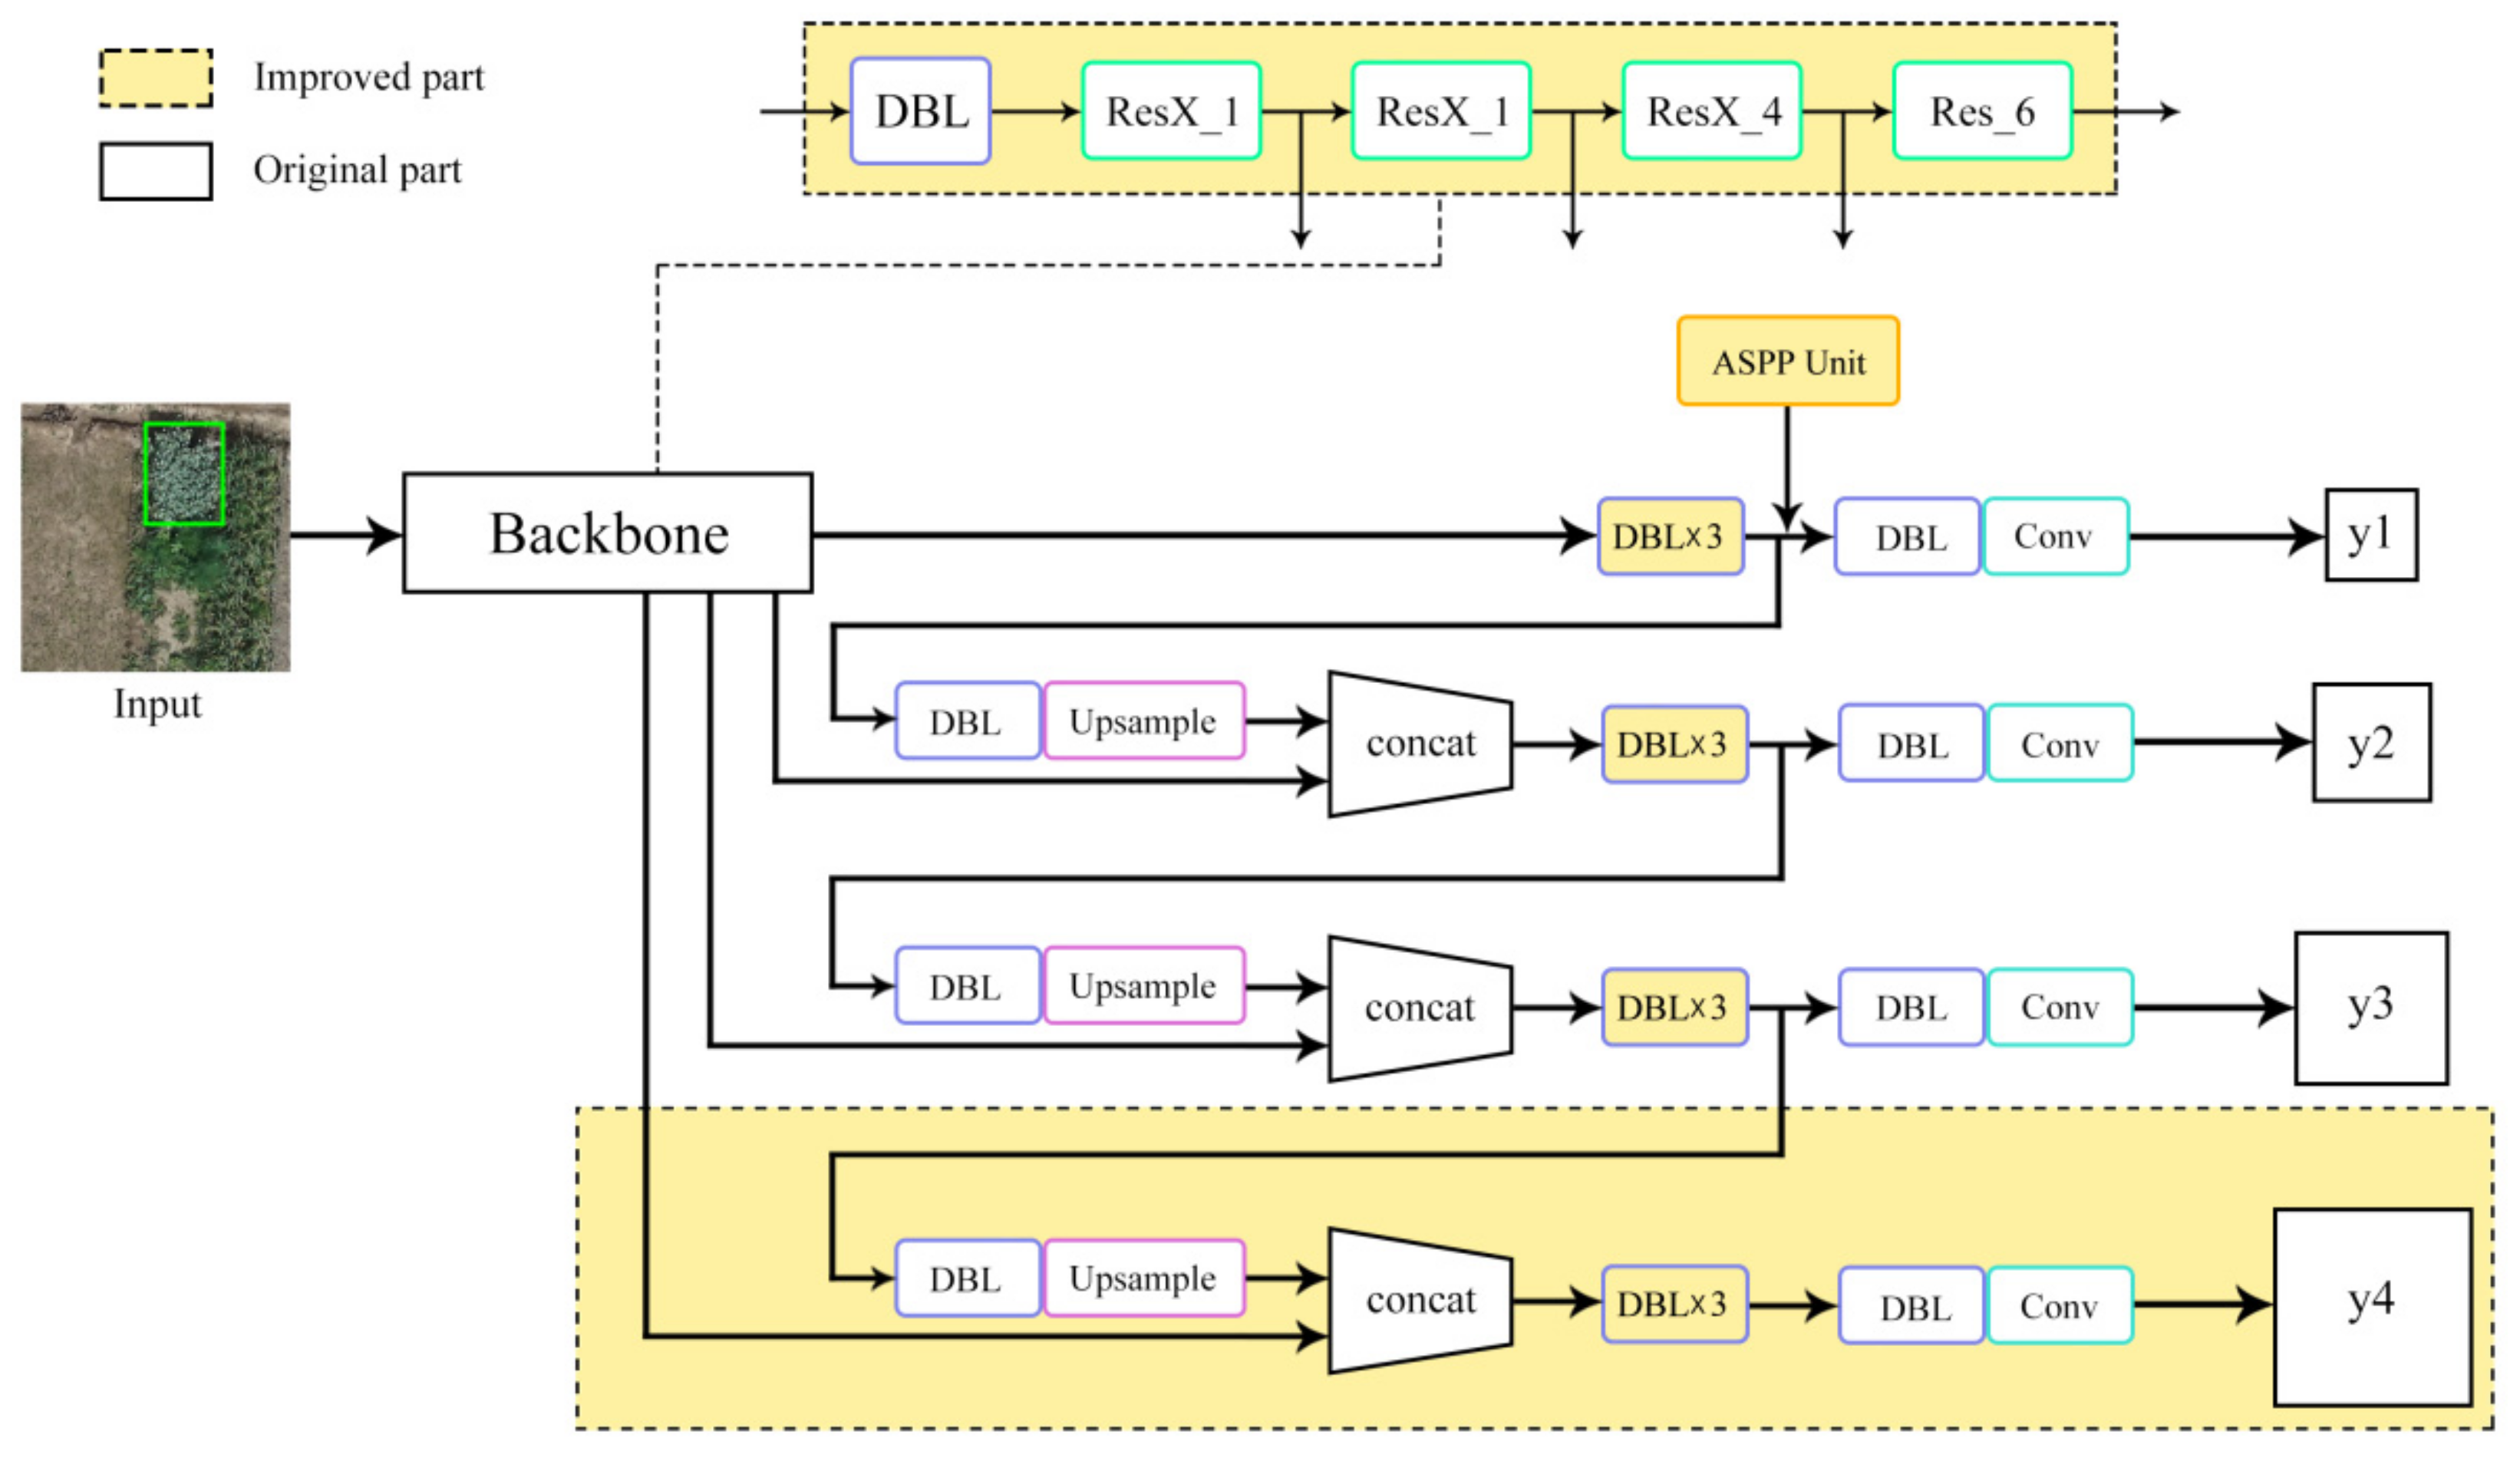
This study proposed an improved YOLOv3 network, which was named Global Multiscale-YOLOv3. Specifically, the following modifications were made on the basis of YOLOv3: 104 × 104 output was added in the prediction part of the network; the residual module of the original feature extraction network was replaced by the ResNeXt residual group convolution module; the DBL combination operation was reduced to three times; the ASPP module was added before the prediction of y1. The actual poppy cultivation may implement various complex planting strategies such as single-plant planting, multi-plant planting, and small-area planting. In single-plant planting and multi-plant planting strategies, the pixels and feature information of the image are usually limited and of different sizes. The prediction of the original YOLOv3 network uses multiscale layer global features in three stages, which has poor effect on the detection of single-plant and multi-plant small targets. The MS COCO dataset [33] defined the absolute scale of small targets, i.e., a target area with less than 32 × 32 pixels is considered as a small target. Our improved Global Multiscale-YOLOv3 network added 104 × 104 network prediction on the basis of the original prediction, when the size of the feature output layer is smaller, the receptive field corresponding to the unit pixel of the feature map is larger, that is, the feature is more abstract. On the contrary, the larger the size of the feature map output layer is, the smaller the receptive field corresponding to the unit pixel of the feature map is, that is, the clearer the feature is. The feature output layer size of the newly added channel is 104 × 104, the feature extraction ability for smaller targets is stronger, so it is suitable for detecting a single poppy target. So as to enhance the model’s ability to predict small targets. Meanwhile, the ASPP module was added before the prediction of y1 to enhance the model’s multiscale feature extraction ability. The input size of the Global Multiscale-YOLOv3 model is 416 × 416. The outputs are y1, y2, y3, and y4, and their sizes are 13 × 13, 26 × 26, 52 × 52, and 104 × 104, respectively. In Backbone, ResX is the ResNeXt module, Res represents the residual block, and DBL is the combination of the convolutional layer, Batch Normalization, and Leaky Relu loss function. The improved YOLOv3 network structure is shown in Figure 5.

3.2.2. ResNeXt Group Convolution

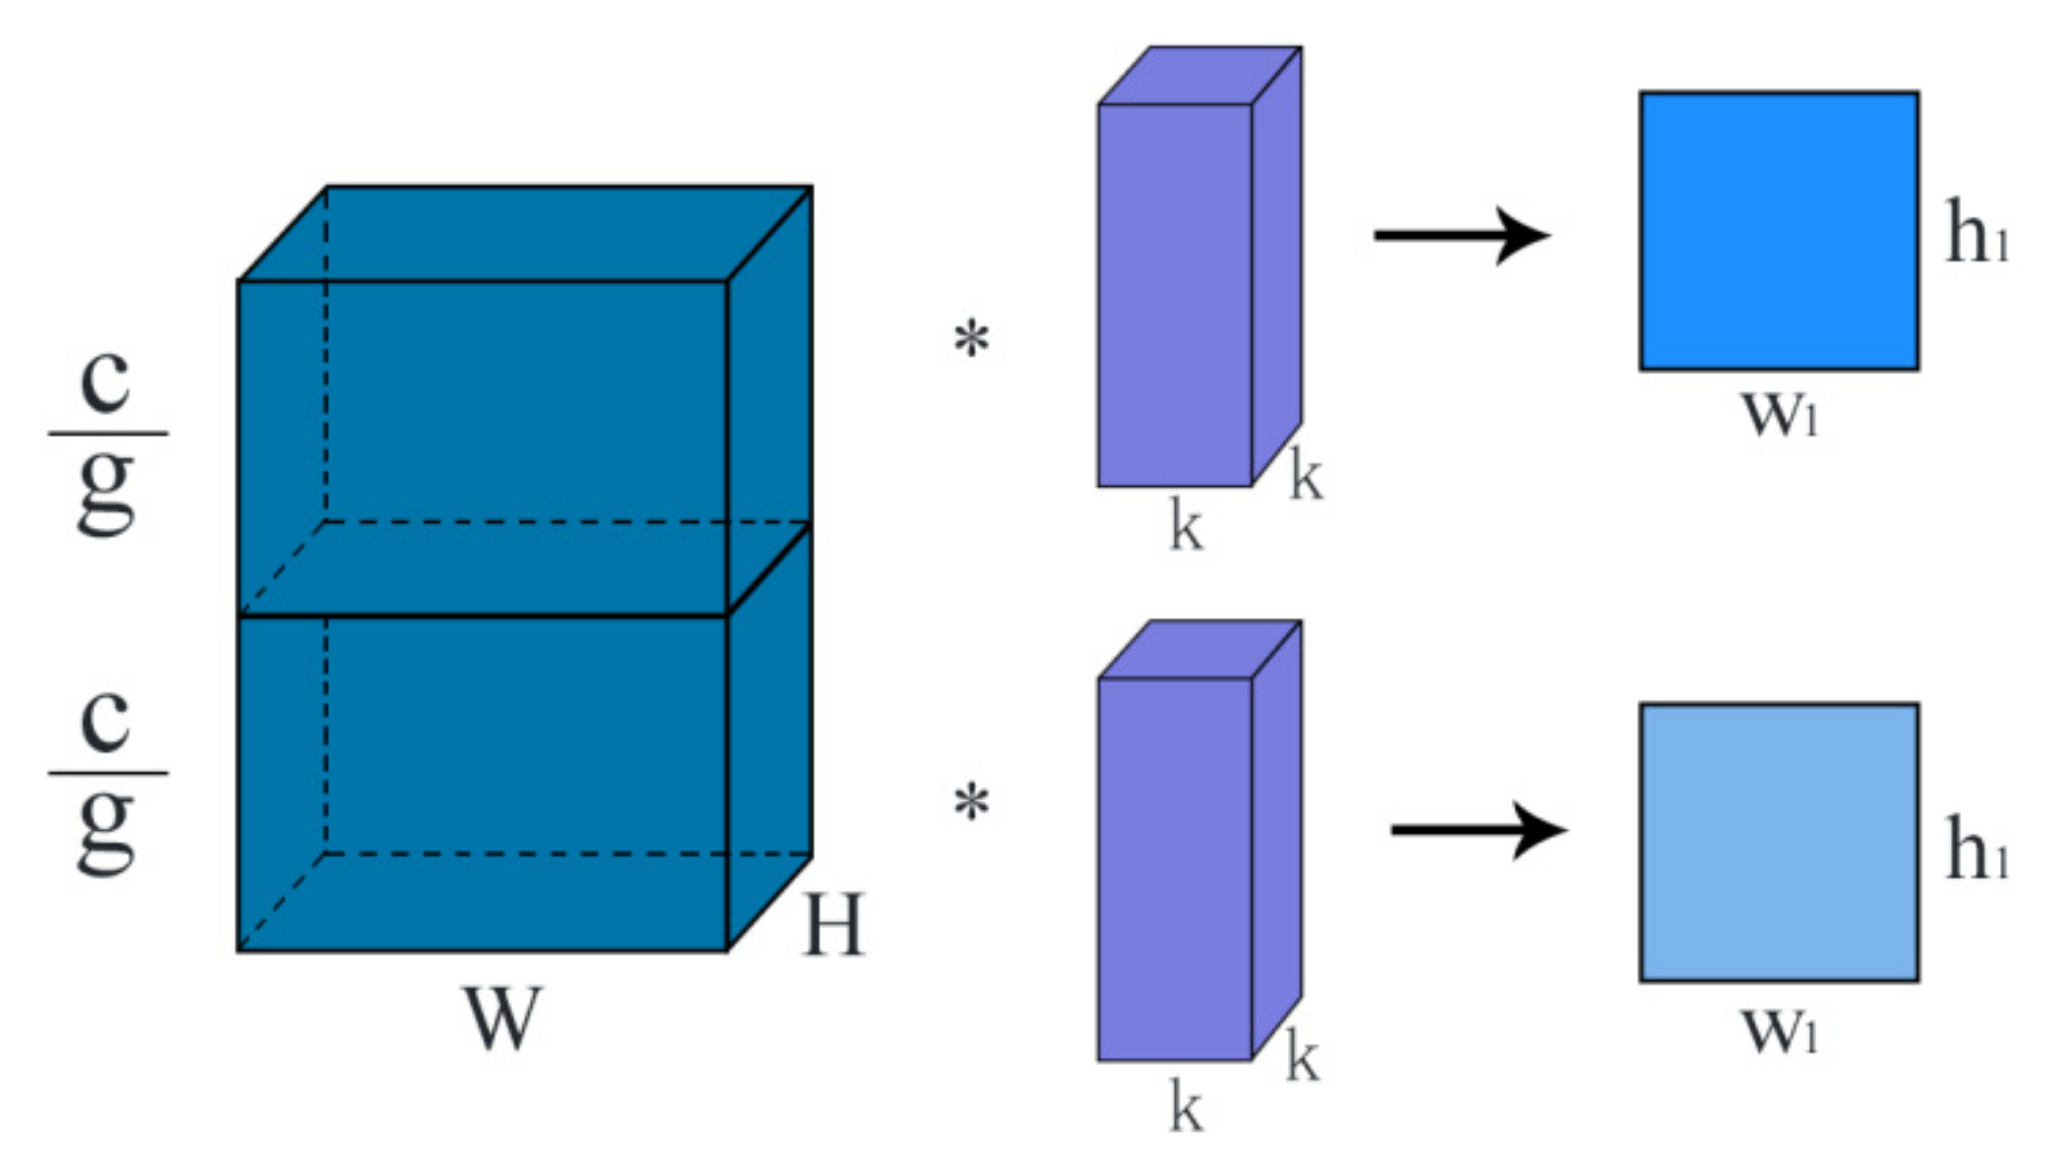
The traditional method to improve model accuracy is usually to deepen or widen the network structure, but as the number of parameters increases, the difficulty and computation cost of network design will also increase. Group convolution was first seen in AlexNet as a tool to segment the network. It divides the feature map into two GPUs for separate processing first and then stitches them together. The schematic diagram of group convolution is shown in Figure 6.
Group convolution is to divide the input feature map and each convolution kernel into several groups, and then to perform the convolution operation in each corresponding group. The feature map of the upper group is convolved with the convolution kernel of the upper group, while the feature map of the lower group is convolved with the convolution kernel of the lower group. Eventually, the feature map with the corresponding number of groups is generated. In Figure 6, c represents the number of channels, g represents the number of groups, W and H represent the width and height of the feature map, and k represents the width and height of the convolution kernel. Assuming that the size of the input feature map is (W, H, C1), the size of convolution kernel is (k × k × C1 × C2), the size of output feature map is (W1, H1, C2), and the group convolution is divided into g groups, then the computation workload of standard convolution and group convolution can be obtained by Equations (3) and (4) respectively:
C a l s = k 2 × W 1 × H 2 × C 1 × C 2
C a l g = k 2 × W 1 × H 2 × C 1 g × C 2 g × g
From Equations (3) and (4), it can be seen that the computation workload of group convolution is much smaller than that of standard convolution (the computation workload of group convolution is 1/g of that of standard convolution).
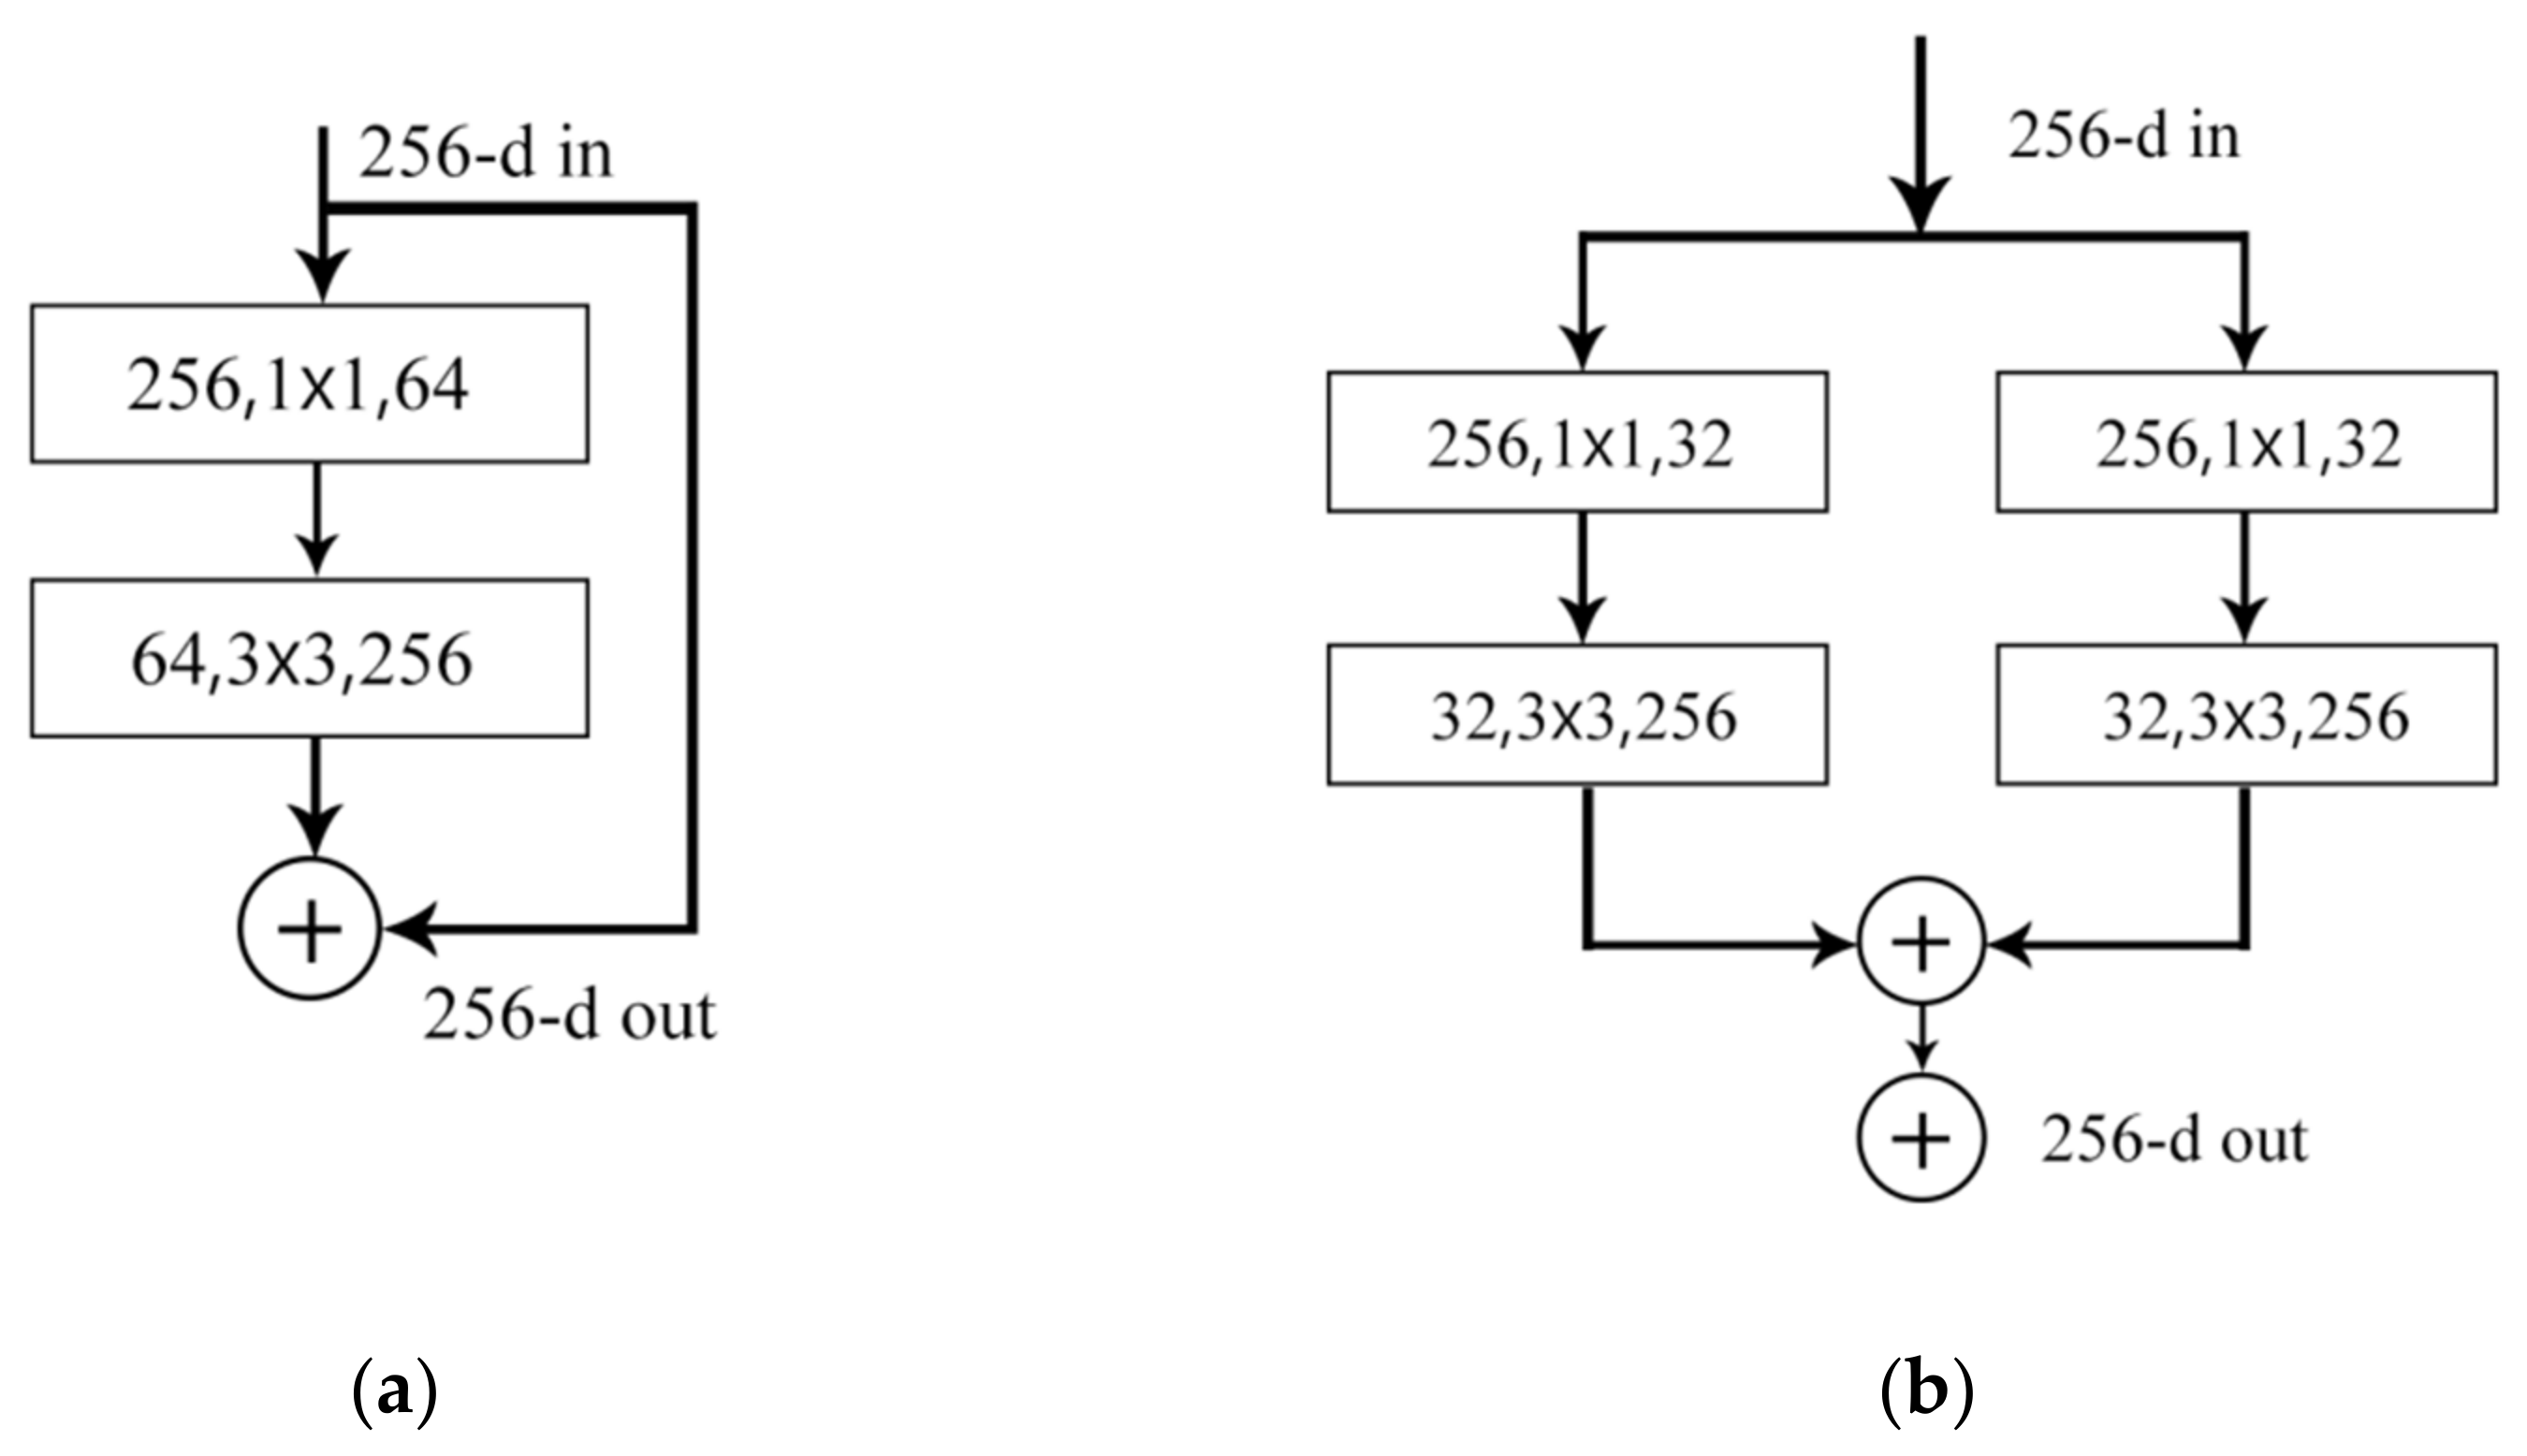
The ResNeXt module [34] is obtained by combining and modifying ResNet [32] and Inception [35]. Its nature is group convolution [36], which controls the number of groups through cardinality. Unlike Inception v4 [37], ResNeXt does not require manual design of a complicated inception structure. Each of its branches is stacked with the same topology module. This rule reduces the free choices of hyperparameters. The network depth and width are exposed as basic latitude, which improves the network accuracy while reducing the number of parameters. The ResNeXt module is shown in Figure 7b.
In the ResNeXt module, the network in the neuron expands along a new dimension, rather than the depth or width direction. This transformation is called aggregation transformation, which can be expressed by Equation (5).
y = x + i = 1 C T i ( x )
where x is the input; y is the output; Ti can be any function; C represents the size of the transformation set to be aggregated.

3.2.3. ResNeXt Group Convolution

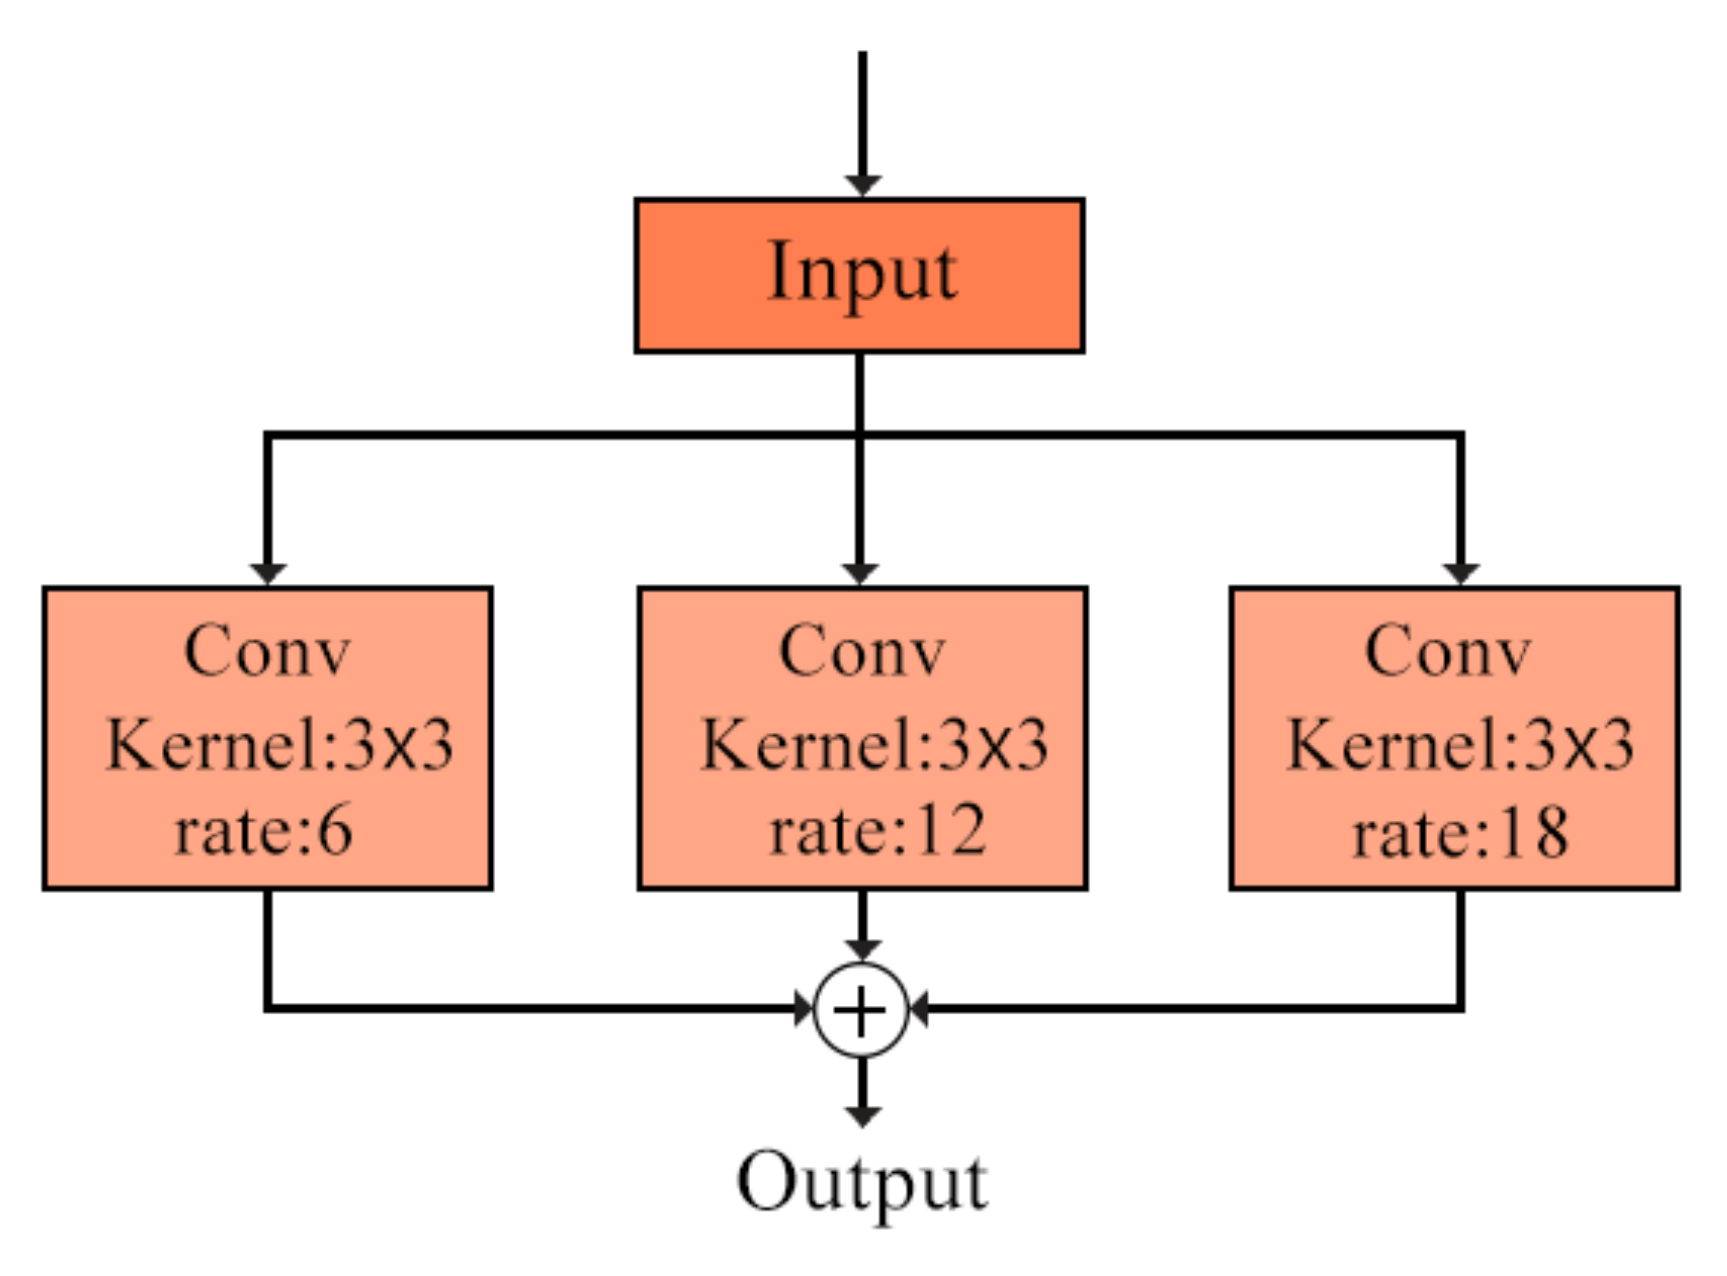
Atrous Spatial Pyramid Pooling (ASPP) [38] is constructed by combining Atrous and Spatial Pyramid Pooling (SPP). SPP [39] was first proposed in 2014 as a tool to solve information loss and distortion by utilizing the multiscale idea. Atrous is to inject holes in the convolution process to expand the receptive field and increase the model’s segmentation and detection ability for large targets without losing resolution. It is a useful tool for accurately positioning the target. The dilation rate parameter in Atrous can be used to effectively adjust the size of the receptive field, so as to obtain more multiscale information. The equation of Atrous can be expressed as Equation (6).
y ( i ) = k = 1 K x ( i + r × k ) w ( k )
when r = 1, it is the commonly used standard convolution; when r > 1, it is Atrous; r refers to the step of sampling on the input sample during the convolution process.
The ASPP module samples the given input in parallel through Atrous of different sampling rates, and the obtained results are stitched together. Then, the 1 × 1 convolution is used to reduce the number of channels to the expected value, so as to capture the contextual information of the image through different scales. The ASPP module is shown in Figure 8.

4. Experiment and Analysis

4.1. Experiment Dataset

The enhanced dataset contains a total of 5325 images, which were divided into the training set (4260 images) and test set (1065 images) according to the ratio of 8:2. The LabelImg software was used to manually label the dataset and generate xml files containing the category (name) information of the image and the information of x min , y min , x max , y max of the target rectangle relative to the upper left corner of the image. After resorting, the dataset was saved in the format of PASCAL VOC2007 to be used for the training and testing of the YOLOv3 network model.

4.2. Model Training

In this study, the hardware configuration for model training and testing is as follows: CPU, Intel® Xeon(R) Gold 6151 CPU @ 3.00GHz; memory, 256G; graphics card, NVIDIA Tesla V100-SXM2-16GB; operating system, 64-bit Windows Server 2016; CUDA version 10.0; TensorFlow version 1.13.1. During the training process, in order to avoid the unfairness in comparing the accuracy between different models due to the difference in hyperparameters, the following hyperparameters were set to be consistent: learning rate = 0.0001, accelerated convergence, batch_size = 3, epoch = 250.

4.3. Evaluation Indicators

4.3.1. Confidence and Intersection-over-Union

In the target detection model YOLOV3, the prediction result provides a confidence indicator for the area containing poppy in each image. Generally, the confidence indicator is set to 0.3, which means the prediction result with confidence higher than 0.3 will be treated as the final prediction result. There is an error between the actually labeled box and the predicted box. The smaller the error, the higher the model detection accuracy is. Intersection-over-Union (IOU) is the overlap rate between the generated prediction candidate bounding box and the ground truth bounding box, that is, the ratio of their intersection and union. Intersection-over-Union (IOU) is a key parameter to measure the detection accuracy, which is expressed as Equation (7). The parameter of IOU was set to 0.5 in this study.
I O U = D R G T D R G T × 100 %
where, DR stands for detection result, which is a predicted result; GT stands for ground truth, which is the actual label.

4.3.2. Precision, Recall, and F1 Harmonic Average

The precision-recall (PR) curve was used to evaluate the performance of the model in detecting poppy cultivation sites. The definitions of Precision, Recall and F1 are shown in Equations (8)–(10) respectively:
P r e c i s i o n = T P T P + F N × 100 %
R e c a l l = T P T P + F P × 100 %
F 1 = 2 P R P + R × 100 %
where T P represents the number of images that are actually opium poppy targets and the model is correctly detected; F P represents the number of images that do not belong to the opium poppy target but are incorrectly detected by the model; F N represents the number of images that are actually opium poppy but are incorrectly detected by the model.

4.3.3. Average Precision and Mean Average Precision

Average precision is a commonly used evaluation indicator for target detection models. It draws a curve for each category. If the model still maintains a high level of precision as the recall increases, the model is considered to be good. In other words, a good model can maintain its precision and recall at a high level with the change of the confidence threshold. This indicator can be used to evaluate the model performance for each category. The precision and recall are used to draw the PR curve. The area under the PR curve stands for the average precision (AP), which can be calculated by Equation (11):
A P = 0 1 P ( R ) d R
where P stands for precision, R stands for recall, and AP stands for the average precision.
Mean average precision (mAP) refers to the mean AP of all categories, which can be calculated by Equation (12):
m A P = i = 1 n A P i n
where, n represents the number of detection categories; in this study, the poppy is the only detection target, so mAP is equal to AP.
The network training results are saved in ten weight files by default. The weight file with a lower loss value is selected as the test, and the weight file with the highest mAP value is selected to test the test set. The results are saved accordingly.
This paper compared a total of three models improved based on YOLOv3 in terms of P, R, F1, mAP, the total number of model parameters, the size of the weight file, and the average detection time of a single image. Meanwhile, the influence of different improvement methods on the overall detection effect was comprehensively analyzed. In improvement Scheme 1, 104 × 104 prediction was added to the prediction part of the original YOLOv3 model. On the basis of Scheme 1, the residual structure in the darknet53 feature extraction network was modified to ResNeXt group convolution, which was referred to as Scheme 2. On the basis of Scheme 2, the ASPP module was added before the first stage of prediction 13 × 13, which was referred to as Scheme 3. Scheme 3 was the final model used for poppy detection in this paper. Table 3 presents the methods used in different schemes.
It can be seen from Table 4 that the original YOLOv3 network model had a large number of parameters and achieved an accuracy rate of 91.97%. By comparing Scheme 1 with the original YOLOv3 network, it was found that the recall and accuracy were improved, while the number of parameters was slightly increased. What contributed to the increase of accuracy was the addition of 104 × 104 output in the prediction stage, which significantly improved the model’s prediction ability on small targets. Scheme 2 modified the residual block to a ResNeXt group convolution module on the basis of Scheme 1 and reduced the number of filters. It could be seen that although the accuracy of Scheme 2 dropped to 90.89%, its number of parameters was greatly reduced. By comparing Scheme 3 with Scheme 2, it was found that the addition of ASPP module in the 13 × 13 prediction part alongside the simplification of the feature extraction network improved the accuracy to 92.42%, which was 0.45% higher than that of the original YOLOv3 model. Compared with the original YOLOv3 network, the detection time of Scheme 3 was shortened by about 5 ms for a single image.
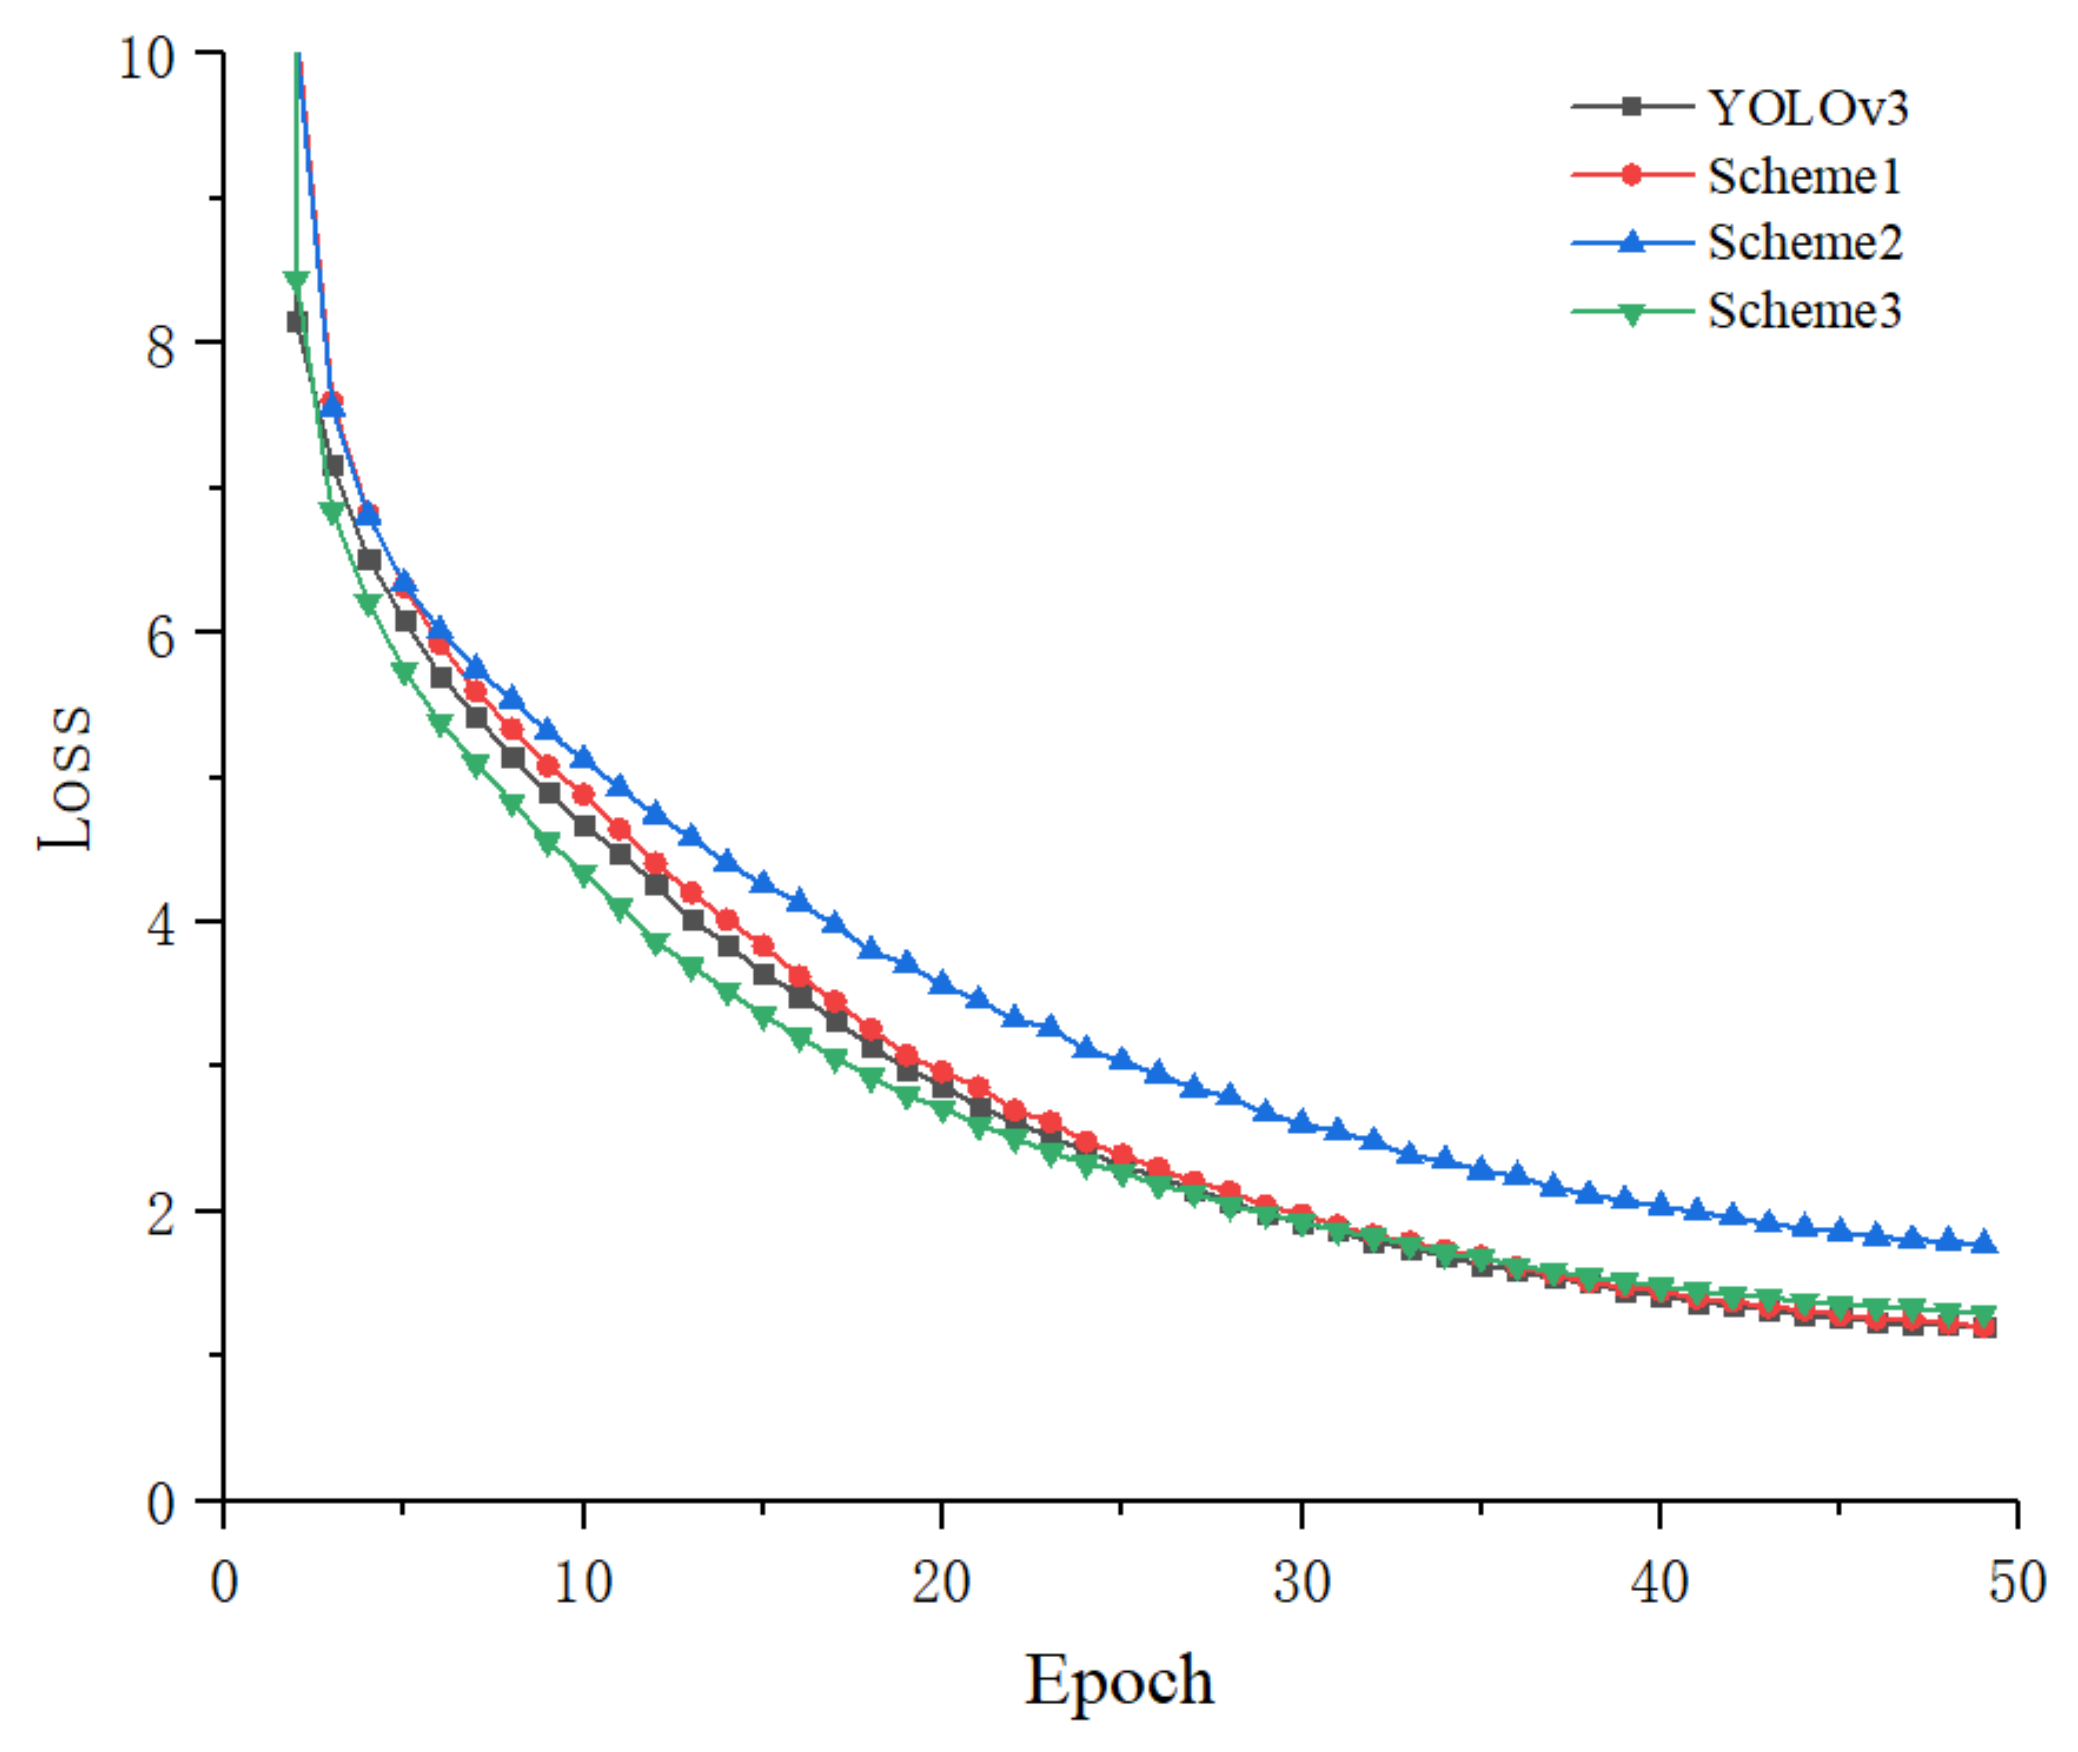
Comparison of the change curve of loss value during model training between the original network and the improved network is shown in Figure 9. With the increase of iteration, the loss values of all the models could eventually stabilize. The loss value was high at the beginning and dropped sharply in the following iterations. Then, the difference gradually became smaller. After ten iterations, Scheme 2 departed away from Scheme 1 and Scheme 3, and stabilized at a higher loss value at last. Scheme 3 had faster convergence speed than Scheme 1 and the original YOLOv3 network, and its final loss was relatively high and stable. The change curves of loss value of the four models finally stabilized after 45 iterations.

4.4. Comparison of Different Detection Algorithms

In order to further verify the effectiveness of the proposed network model on poppy detection, a total of 5325 images in the same dataset were used for comparison, and the training set and test set remained the same. The detection results of the networks were compared in terms of P, R, F1, mAP, the total number of model parameters, the weight size of the model, and the average detection time for a single image, as shown in Table 5.
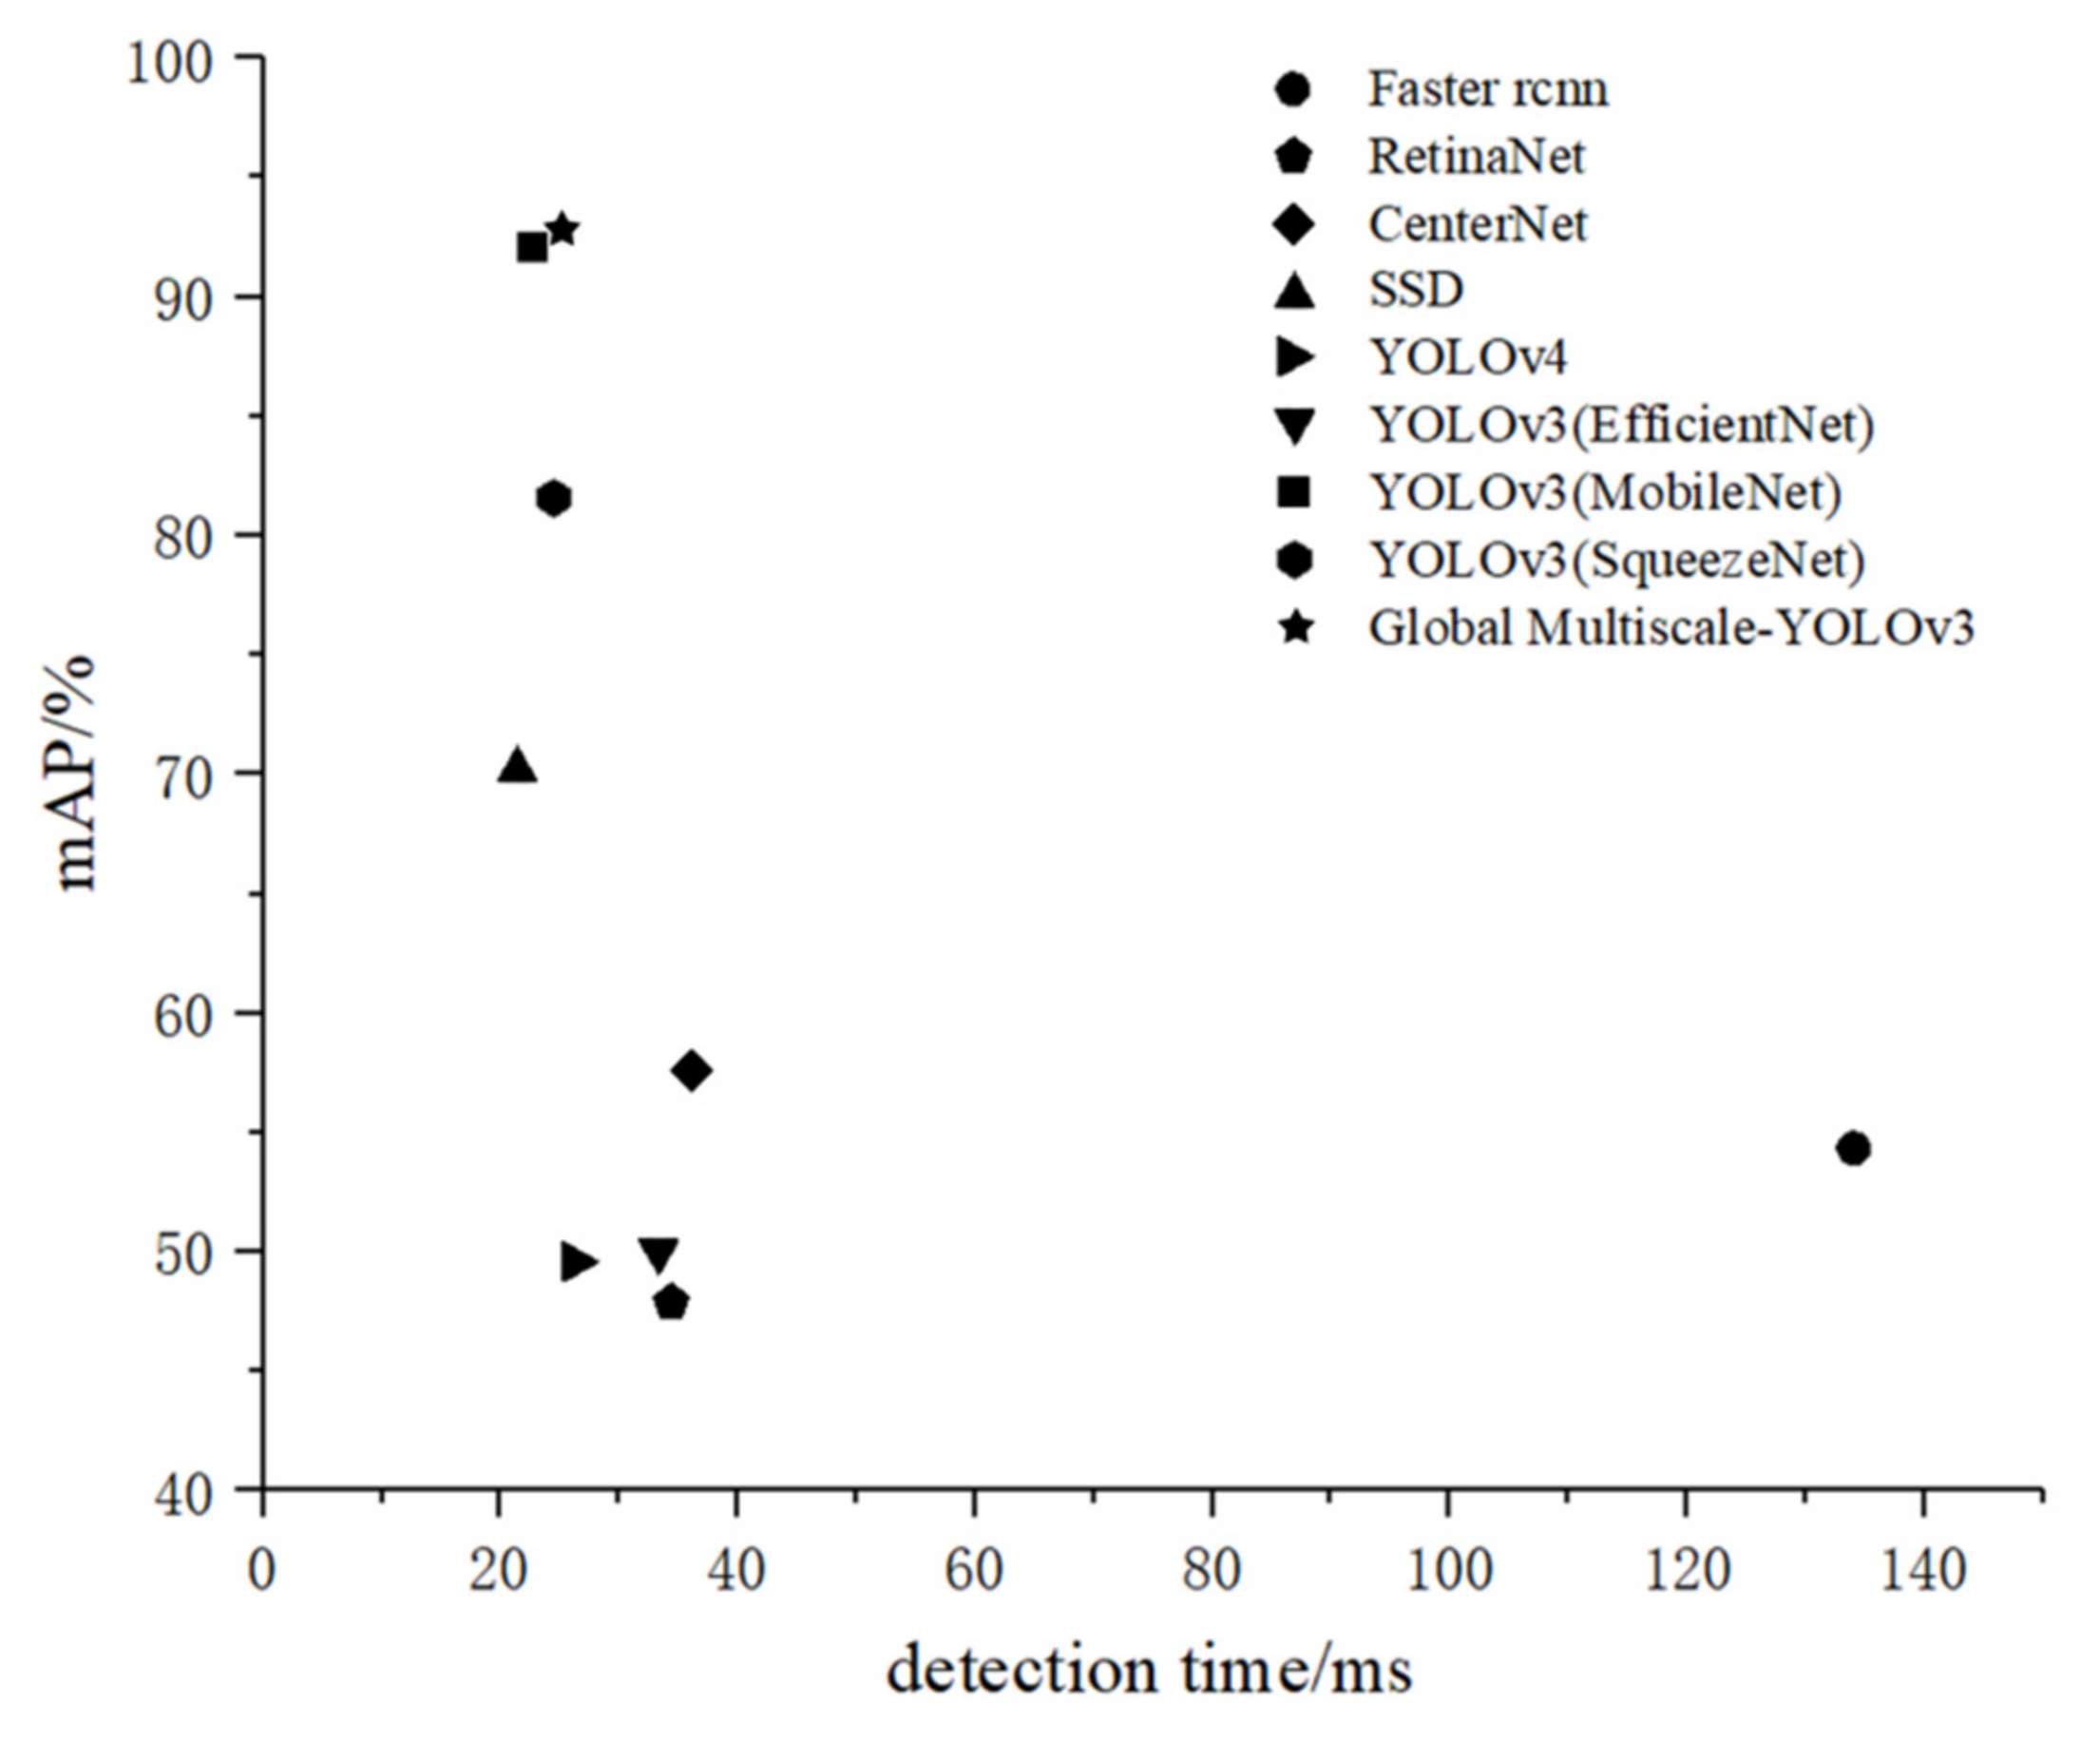
It could be seen from Table 5 that the accuracy of all models was above 47%, but the detection time and the number of network parameters differed significantly. Specifically, Faster rcnn used ResNet50 as the feature extraction network and had a relatively low accuracy and the longest detection time. CenterNet had the highest precision among all the networks, but its recall was relatively low. Similarly, RetinaNet, YOLOv4, and YOLOv3 (EfficientNet) also had a low recall. In actual applications, the network with a low recall has no advantage in poppy detection. Generally speaking, all the YOLOv3 models using MobileNet as the feature extraction network are more advantageous compared to other networks in the control group. Overall, the proposed algorithm in this study further increased the accuracy by 0.44% relative to MobileNet, a better performed YOLOv3 model; the total number of network parameters was only 13.75% of that of the original YOLOv3 network and 35.04% of that of the lightweight YOLOv3 network (MobileNet); the detection time for a single image was basically consistent with that of the lightweight network. The results of poppy target detection are shown in Table 6.
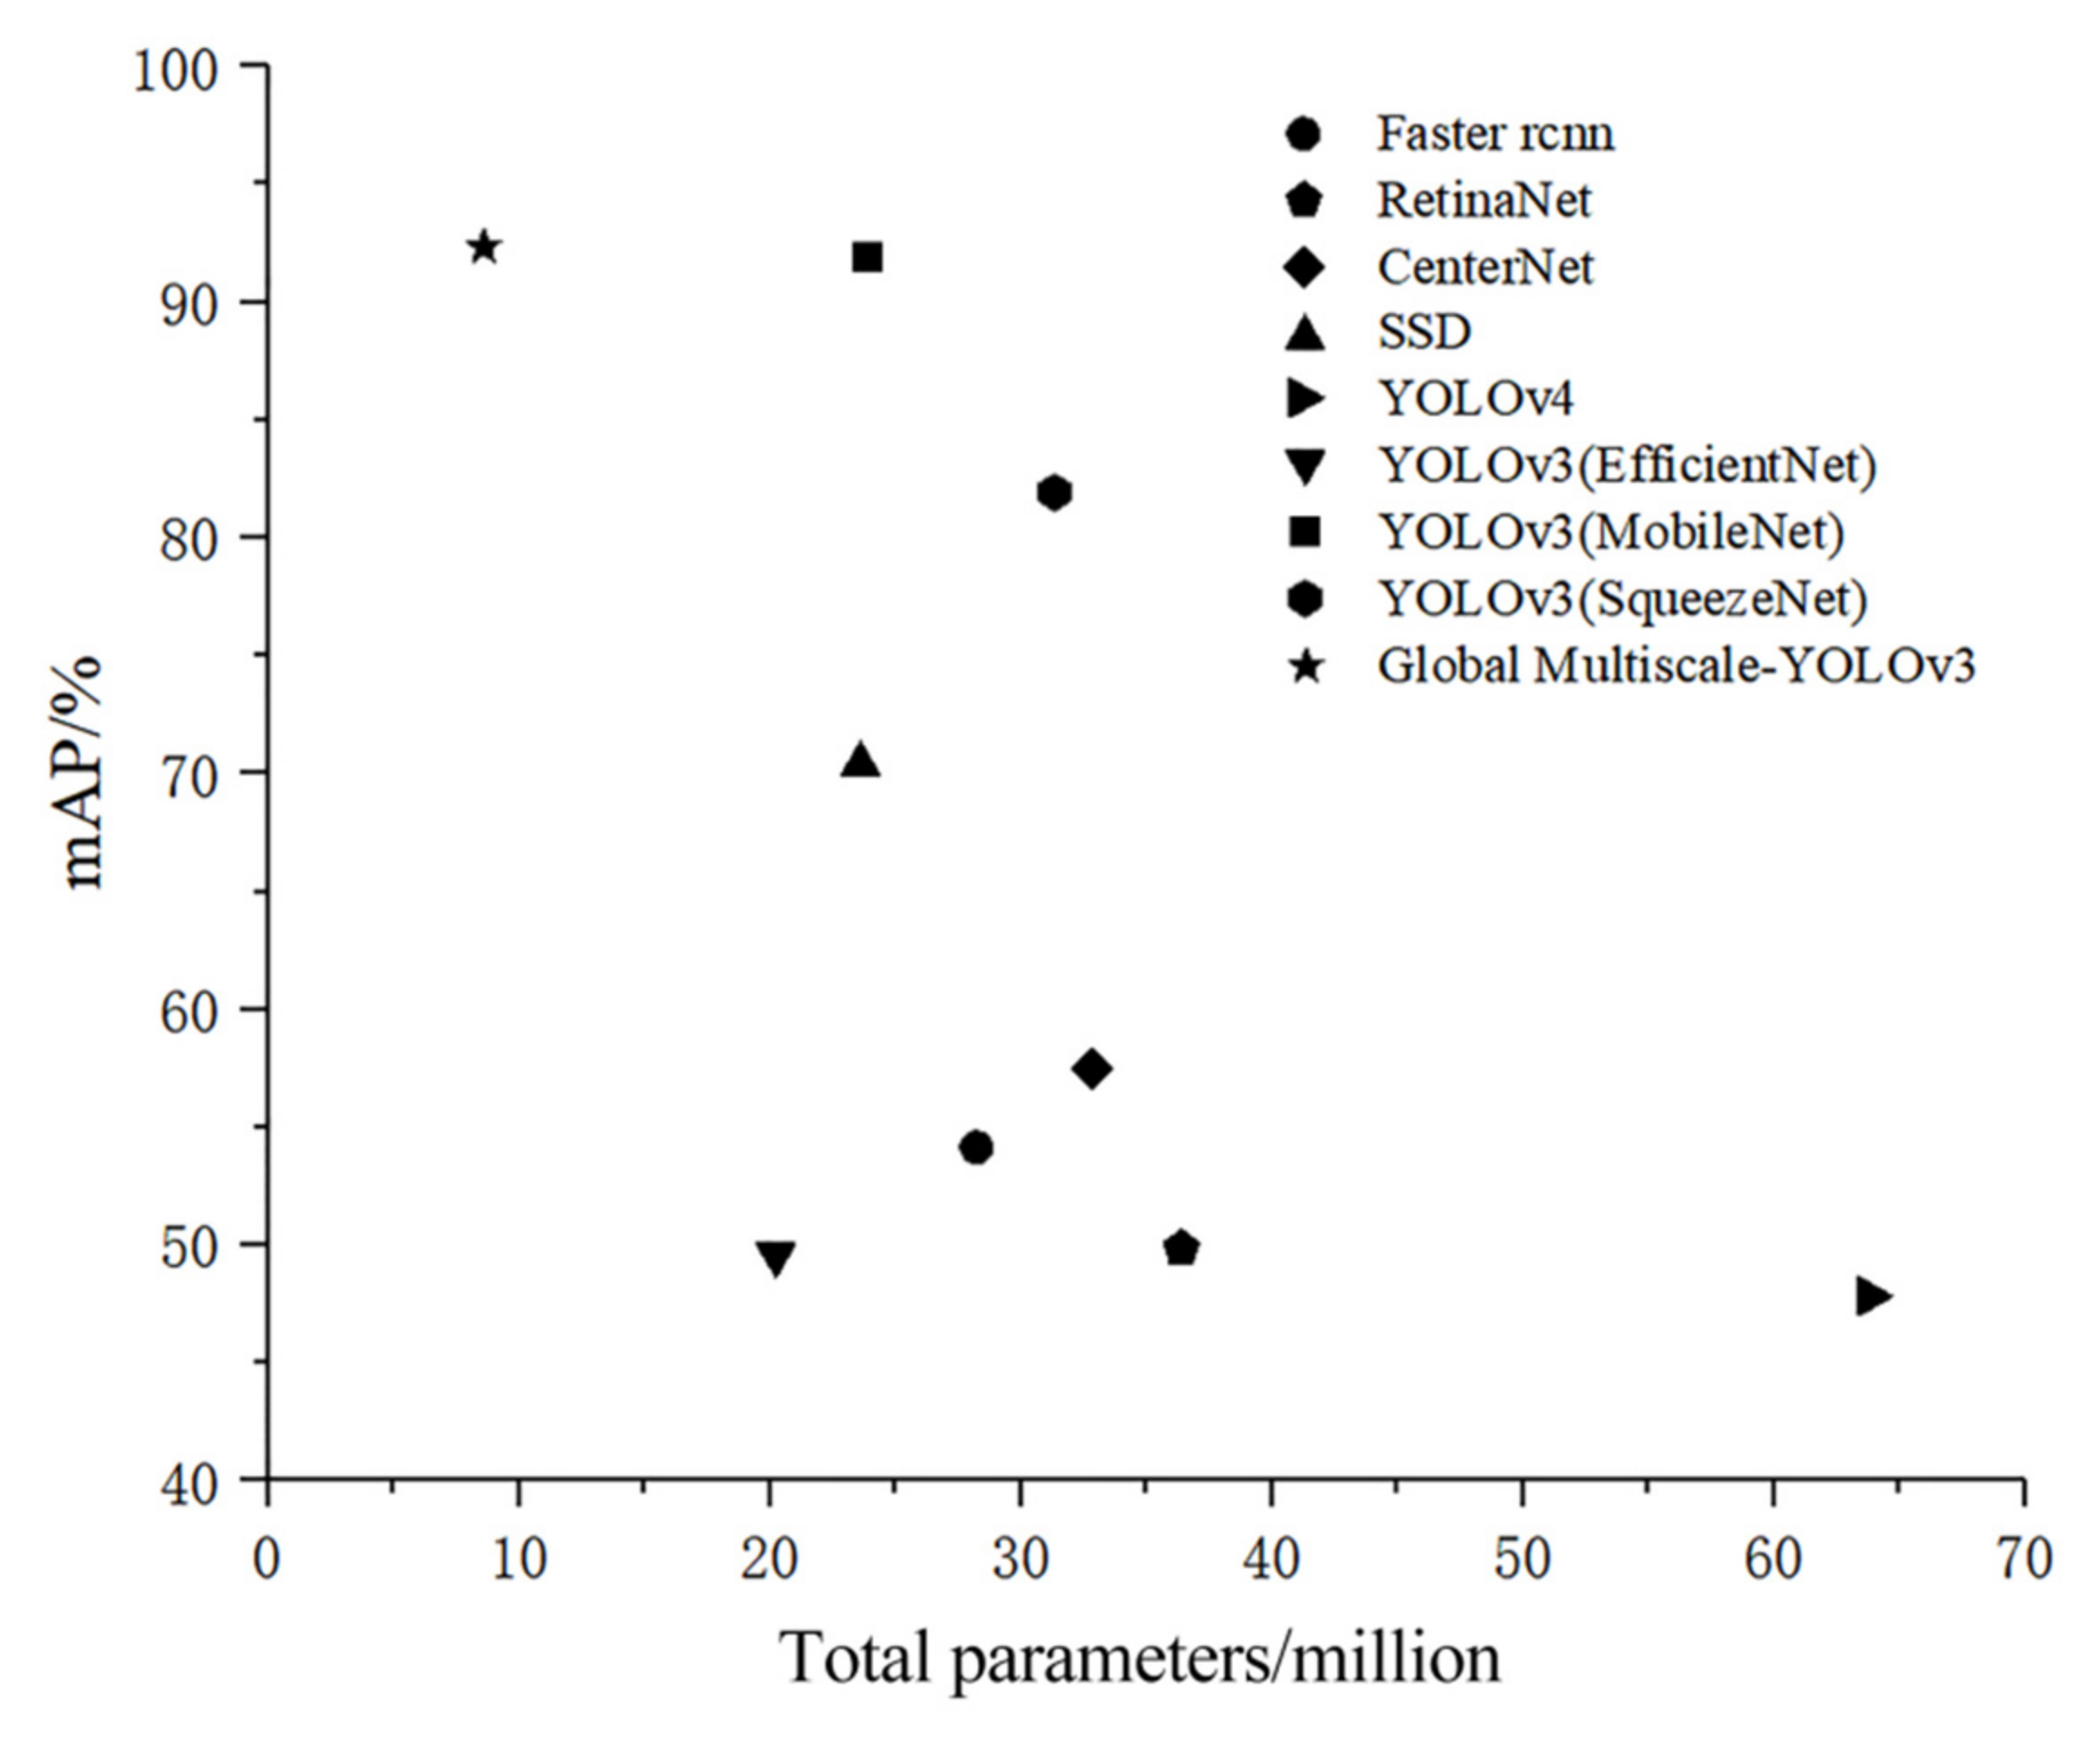
In order to better evaluate the various models, we compared the performance of different detection algorithms from the two aspects, mAP and the total number of model parameters, mAP and the detection time, as shown in Figure 10 and Figure 11. As shown in Figure 10, Global Multiscale-YOLOv3 showed the highest mAP under the premise of the smallest number of total parameters, and achieved balance between mAP and the number of total parameters. However, in terms of detection time, it can be seen from Figure 11 that the average single image detection time of the YOLOv3 (MobileNet) model is 2.1 ms faster than the Global Multiscale-YOLOv3 model.

4.5. Comparison of Detection Results

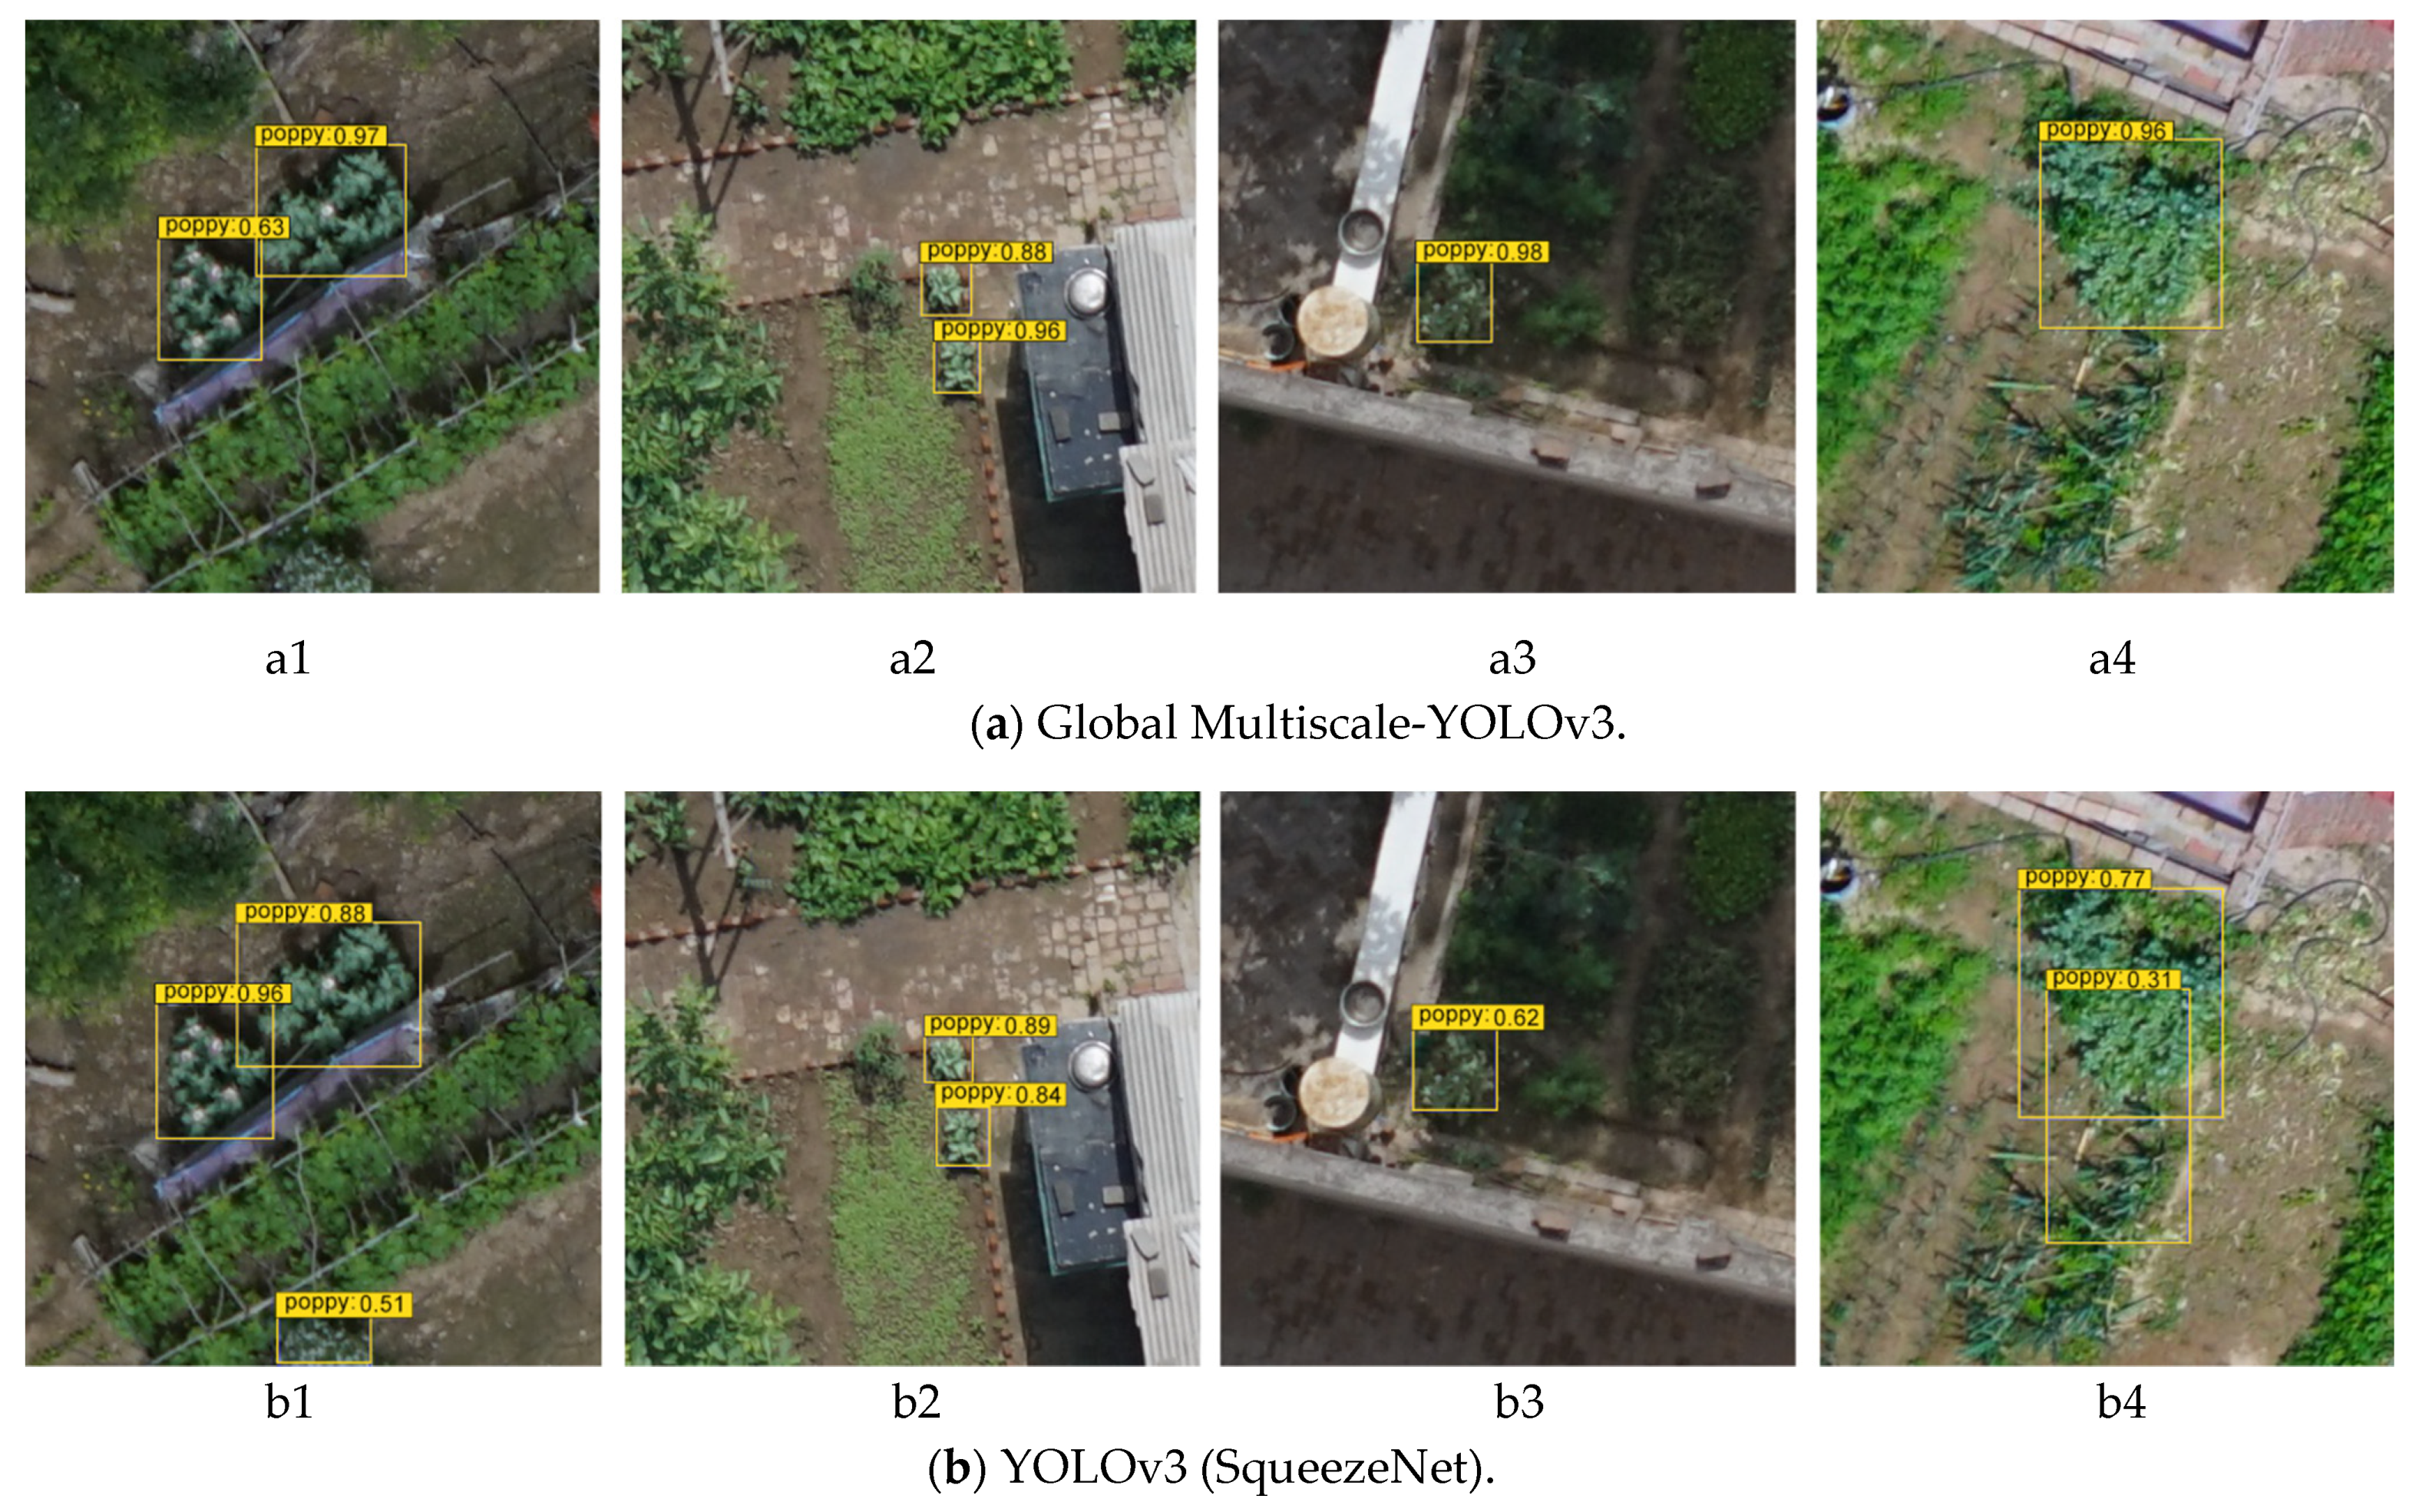
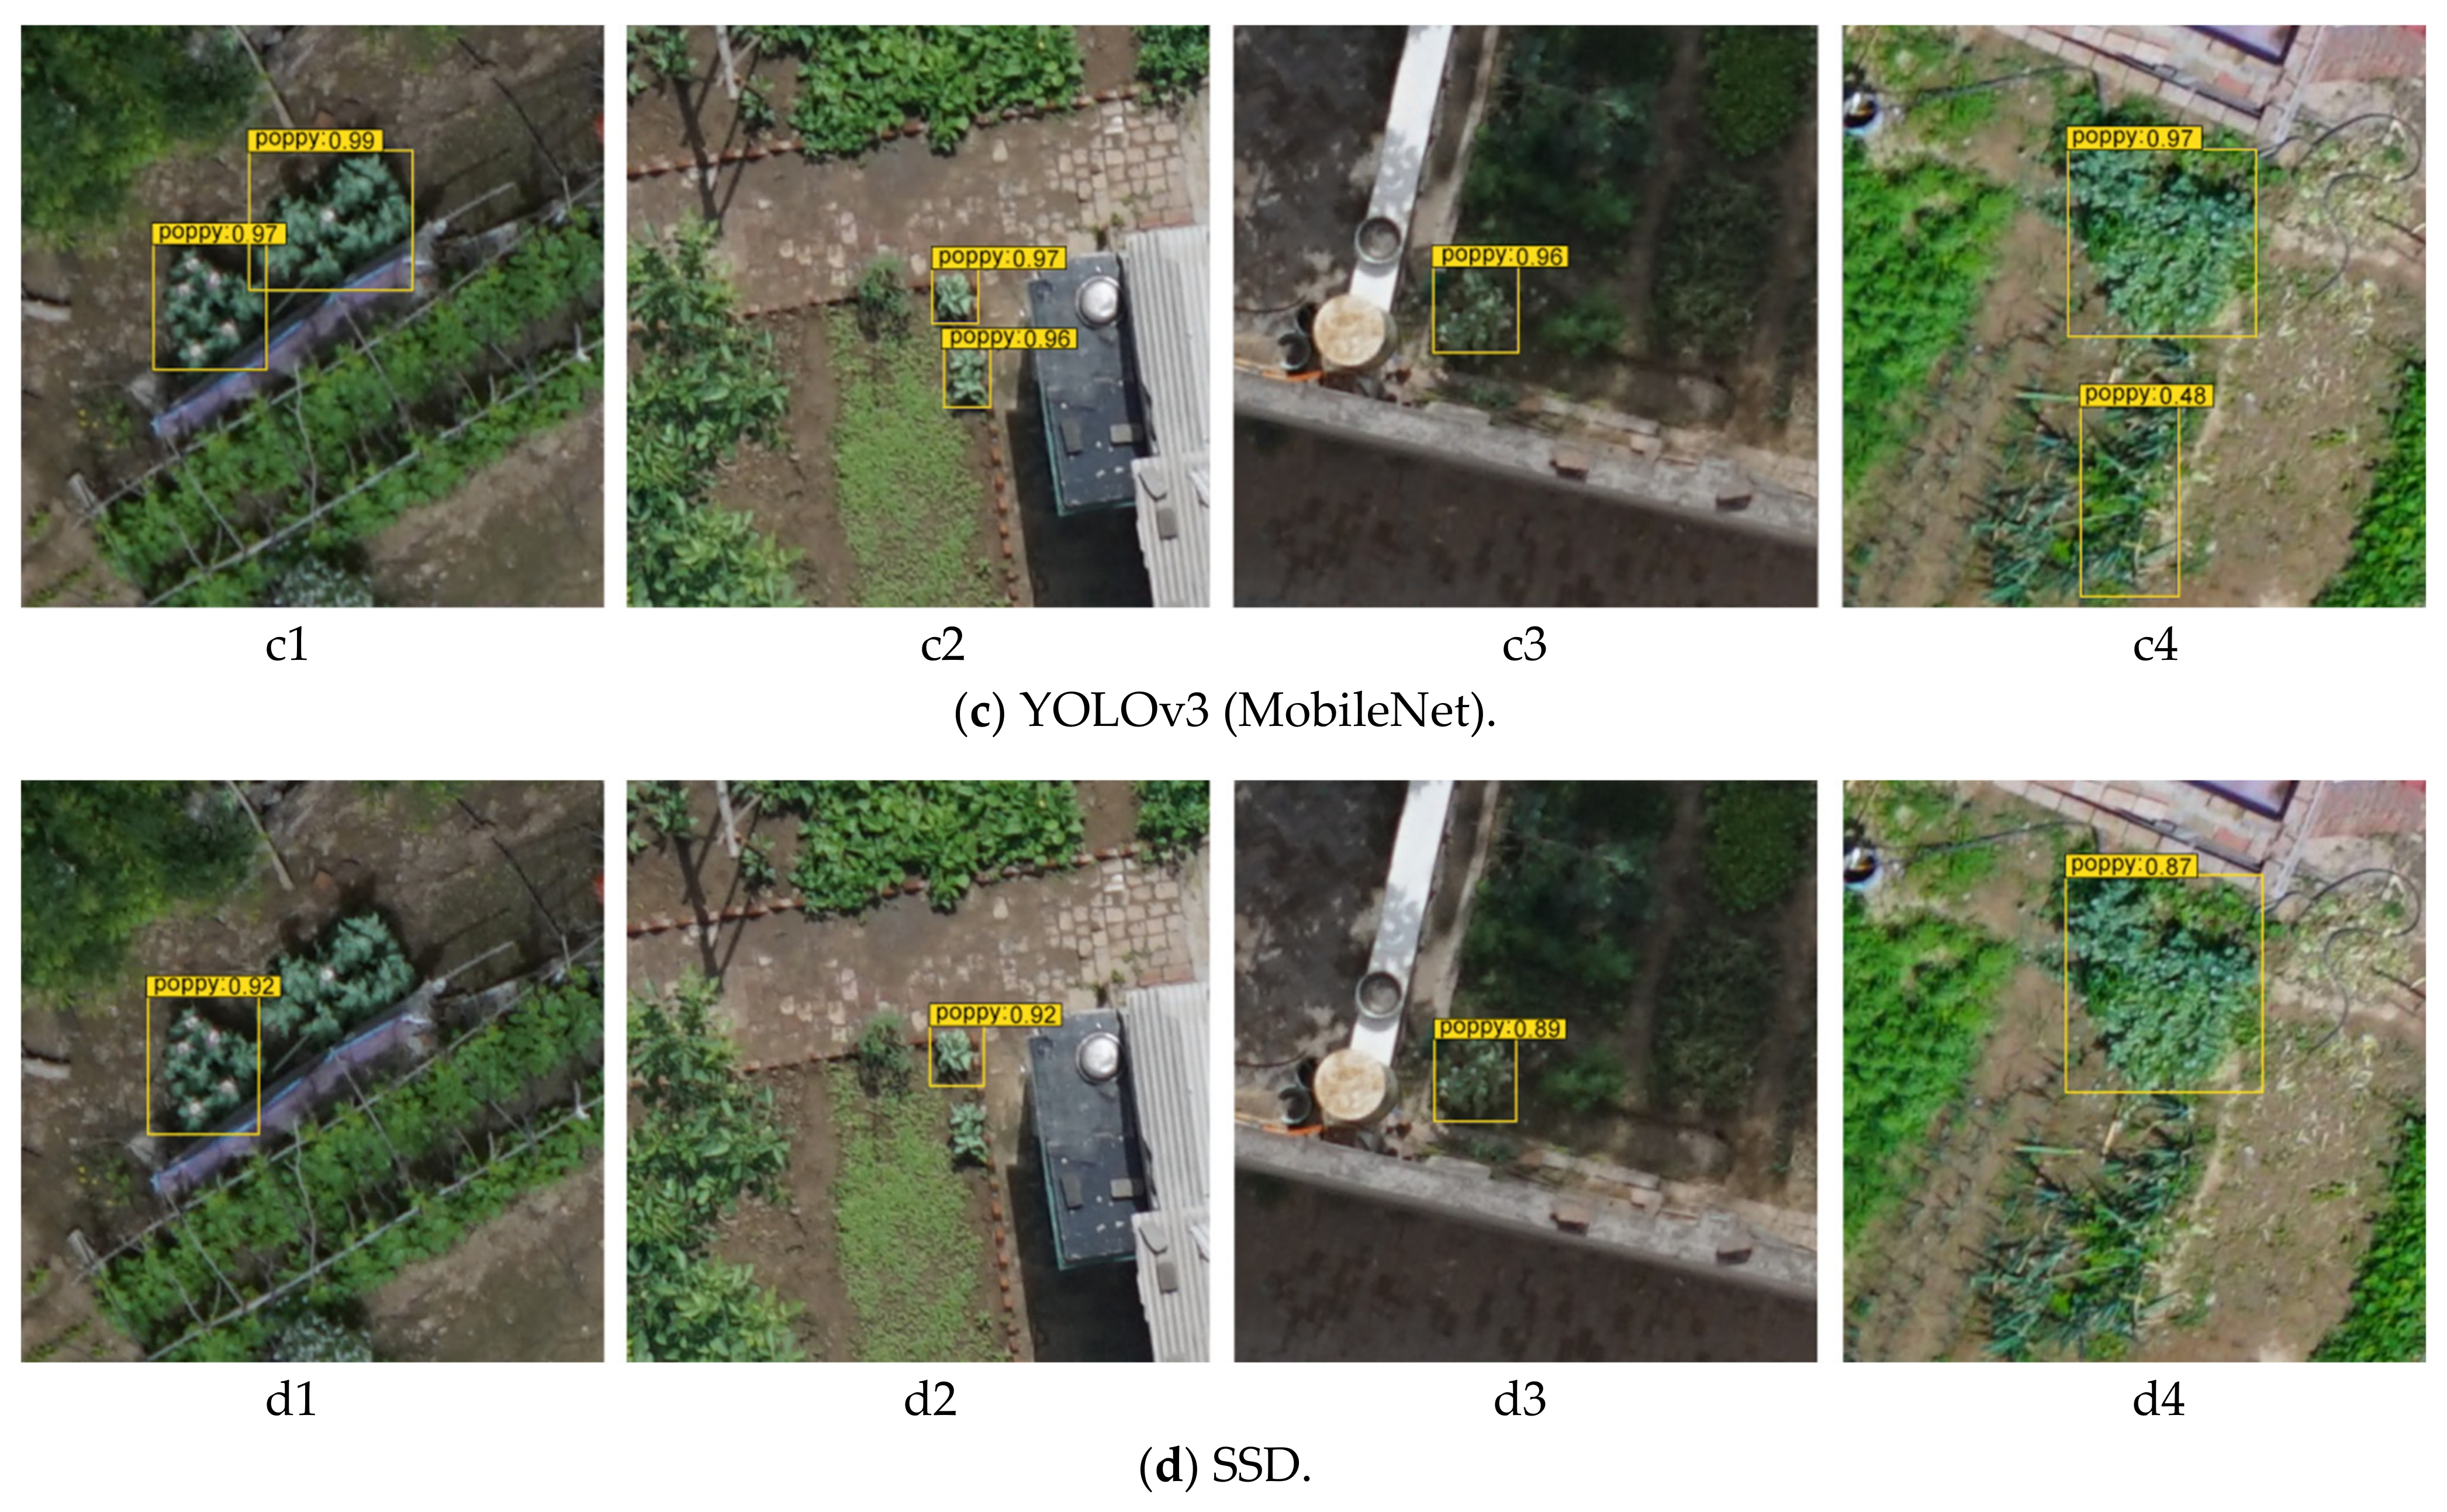
In order to further analyze the robustness of different models, we compared various algorithms in terms of the planting strategies of concentrated planting, single-plant planting, shadow planting, and mixed planting. The detection results are as shown in Figure 12.
By comparing the results of the four algorithms under different planting strategies, it was found that the proposed algorithm in this paper recognized all the targets. Although YOLOv3 (SqueezeNet) and YOLOv3 (MobileNet) also recognized all the targets, there was a false detection in each of them. The cause of false detection lies in that the two models mistakenly detected green onion as opium poppy, which shares similar features to the opium poppy. The four algorithms exhibited different capabilities for detecting small single targets and targets in shadows. SSD had missed detection when detecting single plants, while YOLOv3 (MobileNet) had the highest confidence. For detecting targets in shadows, YOLOv3 (SqueezeNet) achieved the highest confidence (0.62), while there was no obvious difference in confidence among other algorithms.

5. Discussion

The dataset used in this study was a manually selected dataset containing obvious features of the opium poppy. In actual situations, poppy detection is still subjected to the following three difficulties:
(1)
Interference from natural factors. In view of that UAV captures image at an altitude of 120 m, the wind in the atmosphere will cause the camera to shake. Consequently, the captured image may be blurred, resulting in unobvious features of the poppy, which can ultimately interfere with the model’s extraction of poppy features and impose an impact on the recognition accuracy.
(2)
Multiple planting strategies. Illegal poppy planters will deliberately cover the poppy plants with transparent plastic sheets, which will affect the shooting effect of UAV while providing sufficient sunlight to the plants. Additionally, the planters may also mix poppies with a variety of similar plants. In the UAV images, the appearance and color of poppy at the flowering stage are very similar to those of green onion, which may lead to detection errors.
(3)
Complicated planting background. The backgrounds of actual original images captured by UAV are more complicated than those of the cropped 416 × 416 pixel images in our dataset. The backgrounds of UAV images may contain a variety of complicated objects, such as buildings, other vegetable crops, bushes, plant flowers, etc. The complicated backgrounds will lead to an increase in false detection rate. Therefore, it is necessary to increase the model’s learning ability of negative samples by expanding the dataset, so as to adapt to the interference brought by a complicated environment.
Therefore, there are still many shortcomings and difficulties to be solved and optimized in practical applications. The proposed model needs to be further improved in terms of universality and practicality in detecting poppy cultivation in village areas.

6. Conclusions

The use of UAV to inspect opium poppy cultivation has become the main method to fight against illegal opium poppy cultivation. However, at present, this method mainly relies on artificial vision for poppy screening. In view of the current situation, this paper proposed a new target detection network Global Multiscale-YOLOv3 on the basis of convolutional neural network to inspect the opium poppy cultivation, which achieved an accuracy of 92.42% in the test dataset. The use of deep learning in image detection has greatly accelerated the speed of the opium poppy inspection. Our model was constructed by improving the YOLOv3 model. Based on the comparison of detection results against classic target detection algorithms using the same dataset, we analyzed and compared the performance of different algorithms for poppy detection. The results showed that the proposed Global Multiscale-YOLOv3 model was featured with the advantages of fast speed and high accuracy for poppy detection; while achieving an increase of 0.45% in accuracy, it reduced the number of parameters to 13.75% of the original model and increased the detection speed to 24.5 ms/image. Our study provides a solution for the deployment of the model on edge devices to realize rapid detection. In future research, we will continue optimizing our model by focusing on the difficulties of poppy cultivation in the images to improve the model’s recognition accuracy and detection speed.

Author Contributions

Conceptualization, C.Z.; software, Q.W.; validation, G.T.; writing-review and editing, H.W., C.W.; visualization, J.L. All authors have read and agreed to the published version of the manuscript.

Funding

This work was supported in part by the Beijing Municipal Science and Technology Project under Grant Z191100004019007, and in part by the Hebei Province Key Research and Development Project under Grant 20327402D, 19227210D, and in part by the National Natural Science Foundation of China under Grant 61871041, and in part by the Key projects of science and technology research in colleges and universities of Hebei Province under Grant ZD2018221.

Institutional Review Board Statement

Not applicable.

Informed Consent Statement

Not applicable.

Data Availability Statement

The data presented in this study are available on request from the first author.

Acknowledgments

We are grateful to our colleagues at Hebei Agricultural University and Beijing Research Center for Information Technology in Agriculture for their help and input, without which this study would not have been possible.

Conflicts of Interest

The authors declare no conflict of interest.

References

  1. Liu, X.; Tian, Y.; Yuan, C. Opium poppy detection using deep learning. Remote Sens. 2018, 10, 1886. [Google Scholar] [CrossRef] [Green Version]
  2. He, Q.; Zhang, Y.; Liang, L. Identification of poppy by spectral matching classification. Optik 2020, 200, 163445. [Google Scholar] [CrossRef]
  3. Zhou, J.; Tian, Y.; Yuan, C. Improved uav opium poppy detection using an updated yolov3 model. Sensors 2019, 19, 4851. [Google Scholar] [CrossRef] [Green Version]
  4. Krizhevsky, A.; Sutskever, I.; Hinton, G.E. Imagenet classification with deep convolutional neural networks. Adv. Neural Inf. Process. Syst. 2012, 25, 1097–1105. [Google Scholar] [CrossRef]
  5. Deng, J.; Dong, W.; Socher, R.; Li, L.; Li, K.; Li, F.-F. ImageNet: A large-scale hierarchical image database. In Proceedings of the 2009 IEEE Conference on Computer Vision and Pattern Recognition, Miami, FL, USA, 20–25 June 2009; pp. 248–255. [Google Scholar] [CrossRef] [Green Version]
  6. Girshick, R.; Donahue, J.; Darrell, T. Rich feature hierarchies for accurate object detection and semantic segmentation. In Proceedings of the IEEE Conference on Computer vision and Pattern Recognition, Columbus, OH, USA, 23–28 June 2014; pp. 580–587. [Google Scholar]
  7. Wang, J.; Yuan, Y.; Yu, G. Face attention network: An effective face detector for the occluded faces. arXiv 2017, arXiv:1711.07246. [Google Scholar]
  8. Liu, Y.; Tang, X. BFBox: Searching Face-Appropriate Backbone and Feature Pyramid Network for Face Detec-tor. In Proceedings of the IEEE/CVF Conference on Computer Vision and Pattern Recognition, Seattle, WA, USA, 13–19 June 2020; pp. 13568–13577. [Google Scholar]
  9. Liu, Y.; Tang, X.; Han, J. HAMBox: Delving Into Mining High-Quality Anchors on Face Detection 202. In Proceedings of the IEEE/CVF Conference on Computer Vision and Pattern Recognition (CVPR), Seattle, WA, USA, 14–19 June 2020; pp. 13043–13051. [Google Scholar]
  10. Li, J.; Liang, X.; Shen, S.M. Scale-aware fast R-CNN for pedestrian detection. IEEE Trans. Multi-Media 2017, 20, 985–996. [Google Scholar] [CrossRef] [Green Version]
  11. Campmany, V.; Silva, S.; Espinosa, A. GPU-based pedestrian detection for autonomous driving. Procedia Comput. Sci. 2016, 80, 2377–2381. [Google Scholar] [CrossRef] [Green Version]
  12. Cao, J.; Pang, Y.; Li, X. Learning multilayer channel features for pedestrian detection. IEEE Trans. Image Process. 2017, 26, 3210–3220. [Google Scholar] [CrossRef] [PubMed] [Green Version]
  13. Ding, L.; Wang, Y.; Laganière, R. A robust and fast multispectral pedestrian detection deep network. Knowl.-Based Syst. 2021, 106990. [Google Scholar] [CrossRef]
  14. Li, P.; Chen, X.; Shen, S. Stereo r-cnn based 3d object detection for autonomous driving. In Proceedings of the IEEE/CVF Conference on Computer Vision and Pattern Recognition, Long Beach, CA, USA, 15–20 June 2019; pp. 7644–7652. [Google Scholar]
  15. Lu, Z.; Rathod, V.; Votel, R. Retinatrack: Online single stage joint detection and tracking. In Proceedings of the IEEE/CVF Conference on Computer Vision and Pattern Recognition, Seattle, WA, USA, 16–18 June 2020; pp. 14668–14678. [Google Scholar]
  16. Ammour, N.; Alhichri, H.; Bazi, Y. Deep learning approach for car detection in UAV imagery. Remote Sens. 2017, 9, 312. [Google Scholar] [CrossRef] [Green Version]
  17. Ren, S.; He, K.; Girshick, R. Faster r-cnn: Towards real-time object detection with region proposal networks. arXiv 2015, arXiv:1506.01497. [Google Scholar] [CrossRef] [Green Version]
  18. Girshick, R. Fast r-cn. In Proceedings of the IEEE International Conference on Computer Vision, Santiago, Chile, 7–13 December 2015; pp. 1440–1448. [Google Scholar]
  19. He, K.; Gkioxari, G.; Dollár, P. Mask r-cnn. In Proceedings of the IEEE International Conference on Computer Vision, Venice, Italy, 22–29 October 2017; pp. 2961–2969. [Google Scholar]
  20. Redmon, J.; Divvala, S.; Girshick, R. You only look once: Unified, real-time object detection. In Proceedings of the IEEE Conference on Computer Vision and Pattern Recognition, Las Vegas, NV, USA, 27–30 June 2016; pp. 779–788. [Google Scholar]
  21. Liu, W.; Anguelov, D.; Erhan, D. Ssd: Single shot multibox detector. In Proceedings of the European Conference on Computer vision, Amsterdam, The Netherlands, 8–16 October 2016; pp. 21–37. [Google Scholar]
  22. Gao, J.; Chen, Y.; Wei, Y. Detection of Specific Building in Remote Sensing Images Using a Novel YO-LO-S-CIOU Model Case: Gas Station Identification. Sensors 2021, 21, 1375. [Google Scholar] [CrossRef] [PubMed]
  23. Xu, D.; Wu, Y. Improved YOLO-V3 with DenseNet for Multi-Scale Remote Sensing Target Detection. Sensors 2020, 20, 4276. [Google Scholar] [CrossRef]
  24. Wu, X.; Hong, D.; Ghamisi, P. MsRi-CCF: Multi-scale and rotation-insensitive convolutional channel features for geospatial object detection. Remote Sens. 2018, 10, 1990. [Google Scholar] [CrossRef] [Green Version]
  25. Avola, D.; Cinque, L.; Diko, A. MS-Faster R-CNN: Multi-Stream Backbone for Improved Faster R-CNN Object Detection and Aerial Tracking from UAV Images. Remote Sens. 2021, 13, 1670. [Google Scholar] [CrossRef]
  26. Zhao, Y.; Ma, J.; Li, X. Saliency detection and deep learning-based wildfire identification in UAV imagery. Sensors 2018, 18, 712. [Google Scholar] [CrossRef] [PubMed] [Green Version]
  27. Bejiga, M.B.; Zeggada, A.; Nouffidj, A. A convolutional neural network approach for assisting avalanche search and rescue operations with UAV imagery. Remote Sens. 2017, 9, 100. [Google Scholar] [CrossRef] [Green Version]
  28. Bazi, Y.; Melgani, F. Convolutional SVM networks for object detection in UAV imagery. IEEE Trans. Geosci. Remote Sens. 2018, 56, 3107–3118. [Google Scholar] [CrossRef]
  29. Ampatzidis, Y.; Partel, V. UAV-based high throughput phenotyping in citrus utilizing multispectral imaging and artificial intelligence. Remote Sens. 2019, 11, 410. [Google Scholar] [CrossRef] [Green Version]
  30. Bochkovskiy, A.; Wang, C.Y.; Liao, H.Y.M. Yolov4: Optimal speed and accuracy of object detection. arXiv 2020, arXiv:2004.10934. [Google Scholar]
  31. Yun, S.; Han, D.; Oh, S.J.; Chun, S.; Choe, J.; Yoo, Y. Cutmix: Regularization strategy to train strong classifiers with localizable features. In Proceedings of the IEEE/CVF International Conference on Computer Vision, Seoul, Korea, 27 October–2 November 2019; pp. 6023–6032. [Google Scholar]
  32. He, K.; Zhang, X.; Ren, S. Deep residual learning for image recognition. In Proceedings of the IEEE Conference on Computer Vision and Pattern Recognition, Las Vegas, NV, USA, 27–30 June 2016; pp. 770–778. [Google Scholar]
  33. Chen, X.; Fang, H.; Lin, T.Y. Microsoft coco captions: Data collection and evaluation server. arXiv 2015, arXiv:1504.00325. [Google Scholar]
  34. Xie, S.; Girshick, R.; Dollár, P. Aggregated residual transformations for deep neural networks. In Proceedings of the IEEE Conference on Computer vision and Pattern Recognition, Honolulu, HI, USA, 21–26 July 2017; pp. 1492–1500. [Google Scholar]
  35. Szegedy, C.; Liu, W.; Jia, Y. Going deeper with convolutions. In Proceedings of the IEEE Conference on Computer Vision and Pattern Recognition, Boston, MA, USA, 7–12 June 2015; pp. 1–9. [Google Scholar]
  36. Howard, A.G.; Zhu, M.; Chen, B. Mobilenets: Efficient convolutional neural networks for mobile vision ap-plications. arXiv 2017, arXiv:1704.04861. [Google Scholar]
  37. Szegedy, C.; Ioffe, S.; Vanhoucke, V. Inception-v4, inception-resnet and the impact of residual connections on learning. In Proceedings of the AAAI Conference on Artificial Intelligence, San Francisco, CA, USA, 4–9 February 2017; p. 31. [Google Scholar]
  38. Chen, L.C.; Papandreou, G.; Kokkinos, I. Semantic image segmentation with deep convolutional nets and fully connected crfs. arXiv 2014, arXiv:1412.7062. [Google Scholar]
  39. He, K.; Zhang, X.; Ren, S. Spatial pyramid pooling in deep convolutional networks for visual recognition. IEEE Trans. Pattern Anal. Mach. Intell. 2015, 37, 1904–1916. [Google Scholar] [CrossRef] [PubMed] [Green Version]
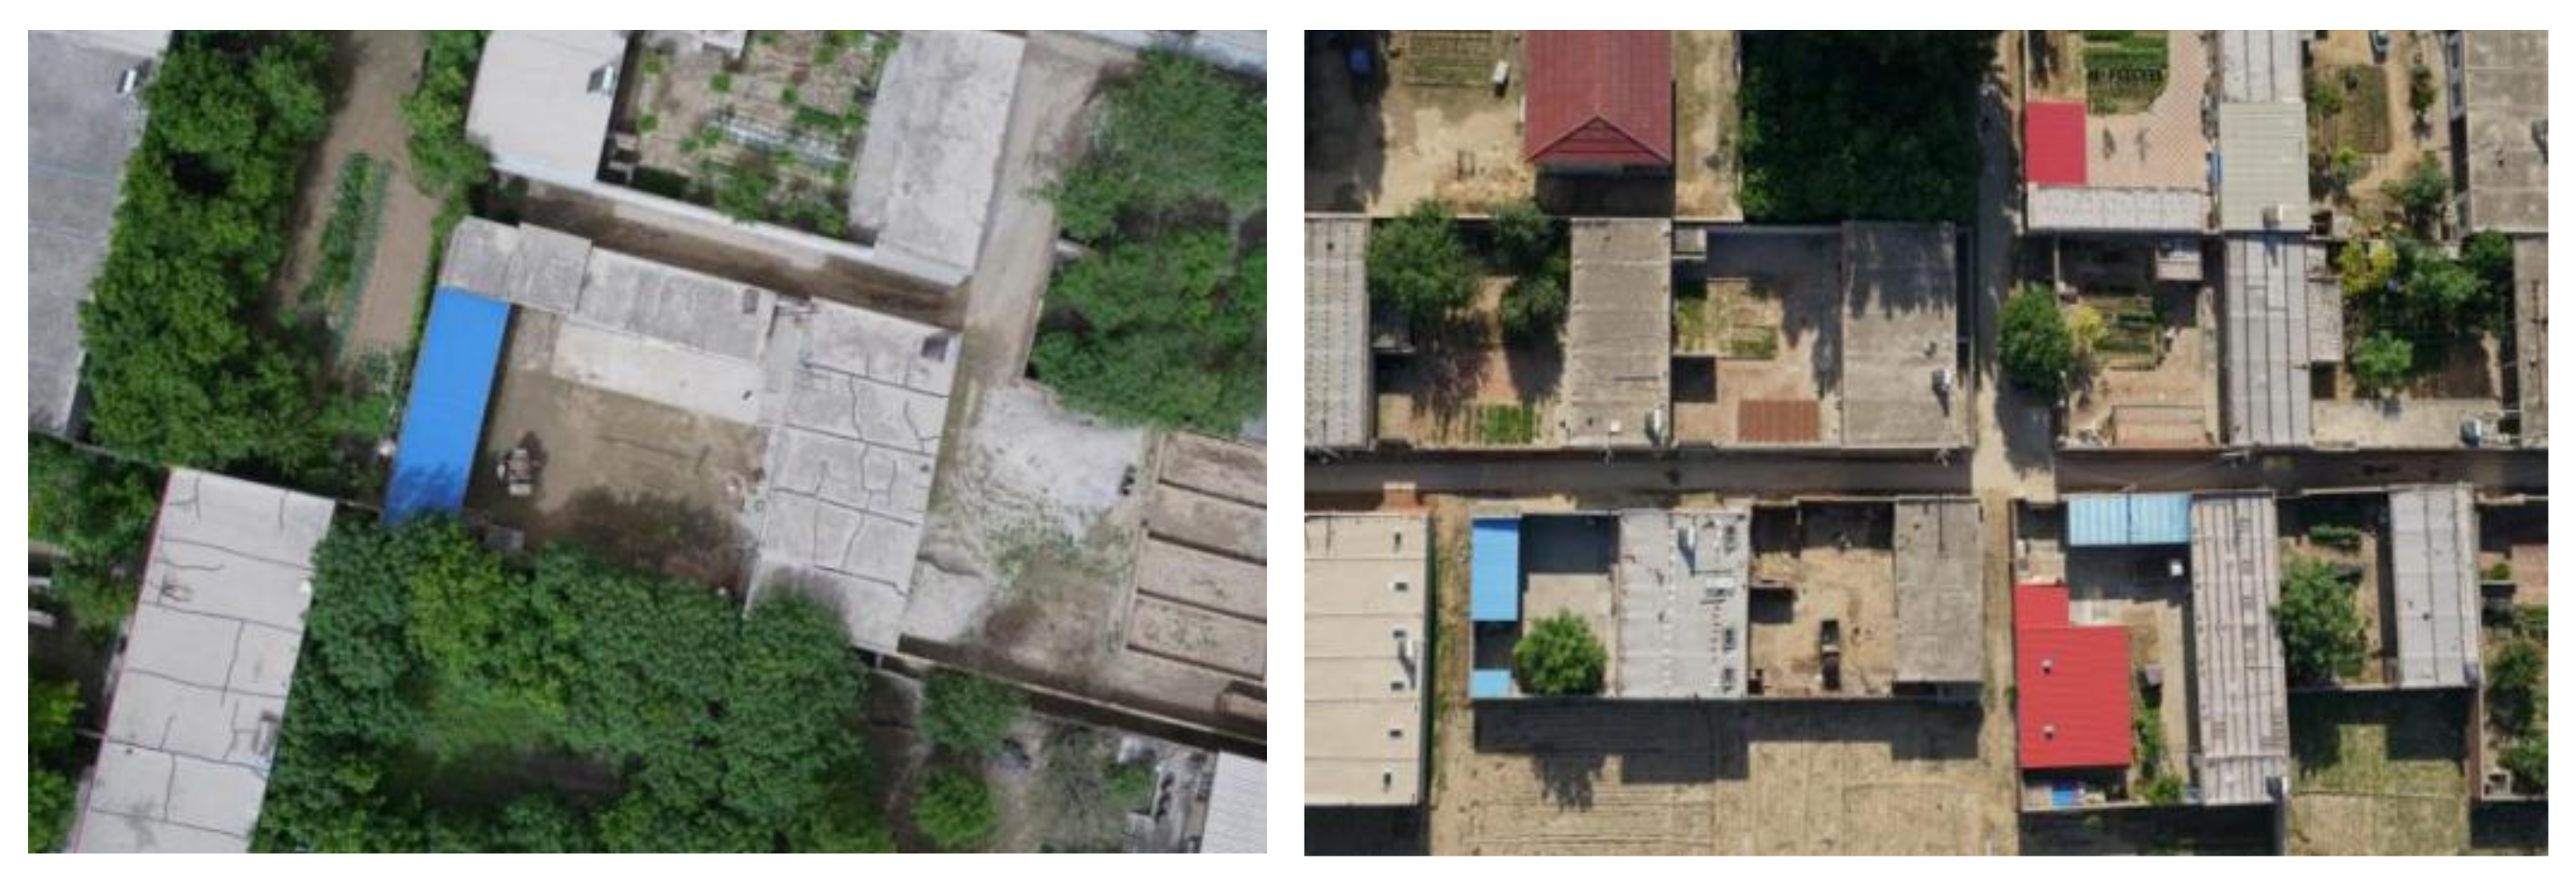
Figure 1. Low-altitude remote sensing images of villages collected by UAV.
Remotesensing 13 02130 g001
Figure 2. Small-area poppy cultivation strategies. (a) Concentrated planting; (b) single-plant planting; (c) shadow planting; (d) mixed planting; (e) covered planting.
Remotesensing 13 02130 g002
Figure 3. Image segmentation with overlap.
Remotesensing 13 02130 g003
Figure 4. The original network structure of YOLOv3.
Remotesensing 13 02130 g004
Figure 5. Global MultiScale-YOLOv3 network structure.
Remotesensing 13 02130 g005
Figure 6. Group convolution.
Remotesensing 13 02130 g006
Figure 7. Structure of residual block. (a) ResNet block; (b) ResNeXt block with cardinality 2.
Remotesensing 13 02130 g007
Figure 8. ASPP module.
Remotesensing 13 02130 g008
Figure 9. Change curve of loss value.
Remotesensing 13 02130 g009
Figure 10. The relationship between mAP and the total parameters of the model.
Remotesensing 13 02130 g010
Figure 11. The relationship between mAP and detection time.
Remotesensing 13 02130 g011
Figure 12. Detection results of different detection algorithms.
Remotesensing 13 02130 g012aRemotesensing 13 02130 g012b
Table 1. The parameters of camera.
Camera ModelValid PixelMaximum ResolutionColor Space
Sony A7RII42.4 million pixels7952 × 5304sRGB
Table 2. The metadata of the image.
Image File NameResolutionGround Resolution/cm File Type
DSC*****7952 × 53041.2JPG
Table 3. The project design.
SchemeAdd 104 × 104 PredictionModify Residual StructureAdd the ASPP Module
1
2
3
Table 4. Yolov3 model comparison.
ModelPrecision/%Recall/%F1/%mAP/%Total ParameterDetection Time/ms
YOLOv395.590.893.191.9761,523,73430
Scheme 194.591.793.192.5861,785,38430.2
Scheme 291.889.190.490.893,591,22432.4
Scheme 394.390.792.092.428,457,19224.5
Table 5. Comparison of different target detection algorithms.
ModelP/%R/%F1/%mAP/%Total ParameterDetection Time/ms
Faster rcnn (ResNet50)45.563.152.954.3828,342,195134
RetinaNet76.838.651.449.8636,382,95733.2
CenterNet97.232.849.057.5032,718,59736.2
SSD87.765.875.270.4423,745,90821.5
YOLOv488.536.651.847.8663,937,68634.2
YOLOv3 (EfficientNet)88.638.954.349.4920,235,90226.4
YOLOv3 (MobileNet)94.790.792.791.9824,135,86222.4
YOLOv3 (SqueezeNet)85.084.884.981.9831,399,92624.2
Global Multiscale-YOLOv394.390.792.092.428,457,19224.5
Table 6. Global Multiscale-YOLOv3 detection results.
Number of DetectionTPFPFNGround TruthPrecision/%Recall/%F-Score/%
Global Multiscale-YOLOv31539145188148160094.390.792.0
Publisher’s Note: MDPI stays neutral with regard to jurisdictional claims in published maps and institutional affiliations.