Abstract
Atmospheric aerosols and dust have become a challenge for urban air quality. The presented study quantified seasonal spatio-temporal variations of aerosols, tropospheric ozone, and dust over the Middle East (ME) for the year 2012 by using the HTAP emission inventory in the WRF-Chem model. Simulated gaseous pollutants, aerosols and dust were evaluated against satellite measurements and reanalysis datasets. Meteorological parameters, temperature, and wind vector were evaluated against MERRA2. The model showed high spatio-temporal variability in meteorological parameters during summer and low variability in winter. The correlation coefficients for all the parameters are estimated to be 0.92, 0.93, 0.98, and 0.89 for January, April, July, and October respectively, indicating that the WRF-Chem model reproduced results very well. Simulated monthly mean AOD values were maximum in July (1.0–1.5) and minimum in January (0.1–0.4) while April and October were in the range of 0.6–1.0 and 0.3–0.7 respectively. Simulated dust concentrations were high in April and July. The monthly average aerosol concentration was highest over Bahrain, Kuwait, Qatar, and the United Arab Emirates and Jeddah, Makkah. The contributions to urban air pollution were highest over Makkah city with more than 25% from anthropogenic sources.
1. Introduction
Atmospheric aerosols are mixture of solid or liquid particles suspended in air. Aerosols can be found in ample quantity in air and are visible as haze, smoke, and dust. Natural and anthropogenic activities are responsible for higher concentrations of aerosol [1,2]. Anthropogenic emissions have increased dramatically over the past century [3]. Aerosols are key air pollutants that have harmful impacts on health, including asthma, diminished lung function, cardiorespiratory sickness, and reductions in visibility (Intergovernmental Panel on Climate Change (IPCC) [4]. According to the World Health Organization (WHO) reports that globally around 7 million premature deaths were an indicator of air pollution during 2012 [5]. There are a limited number of observational and modeling studies conducted for the Arabian Peninsula; however, some available studies have reported high aerosol concentrations over the Arabian Peninsula [6,7,8,9,10,11,12,13,14] These high concentrations in the region are mainly due to natural dust and anthropogenic activities such as industrial and road transportation in the region.
While many monitoring methods are available, however, modeling studies, ground-based in-situ measurements, satellite measurements, and aircraft campaigns also has advanced air-quality monitoring and improved geospatial distribution analysis [15,16]. Remote sensing data and reanalysis datasets are widely used to assess the spatio-temporal distribution of aerosols from local to global scales. Modeling studies of air pollutants are extensively used to identify atmospheric distributions, to quantify surface precursor emissions, and to evaluate local air quality [15,16,17,18,19,20,21,22]. Urban air pollution in ME countries, especially in the Kingdom of Saudi Arabia (KSA), Qatar and United Arabic Emirates (UAE) has become a severe problem in megacities. Rapid industrialization, heavy traffic on the roads, and increasing population are responsible for poor air quality in the megacities in the Middle East region. Sulfate aerosols have adverse effects and are a major source of low visibility in the atmosphere and widely analyzed and discussed in different regions, e.g., United States, China, Australia, South Asia, and Europe [18,19,20,23,24,25,26,27,28].
Sulfates have also impacted the radiation balance of Earth’s systems and contribute to regional and global climate change [4,29,30,31]. Photochemical reactions are responsible for diurnal variability of sulfate aerosols. The transformation of sulfur dioxide to sulfate can take place through several liquid and gas phase oxidation processes. The liquid-phase oxidations play a vital role in formation of sulfate within clouds [32,33,34]. Tropospheric ozone is also an important air pollutant in the atmosphere. Near the surface, concentrations of ozone are contingent on both meteorological conditions and emissions precursors. Meteorological parameters affect ozone concentrations by changing cross-tropopause (from the stratosphere to troposphere) movement of ozone [35,36,37], volatile organic compounds emissions from biogenic activities [38], removal and production by chemical reactions, and deposition of ozone [39,40,41]. Change in water vapor concentration and temperature in the atmosphere can impact the formation and loss of ozone. The important processes that affect the concentrations of ozone include vertical and horizontal transport, dry and wet deposition, and chemical formation and loss. Despite domestic air quality issues, transboundary air pollution transport from Africa also worsens air quality in ME. The anthropogenic sources that contribute to urban air pollution mainly consist of construction activities and fossil fuel usage in industries, power plants and the transport sector [42,43]. Natural factors also contribute to regional pollution. such as mineral dust transport being an important source of regional pollution in Asia [44]. Earlier studies for the ME were mainly concentrated on dust [45,46,47,48,49]. However, especially in the cities, dust mixing with anthropogenic aerosols produces the most adverse effect on air quality.
Air pollution levels in the ME region are several times higher than the safe limits regulated by WHO. Khan Alam et al., [50] reported contrasting variation in aerosol optical properties during dust episodes in the Middle East and Southwest Asia by comparing model results and ground measurement and observed significant variation in AOD over Middle East during dusty and non-dusty days. Robabeh et al. [51] reported aerosol trends during the dusty season over Iran using MERRA-2 and MODIS data sets and concluded that the amount of aerosol has decreased in the recent decade in response to significant anomalies in large-scale atmospheric pressure. A recent study [52] analyzed near-cloud changes in atmospheric aerosols using satellite observations and global model simulations. The study used MERRA-2, MODIS and CALIOP datasets and explored an important aspect of aerosol-cloud interactions and the impact of clouds and cloud-related processes on nearby aerosols. Rehana et al. [53] used MERRA-2 data sets to study interdecadal changes in aerosol optical depth over Pakistan during 1980–2018. This study aims to understand the air pollution levels, seasonal variations of aerosols, optical properties of aerosols, tropospheric ozone, model validation against satellite measurements, and ground-based observations, by using a high spatial-resolution modeling approach and the latest emissions inventories. This study also aims to develop a tool for better evaluating the effectiveness of short-term and prolonged air quality control strategies.
2. Modelling Setup
The Weather Research and Forecasting Model coupled with Chemistry (WRF-Chem) [54], developed by the National Oceanic and Atmospheric Administration (NOAA) and National Center for Atmospheric Research (NCAR), is used to simulate aerosol concentrations over the ME during the months (allowing a one-week spinup) of January, April, July, and October of the year 2012 to represent four different seasons. This study uses version 7.1 of the WRF-Chem.
The CBM-Z mechanism has been used for the gas-phase chemistry scheme [55] and Fast-J scheme for calculation of photolysis rates [56]. The aerosol module is the Model for Simulating Aerosol Interactions and Chemistry (MOSAIC) [57] with different size bins (0.039–0.078, 0.078–0.156, 0.156–0.3125, 0.3125–0.625, 0.625–1.25, 1.25–2.5, 2.5–5.0, 5.0–10 μm). Simulated aerosol species in MOSAIC include , , , OC and BC. The GOCART dust scheme is used for calculating the dust generation and transport in this study. The aerosol direct radiative effects (both Shortwave and Longwave spectral bands) have been calculated using the RRTMG Radiation scheme.
2.1. Observations
Meteorological parameters and aerosol mixing ratios are evaluated against MERRA2 reanalysis datasets. The satellite data can provide sufficient temporal and spatial coverage. The simulated aerosols can be evaluated by using satellite of aerosol optical depth. In this study AOD retrieved from Aerosol Robotic Network (AERONET) AOD at 500 nm and Moderate-resolution Imaging Spectroradiometer (MODIS) Terra satellite at the wavelength of 550 nm have been used.
2.2. Emissions
In this study, anthropogenic emissions of NOx, non-methane, volatile organic compounds (NMVOCs), CO, SO2, BC, NH3, and OC are taken from the Hemispheric Transport of Air Pollution (HTAP) emissions for 2010 (http://www.htap.org, accessed on 3 February 2016, HTAP_v2 datasets are defined according to international merit and emissions are gridded with global proxy data. This gives a set of high spatial-resolution emission grid maps with global coverage (Janssens-Maenhout et al., 2015). HTAP_v2 dataset is compiled using different regional gridded inventories, which incorporate the Environment Canada is for Canada, United States Environmental Protection Agency (US-EPA) for the USA, the European Monitoring and Evaluation Programme (EMEP), and Netherlands Organisation for Applied Scientific Research (TNO) is for Europe. The Model Inter Comparison Study in Asia (MICS-Asia) is for India, China, and other Asian countries. For the rest of the world (mainly Africa, South America, Russia, and Oceania) Emissions Database for Global Atmospheric Research (EDGARv4.3) is used. The HTAP datasets provides gridded data of 0.1° × 0.1° resolution and covers all sectors such as agriculture, power, industries, transport and residential. Simulations of , , , OC, BC, dust and ozone for 4 months (i.e., January, April, July, and October) of the year 2012.
2.3. Numerical Simulations
WRF-Chem simulations were made to analyze variations in aerosols in different seasons for aerosol optical properties, ozone and dust over the ME region:
The control simulations were performed for the , , , OC, BC, and dust for 4 months (i.e., January, April, July, and October) of the year 2012. The model was spun up for seven days for simulation of the four months of the year 2012. The meteorological and boundary conditions data is attained from NCEP FNL. This data has a temporal resolution of 6 h and horizontal resolution of 1 degree (http://rda.ucar.edu/datasets/ds083.2/, accessed on 22 January 2016). For chemical species, boundary conditions and initial conditions were taken from the Model for Ozone and Related Chemical Tracers-version 4 (MOZART-4) [58].
3. Results and Discussions
3.1. Evaluation of Meteorological Parameters
The atmospheric circulation variability is the vital factor for measuring changes in the spatial distribution of aerosols and chemical tracers. Clearly, the accuracy of the parameters used to build weather models is strongly influenced by predictions of aerosol distribution. Because emission, deposition, and chemical transformation are mainly controlled by atmospheric parameters, simulations of meteorological fields are evaluated against reanalysis data. The monthly mean surface-air temperature was compared with the modeled mean at a two-meter height, and zonal and meridional wind vector components at 10 m with MERRA2 reanalysis. To provide the spatial statistical characteristics between the WRF model and reanalysis, both WRF-Chem outputs and MERRA2 reanalysis were interpolated into a new lat-long grid with 0.1 × 0.1-degree resolution using bilinear interpolation. Following statistical parameters, BIAS (Equation (1)), mean absolute error (MAE; Equation (2)), root mean square error (RMSE; Equation (3)), and Pearson correlation coefficient (CORR; Equation (4)) to evaluate the model outputs. These parameters can be defined as:
where Fi represents the simulated values and Oi—MERRA2 reanalysis gridded observation, and N is the number of observations.
Simulated monthly mean air temperature at a two-meter height for January, April, July, and October of 2012 were analyzed with MERRA2 (Figure 1). In January, air temperatures were higher in eastern and southern South Arabia than in the western regions during these months, and the maximum temperatures were above 35 °C in July.
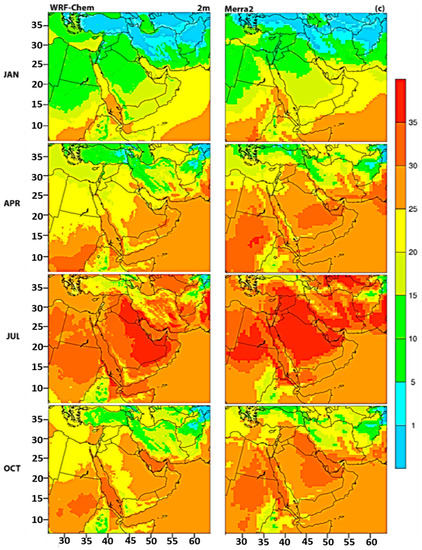
Figure 1.
Comparison between simulated (left column) and MERRA2 (right column), monthly mean air temperature at 2 m (Celsius) during January, April, July and October of 2012.
The comparisons of monthly mean wind vector components of simulated and MERRA2 at a 10-m height are shown in Figure 2. The simulated wind magnitude is generally high (>10 m/s) in July and at a minimum in January over the Arabian Sea. In comparison with MERRA2 wind magnitude and wind vectors, the model captures magnitudes and spatial distributions well.
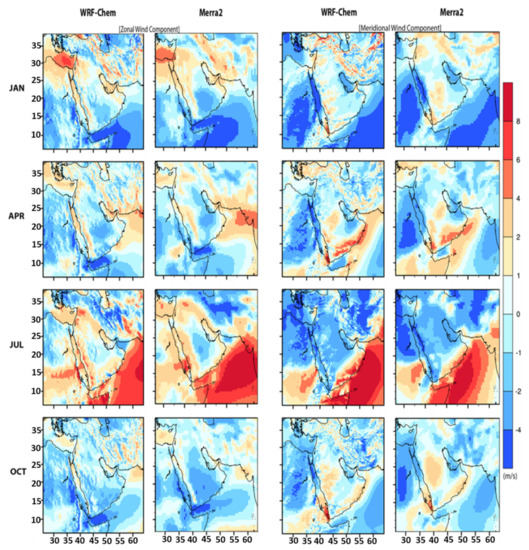
Figure 2.
Comparison between simulated and MERRA2, monthly mean Zonal & Meridional wind component (m/s) at 10 m height during January, April, July, and October of 2012.
Statistical comparison of simulation with the MERRA2 reanalysis is presented in Table 1 and the Taylor diagrams for 2 m, temperature, zonal and meridional components are shown in Figure 3.

Table 1.
Statistical evaluation of model meteorological parameters.
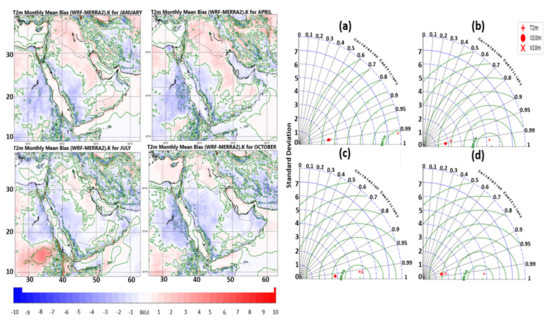
Figure 3.
Spatial distribution of 2 m temperature bias (Left) and Taylor diagram for 2 m temperature (plus sign), 10 m zonal wind component (filled circle), and 10 m meridional wind component (x sign). Green dashed lines show RMSE, blue dashed lines show standard deviation and black solid lines are corresponding to the correlation coefficient. (a) for January; (b) for April; (c) for July and (d) for October (right).
The model reproduced the magnitudes and spatial distributions of 2 m temperatures and wind vector components at 10 m. The temperature and zonal components of the wind have a negative bias in the entire period of simulation. The meridional component of wind shows the bias of seasonal dependence, the negative in the cold period of a year, and the positive and warm period. The RMSE of 2 m temperature ranges from 1.25 °C in January to 1.40 °C in July. As shown in Table 1, the RMSE of wind vector components takes values of 0.82 m/s in April to 1.29 m/s in July. The correlation coefficient between model output and the MERRA2 reanalyzed observation shows values between 0.80 and 0.99. A slight increase in the correlation coefficient was observed for 2 m temperature in comparison with other variables. Statistical evaluation of the average values of the model domain shows a high agreement with observations, the spatial distribution of model error strongly depends on the complexity of relief. Figure 3 demonstrates the 2 m temperature bias; the maximum bias was around 3 °C over the area with complex terrain and the area near the coastline. Conversely, areas with flat (smooth) terrain are associated with low bias (around ±1 °C). This statistical analysis allows us to conclude that the experiment is well-tuned for the region and that the selected set of physical parameterizations describe both the large-scale and mesoscale atmospheric processes in this region.
3.2. Evaluation of Aerosol Optical Depth (AOD)
The MODIS Terra AOD at the wavelength of 550 nm was compared with Modelled AOD for months of January, April, July, and October in 2012. The MODIS monthly product of level 3 datasets was taken from the NASA Giovanni website (http://disc.sci.gsfc.nasa.gov/giovanni, accessed on 19 May 2016). Ground-based AOD was retrieved from Aerosol Robotic NETwork (AERONET) [59]). Figure 4 shows the simulated monthly mean AOD from the CTRL simulations, and MODIS retrieved AOD for 2012.
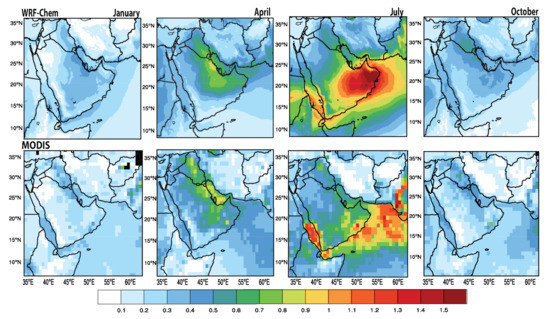
Figure 4.
Comparisons of simulated monthly mean AOD (first row) with and MODIS Land & Ocean mean AOD (second row) for January, April, July, and October 2012.
Simulated monthly mean AOD values were maximum in July and at a minimum in January over the eastern ME region i.e., Kuwait, Dammam KSA, Bahrain, Qatar, United Arabic Emirates, Oman, and eastern Yemen. Maximum values were in the range of 1.0–1.5 in July and minimum in the range of 0.1–0.4. AOD values were in the range of 0.6–1.0 in April which is higher than January but lower than those the values were in July. In October, AOD values were in the range of 0.3–0.7 and completed the seasonal cycle. In general, simulated AOD values were in the western ME region (along the Red Sea), which includes Sana’a, Jazan, Jeddah, Makkah, Madina, Tabuk, generally lower than those of AOD in eastern ME, and AOD values show strong seasonal variations. The magnitudes of AOD agree and simulated seasonal variations were found to be in good agreement with the MODIS measurements.
Simulated aerosol optical properties in the WRF-Chem model are at the wavelengths of 300, 400, 600, and 999 nm. Since retrieved AOD from AERONET are at the wavelengths of 500 nm, WRF-Chem simulated AOD values are interpolated to 500 nm following the Angström power law (http://disc.sci.gsfc.nasa.gov/data-holdings/PIP/aerosol_angstrom_exponent.shtml, accessed on 21 May 2016). Simulated and AERONET AOD values at 500 nm over Kuwait University (29°N, 47°E), Karachi (24.8°N, 67°E) for January, and Mezaira (23.1°N, 53.7°E), KAUST (22.18°N, 39°E) and Karachi for April while Kuwait, Solar Village (24.5°N, 46.23°E) and KAUST for July and Masdar (24.2°N, 54.3°E), Solar Village and KAUST for October are shown in Figure 5.
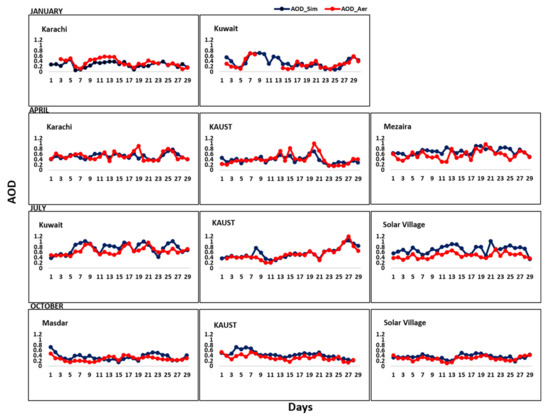
Figure 5.
Comparison of daily simulated AOD and daily AERONET retrieved AOD at 500 nm during January, April, July, and October 2012 over Kuwait, Karachi, Mezaira, KAUST, Solar Village, and Masdar stations.
Overall, in January, simulated and AERONET values for Kuwait University and Karachi were in the range of 0.08–0.71, and 0.05–0.56, respectively. Simulated and AERONET values for Mezaira, KAUST, and Karachi in April, were in the range of 0.3–0.96, 0.13–1.0, and 0.33–0.90, respectively. During July, simulated and AERONET values for Solar Village, Kuwait University, and KAUST were in the range of 0.3–1.0, 0.37–1.02, and 0.20–1.2 respectively. In October, simulated and AERONET values for Solar Village, KAUST, and Masdar Institute were in the range of 0.11–0.50, 0.09–0.58, and 0.14–0.72, respectively. Overall, modeled AOD values were found within range of AERONET retrievals in January, July, and October and slightly lower in April. This underestimation may be associated with large uncertainties reported in modeled meteorology, parametrization, and anthropogenic emissions [60,61,62]. The results of this study are in agreement with previously reported studies in the region that have also shown an underestimation of the dust events [62,63,64,65]. A recent study by Parajauli et al. [66] reported that the WRF-Chem model underestimated the AOD at KAUST by about 35% during the dust event compared to AERONET AOD. Another study over North African region also reported that WRF-Chem model underestimate the AOD peaks in the middle of June in Banizoumbou as compared to the AERONET station [62,63,64]. Ukhov et al. [63] reported that the WRF-Chem model and assimilation products struggle to fit the retrieved AERONET aerosol volume size distribution, failing to correctly reproduce the fine mode in the sub-micron range. The WRF-Chem AOD have low bias values as compared to AERONET, especially during the severe dust events and exhibits the relatively high positive BIAS. Shahid et al. [18] reported that the WRF-Chem AOD values underestimate as compared to AERONET AOD values during dense haze events over North-eastern Pakistan using the WRF-Chem model and remote sensing. Kumar et al. [65] reported that the WRF-Chem model reproduced the spatial and temporal distributions of dust plumes and aerosol optical properties but generally underestimated the AOD.
4. Seasonal Aerosol Variations
The Figure 6 represents the monthly mean concentrations of aerosol distributions simulated for January, April, July, and October over the greater region of ME. Over the northeastern ME region, aerosol shows maximum concentrations of 10–20 µg m−3 in July and October, especially higher over Kuwait, Bahrain, Qatar, UAE, and over southwestern ME region, concentrations of 3–10 µg m−3 prevail during January, April, July, and October, and specifically higher over the western (Jeddah-Makkah) Region. The high sulfate concentration during summertime is associated with photo-chemical reactions almost all over the ME region that led to conversion of SO2 to [67,68,69,70]. Simulated concentrations are generally lower than those in the northeastern ME region. maximum concentrations of 5–10 µg m−3 were simulated in January, over Dubai UAE and Doha Qatar. concentrations of 1–4 µg m−3 were simulated mostly along the Red Sea and Arabian Gulf during all months.
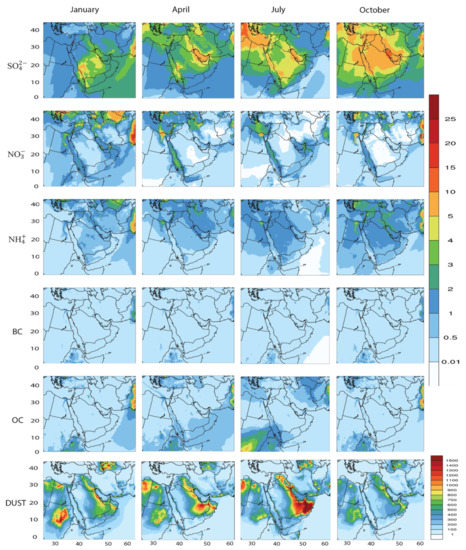
Figure 6.
Simulated monthly mean surface-layer concentrations (µg m−3) of , , , BC, OC and dust for January, April, July and October of the year 2012.
Simulated AOD is composite of all variables including sulfate, nitrate, ammonium, black carbon, organic carbon, and dust. As shown in Figure 6, simulated dust, sulfate, and nitrate aerosols have high concentrations in July leading to high simulated AOD values during summer over northeastern part of Middle East. Overall, the model predicts AOD within the range of MODIS retrievals during all seasons except in July. During July, modeled AOD is within range of MODIS AOD over south western region (southern Red Sea) but is overestimated in northeastern part of middle east (United Arabic Emirates). Such inaccuracy in AOD might be due to inaccurate wind threshold velocity in the WRF-Chem model which has possibly influenced the simulation of dust emission, and transport [71,72,73,74].
Our results agree with findings from previous regional studies that have also shown an underestimation and overestimation of AOD [75,76,77]. Colarco et al. [75] reported the notable differences between the model which underestimates the aerosol loading in the western United States and in the biomass-burning-dominated regions in South America and southern Africa, where the model overestimates the aerosol loading in the northern Atlantic and northern Pacific, and the model overestimates the aerosol loading.
Lower concentrations of are due to high temperatures during all seasons, which are not favorable for formation. Simulated ammonium concentrations are 0.5−3 µg m−3 during January, April, July, and October. Simulated BC concentrations are 0.5 µg m−3 during all seasons, which might be due to no or low emissions. Simulated OC concentrations are 0.5−2 µg m−3 in April and July which is attributed to transport from Sudan and Ethiopia. Simulated dust shows maximum concentrations of 1000−1500 µg m−3, especially higher in Oman, UAE, Qatar, Kuwait, south-eastern ME, and 300−800 µg m−3 in the western ME region, along the Red Sea in April and July. In January and October, simulated dust concentrations were 300−900 µg m−3 over Qatar, Kuwait, and Oman and 100−300 µg m−3 over the western ME region. High aerosol concentration was observed over the eastern and western ME region in January, while aerosol levels in April increased as compared to January over the northeastern and western ME region. In July and October, pollutants start to build up over the central region along with the eastern and western ME region. Simulated dust concentrations indicate good seasonal variations from January to April and maximum in July to its seasonal peak. In October, aerosol concentrations decrease and reach a minimum in January.
5. Seasonal Ozone Variations
Figure 7 shows the simulated seasonal monthly mean surface-layer concentrations of ozone from the CTRL simulation during January, April, July, and October 2012. Over the northeastern ME region, monthly mean ozone concentrations are the lowest in January and October with values of 30 to 45 ppbv due to weak photochemistry. The maximum ozone concentrations of 35 to 55 ppbv are simulated in April and July, prevailing over the whole ME region, especially higher over the Red Sea and Arabian Gulf. Simulated ozone concentrations show strong seasonal variations; compared to the concentrations in January, ozone levels in April show an increase and reach a maximum in July at their seasonal peak, and in October, ozone concentrations decrease again, with concentrations as low as those in January.
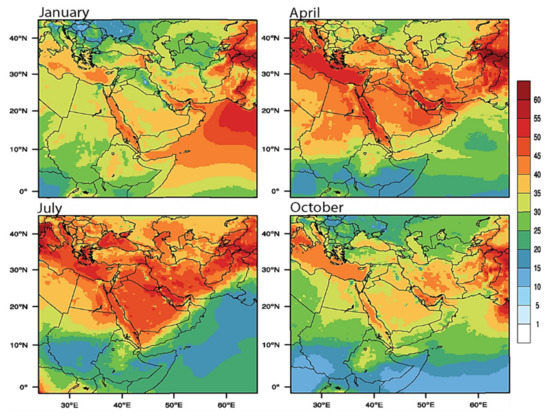
Figure 7.
Simulated surface-layer concentrations (ppbv) of Ozone during January, April, July and October of 2012.
Ozone concentrations are higher over the Red Sea, Arabian Gulf, and the Mediterranean Sea during all months but reach a maximum in July, which is attributed to ship emissions and low ozone uptake by sea surface. Ship emissions mostly affect marine and coastal areas due to the marine boundary layer height, but the ship emissions could contribute to the ozone budget above the boundary layer, where they may have an impact on the regional radiation budget.
6. Urban Air Pollution
In the ME region, dust is a major contribution to air pollution, but urban air pollution has become a severe problem in megacities due to anthropogenic emissions. Therefore, we quantify the aerosol-to-dust ratio to quantify the anthropogenic aerosol contribution in comparison with dust. The aerosol-to-dust ratio is quantified using Equation (5):
Figure 8 shows the simulated dust concentrations time series and aerosols (sum of sulfate, nitrate, and ammonium) to dust ratio (%) over Makkah city during January, April, July and October of 2012.
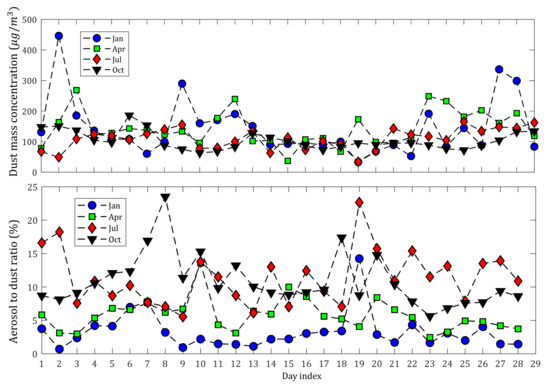
Figure 8.
Simulated daily average dust concentrations and daily average ratio of aerosols (sum of sulfate, nitrate and ammonium) to dust ratio (%), over Makkah during January, April, July, and October of 2012.
In January, aerosols’ contributions in Makkah accounted for about 5–10% and 10–20% during April. Aerosols have the largest contributions in Makkah during July and October accounting for 10–25%. The largest aerosol contributions in Makkah are due to anthropogenic emissions from the transport sector, millions of people visited the Makkah city for religious activities, the industrial emissions play a secondary role within the Makkah region, facilitate the largest formation of sulfate.
7. Summary and Conclusions
This article presents spatial distribution and temporal variation of aerosol concentrations over the ME region using the WRF-Chem Model with a spatial resolution of 10 km × 10 km. The pollutant concentrations were simulated for the year 2012 by using anthropogenic emissions from the HTAP emissions inventory. These pollutants include BC, OC, SO4, NH4, NO3, ozone, and dust. The seasonal variations of aerosols and ozone were analyzed to study the impact of their cross-boundary transport and quantified the aerosol-to-dust ratio over Makkah City. We used six AERONET stations and MODIS to study observed AOD. The main findings of this research are summarized as follows.
- The simulated AOD obtained from the high-resolution WRF-Chem model is reasonably consistent over the study sites across observational datasets, including AERONET and MODIS. The simulated seasonal variations and magnitudes of AOD is also consistent with the MODIS measurements.
- The model successfully reproduced the general features of the Middle East meteorology such as the seasonal changes in wind patterns along with the seasonal cycle of temperature. The errors in model-simulated meteorological parameters are within the proposed benchmark values.
- Meteorological parameters are predicted well by the model, and the correlation coefficient is 0.92, 0.93, 0.98 and 0.89 for January, April, July, and October respectively. The meridional component of wind shows the bias of seasonal dependency, negative in winter, and positive in summer.
- The RMSE of 2 m temperature ranges from 1.25 °C in January to 1.40 °C in July. RMSE of wind vector components takes values of 0.82 m/s in April to 1.29 m/s in July.
- Sulfate aerosol shows maximum concentrations over Kuwait, Bahrain, Qatar, UAE during July, and October. Simulated concentrations nitrate is generally lower than those sulfate in the northeastern ME region.
- The analysis shows that the aerosol concentrations are highest over urban regions, and monthly average sulfate, nitrate, ammonium, and dust aerosols are highest over Bahrain, Kuwait, Qatar, and the United Arab Emirates and Jeddah, Makkah Region in the Kingdom of Saudi Arabia.
- The aerosol-to-dust ratio over Makkah city was quantified for January, April, July, and October 2012. Aerosol’s contributions in Makkah accounting for about 5–10% and 10–20% during January and April, respectively. Aerosols have the largest contributions in Makkah during July and October accounting for about 10–25%.
We believe that with improvement in WRF-Chem model sensitivities, physical parameterizations and development of coupled aerosol modules can further increase model capacity to capture extreme dust and pollution events.
Author Contributions
Conceptualization, Investigation, Visualization, M.Z.S., Formal analysis, result discussion, writing & editing, I.S.—Scientific discussion and review M.B. & F.C. All authors have read and agreed to the published version of the manuscript.
Funding
This research received no external funding.
Institutional Review Board Statement
Not applicable.
Informed Consent Statement
Not applicable.
Acknowledgments
We thank and acknowledge Suleiman Mostamandy (King Abdullah University of Science and Technology) for assistance in the statistical evaluation of model meteorological parameters. The editorial and consultancy support from Adaptive AgroTech and Redmond R. Shamshiri is duly acknowledged.
Conflicts of Interest
The authors declare no conflict of interest.
References
- Chin, M.; Remer, L.A.; DeCola, D.; Feingold, G.; Halthore, R.; Kahn, R.A.; Quinn, P.K.; Rind, D.; Schwartz, S.E.; Streets, D.G.; et al. Atmospheric Aerosol Properties and Climate Impacts; U.S. Climate Change Science Program Synthesis and Assessment Product 2.3; US Climate Change Science Program: Washington, DC, USA, 2009. [Google Scholar]
- Seinfeld, J.H.; Pandis, S.N. Atmospheric Chemistry and Physics, from Air Pollution to Climate Change; John Wiley, A Wiley-Interscience Publication Press: Hoboken, NJ, USA, 2006; Volume 2. [Google Scholar]
- Lohmann, U.; Feichter, J. Global indirect aerosol effects: A review. Atmos. Chem. Phys. 2005, 5, 715–737. [Google Scholar] [CrossRef]
- Stocker, T.F.; Qin, D.; Plattner, G.-K.; Tignor, M.; Allen, S.K.; Boschung, J.; Nauels, A.; Xia, Y.; Bex, V.; Midgley, P.M. Climate Change 2013: The Physical Science Basis; Contribution of Working Group I to the Fifth Assessment Report of the Intergovernmental Panel on Climate Change Cambridge University Press: Cambridge, UK; New York, NY, USA, 2013; p. 1535. [Google Scholar]
- WHO. Health Risk of Particulate Matter from Long Range of Transboundary Air Pollution. 2013. Available online: https://www.euro.who.int/__data/assets/pdf_file/0006/189051/Health-effects-of-particulate-matter-final-Eng.pdf (accessed on 25 March 2016).
- Ukhov, A.; Mostamandi, S.; Krotkov, N.; Flemming, J.; da Silva, A.; Li, C.; Fioletov, V.; McLinden, C.; Anisimov, A.; Alshehri, Y.M.; et al. Study of SO Pollution in the Middle East Using MERRA-2, CAMS Data Assimilation Products, and High-Resolution WRF-Chem Simulations. J. Geophys. Res. Atmos. 2020, 125, e2019JD031993. [Google Scholar] [CrossRef]
- Roshan, D.R.; Koc, M.; Isaifan, R.; Shahid, M.Z.; Fountoukis, C. Aerosol Optical Thickness over Large Urban Environments of the Arabian Peninsula—Speciation, Variability, and Distributions. Atmosphere 2019, 10, 228. [Google Scholar] [CrossRef]
- Anisimov, A.; Tao, W.; Stenchikov, G.; Kalenderski, S.; Prakash, P.J.; Yang, Z.-L.; Shi, M. Quantifying local-scale dust emission from the Arabian Red Sea coastal plain. Atmos. Chem. Phys. 2017, 17, 993–1015. [Google Scholar] [CrossRef]
- Cahill, B.; Toumi, R.; Stenchikov, G.; Sergey, O.; Helen, B. Evaluation of thermal and dynamic impacts of summer dust aerosols on the Red Sea. J. Geophys. Res. Ocean. 2017, 122, 1325–1346. [Google Scholar] [CrossRef]
- Banks, J.R.; Brindley, H.E.; Stenchikov, G.; Schepanski, K. Satellite retrievals of dust aerosol over the Red Sea and the Persian Gulf (2005–2015). Atmos. Chem. Phys. 2017, 17, 3987–4003. [Google Scholar] [CrossRef]
- Prakash, P.J.; Stenchikov, G.; Tao, W.; Yapici, T.; Warsama, B.; Engelbrecht, J. Arabian Red Sea coastal soils as potential mineral dust sources. Atmos. Chem. Phys. 2016, 16, 11991–12004. [Google Scholar] [CrossRef]
- Kalenderski, S.; Stenchikov, G. High-resolution regional modeling of summertime transport and impact of African dust over the Red Sea and Arabian Peninsula. J. Geophys. Res. Atmos. 2016, 121, 6435–6458. [Google Scholar] [CrossRef]
- Alghamdi, M.A.; Almazroui, M.; Shamy, M.; Redal, M.A.; Alkhalaf, A.K.; Hussein, M.A.; Khoder, M. Characterization and Elemental Composition of Atmospheric Aerosol Loads during Springtime Dust Storm in Western Saudi Arabia. Aerosol Air Qual. Res. 2015, 15, 440–453. [Google Scholar] [CrossRef]
- Munir, S.; Habeebullah, T.M.; Seroji, A.R.; Morsy, E.A.; Mohammed, A.M.F.; Saud, W.A.; Esawee, A.L.; Awad, A.H. Modeling Particulate Matter Concentrations in Makkah, Applying a Statistical Modeling Approach. Aerosol Air Qual. Res. 2013, 13, 901–910. [Google Scholar] [CrossRef]
- Martin, R.V. Satellite remote sensing of surface air quality. Atmos. Environ. 2008, 42, 7823–7843. [Google Scholar] [CrossRef]
- Duncan, B.N.; Prados, A.I.; Lamsal, L.N.; Liu, Y.; Streets, D.G.; Gupta, P.; Hilsenrath, E.; Kahn, R.A.; Nielsen, J.E.; Beyersdorf, A.; et al. Satellite data of atmospheric pollution for U.S. air quality applications: Examples of applications, summary of data end-user resources, answers to FAQs, and common mistakes to avoid. Atmos. Environ. 2014, 94, 647–662. [Google Scholar] [CrossRef]
- Streets, D.G.; Canty, T.; Carmichael, G.R.; de Foy, B.; Dickerson, R.R.; Duncan, B.N.; Edwards, D.P.; Haynes, J.A.; Henze, D.K. Emissions estimation from satellite retrievals: A review of current capability. Atmos. Environ. 2013, 77, 1011–1042. [Google Scholar] [CrossRef]
- Shahid, M.Z.; Shahid, I.; Chishtie, I.; Shahzad, M.I.; Bulbul, G. Analysis of a dense haze event over North-eastern Pakistan using WRF-Chem model and remote sensing. J. Atmos. Sol. Terr. Phys. 2019, 182, 229–241. [Google Scholar] [CrossRef]
- Shahid, M.Z.; Liao, H.; Li, J.; Shahid, I.; Lodhi, A.; Mansha, M. Seasonal Variations of Aerosols in Pakistan: Contributions of Domestic Anthropogenic Emissions and Transboundary Transport. Aerosol Air Qual. Res. 2015, 15, 1580–1600. [Google Scholar] [CrossRef]
- Shahid, M.Z.; Hong, L.I.A.O.; Yu-Lu, Q.I.U.; Shahid, I. Source sector contributions to aerosol levels in Pakistan. Atmos. Ocean. Sci. Lett. 2015, 8, 308–313. [Google Scholar]
- Shahid, M.Z.; Shahid, I.; Zahid, M. Inter-annual variability and distribution of aerosols during winters and aerosol optical thickness over Northeastern Pakistan. Int. J. Environ. Sci. Technol. 2020. [Google Scholar] [CrossRef]
- Shahid, I.; Alvi, M.U.; Shahid, M.Z.; Alam, K.; Chishtie, F. Source Apportionment of PM10 at an Urban Site of a South Asian Mega City. Aerosol Air Qual. Res. 2018, 18, 2498–2509. [Google Scholar] [CrossRef]
- Adhikary, B.; Carmichael, G.R.; Tang, Y.; Leung, L.R.; Qian, Y.; Schauer, J.J.; Stone, E.A.; Ramanathan, V.; Ramana, M.V. Characterization of the seasonal cycle of south Asian aerosols: A regional-scale modeling analysis. J. Geophys. Res. Atmos. 2007, 112. [Google Scholar] [CrossRef]
- Pye, H.; Liao, H.; Wu, S.; Mickley, L.J.; Jacob, D.J.; Henze, D.K.; Seinfeld, J.H. Effect of changes in climate and emissions on future sulfate-nitrate-ammonium aerosol levels in the United States. J. Geophys. Res. Atmos. 2009, 114. [Google Scholar] [CrossRef]
- Yang, Y.; Liao, H.; Li, J. Impacts of the East Asian summer monsoon on interannual variations of summertime surface-layer ozone concentrations over China. Atmos. Chem. Phys. 2014, 14, 6867–6879. [Google Scholar] [CrossRef]
- Turnock, S.T.; Spracklen, D.V.; Carslaw, K.S.; Mann, G.W.; Woodhouse, M.T.; Forster, P.M.; Haywood, J.; Johnson, C.E.; Dalvi, M.; Bellouin, N.; et al. Modelled and observed changes in aerosols and surface solar radiation over Europe between 1960 and 2009. Atmos. Chem. Phys. 2015, 15, 9477–9500. [Google Scholar] [CrossRef]
- Fan, J.; Rosenfeld, D.; Yang, Y.; Zhao, C.; Leung, L.R.; Li, Z. Substantial contribution of anthropogenic air pollution to catastrophic floods in Southwest China. Geophys. Res. Lett. 2015, 42, 6066–6075. [Google Scholar] [CrossRef]
- Crawford, J.; Chambers, S.; Cohen, D.D.; Griffiths, A.; Williams, A.; Stelcer, E. Using Radon-222 as an Indicator of Atmospheric Mixing Depth in ME-2 for PM2.5 Source Apportionment. Aerosol Air Qual. Res. 2015, 15, 611–624. [Google Scholar] [CrossRef]
- Charlson, R.J.; Schwartz, S.E.; Hales, J.M.; Cess, R.D.; Coakley, J.A.; Hansen, J.E.; Hofmann, D.J. Climate Forcing by Anthropogenic Aerosols. Science 1992, 255, 423. [Google Scholar] [CrossRef]
- Chuang, C.C.; Penner, J.E.; Taylor, K.E.; Grossmann, A.S.; Walton, J.J. An assessment of the radiative effects of anthropogenic sulfate. J. Geophys. Res. Atmos. 1997, 102, 3761–3778. [Google Scholar] [CrossRef]
- Ramanathan, V.; Ramana, M.V. Persistent, Widespread, and Strongly Absorbing Haze Over the Himalayan Foothills and the Indo-Gangetic Plains. Pure Appl. Geophys. 2005, 162, 1609–1626. [Google Scholar] [CrossRef]
- Middleton, P.; Kiang, C.S.; Mohnen, V.A. Theoretical estimates of the relative importance of various urban sulfate aerosol production mechanisms. Atmos. Environ. 1980, 14, 463–472. [Google Scholar] [CrossRef]
- Saxena, P.; Seigneur, C. The Extent of Nonlinearity in the Atmospheric Chemistry of Sulfate Formation. J. Air Pollut. Control Assoc. 1986, 36, 1151–1154. [Google Scholar] [CrossRef]
- Seigneur, C.; Saxena, P. A theoretical investigation of sulfate formation in clouds. Atmos. Environ. 1988, 22, 101–115. [Google Scholar] [CrossRef]
- Hess, P.G.; Zbinden, R. Stratospheric impact on tropospheric ozone variability and trends: 1990–2009. Atmos. Chem. Phys. 2013, 13, 649–674. [Google Scholar] [CrossRef]
- Voulgarakis, A.; Hadjinicolaou, P.; Pyle, J.A. Increases in global tropospheric ozone following an El Niño event: Examining stratospheric ozone variability as a potential driver. Atmos. Sci. Lett. 2011, 12, 228–232. [Google Scholar] [CrossRef]
- Stenchikov, G.; Dickerson, R.; Pickering, K.; Ellis, W., Jr.; Doddridge, B.; Kondragunta, S.; Poulida, O.; Scala, J.; Tao, W.-K. Stratosphere-troposphere exchange in a midlatitude mesoscale convective complex: 2. Numerical simulations. J. Geophys. Res. Atmos. 1996, 101, 6837–6851. [Google Scholar] [CrossRef]
- Fu, Y.; Liao, H. Simulation of the interannual variations of biogenic emissions of volatile organic compounds in China: Impacts on tropospheric ozone and secondary organic aerosol. Atmos. Environ. 2012, 59, 170–185. [Google Scholar] [CrossRef]
- Camalier, L.; Cox, W.; Dolwick, P. The effects of meteorology on ozone in urban areas and their use in assessing ozone trends. Atmos. Environ. 2007, 41, 7127–7137. [Google Scholar] [CrossRef]
- Ramsey, N.R.; Klein, P.M.; Moore, B. The impact of meteorological parameters on urban air quality. Atmos. Environ. 2014, 86, 58–67. [Google Scholar] [CrossRef]
- Lin, Y.-L.; Farley, R.D.; Orville, H.D. Bulk Parameterization of the Snow Field in a Cloud Model. J. Appl. Meteorol. Climatol. 1983, 22, 1065–1092. [Google Scholar] [CrossRef]
- Faiz, A.; Sturm, P.J. Chapter 7 New directions: Air pollution and road traffic in developing countries. In Developments in Environmental Science; Austin, J., Brimblecombe, P., Sturges, W., Eds.; Elsevier: Amsterdam, The Netherlands, 2002; pp. 241–243. [Google Scholar]
- Parekh, P.P.; Khwaja, H.A.; Khan, A.R.; Naqvi, R.R.; Malik, A.S.; Sajjad, A.K.; Khaid, H.G. Ambient air quality of two metropolitan cities of Pakistan and its health implications. Atmos. Environ. 2001, 35, 5971–5978. [Google Scholar] [CrossRef]
- Zhang, X.Y.; Gong, S.L.; Zhao, T.L.; Arimoto, R.; Wang, Y.Q.; Zhou, Z.J. Sources of Asian dust and role of climate change versus desertification in Asian dust emission. Geophys. Res. Lett. 2003, 30. [Google Scholar] [CrossRef]
- Prakash, P.J.; Stenchikov, G.; Kalenderski, S.; Osipov, S.; Bangalath, H. The impact of dust storms on the Arabian Peninsula and the Red Sea. Atmos. Chem. Phys. 2015, 15, 199–222. [Google Scholar] [CrossRef]
- Kalenderski, S.; Stenchikov, G.; Zhao, C. Modeling a typical winter-time dust event over the Arabian Peninsula and the Red Sea. Atmos. Chem. Phys. 2013, 13, 1999–2014. [Google Scholar] [CrossRef]
- Notaro, M.; Alkolibi, F.; Fadda, E.; Bakhrjy, F. Trajectory analysis of Saudi Arabian dust storms. J. Geophys. Res. Atmos. 2013, 118, 6028–6043. [Google Scholar] [CrossRef]
- Reid, J.S.; Piketh, S.J.; Walker, A.L.; Burger, R.P.; Ross, K.E.; Westphal, D.L.; Bruintjes, R.T.; Holben, B.N.; Hsu, C.; Jensen, T.L.; et al. An overview of UAE2 flight operations: Observations of summertime atmospheric thermodynamic and aerosol profiles of the southern Arabian Gulf. J. Geophys. Res. Atmos. 2008, 113. [Google Scholar] [CrossRef]
- Mohalfi, S.; Bedi, H.S.; Krishnamurti, T.N.; Cocke, S.D. Impact of Shortwave Radiative Effects of Dust Aerosols on the Summer Season Heat Low over Saudi Arabia. Mon. Weather Rev. 1998, 126, 3153–3168. [Google Scholar] [CrossRef]
- Alam, K.; Ahmad, M. Contrasting variation in aerosol optical properties during dust episodes in the Middle East and Southwest Asia: Model results and ground measurement. E3S Web Conf. 2019, 99, 04006. [Google Scholar] [CrossRef]
- Yousefi, R.; Wang, F.; Ge, Q.; Leliveld, J.; Shaheen, A. Aerosol Trends during the Dusty Season over Iran. Remote Sens. 2021, 13, 1045. [Google Scholar] [CrossRef]
- Várnai, T.; Marshak, A. Analysis of Near-Cloud Changes in Atmospheric Aerosols Using Satellite Observations and Global Model Simulations. Remote Sens. 2021, 13, 1151. [Google Scholar] [CrossRef]
- Khan, R.; Kumar, K.R.; Zhao, T.; Ullah, W.; de Leeuw, G. Interdecadal Changes in Aerosol Optical Depth over Pakistan Based on the MERRA-2 Reanalysis Data during 1980–2018. Remote Sens. 2021, 13, 822. [Google Scholar] [CrossRef]
- Grell, G.A.; Peckham, S.E.; Schmitzc, R.; McKeenb, S.A.; Frostb, G.; Skamarockd, W.C.; Eder, B. Fully coupled “online” chemistry within the WRF model. Atmos. Environ. 2005, 39, 6957–6975. [Google Scholar] [CrossRef]
- Zaveri, R.A.; Peters, L.K. A new lumped structure photochemical mechanism for large-scale applications. J. Geophys. Res. Atmos. 1999, 104, 30387–30415. [Google Scholar] [CrossRef]
- Wild, O.; Zhu, X.; Prather, M.J. Fast-J: Accurate Simulation of In- and Below-Cloud Photolysis in Tropospheric Chemical Models. J. Atmos. Chem. 2000, 37, 245–282. [Google Scholar] [CrossRef]
- Zaveri, R.A.; Easter, R.C.; Fast, J.D.; Peters, L.K. Model for Simulating Aerosol Interactions and Chemistry (MOSAIC). J. Geophys. Res. Atmos. 2008, 113. [Google Scholar] [CrossRef]
- Emmons, L.K.; Walters, S.; Hess, P.G.; Lamarque, J.F.; Pfister, G.G.; Fillmore, D.; Granier, C.; Kinnison, D.; Laepple, T.; Orlando, J.; et al. Description and evaluation of the Model for Ozone and Related chemical Tracers, version 4 (MOZART-4). Geosci. Model Dev. 2010, 3, 43–67. [Google Scholar] [CrossRef]
- Holben, B.N.; Eck, T.F.; Slutsker, I.D.; Tanré, D.; Buis, J.P.; Setzer, A.; Vermote, E.; Reagan, J.A.; Kaufman, Y.J.; Nakajima, T.; et al. AERONET—A federated instrument network and data archive for aerosol characterization. Remote Sens. Environ. 1998, 66, 1–16. [Google Scholar] [CrossRef]
- Cherian, R.; Venkataraman, C.; Ramachandran, S.; Quaas, J.; Kedia, S. Examination of aerosol distributions and radiative effects over the Bay of Bengal and the Arabian Sea region during ICARB using satellite data and a general circulation model. Atmos. Chem. Phys. 2012, 12, 1287–1305. [Google Scholar] [CrossRef]
- Nair, V.S.; Solmon, F.; Giorgi, F.; Mariotti, L.; Babu, S.S.; Moorthy, K.K. Simulation of South Asian aerosols for regional climate studies: Simulation of South Asian aerosols. J. Geophys. Res. Atmos. 2012, 117. [Google Scholar] [CrossRef]
- Chaibou, A.Z.; Ma, X.; Kumar, R.K.; Jia, H.; Tong, Y.; Sha, T. Evaluation of dust extinction and vertical profiles simulated by WRF-Chem with CALIPSO and AERONET over North Africa. J. Atmos. Sol. Terr. Phys. 2020, 199, 105213. [Google Scholar] [CrossRef]
- Ukhov, A.; Mostamandi, S.; da Silva, A.; Flemming, J.; Alshehri, Y.; Shevchenko, I.; Stenchikov, G. Assessment of naturaland anthropogenic aerosol air pollution in the Middle East using MERRA-2, CAMS data assimilation products, and high-resolution WRF-Chem model simulations. Atmos. Chem. Phys. Discuss. 2020, 1–42. [Google Scholar] [CrossRef]
- Su, L.; Fung, J.C.H. Sensitivities of WRF-Chem to dust emission schemes and land surface properties in simulating dust cycles during springtime over East Asia. J. Geophys. Res. Atmos. 2015, 120, 11215–11230. [Google Scholar] [CrossRef]
- Kumar, R.; Barth, M.C.; Pfister, G.G.; Naja, M.; Brasseur, G.P. WRF-Chem simulations of a typical pre-monsoon dust storm in northern India: Influences on aerosol optical properties and radiation budget. Atmos. Chem. Phys. 2014, 14, 2431–2446. [Google Scholar] [CrossRef]
- Parajuli, S.P.; Stenchikov, G.L.; Ukhov, A.; Shevchenko, I.; Dubovik, O.; Lopatin, A. Aerosol vertical distribution and interactions with land/sea breezes over the eastern coast of the Red Sea from lidar data and high-resolution WRF-Chem simulations. Atmos. Chem. Phys. 2020, 20, 16089–16116. [Google Scholar] [CrossRef]
- Crippa, P.; Sullivan, R.C.; Thota, A.; Pryor, S.C. Evaluating the skill of high-resolution WRF-Chem simulations in describing drivers of aerosol direct climate forcing on the regional scale. Atmos. Chem. Phys. 2016, 16, 397–416. [Google Scholar] [CrossRef]
- Kleeman, M.J. A preliminary assessment of the sensitivity of air quality in California to global change. Clim. Chang. 2008, 87, 273–292. [Google Scholar] [CrossRef]
- Dawson, J.P.; Adams, P.J.; Pandis, S.N. Sensitivity of PM2.5 to climate in the Eastern US: A modeling case study. Atmos. Chem. Phys. 2007, 7, 4295–4309. [Google Scholar] [CrossRef]
- Davison, J.; Bernhard, Y.; Kleefeld, J.B.; Farren, N.J.; Hausberger, S.; Tate, J.E.; Vaughan, A.R.; Carslaw, D.C. Distance-based emission factors from vehicle emission remote sensing measurements. Sci. Total. Environ. 2020, 739, 139688. [Google Scholar] [CrossRef]
- Nabavi, S.O.; Haimberger, L.; Samimi, C. Sensitivity of WRF-chem predictions to dust source function specification in West Asia. Aeolian Res. 2017, 24, 115–131. [Google Scholar] [CrossRef]
- Rizza, U.; Migiletta, M.M.; Mangia, C.; Ielpo, P.; Morichetti, M.; Lachini, C.; Virgili, S.; Passerini, G. Sensitivity of WRF-Chem model to land surface schemes: Assessment in a severe dust outbreak episode in the Central Mediterranean (Apulia region). Atmos. Res. 2018, 201, 168–180. [Google Scholar] [CrossRef]
- ElTahan, M.; Shokr, M.; Sherif, A.O. Tuning dust schemes in weather research forecast for simulating severe events over Egypt. In EGU General Assembly Conference Abstracts; European Geoscience Union: Munich, Germany, 2017; p. 6115. [Google Scholar]
- Cremades, P.G.; Fernández, R.P.; Allende, D.G.; Mulena, G.C.; Puliafito, S.E. High resolution satellite derived erodibility factors for WRF/Chem windblown dust simulations in Argentina. Atmósfera 2017, 30, 11–25. [Google Scholar] [CrossRef]
- Colarco, P.; da Silva, A.; Chin, M.; Diehl, T. Online simulations of global aerosol distributions in the NASA GEOS-4 model and comparisons to satellite and ground-based aerosol optical depth. J. Geophys. Res. Atmos. 2010, 115, D14207. [Google Scholar] [CrossRef]
- Curci, G.; Hogrefe, C.; Bianconi, R.; Im, U.; Balzarini, A.; Baró, R.; Brunner, D.; Forkel, R.; Giordano, L.; Hirtl, M.; et al. Uncertainties of simulated aerosol optical properties induced by assumptions on aerosol physical and chemical properties: An AQMEII-2 perspective. Atmos. Environ. 2014, 115, 541–552. [Google Scholar] [CrossRef]
- Karagulian, F.; Temimi, M.; Ghebreyesus, D.; Weston, M.; Kondapalli, N.K.; Valappi, V.K.; Aldababesh, A.; Lypustin, A.; Chaouch, N.; Hammadi, F.A.; et al. Analysis of a severe dust storm and its impact on air quality conditions using WRF-Chem modeling, satellite imagery, and ground observations. Air Qual. Atmos. Health 2019, 12, 453–470. [Google Scholar] [CrossRef]
Publisher’s Note: MDPI stays neutral with regard to jurisdictional claims in published maps and institutional affiliations. |
© 2021 by the authors. Licensee MDPI, Basel, Switzerland. This article is an open access article distributed under the terms and conditions of the Creative Commons Attribution (CC BY) license (https://creativecommons.org/licenses/by/4.0/).