Abstract
Integer ambiguity resolution is required to obtain precise coordinates for the global navigation satellite system (GNSS). Poorly observed data cause unfixed integer ambiguity and reduce the coordinate accuracy. Previous studies mostly used denoise filters and partial ambiguity resolution algorithms to address this problem. This study proposes a sequential ambiguity resolution method that includes a float solution substitution process and a double-difference (DD) iterative correction equation process. The float solution substitution process updates the initial float solution, while the DD iterative correction equation process is used to eliminate the residual biases. The satellite-selection experiment shows that the float solution substitution process is adequate to obtain a more accurate float solution. The iteration-correction experiment shows that the double-difference iterative correction equation process is feasible with an improvement in the ambiguity success rate from 28.4% to 96.2%. The superiority experiment shows significant improvement in the ambiguity success rate from 36.1% to 83.6% and a better baseline difference from about 0.1 m to 0.04 m. It is proved that the proposed sequential ambiguity resolution method can significantly optimize the results for poorly-observed GNSS data.
1. Introduction
Reliable integer ambiguity resolution is essential for real-time kinematic (RTK) positioning. RTK positioning was a popular topic in the 1990s and the 2000s. Since about 2010, the PPP-RTK became a hot study. Since the 1990s, many studies were conducted on integer ambiguity resolution methods [1,2,3,4]. These methods perform well for ideal short-baseline observation. However, they may perform differently in some situations. The biases in the DD observation equations may cause ambiguity unfixed, such as different atmospheric biases in long-baseline GNSS observation. Consequently, many methods were proposed to reduce the convergence time of long-baseline integer ambiguity resolution [5,6]. Different correction models are built to resolve those problems. Another case is that the poor conditions, such as poor quality receiver and poor environment, cause observation containing biases. The poor quality receiver causes the data containing systematic noise, while the poor environment causes biases such as environmental and multipath biases. Many studies proposed the partial ambiguity resolution method to solve this problem, but the partial ambiguity resolution method cannot obtain a high-precision solution if only three or four DD equations are feasible. The accuracy of the solution is related to the observation redundancy; a larger redundancy obtains a more accurate solution [7]. The signal noise may cause a low precision solution.
Removing the signal noise is the key to obtain an accurate solution for poor quality data. Several methods were proposed to remove the noise, such as partial ambiguity resolution, which selects well-observed satellites under different conditions [8,9,10]. However, it performs poorly when most of the data contain noise and few observations are available. The partial ambiguity resolution method needs more equations to obtain a high-precision solution. Another method applies different filters such as the robust Kalman filter [11,12] and the Wavelet filter [13,14] to address this problem. The robust Kalman filter removes noisy signals based on the linear state, while the Wavelet filter uses the transformed coefficients. Filters are usually used as a post-processing method to remove the noise in the GNSS time series. Consequently, it has a slight impact on the integer ambiguity resolution. Furthermore, the sequential model can also remove the noise. Marko and Milorad [15] applied the sequential Monte-Carlo filter to global positioning system (GPS) multipath noise, which also serves as a post-processing method. In another study, Zhang et al. [16] proposed a sequential and partial ambiguity resolution method that iteratively applied a wide-lane (WL) ambiguity resolution method and deleted the ambiguity with the maximum variance for each iteration. His method is one of the partial ambiguity resolution methods used to obtain the maximum subset consisting of only well-observed data for the WL ambiguity resolution method. His method obtains a high-precision solution with a larger observation redundancy. Generally, the current methods for poorly observed data mainly focus on partial ambiguity resolution and post-processing filtering methods.
This study proposes a sequential ambiguity resolution method for poorly observed data, consisting of a float solution substitution process and a DD iterative correction equation process. The float solution substitution process is one of the partial ambiguity resolution methods to obtain a more accurate solution than the Pseudo-range single-point positioning (SPP). A more accurate float solution provides more accurate RTK corrections, and the residuals caused by poorly observed data are absorbed into the DD residuals. The DD iterative correction equation process divides the equations into two parts, inspired by the generalized least square method. The DD residual value is the criteria for well-observed and poorly-observed equations. The well-observed equations iteratively update the sequential solution, and the sequential solution conversely updates the equations and its variance matrix. The number of poorly observed equations decreases with the iteration increasing, and the iteration ends when the minimum residual combination is received. The experiments showed that the proposed method was superior to the conventional RTK model for poorly observed data. The proposed sequential ambiguity method can remove signal noise as an immediate denoising model.
2. Materials and Methods
2.1. Satellite Selection Criteria for an Initial Ambiguity Resolution
The initial ambiguity resolution process is one of the partial ambiguity resolution methods. Poor receiver and poor environment cause most of the data containing biases, such as receiver biases, environment biases, and multipath biases. It is difficult to obtain a sufficient number of feasible DD equations, and the initial ambiguity resolution process is the first step to obtain a criterion to adjust the rest DD equations. Three DD equations are set to obtain the initial fixed solution because we cannot guarantee more feasible DD equations in poor conditions. A minimum of three equations are required for RTK positioning. More DD equations may cause the selected equations to contain biases. This idea was inspired by the least-square integer ambiguity resolution method, in which four satellites were selected to obtain the threshold of the rest of the ambiguities [17]. The selected three DD equations can obtain a more accurate solution than the SPP float solution, but it is insufficient for high-precision RTK positioning. Thus, it significantly improves the parameter accuracy. The DD carrier-phase observation equation is Equation (1).
where denotes the matrix of carrier phase length; denotes the DD carrier phase observation vector; denotes the DD satellite station distance vector; denotes the float solution vector of the DD integer ambiguity; denotes the DD ionospheric delay vector, which is obtained by the Klobuchar model [18]; denotes the DD tropospheric delay vector, which is obtained by the Saastamoinen model [19]; denotes the DD noise vector; and denotes the DD hardware bias vector [20]. The tropospheric delay and the ionospheric delay are weakened in the DD observation equations. For short-baseline RTK positioning, the tropospheric delay and the ionospheric delay can be ignored [21]. The float solution of the estimated parameters and their variance matrix is Equation (2).
where denotes the float solution of estimated position parameter vector; denotes the variance submatrix of coordinates; denotes the variance submatrix of ambiguity; and denotes the covariance submatrices. Feasible numbers and selecting criteria for DD equations are important for this process.
It is known that data with a higher elevation angle and larger signal-to-noise (SNR) have better results [22]. Therefore, the elevation angle and SNR are set as the selection criteria. For the float solution substitution process, the first criterion is three equations with the highest elevation angle, while the second is with the largest SNR value. Additionally, the DD carrier phase residual (resc) and the DD pseudo-range residual (resp) are also set as the individually selecting criteria (Equation (3)).
where denotes the DD pseudo-range observation vector. It is known that the data with smaller resc value and resp value have better results [22]. For the float solution substitution process, we select the three equations with the smallest resp value for the third criteria and the three equations with the smallest resc value for the third criteria. Elevation, SNR, resp, and resc selecting criteria are individual for different conditions.
In the proposed method, the float solution substitution process is to obtain a criterion for the DD iterative correction equation process. The precision of the SPP float solution in Equation (2) is extremely low, and we select the three optimal equations to obtain this solution. The float solution substitution process is the first step to improve the accuracy of the float solution, and it is sufficient to substitute the initial fixed solution or the Kalman filtering results with the sequential float solution . Therefore, it is essential to select feasible satellite selection criteria. This section proposes four criteria, and Section 3.1 shows the experiment of the four proposed criteria. Most of the data contain biases in the poor condition, thus the feasible selection criteria are important for the subsequent DD iterative correction equation process. At a minimum, the RTK integer ambiguity resolution requires three DD equations. As one of the partial ambiguity resolution methods, determining the satellite selection criteria is a crucial step.
The initial ambiguity resolution process applies the least-squares ambiguity decorrelation adjustment (LAMBDA) method for the selected three DD equations. This estimator is known as an optimality property of the integer least-squares estimator [23]. Then, the float solution in Equation (2) is transformed to the initial fixed solution in Equation (4).
where denotes the fixed solution of the estimated position parameter vector. It is obvious that the float solution and its variance matrix have a major impact on the fixed solution . To have a more accurate solution, we adjust the float solution and its matrix in the DD iterative correction equation process.
2.2. The Correcting Method for DD Equation
The initial ambiguity resolution process in the above section has low redundancy. To obtain a larger redundancy, the DD equation correction process adjusts the residuals of the rest of the DD equations. A larger redundancy obtains a more accurate solution. The residuals resulting from imperfect observations are absorbed into the DD residuals. The DD error equation is Equation (5).
where denotes the DD design matrix; denotes the DD carrier-phase residual vector, containing the biases; and denotes the initial DD satellite station distance vector. It is difficult to obtain a high-precision solution for RTK positioning in poor conditions. In the previous studies, the noise in the DD observation equations caused the ambiguities unfixed. In the proposed method, the noise is absorbed into the carrier-phase residual , and the residual value is the criterion to adjust the equations. Equation (4) indicates that float solution and its variance have a major impact on the final solution. The float solution substitution process obtains a more accurate float solution, and the DD iterative correction equation process updates the sequential float solution for iterations.
To adjust the equations, we apply the generalized least square estimation [24] to divide the original observation equations into two parts in Equation (6).
where denotes the variance matrix of ; denotes within-threshold residual subvector; denotes the variance matrix of ; denotes the above-threshold residual subvector; denotes the variance matrix of . The in the first iteration is the selected three optimal DD equations, and the in the later iteration is selected on the threshold . The well-observed observation equations are used to remove the signal noise of the poorly observed equations. We apply variance inflating function and weight shrinking function to adjust in Equation (7).
where denotes one of the variance value of ; denotes the residual value of . Equation (4) indicates that float solution and its variance have a major impact on the final solution. Adjusting the residual vector and its variance decreases the number of DD equations containing noise. The sequential float solution is updated for each iteration, with each iteration more accurate than the previous one. A sequential float solution with higher accuracy reciprocally results in relative corrections with higher accuracy. The absorbed noise is iteratively removed. The DD iterative correction equation process enables the proposed sequential ambiguity resolution method to remove signal noise.
2.3. Evaluation for the Proposed Method
The DD iterative correction equation process adjusts the equations with iterations. Then, the proposed method obtains the final solution with all equations. A feasible threshold is needed to avoid the endless loop, and more criteria are needed to evaluate the correctness of all ambiguities. The proposed method is to obtain the solution with the minimum , and the criteria are shown by Equation (8).
where denotes the difference value of the adjacent iterations; denotes the value of the current iteration; denotes the value of the previous iteration. The proposed method is to obtain the solution with the minimum . If , the sequential float solution is output as the final float solution . Equation (8) is the threshold to avoid the endless loop and output the solution as the float solution. The proposed method fixes the ambiguities for all of the DD equations with the minimum . The acceptance test of integer ambiguity resolution is also important.
The proposed method contains an initial ambiguity resolution process and a DD equation correction process. The initial ambiguity resolution process obtains a more accurate initial solution, and the DD equation correction process adjusts the float solutions and their variance with iterations. The proposed method fixes ambiguities for all observations after the DD equation correction process. Feasible criteria are needed to evaluate the results for all ambiguities. The ratio test is one of the most popular ambiguity acceptance tests for integer ambiguity resolution [25,26,27], which is Equation (9).
where denotes the vector of the optimal candidate, denotes the vector of the sub-optimal candidate, and denotes the threshold value. is the experiential threshold in the previous studies [27]. Figure 1 shows more details about the test of the proposed method. The ratio test in Equation (9) is the popular acceptance. The final solution is output as the fixed solution when meeting Equation (9). However, it cannot guarantee that the fixed solution is right. If some of the satellites have wrong integer ambiguities, the output solution will still have a centimeter error.
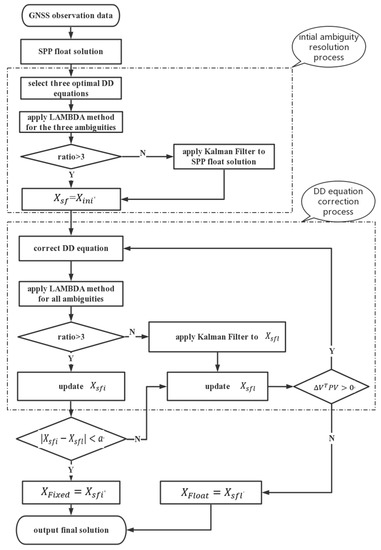
Figure 1.
Flowchart of the sequential ambiguity resolution method.
To evaluate the correctness of the integer ambiguity resolution, another threshold is proposed to estimate the correctness of the final solution. The sequential float solution iteratively approaches the final solution. An appropriate final criterion for the proposed method is essential for the final solution. The current fixed solution is set as the sequential fixed solution, and the previous sequential fixed solution is set as the sequential float solution. The DD residuals are nearly removed with iterations. Therefore, the difference between the sequential fixed solution and the known sequential solution is less than one wavelength. It is known that RTK horizontal and vertical accuracies reach levels of 2 cm and 5 cm, respectively [20]. We set it as the threshold of the final solution, which is Equation (10).
where denotes the position parameters of the sequential fixed solution, and denotes the position parameters of the known sequential solution. If the difference is less than the threshold, the final solution is output as the correctly fixed solution. This is the threshold to estimate the correctness of the final solution. As a rule of thumb, is obtained by the average value of the fixed solution with in the previous observation, and the average value can be set as the true solution of the estimated position. Equation (9) is the popular acceptance test for integer ambiguity resolution. However, it cannot guarantee that we obtain the correct position. Equation (10) is a thumb rule to evaluate the correctness of the integer ambiguity resolution. The ambiguity success rate (Equation (11)) is an essential proportion of all correctly fixed ambiguity.
where denotes the success rate of the correctly fixed ambiguity; denotes the epoch number of the correctly fixed ambiguity; and denotes all epoch numbers in the experiment. Besides, and contain the epoch number of incorrectly fixed ambiguity and unfixed ambiguity. This is an important available parameter for high-precision positioning. Equation (10) is the criteria of the correctly fixed ambiguity in Equation (11).
The overview of the proposed sequential ambiguity resolution method is presented in Figure 1.
The detailed steps, shown in Figure 1, are as follows:
- Set the SPP float solution as the initial solution .
- Substitute the initial fixed solution for the initial solution if the selected ambiguities are fixed. Otherwise, apply the Kalman filter to the initial solution and substitute its solution for the initial solution .
- Apply the generalized least square method to correct the DD equations and update the RTK parameters.
- Set the fixed solution for the sequential fixed solution if the ambiguities for all satellites are fixed. Otherwise, apply the Kalman filter to the initial fixed solution and substitute its solution for the sequential float solution .
- Calculate the solution difference . If , the sequential fixed solution is output as the final fixed solution . Otherwise, set the sequential fixed solution as the sequential float solution and return to step 3.
- Obtain the residual difference . If the , the sequential float solution will be output as the final float solution . Otherwise, return to step 3.
3. Experiments
Three experiments were conducted to verify the proposed sequential ambiguity resolution method. The first experiment was to verify the criteria of satellite selection. The second experiment was to verify the criteria of double-different equation correction. The third experiment was to verify the proposed method. By contrast, the conventional RTK model was used to resolve the same data, which also applied the LAMBDA method for ambiguity resolution. The computation platform was by Visual Studio 2015 C++.
3.1. Experiment for Satellite Selection Criteria
To compare the four proposed selecting criteria, we conducted the Shenzhen Ping’an Building pa07 experiment with 1 Hz GPS data from 10:00 to 24:00 on 27 April 2015 (GPST). Jianyi station (JY), located on the roof of the Jianyi Building in the Continuously Operating Reference Station of Shenzhen (SZCORS), was chosen as the base station. The GNSS receiver and antenna of the rover and the base station were as follows.
The experiments, consisting of five models, were conducted to compare the four selection criteria (see Section 2.1). The RTK model did not have any additions, while the elevation model added elevation selection criteria to the float solution substitution. Further, SNR, resc, and resp models were similar to the elevation model. Table 1 shows the comparison of the four proposed selection models with the RTK model in the JY-pa07 experiment. denotes the internal precision of east (E), north (N), and up (U) directions in the local coordinate system, , and denotes the true displacement directions.

Table 1.
Equipment of JY-pa07 experiment.
The four proposed selection models showed a noticeable improvement in the ambiguity success rate compared to the RTK model, which only had a success rate of 36.1%. The improvements were similar across all four proposed selection models; however, the SNR model had the largest improvement, i.e., 82.5%. In contrast, the elevation model had the smallest improvement, i.e., 78.5%. Besides, the resp and the resc models showed improvements of 81.6% and 80.8%, respectively.
For this experiment, the internal precision was chosen as the other proportion. The four proposed selection models exhibited noticeable improvements when compared to the RTK model. However, the results of the internal precision were different. The elevation model had the minimum value for both projection directions and true displacement direction, while the resp model and the resc models had the second-smallest and third-smallest values, respectively. In contrast, the SNR model had the maximum value. The difference between the ambiguity success rate and the internal accuracy was caused by the consideration of the only float solution substitution. This float solution substitution obtained different initial fixed solutions for different selection criteria.
Table 2 shows that the RTK model had a low success rate of 36.1%. Therefore, it was challenging to determine the difference between the RTK model and the four proposed selection models. To clearly show the coordinate time series, we chose the time from 15:03 to 15:20 due to the high success rate in all considered models. Figure 2 shows the results of this period. Moreover, it reflected the importance of a more accurate initial solution. The differences between the RTK model and the other models proposed in this study were 0.15 m, 0.05 m, and 0.15 m for E, N, and U directions, respectively. The four proposed selection models had similar results with the differences of 0.05 m, 0.05 m, and 0.05 m for E, N, and U directions, respectively.
Table 2.
Statistics of JY-pa07 experiment.
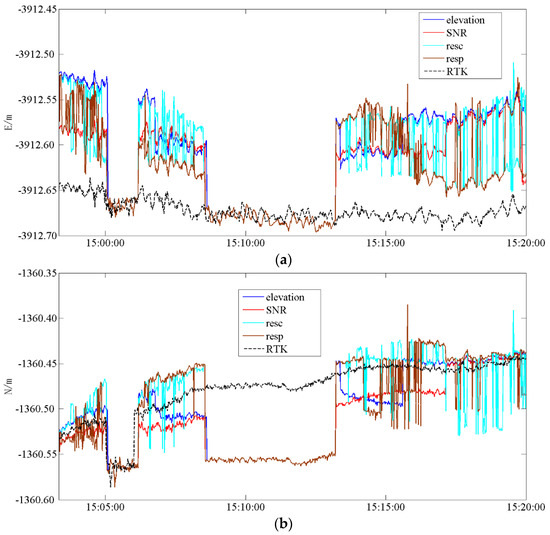
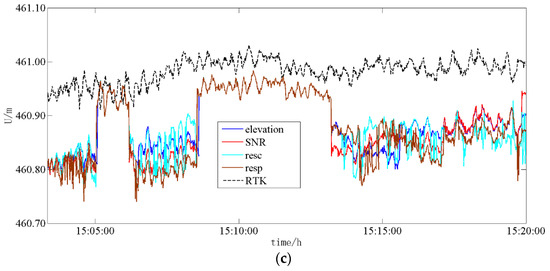
Figure 2.
Time series for JY−pa07 experiment. (a) Time series in E direction, (b) Time series in N direction, (c) Time series in U direction.
There were two periods in which the RTK model was approximately consistent with the four proposed selection models for E, N, and U directions. This finding can be attributed to the fact that the Kalman filter was applied (during this time) to deal with the SPP float solution, thus resulting in an initial unfixed solution. Consequently, the two mentioned periods appeared. The chosen period exhibited more noise in the E and the U directions than in the N direction.
3.2. Experiment for the DD Iterative Correction Equation
To test the denoising function of the DD equation iterative correction, we conducted the Wuhan Baishazhou Bridge S035 experiment, which consisted of a 10 Hz GPS+Beidou (BDS) +GLONASS data from 12:00 to 13:00 on 26 September 2016 (GPST). The GNSS receiver and antenna of the rover and the base station were in Table 3.
Table 3.
Equipment of the Baishazhou Bridge S035 experiment.
To show the results effectively, we chose the elevation selection criteria in float solution substitution as an elevation model. Table 4 shows the statistics of the Wuhan Baishazhou Bridge S035 experiment.
Table 4.
Statistics of the Baishazhou Bridge S035 experiment.
The results (Table 4) show the comparison of the elevation model with the RTK model. The experiments had about a 10% improvement in the ambiguity success rate for GPS, BDS, and GLONASS. The most evident improvement was observed for GPS+BDS+GLONASS, i.e., 28.4%–96.2%. This finding can be attributed to the availability of satellites for the elevation model, thus, a more accurate initial solution was obtained.
Regarding epoch-to-first fixed ambiguity, the RTK model required time to converge to fixed ambiguity due to noise in poorly-observed data. The DD iterative correction equation removed the signal noise, and, thus, the elevation model converged to fixed ambiguity in the first epoch for the GPS and BDS experiments. Further, the elevation model converged to fixed ambiguity in the 37th epoch compared to the 2234th epoch for the GLONASS experiment. The GPS+BDS+GLONASS experiment had a similar convergence time at the 115th epoch and the 147th epoch. It can be seen that the GPS and the GLONASS had poor quality observations, in which the ambiguity success rates were less than 90%. Li et al. [28] used this experiment to test their constrained MLAMBDA method on GNSS structural health monitoring. In contrast, this study proposed a sequential ambiguity resolution method, which achieved better results.
The noise in the single satellite system resulted in a low success rate in the GPS+BDS+GLONASS experiment. Thus, we focused on the S035 experiment to test the denoising function of the DD iterative correction equation. Figure 3 shows the time series for coordinate residuals for the Wuhan Baishazhou Bridge S035 using GPS+BDS+GLONASS.
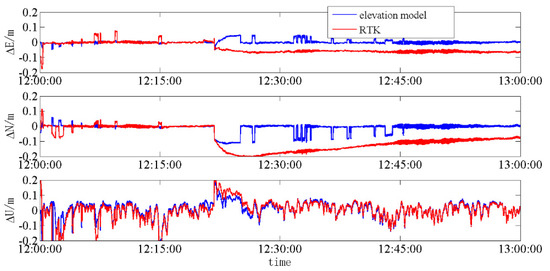
Figure 3.
Time–series coordinate residual for S035 experiment.
It can be seen that there are similar situations for the E and the N directions. The elevation model was fast to converge to the fixed ambiguity, while the RTK model was not consistent. The RTK model became unfixed from about 12:20 owing to the noise in three single satellite systems. In contrast, the elevation model fixed ambiguity with little fluctuations owing to the availability of satellites, which resulted in a more accurate initial solution; thus, it was beneficial for the DD iterative correction equation. Then, the DD iterative correction equation removed signal noise to achieve a more accurate sequential float solution. Consequently, the elevation model had an ambiguity success rate of 96.2%, compared to 28.4% achieved by the RTK model. The elevation model had the U direction coordinates similar to those of the RTK model. We can conclude that noise in the S035 GPS+BDS+GLONASS experiment had a significant impact on the E and the N directions, while the impact on the U direction was minimal.
3.3. Experiment for Feasibility and Superiority
Two experiments were conducted in this section, with the objectives of verifying the feasibility and the superiority of the proposed method, respectively.
3.3.1. Feasibility Experiment
As per the flowchart in Figure 1, the current sequential float solution was output for more than six cycles in the DD iterative correction equation. To test the feasibility of the proposed sequential ambiguity resolution method, we conducted a directional mobile experiment using 1 Hz GPS+GLONASS data from 7:00 to 8:00 on 30 January 2018 (GPST). The rover station was located on the roof of the Teaching Experiment Building at Wuhan University, while the base station was WUHN, an international GNSS Service (IGS) station. The GNSS receiver and antenna of the rover and the base station were as follows in Table 5.
Table 5.
Equipment of the feasibility experiment.
This experiment was conducted in an ideal environment with little noise. The maximum moving ranges of the mobile observation base were 12 cm, 17 cm, and 0 cm for E, N, and U directions, respectively. An observation was conducted (as a group) for 5 min, and the base was moved by 1 cm in the E and the U directions at each time. In this experiment, the elevation selection criteria were chosen for float solution substitution in the proposed method. Figure 4 shows the time series of coordinates for the directional mobile experiment.
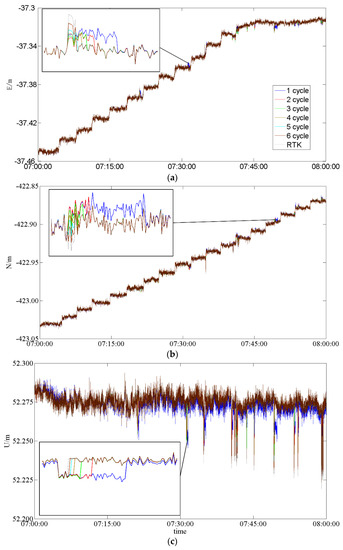
Figure 4.
Time series of coordinates for JY-pa07 + NS-pa07 experiment. (a) Time series of coordinates in the E direction, (b) Time series of coordinates in the N direction, (c) Time series of coordinates in the U direction.
The result for the E direction showed better coherence for the proposed method with different cycles and the standard RTK model. The proposed method, with one cycle, had an insignificant difference, i.e., 0.005 m, relative to other models in a few epochs. Similarly, there was a negligible difference in the N direction, i.e., 0.005 m, in the last displacements. The results were more evident in the U direction, where the proposed method (with one cycle) had an insignificant difference, i.e., 0.01 m, relative to other models. This finding suggests that one cycle was not sufficient for the proposed method. However, the proposed performed better when cycles increased beyond three. Figure 4 showed that the proposed method was feasible for the well-observed data and could detect the true displacement instead of signal noise. Figure 4 shows that the proposed method usually needed four iterations for the DD iterative correction process.
3.3.2. Superiority Experiment
To test the denoising function of the proposed sequential ambiguity method, we conducted an additional Ping’an Building pa07 experiment. Besides the experiment for satellite selection criteria, Nanshan station (NS) in SZCORS was chosen as another base station, located on the roof of the Nanshan District Land and Resources Bureau. The receiver for the NS station was TRIMBLE NETR9. The GNSS receiver and antenna of the rover and the base station were in Table 6.
Table 6.
Equipment of JY-pa07 and NS-pa07 experiment.
First, we checked the data quality by translate, edit, and quality-check (teqc). Table 7 shows the checking conclusion.
Table 7.
Quality statistics of the JY-pa07 + NS-pa07 experiment.
The quality statistics showed that the data had poor quality. MP1 and MP2 results showed that there were many slips in the data, and the data had multi-path residuals. It is difficult to obtain an accurate solution by the RTK method. This section applied the proposed sequential ambiguity resolution method to deal with the poorly observed data. The consistency of the results calculated by the two base stations was more influential for the disnosing function of the proposed method. In this experiment, elevation selection criteria were chosen for float solution substitution in the proposed method. Table 8 shows the statistics for the Shenzhen Ping’an Building pa07 superiority experiment.
Table 8.
Statistics of the JY−pa07 + NS−pa07 experiment.
The result of the RTK model for the JY base station had a success rate of 36.1%, compared to 83.6% of the sequential model. In contrast, the result of the RTK model for the NS base station had a success rate of 16.4%, compared to 67.6% of the sequential model. Owing to its longer baseline of the NS base station, its results were better than those for the JY station. There was a significant improvement for both two base stations in the proportion of ambiguity success rate. Moreover, the average coordinate of the solution was another proportion of the denoising function of the sequential model. There were about 0.15 m differences in the X direction between the RTK model results, compared to 0.001 m of the sequential model. In contrast, there were about 0.08 m differences in the Y direction between the RTK mode results, comparing to 0.004 m of the sequential model. For Z directions, there were about 0.01 m differences between the RTK model results, comparing to 0.003 m of the sequential model. The noise caused by unavailable poorly observed data was removed by the sequential model, thus achieving better results. This superiority experiment showed that noise had a worse impact along the X and the Y directions than along the Z direction. Figure 5 shows the time series of the number of satellites in the Shenzhen Ping’an Building pa07 superiority experiment.
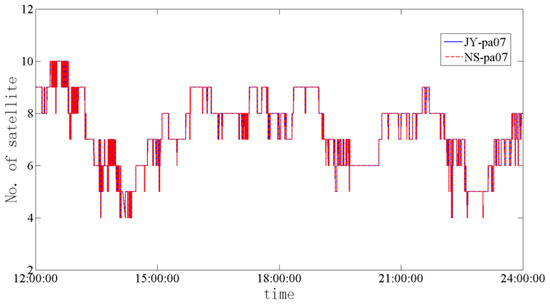
Figure 5.
Time series of the number of satellites for the JY-pa07 + NS-pa07 experiment.
The numbers of satellites for the two baselines were the same during the experiment. Therefore, the difference in the ambiguity success rate was not influenced by the number of satellites in each baseline. There were four satellites available at approximately 14:00 and 22:30. However, there were approximately seven satellites available for most of the observation time. It was difficult for the RTK model to obtain a precise solution when few satellites were available due to the poor quality receiver.
Figure 6 shows the time series of the coordinates for the Shenzhen Ping’an Building pa07 superiority experiment. More clearly, we show the logarithm of the coordinate results.
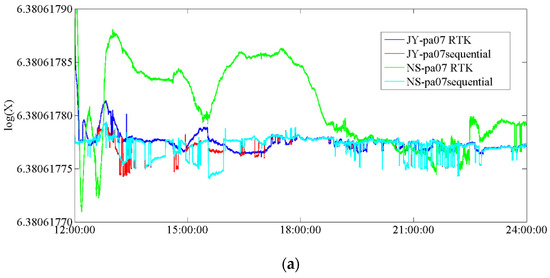
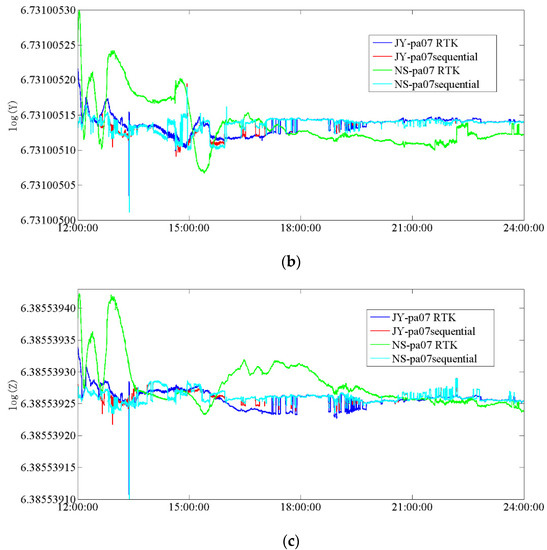
Figure 6.
Time series of coordinates for JY−pa07 + NS−pa07 experiment. (a) Time series of coordinates in the X direction, (b) Time series of coordinates in the Y direction, (c) Time series of coordinates in the Z direction.
The proposed model had better convergence for the two baselines. Apparent fluctuations at around 14:00 could be seen from the results (Figure 6). As per Figure 5, there were only four available satellites during this period, thus explaining the fluctuations in both the RTK model and the sequential model. From 15:00 to 22:00, the sequential model had a smooth time series, while the RTK model exhibited apparent fluctuations. This can be attributed to the relatively worse capability for removing signal noise by the RTK model, as there were approximately seven satellites available during this period (Figure 5). Similarly, the performance at about 22:30 occurred for the same reason.
A better consistency in the X direction was observed for the sequential model between the JY-pa07 and the NS-pa07 experiments. In contrast, a clear difference was observed for the RTK model. The differences between JY-pa07 and NS-pa07 experiments in the Y direction were about 0.004 m and 0.008 m for the sequential model and the RTK model, respectively. The difference between the JY-pa07 and the NS-pa07 experiments in the Z direction is about 0.003 m and 0.01 m for the sequential model and the RTK model, respectively. Owing to the signal noise in poorly observed data, the RTK model obtained worse results, with significant differences between the two baseline experiments.
4. Conclusions
The current methods for poorly observed data mainly focus on partial ambiguity resolution and post-processing filtering methods. This study proposed a sequential ambiguity resolution method to remove the signal noise and conducted three experiments to test its superiority. The experiment for satellite selection criteria showed that a more accurate float solution resulted in better final solutions; a more accurate float solution obtained a more accurate RTK correction. Then, a better solution was obtained. The experiment for the DD iterative correction equation showed that the proposed method could remove signal noise and achieve higher ambiguity success rates. We applied the generalized least square method to divide all the equations into two parts. The well-observed equations were used to adjust the poorly-observed equations. Thus, the proposed method could remove signal noise. The superiority experiment showed that the proposed method could remove the signal noise instead of making incorrect calculations. The number of uncorrected poorly-observed equations decreased with iterations. Thus, the proposed method could remove signal noise instead of making incorrect calculations.
The proposed sequential ambiguity resolution method consisted of a float solution substitution process and a DD iterative correction equation process. The float solution substitution process constituted the first step in improving the accuracy of the sequential float solution. The DD iterative correction equation process divided all the equations into two parts, inspired by the generalized least square method. The solution was output when the minimum residual combinations were obtained.
The proposed method removed the signal noise in real-time, relative to the post-processing filtering method. Furthermore, it obtained a more accurate DD equation relative to the partial ambiguity resolution method. However, certain aspects warrant further research. First, the satellite selection criteria were radical; however, more criteria need to be studied further. Then, the DD iterative correction equation could remove orient noise using an orient residual threshold. Finally, the ending criteria may yield better results with prior observations.
Author Contributions
Supervision, G.N.; Writing—original draft, H.L.; Writing—review & editing, S.W. and Y.H. All authors have read and agreed to the published version of the manuscript.
Funding
This work is sponsored partially by the National Key Research and Development Scheme Strategic International Cooperation in Science and Technology Innovation Program, and the funding number is No. 2018YFE0206500.
Institutional Review Board Statement
Not applicable.
Informed Consent Statement
Not applicable.
Acknowledgments
The authors are grateful for the constructive suggestions by the anonymous reviewers.
Conflicts of Interest
The authors declare no conflict of interest.
References
- Teunissen, P.J.G. A New Method for Fast Carrier Phase Ambiguity Estimation. In Proceedings of the Position Location and Navigation Symposium, Las Vegas, NV, USA, 11–15 April 1994. [Google Scholar] [CrossRef]
- Ge, M.; Gendt, G.; Dick, G.; Zhang, F. Improving carrier-phase ambiguity resolution in global GPS network solutions. J. Geod. 2005, 79, 103–110. [Google Scholar] [CrossRef]
- Feng, Y. GNSS three carrier ambiguity resolution using ionosphere-reduced virtual signals. J. Geod. 2008, 82, 847–862. [Google Scholar] [CrossRef]
- Xu, P.; Sh, C.; Liu, J. Integer estimation methods for GPS ambiguity resolution: An applications oriented review and improvement. Survey Rev. 2012, 44, 59–71. [Google Scholar] [CrossRef]
- Wang, D.; Gao, C.; Pan, S. Single-Epoch Integer Ambiguity Resolution for Long-Baseline RTK with Ionosphere and Troposphere Estimation; Springer: Berlin/Heidelberg, Germany, 2013. [Google Scholar] [CrossRef]
- Gong, X.; Lou, Y.; Liu, W.; Zheng, F.; Gu, S.; Wang, H. Rapid ambiguity resolution over medium-to-long baselines based on GPS/BDS multi-frequency observables. Adv. Space Res. 2016, 59, 794–803. [Google Scholar] [CrossRef]
- Li, Z.; Zhang, X. New Technology of Satellite Navigation and Positioning and High Precision Data Processing Method; Wuhan University Press: Wuhan, China, 2009. [Google Scholar]
- Parkins, A. Increasing GNSS RTK availability with a new single-epoch batch partial ambiguity resolution algorithm. Gps Solut. 2011, 15, 391–402. [Google Scholar] [CrossRef]
- Brack, A. Reliable GPS + BDS RTK positioning with partial ambiguity resolution. Gps Solut. 2017, 21, 1083–1092. [Google Scholar] [CrossRef]
- Gao, W.; Gao, C.; Pan, S. A method of GPS/BDS/GLONASS combined RTK positioning for middle-long baseline with partial ambiguity resolution. Emp. Surv. Rev. 2015, 49, 212–220. [Google Scholar] [CrossRef]
- Wang, J.; Xu, C.; Wang, J. Applications of robust Kalman filtering schemes in GNSS navigation. In Proceedings of the International Symposium on GPS/GNSS 2008, Tokyo, Japan, 11–14 November 2008; pp. 308–316. [Google Scholar]
- Barreau, V.; Vigneau, W.; Macabiau, C.; Deambrogio, L. Kalman Filter based robust GNSS signal tracking algorithm in presence of ionospheric scintillations. In Proceedings of the Satellite Navigation Technologies & European Workshop on Gnss Signals & Signal Processing, Noordwijk, The Netherlands, 5–7 December 2012. [Google Scholar]
- Su, Y.; Liu, H.; Yue, J.; Yang, Y. Characterization of ionospheric amplitude scintillations using wavelet entropy detrended GNSS data. Adv. Space Res. 2014, 54, 2172–2183. [Google Scholar] [CrossRef]
- Ruan, H.; Zhang, L.; Luo, Y.; Long, T. GNSS Carrier Phase Tracking with Discrete Wavelet Transform Filtering under Ionospheric Scintillation. IEEE Commun. Lett. 2016, 21, 394–397. [Google Scholar] [CrossRef]
- Dogatovic, M.; Stanojevic, M. Multipath mitigation of GPS signal using sequential Monte-Carlo filter. In Proceedings of the 2009 9th International Conference on Telecommunication in Modern Satellite, Cable, and Broadcasting Services, Nis, Serbia, 7–9 October 2009. [Google Scholar] [CrossRef]
- Zhang, S.; Zhao, L.; Li, X.; Bing, C. A sequential and partial ambiguity resolution strategy for improving the initialization performance of medium-baseline relative positioning. Earth Planets Space 2016. [Google Scholar] [CrossRef]
- Ronald, H. Method and Apparatus for Precision Attitude Determination and Kinematic Positioning. U.S. Patent 4,963,889, 16 October 1990. [Google Scholar]
- Klobuchar, J.A. Ionospheric time-delay algorithms for single-frequency GPS users. IEEE Trans. Aerosp. Electron. Syst. 1987, 23, 325–331. [Google Scholar] [CrossRef]
- Sastamoinen, J. Atmospheric correction for troposphere and stratosphere in radio ranging of satellites, in the use of artifical satellites for geodesy. Geophys. Monogr. Ser. 1972, 52, 485. [Google Scholar]
- Brunini, C.; Azpilicueta, F. GPS slant total electron content accuracy using the single layer model under different geomagnetic regions and ionospheric conditions. J. Geod. 2010, 84, 293–304. [Google Scholar] [CrossRef]
- Chen, D. Research on Fast Ambiguity Fixing and Regional Error Modeling Method of Beidou Medium and Long-Distance Reference Station; Wuhan University: Wuhan, China, 2016. [Google Scholar]
- Li, Z. GPS Measurement and Data Processing; Wuhan University Press: Wuhan, China, 2016. [Google Scholar]
- Teunissen, P.J.G. An optimality property of the integer least-squares estimator. J. Geod. 1999, 73, 587–593. [Google Scholar] [CrossRef]
- Baltagi, B.H. Generalized Least Squares; John Wiley & Sons: Hoboken, NJ, USA, 2011. [Google Scholar] [CrossRef]
- Teunissen, P.J.G. Integer aperture GNSS ambiguity resolution. Artif. Satell. 2003, 38, 79–88. [Google Scholar]
- Teunissen, P.J.G.; Verhagen, S. Integer Aperture Estimation—A Framework for GNSS Ambiguity Acceptance Testing. Inside Gnss 2011, March/April, 66–73. [Google Scholar]
- Teunissen, P.J.G.; Verhagen, S. The GNSS ambiguity ratio-test revisited: A better way of using it. Emp. Surv. Rev. 2009, 41, 138–151. [Google Scholar] [CrossRef]
- Li, H.; Nie, G.; Chen, D.; Wu, S.; Wang, K. Constrained MLAMBDA Method for Multi-GNSS Structural Health Monitoring. Sensors 2019, 19, 4462. [Google Scholar] [CrossRef] [PubMed]
Publisher’s Note: MDPI stays neutral with regard to jurisdictional claims in published maps and institutional affiliations. |
© 2021 by the authors. Licensee MDPI, Basel, Switzerland. This article is an open access article distributed under the terms and conditions of the Creative Commons Attribution (CC BY) license (https://creativecommons.org/licenses/by/4.0/).