Article

Analysis of Spatial and Temporal Changes and Expansion Patterns in Mainland Chinese Urban Land between 1995 and 2015

1
State Key Laboratory of Resources and Environmental Information System, Institute of Geographic Sciences and Natural Resources Research, Chinese Academy of Sciences, Beijing 100101, China
2
University of the Chinese Academy of Sciences, Beijing 100049, China
*
Author to whom correspondence should be addressed.
Remote Sens. 2021, 13(11), 2090; https://doi.org/10.3390/rs13112090
Submission received: 11 April 2021 / Revised: 21 May 2021 / Accepted: 24 May 2021 / Published: 26 May 2021
(This article belongs to the Special Issue Advances of Remote Sensing in Environmental Geoscience)

Abstract

:
China has experienced greater and faster urbanization than any other country, and while coordinated regional development has been promoted, urbanization has also introduced various problems, such as an increased scarcity of land resources, uncontrolled demand for urban land, and disorderly development of urban fringes. Based on GIS, remote sensing data, and spatial statistics covering the period 1995–2015, this study identified the patterns, as well as spatial and temporal changes, with respect to urban land expansion in 367 mainland Chinese cities. Over this study period, the area of urban land in mainland China increased from 3.05 to 5.07 million km2, at an average annual growth rate of 2.56%. This urban land expansion typically occurred the fastest in medium-sized cities, followed by large cities, and then small cities, with megacities and megalopolises exhibiting the slowest expansion rates. Nearly 70% of the new urban land came from arable land, 11% from other built land, such as pre-existing rural settlements, and 15% from forests and grasslands. When considering marginal-, enclave-, and infill-type expansion patterns, growth in >80% of the 367 cities surveyed was dominated by marginal expansion patterns. Marginal and enclave expansion patterns were found to be becoming more prevalent, with infill-type expansion being seen less. The results of this study provide a theoretical basis and data support for urban spatial planning, the protection of farmland, and the promotion of urban land use efficiency, and can be used as guidance for regional urbanization planning.

Graphical Abstract

1. Introduction

Urban land, as a key support for human lifestyles and production activities, provides the material basis for sustaining socio-economic development and continuity [1]. Urbanization promotes rapid socio-economic development and significant improvement in people’s living standards, but also accelerates urban land area expansion [2,3,4,5]. The scale of urban land use and availability, optimal urban land structures, and spatial expansion modes are important metrics in measuring the achievement of intensive and efficient production spaces, livable and healthy living spaces, and attractive environmental surroundings—which ultimately promote the healthy development of urbanization [6,7,8]. However, the unplanned pursuit of high-speed urban land expansion can cause aggravated urbanization problems, such as land resource shortages, uncontrolled urban land demand, and the disorderly development of urban and rural fringes—which will, in turn, seriously reduce urbanization quality, and its potential to be sustainable [9,10,11].
Researchers mostly use statistical yearbooks and land use remote sensing datasets to directly assess the area, rate, and intensity of urban land expansion, as these sources reveal expansion scale, speed, and strength [12,13]. In contrast, land use remote sensing datasets—including both datasets released by government departments and research institutions such as NASA, ESA, and CAS, and manual interpretation or computer classifications by researchers using high-resolution satellite data—are easier to analyze [14,15]. These spatial conversion relationship data between new urban land and other land use types can provide the information needed to guide the urbanization process planning and management, and researchers are nowadays comfortable in analyzing these processes using spatial autocorrelations, hotspot analyses, and other spatial statistical methods [14,16] Urban land spatial expansion patterns are influenced by socio-economic and other drivers, as well as by geographic conditions, which can constrain urban land advancement [17,18]. Generally, several quantitative indicators, such as urban expansion rate and intensity, were widely used to measure the characteristics of urban land spatial expansion [19,20,21,22]. For example, Xu et al. (2013) employs urban expansion rate and intensity to analyze the urban expansion patterns of 18 cities in different regions in China [22]. In addition, research on urban land spatial expansion patterns focused on theoretical studies initially, starting with the three classical urban land use theories—the concentric circle model [17,23], the sector model [24], and the multi-core model [25]—before advancing to the current theoretical basis of urban and business geography, the central place theory [26]. For example, Wilson categorized urban land spatial expansion patterns into five types: extension, sprawl, infill, insularity, and branching [27]. Liu et al. identified the spatial expansion patterns of towns and cities based on the convex hull principle and used this theory to classify urban spatial expansion into either infill or sprawl [28]. Liu et al. introduced the landscape expansion index (LEI), and used the ratio of the boundary length between new and original urban land to classify land uses into either enclave, edge, or infill types [29]. With the development of GIS and remote sensing technology, researchers have gradually carried out quantitative research on urban land spatial expansion patterns from the perspective of urban spatial morphology, and some landscape metrics, such as compactness and fractal dimensions have been widely applied in related research [22,30,31,32]. For example, Xu et al. (2020) use openness and proximity to represent the fragmentation and compactness of built-up areas to investigate influences of urban form and expansion pattern on the decline in densities in 200 global cities [30]. Encarnação (2012) proposed a model based on fractal dimensions, and it can provide a way to automatic classification of urban areas [31]. Encarnação (2013) classified urban land into five types based on Generalized Local Spatial Entropy (GLSE) function, and investigate the relation between the local fractal dimension and the development of the built-up area of the Northern Margin of the Metropolitan Area of Lisbon [32]. Studying the differences in urban land spatial expansion patterns can provide a scientific approach and theoretical basis for urban spatial planning and management.
Currently researchers are focusing more on urban land spatial expansion patterns in megacities and megalopolises, in provincial capitals, and in sub-provincial and high-ranked cities, and less on the expansion patterns experienced in small and medium-sized cities. In particular, comprehensive research including both megacities and small and medium-sized is still lacking. The authors concluded, however, that urbanization in this latter cohort could provide powerful insights into future socio-economic development and deserve more attention from researchers—an insight that helped to motivate this work. In mainland China, 367 administrative regions were identified as the sampling base and used to quantify urban land spatial expansion and land sources in China, over the period of 1995 to 2015. The analysis covered different urban spatial expansion patterns, with a view to providing a theoretical basis and data support for spatial planning in cities and towns, for basic farmland protection, for the promotion of urban land use efficiency, and for guiding regional spatial plan development.

2. Materials and Methods

2.1. Study Area

In this study, the 367 mainland Chinese administrative entities (cities) selected for review, included 333 prefectural-level administrative regions, 30 province-administered counties, and 4 municipalities directly under central government control (Figure 1). These cities represented the spatial and temporal characteristics of urban land expansion in mainland China quite comprehensively and provided examples of urban spatial planning and management in different development stages, and across various climate and geomorphological zones.

2.2. Data Sources

Urban land mainly means construction land in this study and excludes industrial land. Urban land use data for this study were derived from the remote sensing monitoring dataset for land use cover (CNLUCC) provided by the Resource and Environment Science and Data Center, of the Chinese Academy of Sciences (https://www.resdc.cn/, accessed on 8 March 2020). Multi-temporal land use data covering all of China were developed in this dataset with the support of a number of projects, such as the National Science and Technology Support Program and the Knowledge Innovation Program of the Chine Academy of Sciences. This dataset uses Landsat remote sensing imagery as its main data source, such as Landsat Thematic Mapper (TM) and Enhanced Thematic Mapper Plus (ETM+). Then, the spatial distribution of land use cover is established by manual visual interpretation of the imagery, and it is classified into six primary land use types, including arable land, forests, grasslands, water, urban and rural built land, and unused land [33]. The visual interpretation technique, as applied to the primary land use types in the dataset, was tested using a large number of samples, and achieved > 94.3% accuracy [34,35]. This dataset has played an important role in national land resource survey, hydrological and ecological research, and has achieved significant social and economic benefits. Furthermore, compared with existing land use expansion research, the accuracy of this dataset is reliable [36,37]. Thus, land use data focus points for 1995, 2000, 2005, 2010, and 2015 were used in this study, which can guarantee the accuracy for further analysis (Figure 2).

2.3. Methods

2.3.1. Methods for Quantifying Urban Land Spatial Expansion

In this study, scale, rate, and intensity measures were used to quantify urban land spatial expansion, as shown in Equations (1)–(3). The urban land spatial expansion scale was defined as the increase in the urban land footprint in the study area within a certain period of time, while its rate was defined as the ratio of the scale of urban land spatial expansion to the original urban land area in the study area, per unit of time. Urban land spatial expansion intensity was defined as the ratio of the expansion scale to the total study area, per unit of time [20,21].
D =   U   b   U   a ,
S =   U   b   U   a   U   a ×   1   Δ T × 100 % ,
I =   U   b   U   a   A   T ×   1   Δ T × 100 % ,
where D, S, and I represent the size, rate, and intensity of urban expansion, respectively. Ua and Ub represent the urbanized land quantum in the base and target years, respectively, while AT indicates the total study area, and ΔT denotes the time interval.

2.3.2. Methods for Calculating Land Sources for Urbanization

In this study, a land use transfer matrix was used to organize the representation of urban land transfers from other land use types, and to facilitate further analysis of new urban land sources.
S i j   =   S 11 S 12 S 13 S 1 n S 21 S 22 S 23 S 2 n S 31 S 32 S 33 S 3 n Sn 1 Sn 2 Sn 3 Snn
In Equation (4), S refers to the conversion area, n indicates the number of land use types, and i and j represent the land use types at the beginning and end of the study period. Using spatial overlay analysis, the land use data for any two periods could be superimposed, to identify the amount of new urban land occupying land previously designated as cropland, forest, grasslands, water, or unused land.

2.3.3. Methods for Calculating Urban Land Use Spatial Expansion

In this study, the LEI was applied to characterize urban land spatial expansion patterns, which were determined by comparing spatial relationships between new and pre-existing urban land (Figure 3). Based on LEI results, the spatial expansion patterns for new urban land over a certain period could be classified into three categories: infill, edge, or enclave. ‘Infill’ refers to new town land formed by filling gaps within existing town land, ‘edge’ refers to a spatial expansion pattern in which new town land extends outward from existing town land edges, while ‘enclave’ refers to new town land established independent of existing town land [38], as represented by Equation (5):
LEI =   L   com   P   new  
where Lcom represents the length of the common boundary between existing and new urban land, and Pnew indicates the perimeter length of the new land. For enclave categories, LEI = 0, for edge categories, 0 < LEI ≤ 0.5, and for expansion categorized as infill, 0.5 < LEI ≤ 1.

3. Results

3.1. Spatial and Temporal Characteristics of Urban Land Use Expansion in Mainland China

Between 1995 and 2015, urban land in mainland China expanded from 3.06 to 5.07 million km2, at the average annual growth rate of 2.56%. From 1995 to 2000, urban land expansion amounted to 0.12 million km2, at an annual expansion rate of 0.78%, while from 2000 to 2005, the expansion scale was 0.87 million km2, at the rate of 5.47%. Through 2005 to 2010, the expansion scale amounted to 0.45 million km2, at the annual rate of 2.22%, and between 2010 and 2015, 0.57 million km2 of new urban land was established, at the annual expansion rate of 2.53% (Table 1).
Spatial and temporal characteristics of urban land use changes in different-sized cities were also analyzed (Table 2). The total urban land area of large (big cities and above) cities accounted for >30% of the total urban area of the country, with megacities and megalopolises occupying the most urban land, with their share increasing from 32.50% in 1995 to 35.15% in 2010, before decreasing to 34.11% in 2015, showing an overall trend of increase followed by decrease (Table 2, Figure 4). This trend can be seen as reflecting government policy, whereby prior to 2010, China encouraged the development of large cities, while afterwards, policies were implemented to control urban expansion and regulate land use, and to encourage more rapid development in small- to medium-sized cities.
In terms of the scale of urban land spatial expansion, from 1995 to 2015, the more economically developed cities, such as Beijing, Tianjin, Dongguan, Suzhou, Guangzhou, and Nanjing, the western region of Chongqing and Chengdu, and the central region of Zhengzhou, expanded their urban land footprints rapidly, all by >260 km2 (Figure 4). This showed that the growth of China’s economy drove very fast town and city development, as was particularly the case after 2000, when China’s urban planning and industrialization processes entered a new historic stage, becoming more heavily influenced by overseas planning doctrines, which resulted in more mega-projects, large shopping malls, and luxury residences being constructed in both inner and outer suburbs.
During this period, megacity agglomerations—such as the Beijing–Tianjin–Hebei city cluster, the Yangtze River Delta city cluster, and that of the Pearl River Delta—entered a period of rapid urbanization, which led to massive increases in the amount of urban land being used to construct residential, commercial, and industrial premises.
The regions exhibiting the most urban land spatial expansion were mainly located in the eastern and coastal regions. In terms of expansion rates, however, the faster cities more recently included Shannan City, Wenchang City, and Ya’an City in the west, which were seen to be following the characteristic expansion rate hierarchy of medium-sized cities > large cities > small cities > mega cities and megalopolises. More than half of the medium-sized cities analyzed had expansion rates above the national average, with such cities in the central and western regions having entered a period of rapid growth. This contrasted with the statistics for earlier periods, with 1995 to 2005 data showing that expansion of urban land space in megacities and megalopolises was much faster than it was in medium- or small-sized cities, in a trend that had then reversed by 2015.
Analysis showed that the Pearl River Delta region had the highest urban land spatial expansion intensity, followed by the Yangtze River Delta, and then individual cities in the western regions. The overall urban land spatial expansion pattern was characterized by a greater expansion intensity in the eastern region than in the central and west, although this trend was showing a tendency to shift to the latter regions more recently. This shift has most likely been in response to implementation of the government’s “Western Development” strategy, in which central and western regions have absorbed excess industrial production capacity from the eastern coastal areas, resulting in more development in some western and central parts.

3.2. Analysis of Land Sources for Urbanization

Based on the overlay of land use data from different periods, and by using the land use data transfer matrix, spatial transformation relationships between urban and other land were revealed, allowing the main sources of new urban land to be identified (Table 3). Arable land was found to have been the main urban land expansion source over the study period, accounting for 67.98%, followed by other built land (e.g., rural settlements, or brownfield sites) (11.07%), and forests (9.15%), with reclaimed water areas, grasslands, and unused land accounting for 5.36%, 5.10%, and 1.33%, respectively.

3.3. Urban Land Use Spatial Expansion Patterns

Urban land LEIs for the 367 Chinese administrative regions targeted in this study were calculated for the periods 1995 to 2005 and 2005 to 2015 (Figure 5). The data showed that almost all cities experienced all three spatial expansion patterns—enclave, edge, and infill—at the same time, with one always predominant. From 1995 to 2005, edge expansion was the most common expansion process in 274 administrative districts, or 74.66%, with infill next, used as the main process by 16.62%, or 61 administrative districts, and enclave used the least, emerging as the most used in only 32 administrative districts (8.72%). From 2005 to 2015, while marginal sprawl became even more predominantly used as the expansion pattern, at 296 administrative districts (80.65%), enclaves had become more popular, with 49 administrative districts or 13.35% showing it as the most used pattern, with infill now the least used, with 22 administrative districts, or 5.99%, using it more than the other two expansion patterns (Table 4).
Comparing the two time periods, the marginal and enclave urban site expansion patterns for 2005 to 2015 both showed increasing trends, by 22 (5.99%) and 16 (4.63%) locations respectively. With the recent increasing housing prices in most Chinese cities, it was perhaps inevitable that the enclave pattern showed increases, as people usually chose to sacrifice commuting time and distance to buy a less expensive life in outer suburbs. The infill model showed a decreasing trend, with 39 fewer sites (10.63%). Renovating urban villages represents a typical example of the infill sprawl pattern, however, as urban villages are usually small, infill patches involving their upgrading contribute only minor or even negligible land to city expansion.
In terms of spatial distribution regions, from 1995 to 2005, the infill spatial expansion pattern was mainly distributed in Jilin, Liaoning, Fujian, Guangdong, Hunan, and Yunnan provinces, together with individual cities in the west, while the enclave expansion pattern was mainly found in Sichuan, Qinghai, and Ningxia in the west, and in individual cities in the Shaanxi and Henan central region provinces (Table 4). From 2005 to 2015, the infill spatial expansion pattern was concentrated in Fujian and Guangdong provinces, in the southeastern coastal region, while the enclave pattern was mainly distributed in individual cities in the west and central regions.
From the perspective of specific urban spatial expansion practices, almost every city showed a mixture of the three expansion modes. At the early stage of urban development and growth, expansion usually involved “spreading out the pie”, that is, applying marginal expansion. As examples of this, mega-cities such as Beijing and Shanghai have relied on continuous construction of ring roads to expand from the old city out into surrounding areas.

3.4. Urban Land Expansion in Major Urban Agglomerations in China

Urban agglomeration is a highly developed urban form of spatial integration. Ten urban agglomerations, including Beijing-Tianjin-Hebei (BTH), Yangtze River Delta (YRD), Pearl River Delta (PRD), Chengdu-chongqing (CC), Central Plains (CP), Triangle of Central China (TCC), Liaozhongnan (LZN), Northern Slope of Tianshan Mountains (NSTM), Harbin-Changchun (HC) and Beibu Gulf (BG) urban agglomerations were chosen to deepen the understanding the urbanization of China.
Table 5 shows urban land spatial expansion in major urban agglomerations in China from 1995 to 2015. Urban land expanded from 2.09 to 40.21 million km2 from 1995 to 2015 in different urban agglomerations. It indicated that urban land showed an increasing trend in urban agglomerations. It is founded that urban land expanded significantly in YRT (40.21 million km2), CP (22.63 million km2), PRD (16.32 million km2), and BTH (16.27 million km2). Rates of expansion ranged from 1.28% to 5.46% in different urban agglomerations. The rate of expansion in CC, NSTM and YRT is high, and all expanded by more than 5%. Intensities of urban expansion ranged from 0.01% to 0.15% in different urban agglomerations. The intensity of the urban expansion of PRD (0.15%) and YRT (0.09%) is high, indicating that urban sprawl is violent in these regions.
Figure 6 shows the urban land spatial expansion patterns for major urban agglomerations in China, from 1995 to 2015. It is founded that there are significant differences in urban land spatial expansion in different urban agglomerations. For BTH, urban land mainly expanded in the southeastern area, and this region was plain. The urban land expansion of the YRD presents a linear expansion of “Z” shape along the railway and highway traffic arteries. Urban land expansion in PRD is dominated by edge expansion. For CC, urban land expansion presents a significant “bipolar” development trend and has the characteristics of “long tail”. CP presents a typical “point-axis-network” expansion. Urban land expansion in TCC, LZN, NSTM and HC differ between 1995 to 2005 and 2005 to 2015. Urban land expansion in BG is dominated by edge expansion.

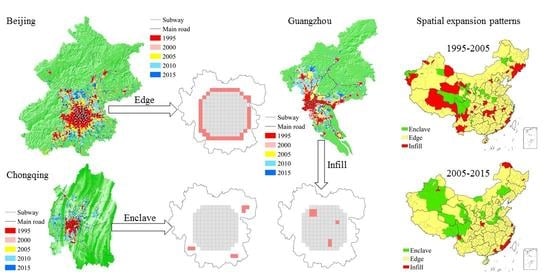
3.5. Urban Land Spatial Expansion Patterns for Major Cities in China

The urban land spatial expansion patterns for typical cities in China from 1995 to 2015 are shown in Figure 7. It was observed that urban land expansion in the 36 cities mainly showed an edge expansion mode from 1995 to 2015. There are also differences in urban land expansion between 1995 to 2005 and 2005 to 2015. During the period 1995 to 2005, urban land expansion in Fuzhou, Wuhan, Shenzhen, Lhasa, and Lanzhou showed an infill expansion mode, and others mainly showed an edge expansion mode. During the period from 2005 to 2015, urban land expansion in Shanghai, Fuzhou, Xiamen, Guangzhou, Shenzhen, and Urumqi showed an infill expansion mode, and others mainly showed an edge expansion mode.
Additionally, there are some typical cases of urban land expansion. For example, Beijing, the capital of China, urban land expansion is mainly based on a single center circle. Tianjin, a coastal city of China, has shown a trend of expanding outwards from the two centers of Heping District and Binhai New District. Shanghai and Xi’an have gradually changed from the “single-core expansion” to the “multi-core expansion” and “point-axis expansion” of original urban areas, satellite cities, suburban development zones, and arterial roads. Elevation and slope are important factors influencing urban expansion. For example, Chongqing, with the peninsula formed by the Yangtze River and the Jialing River as its center, expanded southward along hilly valleys in early period, and later expanded to both sides with rivers and heavy transportation projects as the axis. Due to special topographical conditions, Guangzhou extended along the rivers and lakes, and formed a development pattern of “eastward advancement, western union, north superiority, and southward expansion”. Chengdu, which centered on the hinterland of Chengdu Plain, expanded to the edge. As Kunming is surrounded by mountains on three sides and the Dianchi Lake in the south, it gradually showed an expansion pattern of urban filling. Due to the existence of a port, Dalian had both a single center and linear sprawl expansion. Wuhan is mainly based on three centers, including Wuchang, Hanyang, and Hankou, and expanded along the tributaries of the Yangtze River. Nanjing is a typical multi-core land expansion due to topographical conditions and the constraints of the urban master planning.

4. Discussion

This study investigated the spatial and temporal changes of urban land expansion in 367 mainland Chinese cities, and emphasized that the area of urban land in mainland China increased significantly. Generally, government regulatory actions and decision-making plays a key role in urban expansion in China. This regulatory role was mainly reflected in two ways.
Firstly, government decision-making influences development by using land use planning and urban master planning to guide urban land spatial expansion, which in turn causes changes to the spatial patterns of entire cities. In Shenyang City, for example, in the early 1980s, the city master plan had an explicit focus on transforming and upgrading older urban areas, building expressway-style ring roads, constructing new transportation hubs, such as railway stations and airports, and moving the old airport out of the central city. Then, in the revised 2000 version, the city master plan proposed converting built land to “decentralized clusters”, which greatly influenced the pattern of urban land expansion and urban form.
Secondly, city spatial expansions have been guided by the adjustment of administrative divisions within the jurisdiction of counties to districts, and counties to cities. The 19th National Congress of the Communist Party of China proposed to “optimize the setting of administrative divisions, give full play to the driving role of central cities and urban clusters, and build modern urban areas”. Adjusting administrative divisions can help integrate urban and rural area development, while changing administrative divisions—which in the Chinese administrative system can involve upgrading counties to cities, or downgrading counties to districts, and redefining townships as towns—can greatly expand central urban administrative areas. Using the major city of Foshan as an example, the city administrators here first converted four county-level cities (Shunde, Nanhai, Sanshui (formerly westernized as ‘Samshui’), and Gaoming (formerly ‘Koming’)) into Foshan municipal districts. This led, in turn, to the rapid expansion of urban construction land to the west, south, and east, forming a spatial pattern of “2 + 5” clusters of urban land.
Developing transportation arteries has also contributed significantly to urban land expansion patterns. Because people and goods are linked within cities and between cities through transportation arteries, their installation leads to changes in city scales and layout patterns, with new urban land built along both sides of rail and road arteries. For example, completing ring roads 2–6 led to Beijing initially showing concentric circles of outward urban expansion, before, at a certain sequential development stage, axial road and rail arteries then provided the expansion corridors of least resistance, revealing a radial expansion trend, greatly promoting urbanization of the land surrounding these transportation arteries.
Once the resident population reaches a certain size, however, land for constructing residential and industrial areas becomes increasingly sparse, land prices rise, and constructing high speed road and rail links significantly shortens commuting times. At this point, taking acquisition, demolition, and construction costs into account, land types such as farmland, forested land, grassland, water areas, and unused land around the central city will be consumed by urban construction, and used to build new developments. This further accelerates urban construction land fragmentation, in a development spatial pattern referred to as “multi-center, cluster and enclave”. After this, with improved living standards and higher requirements for environmental elements, the phenomenon of shantytown renovation starts to increase in older cities, and the pattern of infill expansion gradually emerges. Taking Beijing as an example, after the population increased to approximately 15 million in 2005, the enclave categories and infill patches increased significantly.
In the early stage of urbanization, when the urbanization rate is <30%, small and medium-sized towns dominate the expansion pattern of the whole region, while in the middle stages, when the urbanization rate has reached 30 to 50%, larger cities dominate regional expansion. In the late stage, when the urbanization rate is 50 to 70%, urban clusters dominate regional expansion patterns.

5. Conclusions

Taking 367 administrative regions in mainland China as the sample suite, quantitative urban land spatial expansion characteristics and sources over the period from 1995 to 2015 were analyzed. Different urban spatial expansion patterns were quantified as well, with a view to providing a theoretical basis and data support for urban spatial planning, protection of basic farmland, promotion of urban land use efficiency, and guidance for territorial spatial planning.
From 1995 to 2015, the area of urban land in mainland China increased from 3.06 to 5.07 million km2, expanding at an average annual growth rate of 2.56%. The urban land expansion rate hierarchy showed that medium-sized cities expanded the fastest, followed by large cities, then small cities, followed by mega cities and megalopolises. Nearly 70% of the new urban land came from arable land, 11% from other built land (such as rural settlements), and 15% from forests and grasslands. In terms of the predominant expansion patterns seen, marginal expansion predominated in >80% of the 367 cities examined. We also saw that marginal and enclave expansion patterns were occurring more and more often, while the infill expansion pattern was being seen less over time.
Going forward, we intend to quantify the causal mechanisms of urban land spatial expansion patterns, and to conduct cluster analysis of cities based on these different mechanisms and influencing factors. We proposed including both natural and socio-economic factors in this next phase, with a view to providing basic data and a theoretical support for fine-tuning urban management.

Author Contributions

Conceptualization, C.C. and X.Y.; methodology, C.C. and X.Y.; software, C.C. and H.C.; writing—original draft preparation, C.C.; writing—review and editing, C.C., X.Y. and H.C.; supervision, X.Y. All authors have read and agreed to the published version of the manuscript.

Funding

This research was funded by the Strategic Priority Research Program of Chinese Academy of Sciences (Grant No. XDA20010203) and National Natural Science Foundation of China (Grant No. 41771460).

Informed Consent Statement

Not applicable.

Data Availability Statement

The Urban land use data are downloaded from https://www.resdc.cn/ (Accessed on 8 March 2020). The collocations are available from the corresponding author by request.

Conflicts of Interest

The authors declare no conflict of interest.

References

  1. Seto, K.C.; Giineralp, B.; Hutyra, L.R. Global forecasts of urban expansion to 2030 and direct impacts on biodiversity and carbon pools. Proc. Natl. Acad. Sci. USA 2012, 109, 16083–16088. [Google Scholar] [CrossRef] [PubMed] [Green Version]
  2. Wang, S.; Fang, C.; Sun, L.; Su, Y.; Chen, X.; Zhou, C.; Feng, K.; Hubacek, K. Decarbonizing China’s Urban Agglomerations. Ann. Am. Assoc. Geogr. 2019, 109, 266–285. [Google Scholar] [CrossRef]
  3. Wu, R.; Li, Z.; Wang, S. The varying driving forces of urban land expansion in China: Insights from a spatial-temporal analysis. Sci. Total Environ. 2021, 766, 142591. [Google Scholar] [CrossRef] [PubMed]
  4. Yang, J.; Guo, A.; Li, Y.; Zhang, Y.; Li, X. Simulation of landscape spatial layout evolution in rural-urban fringe areas: A case study of Ganjingzi District. Giscience Remote Sens. 2019, 56, 388–405. [Google Scholar] [CrossRef]
  5. Yang, J.; Yang, R.; Chen, M.-H.; Su, C.-H.; Zhi, Y.; Xi, J. Effects of rural revitalization on rural tourism. J. Hosp. Tour. Manag. 2021, 47, 35–45. [Google Scholar] [CrossRef]
  6. Homer, C.; Dewitz, J.; Jin, S.; Xian, G.; Costello, C.; Danielson, P.; Gass, L.; Funk, M.; Wickham, J.; Stehman, S.; et al. Conterminous United States land cover change patterns 2001–2016 from the 2016 National Land Cover Database. ISPRS J. Photogramm. Remote Sens. 2020, 162, 184–199. [Google Scholar] [CrossRef]
  7. Zhu, X.; Zhang, P.; Wei, Y.; Li, Y.; Zhao, H. Measuring the efficiency and driving factors of urban land use based on the DEA method and the PLS-SEM model—A case study of 35 large and medium-sized cities in China. Sustain. Cities Soc. 2019, 50, 101646. [Google Scholar] [CrossRef]
  8. Yang, J.; Luo, X.; Jin, C.; Xiao, X.; Xia, J. Spatiotemporal patterns of vegetation phenology along the urban–rural gradient in Coastal Dalian, China. Urban For. Urban Green. 2020, 54, 126784. [Google Scholar] [CrossRef]
  9. Li, S.; Bing, Z.; Jin, G. Spatially Explicit Mapping of Soil Conservation Service in Monetary Units Due to Land Use/Cover Change for the Three Gorges Reservoir Area, China. Remote Sens. 2019, 11, 468. [Google Scholar] [CrossRef] [Green Version]
  10. Wang, K.; Yin, H. The Impact of Urbanization and Land Intensive Use on Environmental Pollution A Case Study on 35 Cities in China. In Proceedings of the 2017 4th International Conference on Industrial Economics System and Industrial Security Engineering (IEIS), Kyoto, Japan, 24–27 June 2017. [Google Scholar]
  11. Yang, J.; Ren, J.; Sun, D.; Xiao, X.; Xia, J.; Jin, C.; Li, X. Understanding land surface temperature impact factors based on local climate zones. Sustain. Cities Soc. 2021, 69, 102818. [Google Scholar] [CrossRef]
  12. Lyu, R.; Clarke, K.C.; Zhang, J.; Jia, X.; Feng, J.; Li, J. The impact of urbanization and climate change on ecosystem services: A case study of the city belt along the Yellow River in Ningxia, China. Comput. Environ. Urban Syst. 2019, 77, 101351. [Google Scholar] [CrossRef] [Green Version]
  13. Qiao, Z.; Wu, C.; Zhao, D.; Xu, X.; Yang, J.; Feng, L.; Sun, Z.; Liu, L. Determining the Boundary and Probability of Surface Urban Heat Island Footprint Based on a Logistic Model. Remote Sens. 2019, 11, 1368. [Google Scholar] [CrossRef] [Green Version]
  14. Souza, C.M.; Shimbo, Z.; Rosa, J.; Parente, M.R.; Alencar, L.L.A.; Rudorff, B.F.T.; Hasenack, H.; Matsumoto, M.; Ferreira, G.L.; Souza-Filho, P.W.M.; et al. Reconstructing Three Decades of Land Use and Land Cover Changes in Brazilian Biomes with Landsat Archive and Earth Engine. Remote Sens. 2020, 12, 2735. [Google Scholar] [CrossRef]
  15. Khan, T.U.; Mannan, A.; Hacker, C.E.; Ahmad, S.; Amir Siddique, M.; Khan, B.U.; Din, E.U.; Chen, M.; Zhang, C.; Nizami, M.; et al. Use of GIS and Remote Sensing Data to Understand the Impacts of Land Use/Land Cover Changes (LULCC) on Snow Leopard (Panthera uncia) Habitat in Pakistan. Sustainability 2021, 13, 3590. [Google Scholar] [CrossRef]
  16. Labib, S.M.; Lindley, S.; Huck, J.J. Spatial dimensions of the influence of urban green-blue spaces on human health: A systematic review. Environ. Res. 2020, 180, 108869. [Google Scholar] [CrossRef]
  17. Gao, Y.; Kii, M.; Nonomura, A. Urban research—Urban systems; new findings on urban systems described by investigators at Kagawa University (urban expansion using remote-sensing data and a Monocentric Urban Model). Ecol. Environ. Conserv. 2019, 77, 567–585. [Google Scholar]
  18. Simwanda, M.; Murayama, Y.; Phiri, D.; Nyirenda, V.R.; Ranagalage, M. Simulating Scenarios of Future Intra-Urban Land-Use Expansion Based on the Neural Network-Markov Model: A Case Study of Lusaka, Zambia. Remote Sens. 2021, 13, 942. [Google Scholar] [CrossRef]
  19. Zhao, M.; Cai, H.; Qiao, Z.; Xu, X. Influence of urban expansion on the urban heat island effect in Shanghai. Int. J. Geogr. Inf. Sci. 2016, 30, 2421–2441. [Google Scholar] [CrossRef]
  20. Estoque, R.C.; Murayama, Y. Intensity and spatial pattern of urban land changes in the megacities of Southeast Asia. Land Use Policy 2015, 48, 213–222. [Google Scholar] [CrossRef]
  21. Li, X.; Yang, L.; Ren, Y.; Li, H.; Wang, Z. Impacts of Urban Sprawl on Soil Resources in the Changchun–Jilin Economic Zone, China, 2000–2015. Int. J. Environ. Res. Public Health 2018, 15, 1186. [Google Scholar] [CrossRef] [Green Version]
  22. Xu, X.; Min, X. Quantifying spatiotemporal patterns of urban expansion in China using remote sensing data. Cities 2013, 35, 104–113. [Google Scholar] [CrossRef]
  23. Xu, Q.; Yang, R.; Dong, Y.-X.; Liu, Y.-X.; Qiu, L.-R. The influence of rapid urbanization and land use changes on terrestrial carbon sources/sinks in Guangzhou, China. Ecol. Indic. 2016, 70, 304–316. [Google Scholar] [CrossRef]
  24. Kuang, W. Simulating dynamic urban expansion at regional scale in Beijing-Tianjin-Tangshan Metropolitan Area. J. Geogr. Sci. 2011, 21, 317. [Google Scholar] [CrossRef]
  25. Wang, H.; Zhang, B.; Liu, Y.; Liu, Y.; Xu, S.; Deng, Y.; Zhao, Y.; Chen, Y.; Hong, S. Multi-dimensional analysis of urban expansion patterns and their driving forces based on the center of gravity-GTWR model: A case study of the Beijing-Tianjin-Hebei urban agglomeration. Acta Geogr. Sin. 2018, 73, 1076–1092. [Google Scholar]
  26. Matos, C.; Petrovan, S.O.; Wheeler, P.M.; Ward, A.I. Landscape connectivity and spatial prioritization in an urbanising world: A network analysis approach for a threatened amphibian. Biol. Conserv. 2019, 237, 238–247. [Google Scholar] [CrossRef]
  27. Wilson, E.H.; Hurd, J.D.; Civco, D.L.; Prisloe, M.P.; Arnold, C. Development of a geospatial model to quantify, describe and map urban growth. Remote Sens. Environ. 2003, 86, 275–285. [Google Scholar] [CrossRef]
  28. Liu, J.; Shao, Q.; Yan, X.; Fan, J.; Zhan, J.; Deng, X.; Kuang, W.; Huang, L. The climatic impacts of land use and land cover change compared among countries. J. Geogr. Sci. 2016, 26, 889–903. [Google Scholar] [CrossRef] [Green Version]
  29. Liu, X.-B.; Li, X.; Chen, Y.-M.; Qin, Y.; Li, S.; Chen, M. Landscape Expansion Index and Its Applications to Quantitative Analysis of Urban Expansion. Acta Geogr. Sin. 2009, 64, 1430–1438. [Google Scholar] [CrossRef]
  30. Xu, G.; Zhou, Z.; Jiao, L.; Zhao, R. Compact Urban Form and Expansion Pattern Slow Down the Decline in Urban Densities: A Global Perspective. Land Use Policy 2020, 94, 104563. [Google Scholar] [CrossRef]
  31. Encarnação, S.; Gaudiano, M.; Santos, F.C.; Tenedório, J.A.; Pacheco, J.M. Fractal cartography of urban areas. Sci. Rep. 2012, 2, 527. [Google Scholar] [CrossRef] [Green Version]
  32. Encarnação, S.; Gaudiano, M.; Santos, F.C.; Tenedório, J.A.; Pacheco, J.M. Urban Dynamics, Fractals and Generalized Entropy. Entropy 2013, 15, 2679–2697. [Google Scholar] [CrossRef] [Green Version]
  33. Liu, J.; Kuang, W.; Zhang, Z.; Xu, X.; Qin, Y.; Ning, J.; Zhou, W.; Zhang, S.; Li, R.; Yan, C.; et al. Spatiotemporal characteristics, patterns, and causes of land-use changes in China since the late 1980s. J. Geogr. Sci. 2014, 24, 195–210. [Google Scholar] [CrossRef]
  34. Liu, J.; Liu, M.; Zhuang, D.; Zhang, Z.; Deng, X. Study on spatial pattern of land-use change in China during 1995–2000. Sci. China Ser. D Earth Sci. 2003, 46, 373–384. [Google Scholar] [CrossRef]
  35. Liu, J.; Zhang, Z.; Xu, X.; Kuang, W.; Zhou, W.; Zhang, S.; Li, R.; Yan, C.; Yu, D.; Wu, S.; et al. Spatial patterns and driving forces of land use change in China during the early 21st century. J. Geogr. Sci. 2010, 20, 483–484. [Google Scholar] [CrossRef]
  36. Xu, M.; He, C.; Liu, Z.; Dou, Y.; Satish, U. How Did Urban Land Expand in China between 1992 and 2015? A Multi-Scale Landscape Analysis. PLoS ONE 2016, 11, e0154839. [Google Scholar] [CrossRef] [Green Version]
  37. Song, X.; Chang, K.T.; Yang, L.; Scheffran, J. Change in Environmental Benefits of Urban Land Use and Its Drivers in Chinese Cities, 2000–2010. Int. J. Environ. Res. Public Health 2016, 13, 535. [Google Scholar] [CrossRef] [Green Version]
  38. Shi, Y.; Sun, X.; Zhu, X.; Li, Y.; Mei, L. Characterizing growth types and analyzing growth density distribution in response to urban growth patterns in peri-urban areas of Lianyungang City. Landsc. Urban Plan. 2012, 105, 425–433. [Google Scholar] [CrossRef]
Figure 1. Study area.
Remotesensing 13 02090 g001
Figure 2. Spatial and temporal land use distribution characteristics in mainland China.
Remotesensing 13 02090 g002
Figure 3. Map of spatial expansion patterns in urban land use.
Remotesensing 13 02090 g003
Figure 4. Urban land expansion statistics for mainland China, covering 1995–2015.
Remotesensing 13 02090 g004
Figure 5. Urban land spatial expansion patterns for mainland China, from 1995 to 2015.
Remotesensing 13 02090 g005
Figure 6. Urban land spatial expansion patterns for major urban agglomerations in China, from 1995–2015.
Remotesensing 13 02090 g006aRemotesensing 13 02090 g006b
Figure 7. Urban land spatial expansion patterns for typical cities in China, from 1995 to 2015.
Remotesensing 13 02090 g007aRemotesensing 13 02090 g007bRemotesensing 13 02090 g007cRemotesensing 13 02090 g007dRemotesensing 13 02090 g007eRemotesensing 13 02090 g007f
Table 1. Urban land spatial expansion scale and rate in mainland China, for 1995–2015, at five-year intervals.
Year19952000200520102015
Area (million km2)3.063.184.054.55.07
Expansion area (million km2)/0.120.870.450.57
Rate of expansion (%)/0.785.472.222.53
Table 2. Total land areas of the bigger cities in mainland China, from 1995 to 2015, at five-year intervals.
Type of City1995 (%)2000 (%)2005 (%)2010 (%)2015 (%)
Megacity11.8311.3611.8312.0010.96
Megalopolis9.448.7610.6010.8910.42
Large city11.2312.1712.4812.2612.74
Total32.5032.2934.9135.1534.11
Classification of cities refer to “Notice of the State Council on Adjusting the Standards for City Size Classification”, which was promulgated by the State Council in 2014 (http://www.gov.cn/zhengce/content/2014-11/20/content_9225.htm, accessed on 8 March 2020).
Table 3. Sources of new urban land in mainland China, 1995–2015.
Time PeriodArable Land (%)Forests (%)Grassland (%)Water Areas (%)Other Built Areas (%)Unused Land (%)
1995–200065.3610.655.057.4510.351.14
2000–200566.388.342.804.3017.230.95
2005–201072.006.192.183.5915.610.42
2010–201574.885.448.151.847.342.36
1995–2015 Overall67.989.155.105.3611.071.33
Table 4. Spatial expansion pattern statistics for urban land in mainland China, from 1995–2015.
Infill Type
Study Period
EnclaveEdgeInfill
Quantity%Quantity%Quantity%
1995–2005328.7227474.666116.62
2005–20154913.3529680.65225.99
Change174.63225.99−39−10.63
Table 5. Urban land spatial expansion in major urban agglomerations in China, from 1995 to 2015 (unit: million km2).
Name19952000200520102015Expansion AreaRate of ExpansionIntensity of Urban Expansion
BTH34.0534.9544.4047.4250.3216.272.39%0.04%
YRD39.2342.6359.9068.5379.4440.215.12%0.09%
PRD21.9917.2232.8637.7438.3116.323.71%0.15%
CC8.9811.0014.1117.3718.789.805.46%0.02%
CP26.8330.8938.5943.0349.4622.634.22%0.04%
TCC23.5123.0428.3630.8533.009.492.02%0.01%
LZN10.2312.1012.6713.9614.704.472.18%0.03%
NSTM4.805.846.316.439.614.815.01%0.01%
HC15.5116.9917.8019.0621.956.442.08%0.01%
BG8.207.719.059.6110.292.091.28%0.01%
Publisher’s Note: MDPI stays neutral with regard to jurisdictional claims in published maps and institutional affiliations.

