Abstract
Using high-resolution remote sensing data to identify infected trees is an important method for controlling pine wilt disease (PWD). Currently, single-date image classification methods are widely used for PWD detection in pure stands of pine. However, they often yield false detections caused by deciduous trees, brown herbaceous, and sparsely vegetated regions in complex landscapes, resulting in low user accuracies. Due to the limitations on the bands of the high-resolution imagery, it is difficult to distinguish wilted pine trees from such easily confused objects when only using the optical spectral characteristics. This paper proposes a spatiotemporal change detection method to reduce false detections in tree-scale PWD monitoring under a complex landscape. The framework consisted of three parts, which represent the capture of spectral, temporal, and spatial features: (1) the Normalized Green–Red Difference Index (NGRDI) was calculated as a descriptor of canopy greenness; (2) two NGRDI images with similar dates in adjacent years were contrasted to obtain a bitemporal change index that represents the temporal behaviors of typical cover types; and (3) a spatial enhancement was performed on the change index using a convolution kernel matching the spatial patterns of PWD. Finally, a set of criteria based on the above features were established to extract the wilted pine trees. The results showed that the proposed method effectively distinguishes wilted pine trees from other easily confused objects. Compared with single-date image classification, the proposed method significantly improved user’s accuracy (81.2% vs. 67.7%) while maintaining the same level of producer’s accuracy (84.7% vs. 82.6%).
1. Introduction
Pine wilt disease (PWD) is a lethal wilting disease caused by the pine wood nematode (Bursaphelenchus xylophilus; PWN). After becoming infected with the disease, pine trees show certain symptoms, in which the needles of the tree gradually change color; the pine resin stops flowing; and the tree wilts, withers, and eventually dies, with the whole process occurring over a few months [1,2,3]. In 2020, PWD has been reported in 18 provinces, autonomous regions, and municipalities that are directly under the Central Government of China, with an infestation area of 1.8 million ha and a death toll of 19.5 million trees [4]. Studies have shown that, with the changes in climate in recent years, the potentially suitable areas for pine wood nematodes have expanded toward China’s northern and western regions [5,6,7]. These results indicate that pine wilt disease has already become one of the most dangerous forest biological disasters in China, not only causing serious damage to pine forest resources and endangering the ecological security of scenic spots and other areas but also seriously affecting China’s import and export trade.
Currently, it is believed that PWD is the interactive outcome of the pathogen, the host pine tree, the insect vector, and climatic conditions [8]. Moreover, there is currently no effective method to completely eradicate the disease, and the timely removal of the diseased trees is the most effective way to control the disease once the infected trees are identified [9]. In recent years, the development of high-resolution commercial satellites and unmanned aerial vehicle (UAV) technology has also provided new data support for natural resources monitoring. Compared with other survey methods, remote sensing technology has many advantages when making surveys of forest pests and diseases, including (1) fast information acquisition with a short revisit cycle, (2) less restriction by ground conditions and low labor costs, and (3) the capability for large-scale monitoring [10]. Therefore, using remote sensing technology to accurately locate trees that are infected with pine wilt disease can enable timely monitoring of the health status of the forest and cleanup of diseased trees while helping to elucidate the pattern of prevalence of the disease at multiple scales and its interactions with humans and the natural environment.
The Joint Research Center (JRC) conducted a pilot study in 2014 and 2015 to confirm the feasibility of identifying dead pine trees through high-resolution satellite remote sensing images and UAV images and to establish a basic methodological system of using remote sensing to monitor PWD-infected trees [11]. Currently, in monitoring discolored pine trees caused by forest pests and diseases, optical satellite remote sensing is the most widely used method. Previous studies based on hyperspectral data showed that the canopy color change of pine trees include higher red band reflectance than green band reflectance, a decreased slope, and a blue shift of the red edge [12,13,14]. Unlike the stand or landscape-scale forest mortality [15], PWD usually occurs at the tree-scale, which needs high-resolution imagery to provide distinct information on the infestation patterns [11]. The commonly used high-resolution satellite remote sensing data for PWD detection include IKONOS [16,17], QuickBird [18,19], WorldView [20], and GeoEye-1 [21]. Methodologically, image enhancement is achieved through a variety of methods, such as constructing the spectral index, principal component analysis, and tasseled cap transformation, on which the wilted pine trees are further extracted through the threshold segmentation method or machine learning [22,23,24,25].
The studies mentioned above are mostly based on single-date image classification, which have been well applied in studies for pure pine forests. However, in the complex landscapes (i.e., structurally heterogeneous vegetation or fragmented land cover), there could be many pixels with similar spectral properties to the wilted pine trees in the image, such as seasonal discoloration of deciduous trees, brown herbaceous, and sparsely vegetated regions [26,27]. For instance, the incidences of PWD in southern China are highly spatially dispersed, with a complex distribution [28], and the seasonal discoloration of the deciduous trees in the mixed forest is very similar to the wilting process of the pine trees. On the other hand, high resolution satellite imagery provides spatial detail at the tree-scale but mostly only four (visible and near infrared) bands on which the wilted pine trees and the easily confused objects show indistinguishable spectral properties. Moreover, high-resolution imagery often yields more variable reflectance values within one cover type [21,29,30]. These issues significantly confuse the recognition process and specifically causes a lot of commission errors into the result, which is more problematic than omission errors from an operational perspective [17]. In summary, the main reason for the limitations in using high-resolution images to monitor PWD is that the approaches have relied excessively on the spectral information while overlooking the spatiotemporal patterns of the discoloration process.
By addressing these problems, we insist that a change detection method based on fusing spatial and temporal characteristics is a reasonable strategy to improve the accuracy (especially user accuracy) in PWD detection. The objective of this study is to incorporate spatial and temporal information extraction and to explore its improvements in tree-scale PWD detection in a complex landscape. Specifically, a spectral index is calculated to represent the canopy greenness in a single-date satellite image; the temporal behavior of the wilting process is measured using bi-temporal change detection; the spatial feature of wilted pine trees is enhanced by a spatial convolution operation using a proposed kernel. The PWD-induced wilted trees are subsequently determined by the extracted features.
2. Materials and Methods
2.1. Study Area
The study area is located in Dangyang City, Hubei Province (Figure 1a). Dangyang is situated in a mid-latitude area and experiences a subtropical monsoon humid climate, with rainy and hot weather occurring within the same season. The annual average temperature is 16.6 °C, and the average annual rainfall is approximately 990 mm. The study area consists of a hilly area with undulating terrain and fragmented land cover. The main forest type is mixed forests, in which the evergreen tree species are mainly masson pine (Pinus massoniana) and slash pine (Pinus elliottii), and the deciduous tree species are mainly sawtooth oak (Quercus acutissima) and cork oak (Quercus variabilis). The main soil type is the yellow brown soil.
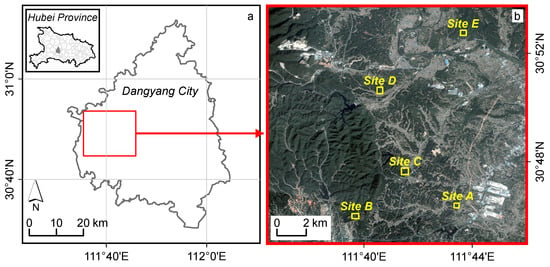
Figure 1.
Overview of the study area and field sites. (a) The study area located in Dangyang City, Hubei Province. (b) A thumbnail graph of the PlanetScope satellite image and the spatial distribution of the five field sites.
Due to incomplete clearing of infected trees and a favorable living environment for the host insects (Monochamus alternatus) of PWN, Dangyang has experienced PWD-induced tree mortality since 2015. The foliage of the wilted pine trees begins to turn red or yellow every October, and discoloration and defoliation of deciduous trees occur during the same period. The fragmented land cover together with the deciduous trees pose an immense challenge to PWD monitoring. In this study, we designated five field sites with new outbreaks of PWD in 2019 (Figure 1b) to analyze the spatial and temporal characteristics of tree wilting and to verify the detection results.
2.2. Data Collection
2.2.1. Satellite Imagery
The satellite imagery dataset in this study consisted of a pair of PlanetScope multispectral images on similar dates in adjacent years. The first image was acquired on 22 October 2018, and the second image was acquired on 15 October 2019. PlanetScope is a satellite constellation consisting presently of 130+ CubeSats (4 kg satellites) operated by Planet Labs [31]. The company has established a data-sharing program to provide PlanetScope data with high spatial and temporal resolution to users [32]. PlanetScope imagery contains four spectral bands, i.e., blue (455–515 nm), green (500–590 nm), red (590–670 nm), and near-infrared (NIR, 780–860 nm). We employed the Level-3B surface reflectance products that have been atmospherically corrected by Planet Labs. The spatial resolution of these products is 3 m, which could meet the requirements for tree-scale monitoring in the study area according to the canopy width of pine trees from the field survey. We checked the co-registration of the two PlanetScope acquisitions and found that they were already well co-registered. A reference image (date: 15 October 2019) was selected, and the other image was radiometrically normalized to this reference image following the approach of Canty and Nielsen [33]. Based on these operations, we finally obtained the ready-to-use images for the five field sites.
2.2.2. Ground Control Data
In situ investigations were performed for the five field sites from 17 to 22 October 2019. Unmanned aerial vehicle (UAV) photos were taken at each site as a combination between the satellite imagery and the ground data. The photos were taken at an oblique angle and hence cannot be accurately projected to a geographic coordinate system. Consequently, visual interpretation was required to determine typical land (or surface) cover types in the satellite image on 15 October 2019. Although most of the cover types in the satellite image can be clearly determined by referring to the UAV photos, it is still hard to identify whether the discoloration of a tree is caused by PWD or related to phenology. To solve this problem, field crews were dispatched to validate the species and the reason for discoloration in these trees. The wilted pine trees and the discolored deciduous trees were then recorded separately (e.g., at Site A, Figure 2).
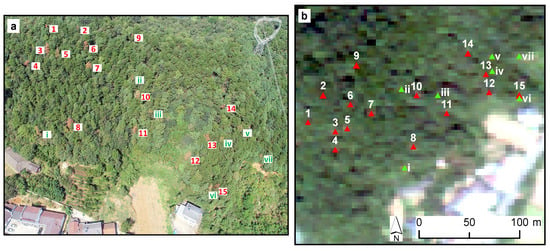
Figure 2.
The locations of the wilted pine trees (marked with Arabic numerals) and discolored deciduous trees (marked with Roman numerals) on (a) the UAV photo and (b) the satellite image at Site A. The canopy widths of the Nos. 2, 9, and 15 trees were less than 3 m, and the No. 14 pine tree was mostly blocked by the adjacent trees.
We found that the mean canopy width of the wilted pine trees in the five field sites was 5.6 m (SD = 1.7), which was used to evaluate the appropriate spatial resolution for tree-scale PWD mapping. For each wilted pine tree at each site, the canopy width was recorded and classified based on the spatial resolution of the PlanetScope image used in this study (Table 1). All of the wilted pine trees newly added in 2019 were collected and saved as point features. As the spectral signal is significantly distinct from the neighborhood in the case that the wilted pine tree mostly covers at least one pixel [34,35], the wilted pine trees with a canopy width less than 3 m were not considered for the subsequent analysis. Consequently, a total of 203 wilted trees with canopy width greater than 3 m were selected. Afterwards, a pixel-wise sample set was simultaneously built based on the selected wilted pine trees and visual interpretation. There were nine cover types in the sample set, including healthy and wilted pine trees, deciduous trees, grass, crops, water, buildings, roads and barren. A total of 1231 sample pixels (15–40 pixels for each of the cover types in each site) were labeled for temporal behavior analysis and classifier training.

Table 1.
The count of the PWD-induced wilted pine trees with different canopy width for the five field sites collected in the in situ investigations.
2.3. Methods
2.3.1. General Workflow
We established a spatiotemporal change detection framework to capture the spatial and temporal patterns of the wilting process caused by PWD (Figure 3): (1) a spectral index was calculated for the two remote sensing images with similar dates in adjacent years; (2) a bi-temporal change analysis was used to obtain the differences between the calculated indices; and (3) the resulting image was enhanced through spatial convolution based on a proposed kernel that was fitted to the spatial pattern of the wilted pine trees. Finally, a set of criteria were used to extract the wilted pine trees caused by PWD. The spatiotemporal analysis focused on distinguishing between the wilted pine trees and other objects with similar spectral properties but diverse temporal behaviors and spatial patterns (e.g., discolored deciduous trees, brown herbaceous, and sparsely vegetated regions). The results were validated using the locations of the wilted pine trees recorded in the in situ investigations. Meanwhile, a supervised classification method based on single-date imagery was performed for comparison.
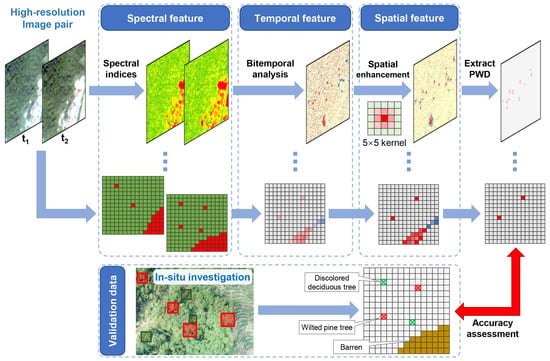
Figure 3.
Flowchart outlining the main steps implemented in the spatiotemporal change detection framework. The spectral indices were used to indicate the non-green pixels in the image pair; the bi-temporal analysis was used to reveal the pixels with changed cover types at two times; and the spatial enhancement was used to specifically highlight the wilted pine trees in the satellite image.
2.3.2. Bi-Temporal Change Detection
The Normalized Green–Red Difference Index (NGRDI) was calculated for both images, using the formula of Hunt et al. [36]:
where and are the reflectance of the red and green bands, respectively. The NGRDI observations are correlated with green vegetation cover with the possible range from −1 to 1. In this study, the NGRDI was employed to indicate the color of a pixel (i.e., greenish or reddish). Then, a differentiation was made between the NGRDIs from the two dates:
where and are calculated from the satellite images from 22 October 2018 and 15 October 2019, respectively.
2.3.3. Spatial Enhancement
A typical spatial pattern of the wilted pine trees in the images were abstracted based on the average canopy width, which is approximately twice the size of the pixel (Figure 4). In the imaging process, radiation naturally reflected from the ground are sampled and quantized into digital numbers (DNs) within the grid cells. The spacing between pixels on the canopy was shown in Figure 4a. In general, the values of the wilted pine tree are negative and significantly lower than those of the surrounding healthy trees, which is close to 0. Within a wilted pine tree, the values of the canopy centroid are lower than those at the edge of the canopy (Figure 4b). Therefore, we defined a measure of the spatial similarity of an image patch to a wilted pine tree using the spatial convolution with a 5 × 5 kernel (Figure 4c). The kernel was then normalized to sum to 1, and the image was convolved with the normalized kernel. Let be the output of the spatial convolution from the input image.
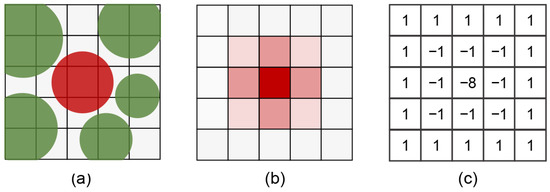
Figure 4.
Typical spatial patterns of (a) a wilted pine tree on the ground and (b) the corresponding in the satellite image, and (c) the proposed kernel matching the spatial pattern of the wilted pine trees. The canopy width is set to twice the pixel size as an example according to the average canopy width acquired from the in situ investigations and spatial resolution of the satellite image used in this study.
2.3.4. Extraction of PWD
Based on the spatiotemporal features, we set up a group of restrictions on the spatiotemporal features (Table 2). The single-date NGRDI image could indicate the non-green objects, including wilted pine trees and many other objects with the similar spectral properties. The bi-temporal change detection distinguished between the wilted pine trees and these objects by capturing the temporal behaviors of the wilting process. However, pixels with the certain land (or surface) cover change (e.g., deforestation, fallow) during 2018–2019 could show similar temporal behaviors to tree wilting. As such events were commonly of larger spatial extent and relatively homogeneous observations, which was different from the wilted pine trees (Figure 4b), spatial analysis was additionally performed to eliminate them.

Table 2.
The criteria for the spatiotemporal features extracted from image pair to distinguish the pine wilted trees.
Specifically, a threshold of was applied on to mask the possible wilted pine tree pixels (Figure 5a). Then, we converted the pixel-based results into the target-based results, in which the adjacent pixels (including diagonally connected pixels) were reorganized into a target and designated each corresponding rectangular frame as a candidate bounding box (, Figure 5b). The number of pixels in each candidate was counted. As the s were approximately squared, the possible pixel count could be inferred in advance. For example, the pixel counts of the candidate s are nine and six in Figure 5b. The upper limit of the pixel count in a candidate was set as N to avoid false detections of the large-scale land (or surface) cover change.
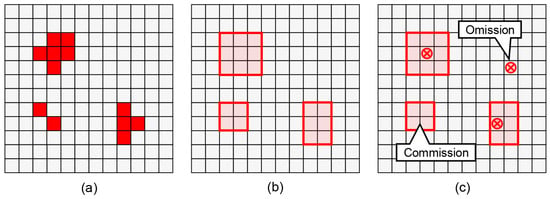
Figure 5.
Schematics showing (a) the wilted pine tree pixels masked by the threshold , (b) the candidate bounding boxes (s) converted from the pixel-based result, and (c) the omission and commission errors defined based on the locations of wilted pine trees and s.
In addition, a support vector machine (SVM) classification with the 2019 image was performed as a single-date image classification method to compare with the spatiotemporal change detection method. As there were too few wilted pine trees at Sites A and B and Site D was full of pure pine stands, we randomly selected approximately 60% of the samples at Sites C and D to train the classifier. For the key parameters in SVM, kernel type was set as the Radial Basis Function, cost parameter was set as 100, and gamma was set as 0.25 (the reciprocal of the number of bands). For the classification results, only the wilted pine tree class was considered, and likewise, the pixel-wise results were also converted to candidate s and screened by N.
2.3.5. Accuracy Assessment
The proposed spatiotemporal change detection method as well as the single-date image classification method were evaluated for the five field sites. For the spatiotemporal change detection, all of the 203 wilted pine trees can be used for validation, while for the single-date classification, 60% of the samples at Sites C and D were already used for training so the rest wilted pine trees were selected as validation data. To match the feature points recorded in field survey with the s generated by detection algorithms, referring to White et al. [17], we defined true positive, omission and commission errors according to the following rules: true positive is defined as wilted pine trees falling within the s; when an actual wilted pine tree does not fall in any , it is recorded as an omission error; when there is no actual wilted pine in a , it is defined as a commission error (Figure 5c). The producer’s accuracy was defined as the proportion of the number of wilted pine trees correctly detected to the number of actual wilted pine trees, and the user accuracy was defined as the proportion of the number of s containing actual wilted pine trees to the total number of s in the detection results.
3. Results
3.1. Spatial and Temporal Patterns of PWD-Induced Wilting
The NGRDI observations in 2018 and 2019 for six typical cover types, including wilted pine tree caused by PWD in 2019 as well as healthy pine tree, deciduous tree, grass, crop, and barren, were used to construct a scatter plot (Figure 6). A total of 300 pixels (50 pixels per cover type) were randomly selected from the sample set. In general, the NGRDI observations is correlated with the coverage of green vegetation as well as the color of the canopy. Pixels of healthy pine trees have higher NGRDI observations, while barren areas have the lowest NGRDI observations. The NGRDI observations of deciduous trees, grass, and crops are distributed around 0, with positive and negative values. In addition, the NGRDI observations for 2018 and 2019 were very close if there was no land (or surface) cover change, while those for pine trees infected with PWD in 2019 clearly deviated from the 1:1 line, mostly falling in the fourth quadrant of the coordinate system.
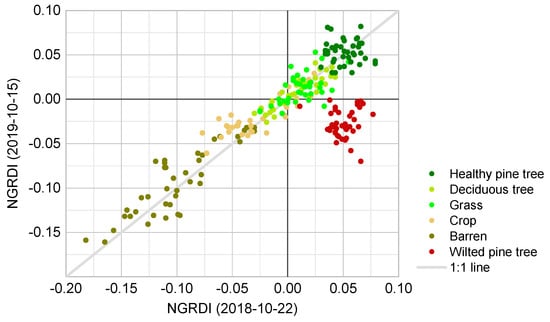
Figure 6.
Scatter plot derived using the NGRDI observations for pixels belongs to typical land (or surface) cover types in 2018 and 2019. The wilted pine trees were caused by the PWD in 2019, and there were no land (or surface) cover change for the rest pixels between the two times.
The spatial distributions of NGRDI for those two years at Site A are shown in Figure 7. Pixels appeared to be non-green in the true-color images (e.g., non-vegetation cover, discolored deciduous trees, and wilted pine trees) also showed low NGRDI observations. Among these cover types, other than the fact that some of the NGRDI observations of barren is significantly lower (<−0.05), there are no significant differences between the NGRDI observations of the wilted pine trees and those of other types of pixels. Comparing the images for those two years, NGRDI observations changed for locations with pine trees infected with PWD in 2019.
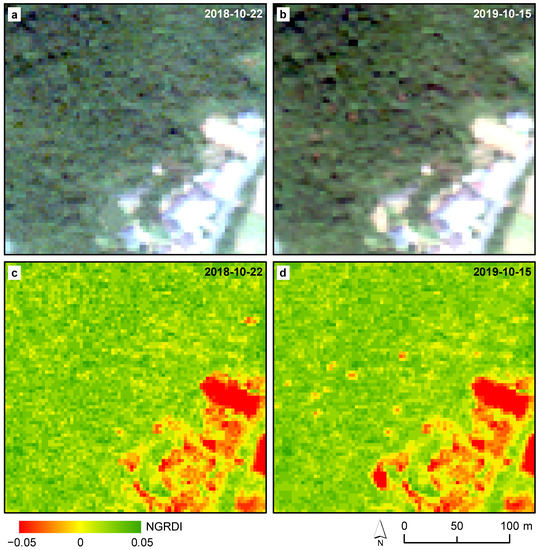
Figure 7.
The true-color PlanetScope image and the NGRDI mapping at Site A on 22 October 2018 (a,c) and 15 October 2018 (b,d).
The bi-temporal change index was calculated to highlight the pine pixels infected with PWD in 2019 (e.g., at Site A, Figure 8a). It is evident that the of wilted pine trees is at low levels throughout the entire image, while the other pixels with no land (or surface) cover change showed almost no differences ( is close to 0) because the cover type did not change. Nevertheless, there are also pixels with similar to the wilted pine trees in the image. Apart from some noise, the most obvious object is a patch of bare ground formed in 2019 in the lower part of the image. After convolution on , a large amount of noise was weakened (Figure 8b). Although the bare ground maintains similar color-changing characteristics, the spatial extent is broader than that of a single wilted pine tree.
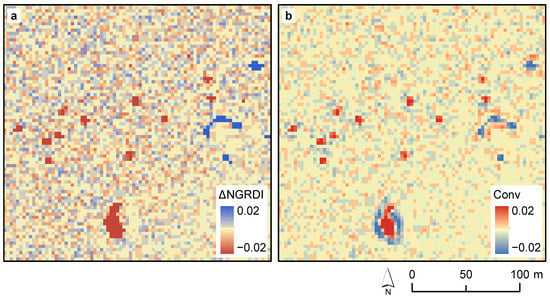
Figure 8.
Mapping of the (a) and the (b) at Site A.
3.2. Comparison of Spatiotemporal Change Detection and Single-Date Classification
All of the newly added wilted pine trees with canopy width greater than 3 m were collected to assess the relationship between the accuracies and the thresholds of and N. The specific producer accuracy as well as user accuracy under different and N values are listed in Table A1 and Table A2 in Appendix A, respectively. Due to the trade-off between the producer and the user accuracies, the was set to 0.015 and the N was set to 16 for further analyses. We compared the advantages and disadvantages of the proposed spatiotemporal change detection method and the single-date image classification method. The validation results for the each field site are presented in Table 3 and Table 4. Compared to the single-date classification, the spatiotemporal change detection showed better user accuracies for the mixed forest (Sites A, B, C, and D). Overall, the producer accuracies for the two method were relatively close (84.7% and 82.6%), while the user accuracy for the spatiotemporal change detection (81.2%) was significantly better than that of the single-date classification (67.7%).

Table 3.
Validation results for PWD detection based on the spatiotemporal change detection method.

Table 4.
Validation results for PWD detection based on the single-date image classification method.
The detection results for the two methods at Site A are shown in Figure 9. The spatiotemporal change detection correctly detected 11 of 15 wilted pine trees and missed Nos. 2, 9, 14, and 15, and there was only one commission error (Figure 9a). The single-date classification correctly detected 12 wilted pine trees and missed Nos. 2, 9, and 14, but there were eight false detections, significantly more than that for spatiotemporal change detection (Figure 9b). The eight commission errors included four discolored deciduous trees, specifically Nos. i, ii, iii, and v, along with four barren and mixed vegetation-soil targets. Meanwhile, the detection result of the spatiotemporal change detection did not include discolored deciduous trees at Site A.
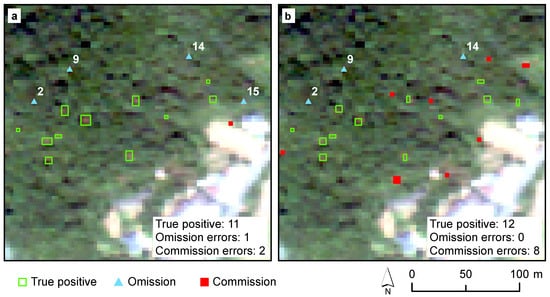
Figure 9.
Comparison of the detection result through spatiotemporal change detection method (a) and single-date image classification method (b) at Site A.
4. Discussion
4.1. General Framework of Tree-Scale PWD Monitoring
For satellite remote sensing, whether a wilted pine tree could be detected or on what canopy width could a wilted pine tree be detected largely depend on the spatial resolution of remote sensing images [17,18,29,35]. Generally, the ideal spatial resolution of the satellite image need to reach the canopy width of the pine tree to be detected [34]. Thus, the main reason why the wilted pine trees Nos. 2, 9, 14, and 15 at Site A were not identified were due to the limitations of the resolution of the PlanetScope image. In terms of temporal feature, this study has demonstrated that it is feasible to use two images with similar dates in adjacent years to distinguish the wilted pine trees from other confusing targets. In addition, we believe that attempts to analyze two or more images from the same year when PWD occurs are worthwhile. Despite the relatively limited channels for current high-resolution satellite sensors, it is undeniable that richer spectral information inevitably lead to further improvements in accuracy. The advantage of STM in the PWD detection is that it effectively reduces false detections caused by easily confused targets, which are particularly abundant in mixed or fragmented forests. Therefore, the spatiotemporal change detection is more advantageous in such complex landscapes.
In this study, the NGRDI is based on the red and green bands, mainly reflecting the color of pixels. Similar to NDVI [37], RGI [18], and other indices, NGRDI also could indicate the growth states and the canopy traits of vegetation [38,39,40,41]. We chose the index with the normalized difference form to further eliminate errors caused by the inconsistencies in radiation between different images [36]. Another reason for choosing NGRDI is that it has a natural threshold of 0. The plus or minus sign for NGRDI indicates whether a pixel is “greenish” or “reddish”, which is friendly to some threshold settings. In the spatial filtering, the setting of the convolution kernel should match the spatial pattern of the color-changing pine tree on the remote sensing image. Alternatively, the commonly used Sobel, Difference of Gaussian, and Laplace of Gaussian operators [42] can also be used as convolution kernels to enhance the spatial feature of the wilted pine trees in the image.
4.2. Advantages of Spatiotemporal Change Detection Method
The widely used single-date classification mainly relies on the spectral information of an image and could yield a good performance for PWD detection in the pure pine forest [17,22,23]. The false detections for this method mainly include discolored deciduous trees, brown herbaceous, and sparsely vegetated area (including mixed pixels at the junctions of forest and bare soil). Their characteristics on optical remote sensing images are very similar to the wilted pine trees caused by PWD, and the corresponding values of the spectral indices are close (Figure 6 and Figure 7). However, high-resolution imagery usually contains only four bands of blue, green, red, and near-infrared, which inevitably leads to a large number of commission errors in the detection results. Even if the producer accuracy is high, an excessive number of commission errors still reduces the applicability of the single-date classification. Wulder et al. [19] insisted that multi-temporal images can be used to achieve a higher detection accuracy. In this study, for two images taken on similar dates in different years, if the land (or surface) cover does not change, the NGRDI observations of the cover types that are easy to be confused with wilted pine trees will remain unchanged, while the those of pine trees after wilting will significantly decrease (Figure 6). Therefore, the with the temporal feature can effectively distinguish the wilted pine trees from commonly confused objects.
In addition to the abovementioned cover types, there were pixels that are similar to the wilted pine trees in the image (Figure 8a), which can be divided into two categories: (1) human or natural behaviors, such as felling, fallowing, and disasters that lead to the reduction in green vegetation coverage, in which are characterized by large changes in NGRDI and a spatial scale broader than the wilting process of a single pine tree, and (2) the noise caused by differences in atmospheric conditions, radiation, or phenology between the two images [43], in which the distinctive feature of this type of interference is that the magnitude of the change in NGRDI is relatively small while the spatial scale is similar to that of the discoloration of pine trees. Therefore, we constructed a kernel based on the spatial pattern of wilted pine trees to perform a convolution operation on , so that the pixels conforming to the spatial characteristics of wilted pine trees were enhanced and the noise was weakened (Figure 9b). The remaining large-scale changes of the cover type could be filtered by restricting the pixel counts of each .
Although the reported producer accuracies based on the spatiotemporal change detection method and the single-date classification were similar, the commission error results for spatiotemporal change detection were significantly lower than those for the single-date classification (Table 3 and Table 4). For example, in the results for Site A, the commission errors for the single-date classification accounted for 40% (8 of 20) of the total s, and the discolored deciduous trees and pixels with low vegetation cover were not effectively eliminated (Figure 9b). Although the single-date classification successfully detected the No. 15 wilted tree that spatiotemporal change detection had missed, the possible reason is that the No. 15 tree and the adjacent No. vi discolored deciduous tree were detected at the same time; however, this cannot prove that the frequency of omissions of the single-date classification might be lower than that of the spatiotemporal change detection.
4.3. Error Source of the Spatiotemporal Change Detection Method
The main source of commission is the specific land (or surface) cover change with the manifestation of a reduction in greenness at a small spatial scale, which closely resembles the discoloration process caused by PWD. For example, if there is a small area of logging coincided with the tree wilting in the forest, the temporal behaviors and spatial patterns of these two events are very similar. In this situation, the proposed method may not be able to determine to which kind of cover change it belongs. A conceivable solution is to track subtle temporal behaviors using dense image time series instead of the bi-temporal analysis. It should also be admitted that the spatiotemporal change detection method used in this paper may not effectively detect large continuous wilted pine trees because they are probably filtered out in the area-screening step. However, this situation is very rare except in the case in which the infected pine forest has not been treated for many years. Although the spatiotemporal change detection method in this study showed better accuracies, it is worth noting that the result is only for the newly added wilted trees between the two times. The time interval between the two image should not be too long to avoid the excessive land (or surface) cover change confused with tree wilting. In addition, the requirements for coregistration and relative radiation normalization of the spatiotemporal change detection method are relatively high.
5. Conclusions
In this study, we proposed a new perspective based on spatiotemporal change detection for the tree-scale PWD detection in a complex landscape with mixed forest and fragmented land cover. The approach captured spatial and temporal patterns of the PWD-induced wilting through a bi-temporal analysis and a spatial enhancement. The results showed that the proposed method can effectively distinguish wilted pine trees from discolored deciduous trees, sparsely vegetated regions, and many other objects with which they are easily confused. The user’s accuracies for the proposed method were significantly higher (81.2%) than those for the single-date classification (67.7%). By not limiting ourselves to a specific method, we are more focused on proposing a spatiotemporal feature extraction strategy that effectively address targets that cannot be distinguished solely by spectral information, with a goal toward advancing research on remote sensing monitoring of forest pests and diseases.
Author Contributions
Conceptualization, B.Z. and H.Y.; methodology, B.Z.; software, B.Z.; validation, B.Z. and W.L.; formal analysis, B.Z.; investigation, B.W., Z.H. and H.S.; writing—original draft preparation, B.Z.; writing—review and editing, B.Z. and H.Y.; supervision, W.H.; funding acquisition, W.H. All authors have read and agreed to the published version of the manuscript.
Funding
This research was funded by the Strategic Priority Research Program of the Chinese Academy of Sciences (grant number XDA19080304), by the Major Emergency Science and Technology Project of National Forestry and Grassland Administration (grant number ZD202001), and by the National Natural Science Foundation of China (grant number 42071320).
Data Availability Statement
Data sharing is not applicable to this article.
Acknowledgments
The authors gratefully acknowledge Planet Inc. for providing the planet images through their research and education program. We thank Zuoming Wang and Jian Gu for help with the fieldwork. In addition, Biyao Zhang would like to thank Minqian Lu for the help in typesetting. We would like to thank the reviewers for their helpful and constructive comments, which have improved the paper.
Conflicts of Interest
The authors declare no conflict of interest.
Appendix A
We evaluated how producer accuracy and user accuracy vary as functions of the probability of the threshold and N. The was increased from 0.01 to 0.02 at an interval of 0.001, and N was increased from 1 to 36 to cover the possible sizes of the s (approximately squared).

Table A1.
The producer accuracy with different and N. The bold numbers indicate the best parameters.
Table A1.
The producer accuracy with different and N. The bold numbers indicate the best parameters.
| 0.01 | 0.011 | 0.012 | 0.013 | 0.014 | 0.015 | 0.016 | 0.017 | 0.018 | 0.019 | 0.02 | ||
| N | ||||||||||||
| 1 | 30.8% | 29.5% | 28.8% | 27.4% | 25.9% | 24.8% | 24.0% | 22.7% | 21.5% | 19.4% | 15.6% | |
| 2 | 39.5% | 38.1% | 36.2% | 35.0% | 33.5% | 31.6% | 29.6% | 26.5% | 23.5% | 23.3% | 21.9% | |
| 4 | 47.4% | 45.9% | 43.9% | 42.0% | 41.2% | 40.1% | 37.2% | 36.3% | 32.7% | 30.5% | 26.4% | |
| 6 | 60.0% | 58.7% | 56.0% | 53.4% | 51.0% | 48.5% | 48.5% | 45.3% | 40.5% | 40.5% | 34.8% | |
| 9 | 69.4% | 66.8% | 64.5% | 64.3% | 63.7% | 61.2% | 60.0% | 56.8% | 52.4% | 51.4% | 46.3% | |
| 12 | 80.0% | 78.9% | 76.9% | 76.5% | 73.6% | 71.3% | 69.7% | 69.3% | 65.4% | 57.7% | 57.4% | |
| 16 | 89.2% | 88.6% | 88.0% | 86.4% | 85.9% | 84.7% | 80.7% | 77.6% | 69.2% | 68.6% | 55.2% | |
| 20 | 91.7% | 90.4% | 88.6% | 86.2% | 85.4% | 82.7% | 78.0% | 73.2% | 67.9% | 65.5% | 62.9% | |
| 25 | 94.8% | 93.2% | 92.4% | 90.8% | 88.6% | 85.1% | 80.5% | 75.8% | 71.5% | 66.1% | 53.5% | |
| 30 | 96.0% | 95.7% | 94.6% | 92.4% | 90.6% | 89.2% | 86.2% | 81.2% | 79.6% | 76.2% | 74.2% | |
| 36 | 96.5% | 95.8% | 95.1% | 94.5% | 94.4% | 91.8% | 91.5% | 87.1% | 84.6% | 75.8% | 67.1% | |

Table A2.
The user accuracy with different and N. The bold numbers indicate the best parameters.
Table A2.
The user accuracy with different and N. The bold numbers indicate the best parameters.
| 0.01 | 0.011 | 0.012 | 0.013 | 0.014 | 0.015 | 0.016 | 0.017 | 0.018 | 0.019 | 0.02 | ||
| N | ||||||||||||
| 1 | 56.9% | 62.4% | 66.7% | 71.3% | 76.2% | 80.7% | 82.1% | 83.6% | 87.8% | 92.1% | 93.2% | |
| 2 | 58.0% | 66.8% | 71.6% | 77.3% | 79.3% | 81.6% | 83.5% | 84.2% | 87.3% | 91.6% | 92.8% | |
| 4 | 58.3% | 69.3% | 73.2% | 78.6% | 80.2% | 82.5% | 82.9% | 85.5% | 86.9% | 89.8% | 92.6% | |
| 6 | 58.8% | 65.9% | 68.2% | 70.3% | 73.3% | 82.1% | 83.1% | 84.9% | 85.5% | 88.2% | 91.5% | |
| 9 | 58.0% | 62.4% | 63.9% | 69.0% | 72.1% | 81.9% | 82.5% | 84.4% | 85.2% | 87.9% | 90.1% | |
| 12 | 55.7% | 65.6% | 69.8% | 70.2% | 76.8% | 81.5% | 82.2% | 83.8% | 85.0% | 86.5% | 87.7% | |
| 16 | 54.4% | 61.9% | 71.9% | 76.1% | 78.3% | 81.2% | 82.0% | 83.2% | 84.5% | 86.6% | 89.1% | |
| 20 | 45.7% | 47.0% | 53.3% | 57.8% | 60.3% | 72.6% | 75.1% | 78.3% | 79.2% | 80.9% | 82.3% | |
| 25 | 39.2% | 44.7% | 45.0% | 46.8% | 48.5% | 48.9% | 50.0% | 50.4% | 51.7% | 52.1% | 62.9% | |
| 30 | 31.1% | 37.0% | 39.1% | 39.3% | 40.3% | 41.8% | 42.8% | 43.5% | 44.2% | 44.3% | 44.7% | |
| 36 | 17.7% | 20.3% | 22.9% | 26.8% | 28.3% | 29.9% | 31.7% | 33.5% | 34.8% | 35.2% | 35.1% | |
References
- Kuroda, K.; Yamada, T.; Mineo, K.; Tamura, H. Effects of cavitation on the development of pine wilt disease caused by Bursaphelenchus xylophilus. Jpn. J. Phytopathol. 1988. [Google Scholar] [CrossRef]
- Vollenweider, P.; Günthardt-Goerg, M.S. Diagnosis of abiotic and biotic stress factors using the visible symptoms in foliage. Environ. Pollut. 2005. [Google Scholar] [CrossRef] [PubMed]
- Zhao, B. Pine wilt disease in China. In Pine Wilt Disease; Springer: Tokyo, Japan, 2008; pp. 18–25. [Google Scholar] [CrossRef]
- Sun, H.; Zhou, Y.; Li, X.; Zhang, Y.; Wang, Y. The occurrence of major forestry pests nationwide in 2020 and the forecast of their occurrence in 2021. For. Pest Dis. 2021, 45–48. (In Chinese) [Google Scholar] [CrossRef]
- Cheng, G.; Lü, Q.; Feng, Y.; Li, Y.; Wang, Y.; Zhang, X. Temporal and spatial dynamic pattern of pine wilt disease distribution in China predicted under climate change scenario. Sci. Silvae Sin. 2015, 51, 119–126. [Google Scholar]
- He, S.; Wen, J.; Luo, Y.; Zong, S.; Zhao, Y.; Han, J. The predicted geographical distribution of Bursaphelenchus xylophilus in China under climate warming. Chin. J. Appl. Entomol. 2012, 49, 236–243. [Google Scholar]
- Li, Y.; Zhang, X. Analysis on the trend of invasion and expansion of Bursaphelenchus xylophilus. For. Pest Dis. 2018, 037, 1–4. [Google Scholar] [CrossRef]
- Zhao, B.G.; Tao, J.; Ju, Y.W.; Wang, P.K.; Ye, J.L. The role of wood-inhabiting bacteria in pine wilt disease. J. Nematol. 2011, 43, 129. [Google Scholar] [PubMed]
- Huang, M.; Gong, J.; Zhang, J. Study on Pine Wilt Disease Remote Sensing Monitoring and Diffusion Simulation; China Environmental Science Press: Beijing, China, 2012. [Google Scholar]
- Senf, C.; Seidl, R.; Hostert, P. Remote sensing of forest insect disturbances: Current state and future directions. Int. J. Appl. Earth Obs. Geoinf. 2017, 60, 49–60. [Google Scholar] [CrossRef]
- Beck, P.S.A.; Zarco-Tejada, P.; Strobl, P.; San Miguel, J. The feasibility of detecting trees affected by the Pine Wood Nematode using remote sensing. In European Commission Joint Research Centre Institute for Environment and Sustainability; Publications Office of the European Union: Luxembourg, 2015. [Google Scholar]
- Kim, S.R.; Lee, W.K.; Lim, C.H.; Kim, M.; Kafatos, M.C.; Lee, S.H.; Lee, S.S. Hyperspectral analysis of pine wilt disease to determine an optimal detection index. Forests 2018, 9, 115. [Google Scholar] [CrossRef]
- Wu, W.; Zhang, Z.; Zheng, L.; Han, C.; Wang, X.; Xu, J.; Wang, X. Research progress on the early monitoring of pine wilt disease using hyperspectral techniques. Sensors 2020, 20, 3729. [Google Scholar] [CrossRef]
- Xu, H.C.; Luo, Y.Q.; Zhang, T.T.; Shi, Y.J. Changes of reflectance spectra of pine needles in different stage after being infected by pine wood nematode. Spectrosc. Spectr. Anal. 2011, 31, 1352–1356. [Google Scholar] [CrossRef]
- Raffa, K.F.; Aukema, B.H.; Bentz, B.J.; Carroll, A.L.; Hicke, J.A.; Turner, M.G.; Romme, W.H. Cross-scale drivers of natural disturbances prone to anthropogenic amplification: The dynamics of bark beetle eruptions. BioScience 2008, 58, 501–517. [Google Scholar] [CrossRef]
- Kim, J.B.; Park, J.H.; Jo, M.H. A spectral characteristic analysis of damage pine wilt disease area in ikonos image. In Proceedings of the 23rd Asian Conference on Remote Sensing, Kathmandu, Nepal, 25–29 November 2002. [Google Scholar]
- White, J.C.; Wulder, M.A.; Brooks, D.; Reich, R.; Wheate, R.D. Detection of red attack stage mountain pine beetle infestation with high spatial resolution satellite imagery. Remote Sens. Environ. 2005, 96, 340–351. [Google Scholar] [CrossRef]
- Coops, N.C.; Johnson, M.; Wulder, M.A.; White, J.C. Assessment of QuickBird high spatial resolution imagery to detect red attack damage due to mountain pine beetle infestation. Remote Sens. Environ. 2006, 103, 67–80. [Google Scholar] [CrossRef]
- Wulder, M.A.; White, J.C.; Coops, N.C.; Butson, C.R. Multi-temporal analysis of high spatial resolution imagery for disturbance monitoring. Remote Sens. Environ. 2008, 112, 2729–2740. [Google Scholar] [CrossRef]
- Takenaka, Y.; Katoh, M.; Deng, S.; Cheung, K. Detecting forests damaged by pine wilt disease at the individual tree level using airborne laser data and worldview-2/3 images over two seasons. In International Archives of the Photogrammetry, Remote Sensing and Spatial Information Sciences; Copernicus Publications: Göttingen, Germany, 2017; Volume XLII-3/W3, pp. 181–184. [Google Scholar] [CrossRef]
- Dennison, P.E.; Brunelle, A.R.; Carter, V.A. Assessing canopy mortality during a mountain pine beetle outbreak using GeoEye-1 high spatial resolution satellite data. Remote Sens. Environ. 2010. [Google Scholar] [CrossRef]
- Hicke, J.A.; Logan, J. Mapping whitebark pine mortality caused by a mountain pine beetle outbreak with high spatial resolution satellite imagery. Int. J. Remote Sens. 2009, 30, 4427–4441. [Google Scholar] [CrossRef]
- Poona, N.K.; Ismail, R. Discriminating the occurrence of pitch canker infection in Pinus radiata forests using high spatial resolution QuickBird data and artificial neural networks. In Proceedings of the International Geoscience and Remote Sensing Symposium (IGARSS), Munich, Germany, 22–27 July 2012. [Google Scholar] [CrossRef]
- Sharma, R. Detection of Mountain Pine Beetle Infestations Using Landsat TM Tasseled Cap Transformations. Ph.D. Thesis, University of British Columbia, Vancouver, BC, Canada, 2001. [Google Scholar] [CrossRef]
- Skakun, R.S.; Wulder, M.A.; Franklin, S.E. Sensitivity of the thematic mapper enhanced wetness difference index to detect mountain pine beetle red-attack damage. Remote Sens. Environ. 2003, 86, 433–443. [Google Scholar] [CrossRef]
- Gower, S.T.; Kucharik, C.J.; Norman, J.M. Direct and indirect estimation of leaf area index, fAPAR, and net primary production of terrestrial ecosystems. Remote Sens. Environ. 1999, 70, 29–51. [Google Scholar] [CrossRef]
- Reed, D.E.; Ewers, B.E.; Pendall, E.; Frank, J.; Kelly, R. Bark beetle-induced tree mortality alters stand energy budgets due to water budget changes. Theor. Appl. Climatol. 2018, 131, 153–165. [Google Scholar] [CrossRef]
- Tao, H.; Li, C.; Cheng, C.; Jiang, L.; Hu, H. Progress in Remote Sensing Monitoring for Pine Wilt Disease Induced Tree Mortality: A Review. For. Res. 2020, 33, 172–183. [Google Scholar]
- Hart, S.J.; Veblen, T.T. Detection of spruce beetle-induced tree mortality using high- and medium-resolution remotely sensed imagery. Remote Sens. Environ. 2015, 168, 134–145. [Google Scholar] [CrossRef]
- Wulder, M.A.; Dymond, C.C.; White, J.C.; Leckie, D.G.; Carroll, A.L. Surveying mountain pine beetle damage of forests: A review of remote sensing opportunities. For. Ecol. Manag. 2006, 221, 1–41. [Google Scholar] [CrossRef]
- Planet Labs Inc. Planet Imagery and Archive. 2020. Available online: https://www.planet.com/products/planet-imagery/ (accessed on 17 January 2021).
- Planet Team. Planet Application Program Interface: In Space for Life on EARTH; Planet Team: San Francisco, CA, USA, 2017. [Google Scholar]
- Canty, M.J.; Nielsen, A.A. Automatic radiometric normalization of multitemporal satellite imagery with the iteratively re-weighted MAD transformation. Remote Sens. Environ. 2008, 112, 1025–1036. [Google Scholar] [CrossRef]
- Guo, Q.; Kelly, M.; Gong, P.; Liu, D. An object-based classification approach in mapping tree mortality using high spatial resolution imagery. GISci. Remote Sens. 2007, 44, 24–47. [Google Scholar] [CrossRef]
- Lee, S.H.; Cho, H.K. Detection of the pine trees damaged by pine wilt disease using high spatial remote sensing data. Int. Arch. Photogramm. Remote Sens. Spat. Inf. Sci. 2006, 36. [Google Scholar] [CrossRef]
- Hunt, E.R.; Cavigelli, M.; Daughtry, C.S.; McMurtrey, J.E.; Walthall, C.L. Evaluation of digital photography from model aircraft for remote sensing of crop biomass and nitrogen status. Precis. Agric. 2005, 6, 359–378. [Google Scholar] [CrossRef]
- Rouse, J.W.; Haas, R.H.; Schell, J.A.; Deering, D.W. Monitoring vegetation systems in the Great Plains with ERTS. NASA Spec. Publ. 1974, 351, 309. [Google Scholar]
- Afdhalia, F.; Supriatna, S.; Shidiq, I.P.A.; Manessa, M.D.M.; Ristya, Y. Detection of rice varieties based on spectral value data using UAV-based images. In Proceedings of the Sixth International Symposium on LAPAN-IPB Satellite, International Society for Optics and Photonics, Bogor, Indonesia, 24 December 2019; Volume 11372, p. 1137222. [Google Scholar]
- Bustamante, B.D.R.; Bustamante, S.G.H. Method of Anomalies Detection in Persea Americana Leaves with Thermal and NGRDI Imagery. In Proceedings of the 5th Brazilian Technology Symposium; Springer: Cham, Switzerland, 2021; pp. 287–296. [Google Scholar]
- Elazab, A.; Ordóñez, R.A.; Savin, R.; Slafer, G.A.; Araus, J.L. Detecting interactive effects of N fertilization and heat stress on maize productivity by remote sensing techniques. Eur. J. Agron. 2016, 73, 11–24. [Google Scholar] [CrossRef]
- Jannoura, R.; Brinkmann, K.; Uteau, D.; Bruns, C.; Joergensen, R.G. Monitoring of crop biomass using true colour aerial photographs taken from a remote controlled hexacopter. Biosyst. Eng. 2015, 129, 341–351. [Google Scholar] [CrossRef]
- Gonzalez, R.C.; Woods, R.E.; Eddins, S. Digital Image Processing with Matlab; Prentice-Hall: Hoboken, NJ, USA, 2004. [Google Scholar]
- Healey, S.P.; Cohen, W.B.; Yang, Z.; Krankina, O.N. Comparison of Tasseled Cap-based Landsat data structures for use in forest disturbance detection. Remote Sens. Environ. 2005, 97, 301–310. [Google Scholar] [CrossRef]
Publisher’s Note: MDPI stays neutral with regard to jurisdictional claims in published maps and institutional affiliations. |
© 2021 by the authors. Licensee MDPI, Basel, Switzerland. This article is an open access article distributed under the terms and conditions of the Creative Commons Attribution (CC BY) license (https://creativecommons.org/licenses/by/4.0/).