Abstract
Northern protected areas guard against habitat and species loss but are themselves highly vulnerable to environmental change due to their fixed spatial boundaries. In the low Arctic, Torngat Mountains National Park (TMNP) of Canada, widespread greening has recently occurred alongside warming temperatures and regional declines in caribou. Little is known, however, about how biophysical controls mediate plant responses to climate warming, and available observational data are limited in temporal and spatial scope. In this study, we investigated the drivers of land cover change for the 9700 km2 extent of the park using satellite remote sensing and geostatistical modelling. Random forest classification was used to hindcast and simulate land cover change for four different land cover types from 1985 to 2019 with topographic and surface reflectance imagery (Landsat archive). The resulting land cover maps, in addition to topographic and biotic variables, were then used to predict where future shrub expansion is likely to occur using a binomial regression framework. Land cover hindcasts showed a 235% increase in shrub and a 105% increase in wet vegetation cover from 1985/89 to 2015/19. Shrub cover was highly persistent and displaced wet vegetation in southern, low-elevation areas, whereas wet vegetation expanded to formerly dry, mid-elevations. The predictive model identified both biotic (initial cover class, number of surrounding shrub neighbors), and topographic variables (elevation, latitude, and distance to the coast) as strong predictors of future shrub expansion. A further 51% increase in shrub cover is expected by 2039/43 relative to 2014 reference data. Establishing long-term monitoring plots within TMNP in areas where rapid vegetation change is predicted to occur will help to validate remote sensing observations and will improve our understanding of the consequences of change for biotic and abiotic components of the tundra ecosystem, including important cultural keystone species.
1. Introduction
Arctic plant communities are experiencing significant modification due to recent climate change [1,2], which is altering the composition, distribution, and productivity of many tundra plants [3,4,5]. Because of the close ties between tundra vegetation and numerous biological [6,7], geophysical [8,9,10], and cultural systems [11,12], studying changes in plant community dynamics across a range of Arctic environments is critical for predicting future impacts of environmental change. Identifying the drivers of past changes in plant communities is also essential for guiding long-term monitoring, habitat vulnerability assessments, and the management of cultural keystone species in northern protected areas.
Perhaps the most striking recent change in Arctic plant communities has been the increase in shrub dominance that has occurred in many tundra landscapes. Shrubification, referring to increases in the abundance, cover, and biomass of shrubs [13], has been reported through Inuit knowledge sharing [14,15], remote sensing studies [16,17,18], and field-based observations [19,20]. Warming air temperatures can be viewed as a top-down driver of shrubification [13,21], with mediating factors such as herbivory, soil moisture, nutrient availability, and landscape position contributing to variability in the response of plant communities [21,22,23,24]. Whereas shrubification is an obvious indicator of the realized impacts of climate change, shifts in the distribution and abundance of tundra plants that are more visually subtle (i.e., low statured plants and ground cover) can also have wide-reaching effects over large areas. One approach to gaining a temporally and spatially rich perspective on tundra vegetation change is to combine remote sensing techniques with in situ data collection. Doing so can help to overcome our limited ability to understand mechanistic processes from remote sensing imagery [25] and the logistical challenges of conducting extensive field campaigns in remote areas of the North [26].
In the eastern Canadian low Arctic, the Torngat Mountains of Nunatsiavut and Nunavik have undergone widespread environmental change in recent years, including changing permafrost [27] and glacier thinning [28,29], declines in caribou populations [30], and increased shrub establishment and growth [16,31]. In 2005, Torngat Mountains National Park Reserve (Tongait KakKasuangita SilakKijapvinga; designated Torngat Mountains National Park in 2008; TMNP) was officially established with the intent of protecting the unique natural history and culture of the region [32]. Northern protected areas, such as TMNP, hold significant ecological value by offering protection against human drivers of habitat and species loss, and are expected to serve as important refuges for plants and animals moving northwards and to higher elevations due the impacts of climate change [33,34]. Due to their fixed spatial boundaries, however, protected areas are themselves highly vulnerable to changing environmental conditions and many will see shifts in biome or land cover types in the coming decades [35,36]. Ecological inventories developed through field-based data collection and remote sensing are an essential tool for managing protected areas and culturally important species, and provide information about baseline conditions against which to measure on-going change [37]. Valuable plot-scale information about vegetation change is available in southern TMNP [31]; however, this field site includes only a small portion of the range of conditions represented across the park’s topographically diverse 9700 km2, and little is known about contemporary plant community dynamics in central and northern TMNP.
The goal of this research is to extend our knowledge of vegetation dynamics into the past and across a larger spatial expanse to support future research and management activities in TMNP and surrounding areas, and to generate baseline information about critical habitat for Torngat Mountain caribou. The approach used here has wide applicability for monitoring land cover change in Arctic tundra environments elsewhere.
2. Methods
2.1. Study Area
Torngat Mountains National Park of Canada (TMNP; Tongait KakKasuangita SilakKijapvinga in Inuttitut) is located in an overlapping area of the Nunatsiavut and Nunavik Inuit land claims in northern Labrador (Figure 1). It was established as a National Park Reserve when the Labrador Inuit Land Claim was enacted in 2005 and became a National Park in 2008 when the Nunavik Inuit Land Claim came into effect; the park is intended to represent and protect the Northern Labrador Mountains natural region [32]. Spanning over 9700 km2, the park is cooperatively managed with Inuit from Nunatsiavut and Nunavik [38], and the area has been a homeland to modern Inuit and their predecessors for millennia.
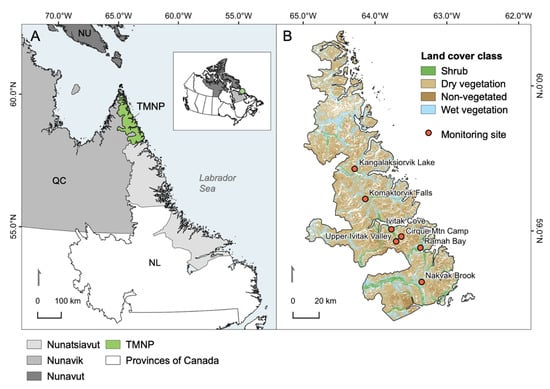
Figure 1.
(A) Location of Torngat Mountains National Park (TMNP) in northern Nunatsiavut and northeastern Nunavik. The green circle on the inset map of Canada shows the location of the park. (B) Land cover classes (2014) and locations of existing temperature monitoring sites in TMNP.
The Torngat Mountains are the southernmost extent of the Arctic Cordillera in Canada. The area is topographically complex and the highest elevations are encountered in the Selamiut Range in the central portion of the park, where the tallest peak, Mount Caubvick, reaches 1652 m a.s.l. The park spans more than 200 km of latitude and relief declines to the north; low elevation areas are characterized by fiords that extend far inland from the coast, deep river valleys, and a complex coastline that includes an archipelago of hundreds of nearshore islands. The regional climate is strongly influenced by the Labrador current [39], which induces foggy and cool maritime conditions throughout the summer. Formation of landfast sea ice along the entire northern Labrador coastline results in cold, continental conditions during winter. The harsh climate and slow soil development have resulted in sparse vegetation cover throughout much of the park. TMNP is situated just north and east of the treeline; however, evergreen and deciduous broadleaf shrubs are common at low elevation on sheltered slopes [40] and along riparian channels [41].
The broader Nunatsiavut and Nunavik regions (Figure 1A) have undergone appreciable environmental change in recent decades. Mean winter and summer temperatures have increased by 2.0 °C/decade and 0.5 °C/decade respectively (1987–2016), and annual temperatures are expected to warm by a further 2–8 °C by the end of the century [42]. Changes in precipitation are difficult to detect, but summer precipitation has generally increased whereas annual snowfall has declined throughout northern Nunatsiavut and Nunavik (1980–2014). In the future, a wetter climate is anticipated as a result of increased rainfall [42]. Climate change in the region has and will continue to have various direct and indirect impacts for permafrost [27], animal and plant populations [41,43,44], and vegetation structure and cover [16,31,45].
2.2. General Approach
This study employed remote sensing and statistical modelling to: 1) detect land cover change in TMNP from 1985 to 2019, and 2) predict where shrub expansion is likely to occur in the future (2039/43 time period). Relationships between contemporary vegetation classes and surface reflectance/topographic variables were modelled and applied to past Landsat composites to hindcast land cover changes through time. Spatial and temporal changes in vegetation type and abundance were then analyzed in the context of biogeophysical controls. Finally, the probabilities of pixels transitioning to shrub dominance were forecast for the 2039/43 time period by extending a model of past (1985/89 to 2014) transitions to shrub dominance into the future.
2.3. Preparation of Spatial Data
2.3.1. Land Cover Map
The reference dataset of contemporary (2014) land cover for TMNP was a 19 class ecotype map (5 m resolution) generated by Ponomarenko and Quirouette [46]. The ecotype map was created from a combination SPOT5 imagery collected in 2008 and 2009, and field validations in 2008. Although the 2008 ecotype map [46] predates the 2014 Landsat composites/indices (described below) by six years, 2014 was the nearest period with sufficient Landsat coverage for modelling due to persistent summer cloud cover. The map was reclassified from 19 ecotypes into four generalized land cover classes including shrub, dry vegetation, non-vegetated, and wet vegetation, with all other ecotypes excluded from analysis (Table 1). Combining ecotypes reduces the level of detail available for different vegetation types; however, the generalized classes were necessary for reducing model complexity in later steps of our analyses. We note that reclassified pixels in the shrub class, which were of particular interest, predominantly represent the low-medium shrub category (58.7% of shrub ecotype pixels; Table 1; including Salix spp., Betula glandulosa, Rhododendron tomentosum), with dwarf shrubs (including Vaccinium vitis-idaea, V. uliginosum, Empetrum nigrum, Rhododendron lapponicum, dwarf species of Salix, Betula glandulosa) and medium-tall shrubs (including Salix spp., Betula glandulosa, Alnus alnobetula) making up smaller proportions of the total (see Table 1). The reclassified ecotype map (hereafter the “land cover raster”) was reprojected (“warp” tool in QGIS) and aggregated (“r.resamp.stats” in GRASS) to match the projection and 30 m resolution of Landsat imagery. The mode of the 36 pixels (5 m res.) within each 30 m grid cell was used during aggregation and the “align” tool (nearest neighbor interpolation) was applied to ensure alignment with corresponding Landsat pixels.

Table 1.
Reclassification and percent composition of the original 19 ecotypes in four representative land cover classes.
The dry vegetation class was the dominant cover type in the reclassified 2014 land cover raster (61.3% of the total pixels). Wet and non-vegetated pixels were the next most abundant at 18.8% and 13.5%, respectively. The shrub cover class was the least common with 6.5% of the total pixels.
2.3.2. Landsat Imagery
Annual composite images of the study area were generated for years 1985 to 2019 from USGS Landsat Surface Reflectance products (Tier 1; Landsat 5 ETM, 7 ETM+, and 8 OLI). Due to the large latitudinal, climatic, and phenological variations across TMNP, it was expected that differences in growing season may alter the peak greening period in southern versus northern portions of the park. Annual duration of peak greening (seasonal changes in the normalized difference vegetation index; NDVI) was thus evaluated for southern, central, and northern TMNP using time series of 250 m resolution Terra MODIS data from 2014 (MOD13Q1.006; AppEEARS web application; [47]). Peak annual greening ranged from three months in the south (approx. June 15 to September 15) to only one month in the north (approx. July 15 to August 15). The period from July 1 to September 1 was therefore retained for acquiring Landsat imagery for land cover hindcasting and model evaluation.
Landsat image collections for the time period of interest (1 July to 1 September 1985 to 2019) were queried in the Google Earth Engine platform [48] and underwent an automated quality assurance procedure that screened pixels for sensor saturation (likely indicative of snow or water), cloud cover (>80%), and atmospheric haze and opacity. Images from Landsat 5 and 8 were cross-calibrated to a Landsat 7 equivalent using the coefficients and methods described in Pironkova et al. [49]. Composites containing red, green, blue color (RGB), shortwave infrared (SWIR), and near infrared (NIR) bands were generated for each year using the median values of the remaining unmasked pixels. The normalized difference vegetation index (NDVI = NIR − R/NIR + R) and normalized difference water index (NDWI = NIR − SWIR/NIR + SWIR) were later calculated for each composite image in R [50]. Inspection of the annual composites showed persistent data gaps due to cloud cover and/or late lying snow within individual summers, therefore composites were binned into 5-year averages (1985/89, 1990/94, etc.) for analysis. Data availability within the park boundary was >80% in all binned composites (mean 86.3%; SD = 4.9%) and exceeded 90% in the 2010/14 and 2015/19 bins (coincident with the launch Landsat 8 in 2013).
2.3.3. Topographic Rasters
A series of additional rasters representing topographic characteristics were prepared to inform the classification of land cover types. Slope, aspect, and latitude rasters were generated in QGIS from the Government of Canada’s Canadian Digital Elevation Model [51] which was reprojected and aggregated to a 30 m resolution (bilinear interpolation). Aspect was folded about the northeast–southwest line to rescale values from 0° to 180° and address the circularity of compass measurements [52]. In the resulting raster, large values indicate the warmest (southwest-facing) and low values represent the coolest aspect (northeast-facing). A distance to the coast raster was also generated from a rasterized shapefile of the coastal boundaries of Québec and Labrador.
2.4. Hindcasting (1985/2014) and Simulating (2015/2019) Land Cover Using Random Forest Classification
Land cover rasters were generated using summer 2014 Landsat composites/indices (red, green, blue, SWIR, NIR, NDVI, NDWI) and topographic variables (aspect, slope, latitude, elevation, distance to coast) in a pixel-based random forest classification algorithm (see workflow in Figure S1). The random forest algorithm was developed using the “ranger” option from the “train” function (“caret” package; [53]) in R. Preliminary analyses on a subset of the data showed that an “mtry” value (predictors sampled for splitting at each node) of 2 and minimum node size of 1 produced the best models, and that classification errors plateaued rapidly when random forest iterations contained >100 trees. These parameters (mtry = 2, min.node.size = 1, num.trees = 300) were thus adopted for modelling throughout TMNP. The random forest algorithm was trained on a random subset of 50% of the data with the remaining 50% used for model evaluation. Predictor variable influence on model accuracy was qualitatively assessed with a variable importance plot. Overall classification accuracy was determined from test-set predictions using a confusion matrix and receiver operating characteristic (ROC) curves.
Hindcasting (1985/89 to 2010/14) and simulating (2015/19) land cover classes was achieved by applying the random forest algorithm to the binned Landsat composites (topographic variables remained constant), resulting in seven land cover intervals (1985/89 to 2015/19). These served as the basis for detecting land cover changes through time.
2.5. Change Detection
Changes in land cover classes were first assessed by comparing the output rasters from 1985/89 and 2015/19. Missing pixels were masked across rasters to ensure comparisons occurred over a common area. Next, the frequencies of different transitions in land cover classes over time (e.g., the proportion of 1985/89 pixels that transitioned to shrub, dry vegetation, wet vegetation, or non-vegetated pixels from each of four initial land cover types; 16 possible outcomes) were calculated. Temporal trends in the proportional cover of each land class were assessed by calculating the proportion of each land cover type in the five-year bins relative to the 1985/89 baseline, with missing pixels masked across all seven land cover layers to ensure comparability.
To investigate whether shrubs have shifted to higher elevations or latitudes over time, the elevations and latitudes of “new” shrub pixels were determined for rasters from 1990/94 to 2015/19. Shrub pixels from the binned land cover rasters were isolated from other cover types, and pixels corresponding to shrubs in the previous five-year bin were masked (thus, data from the earliest bin, 1985/89, are not available). The median, and 25th and 75th quantiles of elevation and latitude, were then determined for the new shrub pixels in each raster.
Finally, proportional changes in land cover class were evaluated for seven sites where hourly ground surface and air temperatures are currently being monitored, providing local-scale snap-shots of vegetation change (Figure 1B). The proportion of each land cover class was determined from three binned land cover rasters (1985/89, 2000/05, 2015/19) for the 10 km2 surrounding the sites. These sites have the potential to be used for validating remotely sensed data and for establishing long-term vegetation monitoring in the future.
2.6. Predicting Future Shrub Expansion
To identify potential hotspots of future shrub expansion, a set of candidate binomial models were assessed to predict the likelihoods of non-shrub pixels transitioning to shrub cover in the future (see workflow schematic in Figure S2). The approach follows that of Lemay et al. [54] who used both binomial and multinomial regression to predict areas of shrub change in Nunavik, Québec. Their results showed that although a binomial shrub change model ignores other potential transition types, its predictive ability was similar to that of more complex multinomial models. Our approach similarly used topographic and biotic variables, derived from the 1985/89, “time1”, land cover raster, to parameterize the model and predict shrub dominance in 2014, “time2”. Potential topographic predictors included elevation (m above sea level), folded aspect, a quadratic term for slope (to allow for the possibility that moderate slopes could be more favorable than very steep or shallow slopes), the additive and interactive effects of slope and aspect, latitude, and the distance to the coast. The candidate biotic predictors included rasters for land cover class (categorical; land cover class of a pixel at time1), neighboring shrubs (numeric; number of shrub class pixels within a 24-pixel search window of the focal pixel at time1), and shrub edge (binary; whether the focal pixel was adjacent to a shrub pixel at time1, determined from an 8-pixel search window). From an ecological perspective, it was expected that land cover types would differ in their likelihood of becoming shrub dominant at time2. We also expected that pixels adjacent to existing shrubs would be more likely to transition to shrub dominance in the future due to higher potential for seed production and dispersal or clonal growth from proximal shrubs. Sites in the vicinity of extant shrubs could also have an inherently higher likelihood of being suitable shrub habitat due to physical changes associated with shrub structure (e.g., [55]). The 2014 (time2) shrub cover raster was split into a training set containing 50% of the data to parameterize the candidate models and a test set to evaluate the accuracy of the final model. The potential influence of spatial autocorrelation on model parameterization was addressed by selecting every other pixel for the training set and the remainder for the test set. As in Lemay et al. [54], pixels that were themselves shrub dominant at time1 were excluded from the analysis because it was assumed that they would still be shrub dominant at time2 (transition probability of 1); this tendency was confirmed by our analyses of land cover transitions that showed shrub pixels to be highly persistent over time (see Results for more details).
Multimodel inference was employed to select the most suitable predictive model from a suite of candidate models of varying complexity. Several constraints were imposed on the possible combinations of predictor variables to limit the number of comparisons [54]. Land cover class was included in all models, whereas either shrub edge or the number of shrub neighbors was included. Latitude and distance to the coast were always included together in candidate models, and slope and aspect (in the form of “slope + aspect + slope × aspect + slope2”) were likewise grouped. These conditions resulted in 24 candidate models (see full list of models in Table S1) that were evaluated using an information theoretic approach (“MuMIn” package in R; [56]). The most suitable model was selected using Akaike’s Information Criterion (lowest AIC); model averaging using Akaike’s weight can be a means of increasing the robustness of the predictions by weighting the parameters of the top performing models [57], but this was not required because the top ranked model had an Akaike weight of 1 (i.e., little additional information would be gained by model averaging). The selected model was then applied to the test-set to evaluate model accuracy against the distribution of shrub class pixels from the 2014 land cover raster; shrub dominant pixels at time2 were considered those with a probability ≥0.50 of becoming shrub dominant given their associated topographic and biotic characteristics.
In the final step, the parameterized binomial model was extended to determine the likelihood of pixels transitioning to shrub dominance one time step into the future (2039/43; time3). The temporal span of predictions (2014 to 2039/43; 27 years) was determined from the length of time between the midpoint of the earliest available Landsat composites (1985/89) and the reference land cover imagery (2014). Beyond these practical considerations, the timespan has the benefit of informing near-term research planning and park management and is relevant to the lifetimes of people using the area today. Rasters representing the same biotic variables as for time1 were generated for time2 from the 2014 land cover raster, whereas topographic variables were assumed to remain constant. Once again, pixels in the shrub cover class (now for time2) were masked from the predictor rasters. A raster depicting shrub transition probabilities was created from the model output.
3. Results
3.1. Random Forest Algorithm
The overall classification accuracy of the random forest algorithm (test-set data of 2014 land cover classes) was 81.1% and the area under the ROC curves was 0.77 (average of the four classes). NDVI, NIR, and NDWI had the highest relative importance for improving the classification accuracy of the random forest algorithm, whereas SWIR, slope, and aspect were of lowest importance (Figure S3). The balanced classification accuracies by land cover type varied from 74.2% for non-vegetated pixels to 85.4% for shrub pixels (Table 2).
Table 2.
Confusion matrix showing the number of actual vs. predicted pixels in each vegetation class for the test-set data. The bolded numbers indicate the number of correctly classified pixels in each class. The bottom row reports the balanced classification accuracy for each land cover type.
3.2. Temporal Changes in Land Cover Class
Here, temporal changes in land cover are described by cover type. Point-in-time changes were determined from the frequency of class transitions between the 1985/89 binned raster and the 2014 reference land cover raster. Temporal trends were determined by comparing the number of pixels of each cover type in each 5-year bin relative to the 1985/89 baseline raster.
3.2.1. Shrub Cover Class
The vast majority (97.3%) of shrub-dominant pixels in the 1985/89 raster remained so in 2015/19, suggesting that transitions from shrub dominance to other vegetation types rarely occurred (<3% of the time; Figure 2). Notably, 28.8% of pixels in the wet vegetation class in 1985/89 transitioned to shrub cover in 2015/19, compared to only 1.4% and 3.0% of dry and non-vegetated pixels. When common pixels were compared across the seven binned composites (Figure 3), shrub cover underwent the largest proportional change over time, with a 234.7% increase in the number of shrub-dominant pixels by 2015/19 relative to the 1985/89 composite. We note that shrubs represent the smallest of the four cover classes, and the change represents an increase from 2.2% to 7.1% of the total land cover pixels with available data. The increase in shrub cover occurred rapidly from 1990/94 onwards (Figure 3).
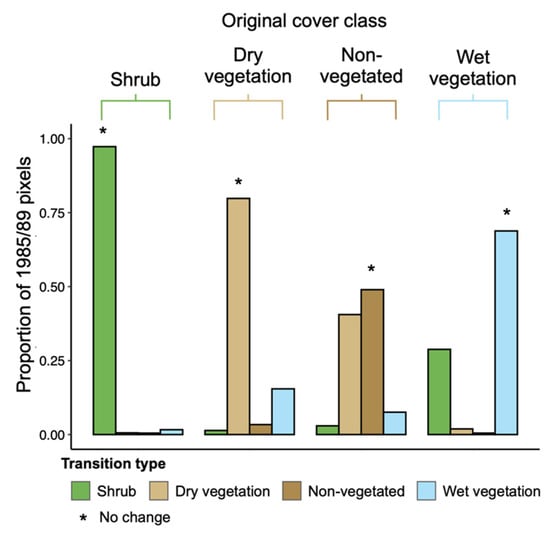
Figure 2.
Proportion of pixels transitioning between land cover classes from 1985/89 to 2015/19. Bars are grouped by the original (1985/89) cover class and transitions are indicated by colors; ‘*’ indicates the case where pixels remained in the same cover class between time periods.
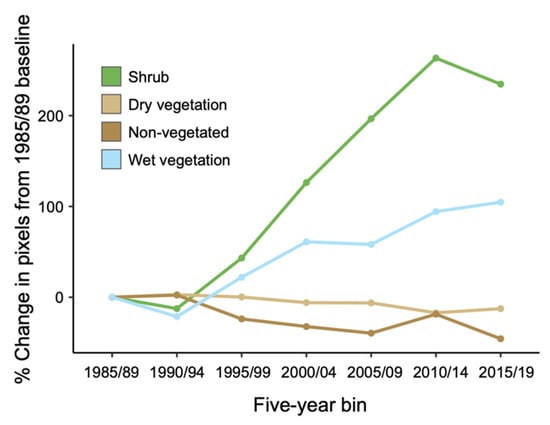
Figure 3.
Percent change in the abundance of pixels in each land cover class relative to 1985/89 values.
3.2.2. Dry Vegetation Class
Most pixels identified as dry vegetation in 1985/89 (79.8%) remained in that cover class in 2015/19 (Figure 2). The largest between-class transition was to the wet vegetation class (15.5% of pixels). Many non-vegetated pixels in 1985/89 became dominated by dry vegetation in 2015/19 (40.6% of pixels). There was little temporal change in the percentage of dry vegetation cover (Figure 3) due to the balance of pixels gained from the non-vegetated category and pixels lost to the wet vegetation category, and the large number of pixels in the dry vegetation category (i.e., a larger absolute change in the number of pixels required to cause a change in percent cover).
3.2.3. Non-Vegetated Class
About half of the non-vegetated pixels in 1985/89 remained so in 2015/19 (49.0%). As described above, many non-vegetated pixels in the earlier time period became dominated by dry vegetation by 2015/19 (40.6%). There was a general decline in the abundance of non-vegetated pixels over time, with 45.7% fewer in the 2015/19 raster relative to 1985/89.
3.2.4. Wet Vegetation Class
The wet vegetation class saw 28.8% of pixels transition to shrub cover by 2015/19 while 69.8% remained unchanged. Transitions to other land cover types represented only a small portion of the total outcomes. By 2015/19, wet vegetation had increased by 104.7% relative to 1985/89, with most of the gains coming from the dry vegetation class. As with changes in shrub cover, the increase in wet vegetation primarily occurred after 1990/94.
3.3. Spatial Changes in Land Cover Class
Comparisons of the distribution of shrub-dominant pixels between 1985/89 and 2015/19 showed that shrubs generally tended to expand in areas adjacent to existing shrub patches, particularly in drainage slopes and valley bottoms (Figure 4A). Most of the shrub gain in 2015/19 occurred in the southern half of the park, and relatively little expansion occurred in the top third. Although there was significant variability across elevations and latitudes, the median elevation of new shrub establishment appears to be increasing over time (Figure 5A). The median latitudes of new shrub pixels showed no temporal trend but the extreme limit of new shrub pixels showed a clear latitudinal increase from 2005 to 2019 (Figure 5B).
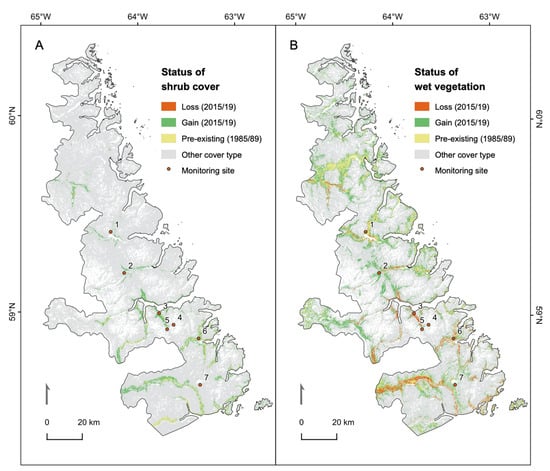
Figure 4.
Maps depicting changes in shrub (A) and wet vegetation (B) land cover classes between 1985/89 and 2015/19. In (B), most pixels in the “loss” category correspond to areas of shrub gain in (A). Monitoring sites: 1—Kangalaksiorvik Lake; 2—Komaktorvik Falls; 3—Ivitak Cove; 4—Cirque Mtn. Camp; 5—Upper Ivitak Valley; 6—Ramah Bay; 7—Nakvak Brook.
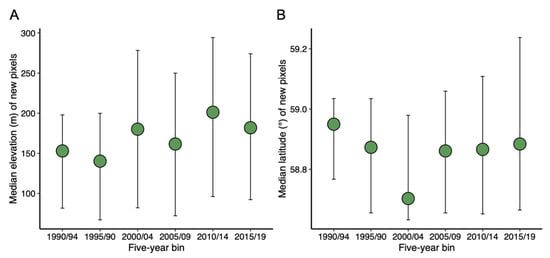
Figure 5.
Median (green dot) and 25th and 75th percentiles (bars) of the elevation (A) and latitude (B) of new shrub pixels in binned land cover rasters. New shrub pixels were determined by masking (removing) the shrub pixels present in the previous five-year raster (thus, 1985/89 not shown).
In general, gains in wet vegetation tended to occur at mid-elevations near and adjacent to drainage areas. In the southern portion of the park, extensive loss of wet vegetation occurred between the two time steps (Figure 4). By comparing the area of wet vegetation loss (red in Figure 4B) to that of shrub gain (green in Figure 4A), it is clear that most of this loss represents a transition to shrub dominance in 2015/19. As with gains in shrub cover, transitions to dry vegetation (mainly from the non-vegetated class) tended to occur in the south of the park. Maps of gains and losses of dry and non-vegetated pixels can be viewed in Figure S4.
3.4. Predicting Changes in Shrub Cover
Model comparisons revealed the model containing all predictor variables except shrub edge to be the best model for predicting shrub probabilities (Tables S1 and S2). When applied to the test set, the model accuracy was 95.6% and the true positive rate of the shrub class was 71.3%. The very high overall model accuracy in part reflects the large number of non-shrub pixels in the dataset that were correctly classified. The AUC of the test-set ROC curve was 0.93.
The model output showed elevation, latitude, wet vegetation, and distance from the coast to be the most influential predictors (Table 3). The probability of a pixel transitioning to shrub dominance decreased with elevation and latitude (Figure 6) and was higher inland than near the coast. Shrub expansion was also more likely for wet than for non-vegetated or dry vegetation pixels (Table 3; Figure 6). The number of shrub pixels in the neighborhood had a positive effect on the likelihood of a focal pixel also being a shrub. The relatively smaller parameter estimates and z-values for slope and aspect indicate that the influence of these topographic variables on shrub probabilities was more subtle.
Table 3.
Model output of the selected binomial regression model in which the probability of a pixel being shrub dominant at time2 (2014) was estimated from topographic and biotic variables at time1 (1985/89).
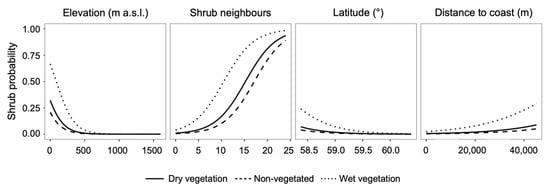
Figure 6.
Modelled probabilities of dry vegetation, non-vegetated, and wet vegetation pixels undergoing a state transition to the shrub cover class based on changes in the four most influential variables in the binomial model. In each panel, the relationship between shrub probabilities and the predictor variable is shown with other model variables set to their average values. Model confidence intervals are not visible at this scale because they are very narrow, likely due to the large size of the dataset.
The shrub probability estimates showed that a 50.9% increase in the extent of shrub cover is expected by 2039/41 relative to 2014. Expansion is more likely to occur near areas currently occupied by shrub patches (Figure 7), suggesting that local habitat infilling will be a dominant mode of shrub expansion. The higher likelihood of wet vegetation transitioning to shrub cover in the binomial model and the presence of extensive shrub patches in river valleys indicates that soil moisture has historically been an important determinant for shrub colonization. Predictions for 2039/43 show that latitudinally, shrub expansion is more likely to occur in the southern two-thirds of the park than in the north. In the northern third, new shrub colonization is most probable in low elevation areas currently occupied by wet vegetation, but at lower probabilities overall.
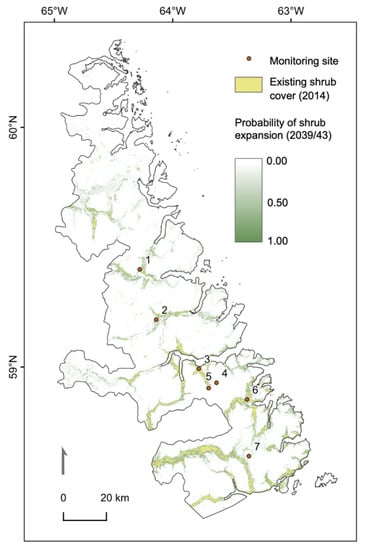
Figure 7.
Extent of shrub class pixels in 2014 (time2; yellow) and probability of pixels becoming shrub dominant by 2039/43 (time3; green scale). Monitoring sites: 1—Kangalaksiorvik Lake; 2—Komaktorvik Falls; 3—Ivitak Cove; 4—Cirque Mtn. Camp; 5—Upper Ivitak Valley; 6—Ramah Bay; 7—Nakvak Brook.
3.5. Vegetation Change at Existing Monitoring Sites
Temperature monitoring stations are currently located in the southern two-thirds of the park (Figure 1B and Figure 8) due to the higher cost and logistical challenges accessing the northern portion of the park. Temporal changes in the proportions of land cover classes were variable across the seven monitoring sites (Figure 8). A large increase in the proportion of shrub cover occurred at Ivitak Cove from 1985/89 to 2015/19, whereas nearby Upper Ivitak Valley and Cirque Mountain Camp have seen an increase in dry vegetation but not shrub cover. These findings highlight the importance of elevation and wet vegetation cover as predictors of shrub expansion; Ivitak Cove is a low valley site (36 m a.s.l.) with ample wet vegetation cover in the 1985/89 raster. In contrast, Upper Ivitak Valley and Cirque Mountain Camp are both located >450 m a.s.l. and were initially dominated by dry and non-vegetated cover (i.e., less susceptible to shrub expansion). Full location details of monitoring sites are available in Table S3.
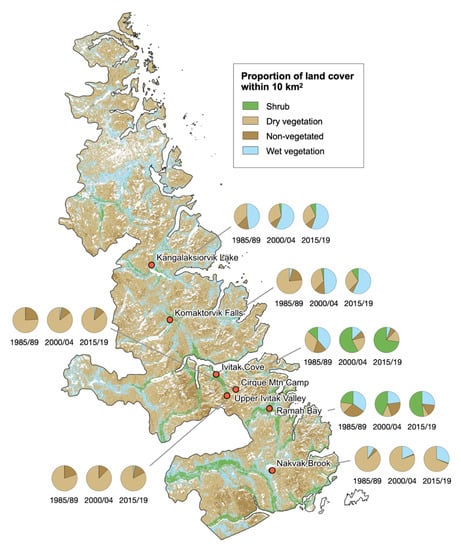
Figure 8.
Changes in the proportions of the four land cover classes within 10 km2 of existing monitoring sites in Torngat Mountains National Park. Basemap shows the distribution of land cover classes in the 2014 reference layer.
Shrub expansion has also been substantial further south at Ramah Bay. About a quarter of pixels within the monitoring area were shrub dominant in 1985/89, increasing to about one half by 2015/19. This change is supported by a series of repeat photographs taken near the monitoring site (Figure S5). Finally, the southernmost site at Nakvak Brook, located on a plateau at 506 m a.s.l., has shown little increase in shrub cover, in contrast with the nearby river valley. The proportion of wet vegetation cover has increased over time, however, indicating that the area could become more suitable for shrub expansion in the future.
4. Discussion
4.1. Temporal and Spatial Changes in Land Cover
The shrub and wet vegetation classes saw the most significant gains in spatial extent from 1985/89 to 2015/19. Increased shrub cover and growth have previously been documented in the region [14,16,31,58,59] and have generally been attributed to regional warming [16,31,60]. The timing and spatial scope of the changes observed here similarly suggest that climate has been an important control on vegetation change throughout TMNP; widespread shrub expansion began in the mid-1990s, corresponding to a period of renewed warming and increased precipitation in the Torngat Mountains [31,42]. As would be expected under a warming climate scenario, shrub expansion also appears to be accelerating at higher elevations and (to a lesser degree) higher latitudes in recent decades. It is important to note, however, that a substantial decline in the size of the George River caribou population, whose migratory range overlaps TMNP, occurred over the same period as temperature warming [30]. Indeed, the interacting effects of an increasingly favorable climate and reduced herbivory may, at least in part, explain the relatively high rate of shrub expansion that has occurred in the Torngat Mountains relative to other areas of the North American Arctic [16,45].
In addition to increasing spatial coverage, shrub class pixels were also highly persistent on the landscape, with few from the early time period transitioning to other land cover types (<3%). Lemay et al. [54] similarly observed that only a small portion (14%) of shrub dominant pixels underwent a change in cover type from 1990/94 to 2010 in Nunavik, Canada. Examining the life history traits of the major shrub taxa (Salix, Alnus, and Betula) reveals several possible explanations for their persistence. Many shrub species are relatively long-lived compared to other arctic plants (decades to centuries; [61] and references therein) prolonging their lifespan by surviving underground and spreading asexually through layering during poor conditions [62]. With their comparatively large stature and ability to quickly respond to improved growing conditions through shoot extension, low to tall shrubs are also positioned to be strong competitors for space and resources while altering microhabitat conditions such as light availability [63], snow distribution [64], and soil conditions [65,66,67]. The rapid increase in shrub cover and persistence of pixels suggests that shrub dominant areas in TMNP are unlikely to transition to other cover types in the short term, barring major disturbances (e.g., via wildfire, a strong increase in herbivory, or flooding).
A notable finding of the transition analysis was that most of the gain in the shrub class took place in low-elevation riparian areas from pixels previously classified as wet vegetation. These changes are likely driven by expansion of the low-medium shrub class given their relatively large abundance (e.g., compared to dwarf shrubs) and tendency to occupy valley bottoms in the original ecotype raster. Increased shrub cover in riparian and floodplain habitats has also occurred in western North America [68,69,70] as these areas seem to possess favorable hydrological characteristics. The role of soil moisture as a mediator of shrub expansion [23,68], productivity [24], and growth [9,20] has been widely reported, with the positive effects of warming temperatures often being greater where moisture is non-limiting. At the same time, highly saturated soils can also be unfavorable for some shrubs [70,71], indicating that expansion is more likely where moisture requirements are met but not greatly exceeded. It is thus possible that the conversion of wet vegetation to shrub cover observed in TMNP was initially facilitated by surface drying, which can promote shrub expansion in wet areas [72]. Surface drying can be caused by increased evaporation due to warming, soil drainage from permafrost thaw, or reduced soil moisture caused by earlier snow melt. Such changes can negatively impact waterfowl species whose wetland habitat can depend on the presence of frozen ground [73]. Mid-summer soil moisture in wet areas in the south of TMNP has been observed to decline in recent years [31], although the underlying mechanisms and the associated impacts on plant communities require further study.
The consequences of shrub expansion have justifiably received significant attention in the literature in recent years; however, transitions from dry to wet land cover are also a noteworthy climate change impact because they signal a change in hydrological processes with broader implications for ecosystem functioning [74] and wildlife [73]. Our analysis of historical land cover change showed a net increase in the extent of wet vegetation over time, with most of the gains coming from the dry vegetation class at mid-elevations. Recent climate change impacts in TMNP have included increased summer precipitation [42], permafrost degradation [27], and glacial melt [28,29], which together may have contributed to the expansion of wet vegetation (moist sedge and fen ecotypes) at higher elevations. Transitions to thermokarst/wetland habitat can arise when active layer deepening occurs atop poor subsurface drainage (e.g., impermeable ground; presence of permafrost at depth) and causes ponding [75]. This has been observed in western Canada where forest loss has resulted from waterlogging caused by permafrost thaw and associated ground surface subsidence [76]. Field validations are needed to determine whether similar processes are occurring in TMNP; however, in the only field-based observations of permafrost conditions available, Davis et al. [31] found active layer depth to be greater in areas of high surface wetness and a reduced probability of permafrost under pooled surface water relative to dry sites.
Changes in dry and non-vegetated cover were proportionally smaller than for the shrub or wet vegetation classes, possibly due to the dry, shallow soils, rocky substrates, and/or more extreme environments found in these cover classes that would restrict many plant species. The gains in dry vegetation that did occur tended to originate from non-vegetated pixels in the southern half of the park, and importantly may be contributing to the general greening trend observed over the past three decades [16]. Future field validations would help to clarify the dominant life forms that have become establishing in these areas.
4.2. Future Shrub Expansion in TMNP
The predictive model revealed shrub expansion to be regulated by a combination of biotic and physical variables. The positive effect of the shrub neighbor variable in the model signals that expansion is more likely to occur near existing shrub patches. This tendency has been observed in tundra environments elsewhere through repeat photography [77] and statistical modelling [54], and could be caused by the higher reproductive potential and/or improved growing conditions near areas that are already shrub-dominant. Spread from existing shrub patches may also be enhanced through a positive feedback with snow cover [13,78], because snow that becomes trapped in shrub branches provides protection from harsh winter conditions and moderates soil moisture and temperature regimes [79]. Spatial correlation in properties such as microclimate and soil conditions could also mean that the environment is more likely to be favorable for shrub expansion near existing shrub habitat.
Topographic and geographic variables have also been shown to moderate changes in shrub cover (e.g., [21,80,81]), because landscape position serves as a proxy for factors that influence plant species composition. In TMNP, we found that elevation and latitude were inversely related to the probability of shrub expansion, whereas probabilities increased with distance from the coast. Low-lying, continental areas in the south of the park likely offer warmer and more sheltered environments as temperatures decline and wind speeds increase at higher elevations and to the north. Peak greening in the northern portion of TMNP was found to last only about one month, which could be related to enhanced exposure to cold, coastal conditions at the tip of Nunavik and Nunatsiavut, and may constrain further shrub expansion in the area. The frequent transition of pixels from the wet vegetation to the shrub cover class in TMNP also suggests that soil moisture in low lying areas may provide the conditions necessary for further expansion, as has been observed in northwestern Canada [81]. Given the ties between shrub cover and snow, elevational or latitudinal differences in the amount and duration of snow cover may also be expected to influence shrub distributions.
We note that the accuracy of the predictive shrub change model relies on several assumptions, foremost of which is that relationships between land cover transitions between time steps (i.e., 1985/89 and 2014), and rates of change, remain constant into the future. Furthermore, information about local geomorphology, the influence of climate change, and species/lifeform-specific data are not explicitly incorporated into our predictions. Finally, our detection of land cover transitions using post-classification change detection has several advantages and disadvantages [82]. The technique was beneficial in allowing us to identify the frequency of transitions across all land cover classes, but the accuracy of the final product is inherently tied to the initial reclassification of the ecotype map, which has not yet been validated in the field. Nonetheless, although we caution against interpreting meaning from individual pixels, the models do provide insight into general areas and cover classes that are more or less likely to undergo future change.
4.3. Implications for Wildlife, Protected Areas Management, and People
Newly protected areas such as TMNP can benefit from research that extends the state of knowledge deeper in time because in situ monitoring programs will have only been recently established. We have shown that substantial changes in land cover have occurred in TMNP from 1985 to the present, and that further increases in shrub cover can be expected in the future. The timing of land cover change in TMNP exemplifies the value of combining remote sensing data with in situ data collection to monitor environmental change in protected areas. Our analysis showed that substantial changes in land cover had already occurred prior to the establishment of the park and the initiation of associated monitoring programs in 2005. Data suggest that vegetation monitoring in low elevation/latitude areas (<500 m a.s.l. and south of 59.0°N) with adequate soil moisture and nearby shrub patches will be suitable for early detection of shrub expansion. It would be beneficial to establish additional monitoring plots along naturally occurring gradients of soil moisture, elevation, latitude, and continentality to improve our understanding of the moderating influence of these factors on shrub expansion in the region. In regard to other land cover changes, wet vegetation appears to have expanded the most in the vicinity of Komaktorvik River. This monitoring site could be well-suited for more detailed studies of the mechanisms underlying the conversion from dry to wet vegetation and from wet vegetation to shrub cover. Finally, although transitions to dry vegetation were less frequently observed, this class occupies the greatest area such that even small proportional changes could have larger cumulative impacts if they occur across the entirety of the park.
The expansion of shrub cover that has already been observed and is predicted to continue in TMNP has implications for several ecosystem processes. The presence of shrub canopies has been associated with a decline in the productivity of culturally significant berry plants through shading [12,15,83], and a reduced abundance of lichen [17,84], an important winter forage for caribou. Caribou may also be impacted by the displacement of wet vegetation and expansion of shrubs in low valleys because caribou browse in sedge meadows early in the growing season. In contrast, animals that make use of shrubs, such as some species of migratory birds, may see their habitats expand into new areas with changes in land cover [41,85]. The winter survival of subnivean animals may also benefit from shrub expansion as snow trapping in dense branch canopies insulates the ground and offers protection against harsh conditions [73]. On a larger scale, and because shrub cover has a role in many landscape-level feedbacks [13], shrub expansion will likely impact rates of carbon and nutrient cycling, and modify hydrological processes. For example, shrub expansion may alter ground temperatures and associated permafrost conditions [86] through interactions with the accumulation and duration of snow cover [10,64,87]. Shrub expansion from 2014 to 2039/43 is expected to be proportionally more modest at 50.9% than what occurred from 1985/89 to 2015/19 (234.7%), however, implying that even under improved climate conditions, other controlling factors will ultimately slow spread and limit the area that can plausibly be converted to shrub cover.
Finally, the past and future land cover change we have documented could also affect Inuit use of the land and park visitation. For example, expansion of shrub thickets along river valleys can make travel by foot or snowmobile more difficult along these important corridors, while also providing cover for black bears (Ursus americanus) and polar bears (U. maritimus), which presents challenges for human safety. Vegetation change will also affect the availability of important country foods such as caribou, ptarmigan, and berries, with consequences for food security and the connection of Inuit to the land. Understanding how these trends may unfold in future could help park managers and Inuit in the region better adapt and minimize the cultural and socioeconomic consequences of environmental change.
5. Conclusions
Our research has demonstrated that substantial changes in land cover have occurred in Torngat Mountains National Park over the past four decades. The most notable changes include a large increase in the extent of shrub cover in low-latitude valley bottoms, as shrubs have displaced wet vegetation, and a shift from dry to wet vegetation cover at mid-elevations. The nature and extent of these changes indicate that climate change, in addition to biotic (e.g., land cover type, plant–herbivore interactions) and topographic (e.g., elevation, latitude, continentality) controls, has been the main underlying driver of ecosystem change. In the future, a further increase in shrub cover is expected to occur with implications for management of protected areas.
Supplementary Materials
The following are available online at https://www.mdpi.com/article/10.3390/rs13112085/s1, Figure S1. Depiction of workflow used to generate four-class land cover rasters (1985/89 to 2015/19) from Landsat composites and topographic data for TMNP. Figure S2. Depiction of the workflow used to predict transitions to shrub dominance from biotic and topographic variables using a binomial regression framework. Figure S3. Relative variable importance plot of the random forest algorithm. Predictors with higher/lower overall importance values contribute more/less to the accuracy of the classification algorithm. Figure S4. Maps showing changes in dry vegetation (A) and non-vegetated cover (B) from 1985/89 to 2015/19 in Torngat Mountains National Park. Figure S5. Shrub change near Ramah Bay shown through (A) repeat photography and (B) predicted land cover maps of the park during a similar time period. The yellow dot in (B) is the approximate location of the photographs in (A). Table S1. Variables included in the 24 candidate binomial regression models used in an information theoretic approach to select the most suitable model for predicting shrub cover change. Table S2. Summary statistics of the comparison between 24 candidate binomial regression models of shrub change between 1985/89 and 2014, in order of rank (Model—name of model corresponding to Table 1; df—model degrees of freedom; logLik—model log-likelihood; AIC—Akaike’s Information Criterion; ∆AIC—change in AIC between ranked models; Model weight—Akaike weight). Table S3. Locations of existing ground and air temperature monitoring sites in Torngat Mountains National Park.
Author Contributions
E.L.D., A.J.T., R.G.W., and D.W. conceived the manuscript; E.L.D. wrote the paper and performed the analyses; A.J.T., R.G.W., L.H., and D.W. provided input to the analysis and interpretation of results. All authors have read and agreed to the published version of the manuscript.
Funding
Financial support for this research was provided by a Weston Family Postdoctoral Fellowship in Northern Research (E.L.D.), ArcticNet Inc. (project #20; R.G.W., A.J.T.), the Canadian Foundation for Innovation (A.J.T.), Queen’s University (R.G.W.), University of Waterloo (A.J.T.), Parks Canada, and the Nunatsiavut Government.
Data Availability Statement
The spatial data and code used in this study are available by contacting the corresponding author.
Acknowledgments
We acknowledge the Inuit of Nunatsiavut and Nunavik who encouraged and permitted us to investigate land cover change in Torngat Mountains National Park, and we thank the many Inuit who contributed to this work with their knowledge and as bear guides for fieldwork related to the research. This project builds on the earlier work of D. McLennan, S. Ponomarenko and J. Quirouette (ecotype mapping of TMNP), J. Quirouette and P. Zorn (subtle vegetation change mapping of Nakvak Brook, TMNP), and benefited from discussion with P. Zorn, S. McCanny, and S. Ponomarenko.
Conflicts of Interest
The authors declare no conflict of interest.
References
- Aerts, R.; Cornelissen, J.H.C.; Dorrepaal, E. Plant performance in a warmer world: General responses of plants from cold, northern biomes and the importance of winter and spring events. Plant Ecol. 2006, 182, 65–77. [Google Scholar] [CrossRef]
- Chapin, F.S., III; Jefferies, R.L.; Reynolds, J.F.; Shaver, G.R.; Svoboda, J.; Chu, E.W. Arctic Ecosystems in a Changing Climate: An Ecophysiological Perspective; Academic Press: San Diego, CA, USA, 1991; p. 469. [Google Scholar]
- Elmendorf, S.C.; Henry, G.H.R.; Hollister, R.D.; Björk, R.G.; Boulanger-Lapointe, N.; Cooper, E.J.; Cornelissen, J.H.C.; Day, T.A.; Dorrepaal, E.; Elumeeva, T.G.; et al. Plot-scale evidence of tundra vegetation change and links to recent summer warming. Nat. Clim. Chang. 2012, 2, 453–457. [Google Scholar] [CrossRef]
- Myers-Smith, I.H.; Hik, D.S. Climate warming as a driver of tundra shrubline advance. J. Ecol. 2017, 106, 547–560. [Google Scholar] [CrossRef]
- Myers-Smith, I.H.; Grabowski, M.M.; Thomas, H.J.D.; Angers-Blondin, S.; Daskalova, G.N.; Bjorkman, A.D.; Cunliffe, A.M.; Assmann, J.J.; Boyle, J.S.; McLeod, E.; et al. Eighteen years of ecological monitoring reveals multiple lines of evidence for tundra vegetation change. Ecol. Monogr. 2019, 89, e01351. [Google Scholar] [CrossRef]
- Barrio, I.C.; Lindén, E.; Te Beest, M.; Olofsson, J.; Rocha, A.; Soininen, E.M.; Alatalo, J.M.; Andersson, T.; Asmus, A.; Boike, J.; et al. Background invertebrate herbivory on dwarf birch (Betula glandulosa-nana complex) increases with temperature and precipitation across the tundra biome. Polar Biol. 2017, 40, 2265–2278. [Google Scholar] [CrossRef]
- Morrissette-Boileau, C.; Boudreau, S.; Tremblay, J.-P.; Côté, S.D. Revisiting the role of migratory caribou in the control of shrub expansion in northern Nunavik (Québec, Canada). Polar Biol. 2018, 41, 1845–1853. [Google Scholar] [CrossRef]
- Lawrence, D.M.; Swenson, S.C. Permafrost response to increasing Arctic shrub abundance depends on the relative influence of shrubs on local soil cooling versus large-scale climate warming. Environ. Res. Lett. 2011, 6, 045504. [Google Scholar] [CrossRef]
- Myers-Smith, I.H.; Elmendorf, S.C.; Beck, P.S.A.; Wilmking, M.; Hallinger, M.; Blok, D.; Tape, K.D.; Rayback, S.A.; Macias-Fauria, M.; Forbes, B.C.; et al. Climate sensitivity of shrub growth across the tundra biome. Nat. Clim. Chang. 2015, 5, 887–891. [Google Scholar] [CrossRef]
- Wilcox, E.J.; Keim, D.; de Jong, T.; Walker, B.; Sonnentag, O.; Sniderhan, A.E.; Mann, P.; Marsh, P. Tundra shrub expansion may amplify permafrost thaw by advancing snowmelt timing. Arct. Sci. 2019, 1–16. [Google Scholar] [CrossRef]
- Anderson, D.; Ford, J.D.; Way, R.G. The Impacts of Climate and Social Changes on Cloudberry (Bakeapple) Picking: A Case Study from Southeastern Labrador. Hum. Ecol. 2018, 46, 849–863. [Google Scholar] [CrossRef]
- Boulanger-Lapointe, N.; Henry, G.H.R.; Lévesque, E.; Cuerrier, A.; Desrosiers, S.; Gérin-Lajoie, J.; Hermanutz, L.; Siegwart Collier, L. Climate and environmental drivers of berry productivity from the forest–tundra ecotone to the high Arctic in Canada. Arct. Sci. 2020, 6, 529–544. [Google Scholar] [CrossRef]
- Myers-Smith, I.H.; Forbes, B.C.; Wilmking, M.; Hallinger, M.; Lantz, T.; Blok, D.; Tape, K.D.; Macias-Fauria, M.; Sass-Klaassen, U.; Lévesque, E.; et al. Shrub expansion in tundra ecosystems: Dynamics, impacts and research priorities. Environ. Res. Lett. 2011, 6, 045509. [Google Scholar] [CrossRef]
- Parks Canada. State of the Park Report, Torngat Mountains National Park of Canada; Parks Canada: Rocky Harbour, NL, Canada, 2008; p. 51. [Google Scholar]
- Siegwart Collier, L. Climate Change Impacts on Berry Shrub Performance in Treeline and Tundra Ecosystems; Memorial University of Newfoundland: St. John’s, NL, Canada, 2020. [Google Scholar]
- Fraser, R.H.; Olthof, I.; Carrière, M.; Deschamps, A.; Pouliot, D. Detecting long-term changes to vegetation in northern Canada using the Landsat satellite image archive. Environ. Res. Lett. 2011, 6, 045502. [Google Scholar] [CrossRef]
- Fraser, R.H.; Lantz, T.; Olthof, I.; Kokelj, S.V.; Sims, R.A. Warming-Induced Shrub Expansion and Lichen Decline in the Western Canadian Arctic. Ecosystems 2014, 17, 1151–1168. [Google Scholar] [CrossRef]
- Bonney, M.T.; Danby, R.K.; Treitz, P.M. Landscape variability of vegetation change across the forest to tundra transition of central Canada. Remote Sens. Environ. 2018, 217, 18–29. [Google Scholar] [CrossRef]
- Paradis, M.; Lévesque, E.; Boudreau, S. Greater effect of increasing shrub height on winter versus summer soil temperature. Environ. Res. Lett. 2016, 11, 085005. [Google Scholar] [CrossRef]
- Ackerman, D.; Griffin, D.; Hobbie, S.E.; Finlay, J.C. Arctic shrub growth trajectories differ across soil moisture levels. Glob. Chang. Biol. 2017, 23, 4294–4302. [Google Scholar] [CrossRef]
- Chen, A.; Lantz, T.C.; Hermosilla, T.; Wulder, M.A. Biophysical controls of increased tundra productivity in the western Canadian Arctic. Remote Sens. Environ. 2021, 258, 112358. [Google Scholar] [CrossRef]
- Andruko, R.; Danby, R.; Grogan, P. Recent Growth and Expansion of Birch Shrubs Across a Low Arctic Landscape in Continental Canada: Are These Responses More a Consequence of the Severely Declining Caribou Herd than of Climate Warming? Ecosystems 2020, 20, 1362–1379. [Google Scholar] [CrossRef]
- García Criado, M.; Myers-Smith, I.H.; Bjorkman, A.D.; Lehmann, C.E.R.; Stevens, N. Woody plant encroachment intensifies under climate change across tundra and savanna biomes. Glob. Ecol. Biogeogr. 2020, 29, 925–943. [Google Scholar] [CrossRef]
- Campbell, T.K.F.; Lantz, T.C.; Fraser, R.H.; Hogan, D. High Arctic Vegetation Change Mediated by Hydrological Conditions. Ecosystems 2021, 24, 106–121. [Google Scholar] [CrossRef]
- Myers-Smith, I.H.; Kerby, J.T.; Phoenix, G.K.; Bjerke, J.W.; Epstein, H.E.; Assmann, J.J.; John, C.; Andreu-Hayles, L.; Angers-Blondin, S.; Beck, P.S.A.; et al. Complexity revealed in the greening of the Arctic. Nat. Clim. Chang. 2020, 10, 106–117. [Google Scholar] [CrossRef]
- Mallory, M.L.; Gilchrist, H.G.; Janssen, M.; Major, H.L.; Merkel, F.; Provencher, J.F.; Strøm, H. Financial costs of conducting science in the Arctic: Examples from seabird research. Arct. Sci. 2018, 4, 624–633. [Google Scholar] [CrossRef]
- Way, R.G.; Lewkowicz, A.G. Modelling the spatial distribution of permafrost in Labrador–Ungava using the temperature at the top of permafrost. Can. J. Earth Sci. 2016, 53, 1010–1028. [Google Scholar] [CrossRef]
- Barrand, N.E.; Way, R.G.; Bell, T.; Sharp, M.J. Recent changes in area and thickness of Torngat Mountain glaciers (northern Labrador, Canada). Cryosphere 2017, 11, 157–168. [Google Scholar] [CrossRef]
- Way, R.G.; Bell, T.; Barrand, N.E. Glacier change from the early Little Ice Age to 2005 in the Torngat Mountains, northern Labrador, Canada. Geomorphology 2015, 246, 558–569. [Google Scholar] [CrossRef]
- COSEWIC. COSEWIC Assessment and Status Report on the Caribou Rangifer Tarandus, Eastern Migratory Population and Torngat Mountains Population in Canada; Committee on the Status of Endangered Wildlife in Canada: Ottawa, ON, Canada, 2017; p. 85. [Google Scholar]
- Davis, E.; Trant, A.; Hermanutz, L.; Way, R.G.; Lewkowicz, A.G.; Siegwart Collier, L.; Cuerrier, A.; Whitaker, D. Plant–Environment Interactions in the Low Arctic Torngat Mountains of Labrador. Ecosystems 2020. [Google Scholar] [CrossRef]
- Parks Canada. Tongait KakKasuangita SilakKijapvinga, Torngat Mountains National Park of Canada—Management Plan; Parks Canada: Nain, NL, Canada, 2010; p. 76. [Google Scholar]
- Mizel, J.D.; Schmidt, J.H.; Mcintyre, C.L.; Roland, C.A. Rapidly shifting elevational distributions of passerine species parallel vegetation change in the subarctic. Ecosphere 2016, 7, e01264. [Google Scholar] [CrossRef]
- Berteaux, D.; Ricard, M.; St-Laurent, M.H.; Casajus, N.; Perie, C.; Beauregard, F.; de Blois, S. Northern protected areas will become important refuges for biodiversity tracking suitable climates. Sci. Rep. 2018, 8, 4623. [Google Scholar] [CrossRef]
- Gonzalez, P.; Wang, F.; Notaro, M.; Vimont, D.J.; Williams, J.W. Disproportionate magnitude of climate change in United States national parks. Environ. Res. Lett. 2018, 13, 104001. [Google Scholar] [CrossRef]
- Holsinger, L.; Parks, S.A.; Parisien, M.A.; Miller, C.; Batllori, E.; Moritz, M.A. Climate change likely to reshape vegetation in North America’s largest protected areas. Conserv. Sci. Pract. 2019, 1, e50. [Google Scholar] [CrossRef]
- McLennan, D.; Ponomarenko, S. Updating ecosystem inventories at Parks Canada. In Proceedings of the Fifth International SAMPA Conference, Nara, Japan, 25–30 May 2003; p. 9. [Google Scholar]
- Lemelin, H.; Johnston, M.; Lough, D.; Rowell, J.; Broomfield, W.; Baikie, G.; Sheppard, K. Two Parks, One Vision—Collaborative Management Approaches to Transboundary Protected Areas in Northern Canada: Tongait KakKasuangita SilakKijapvinga/Torngat Mountains National Park, Nunatsiavut and le Parc national Kuururjuaq Nunavik. In Indigenous Peoples’ Governance of Land and Protected Territories in the Arctic; Springer: Cham, Switzerland, 2016; pp. 71–82. [Google Scholar]
- Banfield, C.E.; Jacobs, J.D. Regional patterns of temperature and precipitation for Newfoundland and Labrador during the past century. Can. Geogr. 1998, 42, 354–364. [Google Scholar] [CrossRef]
- Riley, J.L.; Notzl, L.; Greene, R. Labrador Nature Atlas: Vol II, Ecozones, Ecoregions and Ecodistricts; Nature Conservancy of Canada: Toronto, ON, Canada, 2013; p. 128. [Google Scholar]
- Whitaker, D. Expanded Range Limits of Boreal Birds in the Torngat Mountains of Northern Labrador. Can. Field Nat. 2017, 131, 55–62. [Google Scholar] [CrossRef]
- Barrette, C.; Brown, R.; Way, R.; Mailhot, A.; Diaconescu, E.P.; Grenier, P.; Chaumont, D.; Dumont, D.; Sévigny, C.; Howell, S.; et al. Chapter 2: Nunavik and Nunatsiavut Regional Climate Information Update; ArcticNet Inc.: Québec, QC, Canada, 2020; p. 58. [Google Scholar]
- Zamin, T.J.; Côté, S.D.; Tremblay, J.-P.; Grogan, P. Experimental warming alters migratory caribou forage quality. Ecol. Appl. 2017, 27, 2061–2073. [Google Scholar] [CrossRef]
- Leblond, M.; St-Laurent, M.H.; Côté, S.D. Caribou, water, and ice—Fine-scale movements of a migratory arctic ungulate in the context of climate change. Mov. Ecol. 2016, 4, 14. [Google Scholar] [CrossRef] [PubMed]
- Ju, J.; Masek, J.G. The vegetation greenness trend in Canada and US Alaska from 1984–2012 Landsat data. Remote Sens. Environ. 2016, 176, 1–16. [Google Scholar] [CrossRef]
- Ponomarenko, S.; Quirouette, J. SPOT5-Based Terrestrial Ecotype Map for Torngat Mountains National Park, 2014.
- USGS. Application for Extracting and Exploring Analysis Ready Samples (AρρEEARS). Available online: https://lpdaacsvc.cr.usgs.gov/appeears/ (accessed on 1 July 2020).
- Gorelick, N.; Hancher, M.; Dixon, M.; Ilyushchenko, S.; Thau, D.; Moore, R. Google Earth Engine: Planetary-scale geospatial analysis for everyone. Remote Sens. Environ. 2017, 202, 18–27. [Google Scholar] [CrossRef]
- Pironkova, Z.; Whaley, R.; Lan, K. Time Series Analysis of Landsat NDVI Composites with Google Earth Engine and R: User Guide; Ontario Ministry of Natural Resources and Forestry, Science and Research Branch: Peterborough, ON, Canada, 2018; p. 18. [Google Scholar]
- R Core Team. R: A Language and Environment for Statistical Computing; R Foundation for Statistical Computing: Vienna, Austria, 2020. [Google Scholar]
- Natural Resources Canada. Canadian Digital Elevation Model, 1945–2011; Natural Resources Canada: Ottawa, ON, Canada, 2015. [Google Scholar]
- McCune, B.; Dylan, K. Equations for potential annual direct incident radiation and heat load. J. Veg. Sci. 2002, 13, 603–606. [Google Scholar] [CrossRef]
- Kuhn, M. Building Predictive Models in R Using the caret Package. J. Stat. Softw. 2008, 28, 1–26. [Google Scholar] [CrossRef]
- Lemay, M.; Provencher-Nolet, L.; Bernier, M.; Lévesque, E.; Boudreau, S. Spatially explicit modeling and prediction of shrub cover increase near Umiujaq, Nunavik. Ecol. Monogr. 2018, 88, 385–407. [Google Scholar] [CrossRef]
- Sturm, M.; Schimel, J.; Michaelson, G.; Welker, J.M.; Oberbauer, S.F.; Liston, G.E.; Fahnestock, J.; Romanovsky, V. Winter Biological Processes Could Help Convert Arctic Tundra to Shrubland. Bioscience 2005, 55, 17–26. [Google Scholar] [CrossRef]
- Bartoń, K. MuMIn: Multi-Model Inference, R Package. 2020. Available online: https://open.canada.ca/data/en/dataset/7f245e4d-76c2-4caa-951a-45d1d2051333 (accessed on 1 July 2020).
- Anderson, D.R. Multimodel Inference. In Model Based Inference in the Life Sciences: A Primer on Evidence; Springer: New York, NY, USA, 2008; pp. 105–124. [Google Scholar]
- Tremblay, B.; Lévesque, E.; Boudreau, S. Recent expansion of erect shrubs in the Low Arctic: Evidence from Eastern Nunavik. Environ. Res. Lett. 2012, 7, 035501. [Google Scholar] [CrossRef]
- Provencher-Nolet, L.; Bernier, M.; Lévesque, E. Short term change detection in tundra vegetation near Umiujaq, subarctic Quebec, Canada. In Proceedings of the IEEE Geoscience and Remote Sensing Symposium, Québec City, QC, Canada, 13–18 July 2014; pp. 4668–4670. [Google Scholar]
- Larking, T.; Davis, E.; Way, R.; Hermanutz, L.; Trant, A. Recent greening driven by species-specific shrub growth characteristics in Nunatsiavut, Labrador, Canada. Arct. Sci. 2021. [Google Scholar] [CrossRef]
- Myers-Smith, I.H.; Hallinger, M.; Blok, D.; Sass-Klaassen, U.; Rayback, S.A.; Weijers, S.; Trant, A.J.; Tape, K.D.; Naito, A.T.; Wipf, S.; et al. Methods for measuring arctic and alpine shrub growth: A review. Earth Sci. Rev. 2015, 140, 1–13. [Google Scholar] [CrossRef]
- Anthelme, F.; Cornillon, L.; Brun, J.-J. Secondary succession of Alnus viridis (Chaix) DC. in Vanoise National Park, France: Coexistence of sexual and vegetative strategies. Ann. For. Sci. 2002, 59, 419–428. [Google Scholar] [CrossRef]
- Pajunen, A.M.; Okanen, J.; Virtanen, R. Impact of shrub canopies on understorey vegetation in western Eurasian tundra. J. Veg. Sci. 2011, 22, 837–846. [Google Scholar] [CrossRef]
- Domine, F.; Barrere, M.; Morin, S. The growth of shrubs on high Arctic tundra at Bylot Island: Impact on snow physical properties and permafrost thermal regime. Biogeosciences 2016, 13, 6471–6486. [Google Scholar] [CrossRef]
- Kropp, H.; Loranty, M.M.; Natali, S.M.; Kholodov, A.L.; Rocha, A.V.; Myers-Smith, I.H.; Abbott, B.W.; Abermann, J.; Blanc-Betes, E.; Blok, D.; et al. Shallow soils are warmer under trees and tall shrubs across Arctic and Boreal ecosystems. Environ. Res. Lett. 2020. [Google Scholar] [CrossRef]
- Kemppinen, J.; Niittynen, P.; Virkkala, A.-M.; Happonen, K.; Riihimäki, H.; Aalto, J.; Luoto, M. Dwarf Shrubs Impact Tundra Soils: Drier, Colder, and Less Organic Carbon. Ecosystems 2021. [Google Scholar] [CrossRef]
- Way, R.; Lapalme, C. Does tall vegetation warm or cool the ground surface? Constraining the ground thermal impacts of upright vegetation in northern environments. Environ. Res. Lett. 2021. [Google Scholar] [CrossRef]
- Naito, A.T.; Cairns, D.M. Relationships between Arctic shrub dynamics and topographically derived hydrologic characteristics. Environ. Res. Lett. 2011, 6, 045506. [Google Scholar] [CrossRef]
- Tape, K.D.; Christie, K.; Carroll, G.; O’Donnell, J.A. Novel wildlife in the Arctic: The influence of changing riparian ecosystems and shrub habitat expansion on snowshoe hares. Glob. Chang. Biol. 2016, 22, 208–219. [Google Scholar] [CrossRef] [PubMed]
- Tape, K.D.; Hallinger, M.; Welker, J.M.; Ruess, R.W. Landscape Heterogeneity of Shrub Expansion in Arctic Alaska. Ecosystems 2012, 15, 711–724. [Google Scholar] [CrossRef]
- Lloyd, A.H.; Yoshikawa, K.; Fastie, C.L.; Hinzman, L.; Fraver, M. Effects of permafrost degradation on woody vegetation at arctic treeline on the Seward Peninsula, Alaska. Permafr. Periglac. Process. 2003, 14, 93–101. [Google Scholar] [CrossRef]
- van der Kolk, H.-J.; Heijmans, M.M.P.D.; van Huissteden, J.; Pullens, J.W.M.; Berendse, F. Potential Arctic tundra vegetation shifts in response to changing temperature, precipitation and permafrost thaw. Biogeosciences 2016, 13, 6229–6245. [Google Scholar] [CrossRef]
- Berteaux, D.; Gauthier, G.; Domine, F.; Ims, R.A.; Lamoureux, S.F.; Lévesque, E.; Yoccoz, N. Effects of changing permafrost and snow conditions on tundra wildlife: Critical places and times. Arct. Sci. 2017, 3, 65–90. [Google Scholar] [CrossRef]
- Wrona, F.J.; Johansson, M.; Culp, J.M.; Jenkins, A.; Mård, J.; Myers-Smith, I.H.; Prowse, T.D.; Vincent, W.F.; Wookey, P.A. Transitions in Arctic ecosystems: Ecological implications of a changing hydrological regime. J. Geophys. Res. Biogeosci. 2016, 121, 650–674. [Google Scholar] [CrossRef]
- Karlsson, J.M.; Bring, A.; Peterson, G.D.; Gordon, L.J.; Destouni, G. Opportunities and limitations to detect climate-related regime shifts in inland Arctic ecosystems through eco-hydrological monitoring. Environ. Res. Lett. 2011, 6, 014015. [Google Scholar] [CrossRef]
- Baltzer, J.L.; Veness, T.; Chasmer, L.E.; Sniderhan, A.E.; Quinton, W.L. Forests on thawing permafrost: Fragmentation, edge effects, and net forest loss. Glob. Chang. Biol. 2014, 20, 824–834. [Google Scholar] [CrossRef] [PubMed]
- Tape, K.D.; Sturm, M.; Racine, C. The evidence for shrub expansion in Northern Alaska and the Pan-Arctic. Glob. Chang. Biol. 2006, 12, 686–702. [Google Scholar] [CrossRef]
- Sturm, M.; McFadden, J.P.; Liston, G.E.; Chapin, F.S., III; Racine, C.H.; Holmgren, J. Snow–Shrub Interactions in Arctic Tundra: A Hypothesis with Climatic Implications. J. Clim. 2001, 14, 336–344. [Google Scholar] [CrossRef]
- Myers-Smith, I.H.; Hik, D.S. Shrub canopies influence soil temperatures but not nutrient dynamics: An experimental test of tundra snow-shrub interactions. Ecol. Evol. 2013, 3, 3683–3700. [Google Scholar] [CrossRef]
- Ropars, P.; Lévesque, E.; Boudreau, S. How do climate and topography influence the greening of the forest-tundra ecotone in northern Québec? A dendrochronological analysis of Betula glandulosa. J. Ecol. 2015, 103, 679–690. [Google Scholar] [CrossRef]
- Cameron, E.A.; Lantz, T.C. Drivers of tall shrub proliferation adjacent to the Dempster Highway, Northwest Territories, Canada. Environ. Res. Lett. 2016, 11, 045006. [Google Scholar] [CrossRef]
- Lu, D.; Mausel, P.; Brondízio, E.; Moran, E. Change detection techniques. Int. J. Remote Sens. 2004, 25, 2365–2401. [Google Scholar] [CrossRef]
- Boulanger-Lapointe, N.; Gérin-Lajoie, J.; Siegwart Collier, L.; Desrosiers, S.; Spiech, C.; Henry, G.H.R.; Hermanutz, L.; Lévesque, E.; Cuerrier, A. Berry Plants and Berry Picking in Inuit Nunangat: Traditions in a Changing Socio-Ecological Landscape. Hum. Ecol. 2019, 47, 81–93. [Google Scholar] [CrossRef]
- Chagnon, C.; Boudreau, S. Shrub canopy induces a decline in lichen abundance and diversity in Nunavik (Québec, Canada). Arct. Antarct. Alp. Res. 2019, 51, 521–532. [Google Scholar] [CrossRef]
- Boelman, N.T.; Gough, L.; Wingfield, J.; Goetz, S.; Asmus, A.; Chmura, H.E.; Krause, J.S.; Perez, J.H.; Sweet, S.K.; Guay, K.C. Greater shrub dominance alters breeding habitat and food resources for migratory songbirds in Alaskan arctic tundra. Glob. Chang. Biol. 2015, 21, 1508–1520. [Google Scholar] [CrossRef] [PubMed]
- Pelletier, M.; Allard, M.; Levesque, E. Ecosystem changes across a gradient of permafrost degradation in subarctic Québec (Tasiapik Valley, Nunavik, Canada). Arct. Sci. 2019, 5, 1–26. [Google Scholar] [CrossRef]
- Grünberg, I.; Wilcox, E.J.; Zwieback, S.; Marsh, P.; Boike, J. Linking tundra vegetation, snow, soil temperature, and permafrost. Biogeosciences 2020, 17, 4261–4279. [Google Scholar] [CrossRef]


Publisher’s Note: MDPI stays neutral with regard to jurisdictional claims in published maps and institutional affiliations. |
© 2021 by the authors. Licensee MDPI, Basel, Switzerland. This article is an open access article distributed under the terms and conditions of the Creative Commons Attribution (CC BY) license (https://creativecommons.org/licenses/by/4.0/).