Article

Comparison of Accuracy of Surface Temperature Images from Unmanned Aerial Vehicle and Satellite for Precise Thermal Environment Monitoring of Urban Parks Using In Situ Data

1
Korea Environment Institute, Bldg. B, 370 Sicheong-daero, Sejong 30147, Korea
2
Division of Environmental Science & Ecological Engineering, Korea University, 02841 145 Anam-ro, Seongbuk-gu, Seoul 02841, Korea
*
Author to whom correspondence should be addressed.
Remote Sens. 2021, 13(10), 1977; https://doi.org/10.3390/rs13101977
Submission received: 23 March 2021 / Revised: 4 May 2021 / Accepted: 15 May 2021 / Published: 19 May 2021

Abstract

:
Rapid urbanization has led to several severe environmental problems, including so-called heat island effects, which can be mitigated by creating more urban green spaces. However, the temperature of various surfaces differs and precise measurement and analyses are required to determine the “coolest” of these. Therefore, we evaluated the accuracy of surface temperature data based on thermal infrared (TIR) cameras mounted on unmanned aerial vehicles (UAVs), which have recently been utilized for the spatial analysis of surface temperatures. Accordingly, we investigated land surface temperatures (LSTs) in green spaces, specifically those of different land cover types in an urban park in Korea. We compared and analyzed LST data generated by a thermal infrared (TIR) camera mounted on an unmanned aerial vehicle (UAV) and LST data from the Landsat 8 satellite for seven specific periods. For comparison and evaluation, we measured in situ LSTs using contact thermometers. The UAV TIR LST showed higher accuracy (R2 0.912, root mean square error (RMSE) 3.502 °C) than Landsat TIR LST accuracy (R2 value lower than 0.3 and RMSE of 7.246 °C) in all periods. The Landsat TIR LST did not show distinct LST characteristics by period and land cover type; however, grassland, the largest land cover type in the study area, showed the highest accuracy. With regard to the accuracy of the UAV TIR LST by season, the accuracy was higher in summer and spring ( R 2 0.868–0.915, RMSE 2.523–3.499 °C) than in autumn and winter ( R 2 0.766–0.79, RMSE 3.834–5.398 °C). Some land cover types (concrete bike path, wooden deck) were overestimated, showing relatively high total RMSEs of 4.439 °C and 3.897 °C, respectively, whereas grassland, which has lower LST, was underestimated—showing a total RMSE of 3.316 °C. Our results showed that the UAV TIR LST could be measured with sufficient reliability for each season and land cover type in an urban park with complex land cover types. Accordingly, our results could contribute to decision-making for urban spaces and environmental planning in consideration of the thermal environment.

1. Introduction

The proportion of urban areas worldwide has been increasing over the last several decades. Continuous urbanization has led to the proportion of the population living in cities exceeding 55.7% of the global population in 2019 (databank.worldbank.org) and it is expected to reach 60% by 2050 [1,2]. Urbanization causes numerous environmental problems, such as water pollution and the weakening of ecosystem services [3,4]. In particular, as natural landscapes such as vegetation, water bodies, and agricultural lands are transformed into impermeable surfaces and urban infrastructure, the absorption of solar radiation and surface heat accumulation increase, causing significant changes in the thermal environment in cities and surrounding areas [5]. Further, urban heat islands (UHIs) emerge, causing higher temperatures in urban areas compared with surrounding areas. UHI effects have been researched for more than two centuries since it was first discovered in 1818 [6], as they negatively affect the health and comfort of urban residents, leading to an increase in energy and water consumption, carbon dioxide emissions, thermal stress, and air pollution [7]. To mitigate such effects, various methods are being applied, such as green space formation, change of building materials and colors, and the operation of sprinklers and cooling fog systems. Among these, green spaces, such as urban parks, forests, and rivers are known to be environmentally friendly and economically effective measures [7,8].
During the COVID-19 pandemic, the operation of cooling centers for people vulnerable to heatwaves is being limited by the Korean government and municipalities; therefore, the importance of green spaces where people can relax in a relatively open environment in cities is growing.
To analyze the UHI mitigation effect of green spaces, air temperatures, and land surface temperature (LST) data from weather stations, LST data extracted from satellite thermal infrared images, and thermal environment model simulations have been used previously [9,10,11]. Among such techniques, the satellite thermal infrared imaging method has the advantage of regular monitoring over a large area. Therefore, it is employed to analyze urban scale LST and UHI effects and to spatially investigate the correlations between urban green space and the UHI effect [12]. However, satellite thermal infrared images have limitations for analyzing thermal environments in complex cities because of spatial resolutions of 30 m–1 km [13,14]. Further, satellite images have limitations for acquiring thermal infrared images because they are captured at specific times depending on the satellite route. Aircraft flight-based thermal infrared imaging could be proposed as an alternative, but such a method would not be economically feasible [14].
Recently, it has become possible to acquire LST images with centimeter-scale spatial resolutions using an unmanned aerial vehicle (UAV) and a thermal infrared (TIR) camera. Precise thermal environment analysis has been attempted for small areas employing this method [15,16]. However, current studies on the verification of UAV-based LST data for urban green spaces comprising various artificial facilities and land covers are inadequate. While some studies have evaluated the accuracy of UAV TIR LST using a thermal imaging camera or a contact surface thermometer [17,18,19], few studies have evaluated the accuracy of UAV TIR LST for green spaces. Urban parks provide ecological and social benefits such as recreation and can improve the welfare of citizens by mitigating UHI effects through the cooling effect of their vegetation [20,21]. However, the cooling effect of urban parks varies according to the composition and layout of land cover types; therefore, precise thermal environment analysis based on UAV-acquired information is needed [14,22]. Accordingly, our study aimed to obtain such data from precise UAV TIR LST data for an urban park that mainly comprises urban green space. In addition, we aimed to verify the accuracy of the data. Through this, we propose a calibration method for UAV TIR LST data by type and time of land cover that make up urban parks. It is expected that the thermal environment of urban parks and the mitigation effect of UHI of green spaces can be analyzed more precisely and efficiently.
In this study, UAV TIR LST data were acquired and a database was constructed for the same time slots over one year in the Geum River Park located in Sejong City, South Korea. In addition, we compared the characteristics, advantages, and disadvantages of UAV TIR LST data for precise thermal environment analysis with satellite TIR LST data (Landsat 8 TIR LST). To that end, we simultaneously selected LST checkpoints (CPs) by land cover type to measure and evaluate the accuracy of the in situ LST data at the CPs.

2. Materials and Methods
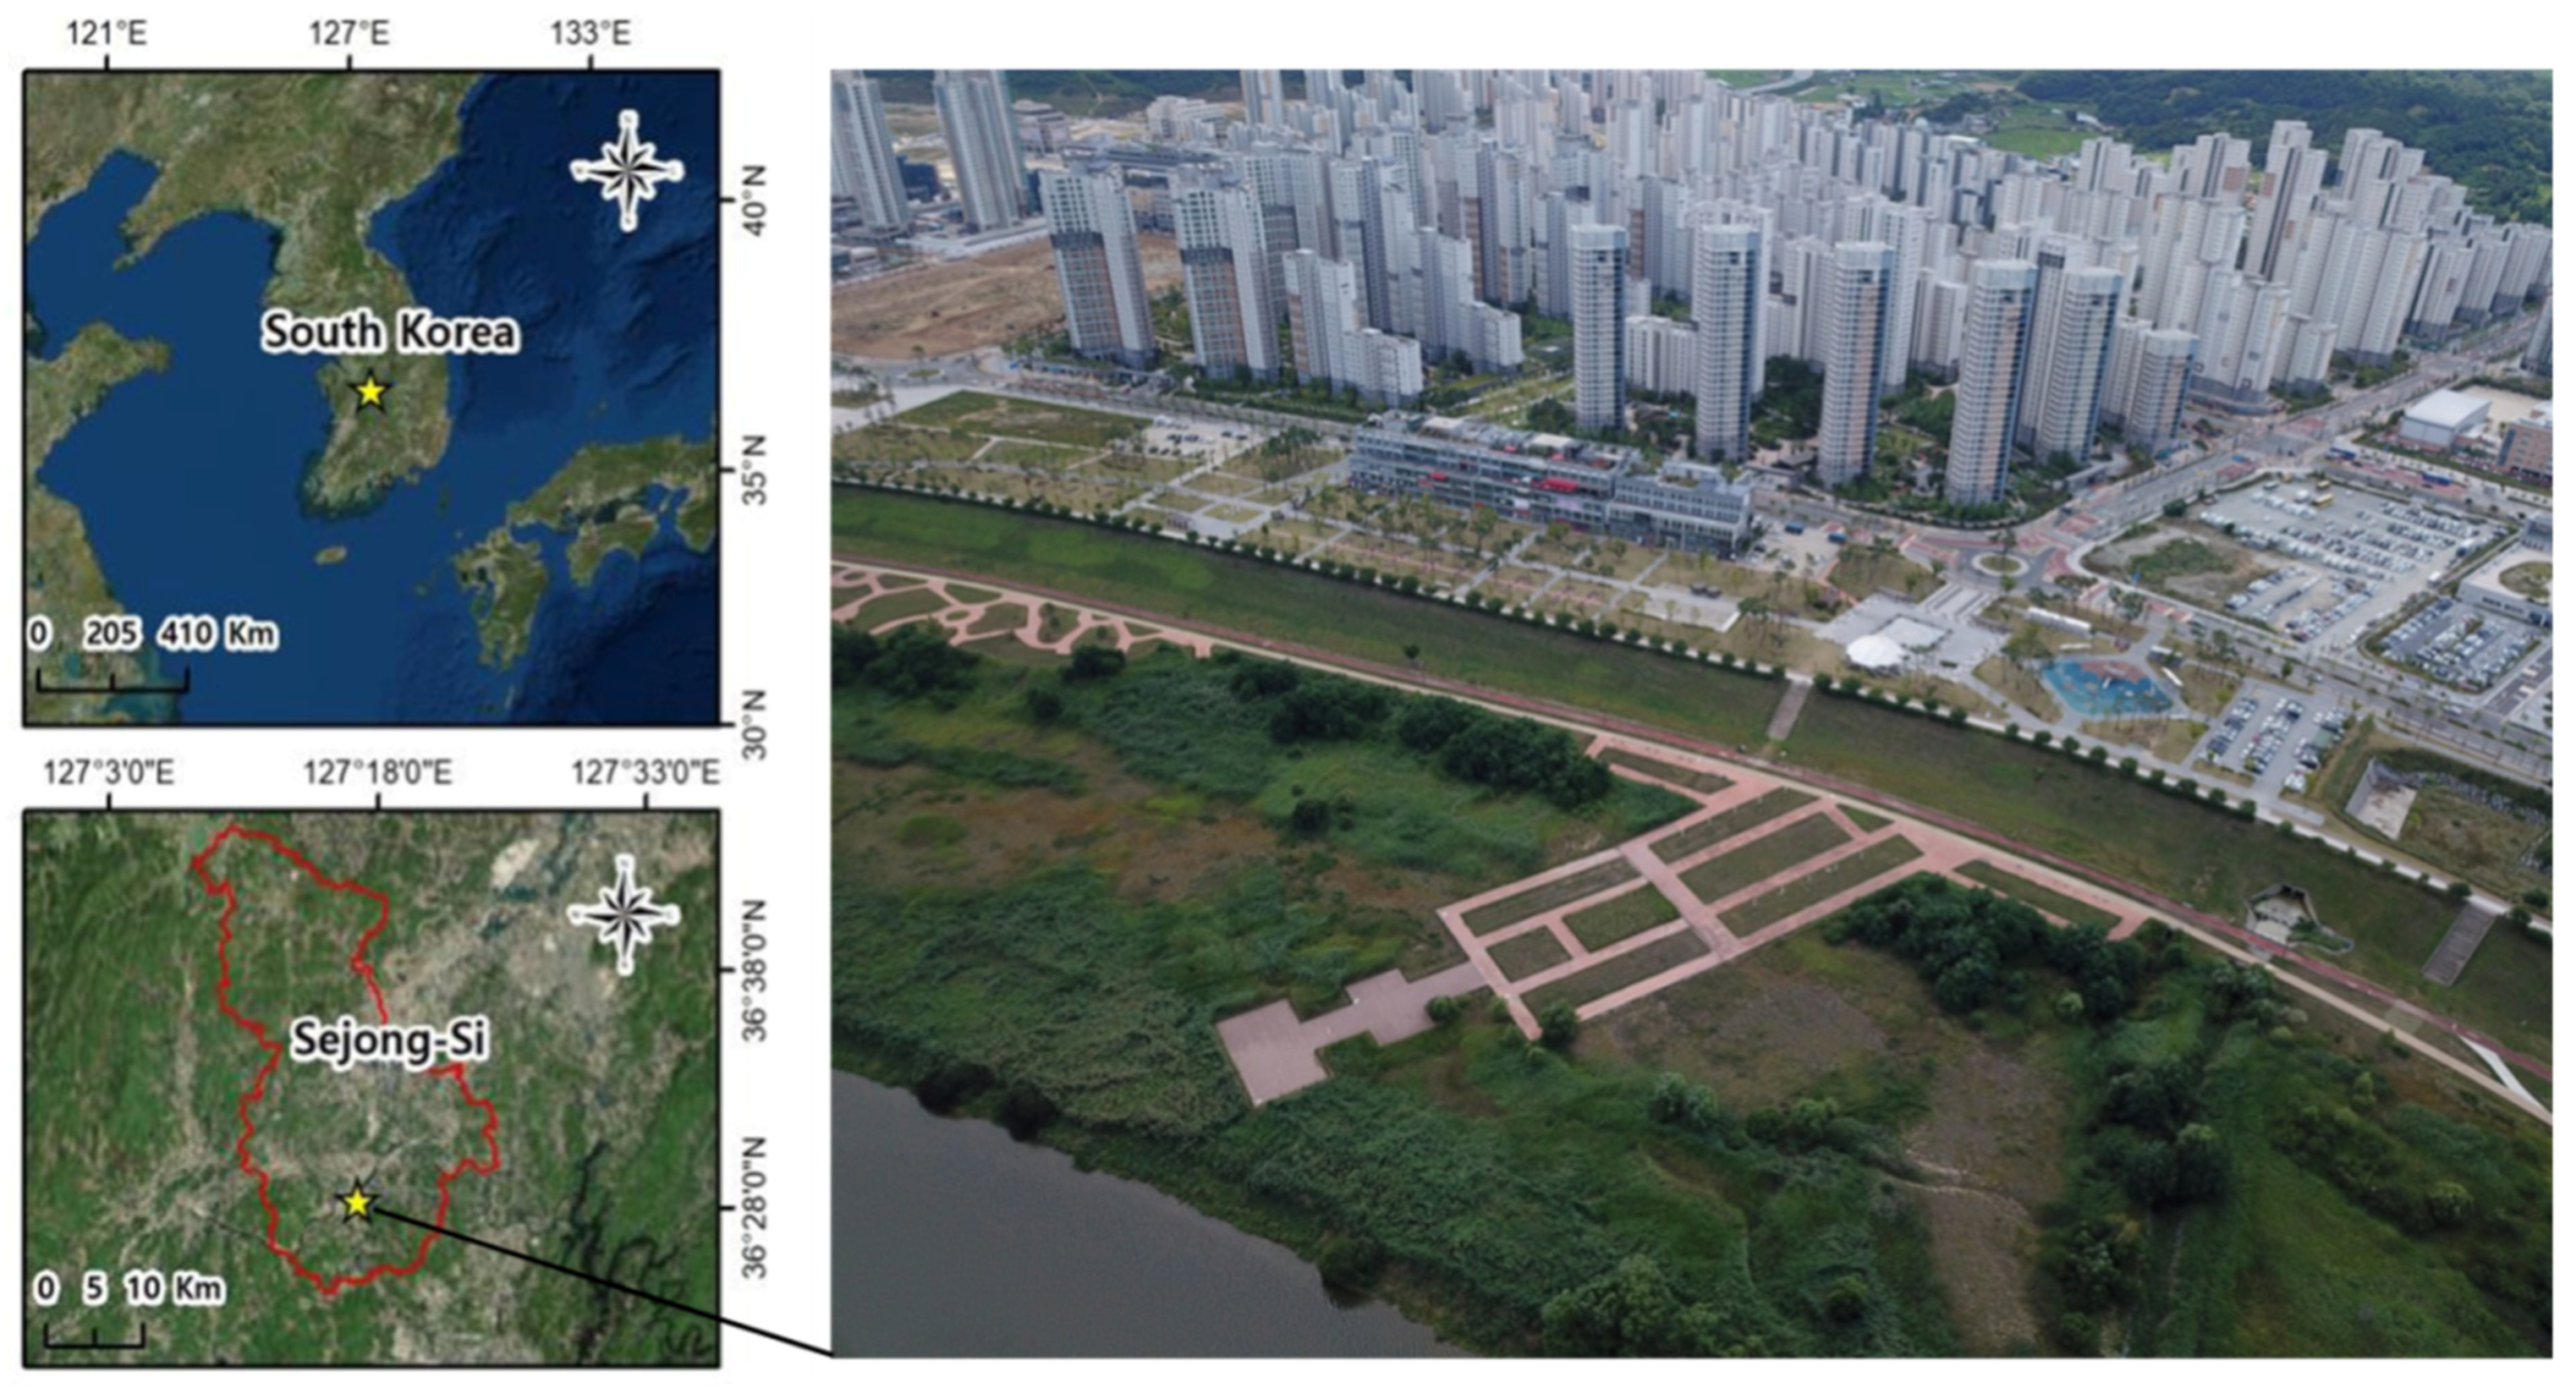
2.1. Study Area

The study area is the Geum River Park (36°28′60″N, 127°17′30″E) in Sejong City, South Korea (Figure 1). The downtown of Sejong City is at the center of a basin surrounded by mountains with altitudes of approximately 300 m, with the Geum River flowing through the center of the downtown area from east to west. The annual average temperature of Sejong City is 12.0 °C, with the January average temperature being −2.5 °C (highest 3.1 °C, lowest −7.4 °C), and the average August temperature being 25.1 °C (highest 30.1 °C, lowest 21.3 °C). The annual average precipitation is 1254.6 mm, with the highest monthly precipitation of 290.4 mm in August and the lowest of 24.5 mm in January (http://www.climate.go.kr/ (accessed on 15 May 2021)). Sejong City is a relatively new city, of which development started in 2009 with the aim of dispersing the functions of Seoul, the capital of South Korea. In December 2019, the population of the city reached approximately 340,000 and, together with the advance in urbanization, UHI phenomena are arising [23]. We obtained LST data from the UAV, Landsat, and field measurements for an area of 150 m × 300 m, from the square of the Geum River Park to the Geum River. In the park, grassland and trees grow around the square and sports facilities, which are the main activity spaces for citizens. In addition, there is a wooden deck and a bike path made of concrete and urethane.
We conducted field measurements and collected UAV and Landsat 8 LST data seven times over a period of one year from 9 August 2019 (summer) to 18 August 2020 (summer) (Table 1). The field measurements were conducted and LST data collected under clear skies; however, Landsat 8 LST data for two periods (8/25/2019 and 07/17/2020) were excluded owing to the effects of local fog and cloud. Table 1 shows the weather data for each LST data collection period. Weather data were collected from the Sejong Geumnam automatic weather station (AWS) operated by Korea Meteorological Administration located near the study area. The air temperatures in May, July, and August, which correspond to the spring and summer seasons, were approximately 22–32 °C, and those in October and March, which correspond to autumn and winter, were approximately 12–17 °C.

2.2. Acquisition of UAV TIR LST Data

The UAV TIR LST data acquisition process can be divided into LST data collection through UAV TIR image capture and orthomosaic matching, and a survey of ground control points (GCPs) for accurate georeferencing of the LST data.
As UAV TIR cameras have lower resolutions compared with red, green, and blue (RGB) and multispectral cameras and take single-band images, there is a greater need for GCP data in the orthomosaic construction process than for other cameras [24]. The GCPs were produced in 1 m × 1 m size with corrugated plastic and aluminum tape. Aluminum can be easily identified in comparison with the surrounding environment because the emissivity of aluminum is 0.03–0.07 [25], and its temperature is low in TIR images. In this study, nine GCPs were installed whenever the UAV TIR image was taken, and the Trimble R8s GNSS system (Trimble, Sunnyvale, CA, USA) was used for the central position survey of GPs. The Trimble R8s is equipped with 440 channels and supports GPS and GLONASS satellites.
The UAV TIR images were taken seven times between 9 August 2019 and 18 August 2020. For comparison with Landsat 8 LST images, the images were taken three times for a total flight time of 40 min—in sync with Landsat 8’s image capturing time. The automatic flight and flight parameters of the UAV were set using Pix4Dcapture software (Pix4D S.A., Prilly, Switzerland). The flight altitude of the UAV was 70 m, and the vertical and horizontal overlap for imaging was set to 90% for stable orthomosaic matching. For UAV TIR imaging, the DJI Inspire 1 Pro Platform and Zenmuse XTR, a TIR camera (both from DJI, China), were used. The UAV TIR images were captured in the radiometric JPG file format to measure absolute temperature. The emissivity was set to 0.95 because of the large diversity of land cover materials in the study area [26]. The orthomosaic and UAV LST data were constructed from the acquired UAV TIR images using Pix4D Mapper 4.3 (Pix4D, Prilly, Switzerland). Table 2 shows the specifications of the equipment used for UAV TIR image capture and position correction.

2.3. Landsat 8 LST

Landsat 8 TIR LST data were collected for comparison with UAV LST data and in situ LST data. Landsat 8 is a polar orbit satellite that was developed jointly and launched in 2013 by the National Aeronautics and Space Administration (NASA) and the United States Geological Survey (USGS). The satellite takes photographs of the same areas at 16-day intervals. The mounted sensors are Operational Land Imager (OLI) and Thermal Infrared Sensor (TIRS). The OLI provides band numbers 1 to 9, which are the visible and near infrared (NIR) channels of 30 m spatial resolution. TIRS is a TIR channel that corresponds to bands 10 and 11. TIRS data is acquired with 100 m resolution, resampled by cubic convolution and registered with 30 m OLI data. Each band stores the quantified digital number (DN) values, which can be converted to radiation energy considering the characteristics of each band [27]. Generally used LST retrieval algorithms include the radiative transfer equation (RTE) method, single channel algorithm [28], and mono-window algorithm [29]. We used the RTE model, which was evaluated by Sekertekin et al. [30] as capable of providing high accuracy in Landsat 8-based LST retrieval. The Landsat 8 data were acquired from USGS Earth Explorer (https://earthexplorer.usgs.gov/; accessed on 15 May 2021). To use the RTE model based on the normalized difference vegetation index (NDVI), band 10 of the TIRS sensor and band 4 (red (R)) and band 5 (NIR) of the OLI sensor were used in the LST retrieval method.
The RTE method performs LST retrieval using a single TIR band. The equation is as follows:
L λ at - sensor = ε B λ T S + 1 ε L λ τ + + L λ
where L λ sat - sensor is the radiance registered in the at-sensor of the thermal band (W∙m−2∙sr−1∙μm−1), B λ is the blackbody radiance (W∙m−2∙sr−1∙μm−1), T S is the surface temperature, L λ is the downwelling path radiance, L λ is the upwelling path radiance, τ   is the atmospheric transmittance, and ε is the surface emissivity. The downwelling path radiance, upwelling path radiance, and atmospheric transmittance were obtained using the atmospheric correction parameter calculator (https://atmcorr.gsfc.nasa.gov/; accessed on 15 May 2021). Surface emissivity   ε   was obtained by using the threshold of the NDVI proposed by Sobrino et al. [31].
The equation for B λ T S is as follows:
B λ T s = L λ at - sensor L λ τ 1 ε L λ τ ε
Finally, T S can be calculated from the inversion of Planck’s law, as follows:
T s = K 2 ln K 1 L λ at - sensor L λ τ 1 ε L λ τ ε + 1
For the number 10 band K 1 of Landsat 8, a constant of 774.89 (watt/(m2∙srad∙μm)) was applied, and for K 2 , a constant of 1321.08 K (Kelvin) was applied.
The Landsat8 LST data used in this study are listed in Table 3 below.

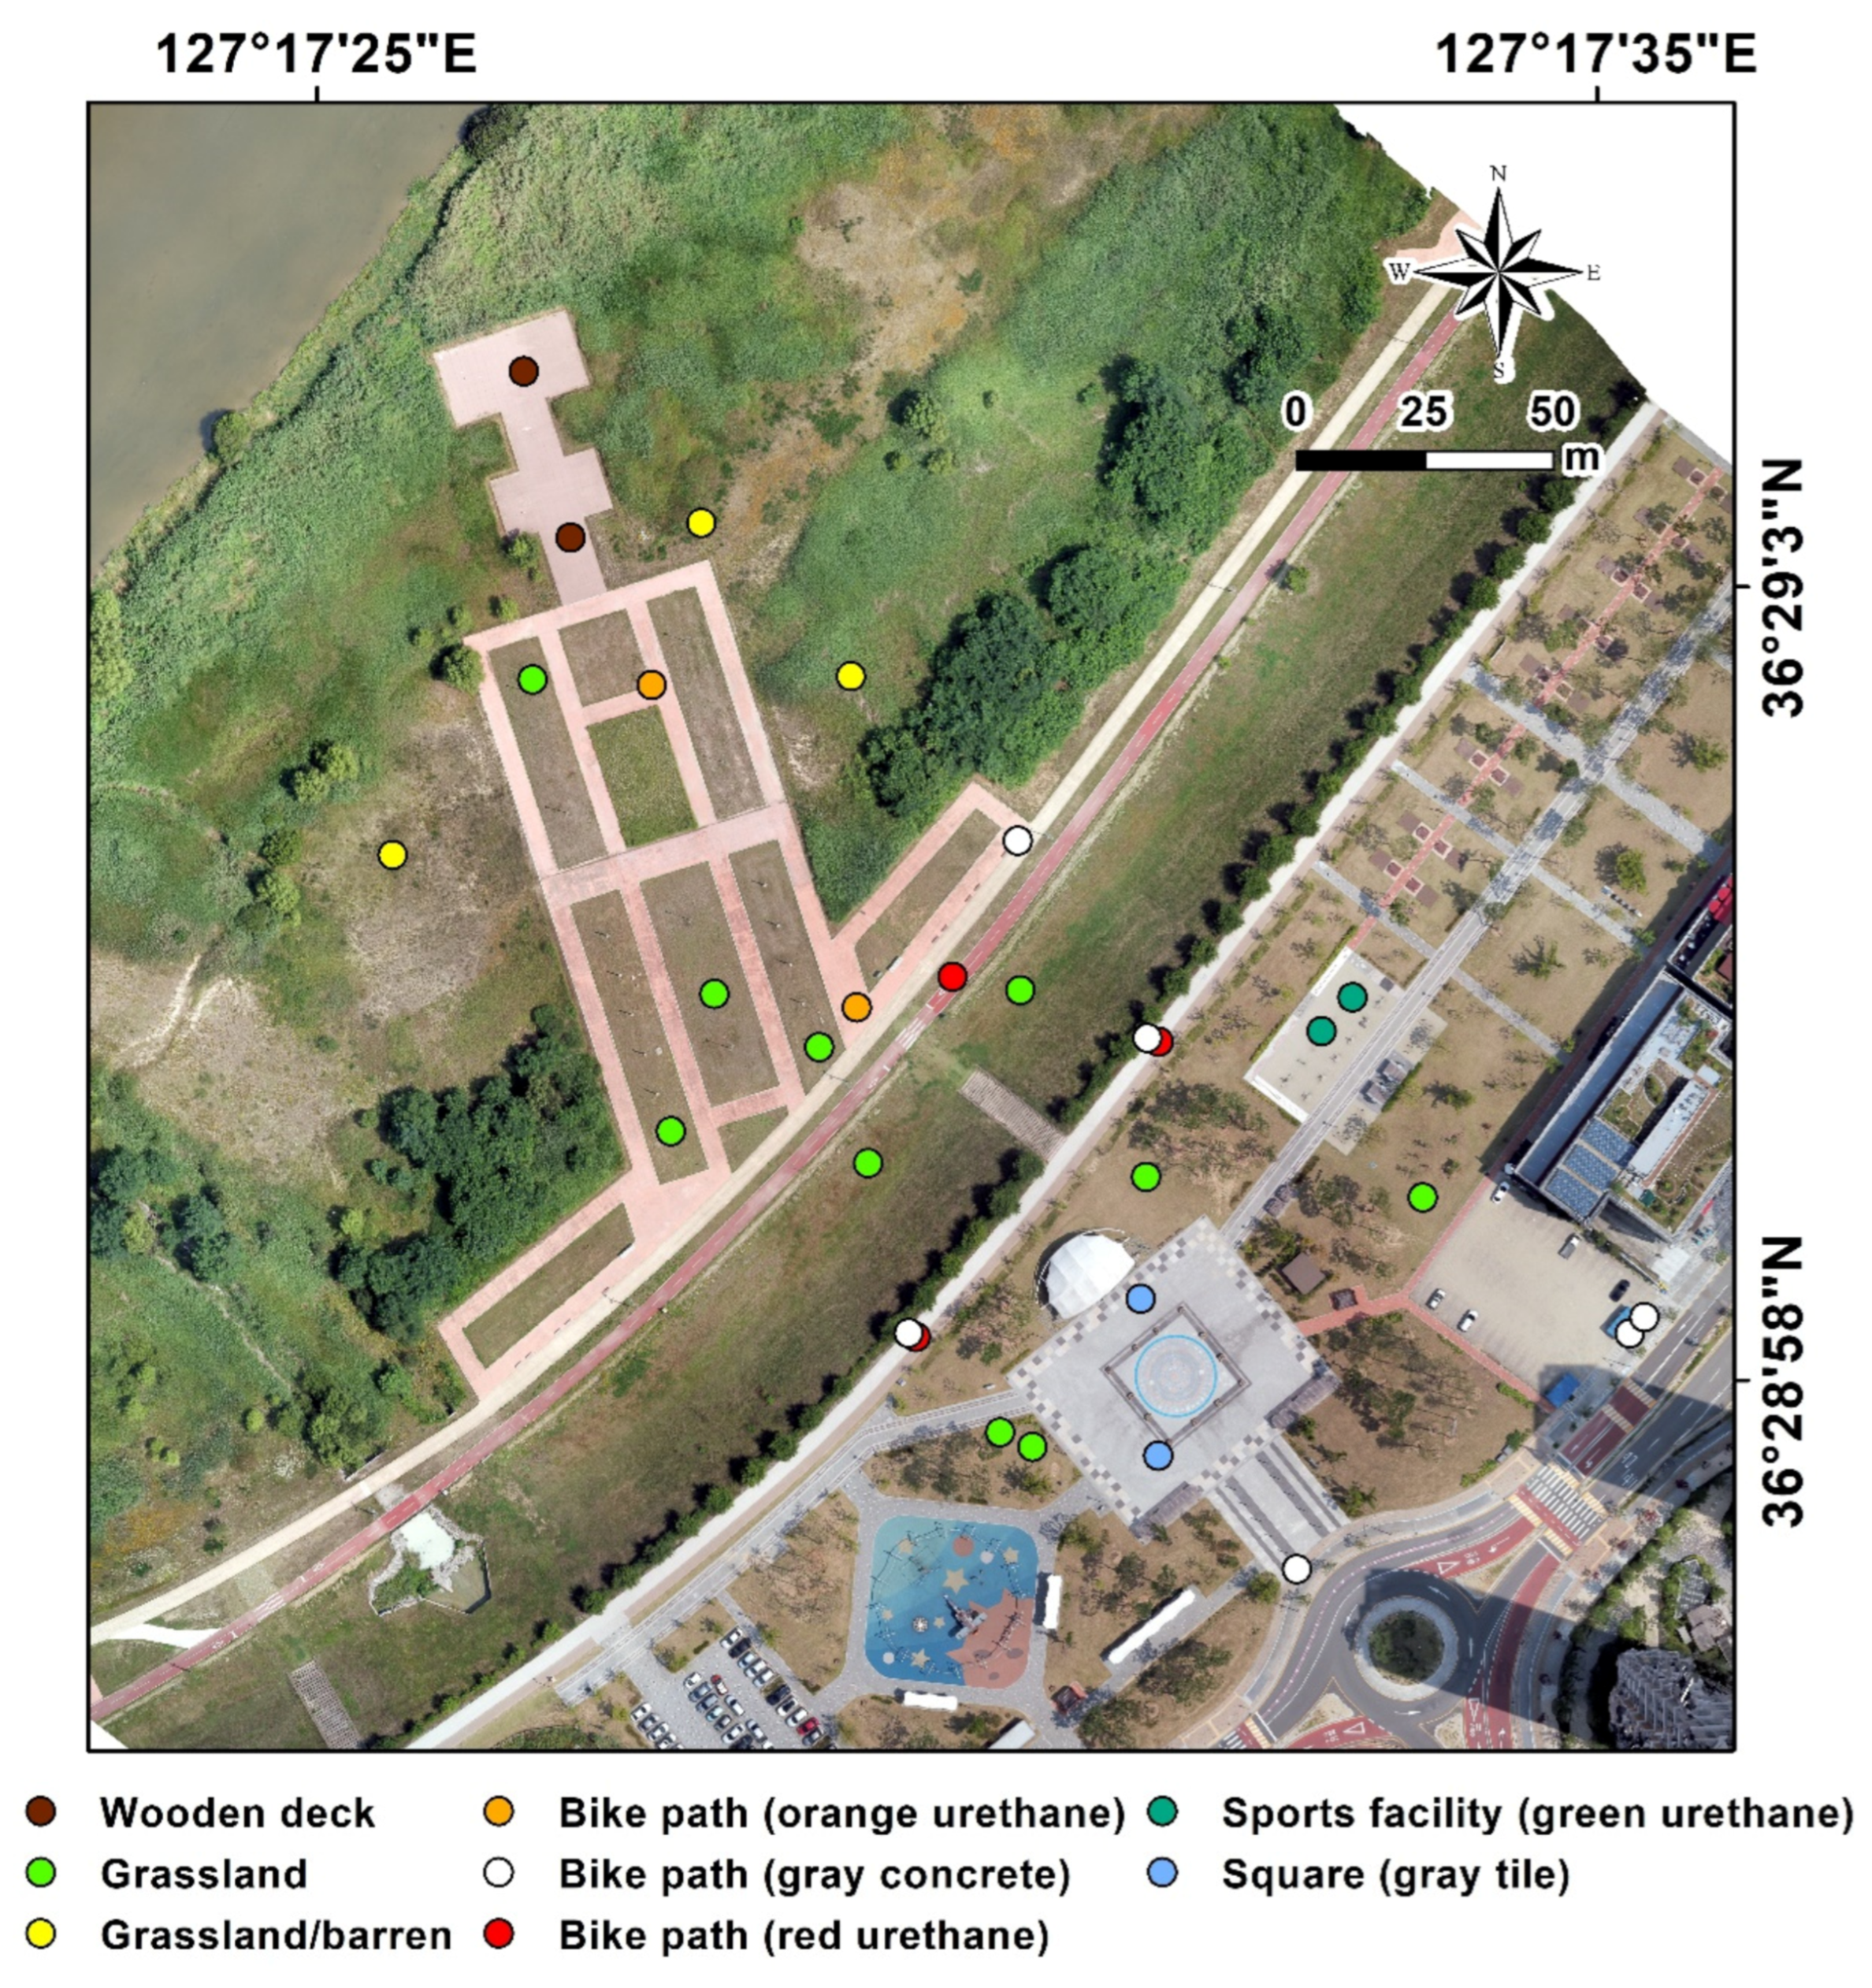
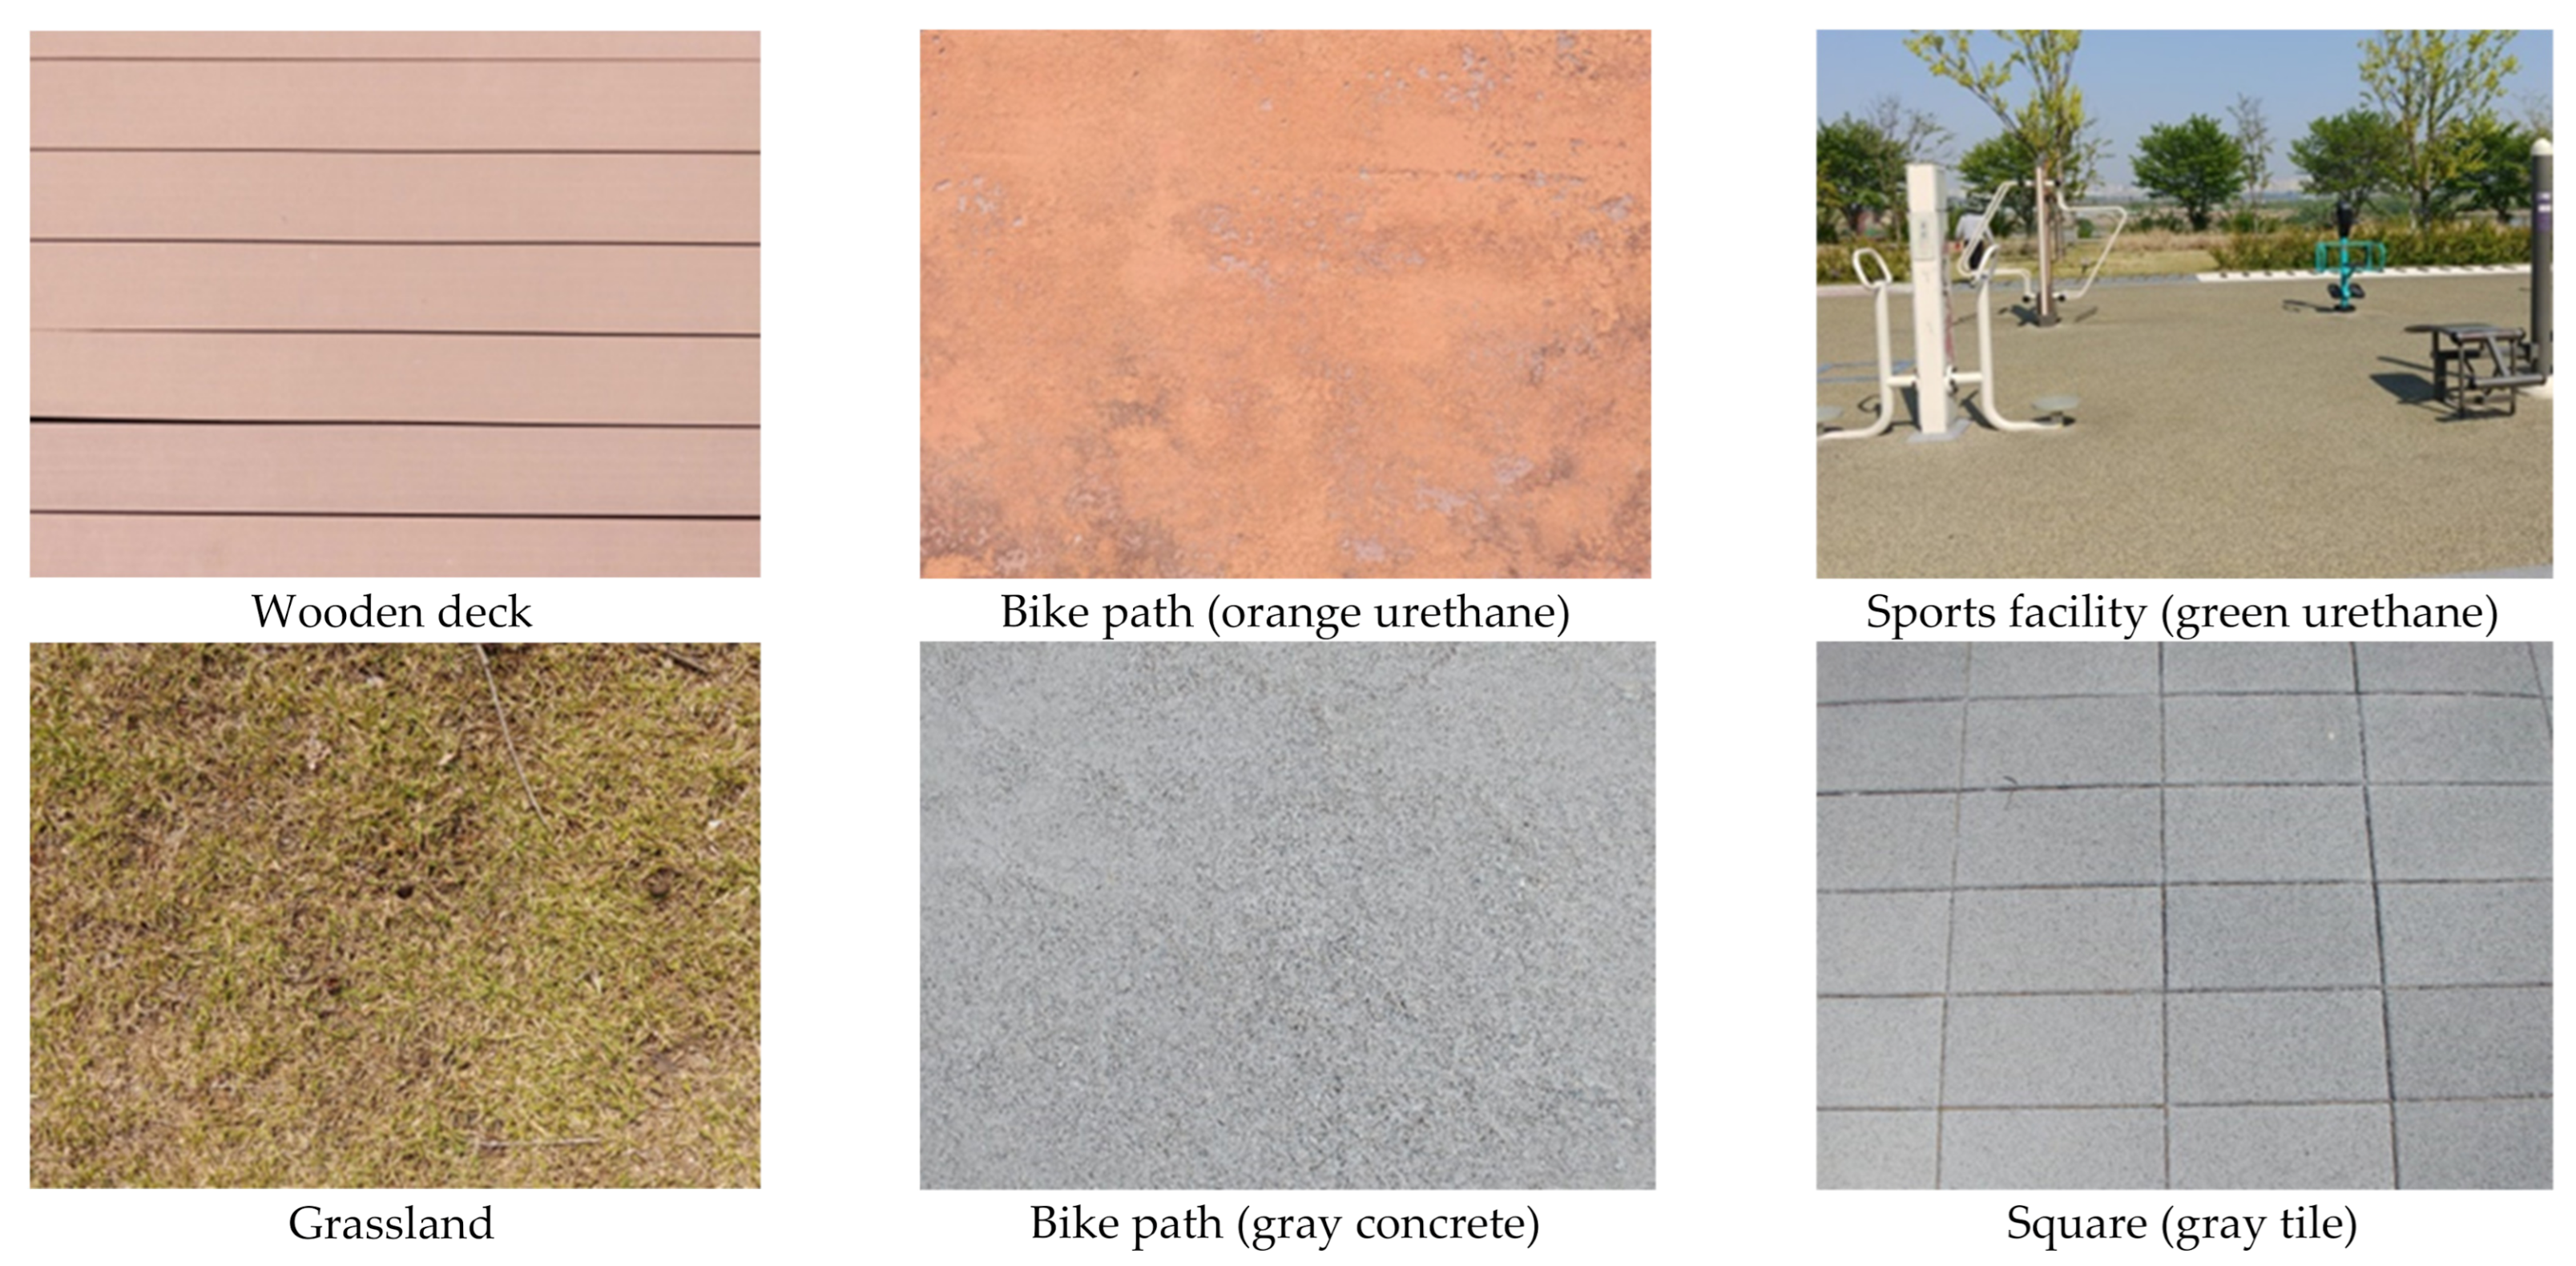
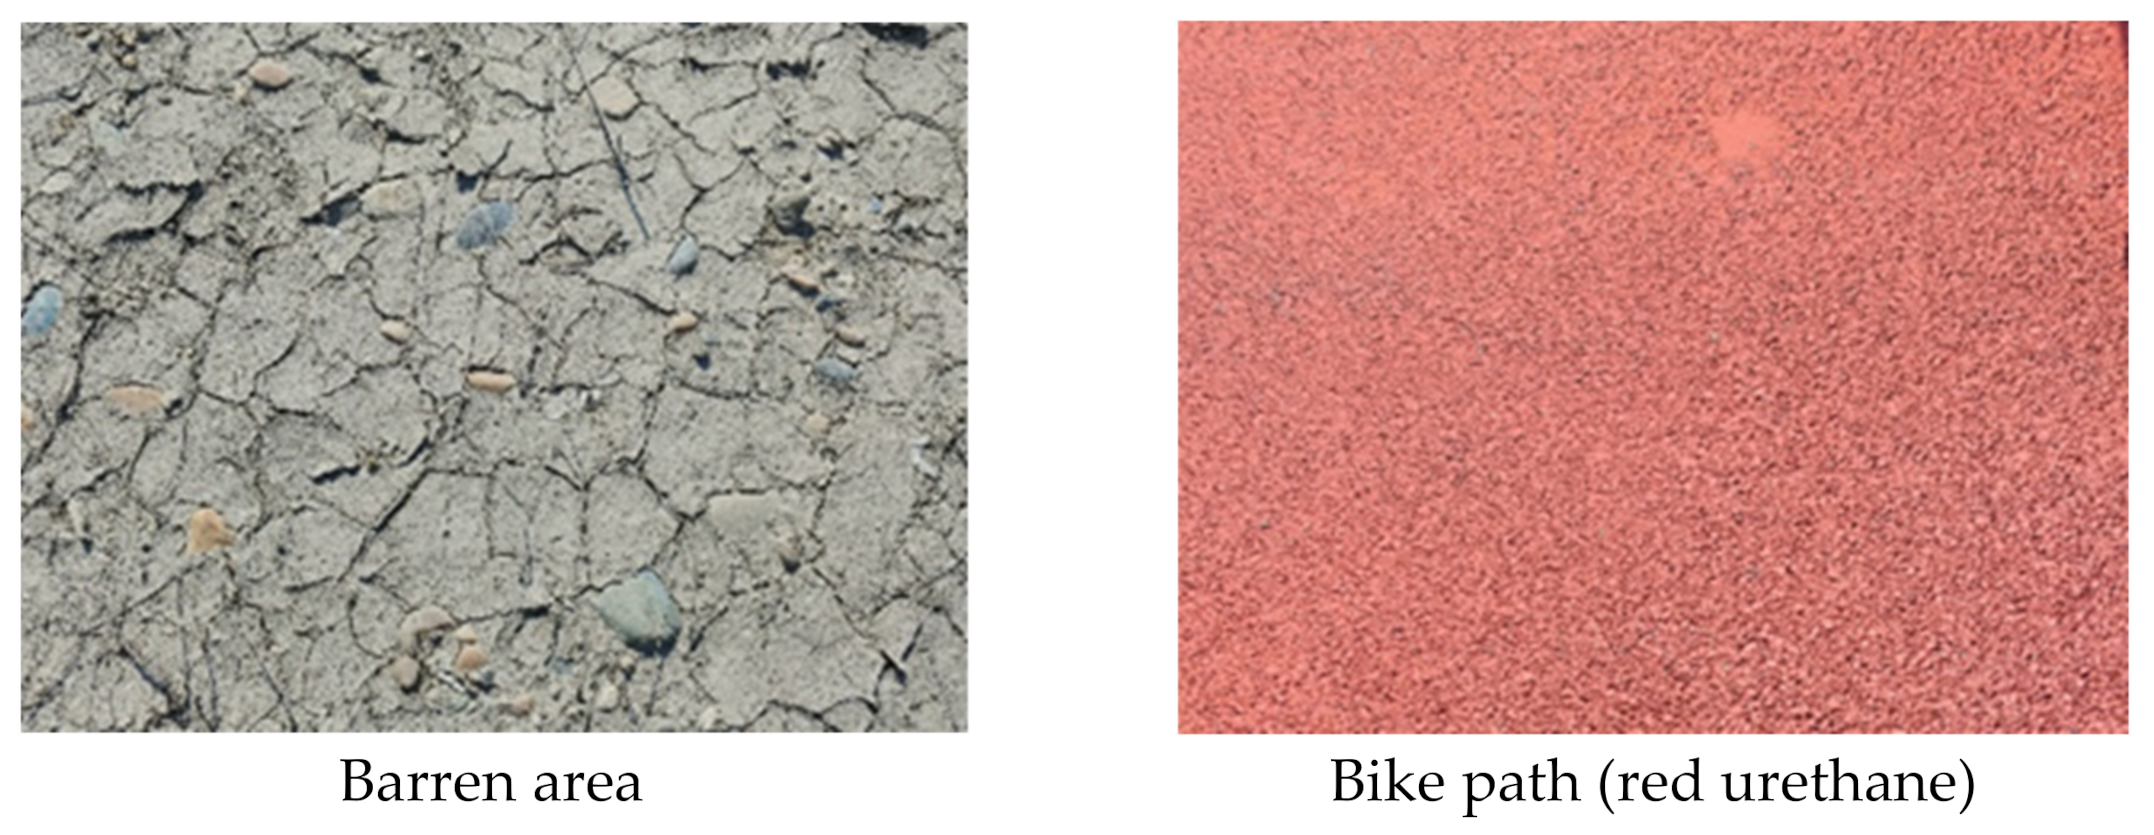
2.4. Measurement of In Situ LST

To evaluate the accuracy of LST data based on UAV and Landsat 8, we set LST CPs in the field. Thirty LST CP points were selected by period considering the land cover type of the study area and the flight path and time of the UAV (Figure 2). The number of CPs for land cover types were distributed in limited number in the study area, such as green urethane (2 points) around the sports facility, wooden deck (2), and gray tile (2) around the square area. The largest number of CPs (13) was distributed over the largest area, namely the grassland. Among these, three CPs near the river temporarily transformed to barren area in March and May. The bike paths were measured using CPs for gray concrete (6), red urethane (3), and orange urethane (2). The on-site photograph of the measured area is shown in Figure 3.
We performed LST CP using a contact thermometer Testo 925 (±0.5 °C) (Testo, Sparta, NJ, USA). At every LST CP, the measurement was conducted within 5 min of the UAV TIR imaging, and the average value was used after three measurements on the surface. The location information of the in situ LST measurement point was acquired using the Trimble R8s GNSS (Trimble, USA).

2.5. Accuracy Verification of UAV TIR LST and Landsat 8 TIR LST

The accuracy of the UAV TIR LST and Landsat 8 TIR LST was evaluated based on the in situ LST. Linear regression was performed, and the root mean square error (RMSE) was determined by comparing the measurements of the UAV TIR LST and Landsat 8 TIR LST corresponding to the in situ LST measuring points. The accuracy was evaluated by LST data construction time and land cover type.

3. Results

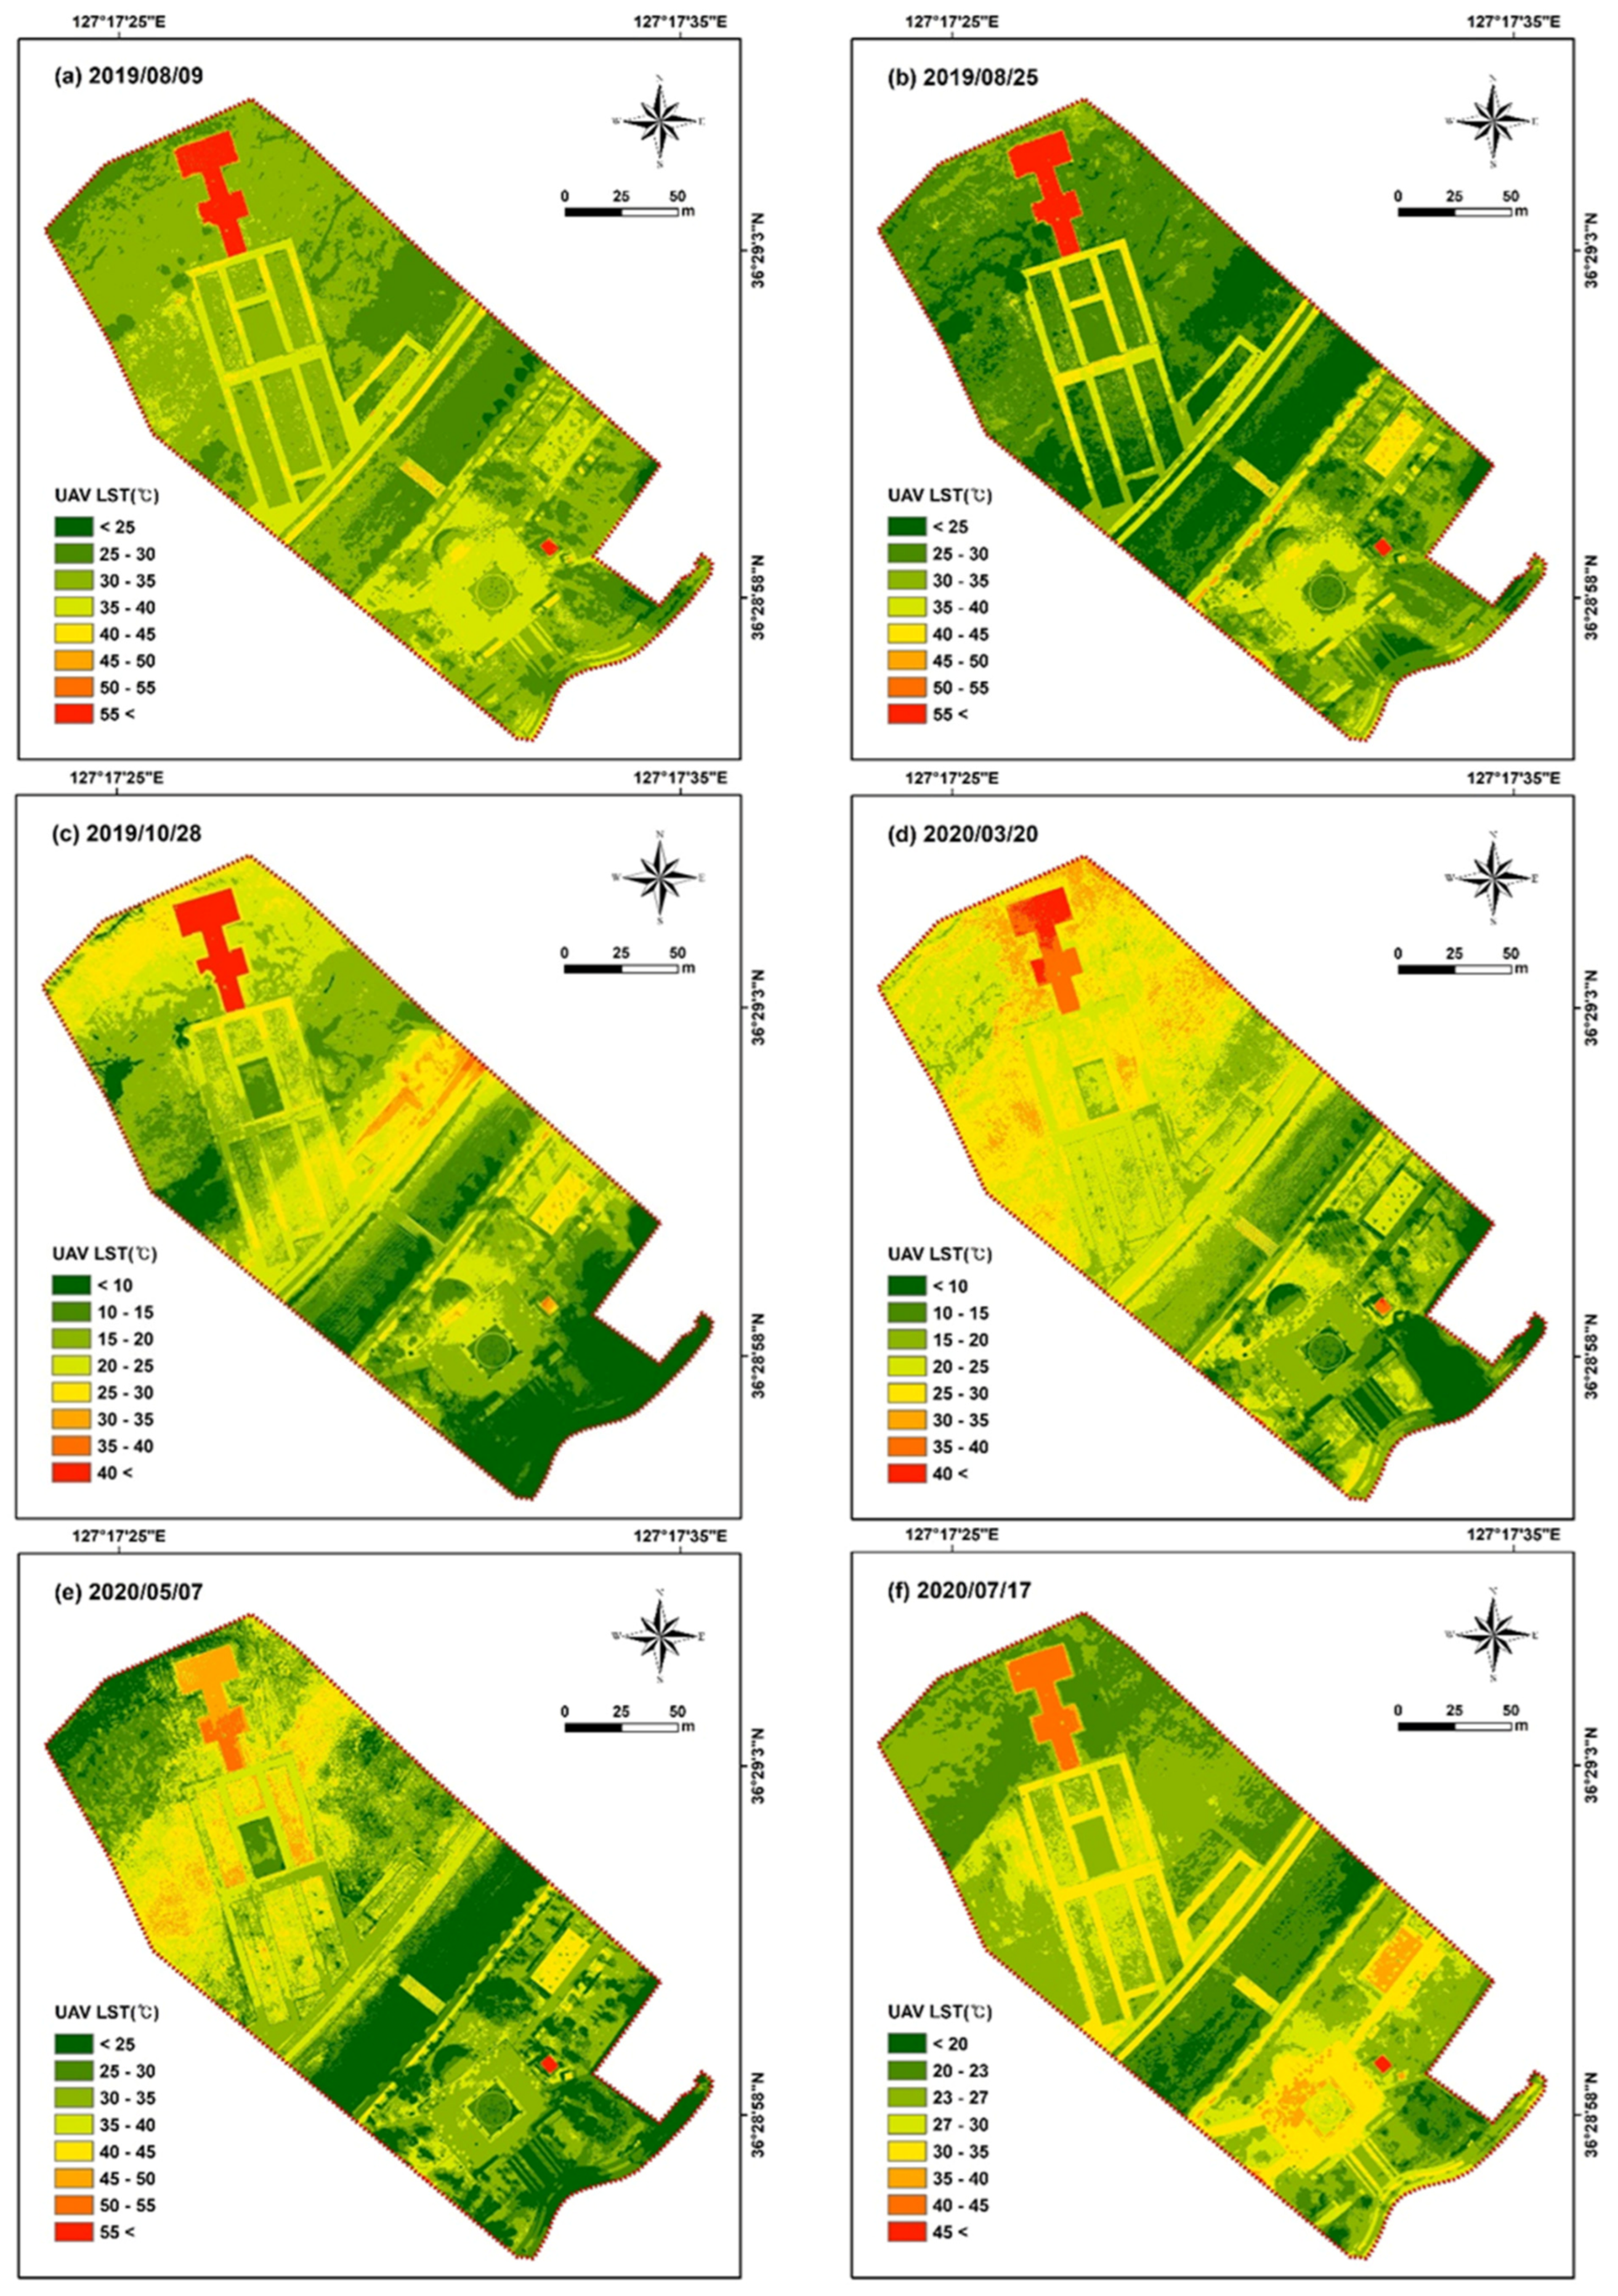
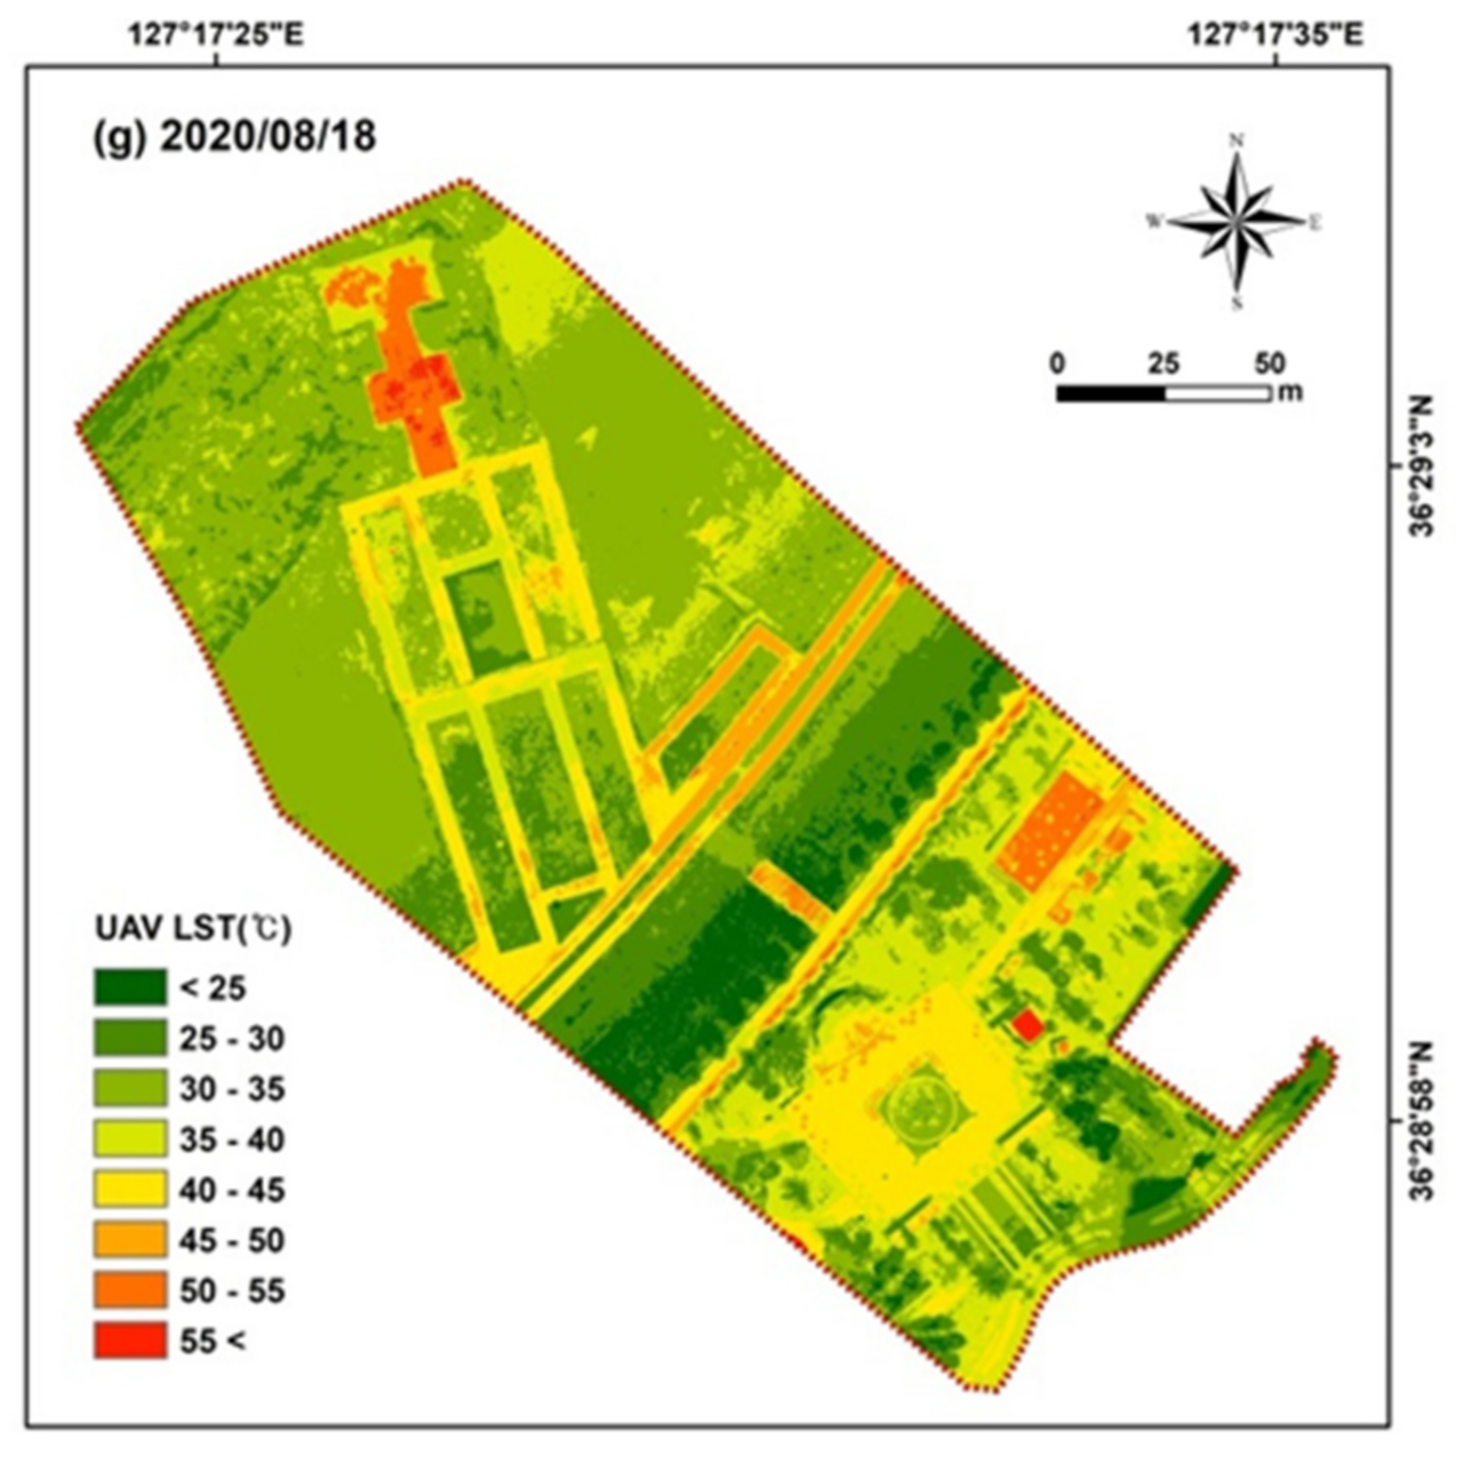
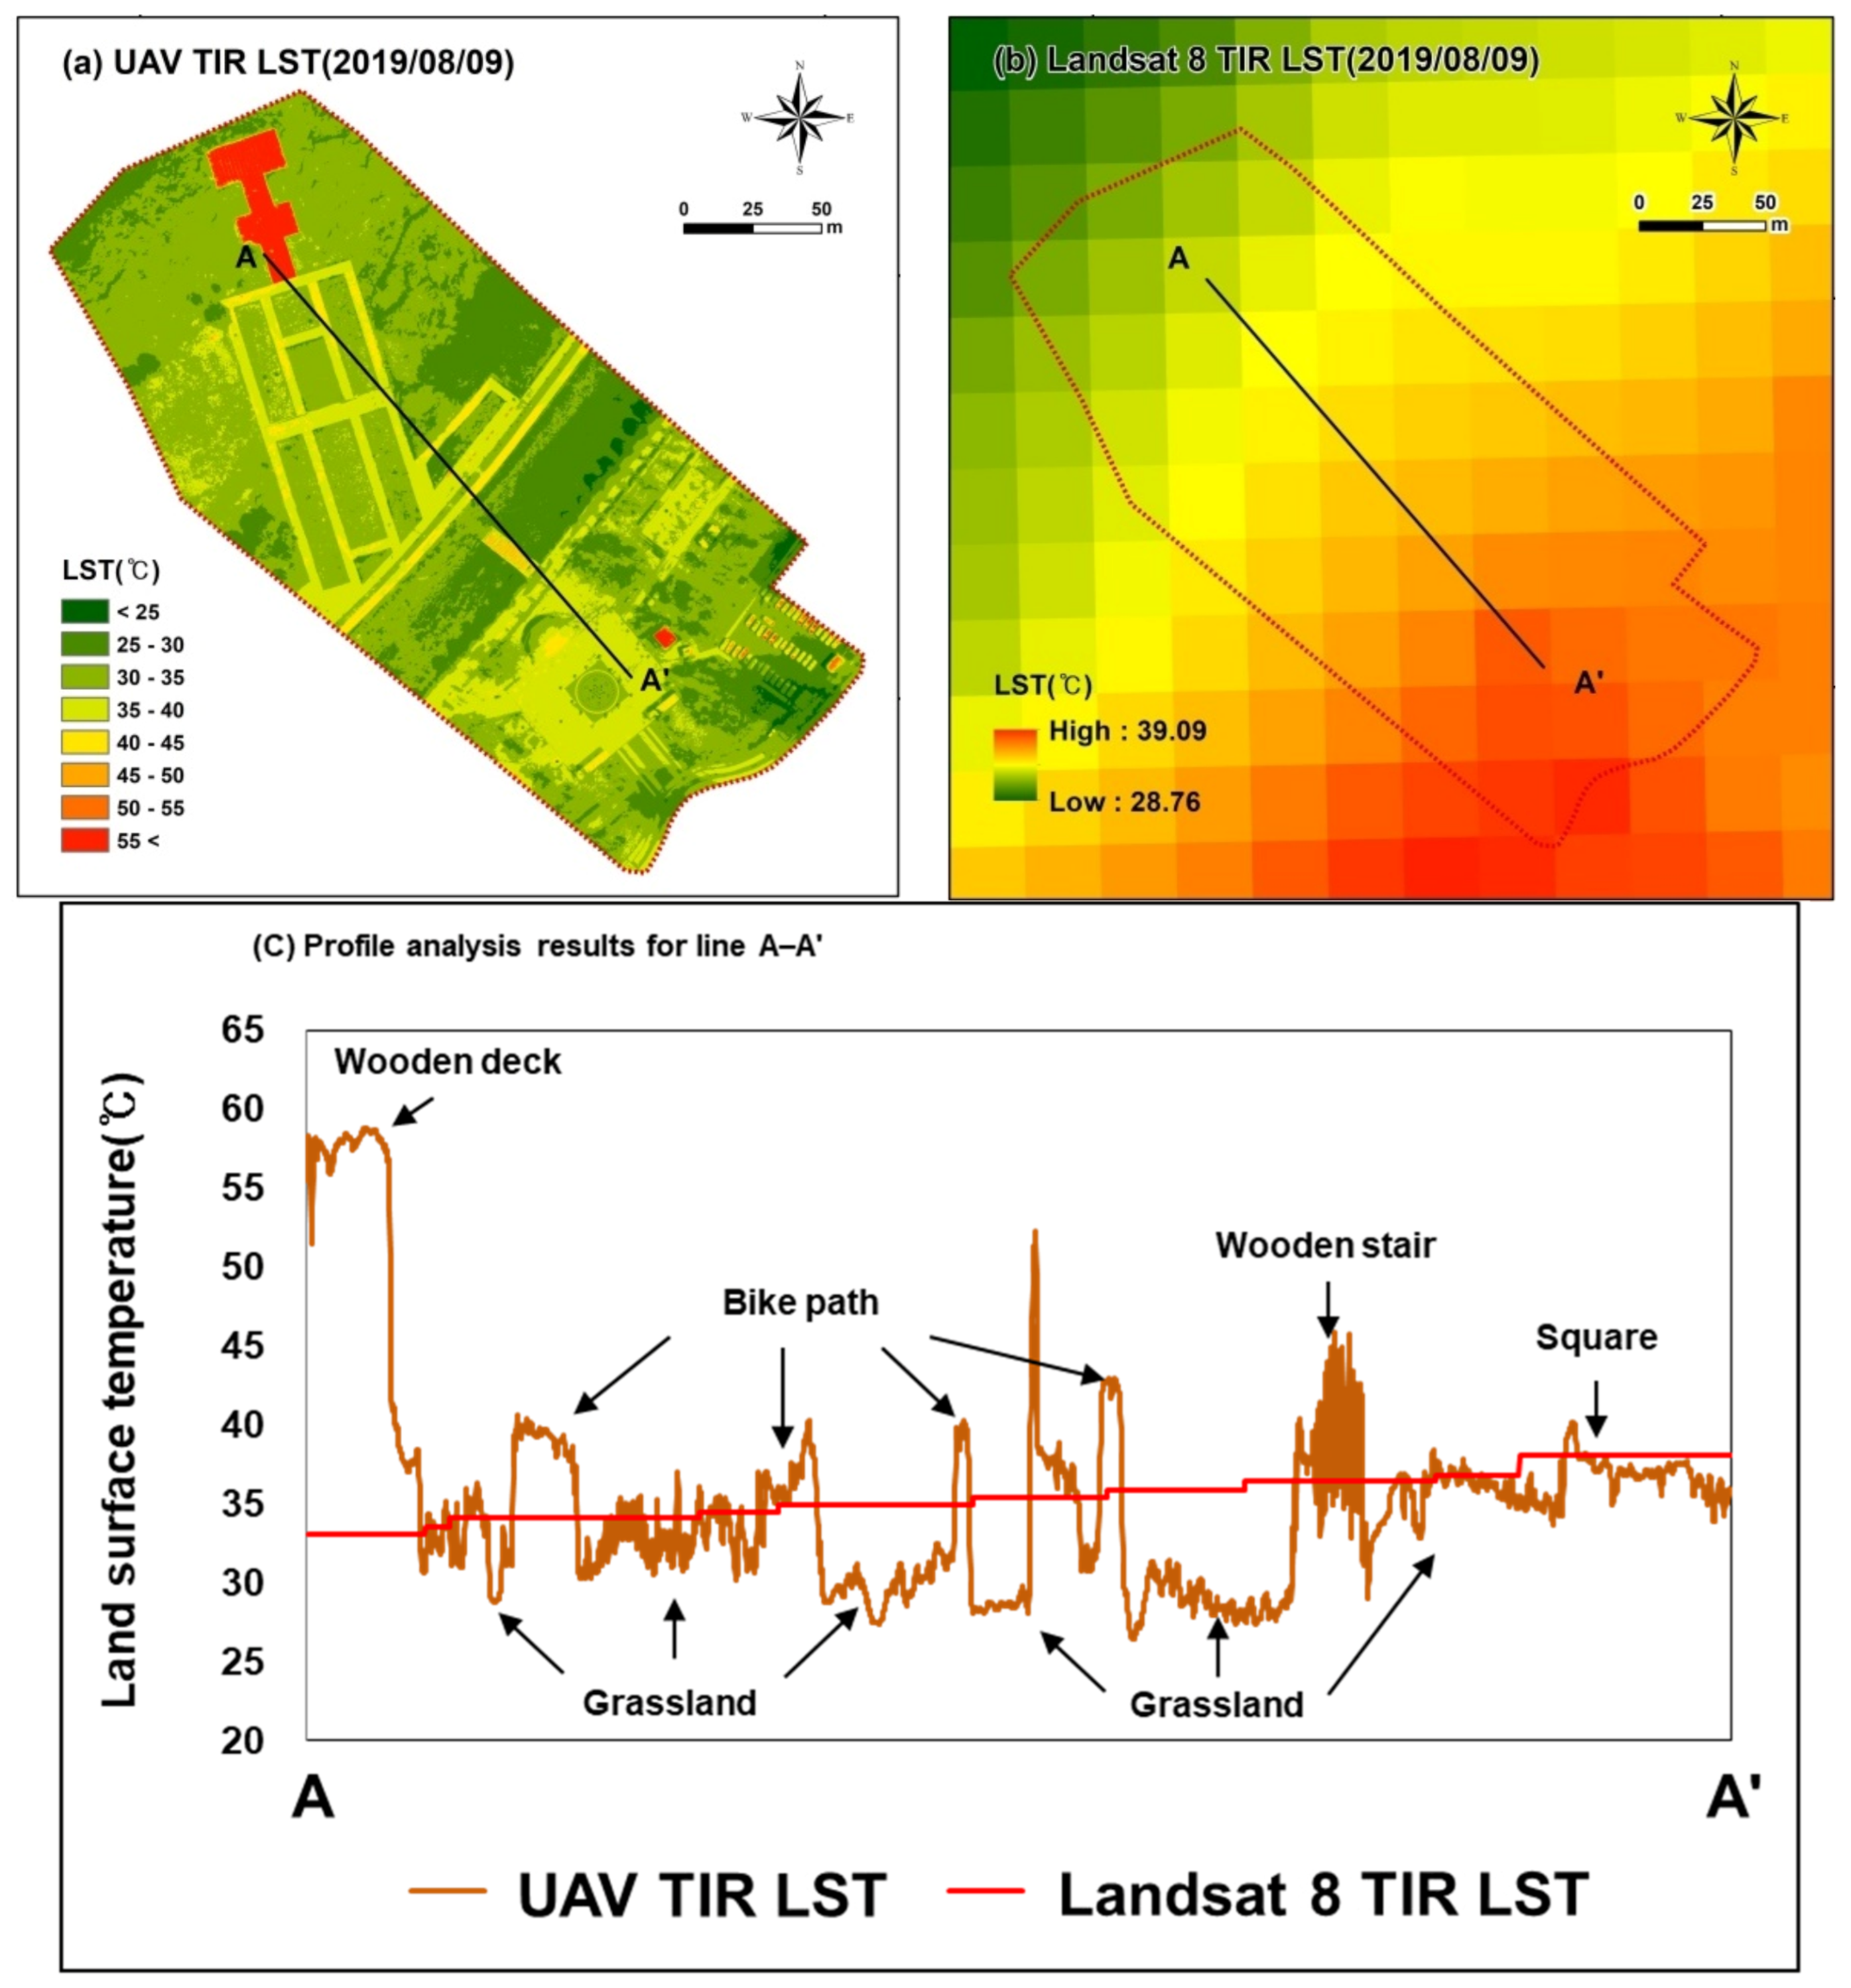
3.1. UAV TIR LST Data

The UAV LST TIR data, at a spatial resolution of approximately 0.09 m, were collected for seven periods in March, May, July, August, and October over one year (Figure 4). Table 4 shows the average value of UAV TIR LST data by land cover for all periods. The UAV TIR LST data were measured for grassland, the largest land cover type in the study area, as well as for the square, sports facilities, wooden deck, and bike path that are distributed only partially. The LST measurements differed according to the period and land cover type. Some buildings in the study area for which it is difficult to measure in situ LST were excluded from the analysis. The total average LST of the study area on 9 August 2019 was 32.89 °C. The LST of the wooden deck was the highest at approximately 58 °C, and that of the grassland, roadside trees, and the places shaded by the building to the southeast of the study area were the lowest at approximately 23 °C. The LSTs of the square (gray tile) and sports facility (green urethane), which are the major activity sites for people, were approximately 38 °C and 36 °C, respectively. The LSTs of the bike path varied by color and material, with the LST of gray concrete increasing to approximately 37 °C, and that of red and orange urethane increasing to approximately 43 °C. The average for 25 August 2019 was 29.57 °C, approximately 3 °C lower than that of August 9. The LST of the wooden deck was still high at approximately 57 °C, but that of the grasslands, roadside trees, and shaded places around buildings, where the LST had been lower than 25 °C, increased. The LSTs of the square (gray tile) and the sports facility (green urethane) were approximately 37 °C and 42 °C, respectively. Among the bike paths, the LST of the gray concrete increased to approximately 40 °C, and that of the red and orange urethanes increased to approximately 47 °C. On 28 October 2019, as the season changed from autumn to winter, the solar altitude decreased and the temperature fell, the average LST was 16.56 °C, i.e., approximately 13 °C lower than in August. The LST of the wooden deck was the highest at approximately 40 °C, and that of grassland, roadside trees, and shaded places around buildings decreased to a low of approximately 7 °C. The shaded areas increased as the shade became longer than in August. The LST of the square (gray tile) was 17–21 °C, and that of the sports facility (green urethane) was approximately 28 °C. Among the bike paths, the LST of the gray concrete was approximately 18–23 °C, and that of the red and orange urethane was 23–28 °C. However, for all types of bike paths, the LST of some parts increased to approximately 47 °C. On 20 March 2020, the time when the season changed from winter to spring, the average LST increased to 20.59 °C. The LST of the wooden deck was the highest at approximately 39 °C, whereas that of the grasslands, roadside trees, shaded places around buildings, and the gray tiles around the square were the lowest at approximately 7 °C. The LST of the square (gray tile) was approximately 13–18 °C, and that of the sports facility (green urethane) was approximately 24 °C. Among the bike paths, the LST of the gray concrete was approximately 13–21 °C, whereas that of the red and orange urethane were 25–27 °C and 19–26 °C, respectively. In addition, the LST of the location that changed from grassland to barren area was approximately 31 °C, i.e., higher than the LST of the surrounding grassland. On 27 May 2020, in springtime, the average LST increased to 31.11 °C. The LST of the wooden deck was the highest at approximately 50 °C, whereas that of grassland, roadside trees, and shaded places around buildings were the lowest at approximately 20 °C. The LST of the square (gray tile) was approximately 33 °C, and that of the sports facility (green urethane) approximately 42 °C. Among the bike paths, the LST of the gray concrete was approximately 27–35 °C, and that of red and orange urethane were 37–44 °C and 31–36 °C, respectively. The LST of the barren area, where grass had not grown yet, was approximately 40–47 °C, i.e., higher than the LST of surrounding grassland. On 17 July 2020, it was still summer, but the average LST was 25.86 °C, approximately 5 °C lower compared with the measurement of 7 May 2020. Apparently, this finding could be ascribed to the difference in solar radiation on the surface because of the effect of local cirrus clouds. The LST of the wooden deck was the highest at approximately 41 °C, whereas that of grassland and the locations shaded by roadside trees was the lowest at approximately 19 °C. The LST of the square (gray tile) was approximately 34 °C, and that of the sports facility (green urethane) was approximately 36 °C. Among the bike paths, the LST of the gray concrete was approximately 26–30 °C, whereas that of red and orange urethane were 32–36 °C and 27–33 °C, respectively. The average LST on 18 August 2020 increased to 34.36 °C. The highest LST, approximately 53 °C, was that of the wooden deck and the sports facility (green urethane). It is believed that the LST of the wooden deck was low because of the effect of the river sediments accumulated thinly on the surface of the deck. The LSTs of the square (gray tile) and the sports facility (green urethane) were approximately 42 °C and 51 °C, respectively. Among the bike paths, the LST of the gray concrete was approximately 37–48 °C, whereas that of red and orange urethane were 44–51 °C and 39–48 °C, respectively.
The analysis results of UAV LSTs in spring, summer, and autumn showed that the LST of grassland was the lowest among the land cover types, whereas the LSTs of the wooden deck, square, and the places around sports facilities were high. Among the bike paths, red urethane showed the highest LST, followed by orange urethane and gray concrete. Factors that influenced LST in addition to land cover were weather variables such as cloud, roadside trees, and the shade cast by buildings.

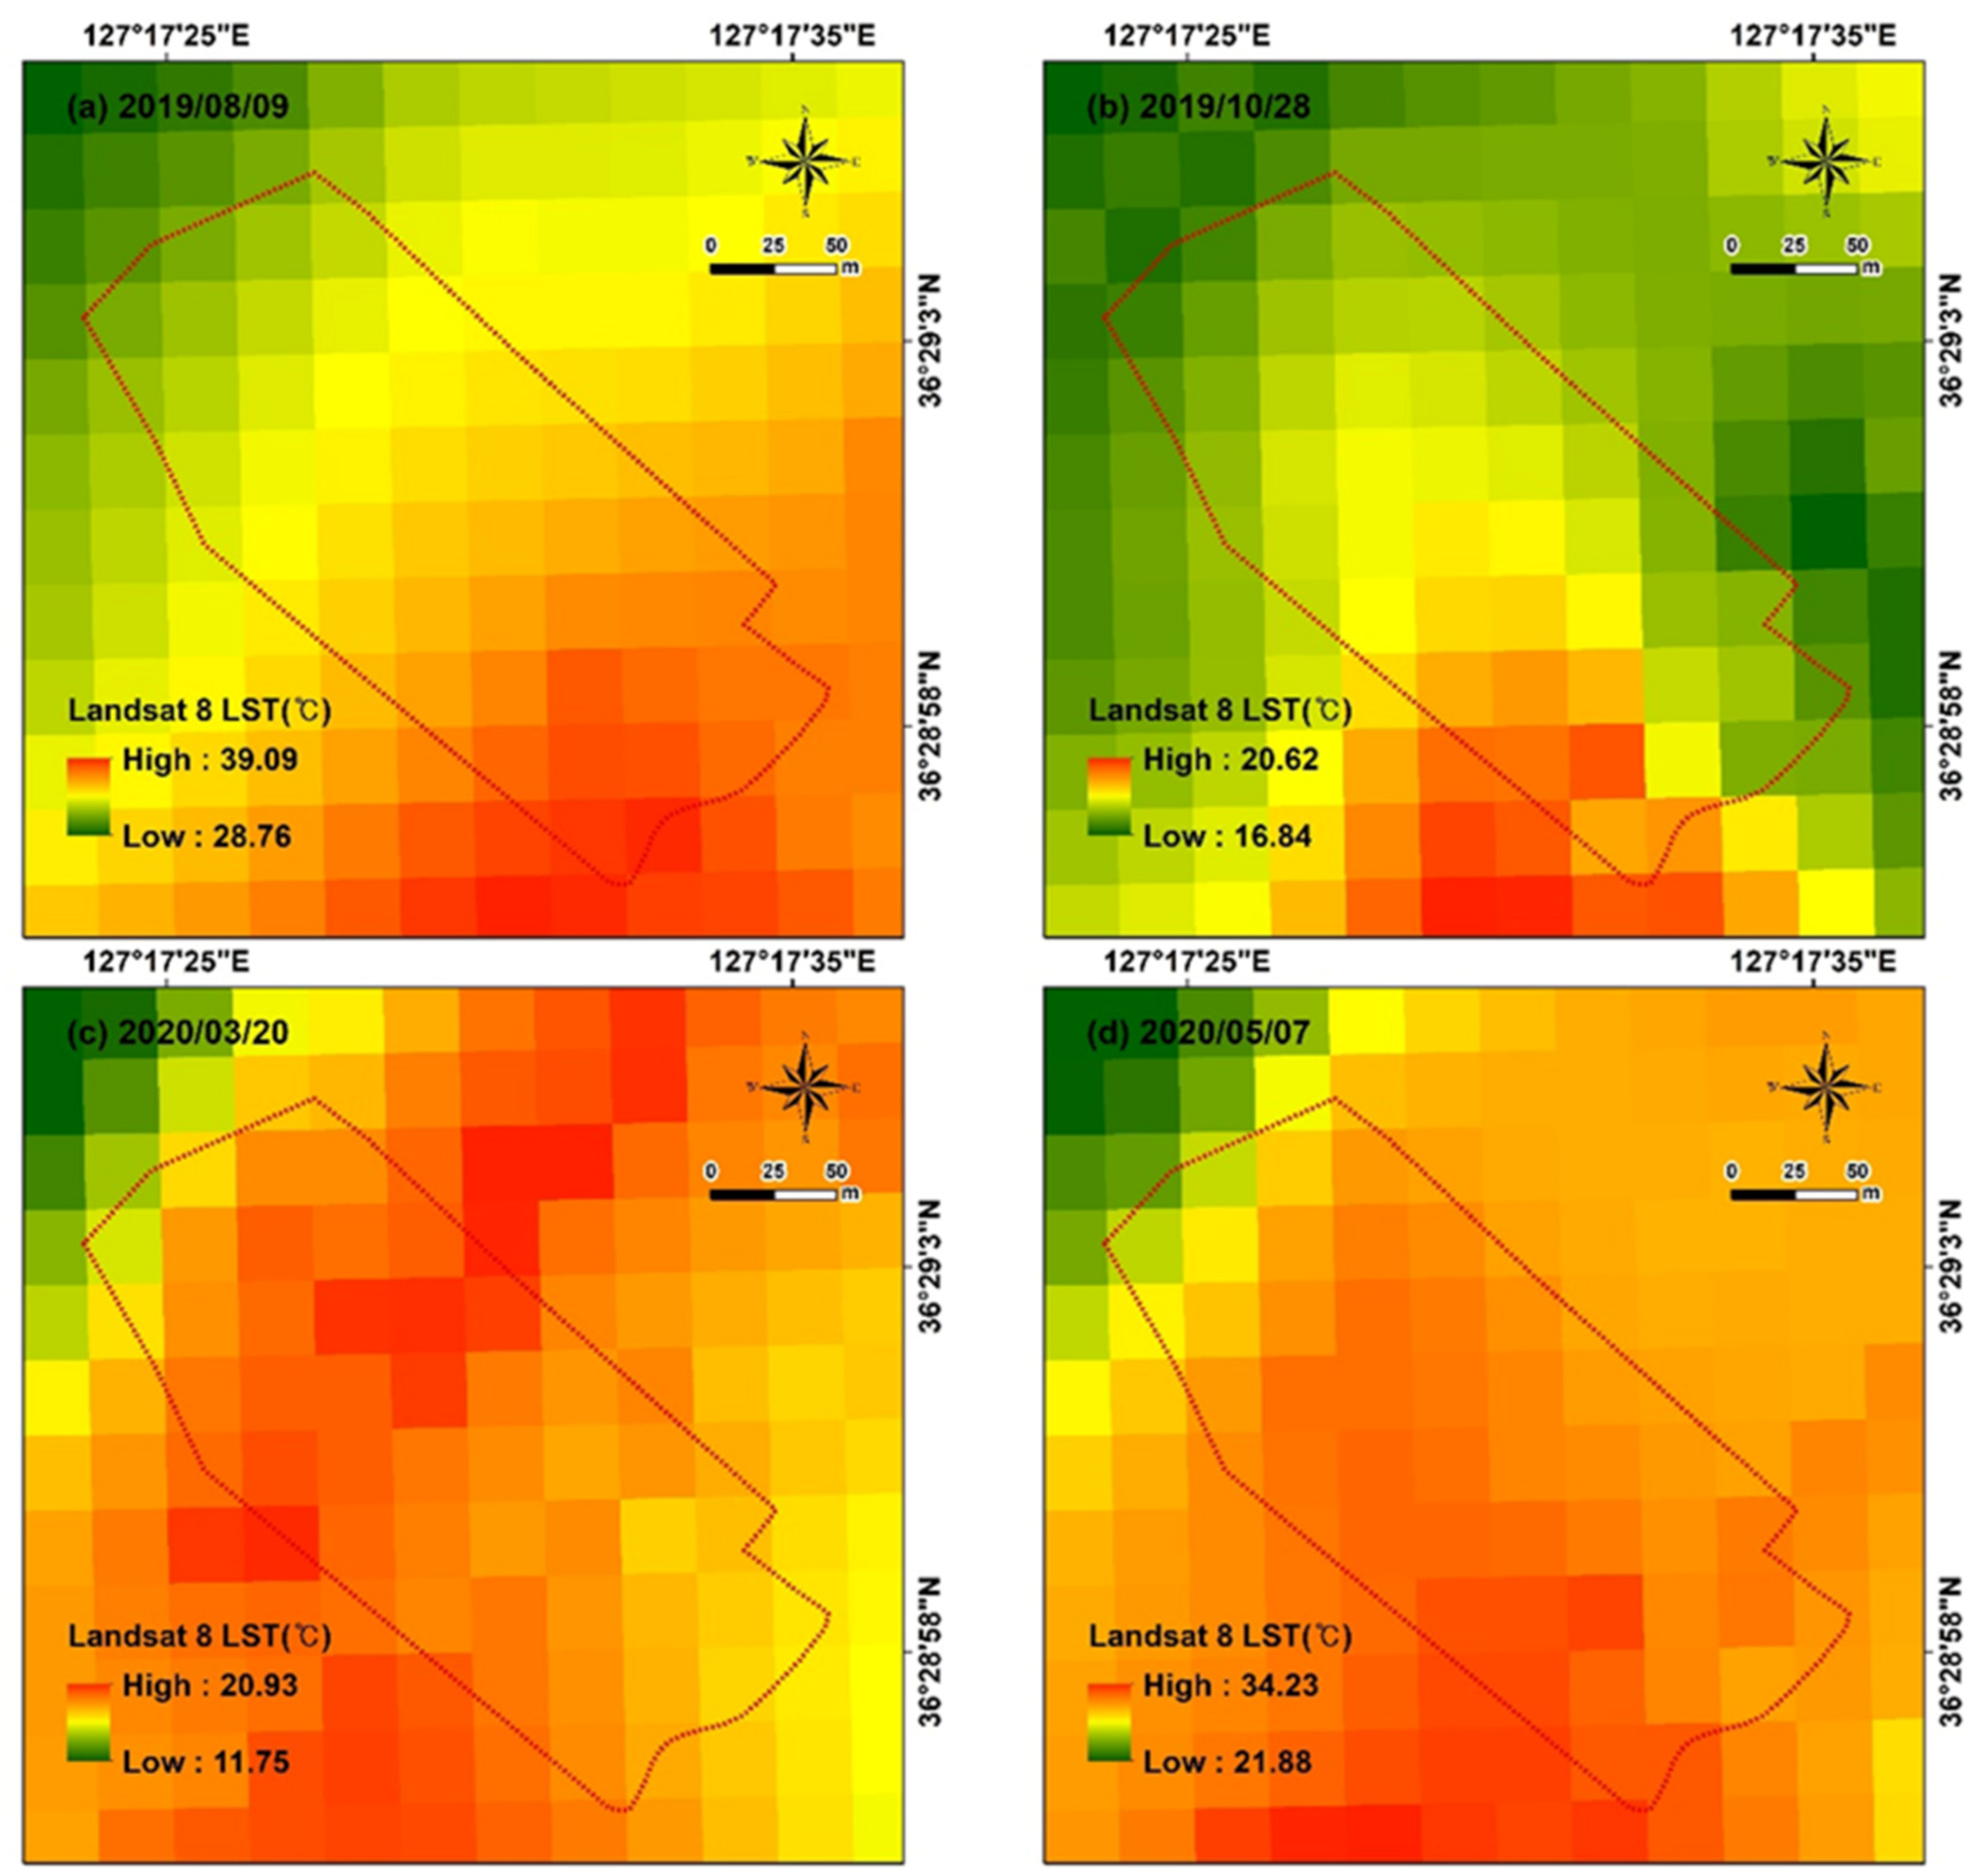
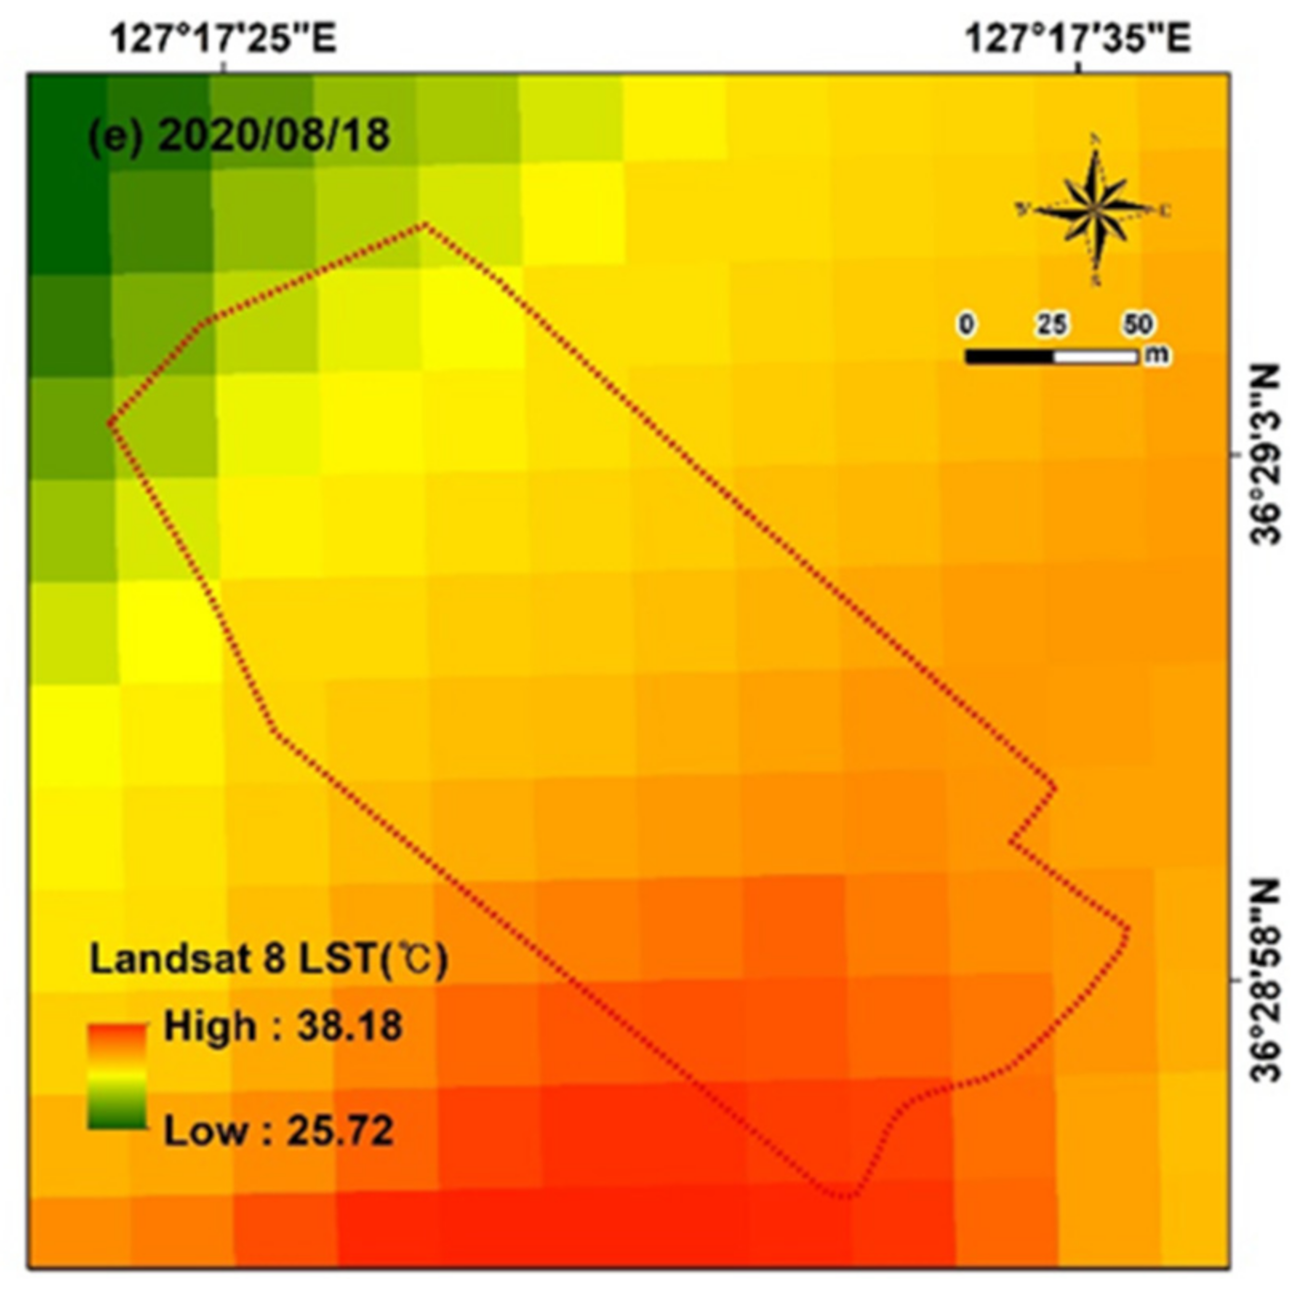
3.2. Landsat 8 TIR LST

The Landsat 8 LSTs of five periods in March, May, August, and October over one year were collected using the Landsat 8 TIR images (Figure 5). The data of 115 paths 35 rows (9 August 2019; 28 October 2019; 20 March 2020; and 7 May 2020), and 116 paths 35 rows (18 August 2020) were used for each period, excluding the Landsat 8 LST data of two periods (25 August 2019 and 17 July 2020) when LST calculation was limited because of local fog and cloud. The spatial resolution of the Landsat 8 LST data was 30 m, and the number of cells corresponding to the study area was 60 in each period. Table 5 shows the average value of UAV Landsat8 LST data by land cover for all periods.
The distribution of Landsat 8 TIR LSTs in summer on 9 August 2019 was approximately 28–39 °C. The LST of locations near the river was the lowest, and that of the central park area the highest, implying that the LST increased with increasing distance from the river. The LST in autumn on 28 October 2019 was approximately 16–20 °C, i.e., approximately 10 °C lower than in August. Similar to August, the LST showed an increasing trend from a location near the river to the square. On 20 March 2020, when the season changed from winter to spring, the LST was approximately 11–20 °C. The location near the river showed the lowest LST, and the LST of the barren area was higher than was that of the square. On 7 May 2020, as the season changed from spring to summer, the solar altitude increased and the temperature rose, the LST increased to 21–34 °C, with the LST near the river being approximately 25 °C, and that of the square approximately 33 °C. While the LST of the barren area was high at approximately 32 °C, generally, the LST showed an increasing trend from the river to the square. On 18 August 2020, the time of highest temperatures of the year, the LST increased to 25–38 °C, with an increasing trend in LST shown from the river to the square.
In all periods, the Landsat 9 LST data in the grassland near the river were the lowest, and highest closer to the square. This appears to reflect the characteristics of the LSTs in the grassland and square, which are distributed broadly in the study area. The LST characteristics of the land cover types of wooden deck, bike path, and sports facilities, which have relatively small areas, did not show clearly.

3.3. Measurement of In Situ LST

The in situ LSTs were measured at 210 CPs, with 30 CPs for each land cover type in each period (Table 6). The average LST for all periods was the highest in the wooden deck, followed by the sports facility (green urethane, 36.77 °C), bike path (red urethane, 36.06 °C), square (gray tile, 33.89 °C), bike path (orange urethane, 33.4 °C), barren area (32.79 °C), and bike path (gray concrete, 30.03 °C). The grassland showed the lowest LST at 28.74 °C. According to period, the average LST in May, July, and August, and the average LST in March and October showed differences of 10 °C minimum to 17 °C maximum. The average LST was the highest on 18 August 2020 at 40.15 °C, whereas it was the lowest on 28 October 2019 and 20 March 2020 at 22.39 °C and 23.03 °C, respectively. According to land cover type, the average LST of the wooden deck on 8 August 2019 was the highest at 53.83 °C, whereas that of the bike path (gray concrete) on 20 March 2020 was the lowest at 18.24 °C.
The standard deviation of the measured LST varied according to the land cover type and, in all periods, all land cover types showed standard deviations of 6 °C or more. The standard deviations were high in the bike path (gray concrete, 8.63 °C), sports facility (green urethane, 8.47 °C), bike path (red urethane, 8.28 °C), and square (gray tile, 7.29 °C). In contrast, the standard deviations were relatively low in the wooden deck (6.66 °C), bike path (orange urethane, 6.66 °C), grassland (6.63 °C), and barren area (6.47 °C).
As regards the characteristics by period, the LST in the wooden deck showed low standard deviations of approximately 1 °C or even lower from 8 August 2019 to 17 July 2020, with a high standard deviation of 3.3 °C on 18 August 2020. This is believed to be the effect of the sediments generated by the flooding of the nearby river before measurement. The square (gray tile) showed LST standard deviations of approximately 1 °C in every period, lower than those of other land cover types. The LST measurement points of the wooden deck and gray tile land cover types had low effects of shade and variations in solar radiation because there were fewer roadside trees, facilities, and buildings around them compared with the other land cover types. The standard deviations of land cover types differed according to period. The factors that influenced LST measurements were weather conditions such as solar radiation, wind direction, and wind speed, differences in specific heat characteristics by land cover type, roadside trees, and shade cast by buildings [18].

3.4. Evaluation of Accuracy of TIR LSTs of UAV and Landsat 8

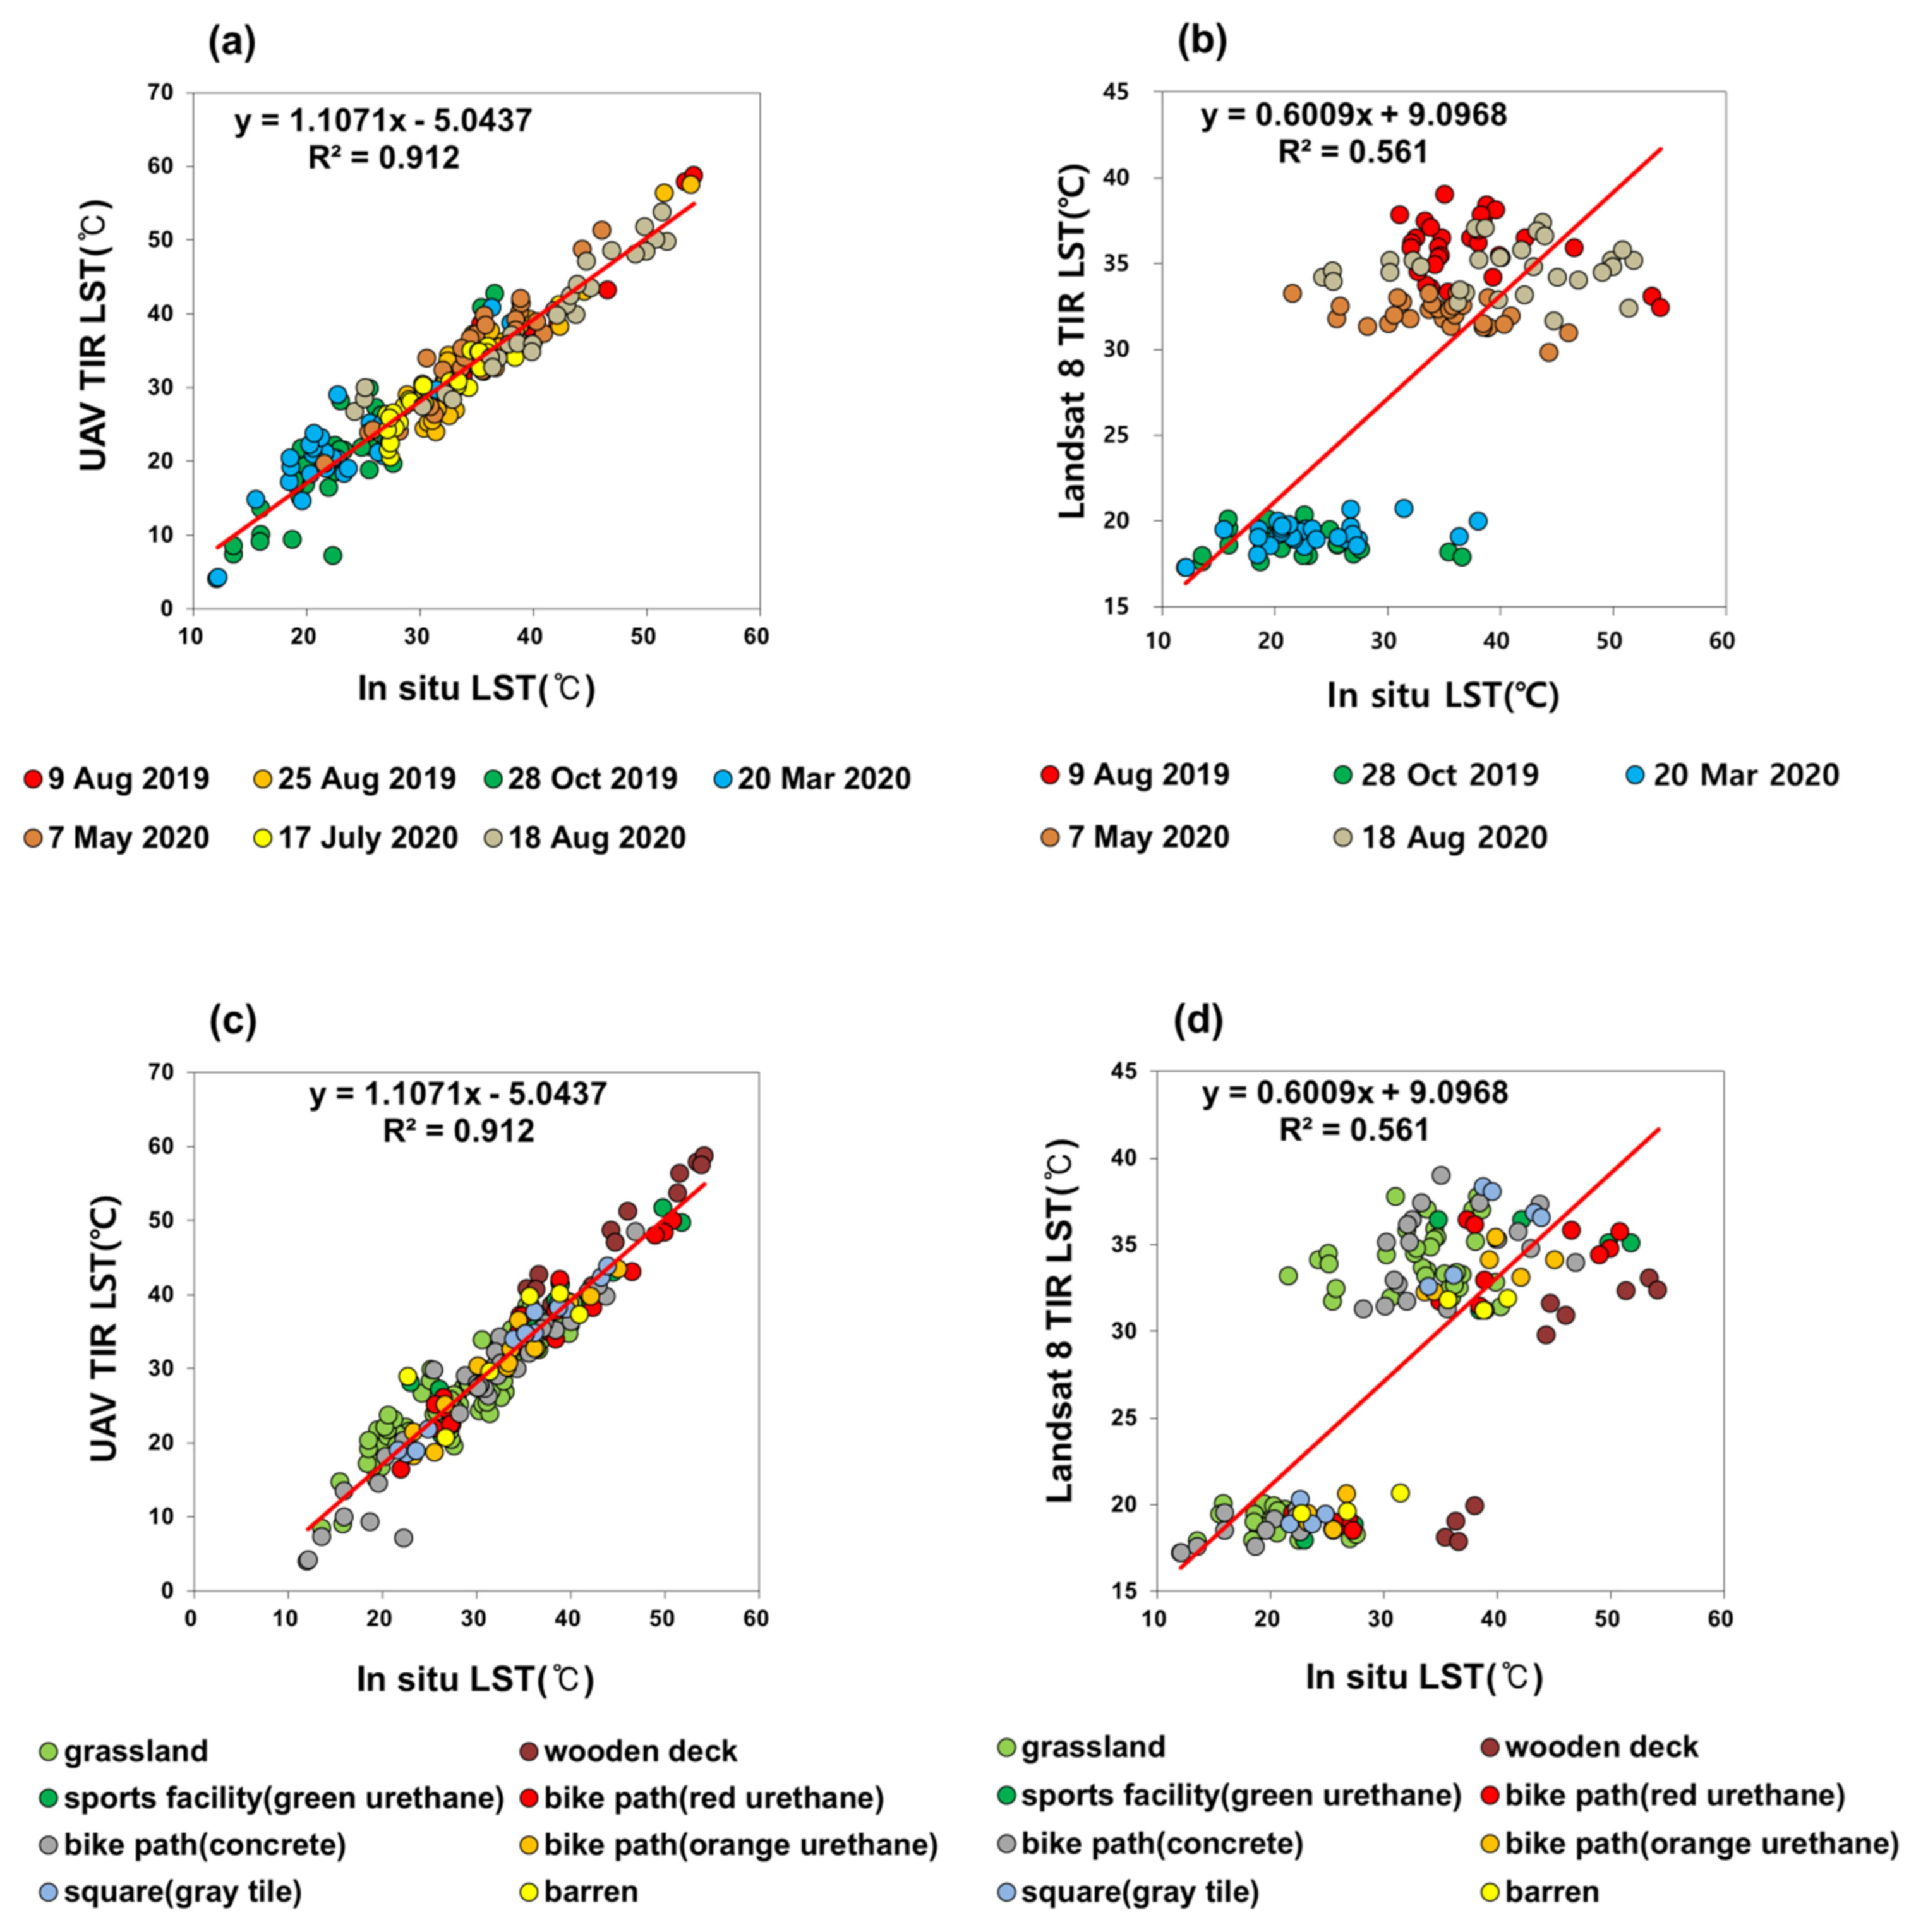
3.4.1. Linear Regression Analysis Result

Linear regression analysis was conducted for in situ LST, UAV TIR LST, and Landsat 8 TIR LST for all periods and land cover types (Figure 6). The total R 2 of the in situ LST and UAV TIR LST was 0.912. The R 2 values of summer and spring (9 August 2019: 0.915; 25 August 2019: 0.88; 7 May 2020: 0.868; 17 July 2020: 0.89; and 18 August 2020: 0.908) were higher than 0.86, whereas the R 2 values of autumn and winter (28 October 2019: 0.766; 20 March 2020: 0.79) were relatively low. The R 2 of the square (gray tile) was 0.984, showing the highest correlation, and that of the bike path (orange urethane), bike path (red urethane), and bike path (concrete) showed similar R 2 values of 0.937, 0.931, and 0.93, respectively. The R 2 values of the wooden deck, sports facility (green), and grassland were relatively low at 0.899, 0.896, and 0.84, respectively. The barren area, with limited measurement times and points, showed the lowest R 2 value of 0.638.
In contrast, the total R 2 of the in situ LST and Landsat 8 TIR LST was 0.561, and the R 2 values by period were lower than 0.3 (9 August 2019: 0.122; 28 October 2019: 0.031; 20 March 2020: 0.258; 7 May 2020: 0.236; and 18 August 2020: 0.003), i.e., indicating lower correlations than the UAV TIR LST. Regarding the R 2 by land cover type, the square (gray tile) showed the highest correlation at 0.931, and bike path (orange urethane), wooden deck, and barren area showed relatively high correlations at 0.872, 0.864, and 0.826, respectively. Bike path (red urethane), bike path (concrete), and sports facility (green) showed relatively low correlations at 0.789, 0.775, and 0.757. Grassland showed the lowest correlation at 0.705.

3.4.2. Differences in UAV TIR LST and Landsat 8 TIR LST Based on In Situ LST

The average differences in the measurements of the UAV TIR LST and Landsat 8 TIR LST based on the in situ LST were calculated and analyzed for each land cover type (Table 7). The total LST difference was −1.63 °C for the UAV TIR LST and −4.07 °C for the Landsat 8 TIR LST, i.e., both LSTs were lower than was the in situ LST. The difference in the UAV TIR LST was smaller by approximately 2.44 °C than in the Landsat 8 TIR LST.
Comparing the differences between the UAV TIR LST and in situ LST by period, the difference on 9 August 2019, in summer, was −1.29 °C. As the season changed to autumn, the difference gradually increased from −1.52 °C on 25 August 2019 to −2.67 °C on 28 October 2019. In the next spring, the difference gradually decreased from −1.7 °C on 20 March 2020 to −0.46 °C on 7 May 2020. The difference on 7 May 2020 was the lowest among all the periods. Further, there was the largest number of land cover types for which the in situ LST measured higher than the UAV TIR LST compared with other periods (wooden deck: 0.467 °C; sports facility (GU): 1.45 °C; bike path (RU): 1.17 °C; barren area: 0.46 °C). The difference on 17 July 2020 increased to −2.37 °C, and that on 18 August 2020 was −1.37 °C, i.e., similar to that on 9 August 2019 in the previous year.
Differences were found between the UAV TIR LST and in situ LST total by land cover type, which indicated that the UAV TIR LST was lower than was the in situ LST for all land cover types except wooden deck. Further, the differences varied by period. Among the land cover types, wooden deck showed the largest difference at 3.15 °C. Except for 17 July 2020, the UAV TIR LST was higher than the in situ LST in every period. For the sports facility (GU), the UAV TIR LST was higher than was the in situ LST in every period except for three periods (25 August 2019: 0.45 °C; 28 October 2019: 3.03 °C; and 7 May 2020: 1.45 °C). For other land cover types, the UAV TIR LST was lower than was the in situ LST in most periods. Among all the land cover types, the UAV TIR LST was higher than the in situ LST in all periods only for wooden decks and sports facilities (GU). It appears that in these land cover types, the UAV TIR LST was overestimated at high temperatures. However, for the bike path (RU), where the LST was similar to that of the sports facility (GU), the UAV TIR LST appears to have been underestimated compared with the in situ LST because of the shade of roadside trees near the measurement point.
The differences between the Landsat 8 TIR LST and in situ LST by period were −1.58 °C, −3.67 °C, and −3.92 °C on 25 August 2019; 28 October 2019; and 20 March 2020, respectively. The differences gradually increased from summer to autumn and then to the next spring. Afterward, it decreased to −2.55 °C on 7 May 2020, with the largest difference on 18 August 2020 at −5.49 °C for all periods. The difference on 25 August 2019 was large at 3.91 °C.
The differences between the Landsat 8 TIR LST and in situ LST total by land cover type were higher than −4 °C, except for the bike path (GC) and grassland. Grassland is the largest land cover type in the study area, and this characteristic was reflected mainly in the Landsat 8 TIR LST and, therefore, differences from the in situ LST were small. The other land cover types were not reflected in the Landsat 8 TIR LST because their areas are smaller than are those of the grassland. The LST difference in the bike path (GC), which showed similar temperatures as the grassland, was small at −1.83 °C.
Comparing the differences between the UAV TIR LST and Landsat 8 TIR LST from the in situ LST, the difference in the UAV TIR LST was smaller in all periods. With respect to land cover type, the difference in the UAV TIR LST was smaller, except for grassland.

3.4.3. RMSE Analysis Result

We calculated the RMSE of the UAV TIR LST and Landsat 8 TIR LST based on the in situ LST (Table 8). The total RMSE between the UAV TIR LST and the in situ LST was 3.502 °C, and by land cover type and period, the total RMSE was approximately 2–5 °C. The bike path (GC), barren area, wooden deck, and grassland showed relatively high total RMSE of 4.439 °C, 4.304 °C, 3.897 °C, and 3.316 °C, respectively. However, the bike path (OU), sports facility (GU), bike path (RU), and square (GT) showed low total RMSE of 3 °C or lower at 3.026, 2.904, 2.889, and 2.198 °C, respectively.
According to period, the total RMSE between the UAV TIR LST and the in situ LST was lowest at 2.523 °C on 9 August 2019. At this time, the RMSE of the wooden deck was the largest at 4.399 °C, and we believe that the UAV TIR LST of high-temperature objects was overestimated. The total RMSE on 25 August 2019 was 3.499 °C, i.e., higher than on 9 August 2019. In particular, grassland showed a high RMSE of 4.586 °C. This error appears to reflect the fact that in this study, the in situ LST of the grassland was measured on the surface of the leaves, but in this period, the leaves in the grassland had mixed colors of brown and green, and the UAV TIR LST could include the temperatures of the nearby soil as well as the surface of leaves. The total RMSE of 28 October 2019 was 5.298 °C, the highest in all periods. The RMSE of all land cover types had increased compared with the previous period. In particular, the RMSE of the bike path (GC), which was affected by a larger shaded area, was the highest at 8.396 °C. This appears to be the effect of underestimation of the UAV TIR LST for low-temperature objects.
On 20 March 2020, in the next spring, the total RMSE decreased to 3.834 °C, but the bike path (GC), sports facility (GU), and barren showed high RMSE of 5.40 °C, 5.164 °C, and 5.141 °C, respectively. The bike path (GC) showed a high RMSE because of shade cast by buildings. The UAV TIR LST of sports facility (GU) at this time was lower by −5.16 °C than the in situ LST, resulting in a larger difference than for the other periods. This error could have been caused by the wind or temperature changes in and outside the TIR camera at the time of measuring the UAV TIR LST [17]. In the barren area, the in situ LST was measured for the soil, but the UAV TIR LST was measured not only for soil but also for gravels of various sizes, resulting in a large RMSE. In contrast, the RMSE of grassland was 1.506 °C, much lower than before. The reason for this appears to be that the grass changed to brown at this time, thereby unifying the color, and the grass was cut short, lowering the effect of the shade of grass on the LST.
On 7 May 2020, the total RMSE decreased further to 2.849 °C. As the temperature increased markedly and the shaded area shortened, the RMSE of most land cover types decreased, but the RMSE of grassland and wooden deck was higher than before. The LST of the wooden deck increased to over 45 °C, and the UAV TIR LST was overestimated compared to in situ LST, resulting in a higher RMSE. In the grassland, the color of some grass changed from brown to green, and because of the effects of shade with the growth of stems, the UAV TIR LST was overestimated compared with the in situ LST, resulting in a higher RMSE.
On 17 July 2020, although it was already full-fledged summer, a reduction in solar radiation from local cirrus clouds decreased the LST compared with 7 May 2020. For all land cover types, the UAV TIR LST was underestimated compared with the in situ LST. The total RMSE increased slightly to 2.93 °C compared with that on 7 May 2020, but the RMSE of the wooden deck, sports facility (GU), and bike path (GC) decreased, and the RMSE of all bike paths and grassland increased. During this period, the UAV TIR LSTs of bike paths and grassland were underestimated compared with other land cover types. This appeared to be the effect of the tendency of underestimating the UAV TIR LST because of the intrinsically low LST value and the shade of trees and grass near the measurement point. In addition, weather conditions such as cloud and solar radiation need to be considered for accurate estimation/comparison.
On 18 August 2020, the total RMSE decreased to 2.788 °C, similar to the total of 2.523 °C on 9 August 2019. As regards RMSE by land cover type, the wooden deck and bike path (GC) showed high RMSE, as they did on 9 August 2019, but the RMSE of grassland was the highest at 3.469 °C. This result is ascribed to the UAV TIR LST of the wooden deck being overestimated, whereas the RMSE of the grassland was high because the UAV TIR LST was underestimated.
The total RMSE between the Landsat 8 TIR LST and in situ LST in all periods was 7.246 °C. The RMSE by land cover type and period were approximately 2.5–9.5 °C and approximately 4–15 °C, respectively. The total RMSE of the wooden deck, bike path (RU), sports facility (GU), and barren area were relatively high at 15.027, 8.919, 7.835, and 7.518 °C, respectively. The total RMSE of the bike path (OU), bike path (GC), grassland, and square (GT) were relatively low at 6.613 °C, 4.633 °C, 4.358 °C, and 2.198 °C, respectively.
As regards the total RMSE of Landsat 8 TIR LST and in situ LST by period, the total RMSE on 18 August 2020 was the highest. The total RMSE of other periods was approximately 6.5 °C; implying they did not show periodic or seasonal characteristics. As the Landsat 8 TIR LST tended to increase with distance from the river and closer proximity to the city, the RMSE by land cover type in each period showed a similar tendency as that of total RMSE. The RMSE of wooden deck, bike path (RU), sports facility (GU), and barren area, which had higher LSTs than the surrounding land cover types, were consistently high.
The total RMSE of the UAV TIR LST and Landsat 8 TIR LST compared with the in situ LST for all periods were 3.502 °C and 7.246 °C, respectively, i.e., the total RMSE of the UAV TIR LST was lower by approximately 3.7 °C. The difference in total RMSE by land cover type between UAV TIR LST and Landsat 8 TIR LST was the largest for wooden deck at approximately 11.13 °C, followed by bike path (RU) at 6.03 °C, sports facility (GU) at 4.931 °C, barren area at 3.214 °C, and bike path (OU) at 3.11 °C. The total RMSE by land cover type was relatively large at 3 °C or higher. These land cover types, which have high UAV TIR LST values compared with that grassland covers a large area, are distributed fragmentally over small areas and, therefore, show low Landsat 8 TIR LSTs and large differences in total RMSE. The differences in the total RMSE of the square (GT) and grassland was relatively low at 2.025 °C and 2.16 °C, respectively, and the bike path (GC) showed the lowest difference in total RMSE of 0.194 °C. In the square (GT) and grassland, which have larger areas, the RMSE was low for both the UAV TIR LST and Landsat 8 TIR LST, resulting in a small difference in the total RMSE. In the bike path (GC), the difference was small because both the UAV TIR LST and Landsat 8 TIR LST had high total RMSE.
The RMSE of the UAV TIR LST by period was lower than was that of the Landsat 8 TIR LST. The RMSE of the UAV TIR LST was low in summer and spring when the solar radiation and air temperature were high, and in autumn and winter it was high. However, the Landsat 8 TIR LST showed the highest total RMSE of 9.593 °C on 18 August 2020, in summer, and its total RMSE in other periods was approximately 6.5 °C, implying that it did not show seasonal characteristics. The period when the RMSE difference between the UAV TIR LST and Landsat 8 TIR LST was the smallest was 28 October 2019 at approximately 1.287 °C, and the difference was largest on 18 August 2020 at approximately 6.805 °C.

4. Discussion

In our study, the UAV TIR LST and Landsat 8TIR LST data were collected by time series for one year in an urban green space. Figure 7 shows the profile analysis results for the UAV TIR LST and Landsat 8TIR LST on 9 August 2019 for line A–B, which is approximately 200 m. The UAV TIR LST was the highest in the wooden deck at 58.85 °C and the lowest in the grassland at 26.47 °C, indicating variation in the LST values and characteristics according to land cover type. In contrast, the Landsat 8 TIR LST was lowest at 33.04 °C at point A, which is the closest to the river, and highest at 38.04 °C at point B, which is close to the city. This result implies difficulty to identify LST by land cover type. Probably, as the Landsat 8 LST data were closer to point A, the LST of the grassland (largest area cover) appeared and, being closer to point B and the city, the LST of the square (GT) (similar to the city area) appeared. This phenomenon is mainly because the cooling effect of the river located in the northwest of the study area is dominant in the Landsat 8 TIR LST and that the LST characteristics of land cover types with a relatively low area ratio are not found in the Landsat 8 TIR LST.
The Landsat 8 TIR LST was measured originally at a resolution of 100 m, but it was provided at 30 m resolution to match with the OLI multi-spectrum band in this study. It was, therefore, difficult to measure LST more precisely in an urban green space with complex land cover types. Further, as the time resolution of Landsat 8 is 16 days, LST measurement and thermal environment analyses were limited because they are affected significantly by weather conditions such as clouds and fog [32].
Various accuracies of the UAV TIR LST are shown, depending on the time and the object of the LST measurements. When the in situ LST and UAV TIR LST in summer for land cover types such as asphalt, concrete, and vegetation in a college campus environment were compared, the R 2 was higher than 0.7, and the RMSE was approximately 2–5 °C [18]. When the diurnal cycles of in situ LST and UAV TIR LST were compared for two days for land cover types such as grassland and corn fields after harvesting in an agricultural area, the R 2 was 0.96 or higher and the RMSE was approximately 1–2 °C [33]. The RMSE of the in situ LST and UAV TIR LST for land cover types such as vegetation, debris, and water in a glacial area appeared differently according to the time of measurement at 0.9 °C (06:45), 7.0 °C (09:20), and 5.1 °C (10:35) [34].
Several factors have been suggested that influence the accuracy of the UAV TIR LST, namely weather conditions such as wind, temperature, and humidity, and environmental conditions such as the emissivity of the object of LST measurement and the distance between the object of measurement and the camera [19]. In addition, the TIR LST construction conditions have also been suggested as factors, such as the flight altitude of the UAV [19], stabilization time of the thermal imaging camera [35], shooting angle, and vignetting in the TIR image [17].
Measures to improve the accuracy have been suggested, including TIR camera calibration in the laboratory [36], atmospheric corrections such as temperature and humidity, radioactive correction [37], correction using in situ LST measurements [24], and the derivation of an LST correction formula based on an artificial neural network [38].
Accordingly, the accuracy of the UAV TIR LST could be affected by various conditions, and significant accuracy problems are expected to occur depending on the object and purpose of LST measurement.
Analyses results on the accuracy of the UAV TIR LST based on in situ LST showed that the accuracy in summer and spring ( R 2 : 0.868–0.915, RMSE: 2.523–3.499 °C) was higher than was it was in autumn and winter ( R 2 : 0.766–0.79, RMSE: 3.834–5.398 °C). This appeared to be the effect of weather conditions such as solar radiation and air temperature by period. Furthermore, according to land cover type, the UAV TIR LST of the wooden deck, which had higher LST than the surroundings, was overestimated, whereas the UAV TIR LST of grassland and bike path (GC) was underestimated because of the effect of shade, resulting in a higher RMSE and low accuracy. In particular, the length and area of shade change depend on the altitude of the sun and the growth of trees and grass by season and time. Therefore, it is crucial to consider the effect of shade on the measurement of UAV TIR LST.
Green spaces such as urban parks, forests, grasslands, and water bodies in the city play an important role in reducing the UHI effect. This reduction effect varies depending on the location, size, and shape index of green spaces, various land cover ratios and spatial components, and seasonal characteristics [7,39]. Therefore, it is necessary to conduct research to establish an accurate UAV TIR LST by introducing continuous in situ LST-based data accumulation and correction methods. Further consideration should be given to the land cover characteristics of the target site and the characteristics of various time series, such as daily and weekly periods, as well as seasons, in accordance with the purpose of analyzing the characteristics of the green spaces and their UHI reduction effects.

5. Conclusions

We acquired UAV TIR LST and Landsat 8 TIR LST data for seven periods over approximately one year (9 August 2019; 25 August 2019; 28 October 2019; 20 March 2020; 7 May 2020; 17 July 2020; and 18 August 2020) in an urban green space. In addition, we evaluated the accuracy of the UAV TIR LST and Landsat 8 TIR LST by measuring in situ LST for each land cover type.
The results of the in situ LST measurements showed that although there were differences by period, the land cover types using artificial pavement materials such as wooden decks, sports facilities, and bike paths showed high LST, whereas the grassland showed the lowest LST.
The UAV TIR LST and Landsat 8 TIR LST were acquired with spatial resolutions of 0.09 m and 30 m, respectively. When accuracy was compared by conducting linear regression analysis and RMSE calculations of the UAV TIR LST and Landsat 8 TIR LST based on the measurement point of in situ LST, the UAV TIR LST showed higher accuracy in summer and spring when the solar radiation and air temperature were higher ( R 2 : 0.868–0.915; RMSE: 2.523–3.499 °C) than in autumn and winter ( R 2 : 0.766–0.79; RMSE: 3.834–5.398 °C). The accuracy of the Landsat 8 TIR LST did not show seasonal characteristics, and it was difficult to identify LST by land cover type because of the spatial resolution in the study area, where complex land cover distributions appeared.
As regards the UAV TIR LST, it was possible to conduct precise analysis of the thermal environment with reliability by season in an urban park with complex land cover types, compared with the Landsat 8 TIR LST. However, the UAV TIR LST by land cover type showed an overestimation tendency at high temperatures, whereas the UAV TIR LST was underestimated compared with the in situ LST owing to the effect of the shade cast by buildings and roadside trees.
In future research using UAV TIR LST in urban parks, the accuracy of UAV TIR LST could be improved by additionally considering the effects of the emissivity of the object of LST measurement, flight altitude of the UAV, and the shooting angle of the thermal imaging camera on the accuracy of UAV TIR LST.
The results of this study have demonstrated that the UAV TIR LST could be measured with sufficient reliability by season and land cover type in an urban park with complex land cover types. The results of this study could be applied to urban environment planning and design, as well as to urban planning for park and space design in the future.

Author Contributions

Conceptualization, D.K.; methodology, S.S.; software, D.K.; validation, S.S., J.Y. (Jeongho Yoon), and J.Y. (Jaejin Yu); formal analysis, S.J.; investigation, J.Y. (Jaejin Yu); writing—original draft preparation, S.S.; writing—review and editing, S.J., S.S.; visualization, D.K.; supervision, D.K. All authors have read and agreed to the published version of the manuscript.

Funding

This study was funded by the Korea Environmental Industry & Technology Institute (KEITI) under grant (number: 2016000200009) and conducted (name: Application of Advanced Technology (Drone, Robot, etc.) for Environmental Inspection and Its Integrated Management, number: 2018-080) by the Korea Environment Institute (KEI).

Data Availability Statement

Access to the data will be considered upon request by the authors.

Conflicts of Interest

The authors declare no conflict of interest.

References

  1. United Nations, Department of Economic and Social Affairs. Population Division. World Urbanization Prospects: The 2018 Revision (ST/ESA/SER.A/420); United Nations: New York, NY, USA, 2019. [Google Scholar]
  2. The World Bank Group. 2019. Available online: https://data.worldbank.org/indicator/sp.urb.totl.in.zs (accessed on 10 January 2020).
  3. Cumming, G.S.; Buerkert, A.; Hoffmann, E.M.; Schlecht, E.; von Cramon-Taubadel, S.; Tscharntke, T. Implications of agricultural transitions and urbanization for ecosystem services. Nature 2014, 515, 50–57. [Google Scholar] [CrossRef] [PubMed]
  4. Qiu, K.; Jia, B. The roles of landscape both inside the park and the surroundings in park cooling effect. Sustain. Cities Soc. 2020, 52, 101864. [Google Scholar] [CrossRef]
  5. Qiao, Z.; Liu, L.; Qin, Y.; Xu, X.; Wang, B.; Liu, Z. The impact of urban renewal on land surface temperature changes: A case study in the main city of Guangzhou, China. Remote Sens. 2020, 12, 794. [Google Scholar] [CrossRef] [Green Version]
  6. Howard, L. The Climate of London: Deduced from Meteorological Observations, Made at Different Places in the Neighbourhood of the Metropolis; W. Phillips: Cambridge, MA, USA, 1820; Volume 1. [Google Scholar]
  7. Yu, Z.; Yang, G.; Zuo, S.; Jørgensen, G.; Koga, M.; Vejre, H. Critical review on the cooling effect of urban blue-green space: A threshold-size perspective. Urban For. Urban Green. 2020, 49, 126630. [Google Scholar] [CrossRef]
  8. Carvalho, D.; Martins, H.; Marta-Almeida, M.; Rocha, A.; Borrego, C.J.U.C. Urban resilience to future urban heat waves under a climate change scenario: A case study for Porto urban area (Portugal). Urban Clim. 2017, 19, 1–27. [Google Scholar] [CrossRef]
  9. Jaganmohan, M.; Knapp, S.; Buchmann, C.M.; Schwarz, N. The bigger, the better? The influence of urban green space design on cooling effects for residential areas. J. Environ. Qual. 2016, 45, 134–145. [Google Scholar] [CrossRef]
  10. Yang, C.; He, X.; Yu, L.; Yang, J.; Yan, F.; Bu, K.; Chang, L.; Zhang, S. The cooling effect of urban parks and its monthly variations in a snow climate city. Remote Sens. 2017, 9, 1066. [Google Scholar] [CrossRef] [Green Version]
  11. Yang, A.S.; Juan, Y.H.; Wen, C.Y.; Chang, C.J. Numerical simulation of cooling effect of vegetation enhancement in a subtropical urban park. Appl. Energy 2017, 192, 178–200. [Google Scholar] [CrossRef]
  12. Pandey, P.; Kumar, D.; Prakash, A.; Masih, J.; Singh, M.; Kumar, S.; Jain, V.K.; Kumar, K. A study of urban heat island and its association with particulate matter during winter months over Delhi. Sci. Total Environ. 2012, 414, 494–507. [Google Scholar] [CrossRef]
  13. Lazzarini, M.; Marpu, P.R.; Ghedira, H. Temperature-land cover interactions: The inversion of urban heat island phenomenon in desert city areas. Remote Sens. Environ. 2013, 130, 136–152. [Google Scholar] [CrossRef]
  14. Naughton, J.; McDonald, W. Evaluating the variability of urban land surface temperatures using drone observations. Remote Sens. 2019, 11, 1722. [Google Scholar] [CrossRef] [Green Version]
  15. Webster, C.; Westoby, M.; Rutter, N.; Jonas, T. Three-dimensional thermal characterization of forest canopies using UAV photogrammetry. Remote Sens. Environ. 2018, 209, 835–847. [Google Scholar] [CrossRef] [Green Version]
  16. Di Felice, F.; Mazzini, A.; Di Stefano, G.; Romeo, G. Drone high resolution infrared imaging of the Lusi mud eruption. Mar. Pet. Geol. 2018, 90, 38–51. [Google Scholar] [CrossRef]
  17. Kelly, J.; Kljun, N.; Olsson, P.O.; Mihai, L.; Liljeblad, B.; Weslien, P.; Klemedtsson, L.; Eklundh, L. Challenges and best practices for deriving temperature data from an uncalibrated UAV thermal infrared camera. Remote Sens. 2019, 11, 567. [Google Scholar] [CrossRef] [Green Version]
  18. Song, B.; Park, K. Verification of Accuracy of Unmanned Aerial Vehicle (UAV) Land Surface Temperature Images Using In-Situ Data. Remote Sens. 2020, 12, 288. [Google Scholar] [CrossRef] [Green Version]
  19. Acorsi, M.G.; Gimenez, L.M.; Martello, M. Assessing the Performance of a Low-Cost Thermal Camera in Proximal and Aerial Conditions. Remote Sens. 2020, 12, 3591. [Google Scholar] [CrossRef]
  20. Dronova, I.; Friedman, M.; McRae, I.; Kong, F.; Yin, H. Spatio temporal non-uniformity of urban park greenness and thermal characteristics in a semi-arid region. Urban For. Urban Green. 2018, 34, 44–54. [Google Scholar] [CrossRef]
  21. Lafortezza, R.; Carrus, G.; Sanesi, G.; Davies, C. Benefits and well-being perceived by people visiting green spaces in periods of heat stress. Urban For. Urban Green. 2009, 8, 97–108. [Google Scholar] [CrossRef]
  22. Nastran, M.; Kobal, M.; Eler, K. Urban heat islands in relation to green land use in European cities. Urban For. Urban Green. 2019, 37, 33–41. [Google Scholar] [CrossRef] [Green Version]
  23. Hong, S.; Lee, Y.W.; Ryu, J.H.; Yeom, J.M.; Kim, W.; Cho, J. Satellite-based assessment of rapid mega-urban development on agricultural land. J. Agric. Meteorol. 2018, 74, 87–91. [Google Scholar] [CrossRef] [Green Version]
  24. Yang, Y.; Lee, X. Four-band thermal mosaicking: A new method to process infrared thermal imagery of urban landscapes from UAV flights. Remote Sens. 2019, 11, 1365. [Google Scholar] [CrossRef] [Green Version]
  25. Lillesand, T.; Kiefer, R.W.; Chipman, J. Remote Sensing and Image Interpretation, 6th ed.; John Wiley & Sons: New York, NY, USA, 2015. [Google Scholar]
  26. Ortiz-Sanz, J.; Gil-Docampo, M.; Arza-García, M.; Cañas-Guerrero, I. IR Thermography from UAVs to Monitor Thermal Anomalies in the Envelopes of Traditional Wine Cellars: Field Test. Remote Sens. 2019, 11, 1424. [Google Scholar] [CrossRef]
  27. USGS. Landsat 8 (L8) Data Users Handbook (LSDS-1574, Version 3.0); EROS: Sioux Falls, SD, USA, 2018.
  28. Jiménez-Muñoz, J.C.; Cristóbal, J.; Sobrino, J.A.; Sòria, G.; Ninyerola, M.; Pons, X. Revision of the single-channel algorithm for land surface temperature retrieval from Landsat thermal-infrared data. IEEE Trans. Geosci. Remote Sens. 2008, 47, 339–349. [Google Scholar] [CrossRef]
  29. Qin, Z.; Karnieli, A.; Berliner, P. A mono-window algorithm for retrieving land surface temperature from Landsat TM data and its application to the Israel-Egypt border region. Int. J. Remote Sens. 2001, 22, 3719–3746. [Google Scholar] [CrossRef]
  30. Sekertekin, A.; Bonafoni, S. Sensitivity Analysis and Validation of Daytime and Nighttime Land Surface Temperature Retrievals from Landsat 8 Using Different Algorithms and Emissivity Models. Remote Sens. 2020, 12, 2776. [Google Scholar] [CrossRef]
  31. Sobrino, J.A.; Jiménez-Muñoz, J.C.; Sòria, G.; Romaguera, M.; Guanter, L.; Moreno, J.; Plaza, A.; Martínez, P. Land surface emissivity retrieval from different VNIR and TIR sensors. IEEE Trans. Geosci. Remote Sens. 2008, 46, 316–327. [Google Scholar] [CrossRef]
  32. Masina, M.; Lambertini, A.; Daprà, I.; Mandanici, E.; Lamberti, A. Remote Sensing Analysis of Surface Temperature from Heterogeneous Data in a Maize Field and Related Water Stress. Remote Sens. 2020, 12, 2506. [Google Scholar] [CrossRef]
  33. Malbéteau, Y.; Parkes, S.; Aragon, B.; Rosas, J.; McCabe, M.F. Capturing the diurnal cycle of land surface temperature using an unmanned aerial vehicle. Remote Sens. 2018, 10, 1407. [Google Scholar] [CrossRef] [Green Version]
  34. Kraaijenbrink, P.D.; Shea, J.M.; Litt, M.; Steiner, J.F.; Treichler, D.; Koch, I.; Immerzeel, W.W. Mapping surface temperatures on a debris-covered glacier with an unmanned aerial vehicle. Front. Earth Sci. 2018, 6, 64. [Google Scholar] [CrossRef] [Green Version]
  35. Smigaj, M.; Gaulton, R.; Suarez, J.C.; Barr, S.L. Use of miniature thermal cameras for detection of physiological stress in conifers. Remote Sens. 2017, 9, 957. [Google Scholar] [CrossRef] [Green Version]
  36. Sheng, H.; Chao, H.; Coopmans, C.; Han, J.; McKee, M.; Chen, Y. Low-cost UAV-based thermal infrared remote sensing: Platform, calibration and applications. In Proceedings of the 2010 IEEE/ASME International Conference on Mechatronic and Embedded Systems and Applications, QingDao, China, 15–17 July 2010; pp. 38–43. [Google Scholar]
  37. Pour, T.; Miřijovský, J.; Purket, T. Airborne thermal remote sensing: The case of the city of Olomouc, Czech Republic. Eur. J. Remote Sens. 2019, 52 (Suppl. 1), 209–218. [Google Scholar] [CrossRef]
  38. Ribeiro-Gomes, K.; Hernández-López, D.; Ortega, J.F.; Ballesteros, R.; Poblete, T.; Moreno, M.A. Uncooled thermal camera calibration and optimization of the photogrammetry process for UAV applications in agriculture. Sensors 2017, 17, 2173. [Google Scholar] [CrossRef]
  39. Hamada, S.; Ohta, T. Seasonal variations in the cooling effect of urban green areas on surrounding urban areas. Urban For. Urban Green. 2010, 9, 15–24. [Google Scholar] [CrossRef]
Figure 1. Location of the study area (left panel, yellow star), and Geum River Park in Sejong City, South Korea (right panel).
Remotesensing 13 01977 g001
Figure 2. Location of land surface temperature checkpoints by land cover type.
Remotesensing 13 01977 g002
Figure 3. Photographs of the site.
Remotesensing 13 01977 g003aRemotesensing 13 01977 g003b
Figure 4. Distribution of UAV TIR LST by period.
Remotesensing 13 01977 g004aRemotesensing 13 01977 g004b
Figure 5. Landsat 8 TIR LST distribution by period.
Remotesensing 13 01977 g005aRemotesensing 13 01977 g005b
Figure 6. Scot plots for in situ LST, UAV TIR LST, and Landsat 8 TIR LST by period and land cover type: (a) Scot plots for in situ LST and UAV TIR LST (by period); (b) Scot plots for in situ LST and Landsat 8 TIR LST (by period); (c) Scot plots for in situ LST and UAV TIR LST (by land cover type); (d) Scot plots for in situ LST and Landsat 8 TIR LST (by land cover type).
Remotesensing 13 01977 g006
Figure 7. Profile analysis results for line A-A’ of TIR LST and Landsat 8 TIR LST on 9 August 2019.
Remotesensing 13 01977 g007
Table 1. Weather data in each period of field measurements and LST data acquisition.
DateTimeAir Temp
(°C)
Wind Speed
(m/s)
Wind Direction
(degrees)
Humidity
(%)
9 August 201911:00 a.m.30.8--73.9
9 August 201912:00 p.m.31.81.340.764.8
25 August 201911:00 a.m.26.81.1338.257.3
25 August 201912:00 p.m.27.51.9355.355.4
28 October 201911:00 a.m.15.3285.349.1
28 October 201912:00 p.m.17.41.4233.246.9
20 March 202011:00 a.m.12.83222.931
20 March 202012:00 p.m.13.73219.930.5
7 May 202011:00 a.m.22.93.480.524.3
7 May 202012:00 p.m.23.43.991.622.1
17 July 202011:00 a.m.26.81.484.168.6
17 July 202012:00 p.m.26.81.97866.7
18 August 202011:00 a.m.311245.664.4
18 August 202012:00 p.m.31.41.59.361.9
Table 2. Equipment specifications.
ClassificationModelSpecification
UAVInspire Pro 1Weight: 3.4 kg (including camera and battery)
Max speed: 18 m/s
Flight time: Approximately 18 min (18-m TB48 battery)
Operating temperature: −10 to 40 °C
CameraZenmuse XTRDimensions: 103 mm × 74 mm × 102 mm
Weight: 270 g
Resolution: 640 × 512 pixel
Pixel pitch: 17 μm
Spectral range: 7.5–13.5 μm
Scene range: −25° to 135 °C (high gain)
Accuracy: ±5 °C
Field of view: 13 mm, 45° × 37°
Operating temperature: −10 to 40 °C
VRS-RTK GNSSTrimble R8s GNSSChannel: 440
Satellite: GPS, GLONASS
VRS H: 8 mm + 0.5 ppm RMS
VRS V: 15 mm + 0.5 ppm RMS
Table 3. Landsat8 LST data information.
DatePath/RowStart TimeStop Time
9 August 2019115/3511:05:0611:05:38
28 October 2019115/3511:05:2411:05:55
20 March 2020115/3511:04:4911:05:21
7 May 2020115/3511:04:2411:04:56
18 August 2020116/3511:11:1311:11:45
Table 4. Measurements of in UAV TIR LST (°C) by land cover type.
DateLST DataWooden DeckSports Facility (GU)Bike Path (RU)Bike Path (GC)Bike Path (OU)Square (GT)GrasslandBarren Area
9 August 2019UAV (Mean)58.2336.8537.932.9138.5438.4133.03-
25 August 2019UAV (Mean)56.8442.236.233.8531.5437.8828.18-
28 October 2019UAV (Mean)41.6727.6321.4312.8120.0320.117.82-
20 March 2020UAV (Mean)39.6521.7423.9713.5221.6518.8820.3826.37
7 May 2020UAV (Mean)49.940.238.6428.2534.534.3530.0739.0
17 July 2020UAV (Mean)41.035.0533.7729.6230.434.725.22-
18 August 2020UAV (Mean)50.3250.6948.7837.6641.5443.0732.29-
TotalUAV (Mean)48.2336.3434.3926.9531.1732.4926.8232.69
Abbreviations: GU (green urethane), RU (red urethane), GC (gray concrete), OU (orange urethane), GT (gray tile).
Table 5. Measurements of in Landsat 8 TIR LST (°C) by land cover type.
DateLST DataWooden DeckSports Facility (GU)Bike Path (RU)Bike Path (GC)Bike Path (OU)Square (GT)GrasslandBarren Area
9 August 2019L8 (Mean)32.7136.4236.1336.9334.7638.235.51-
28 October 2019L8 (Mean)17.9718.3718.9518.5718.7519.8518.72-
20 March 2020L8 (Mean)19.4718.8418.8818.2920.0518.8619.2819.9
7 May 2020L8 (Mean)30.3231.232.0331.8932.2632.932.331.63
18 August 2020L8 (Mean)31.9635.134.9635.3433.6136.6834.47-
TotalL8 (Mean)26.4927.9928.1928.227.8929.328.2825.76
Abbreviations: L8 (Landsat 8), GU (green urethane), RU (red urethane), GC (gray concrete), OU (orange urethane), GT (gray tile).
Table 6. Measurements of in situ LST (°C) by land cover type.
DateLST DataWooden DeckSports Facility (GU)Bike Path (RU)Bike Path (GC)Bike Path (OU)Square (GT)GrasslandBarren Area
9 August 2019In situ (Mean)53.8338.5340.6935.339.6539.234.38-
9 August 2019In situ (SD)0.383.684.23.020.30.411.98-
25 August 2019In situ (Mean)52.7841.7536.7934.5433.2337.5331.72-
25 August 2019In situ (SD)1.182.84.023.762.981.281.62-
28 October 2019In situ (Mean)36.0524.624.7418.7124.4823.7820.57-
28 October 2019In situ (SD)0.611.561.984.11.131.133.73-
20 March 2020In situ (Mean)37.2326.926.6418.2425.0522.7319.6627.04
20 March 2020In situ (SD)0.830.560.714.431.70.981.753.56
7 May 2020In situ (Mean)45.2338.7537.4731.434.3535.131.1738.54
7 May 2020In situ (SD)0.880.251.792.250.661.115.892.18
17 July 2020In situ (Mean)42.3836.036.1232.333.435.2828.0-
17 July 2020In situ (SD)0.030.061.691.480.060.030.82-
18 August 2020In situ (Mean)48.0850.8549.9739.743.6343.6334.16-
18 August 2020In situ (SD)3.331.010.746.191.480.335.63-
In situ totalIn situ (Mean)45.0836.7736.0630.0333.433.8928.7432.79
In situ totalIn situ (SD)6.668.478.288.636.667.296.636.47
Abbreviations: GU (green urethane), RU (red urethane), GC (gray concrete), OU (orange urethane), GT (gray tile), SD (standard deviation).
Table 7. Differences between UAV TIR LST and Landsat 8 TIR LST and the in situ LST (°C).
Compared LST DataDateWooden DeckSports Facility (GU)Bike Path (RU)Bike Path (GC)Bike Path (OU)Square (GT)GrasslandBarrenTotal
UAV
TIR
LST
9 August 20194.4−1.68−2.79−2.39−1.11−0.79−1.35 −1.29
25 August 20194.060.45−0.59−0.69−1.690.35−3.54 −1.52
28 October 20195.623.03−3.31−5.9−4.45−3.68−2.75 −2.67
20 March 20202.42−5.16−2.67−4.72−3.4−3.850.72−0.67−1.7
7 May 20204.671.451.17−3.150.15−0.75−1.10.46−0.46
17 July 2020−1.38−0.95−2.35−2.68−3−0.58−2.78 −2.37
18 August 20202.24−0.16−1.19−2.04−2.09−0.56−1.87 −1.37
Total3.15−0.43−1.67−3.08−2.23−1.4−1.92−0.1−1.63
L8
TIR
LST
25 August 2019−21.12−2.11−4.561.63−4.89−11.13 −1.58
28 October 2019−18.08−6.23−5.79−0.14−5.73−3.93−1.85 −3.67
20 March 2020−17.76−8.06−7.760.05−5−3.87−0.38−7.14−3.92
7 May 2020−14.91−7.55−5.440.49−2.09−2.21.13−6.91−2.55
18 August 2020−16.12−15.75−15.01−4.36−10.02−6.950.31 −5.49
Total−18.59−8.78−7.87−1.83−5.51−4.59−0.46−7.03−4.07
Abbreviations: L8 (Landsat 8), GU (green urethane), RU (red urethane), GC (gray concrete), OU (orange urethane), GT (gray tile).
Table 8. RMSE (°C) of UAV TIR LST and Landsat 8 TIR LST based on in situ LST measurement points.
TimeLST DataWooden DeckSports Facility (GU)Bike Path (RU)Bike Path (GC)Bike Path (OU)Square (GT)GrasslandBarren AreaTotal
9 August 2019UAV (RMSE)4.3992.6282.9512.6511.1121.1052.241-2.523
L8 (RMSE)21.1314.2386.3443.84.9071.1482.499-6.502
25 August 2019UAV (RMSE)4.1062.1482.8211.4572.4611.0664.586-3.499
L8 (RMSE)---------
28 October 2019UAV (RMSE)5.633.6033.9318.3965.0913.7183.96-5.298
L8 (RMSE)18.16.3296.2413.8985.884.234.409-6.585
20 March 2020UAV (RMSE)3.0665.1643.2055.4033.8243.9761.5065.1413.834
L8 (RMSE)17.7688.0857.8073.6815.1343.9951.7437.7756.64
7 May 2020UAV (RMSE)4.6951.6812.1953.5871.6380.9932.5093.262.849
L8 (RMSE)14.917.5595.6782.4441.8822.3415.9667.2516.385
17 July 2020UAV (RMSE)1.3811.0313.1072.9853.0110.5763.401-2.93
L8 (RMSE)---------
18 August 2020UAV (RMSE)2.2461.9971.2412.7072.1240.7133.469-2.788
L8 (RMSE)16.38615.78615.0127.62810.0686.9645.548-9.593
TotalUAV (RMSE)3.8972.9042.8894.4393.0262.1983.3164.3043.502
L8 (RMSE)15.0277.8358.9194.6336.1634.2234.3587.5187.246
Abbreviations: L8 (Landsat 8), GU (green urethane), RU (red urethane), GC (gray concrete), OU (orange urethane), GT (gray tile).
Publisher’s Note: MDPI stays neutral with regard to jurisdictional claims in published maps and institutional affiliations.

