Abstract
Bi-hemispherical reflectance (BHR), in the land surface research community also known as “white-sky albedo”, is independent of the directions of incidence and viewing. For vegetation canopies, it is also nearly independent of the leaf angle distribution, and therefore it can be considered an optical quantity that is only dependent on material properties. For the combination leaf canopy and soil background, the most influential material properties are the canopy LAI (leaf area index), optical properties of the leaves, and soil brightness. When the leaf and soil optical properties are known or assumed, one may estimate the canopy LAI from its white-sky spectral albedo. This is also because a simple two-stream radiative transfer (RT) model is available for the BHR of the leaf canopy and soil combination. In this contribution, crown clumping and lateral linear mixing effects are incorporated in this model. A new procedure to estimate soil brightness is introduced here, even under a moderate layer of green vegetation. The procedure uses the red and NIR spectral bands. A MODIS white-sky albedo product at a spatial resolution of 0.05° is used as a sample input to derive global maps of LAI, soil brightness, and fAPAR at the local moments of minimum and maximum NDVI over a 20-year period. These maps show a high degree of spatial coherence and demonstrate the possible utility of products that can be generated with little effort by using a direct LUT technique.
Keywords:
MODIS white-sky albedo; NDVI; fractional cover; LAI; fAPAR; soil brightness; SAIL model; retrieval; global maps 1. Introduction
The correct quantitative interpretation of remotely sensed land surface reflectance data is hampered by the anisotropy of most surfaces on Earth, whether it be bare soils, vegetation canopies, or water bodies. This is why, after the correction of atmospheric effects, attempts are often made to remove or normalize these so-called BRF (bi-directional reflectance factor) effects. Various parametric BRF models are frequently used in this case [1] and are inverted on the basis of several directional observations collected by satellite missions during a period of less than two weeks. This is performed in order to prevent large temporal changes in an object’s properties. The output product is mostly the bi-directional reflectance normalized to a particular standard situation, e.g., nadir viewing under a 45° solar zenith angle; however, for energy balance studies, hemispherical reflectance products are of more interest, since these express the surface’s total reflectance response to the incident radiation from the sun and the sky. The hemispherical reflectance for incident solar radiation, called the DHRF (directional hemispherical reflectance factor) [2], is most important in this respect, since optical satellite observations are primarily only possible under nearly cloud-free conditions, so that the direct solar radiation input dominates. This quantity is sometimes called “black-sky albedo” and is obviously a function of the solar zenith angle. This is very useful for realistic energy balance calculations, but for the retrieval of inherent surface properties it is still a complication. Once again making use of the parametric BRF model, with angular integration of the DHRF over the incident hemisphere, it is possible to obtain the BHRF (bi-hemispheric reflectance factor) [1,2] or “white-sky albedo”. This product only plays a modest role in the energy balance, since it only approximates the hemispheric response to the diffuse incident radiation from the sky, which contributes little to the total energy balance; however, in terms of standardization, it may be just as important and useful as a BRF product normalized to a standard illumination-viewing geometry. By definition, the BHRF is a hypothetical quantity that normally cannot be directly measured by remote sensing techniques. As described above, it can only be estimated by aggregating several directional observations in a model during a relatively short period of time. A great advantage of this product is that it is independent of any observational conditions, and therefore can be considered a true inherent optical property of land surface objects on Earth. Another advantage of the white-sky albedo is that a very simple two-stream RT model can be employed that describes the relation between a few crucial object properties and the BHRF of soil and canopy combinations, thereby allowing model inversion to estimate the LAI and soil brightness if the leaf optical properties are assumed (to be green) and the soil’s spectral shape is approximately known. This model is derived from the diffuse hemispheric fluxes in the SAIL model [3] and it will be shown that the estimation of LAI and soil brightness is possible on the basis of the same spectral information that the NDVI (normalized difference vegetation index) is based on by only employing reflectance data in the red and the near-infrared (NIR); however, in this case, it must be assumed that the target pixel is homogeneous and can be considered a turbid medium. For the description of heterogeneous targets or ones showing 3D effects due to crown clumping, etc., a minimum of two additional spectrally invariant parameters is required, which makes model inversion based on exclusively red and NIR spectral reflectance data clearly an ill-posed problem. Another issue is formed by the fact that the sensitivity of canopy reflectance to changes in the LAI tends toward zero for high LAI values, even in the NIR range. This means that other parameters, like leaf optical properties and canopy structure (LIDF, crown clumping, pixel heterogeneity) gain relative importance, and uncertainties about these parameters can lead to enormous equivalent uncertainties in the LAI. In such cases of a high LAI, it is probably more pragmatic to assume that the LAI is high, e.g., 8, and next one can try to estimate the secondary parameters like the fraction of vegetative cover, fC. A similar situation applies to leaf chlorophyll. Single leaf reflectance and transmittance get saturated at high chlorophyll contents, and the sensitivity to other parameters then becomes more important. Therefore, it is probably more practical to assume a prototype green leaf with a fixed high chlorophyll content in order to represent green vegetation.
Apart from the above-mentioned complications, other factors can play roles in the formation of the BHRF in the red and NIR bands, and therefore will also have an effect on the NDVI. To mention a few, dry vegetation, with yellow or brown leaves or other elements, can form a significant part of a pixel, as well as woody material (twigs, branches, trunks) in forested areas. This also reveals a major weakness of most radiative transfer models describing vegetation, namely what may be termed their “spectral poverty”. In most cases, the spectral diversity in these models is limited to a single species for the soil background, and one or two for the leaves, needles, and/or stems; however, including more spectral species in RT models not only makes these models more complicated, but it also renders their inversion virtually impossible, even if multispectral or hyperspectral data would be used. We have to accept that models are always an abstraction of reality and that the results of model inversion should be interpreted with caution. On the other hand, the NDVI and other more refined versions of it, like the SAVI (soil-adjusted vegetation index), are still widely used, so one may conclude that there is a clear demand for the spectral information condensed in a simple index that provides a quick qualitative impression of green vegetation status over large areas. As such, in this paper, we investigate whether the spectral information that the NDVI is based on, namely the reflectance in the red and NIR bands, can be used to provide quantitative estimates of the LAI, soil brightness, and fAPAR by a simple model inversion applied to bi-spectral red and NIR white-sky albedo data, and if this is possible with a speed that is comparable to that of the NDVI calculation.
The paper is organized as follows. Section 2 presents several radiative transfer modelling concepts and bi-spectral image processing approaches. Section 2.1 presents the two-stream BHR model in which the soil background is included with the adding method. Section 2.2 discusses feature space plots of the red and NIR bands to illustrate the effects of soil brightness and LAI and presents a new concept to retrieve soil brightness. In Section 2.3, the effects of crown clumping and linear mixing on moderate-resolution pixels are considered. Here, three models of surface heterogeneity are also introduced and their manifestation in feature space plots is presented. The estimation of fAPAR based on the three heterogeneity models is described in Section 2.4, and Section 2.5 describes the application of a direct look-up table (DLUT) technique applied to global satellite data to generate LAI, soil brightness, and fAPAR maps. The results are presented in Section 3 and discussed in Section 4, while the conclusions are presented in Section 5.
2. Materials and Methods
2.1. Bi-hemispheric Reflectance Model
In the 1D turbid medium radiative transfer model SAIL [3], an adding method [4] is applied to calculate the bi-hemispherical reflectance of the combination soil and canopy, which is given by the simple expression below [5]:
where is the reflectance of the soil background and the right term describes the multiple reflections between canopy layer and soil background. To clearly express the downward and upward flows of diffuse radiation through the canopy required to account for the soil’s influence, the hemispheric canopy transmittance appears twice in Equation (1). For a small LAI, this transmittance approaches unity, so it includes the direct transmission of light without any contact with leaves. The adding method is a simplified implementation of what has been termed by other investigators a combination of the so-called “black soil problem” and “S-problem” [6,7] in their explanations of numerical 3D radiative transfer as a particle transport problem, similar to approaches applied in the numerical modelling of neutron transport in nuclear reactor physics. In the much simpler analytical two-stream radiative transfer theory applied in SAIL, the bi-hemispheric reflectance and transmittance of the isolated canopy layer (the basic solutions of the black soil problem), and , are given by well-known expressions:
where L is the leaf area index (LAI).
The quantities m and are known as the diffusion exponent and the so-called infinite reflectance, which is the BHR of a hypothetical canopy with an infinite LAI. Both quantities are functions of single leaf reflectance, ρ, single leaf transmittance, τ, and the leaf inclination distribution function, LIDF, which is symbolized as f (θl), where θl is the zenith angle of the leaf’s normal. The leaf azimuth distribution is assumed to be uniform. Together, these quantities determine the diffuse backscattering coefficient σ and the net attenuation coefficient a as follows [3,7,8]:
where θl is in radians and .
Table 1 shows some values of γ for a few common LIDF types. They range from 0 to 1, but since in Equation (3) they are multiplied by half the difference of leaf reflectance and leaf transmittance, the effect of γ on these quantities will never be large, since leaf reflectance and transmittance usually do not differ by more than 0.05. Note in column 2 of the table that δ is the Dirac delta function.

Table 1.
Values of γ for some common LIDF types.
The diffusion exponent m is the eigenvalue of the coupled system of two-stream differential equations [5,7] and is given as follows:
where and denotes the single leaf absorptance. The infinite reflectance, , finally is given by the following equation:
Figure 1 shows an example of the spectra of and m (unitless) as obtained from the leaf optical properties model Fluspect-B [9], which, regarding leaf reflectance and transmittance, is very similar to PROSPECT-5 [10], except that it still includes brown pigments, as in older versions of PROSPECT [11]. In this typical case of a green leaf, the biochemical inputs are the ones listed in Table 2.
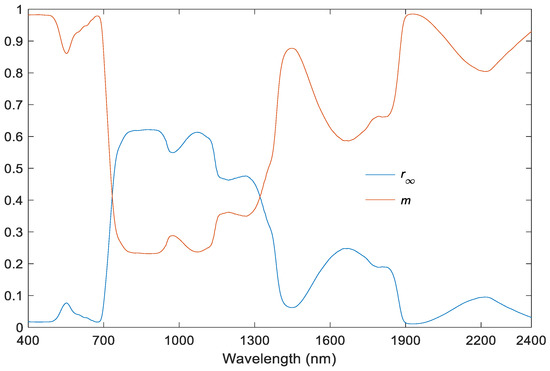
Figure 1.
Spectra of the infinite canopy bi-hemispherical reflectance and the diffusion exponent m for a spherical leaf angle distribution as obtained from the Fluspect-B model with the inputs of Table 2.

Table 2.
Input parameters for spectral simulation with leaf model Fluspect-B.
The substitution of Equation (2) in Equation (1) gives an analytical expression for the canopy BHR in which the soil background, with reflectance , is also incorporated. This yields the following quasi-linear combination of and :
where.
Further elaboration of Equation (6) provides the BHR of the combination of the soil and canopy with a slightly simpler equation:
The quantity . expresses the spectral soil/vegetation contrast. From Equation (7), it can be concluded that the sensitivity of rdd tohe LAI will be most favourable for large values of rs’, i.e., when there is a large contrast between and . Spectral regions in the red and the near-infrared (NIR) parts of the spectrum both allow a large soil/vegetation contrast, and therefore both are very sensitive to the LAI, since in the red, the for green vegetation is very small (<0.05) and in the NIR it is high (>0.60, Figure 1) when compared to the moderate reflectance of the soil in these spectral regions; however, the NIR has the advantage of featuring a much smaller value of the diffusion exponent m, which means that saturation at high LAIs occurs much later than in the red band. It turns out that, in general, the reflectance in the red band is particularly sensitive to low LAIs, whereas the reflectance in the NIR band is relatively more sensitive to the LAI when it is high. Also, should the soil’s reflectance in either the red or the NIR band be close to the corresponding , then the soil/vegetation contrast in the other band will be extra high, so both spectral regions will always complement each other. These cases may occur for either very dark or very bright soil backgrounds.
2.2. Red–NIR Feature Space Plots
Figure 2 shows how various combinations of soil brightness and canopy LAI appear in a red–NIR feature space plot. In this paper, the soil’s reflectance in the red is adopted as a measure of soil brightness. For reflectance values obtained from various crops observed in the field, the resulting quasi-triangular shape is also known under the name of “tasselled cap” [12]. In the publication of Kauth and Thomas [12], the tassels mark the various paths in the feature space that are followed by cereal crops during ripening. In Figure 2, the tassels are actually missing in this simulated case of exclusively green vegetation. The plot also confirms why the NDVI is a fairly good indicator of the LAI, since lines of constant NDVI go through the origin, and the brown lines of constant LAI in the diagram show roughly the same behaviour, although for the low LAIs located just above the bare soil line this is clearly no longer the case [13]. In Figure 2, all green lines of constant soil brightness appear to join together in a single vertical line.
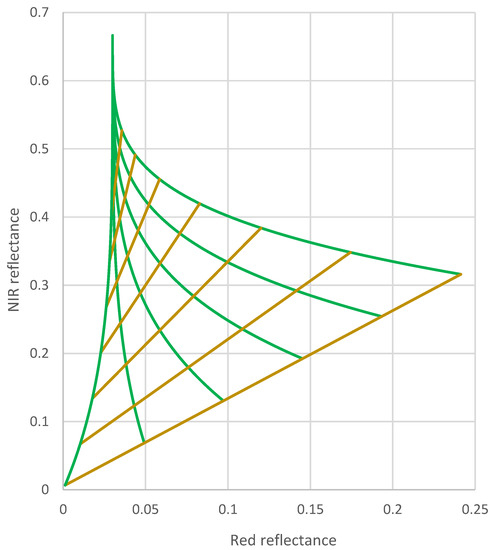
Figure 2.
Feature space plot of modelled NIR vs. red bi-hemispherical reflectance for varying soil brightnesses and canopy LAIs. Lines of a varying LAI are shown in green and lines of a varying soil brightness are shown in brown.
This means that in this region of the red–NIR feature space, only a very specific value of the reflectance () in the red band would allow possible solutions for model inversion. By allowing a much larger range of soil brightness values, the model’s “repertoire” can be extended, and it appears that the triangle then also fills the upper parts of the diagram, as shown in Figure 3; however, the fact remains that solutions of model inversion are only possible for red reflectance values that exceed a certain minimum value, namely the canopy in the red.
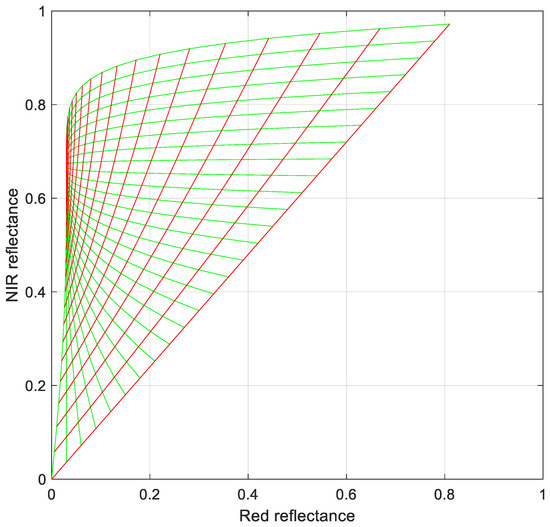
Figure 3.
Same as Figure 2, but for an extended range of soil brightness. Lines of varying soil brightness values shown in red and lines of varying LAIs shown in green.
From Equation (7), we may obtain , and therefore the LAI can in principle be solved by the following:
so that the LAI can be estimated analytically from the simple equation .
This equation makes it clear that for the estimation of the LAI, knowledge about the soil’s reflectance is just as important as the measured reflectance of the soil and canopy combination and the optical properties of the vegetation, as expressed by and m; however, since the soil’s reflectance, in particular its brightness, is usually unknown, one still has to find a way to estimate before one can estimate the LAI. Therefore, we will now try to exploit the relationship between the values of soil reflectance at two wavelengths. This relationship is mostly very simple, since the ratio of the soil’s reflectance at two wavelengths for a given soil type is usually constant [13,14,15]. One can derive .
Since , we find the following equation:
This indicates that, theoretically, with a known or assumed leaf area index L and given values of m, r, and , it is possible to derive the soil’s reflectance, provided of course that the LAI is not too high.
We may assume that for a given soil type, its reflectance rs in the near-infrared band (N) is a constant factor S times its reflectance in the red band (R). We express this by Ns = SRs. Extending this notation for red and near-infrared reflectance (R and N) to the other quantities gives the following:
These expressions indicate that with an assumed leaf area index L and given values of m, r, and at both wavelengths, it should be possible to estimate the soil’s reflectance at these wavelengths, identified as Rs and Ns. In particular, the ratio Ns/Rs can then be established, and if this ratio happens to be equal to S, we can conclude that obviously the correct LAI was guessed. When Rs and Ns are plotted in a diagram as a series of points as a function of the assumed LAI, we obtain a graph like that shown in Figure 4. Here, the red line is the locus of points of varying LAI that intersects the point of measured reflectance (the grey dot).
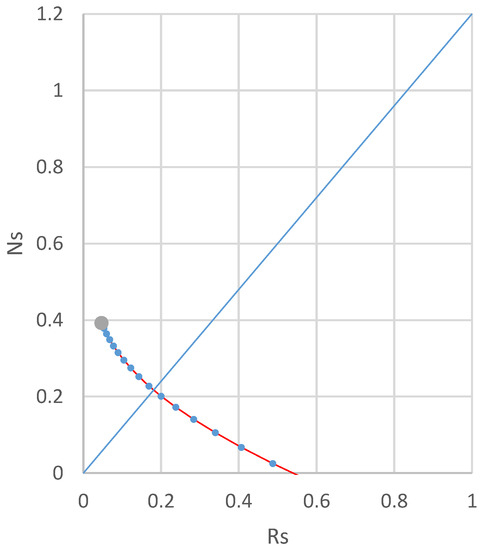
Figure 4.
Feature space plot of Rs and Ns for varying LAIs. The grey dot indicates the point where the assumed LAI = 0. The blue-coloured straight line is the locus of all points where Ns/Rs = S = 1.2.
It is clear from this diagram that in this situation the matching LAI can be found from the intersection of one red line segment with the blue line. Next, the soil’s brightness follows from its position along the blue line relative to the origin. The grey dot corresponds to the point where the assumed L equals 0. In that case, substitution in Equation (10) gives the red reflectance:
This makes sense, since, for an assumed L of zero, the soil’s reflectance must be equal to the measured reflectance. Note that L here does not indicate the actual LAI, but rather the one that would be needed to travel the path from the measured reflectance point at the position (R, N) to the soil line at (Rs, Ns).
2.3. Including Crown Clumping and Surface Heterogeneity (Linear Mixing) Effects
The BHR model discussed so far only simulates radiative transfer for homogeneous turbid medium-type vegetation canopies with infinite extension in the horizontal plane. In reality, vegetation canopies like forests may exhibit crown clumping and/or other forms of spatial heterogeneity, and satellite image pixels may also contain mixtures of bare soil and dense vegetation, certainly if the spatial resolution is moderate or low.
In the two-stream BHR model, a crown clumping effect as in forests can be introduced by modulating the canopy layer’s reflectance and transmittance as follows:
where Cv is the vertically projected crown cover fraction. These expressions were taken from the SLC (soil–leaf-canopy) model [16], which simulates crown clumping effects in one of the simplest possible ways. They are based on the concept of mixing the scattering properties of tree crowns with those of voids, which do not scatter light at all, but have a transmittance of unity.
For the modified canopy reflectance including the soil background, Equation (1) is employed again and then reads:
Note that for Cv = 1 this is equivalent to the spatially uniform (turbid medium) model presented in Section 2.2. Also, it turns out that according to Equation (13) this kind of 3D mixing is non-linear.
Estimating rs from this equation however is still straightforward, since it can easily be derived from Equation (13) as follows:
As opposed to the above model of the 3D mixing of soil and vegetation, the simplest model of surface heterogeneity resulting into mixed pixels is linear and assumes that a fraction fC of a pixel contains vegetation of a uniform composition and the complementary fraction 1 − fC contains only bare soil, having the same reflectance as the one underneath the canopy, rs. The final mixed-pixel reflectance then becomes the following:
This equation represents a new hybrid BHR canopy reflectance model in which vertical and lateral mixing with the bare soil are accommodated. In principle, estimating rs from this model is still possible if it is the only unknown, but this then requires solving the following quadratic equation:
where the coefficients of the quadratic formula are the following:
It was found that the well-known formula for the pair of solutions is less convenient for use in practice, as in the limit of fC = 1, in which case a = 0, only the root of the smallest magnitude can remain finite, which then must be estimated by means of L’Hôpital’s rule. Using the product of both roots, which equals c/a, it was found that the root of smallest magnitude can better be written in a less-known alternative form as follows:
where a = 0 directly gives the correct solution −c/b.
Note that Equation (18) can only yield a value of rs if the LAI and both cover fractions are known. If this algorithm is applied to reflectance values in the red and the near-infrared bands, as shown in Section 2.2 (Figure 4), it turns out that the LAI and soil brightness can still be estimated from bi-spectral red–NIR reflectance values, provided again that both cover fractions Cv and fC are given.
The simulated effects of crown clumping and lateral linear mixing on the red–NIR diagram of Figure 3 are shown in Figure 5. Here, only the upper left panel, where both cover fractions are equal to unity, still represents a homogeneous turbid medium canopy corresponding to the original in Figure 3. The other panels are modified versions of the upper left panel due to the effects of crown clumping (column direction) and incomplete linear fractional cover (row direction). From this figure, we may conclude that these non-linear and linear mixing effects definitely cannot be neglected. By these effects, all points in the red–NIR diagram are drawn into the direction of the bare soil line, especially the points in the upper left corner of the diagram. This also implies that points in the upper left of the diagram can only indicate pixels with dense homogeneous green vegetation. These points have the highest ratios N/R, and therefore also the highest NDVI. A high NDVI therefore not only indicates the presence of a large proportion of green vegetation in the target pixel, but also that the pixel was homogeneous (high fC) and that the vegetation resembled a turbid medium (high Cv), since otherwise the NDVI would have been smaller, as demonstrated in Figure 5 by the panels for the lower values of fC and Cv. One can conclude that a high NDVI must indicate a combination of canopy parameters formed by a high leaf chlorophyll content, a high LAI, and high values of both vegetation coverage parameters fC and Cv; however, the downside is that a low NDVI may have a multitude of causes, namely low values of any of the parameters leaf chlorophyll, crown LAI, crown cover Cv, or the pixel vegetation cover fraction fC.
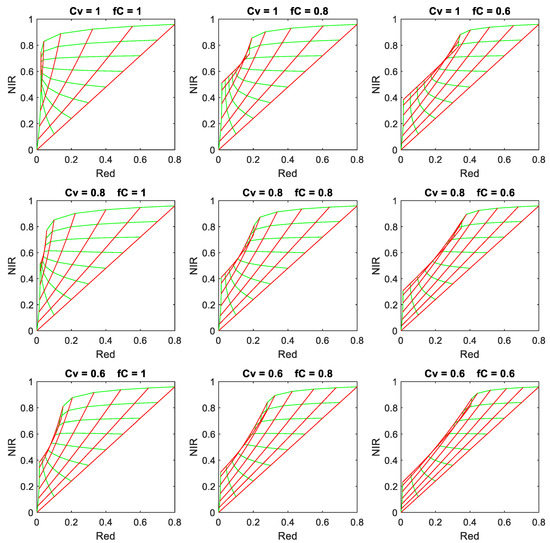
Figure 5.
Effects of crown clumping and mixed-pixel heterogeneity on the red–NIR bi-hemispherical reflectance feature space. Lines of varying soil brightness are shown in red (levels 0, 0.1, 0.2, …, 0.8 in Rs). Lines of varying crown LAI are shown in green (levels 0, 0.2, 0.5, 1, 2, 4, 8). Vertical crown cover (Cv) and fractional cover (fC) are shown in the title of each subplot.
NDVI values are also slightly influenced by the brightness of the soil background, and to reduce this influence, several alternatives for the NDVI have been proposed, like the soil-adjusted vegetation index SAVI [14], transformed SAVI (TSAVI) [15], and modified SAVI (MSAVI) [13]; however, from Figure 5, we can conclude that these attempts to reduce soil brightness effects are most suitable for homogeneous turbid-medium type vegetation canopies, since for more open canopies, with Cv and/or fC less than unity, the slopes of the soil lines are again strongly influenced by the soil, in particular for high LAIs. The lower fC and Cv, the more we find that soil lines orient themselves parallel to the bare soil line, and in that respect the utility of indices (VIs) like the perpendicular VI (PVI) [13] and weighted difference VI (WDVI) [17,18] increases in comparison to the NDVI, since these indices are constant along lines parallel to the bare soil line.
Due to the so-called saturation effect, in Figure 5, the lines of varying soil brightness (shown in red) for an LAI of 8 must be very close to the similar lines corresponding to an infinite crown LAI (not shown) since the corresponding reflectance values are very close to each other, certainly in the red band. In other words, based on reflectance values alone, one can hardly discriminate between an infinite crown LAI and an LAI of 8. This factor alone already substantially complicates the estimation of the LAI from reflectance data when the LAI is high. However, there are more factors, such as the obvious ill-posedness of the model inversion from red–NIR reflectance data, which is manifested here by the fact that multiple combinations of LAI, fC, and Cv can produce exactly the same reflectance pairs of red–NIR reflectance. For instance, in one scenario, one might assume green vegetation with a high leaf chlorophyll content, a fixed crown LAI of 8, complete pixel coverage (fC = 1), and then both vertical crown cover Cv and soil brightness might be estimated from red–NIR reflectance data. In another scenario, one might neglect crown clumping by assuming Cv = 1 and vary pixel heterogeneity by considering fC as an unknown, as well as soil brightness. After model inversion in both of these scenarios, an effective LAI [19] could be assigned to the pixel that is equal to the product of crown LAI and both cover fractions, i.e., LAIeff = LAI × Cv × fC, but in principle these alternative scenarios are just as applicable as the scenario of a homogeneous turbid medium canopy, and the outcomes in terms of effective LAI would probably be different.
Another issue is that, even with assumed values of LAI and leaf chlorophyll, red and NIR reflectance data are not adequate to estimate both cover fractions if soil brightness is also left free, since the number of estimated parameters would still exceed the number of reflectance values by one. Therefore, the application of three extreme models (or scenarios) that are invertible based on different assumptions is proposed. The assumptions common to all three of them are the following:
- The LIDF is spherical;
- Single leaf reflectance and transmittance in the NIR band are 0.52 and 0.44, respectively (0.04 leaf absorptance). In the red band, we use 0.07 and 0.01, respectively, which is common for green leaves;
- The maximum crown LAI is 8;
- The bare soil’s spectral slope, defined by the ratio S = Ns/Rs, is given and equal to 1.2;
- Soil brightness is always a free parameter that is to be estimated.
In the first model (I), both cover fractions are assumed to be equal to unity and the LAI is estimated. This model represents homogeneous surfaces covered with a uniform turbid-medium type of canopy.
In the second model (II), the crown LAI is assumed to be fixed at 8, the surface is homogeneous (fC = 1), and the crown cover fraction Cv is estimated. This model represents homogeneous forests with variable crown density.
In the third model (III), the vegetation LAI is also fixed at 8, the crown cover fraction Cv is unity, but the surface is heterogeneous. The fractional vegetation cover fC is estimated. This model represents green agricultural fields or grasslands interrupted by patches of bare soil within the pixel.
In all cases, soil brightness is estimated, as well as an effective pixel-level LAI, defined by LAIeff = LAI × Cv × fC. Figure 6 shows red–NIR feature space plots for the three models, in which soil brightness varies together with the other free parameter of the corresponding model, so LAI, Cv, and fC in models I, II, and III, respectively.
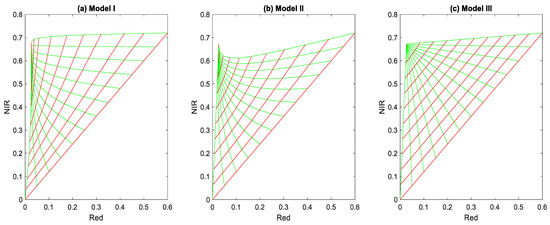
Figure 6.
Effects of changes in soil brightness (in red) and the crown LAI, Cv and fC (in green) in the red–NIR BHR feature space. Soil brightness (Rs) levels of 0, 0.05, …, 0.6; LAI levels in panel (a) are 0, 0.1, 0.2, 0.35, 0.5, 0.7, 1, 1.5, 2, 4, 8; Cv levels in panel (b) are 0, 0.1, …, 1.0; fC levels in panel (c) are 0, 0.1, …, 1.0. The NIR/red ratio for the soils, S, is assumed to be 1.2. For models II and III, the crown LAI is always 8.
In all three panels, the red lines show the effect of soil brightness variations, and the green lines the effects of the other free parameter of the respective model. It appears that all three models occupy similar triangular shapes, and in the overlapping area we can conclude that the three models are equally acceptable as candidates for model inversion. For comparison, Figure 7 shows a 2D histogram of the red and NIR bands obtained from the MODIS white-sky albedo product at the local moment of maximum NDVI, which reproduces the predicted triangular shapes very well.
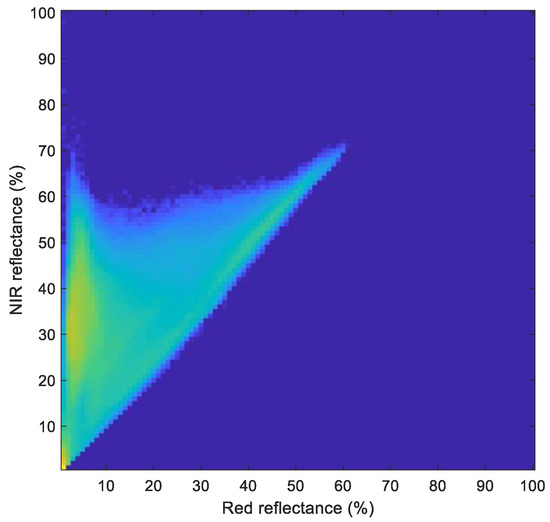
Figure 7.
2D histogram plot (log frequency) of red–NIR bands from global MODIS white-sky albedo at a maximum NDVI. The bin size is 1% reflectance in both bands.
The models clearly differ by their degrees of non-linearity. Model I is extremely non-linear in its response to LAI, the different responses in the red and the NIR, and in the soil lines, which show a large increase of slope with LAI. On the other hand, model III is almost perfectly linear, except in the upper left corner, where the soil line for unity fC has a much higher slope, since this is the slope corresponding to a homogeneous turbid medium canopy with an LAI of 8. Model II is non-linear, like model I, but the response to Cv is much more linear than the response to LAI in model I, and the soil lines of model II do have increasing slopes, but less so than in model I. In model I, the red reflectance hardly changes between LAIs of 4 and 8, so the soil lines for these cases are vertical and do virtually overlap. Here, the NDVI increases with soil brightness, unlike the situation for low LAIs and more open canopies. Model I is so close to linear that it allows the direct estimation of fractional cover fC and soil brightness (Rs) from red–NIR BHR reflectance data if S is known:
where the estimated fractional cover fC is obviously approximated by a linear combination of R and N, whereas the estimated soil brightness, represented by Rs, is found as a ratio of two linear combinations of R and N. The linear combination of R and N that estimates fC suggests that, with a proper choice of the weights, the WDVI [17,18] is a good predictor of the fractional vegetation cover, and in model III this is also a predictor of the effective LAI.
2.4. Estimation of fAPAR
Since the infinite reflectance in the red band is known from its assumed value , and the soil’s reflectance follows one of the methods described in the previous section, one can derive all relevant quantities needed to estimate the fraction of absorbed photosynthetically active radiation, fAPAR, for diffuse incident radiation, while assuming that red light is representative for the whole visible or PAR region. In the homogeneous turbid medium model (I), the absorbed fraction of the incident hemispherical flux is given by the following equation:
This equation shows that canopy absorptance increases with soil reflectance, which is caused by light reflected upward by the soil into the canopy that for a black soil would be lost by absorption in the soil and now contributes to absorption in the canopy layer.
The absorptances by the canopy and by the soil, and the reflectance from the top, together must obey the law of radiant energy conservation. To demonstrate this, Equation (20) may be rewritten as follows:
where the last term is the effective absorptance of the soil, which is formed by the fraction of incident light at the canopy bottom that is not reflected by the soil and thus is given by the following equation:
By combining Equations (21) and (22), one may find that the sum is equal to unity, so the law of radiant energy conservation is thus obeyed.
The above derivations apply to model I, but they can easily be generalized to models II and III. To include the effects of crown clumping and lateral mixing, the canopy absorptance of Equation (20) must be modified into the following form:
In the literature, a linear relationship between fAPAR and the NDVI is often reported. These relationships are mostly based on experimental evidence, but model calculations [6,19,20] also support this idea. Taking the canopy diffuse absorptance in the red band as a proxy for fAPAR, the relationship with the NDVI may be calculated with models I–III for varying soil brightness levels and the LAI or cover fractions. The result is presented in Figure 8, which shows feature space plots of fAPAR vs. NDVI with varying soil brightness effects in red and the effects of the other free parameter in green. The near-linear relationships found earlier by other investigators are confirmed here for soils of moderate brightness (Rs of approximately 0.25–0.40). For black soils, there is hardly any relationship, since in that case NDVIs are high regardless of the soil background, while fAPAR can still vary to a large extent. For dark soils, the relationships are strongly curved in all three models. Similar results have been reported by Myneni and Williams [19]. When soil brightness is increased under a constant LAI or Cv, fAPAR increases while NDVI decreases, especially at high soil brightnesses. In model III, we see horizontal red lines in this case, indicating that in this model fAPAR depends only on fC. This is explained by the high fAPAR at a crown LAI of 8, but only for the fraction of the pixel that is covered with dense green vegetation, with minimum influence of the soil background on total fAPAR per pixel.

Figure 8.
Effects of soil brightness and LAI (model I), Cv (model II), and fC (Model III) on the relationships between NDVI (from red and NIR BHRs) and fAPAR shown by red and green lines, respectively, for the three model scenarios. Soil brightness levels Rs = 0, 0.05, …, 0.6; LAI levels in panel (a) of 0, 0.1, 0.2, 0.35, 0.5, 0.7, 1, 1.5, 2, 4, 8; Cv levels in panel (b) of 0, 0.1, …, 1; fC levels in panel (c) of 0, 0.1, …, 1.
2.5. Retrieval of LAIeff, Soil Brightness and fAPAR from Red–NIR BHR Data
If no other information is available, the three scenarios of models I–III presented in the previous two sections are all equally likely to occur in reality for moderate-resolution satellite image pixels, although this may depend on the LAI. For instance, it is hard to imagine that a canopy can still resemble a turbid medium for LAIs < 1. It seems more likely that low LAIs are only possible in combination with clumping in plants or crop rows.
From Figure 6, one can conclude that the repertoires of these models do largely overlap and it can be shown that, provided a sufficiently large range of soil brightness is accommodated, the triangular shape shown in panel (c) for model III corresponds to the minimum repertoire common to all three models, and this provides a simple criterion to decide whether a given combination of red and NIR reflectance values still belongs to the common repertoire or not. In practice, Equation (19) of Section 2.3 can be applied to test whether the estimated values of fC and Rs are physically acceptable. If not, then one must decide to reject the input pixel for model inversion. Otherwise, inversion of models I–III should be possible, and the results would yield three solutions of soil brightness and separate solutions of LAI, Cv and fC, respectively. Since a crown LAI of 8 was assumed in models II and III, the effective LAI could be estimated by assuming equal weights:
For soil brightness, simply the average of the three outcomes can be taken. Regarding fAPAR, Equation (23) is universally applicable to all three models, so also in this case a simple average of the outcomes should suffice. For red–NIR pairs of measured reflectance values located below the bare soil line, none of the three models can provide a solution. In such cases we have to conclude that obviously the soil’s spectral slope is less than that assumed, and the pixel is vegetation-free. Here, the red reflectance Rs is accepted as the soil brightness output. The equal-weight solution suggested in Equation (24) can be considered as a starting point for more refined solutions, e.g., by adapting the weights according to a biome classification, as is done in the MODIS LAI processing chain [6]; however, to minimize possible spatial discontinuities, only the equal-weight solution is applied for the present paper, regardless of biomes.
For the application of the algorithm in practice, it has been proven to be beneficial to carry out the retrieval with a pre-computed direct look-up table (DLUT). Look-up table (LUT) solutions in radiative transfer model inversion problems are quite common and have been applied by numerous investigators [6,19]; however, these LUTs normally contain predicted reflectance values in a number of bands for a set of combinations of model input parameters, and the model inversion then consists of finding the vector of reflectance values that most closely resembles the measured reflectance data vector, possibly followed by some interpolation. Depending on the size of the LUT and its dimensionality, this may still take a considerable execution time. With a DLUT technique, however, the measured digital reflectance values are converted into an index, which is a direct pointer to the outputs stored in the DLUT. These outputs are the result of traditional model inversion techniques like numerical optimization. Once the DLUT has been generated, the application of this technique to images is nearly instantaneous regarding execution time, but it can only be applied in practice if the number of bands is limited to two or three. With the red and NIR MODIS bands as inputs, and a radiometric sampling interval of 0.001 reflectance units, a DLUT with about one million entries is sufficient to cover all possible combinations of red–NIR inputs. The generation of such a DLUT, which contains as outputs the effective LAI, average fAPAR, and average soil brightness (Rs) calculated from the retrieval results obtained for models I–III, takes about 25 seconds in MATLAB on an average PC (Intel i5 processor) without any speed optimizations. Application of the DLUT to a single MODIS CMG global scene (3600 × 7200 pixels) may take only 0.18 seconds, which is nearly instantaneous indeed. The application of the DLUT to long time series of MODIS CMG data or other large datasets should therefore not be a problem. It should be mentioned that this DLUT technique can only be applied for a fixed assumed value of soil spectral slope S and fixed green leaf optical properties. If S and/or the leaf optical properties vary pixel by pixel, the DLUT technique can no longer be used and one should count on a processing time of about 25 microseconds per pixel, which for a global CMG image would be 650 seconds or approximately 11 minutes; however, by skipping all water pixels, that time could easily be reduced by one third or to about 4 minutes.
3. Results
The Moderate Resolution Imaging Spectroradiometer (MODIS) MCD43C3 Version 6 Bidirectional Reflectance Distribution Function and Albedo (BRDF/Albedo) dataset [1] is produced daily using 16 days of Terra and Aqua MODIS data in a 0.05 degree (5600 m at the equator) Climate Modelling Grid (CMG). Data are temporally weighted to the ninth day of the retrieval period, which is reflected in the Julian date in the file name. This CMG product covers the entire globe for use in climate simulation models. MCD43C3 provides black-sky albedo (directional hemispherical reflectance, DHR) and white-sky albedo or BHR data at the local solar noon. Black-sky albedo and white-sky albedo values are available as a separate layer for MODIS spectral bands one through seven, as well as the visible, near-infrared (NIR), and shortwave infrared bands. Along with the 20 albedo layers, ancillary layers for quality, local solar noon, percent finer resolution inputs, snow cover, and uncertainty are also provided. The data can be downloaded for free from the Land Processes Distributed Active Archive Center (LP DAAC) website: (https://lpdaac.usgs.gov/products/mcd43c3v006/ accessed on 1 March 2020). For this particular project, data were downloaded for all 16 day periods since 2000 until the beginning of 2020. Only two processed data sets were further employed, namely the MODIS white-sky albedo data in bands 1–7 at the pixel-wise situation of accumulated minimum and maximum NDVI, respectively, taking all observations from all years together as input. Figure 9 shows the two global NDVI maps taken from MODIS white-sky albedo bands one and two as red–NIR pairs. A total of 455 images at 16-day intervals was used as input.
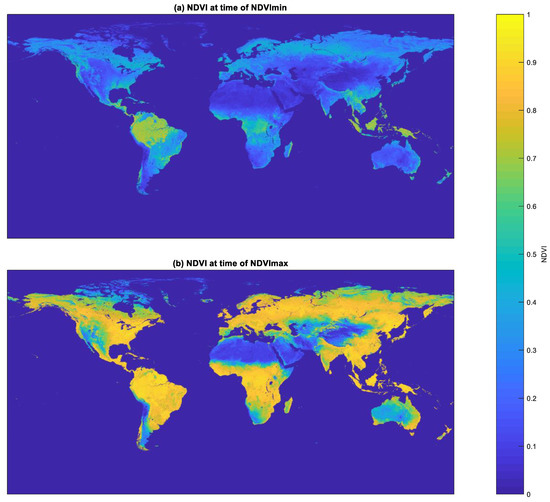
Figure 9.
NDVI maps taken from the white-sky albedo products of the MODIS red and NIR bands at the pixel-wise moments of (a) minimum and (b) maximum NDVI. The result of processing 455 input files downloaded from the NASA EOSDIS Land Processes DAAC at 16-day intervals over the period from 2000 until 2020.
During the processing of all input files, two quality indicators (“BRDF_Quality” and “Percent_Inputs”) supplied by the distributor, in addition to a snow index, were applied to only admit input pixels of sufficient quality as candidates. For the snow index, MODIS bands one and six (red and shortwave infrared) were employed in the formula SI = 255 × R/(R + M), where R and M are the digital numbers in bands 1 and 6, respectively. Only pixels with “BRDF_Quality” < 4, “Percent_Inputs” > 50 and SI < 110 were accepted. This resulted in nearly continuous maps of the minimum and maximum NDVI with a high degree of spatial coherence, as can be seen in Figure 9.
The map of minimum NDVI clearly shows where permanent green vegetation was present during the observation period, although African rainforests show up less prominently than Amazonian and Indonesian rainforests. The map of the maximum NDVI shows the places where dense green vegetation was present at least once during the whole period. This appears to be almost everywhere except in desert areas and regions with permanent snow cover, such as on Greenland and in the Himalayas.
Before discussing the results of applying the DLUT technique to the red and NIR bands of the MODIS data, first some remarks are in order regarding the settings of some important sets of input parameters, since they may have a tremendous effect on the results. As discussed briefly in Section 2.3 and Section 2.4, the repertoire of the models used depends on the assumed optical properties of green leaves or needles in the red and the near-infrared, and on the assumed soil spectral slope. This repertoire determines the retrieval rate, i.e., the percentage of pixels that passed a successful model inversion, since combinations of R and N falling outside the repertoire cannot be inverted, so the larger the repertoire, the larger the retrieval rate can be; however, this may come at a price, namely, less accurate results in terms of LAI, soil brightness, and fAPAR. This is because of the ill-posedness of the model inversion: in the model, several LAI, soil brightness, and leaf optical property combinations can yield the same combination of reflectances in the red and NIR bands, and if the wrong optical leaf properties are assumed, this will be compensated by incorrectly retrieved values for the LAI and soil brightness. The leaf or needle optical properties determine their reflectance and transmittance in the red and NIR spectral bands, and in turn, these determine the corresponding canopy infinite reflectance values, and , as explained in Section 2.1. These infinite reflectance values determine the position of the upper left corner of the triangular-shaped repertoires shown in Figure 6. The smaller and the larger , the larger the model’s repertoire, since this is the direction away from the bare soil line. Additionally, the spectral slope of the bare soil line has some influence on the repertoire: the smaller this slope, the larger the repertoire will be.
With the initial assumptions for the inputs of the three models presented in Section 2.3, the results were not completely satisfactory, since a considerable number of pixels, located mainly in the rainforests, led to unsuccessful retrievals because their reflectance in the red band was less than the assumed , so they fell outside the repertoire. In the 2D histogram of Figure 7, one can observe that several pixels had red reflectance values less than 0.01, so it was decided to adjust the single leaf reflectance to 0.02 and transmittance to zero in order to achieve a retrieval rate close to 100%. In this way, one obtains an of 0.0067, and this turned out to be sufficient to reach a high retrieval rate.
Regarding the assumed bare soil’s spectral slope, for the MODIS red and NIR bands, a fixed value of S = 1.2 was found to be adequate, since this almost perfectly coincided with the modal spectral slope found in the image of the minimum NDVI. A higher assumed slope would result into a lower retrieval rate, since more bare soil pixels would become non-invertible. Assuming a lower slope would enlarge the repertoire and improve the retrieval rate, but bare soils with a slightly higher slope would be mistaken for sparsely vegetated surfaces. In this respect, it should be noted that pixels below the assumed bare soil line actually were not considered to be non-invertible. Instead, for these pixels the LAI was simply set to zero, and the observed reflectance in the red band was adopted as the measure of soil brightness. This can be interpreted as a local posterior adjustment of the assumed bare soil’s spectral slope. In the future, this may lead to a more refined use of maps of soil spectral slope in order to improve the retrieval results compared to the results obtained with a constant value of S.
4. Discussion
The results of applying the DLUT to the red and NIR bands of the images shown in Figure 9 are presented in Figure 10, Figure 11 and Figure 12. The effective LAI maps for the situations of minimum and maximum NDVI are shown in Figure 10. From these maps one can conclude that they look more or less as expected, with maximum LAI values of about 4. They roughly follow the NDVI maps of Figure 9, with the exception of the rain forests, which show only moderate LAIs of about 2–2.5.
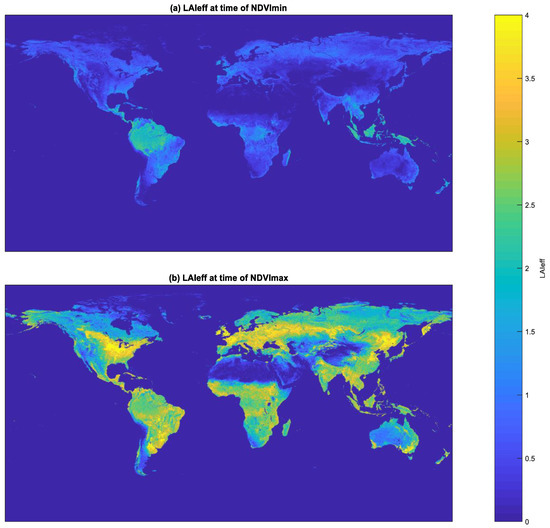
Figure 10.
Estimated effective LAI from the DLUT applied to the red–NIR bands of the images of Figure 9.
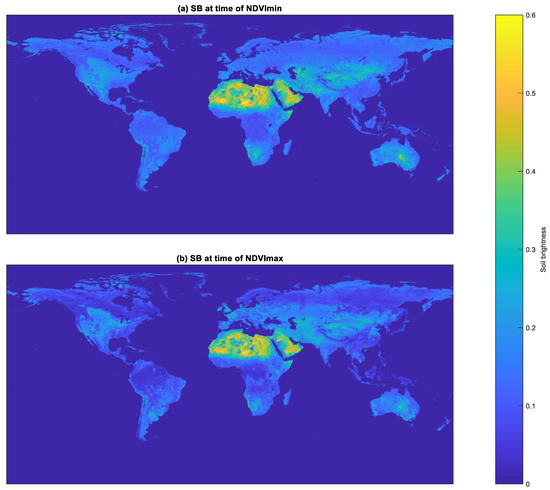
Figure 11.
Estimated soil brightness (in the red band) from the DLUT applied to the red–NIR bands of the images of Figure 9.
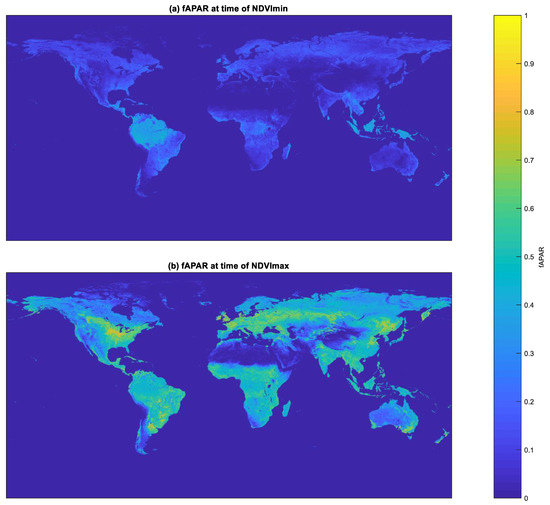
Figure 12.
Estimated fAPAR (red band) from the DLUT applied to the red–NIR bands of images of Figure 9.
As for the white-sky albedo (BHR) the role of the 3D canopy structure was expected to be limited, this low LAI in rainforests was initially only attributed to woody material. This was not incorporated in the two-stream BHR model, but it potentially has a large impact on the NIR canopy reflectance via its effect on the infinite reflectance, , since its absorption of NIR radiation reduces it enormously. The for the assumed leaf with a single leaf absorptance of 0.04 was 0.67; however, according to Equation (5) in Section 2.1, the infinite canopy reflectance can be approximated by , so for a slightly raised effective leaf absorptance of 0.16 we would obtain 1 – 2 × 0.4 = 0.2, which means a reduction by a factor of more than 3. This implies that adding some absorbing woody material to a leaf canopy can have a huge negative impact on the NIR canopy reflectance if the LAI is high, such as in forests. An inspection of the reflectance values in the rainforests revealed that in the NIR band they were substantially lower (about 50%) than in agricultural regions, but in the red band this reduction was even greater, and this cannot be explained by woody material alone, since woody material is brighter than green leaves or needles in the red band, so one may expect a raised reflectance in the red band. The very low red reflectance for forests can only be explained by the clumping effect, combined with a high LAI. This is also the main reason for the difference between the maps of NDVI and LAIeff. The maps of NDVI show high values in both forested and agricultural areas, whereas high values of the retrieved LAIeff at the moment of maximum NDVI are limited to areas of high agricultural activity, such as the Corn Belt in the USA, south of the Amazon rainforest, Europe, Australia, and North-East China.
The corresponding maps of retrieved soil brightness shown in Figure 11 are fairly similar for the situations at maximum and minimum NDVI, not only in desert regions, where this could be expected, but also in most vegetated areas. An exception was formed by the rainforests, which showed lower retrieved soil brightness values at the maximum NDVI. The reason for this is unknown, but it is not of crucial importance anyway, since the impact of soil brightness on densely vegetated forest scenes is very small. Very high soil brightness values greater than 0.5 occur in the Sahara Desert and Arabia. The elucidation of how stable these soil brightness maps are over time may be investigated by time series analysis applied to the MODIS white-sky albedo data; however, this falls outside the scope of the present paper.
The last product discussed here is fAPAR, shown in Figure 12. This product was derived from the retrieved prime parameter of models I–III (LAI, Cv or fC) and soil brightness, as explained in Section 2.4. The results look very similar to the maps of LAIeff shown in Figure 10, with moderate values in rainforests and higher values in areas with strong agricultural activity. Again, this can be attributed to disregarding woody material and underestimating clumping effects in forested areas, although lower values of fAPAR in forests are not against expectations, since visible light absorbed by trunks and branches does not contribute to the fAPAR going to leaves or needles. Nevertheless, the model would have to be reformulated in order to properly take account of the absorption by woody material.
Comparing the results obtained so far with this first version of the algorithm to those of the MODIS LAI products [6], we may conclude that including biome-specific information about the distinction between forests, shrubs, and other types of vegetation would probably be beneficial for an improved result that better takes account of the spectral diversity amongst biome types. Biome maps might also be used for a more specific weighting of the results of models I–III, and perhaps by applying different values of maximum LAI in these models. In the MODIS LAI product [6], a classification into six biomes is included, and each biome is linked to extensive datasets of specific information which drive the numerical radiative transfer model outputs stored in look-up tables. Since the retrieval rate obtained was limited, a backup algorithm based on biome-specific assumed relationships of LAI and fAPAR with the NDVI was employed.
In a Bayesian approach, the JRC-TIP algorithm [19], which applies a two-stream turbid medium model to generate black-sky albedo simulations, uses statistical a priori information to combat the ill-posedness of the model inversion, but this information is applied globally and is non-specific with respect to biomes. An advantage of the Bayesian approach is that maps of the posterior uncertainties of the retrieval results can be provided as by-products. In the method of the present paper, this could be achieved in an approximate manner by comparing the results obtained with the different surface heterogeneity models I–III, since the agreement amongst these models about the outcomes would be a good measure of the uncertainty.
A validation of the presented product prototypes could take place by comparing them to time series of field measurements of LAI and fAPAR at a limited number of flux-tower locations representative for the various biomes on Earth. Also, comparison to several existing LAI and fAPAR products from MODIS (e.g., MOD15, MYD15 and MCD15) and other missions would be desirable, but since in this paper only a few first examples of the new products were shown for some rather arbitrary preliminary settings of the heterogeneity parameters in models I–III, this was considered to be premature, in addition to the considerable impact that it would have on the length of the paper. Also, the mentioned MODIS products have a different spatial sampling density and projection (sinusoidal), which would introduce considerable additional complications. Therefore, since the present paper was only meant to introduce a new simple approach, this task has been left for future work. Nevertheless, in this paper, this new approach has already been presented to enable young researchers in the land surface remote sensing community to experiment with it. To this end, the MATLAB codes of the model inversion, the DLUT generation, and its application to images are provided as Supplementary Materials.
5. Conclusions
A simple bi-hemispherical canopy/soil reflectance model has been introduced and extended with crown clumping and linear mixing effects. Assuming that the soil’s spectral shape is given, soil brightness can be derived if all canopy parameters are known. If applied to red and NIR spectral bi-hemispherical reflectance values, this allows the simultaneous retrieval of soil brightness and LAI by using an efficient direct look-up table technique (DLUT). The fraction APAR in the red band can be provided as an important by-product. Since crown cover and linear mixing coverage are mostly unknown, it was proposed to use three invertible extreme model scenarios of surface heterogeneity and to average the results obtained from these models. The proposed methodology was tested with global MODIS white-sky albedo data in the red and NIR bands. It was shown that the method can be applied with a retrieval rate close to 100% and at a nearly instantaneous speed thanks to the DLUT technique. The global maps of effective LAI, soil brightness, and fAPAR produced are spatially continuous and show a high degree of spatial coherence. Refinements based on biome-specific information are recommended, especially to differentiate forested areas from other vegetation types.
Supplementary Materials
The Supplementary Materials can be available online at https://www.mdpi.com/article/10.3390/rs13101976/s1.
Funding
This research received no external funding.
Data Availability Statement
The MODIS CMG albedo data are downloadable for free from the Land Processes Distributed Active Archive Center (LP DAAC) website: https://lpdaac.usgs.gov/products/mcd43c3v006/ (accessed on 1 March 2020).
Acknowledgments
The Faculty ITC of the University of Twente is acknowledged for administrative support and ICT facilities after the author’s retirement in 2016.
Conflicts of Interest
The author declares no conflict of interest.
References
- Schaaf, C.; Wang, Z. MCD43C3 MODIS/Terra+Aqua BRDF/Albedo Albedo Daily L3 Global 0.05Deg CMG V006 [Data Set]. NASA EOSDIS Land Processes DAAC. 2015. Available online: https://doi.org/10.5067/MODIS/MCD43C3.006 (accessed on 1 March 2020).
- Nicodemus, F.E. Reflectance Nomenclature and Directional Reflectance and Emissivity. Appl. Opt. 1970, 9, 1474–1475. [Google Scholar] [CrossRef] [PubMed]
- Verhoef, W. Light scattering by leaf layers with application to canopy reflectance modeling: The SAIL model. Remote Sens. Environ. 1984, 16, 125–141. [Google Scholar] [CrossRef]
- Van de Hulst, H.C. Multiple Light Scattering; Academic Press: New York, NY, USA, 1980; ISBN 978-0-12-710701-1. [Google Scholar]
- Verhoef, W. Earth observation modeling based on layer scattering matrices. Remote Sens. Environ. 1985, 17, 165–178. [Google Scholar] [CrossRef]
- Knyazikhin, Y.; Glassy, J.; Privette, J.L.; Tian, Y.; Lotsch, A.; Zhang, Y.; Wang, Y.; Morisette, J.T.; Votava, P.; Myneni, R.B.; et al. MODIS Leaf Area Index (LAI) and Fraction of Photosynthetically Active Radiation Absorbed by Vegetation (FPAR) Product (MOD15) Algorithm Theoretical Basis Document. 1999. Available online: http://eospso.gsfc.nasa.gov/atbd/modistables.html (accessed on 28 February 2021).
- Pinty, B.; Lavergne, T.; Dickinson, R.E.; Widlowski, J.-L.; Gobron, N.; Verstraete, M.M. Simplifying the interaction of land surfaces with radiation for relating remote sensing products to climate models. J. Geophys. Res. 2006, 111, D02116. [Google Scholar] [CrossRef]
- Sellers, P.J. Canopy reflectance, photosynthesis and transpiration. Int. J. Remote Sens. 1985, 6, 1335–1372. [Google Scholar] [CrossRef]
- Vilfan, N.; Van der Tol, C.; Müller, O.; Rascher, U.; Verhoef, W. Fluspect-B: A model for fluorescence, reflectance and transmittance spectra. Remote Sens. Environ. 2016, 186, 596–615. [Google Scholar] [CrossRef]
- Féret, J.-B.; Gitelson, A.; Noble, S.D.; Jacquemoud, S. PROSPECT-D: Towards modeling leaf optical properties through a complete lifecycle. Remote Sens. Environ. 2017, 193, 204–215. [Google Scholar] [CrossRef]
- Jacquemoud, S.; Baret, F. PROSPECT: A model of leaf optical properties spectra. Remote Sens. Environ. 1990, 34, 75–91. [Google Scholar] [CrossRef]
- Kauth, R.J.; Thomas, G.S. The Tasseled Cap—A Graphic Description of the Spectral-Temporal Development of Agricultural Crops as Seen by LANDSAT. In Proceedings of the Symposium on Machine Processing of Remotely Sensed Data, LARS Symposia, West Lafayette, IN, USA, 29 June–1 July 1976. [Google Scholar]
- Qi, J.; Chehbouni, A.; Huete, A.R.; Kerr, Y.H.; Sorooshian, S. A Modified Soil Adjusted Vegetation Index. Remote Sens. Environ. 1994, 48, 119–126. [Google Scholar] [CrossRef]
- Huete, A.R. A soil-adjusted vegetation index (SAVI). Remote Sens. Environ. 1988, 25, 295–309. [Google Scholar] [CrossRef]
- Baret, F.; Guyot, G.; Major, D. TSAVI: A vegetation index which minimizes soil brightness effects on LAI or APAR estimation. In Proceedings of the 12th Canadian Symposium on Remote Sensing Geoscience and Remote Sensing Symposium, Vancouver, BC, Canada, 10–14 July 1989. [Google Scholar]
- Verhoef, W.; Bach, H. Coupled soil–leaf-canopy and atmosphere radiative transfer modeling to simulate hyperspectral multi-angular surface reflectance and TOA radiance data. Remote Sens. Environ. 2007, 109, 166–182. [Google Scholar] [CrossRef]
- Clevers, J.G.P.W. The derivation of a simplified reflectance model for the estimation of leaf area index. Remote Sens. Environ. 1988, 25, 53–70. [Google Scholar] [CrossRef]
- Clevers, J.G.P.W. The Application of a Weighted Infrared-Red Vegetation Index for Estimating Leaf Area Index by Correcting for Soil Moisture. Remote Sens. Environ. 1989, 29, 25–37. [Google Scholar] [CrossRef]
- Pinty, B.; Andredakis, I.; Clerici, M.; Kaminski, T.; Taberner, M.; Verstraete, M.M.; Gobron, N.; Plummer, S.; Widlowski, J.-L. Exploiting the MODIS albedos with the Two-stream Inversion Package (JRC-TIP): 1. Effective leaf area index, vegetation, and soil properties. J. Geophys. Res. 2011, 116, D09105. [Google Scholar] [CrossRef]
- Myneni, R.B.; Williams, D.L. On the Relationships between FAPAR and NDVI. Remote Sens. Environ. 1994, 49, 200–211. [Google Scholar] [CrossRef]
Publisher’s Note: MDPI stays neutral with regard to jurisdictional claims in published maps and institutional affiliations. |
© 2021 by the author. Licensee MDPI, Basel, Switzerland. This article is an open access article distributed under the terms and conditions of the Creative Commons Attribution (CC BY) license (https://creativecommons.org/licenses/by/4.0/).