Article

The Impacts of Spatial Resolution, Viewing Angle, and Spectral Vegetation Indices on the Quantification of Woody Mediterranean Species Seasonality Using Remote Sensing

1
Department of Geography, The Hebrew University of Jerusalem, Mt Scopus, Jerusalem 9190501, Israel
2
Israel Nature and Parks Authority, 3 Am Ve Olamo Street, Jerusalem 9546303, Israel
3
The Robert H. Smith Institute of Plant Sciences and Genetics in Agriculture, The Hebrew University of Jerusalem, Rehovot 7610001, Israel
4
Department of Geography and Environment, Bar Ilan University, Ramat-Gan 5290002, Israel
5
Remote Sensing Research Centre, School of Earth and Environmental Sciences, University of Queensland, Brisbane 4072, Australia
*
Author to whom correspondence should be addressed.
Remote Sens. 2021, 13(10), 1958; https://doi.org/10.3390/rs13101958
Submission received: 20 April 2021 / Revised: 13 May 2021 / Accepted: 15 May 2021 / Published: 18 May 2021
(This article belongs to the Special Issue VENµS Image Processing Techniques and Applications)

Abstract

:
Discriminating between woody plant species using a single image is not straightforward due to similarity in their spectral signatures, and limitations in the spatial resolution of many sensors. Seasonal changes in vegetation indices can potentially improve vegetation mapping; however, for mapping at the individual species level, very high spatial resolution is needed. In this study we examined the ability of the Israel/French satellite of VENμS and other sensors with higher spatial resolutions, for identifying woody Mediterranean species, based on the seasonal patterns of vegetation indices (VIs). For the study area, we chose a site with natural and highly heterogeneous vegetation in the Judean Mountains (Israel), which well represents the Mediterranean maquis vegetation of the region. We used three sensors from which the indices were derived: a consumer-grade ground-based camera (weekly images at VIS-NIR; six VIs; 547 individual plants), UAV imagery (11 images, five bands, seven VIs) resampled to 14, 30, 125, and 500 cm to simulate the spatial resolutions available from some satellites, and VENμS Level 1 product (with a nominal spatial resolution of 5.3 m at nadir; seven VIs; 1551 individual plants). The various sensors described seasonal changes in the species’ VIs at different levels of success. Strong correlations between the near-surface sensors for a given VI and species mostly persisted for all spatial resolutions ≤125 cm. The UAV ExG index presented high correlations with the ground camera data in most species (pixel size ≤125 cm; 9 of 12 species with R ≥ 0.85; p < 0.001), and high classification accuracies (pixel size ≤30 cm; 8 species with >70%), demonstrating the possibility for detailed species mapping from space. The seasonal dynamics of the species obtained from VENμS demonstrated the dominant role of ephemeral herbaceous vegetation on the signal recorded by the sensor. The low variance between the species as observed from VENμS may be explained by its coarse spatial resolution (effective ground spatial resolution of 7.5) and its non-nadir viewing angle (29.7°) over the study area. However, considering the challenging characteristics of the research site, it may be that using a VENμS type sensor (with a spatial resolution of ~1 m) from a nadir point of view and in more homogeneous and dense areas would allow for detailed mapping of Mediterranean species based on their seasonality.

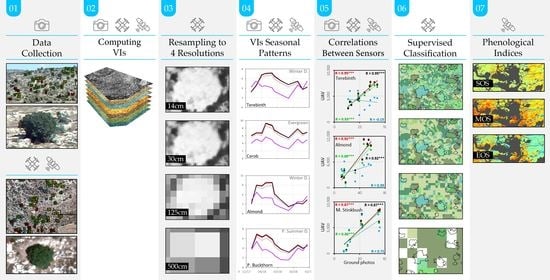
Graphical Abstract

1. Introduction

1.1. Remote Sensing of Phenology

Discrimination between plant species via remote sensing is not straightforward due to similar or overlapping spectral signatures for species with similar characteristics [1]. However, considering the seasonal dynamics of plants potentially allows for identification at the species level. Phenology characterizes the recurring seasonal events in a plant’s biological life-cycle [2], such as budburst and flowering, and can be investigated, inter alia, using spectral vegetation indices (VIs) [3]. The seasonal timing and order of phenological events vary between plant species, influenced by their evolutionary history [4], local environmental conditions such as temperature and precipitation [5], and factors such as day length and regional climate conditions [6]. Interest in quantifying changes in plant phenology over large scales has increased as it can serve as an indicator for climatic changes [7].
Phenological monitoring of plants has traditionally been conducted by human visual observations, often characterized by high spatial resolution, which provides detailed information about the phenology of the plants at the species-scale or individual plant scale [8]. However, plant surveys are considered impractical for monitoring large or inaccessible areas [9,10,11].
Land surface phenology (LSP) is the study of plant phenology at regional to global scales as assessed from data acquired through the use of space-borne optical sensors [12]. LSP includes the use of vegetation indices, quantification of the greenness of plants, and extraction of metrics such as start of season (SOS), maximum of season (MOS), and end of seasons (EOS) [12]. Due to the limited spatiotemporal resolutions in VI products, and mixed pixel effect, near-surface remote sensing is often used to quantify phenological changes [5,13,14,15].
The adoption of platforms such as unmanned aerial vehicles (UAVs) for calibration and validation of plant monitoring was encouraged by recent technological development, relatively low cost [11], and the trade-off between the spatial and temporal resolution of “traditional” satellites [1]. The enhanced spatial resolution of UAVs (centimeters and even millimeters) raises the ability to distinguish between objects, increases the number of pure pixels, and enables reliable monitoring of phenological details [16,17].
Although phenological transition dates are captured well by information extracted using infrastructure-based fixed location photography such as the PhenoCam network [15,18,19,20,21], there are difficulties with comparing the platforms products to overhead products because of differences in viewing geometry. Due to the oblique (rather than nadir) viewing angle of the camera, it sees more layers of leaves (higher Leaf Area Index) [21], and is prone to higher signal contribution from the understory vegetation (compared to contribution from the canopy top) [8]. In addition, since the products of ground photography are not spatially georeferenced, it is difficult to link a specific pixel recorded from the ground camera, to that of pixels acquired from overhead platforms [22].
Due to the availability of PhenoCam data and simple sensors (i.e., digital camera as ground-based or mounted on UAV), many remote sensing vegetation monitoring studies have been using vegetation indices in the visible light range (VIS) such as: relative green [17,23,24], relative red [16,19], and (ExG) excess green [18,25].

1.2. Remote Sensing of Mediterranean Vegetation

Identification of different species in Mediterranean woodlands (also known as maquis [26]) is a challenging task for remote sensing due to morphological resemblance [27], and dense growth of evergreen trees and shrubs, some of which have a similar spectral signature [28,29]. Moreover, the challenge increases with the contribution of the understory of mostly herbaceous species to the spectral signal in the wet season [30]. Given this complexity, accurate detection of Mediterranean vegetation at the individual plant and species level often requires the use of hyperspectral sensors (images in hundreds of narrow bands) covering a wide spectral range [31,32,33].
The need for frequent data collection over large natural areas in phenology studies makes the use of hyperspectral sensors less cost-effective. Weil et al. [27,34] used high spatial and temporal resolution time series of VIs from a consumer-grade digital camera (with VIS-NIR range) and overhead UAV imagery, to extract and quantify phenological information of common 12 Mediterranean woody species. Despite the near-surface high identification results (>85%, Kappa = 0.82), the ability for detailed mapping did not persist for micro-satellite (Planet Labs) 3–5 m imagery, probably due to mixed pixel problems.

1.3. Improved Resolutions for Quantifying Phenology (from Space)

The trade-off between the spatial and temporal resolution of satellites present a fundamental challenge when monitoring vegetation phenology throughout the year [35], and coarse spatial resolution satellites with a revisit time of few days, such as MODerate resolution Imaging Spectroradiometer (MODIS), have been used for successful monitoring of vegetation phenology across ecosystems on a global scale [36].
However, even satellites with moderate spatial resolution such as Landsat and Sentinel 2A (10–60 m depending on the band [37]), may not be sufficient to monitor phenological changes of different plant species that are not spectrally distinct, as the pixel size is bigger than the size of individuals plants [38].
The Vegetation and Environment monitoring on a New Micro-Satellite (VENµS) (250 kg) offers an attractive alternative for monitoring vegetation. VENµS is a joint space system venture of the Israeli and French national space agencies that was launched in August 2017. VENµS provides data with a nominal spatial resolution of 5.3 m (at nadir) in 12 narrow spectral bands (from 420 to 910 nm), with four red-edge bands and two NIR bands, every two days in a constant viewing angle (sun-synchronous orbit at 720 km height), for more than 100 sites globally, and for most of Israel [39]. Its high temporal resolution potentially increases the number of cloud-free images per season and may therefore improve the ability to detect short-term seasonal changes.

1.4. Aims

This work seeks to examine the possibility of identifying woody Mediterranean species from space, following the methodology in Weil et al. [27,34], and based on the seasonal patterns of vegetation indices in spatial resolutions which range between those of UAVs (cm) and VENµS (5 m) imagery, taking advantage of the red-edge bands of VENµS not available on Planet Labs satellites. In other words, this work explores what is the maximum pixel size for identifying specific species in a natural and heterogeneous environment, based on their seasonal dynamics, as expressed by time series of spectral vegetation indices that can be produced from satellites. Accordingly, the specific aims of this study were to:
  • Examine the compatibility between the seasonal patterns of vegetation indices derived from near-surface sensors (ground camera and UAV) and VENµS as a function of their spatial resolution.
  • Compare the ability of different vegetation indices to describe the seasonality patterns of woody Mediterranean plant species at different spatial resolutions.
  • Check the effect of herbaceous vegetation on the temporal patterns of vegetation across multiple spatial resolutions.
  • Explore the ability for detailed vegetation mapping from space (classification of plant individuals at the species level), at the spatial resolution of VENμS.
  • Analyze the spatial factors explaining phenological metrics derived from VENμS for woody Mediterranean vegetation.

2. Materials and Methods

2.1. Study Area

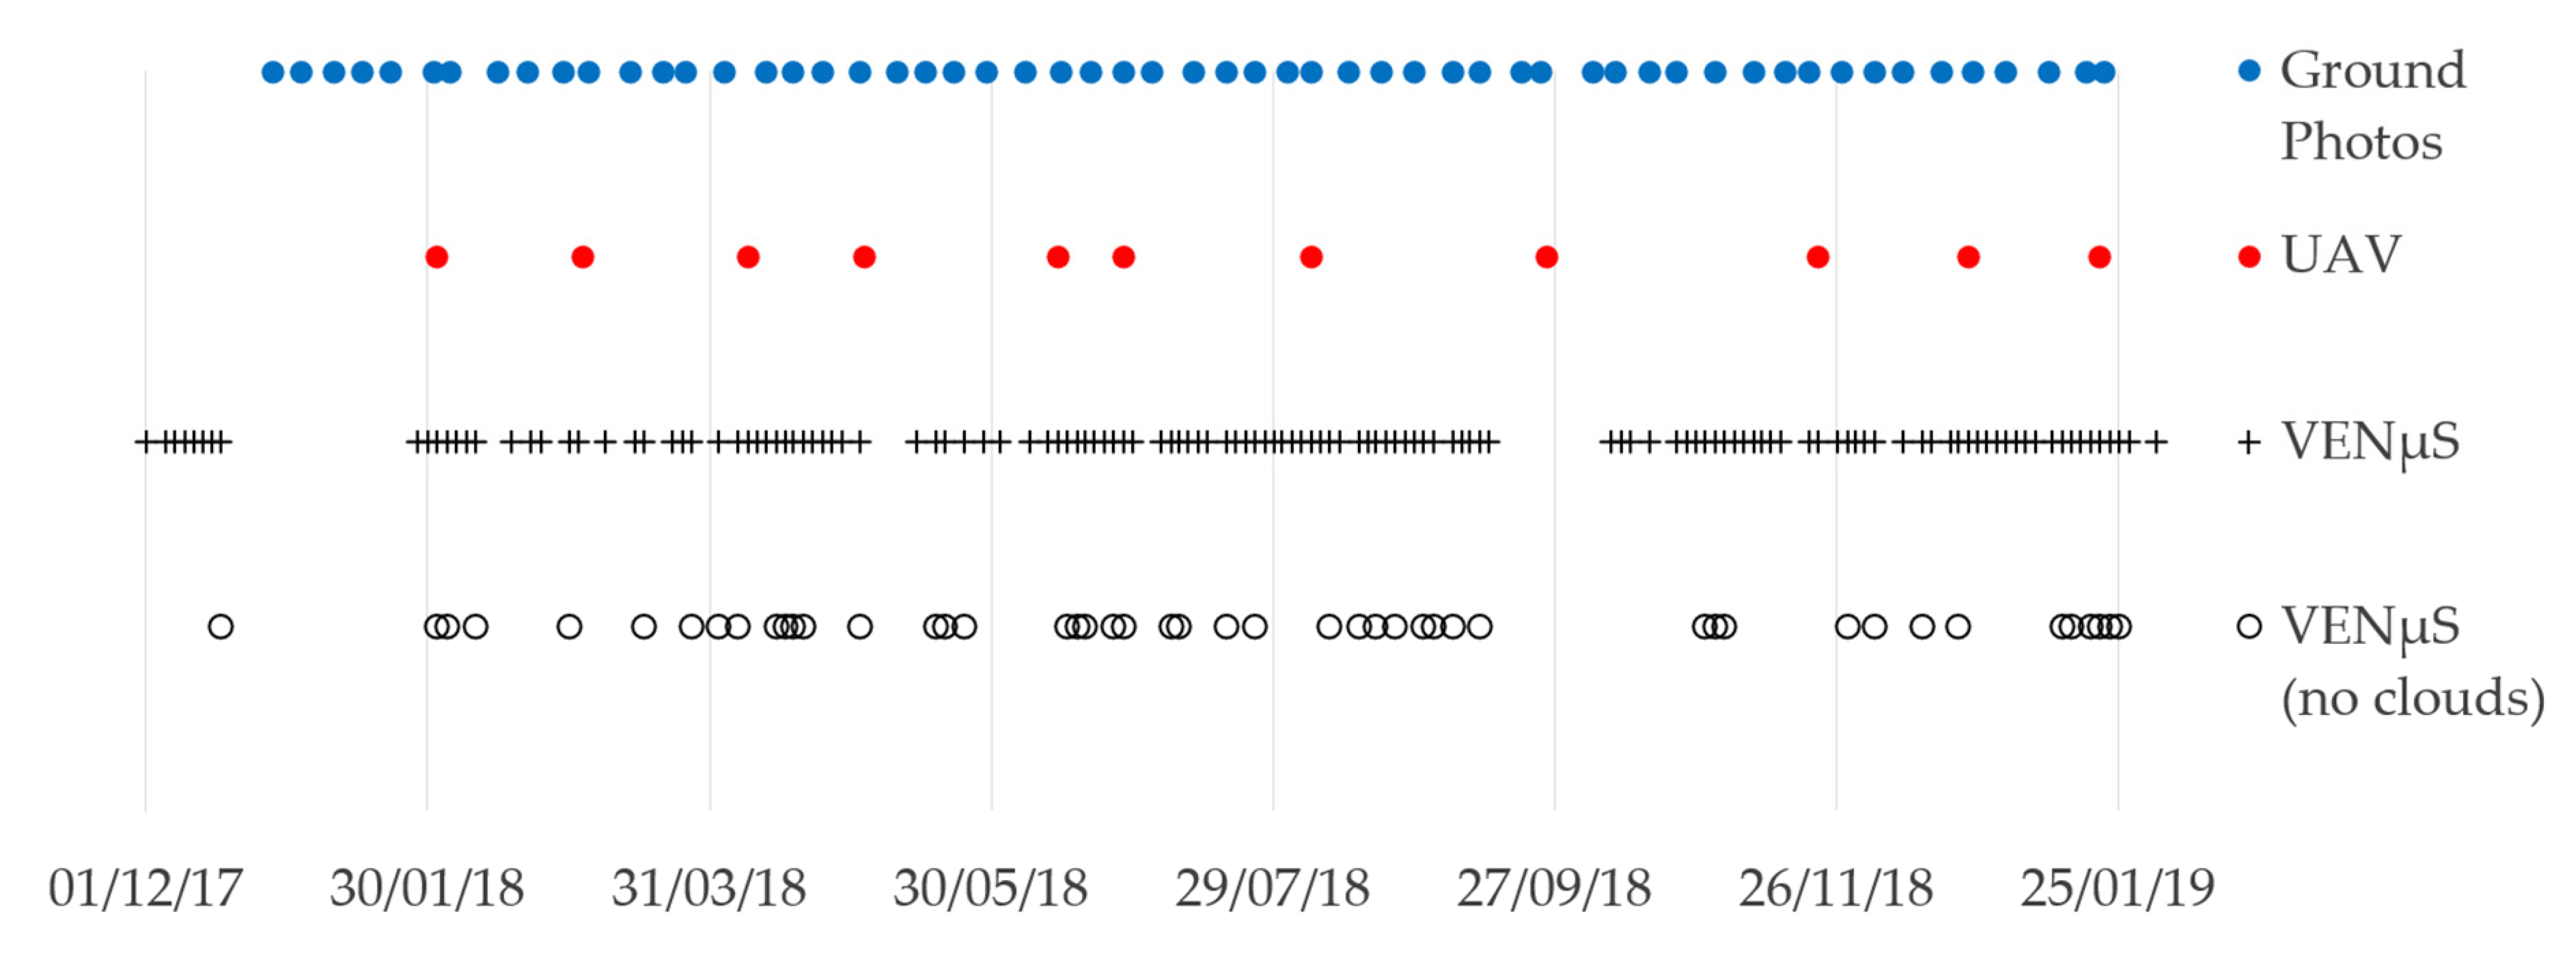
The study area (Mata) is located in the south-facing slope of Zanoach wadi, in the Judaean Mountains, Israel (Figure 1). The Mediterranean vegetation in Mata is composed of sparse woody plants, thus increasing the possibility to identify individual plants via remote sensing [27,34]. The vegetation is dominated by the evergreen Palestine Oak (Quercus calliprinos) and Mastic tree (Pistacia lentiscus) with a high concentration of the semi summer deciduous Prickly Burnet (Sarcopoterium spinosum) and patches of annual herbaceous plants that grow in the rainy season only. The site has a uniform slope of about 12° on average and ranges from approximately 540 to 630 m above sea level. The data collection from the research site was conducted between December 2017 and January 2019 using three platforms: a modified digital camera, UAV, and VENμS (Figure 2).

2.2. Datasets

2.2.1. Ground Photos

The near-surface data collection, pre-processing, outliers’ removal and smoothing method used in this section are described in detail in Weil et al. [27]. We collected the data on a weekly basis, from 28 December 2017, to 22 January 2019 (57 dates) (Figure 3), using an infrared-modified Canon EOS 600D, equipped with two external filters, X-Nite CC1 (RGB) and X-Nite 780 (NIR) (LDP-LCC labs) (response function in Figure 2). We photographed at noon using a tripod from a fixed location on an opposite slope, at a distance ranging between 300 to 700 m (Figure 1).
We registered every image using 23 georeferencing points to a reference image by ArcMap 10.7.5 software, with an average root mean square error of 0.16 pixels. We conducted the correction of the illumination differences between the different acquisition dates per band using a histogram shift to a referenced clear date image, based on the mean digital number (DN) values of un-vegetated rocks surface. In order to achieve a good red-NIR ratio and following the findings of Weil et al. [27], we multiplied the camera’s NIR band by a constant value of 1.4.
Regions of interest (ROI) used for the camera analysis were created by Weil et al. [27,34] and were used by us. These ROIs were drawn in an illuminated part of an individual plant canopy, representing how it appears at the oblique view angle of the ground camera, while trying to minimize noise effects such as shading and mixed pixels. The ROIs were modified by us to suit the 2018 conditions (i.e., removal of 14 ROIs due to interference by another plant or mortality, editing 80 ROIs according to the shading conditions and the change in structure, and addition of 2 ROIs to the layer in order to preserve the number of pixels representing the herbaceous vegetation), resulting in 691 ROIs.
We calculated six spectral vegetation indices (VIs) (Table 1(a–f)), and extracted the mean values of each of the VIs for every individual plant per date from within the ROI. In order to detect outliers, we compared the mean value (of the pixels comprising an individual plant/ROI at a specific date) to the entire time series range and defined it as an outlier if it was a local peak while not forming part of a long trend or not being the annual minimum or maximum value. Outlier values for a specific date which exceeded 10% of change of that individual’s data range (57 dates) were smoothed by a moving average. The excess green index (ExG) had low percentage of outliers and thus was chosen to represent the plants seasonal patterns in all vegetation indices. Therefore, we removed from the analysis individuals for which more than 40% of the dates were identified as outliers in the ExG index or species with less than 10 individuals, resulting in 547 individual plants (Table 2). To produce the final less noisy time series and to describe the phenology, we fitted a locally weighted scatterplot smoothing (LOESS) function [40] with a 6 dates window, following Weil et al. [27,34].

2.2.2. UAV

Images from the study area were obtained using a fixed-wing UAV equipped with a Micasense Rededge-MX camera, with 5 spectrally separated bands (B, G, R, Red-edge, NIR) operated by Terrascan company (http://tmt.co.il (accessed on 17 May 2021)) [46]. The UAV had a monthly revisit time starting February 2018 to January 2019, resulting in 11 dates (without October) (Figure 3). The pixel size in the different corrected surface reflectance mosaics ranged from 5–13 cm. We upscaled (resampled) the UAV images to a common spatial resolution of 14 cm according to the average pixel values (aggregation) in the ENvironment for Visualizing Images software (ENVI 5.3) and calculated seven VIs (Table 1(a–g)), also utilizing the red edge band. To examine the extent to which the spatial resolution had an effect on phenological patterns obtained for each species, we further resampled the time series of UAV VIs to coarser spatial resolutions of 30, 125 and 500 cm. The resampled pixels sizes were chosen to simulate the spatial resolutions of WorldView 3, WorldView 4 (panchromatic in 31 cm, and VIS-NIR in 1.24 m) and VENμS (nominal resolution of 5.3 m at nadir) sensors.
The ROI segmentation method and VI (NDVI) used for the UAV data was similar to Weil et al. [34]. Briefly, after conducting a field survey in the site of Mata for validation and calibration to the analyzed time frame (2018), we digitized the species that were mapped, and merged the result with the points of interest layer of Weil et al. [34]. The transition from points of interest to polygons that represent individual plant canopy was based on the first three components of a principal component analysis (PCA) of the UAV NDVI time series (11 dates), containing 92.46% of the original variability. We segmented the PCA layer using “Segment Mean Shift” in ArcMap 10.7.5 software. We removed the shadowed part of the canopy and pixels with NDVI values of <0.5 throughout the time series from the segmented polygons, resulting in 1551 ROIs (i.e., individual plants, some of them with contiguous canopies) with more than 10 individuals. We extracted the mean VI value for each individual plant per date (n = 11) and spatial resolution from within the ROIs, and compared it to the results of the ground camera analysis in adjacent dates (Table 3) assuming that they describe the phenological patterns more accurately. The statistical analysis was conducted using the Statistical Package for the Social Sciences (SPSS) software.

2.2.3. VENμS

We examined a small area of about 7100 ha in the S01 tile of VENμS over Israel, which overlaps the research site, for clear sky conditions from mid-December 2017 to January 2019, in correspondence with the ground camera acquisitions. We only used cloud-free images, thus resulting in 47 dates and used the images to calculate seven VIs (Table 1(a–g)). We sampled the VENμS time series using the UAV’s ROIs, which focused on the confined area of Mata, and performed a visual and quantitative comparison between the VIs patterns derived from the three sensors. We used VENμS Level 1 product, which provides imagery at a nominal spatial resolution of 5.3 m with top of the atmosphere (TOA) reflectance. It should be noted that VENμS SO1 tile is acquired at non-nadir acquisition angle of 29.7°, and thus the effective ground sampling distance (i.e., the spatial resolution) would be about 7.5 m.

2.3. Compatibility between Sensors in Seasonal Patterns of Vegetation Indices

After extracting the VIs mean values of individual plant per date from within the ROIs, we examined compatibility between the temporal patterns of the VIs derived from the three sensors including the UAVs resampled spatial resolutions. We used both visual comparison and correlation coefficients to quantify the correspondence between the VIs from the different sensors. We used the ExG index to represent the plants’ seasonal patterns in all of the near-surface sensors comparisons, due to low percentage of outliers and strong correlation. However, when comparing the near-surface sensors with VENμS the NDVI index showed stronger correlations in most species and thus was used.

2.4. The Ability of Vegetation Indices to Describe the Seasonality of Vegetation

To examine the ability of the different vegetation indices in describing the seasonal pattern of plant’s phenology, we calculated the Pearson correlation coefficients between the VIs from the ground camera, and the VIs from the UAV (after resampling to spatial resolutions of 14, 30, 125 and 500 cm).

2.5. The Impacts of Herbaceous Vegetation on the Seasonal Patterns of Vegetation

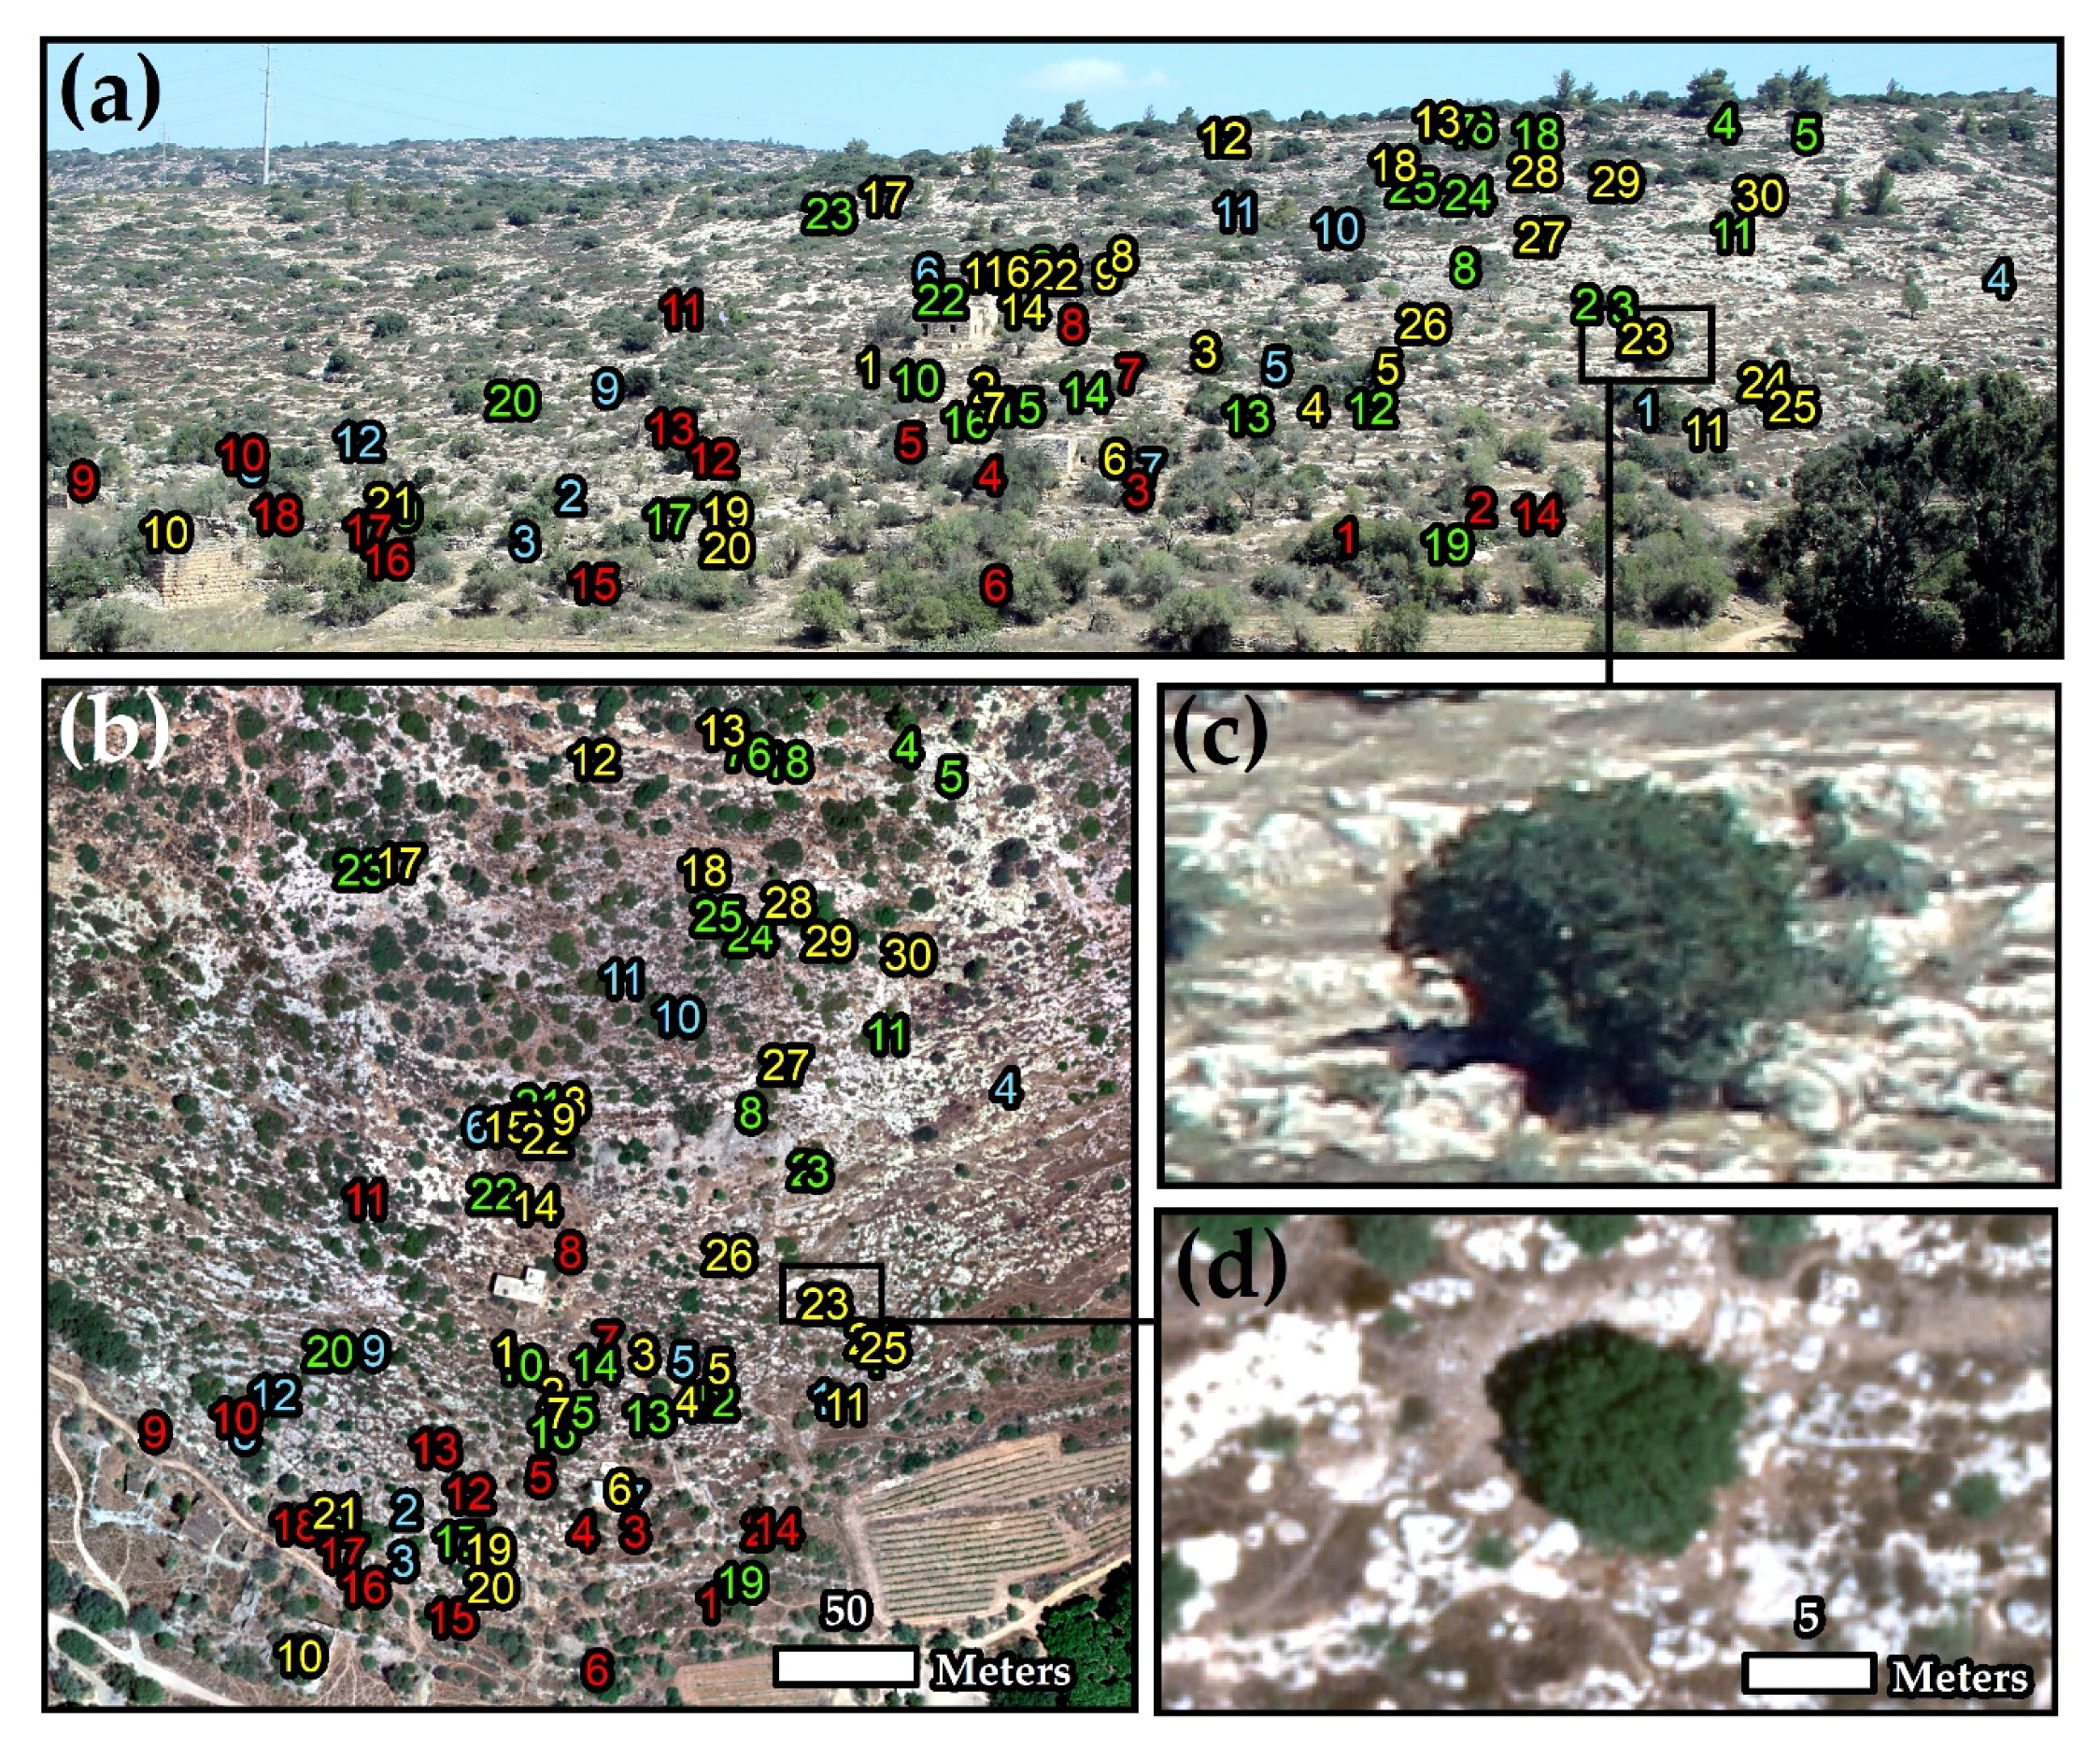
In order to examine the extent to which herbaceous vegetation affects the signal measured by the sensor, according to the different platforms photography geometries (oblique vs. near-nadir viewing angle), we identified individual plants of four species in the ground camera and UAV ROIs: Palestine Oak (evergreen, n = 30), Terebinth (winter deciduous, n = 18), Mastic (evergreen, n = 25), and Carob (evergreen, n = 12) (Figure 4). The high abundance of Palestine Oak in both platforms allowed the selection of individual plants with different distances from the ground camera lens, in a way that aimed to represent the site’s spatial variability. We examined the correlation between the ExG mean values (detected by the same sensor) of a specific plant and the herbaceous vegetation mean value (all ROIs per date), and across the UAV upscaled pixel sizes (14, 30, 125, 500 cm).

2.6. Detailed Vegetation Mapping

In order to examine the ability to map woody Mediterranean vegetation with sensors with relatively coarse spatial resolution (>14 cm), we used a supervised pixel-based classification algorithm (maximum likelihood classification, MLC) for each of the four time series of resampled UAV ExG, using ENVI software. We used the ExG index due to its low number of outliers dates, and high classification accuracy (in most species) relative to the other indices examined. Ten MLC iterations were held for each time series. In each repetition, we randomly split the ROIs into sets of 80% and 20%, to be used as training and validation samples, respectively, with representation of all species in each set. After each MLC run, we performed a refining process to the classification output of 14 and 30 cm resolutions which included: smoothing by removing noisy pixels (Kernel, 3 × 3 square center pixel was replaced to its dominant category) and removal of small areas (areas with up to 9 pixels were attributed to larger adjacent category). The process mentioned above did not improve the classification results of the 125 and 500 cm resolutions, and thus was not performed. We conducted the assessment of classification accuracy by scattering points randomly in each of the 13 categories, with each category having the same number of points, and calculating: overall agreement, species wise agreement, and overall Kappa Index of Agreement.

2.7. Spatial Factors Explaining Phenological Metrics in VENμS

We used TimeSat 3.3 software to run a pixel-based analysis and compute phenological indices to VENμS imagery, such as start of season (SOS), maximum of season (MOS), and end of seasons (EOS). In accordance with the preferences of TimeSat (full year with peak greenness in the middle of the year), we created a new NDVI time series that ranged between October 2018, to September 2019, which included 62 cloud-free images (Figure 5). We used the NDVI index (derived from VENμS) because it had better correlation with the UAV data than the VIS indices. Due to a pause in the satellite’s scientific mission and cloudy conditions over the research area, we produced an NDVI image for the start of the series, as an average of two clear dates (11 September 2018 and 29 October 2018).
We conducted the extraction of seasonality parameters by fitting an Asymmetric Gaussian model function to the NDVI time-series data, and defined SOS/EOS as 5% of the seasonal amplitude. Based on the Mediterranean climate characteristics (i.e., dry season without herbaceous contribution), we performed a time-series analysis in order to decouple the mixed herbaceous-woody signal at a sub-pixel scale. By extracting the minimum and maximum NDVI values of the herbaceous and woody vegetation, respectively, throughout the time-series, we separated the two components, following the same approach described in Levin and Heimowitz [47].
We used the analysis output (% cover of herbaceous vegetation and of perennial woody vegetation) and other environmental factors such as elevation, slope, and aspect, to evaluate the extent to which they can explain the spatial variability of phenological metrics of SOS, MOS and EOS for the season of 2018–2019 (urban, industrial and agricultural areas were excluded from this analysis). Surface aspect is known to have a strong impact on solar radiation, moisture and Mediterranean vegetation communities [48]. To perform statistical tests, we transformed the aspect from a circular to a linear variable by stretching the aspect values, such that 0° represented the north-facing slope and 180° the south-facing slope.

3. Results

3.1. Compatibility between Sensors in Seasonal Patterns of Vegetation Indices

3.1.1. Results from the Ground Camera

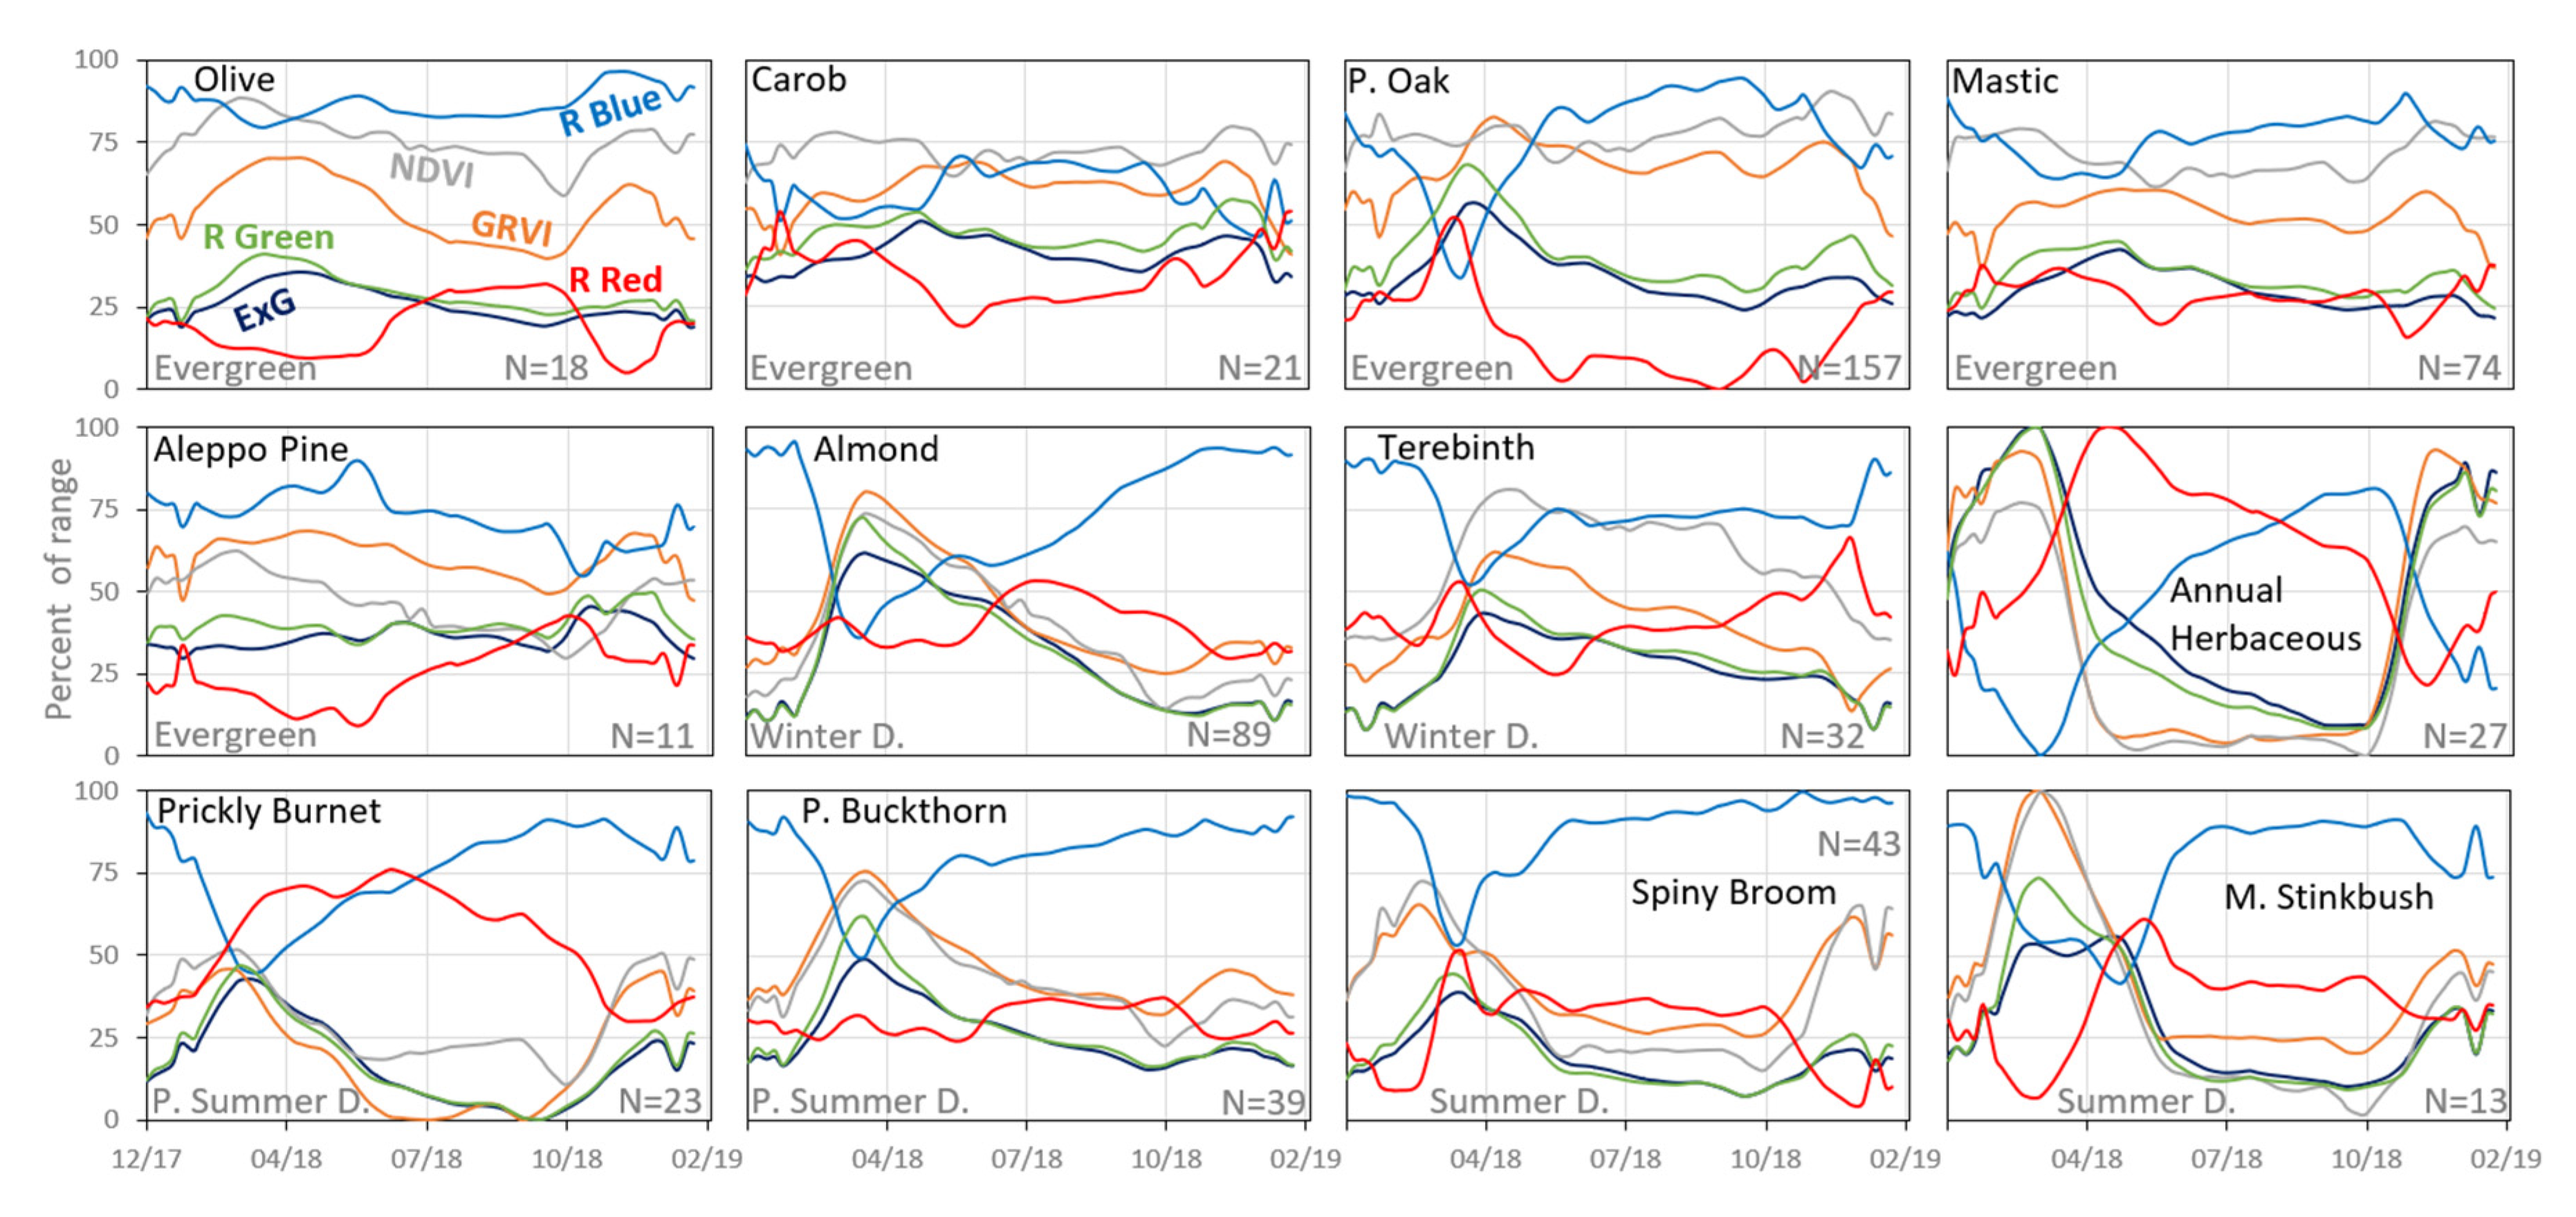
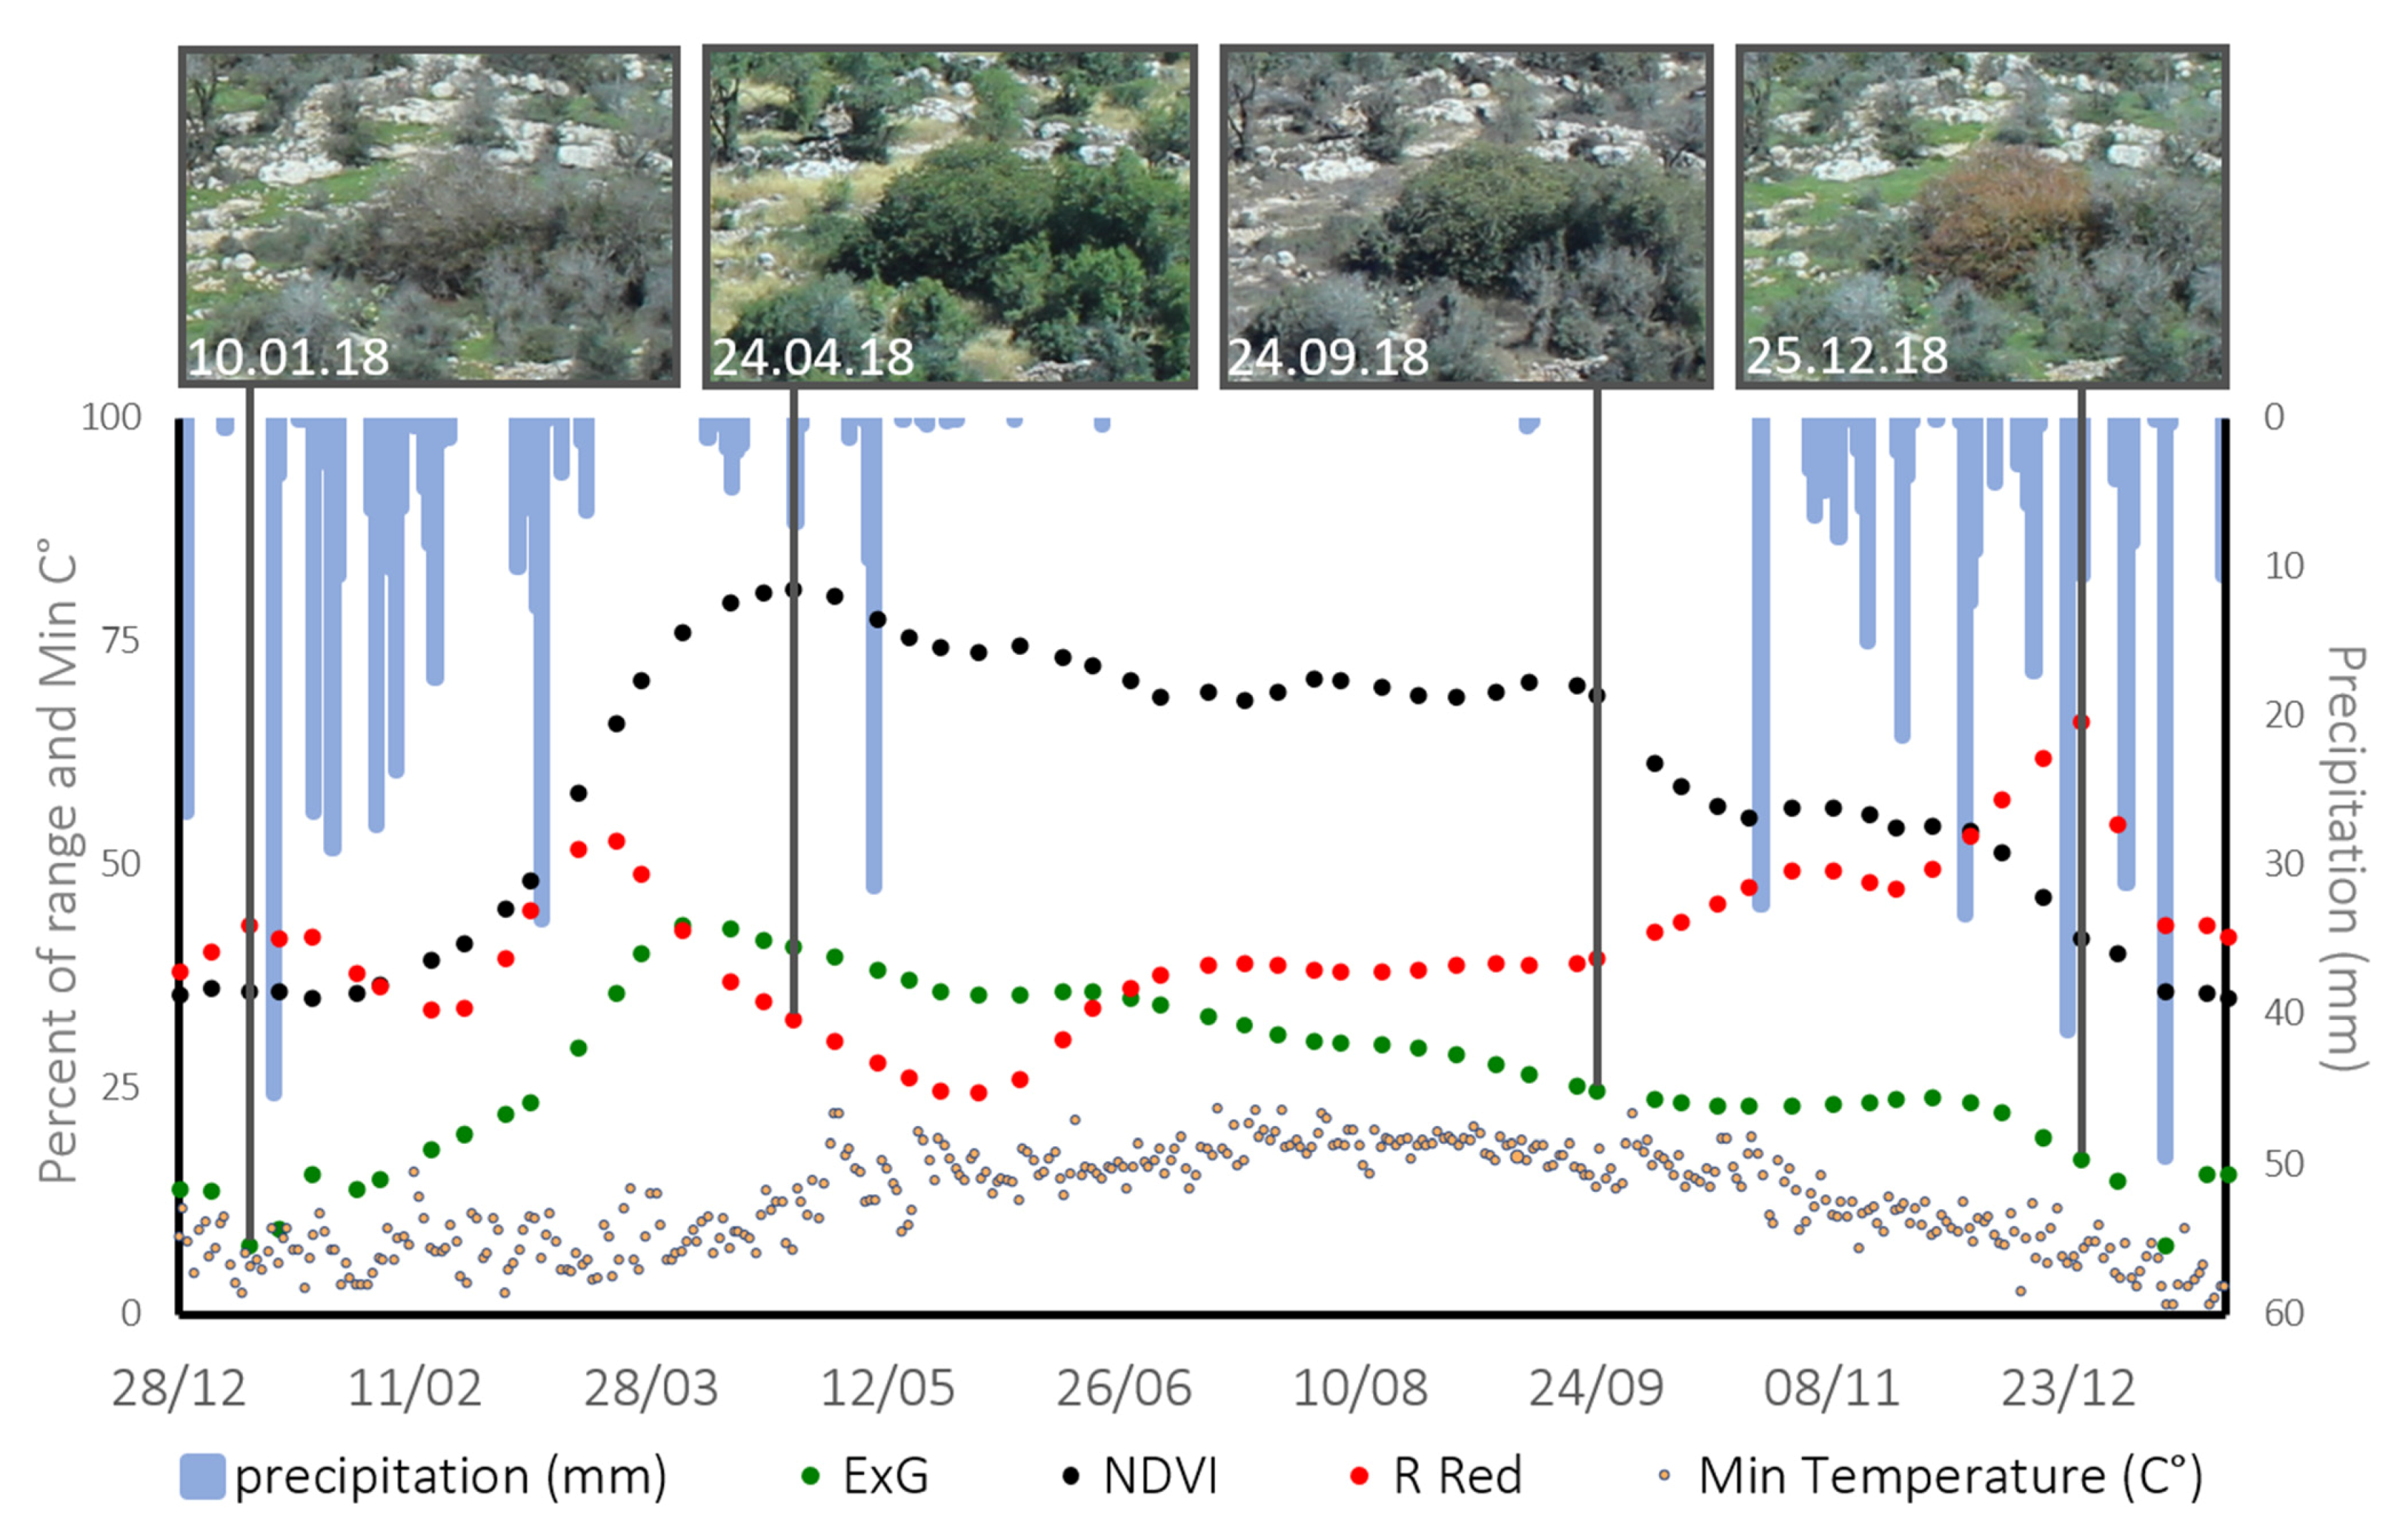
The temporal dynamics (based on the ground camera) of the herbaceous vegetation exhibited a typical annual pattern, with an early green-up at mid-fall, a maximum peak at the wet winter months followed by a fast decline from early-spring to senesce throughout the dry summer months (Figure 6). In accordance with their categorization as evergreen species in the scientific literature, Aleppo Pine, Carob, and Mastic tree display a moderate seasonal pattern with a small amplitude throughout the year 2018 in most VIs. Yet, Carob, Mastic tree, olive tree, and especially Palestine Oak show a peak at mid-late spring, at the time of flowering and blooming of the new leaves (except for Carob that blooms in autumn).
The temporal change in VIs values of Common Almond and Terebinth, represents their being winter deciduous species, with high values (i.e., vegetation greenness) in early and mid-spring, respectively, and a slow decline in greenness until the winter months. Similar to the winter deciduous patterns, the partial summer deciduous species: Prickly Burnet and Palestine Buckthorn show a moderate decline in greenness after spring, however with lower greenness in the summer and autumn months (mainly in ExG, and Relative Green). The Mediterranean Stinkbush (which is full summer deciduous) shows a fast senescence (a drop in greenness) towards the end of spring and an increase (foliage renewal) in late winter. Another summer deciduous, spiny broom, shows an early peak in NDVI and GRVI, with a slower decline in greenness compared to the Mediterranean Stinkbush, probably due to continued photosynthesis in the stems, which remain green during the summer.
As mentioned, the ground camera data served as a reference system to which we compared the data from the other sensors. Overall, in most species, ExG had the highest correlation between the mean VI value of the ground camera (after pre-processing) and the UAV (pixel size 14 cm) (Table 4). However, some species showed a higher correlation between the sensors in other indices, such as Aleppo Pine (in relative blue), Olive tree (in relative red), herbaceous vegetation (in NDVI), and Prickly Burnet (in GRVI).

3.1.2. Results from the UAV Resampled Data

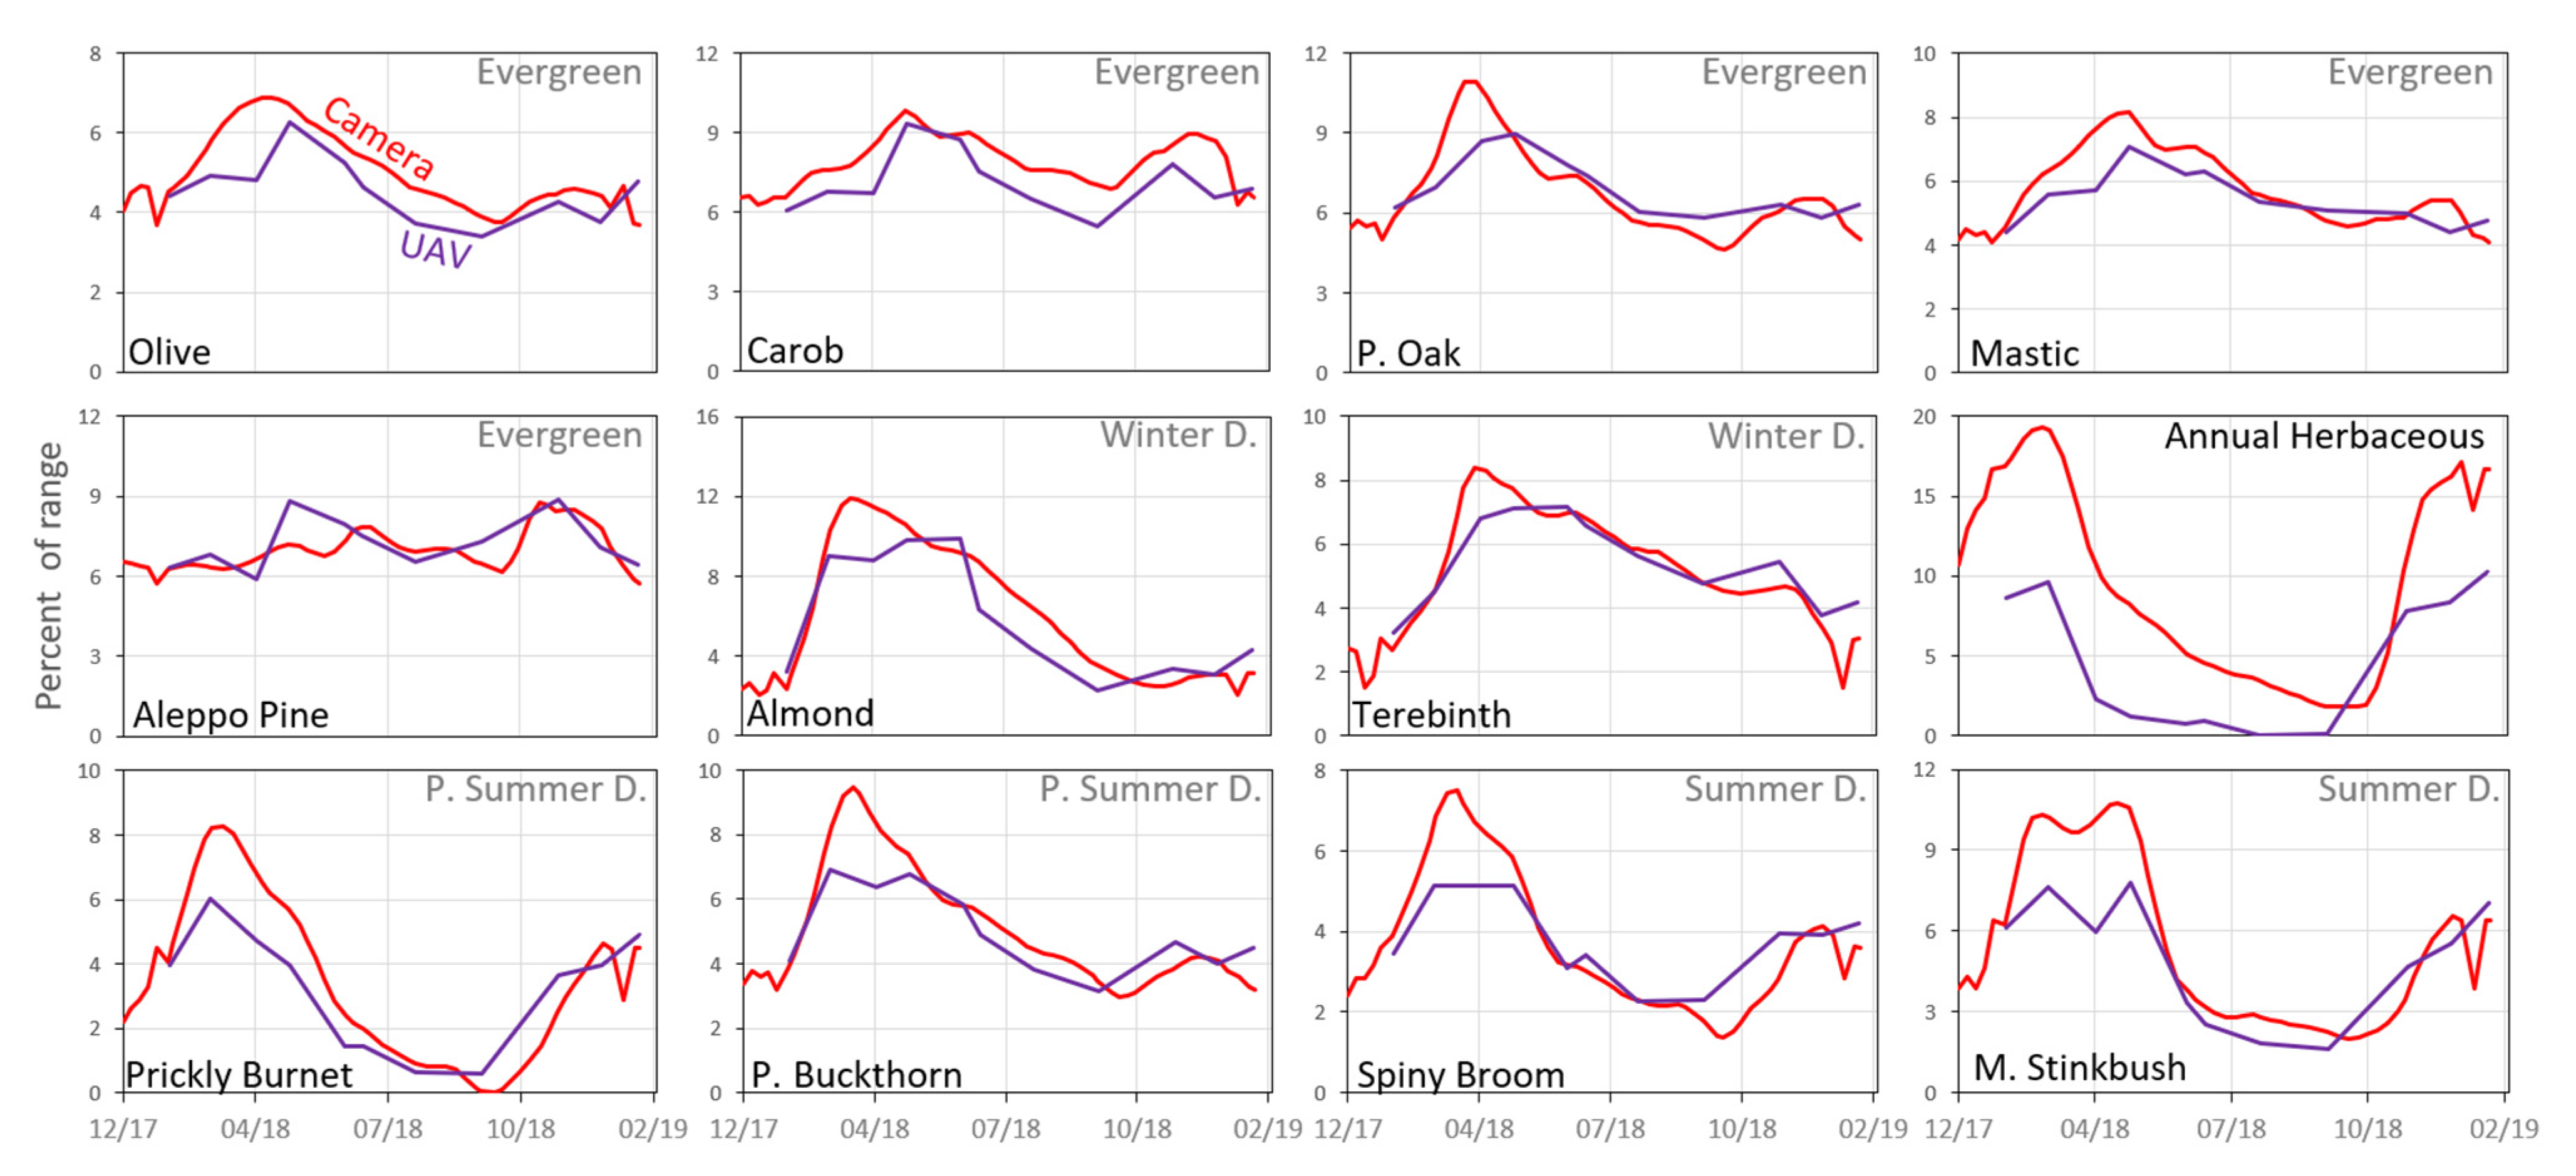
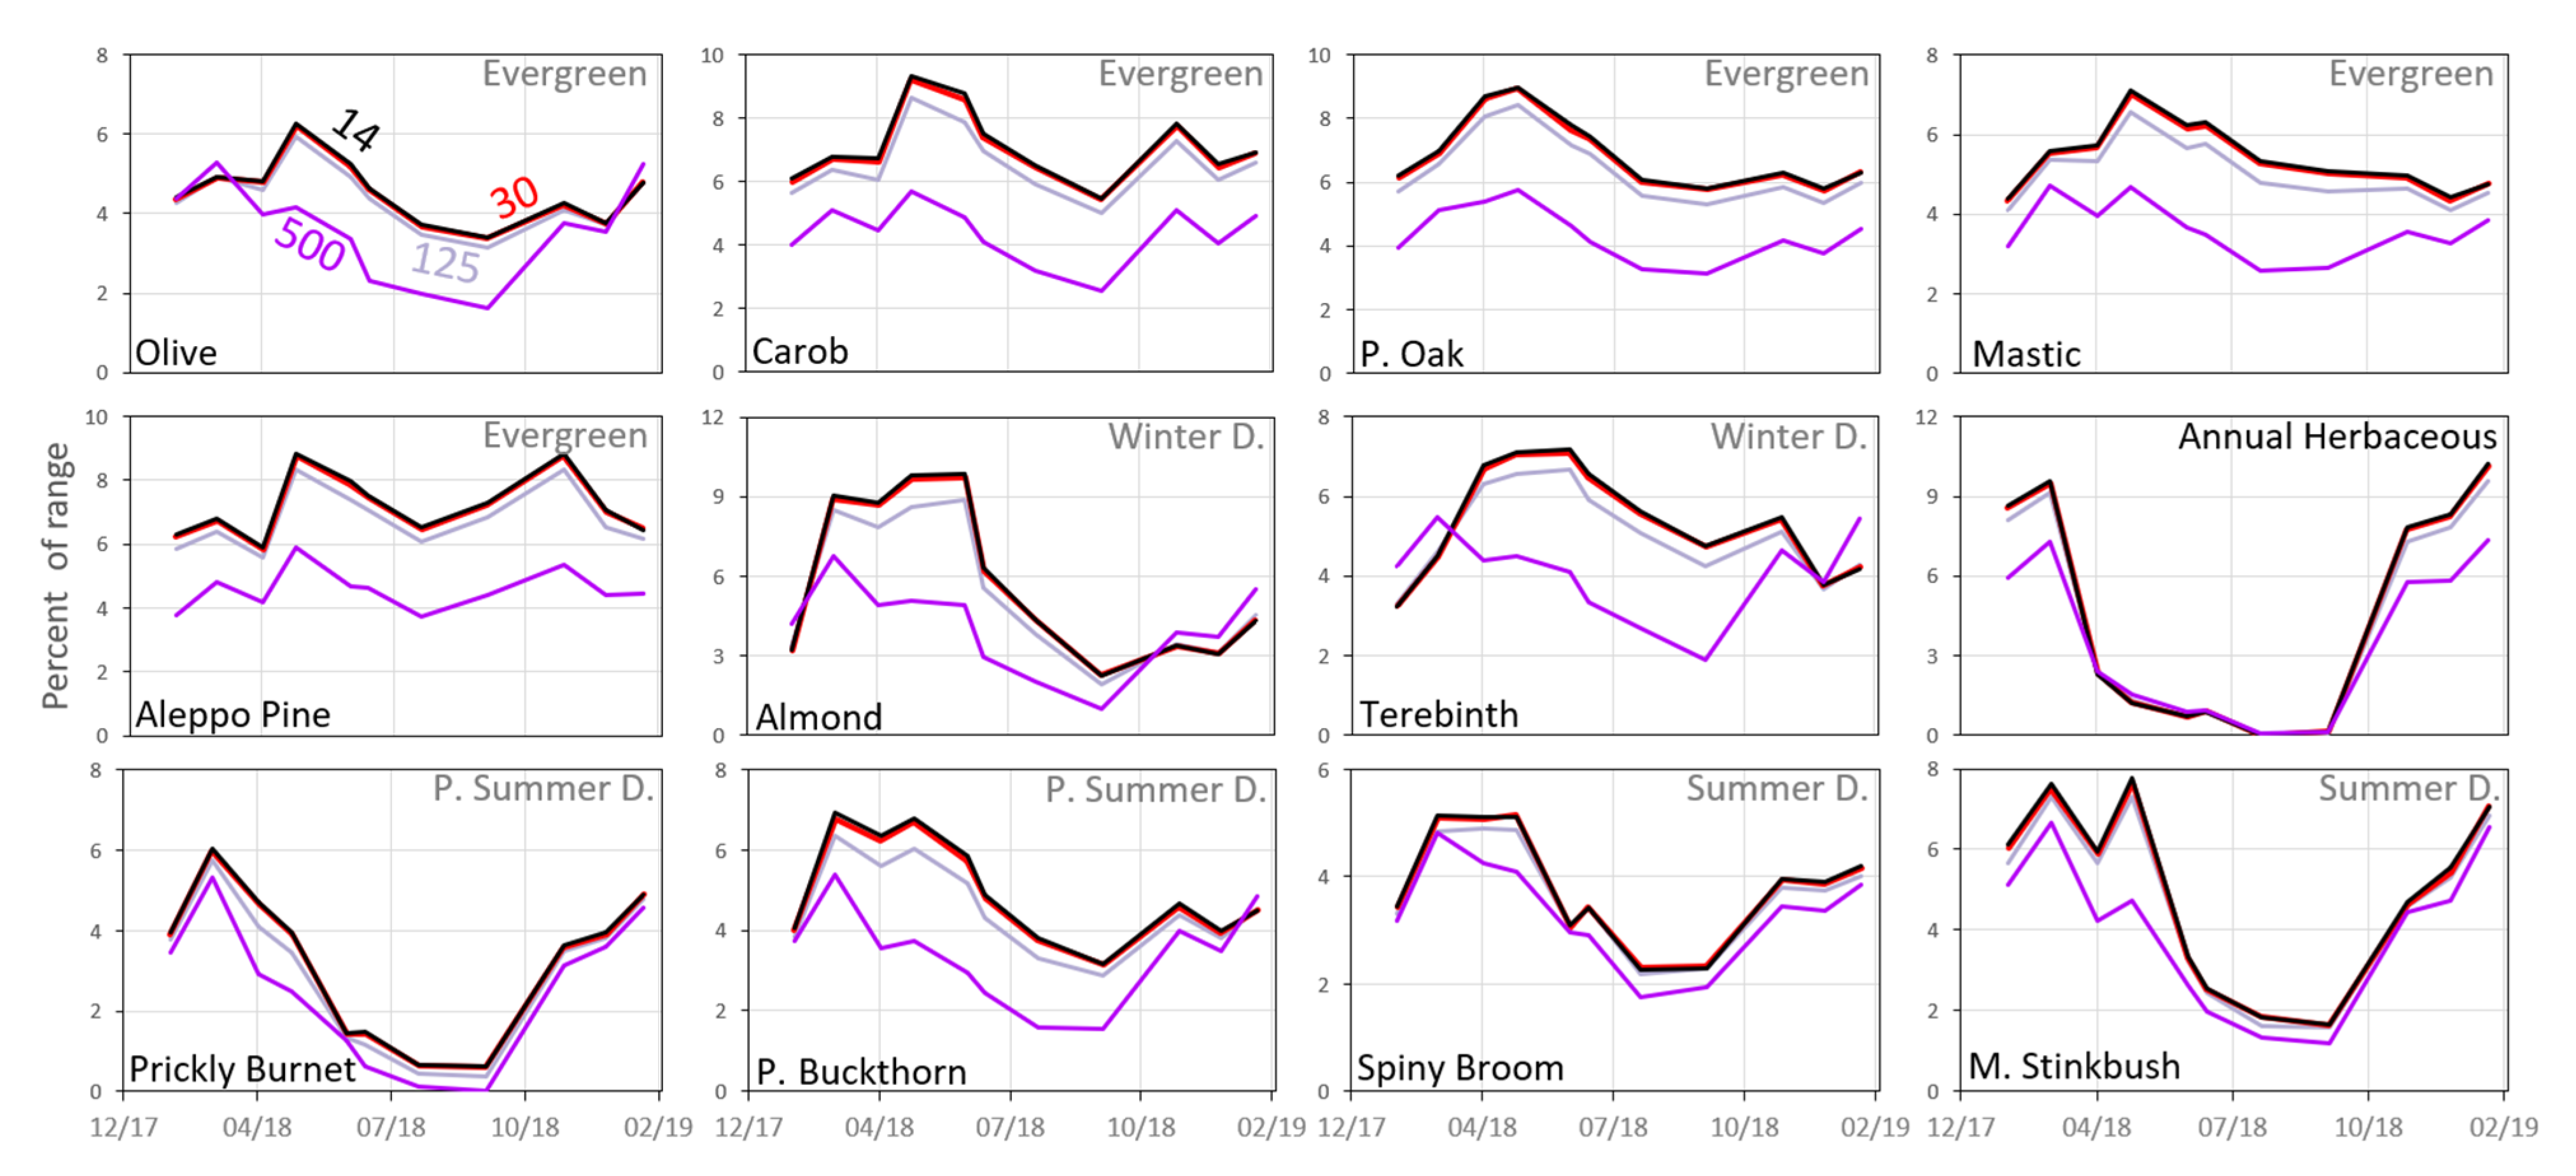
A visual comparison between the standardized ExG mean values of the UAV and the ground camera data enabled examination of the similarities and differences between the temporal patterns of the species’ VIs (Figure 7). Overall, most species presented similar dynamics between the sources; however, unlike the ground camera results, the results from the UAV for Aleppo Pine (evergreen) presented a pattern with steep changes over time (Figure 7). Moreover, the UAVs’ Palestine Oak and Olive tree (evergreen), Common Almond and Terebinth (winter deciduous), Palestine Buckthorn (partial summer deciduous) and Spiny Broom (summer deciduous), exhibited a lag between their maximum values in the UAV data compared to the ground camera data. The herbaceous vegetation was the only case where the UAV values were significantly lower than those of the ground camera (until the autumn months). Similar to the herbaceous vegetation, the summer deciduous species (full and partial) showed an earlier increase in values at the end of summer in the UAV data compared to the ground camera data, although this may be due to a gap in UAV samples (UAV acquisitions) during October 2018.
As shown in Figure 8, the effect of resampling the UAV ExG time series to coarser spatial resolutions of 30 and 125 cm was quite small and most species displayed similar temporal patterns. However, the similarity weakened as the resampled pixel size increased to 500 cm (representing VENμS resolution at nadir), as seen especially in the patterns of Olive tree and Terebinth, with earlier maximum values and start of senescing in fall and winter months, compared with the smaller spatial resolutions. For most species, stronger correlations between the ground camera ExG values and the UAV ExG values were found at the highest spatial resolution (Figure 9). This relationship was found in all the spectral indices calculated (Table 1(a)–(f) and Tables S2–S7).

3.1.3. Results from VENμS (the Impact of Spatial Resolution on Extracting Phenological Patterns from VENμS)

After examining the correlations between the VI time series obtained from VENμS with the other sensors, we found that the VIs which include the NIR band (i.e., NDVI for the camera and NDVIre for the UAV) had the strongest correlations in most species (mainly for summer deciduous species) (Table 5 and Table S8), and thus the NDVI index was selected for the visual comparison between sensors. A visual comparison of the temporal pattern of standardized mean NDVI obtained from the three different sensors emphasizes the low discrimination between species recorded by VENμS (Figure 10), and the overall summer deciduous pattern that characterized them. Similar results were found in all the time series of VIs from the satellite data (Figures S1–S6).

3.2. The Ability of Vegetation Indices to Describe the Seasonality Patterns of Vegetation

Figure 11 demonstrates the seasonal dynamics of Terebinth according to the standardized mean values of three indices. ExG and NDVI presented a similar pattern that differed mainly in the signal strength recorded at different dates, with higher values in the NIR band (NDVI) compared to the green band (ExG). In contrast, Relative Red did not produce a clear annual pattern, but unlike the two other indices (that are mainly affected by the interaction of the plant with light), it did emphasize the change in the color of the Terebinth leaves to red before leaf-fall in the winter months.
A summary of the strongest correlations obtained between the ground camera and the resampled UAV VI data (Table 6) showed that the ExG index maintained a strong correlation between the sensors even at relatively coarse resolutions (Table 6—in black numbers; Figure 9). However, for several species, other VIs resulted in stronger correlations between the temporal dynamics of the VI in the ground camera and UAV data, as found for herbaceous vegetation (NDVI), Prickly Burnet (GRVI), Olive tree (R Red), and Aleppo Pine (R Blue) (Table 6).

3.3. The Impacts of Herbaceous Vegetation on the Seasonal Patterns

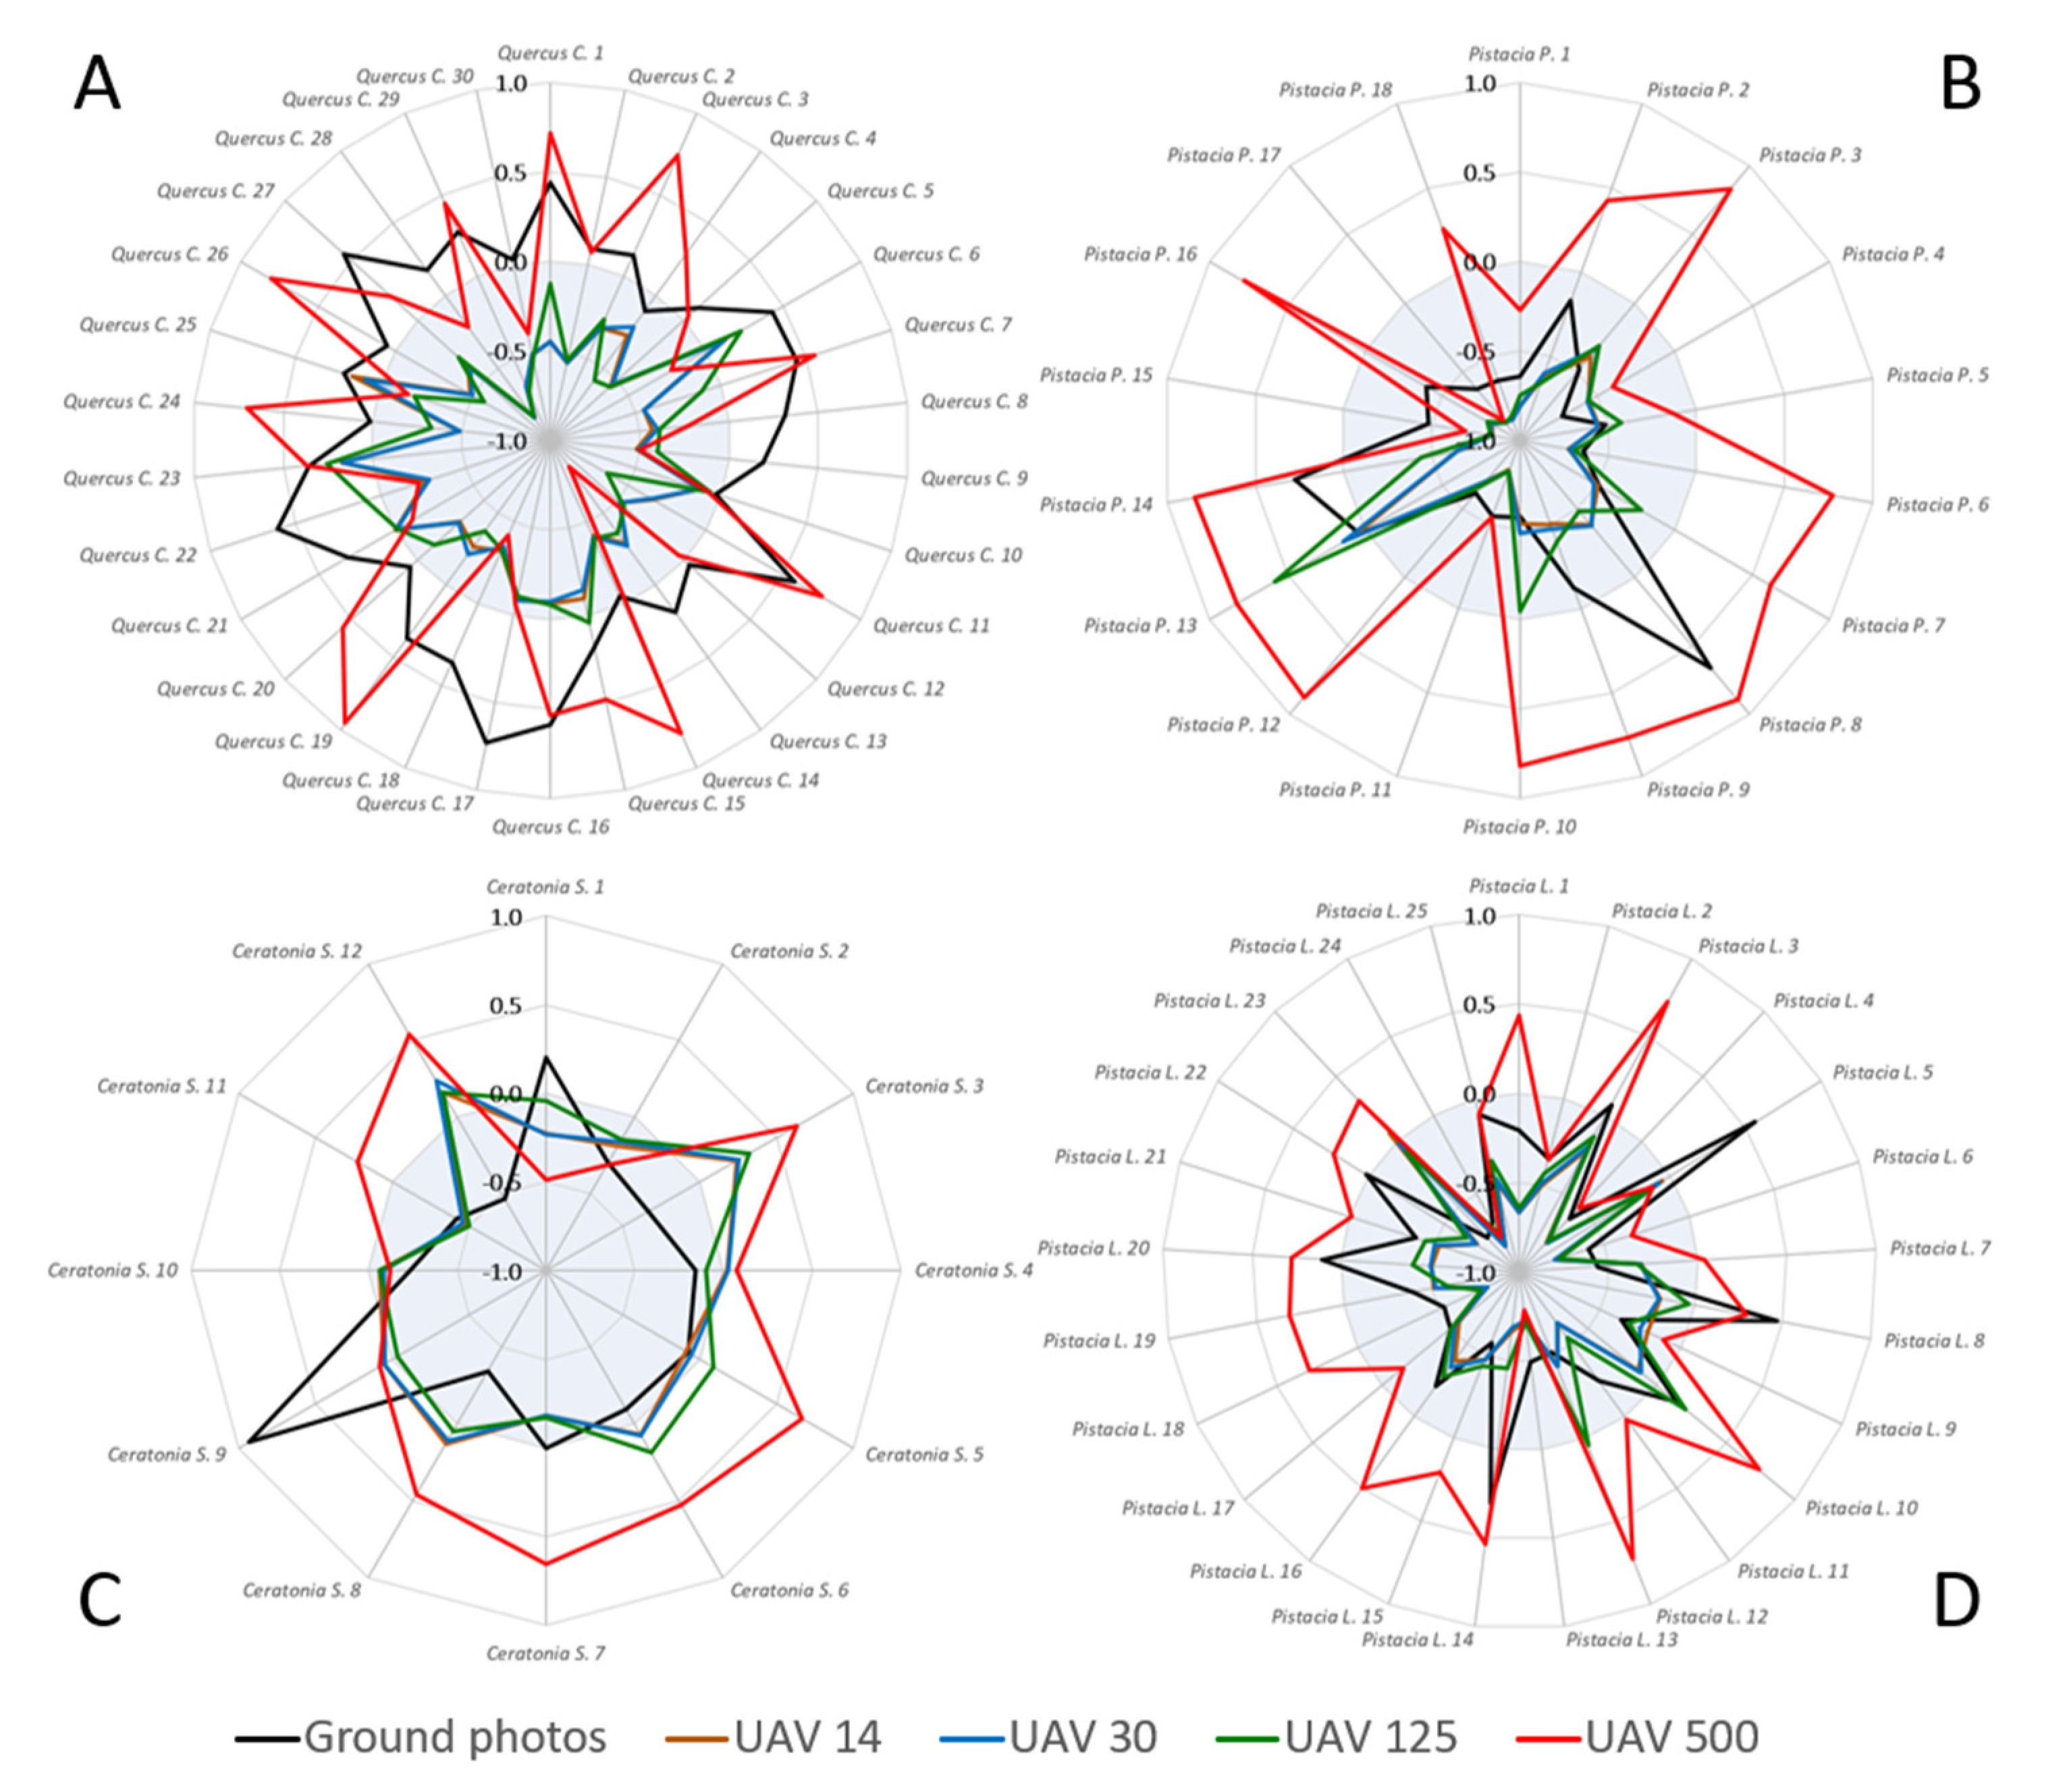
We examined the effect of herbaceous vegetation on the temporal patterns of ExG in four species: Palestine Oak (Figure 12A), Terebinth (Figure 12B), Carob (Figure 12C), and Mastic tree (Figure 12D). For each species the effect was tested on each individual plant in the sample. In the coarse spatial resolution of the resampled UAV (red line, 500 cm) simulating VENμS pixel size (although not nadir), the temporal pattern of most individual plants in all four species presented a large contribution of the herbaceous component. At finer spatial resolutions of the overhead UAV images (14–125 cm), the contribution of the herbaceous component to the values of the four species was not significant, where most plants exhibited a negative correlation (shown within the blueish background range in Figure 12). The results of the near-horizontal geometry of the ground camera (black line) differed between species, and most individuals of Terebinth, Carob, and Mastic trees did not produce a seasonal dynamic similar to that of the herbaceous vegetation. However, for some of the individual plants (and especially for the Palestine Oak, Figure 12A) the ground camera, which is characterized by high spatial resolution, presented a (positive) correlation similar to that of the UAVs’ coarsest resolution. In other words, comparing the ExG time series suggests that in some cases sensors with oblique viewing geometry might have been more exposed to herbaceous contribution than a near-nadir angle (in which the effect of herbaceous vegetation was evident at coarser spatial resolutions).

3.4. Detailed Vegetation Mapping

As mentioned, the possibility of detailed vegetation mapping from space was examined using maximum likelihood classification on the UAV ExG time series at different spatial resolutions. As expected, the averaged overall accuracy of 10 validation runs decreased with increasingly coarser pixel size (Table 7). At the highest spatial resolution (14 cm) the averaged overall accuracy for all species and all runs was 72%, with a correspondence between the classification results and the field survey reference being 70% better (Kappa = 0.7) than random results. In contrast, at the UAV’s coarsest spatial resolution (500 cm) the classification averaged overall accuracy was only 23%, with a Kappa of 0.19.
Up to a resolution of 30 cm, the herbaceous vegetation, and Prickly Burnet (partial summer deciduous) displayed an overall classification average (producer’s accuracy) of ≥90%, and Common Almond (winter deciduous), Olive tree, and Aleppo Pine (evergreen) stood out with overall classification average of ≥77%. In most cases, the difference between the 14 cm and the 30 cm resolutions was not great and did not exceed 5% in success change. Moreover, several species demonstrated improvement in classification success with the reduction in resolution, such as Palestine Oak 73% (+10%), Palestine Buckthorn 53% (+5%), and Rock Rose (Cistus salviifolius/creticus) 73% (+2%). Coarsening to a resolution of 125 cm weakened the success in identifying most species, especially Olive tree 55% (−23%), Mastic tree 50% (−22%), and Palestine Buckthorn 34% (−19%). The most accurate classification results at the 125 cm resolution were obtained for the Prickly Burnet (78%), Common Almond (67%) Rock Rose (66%), and Aleppo Pine (71%).

3.5. Spatial Factors Explaining Phenological Metrics in VENμS

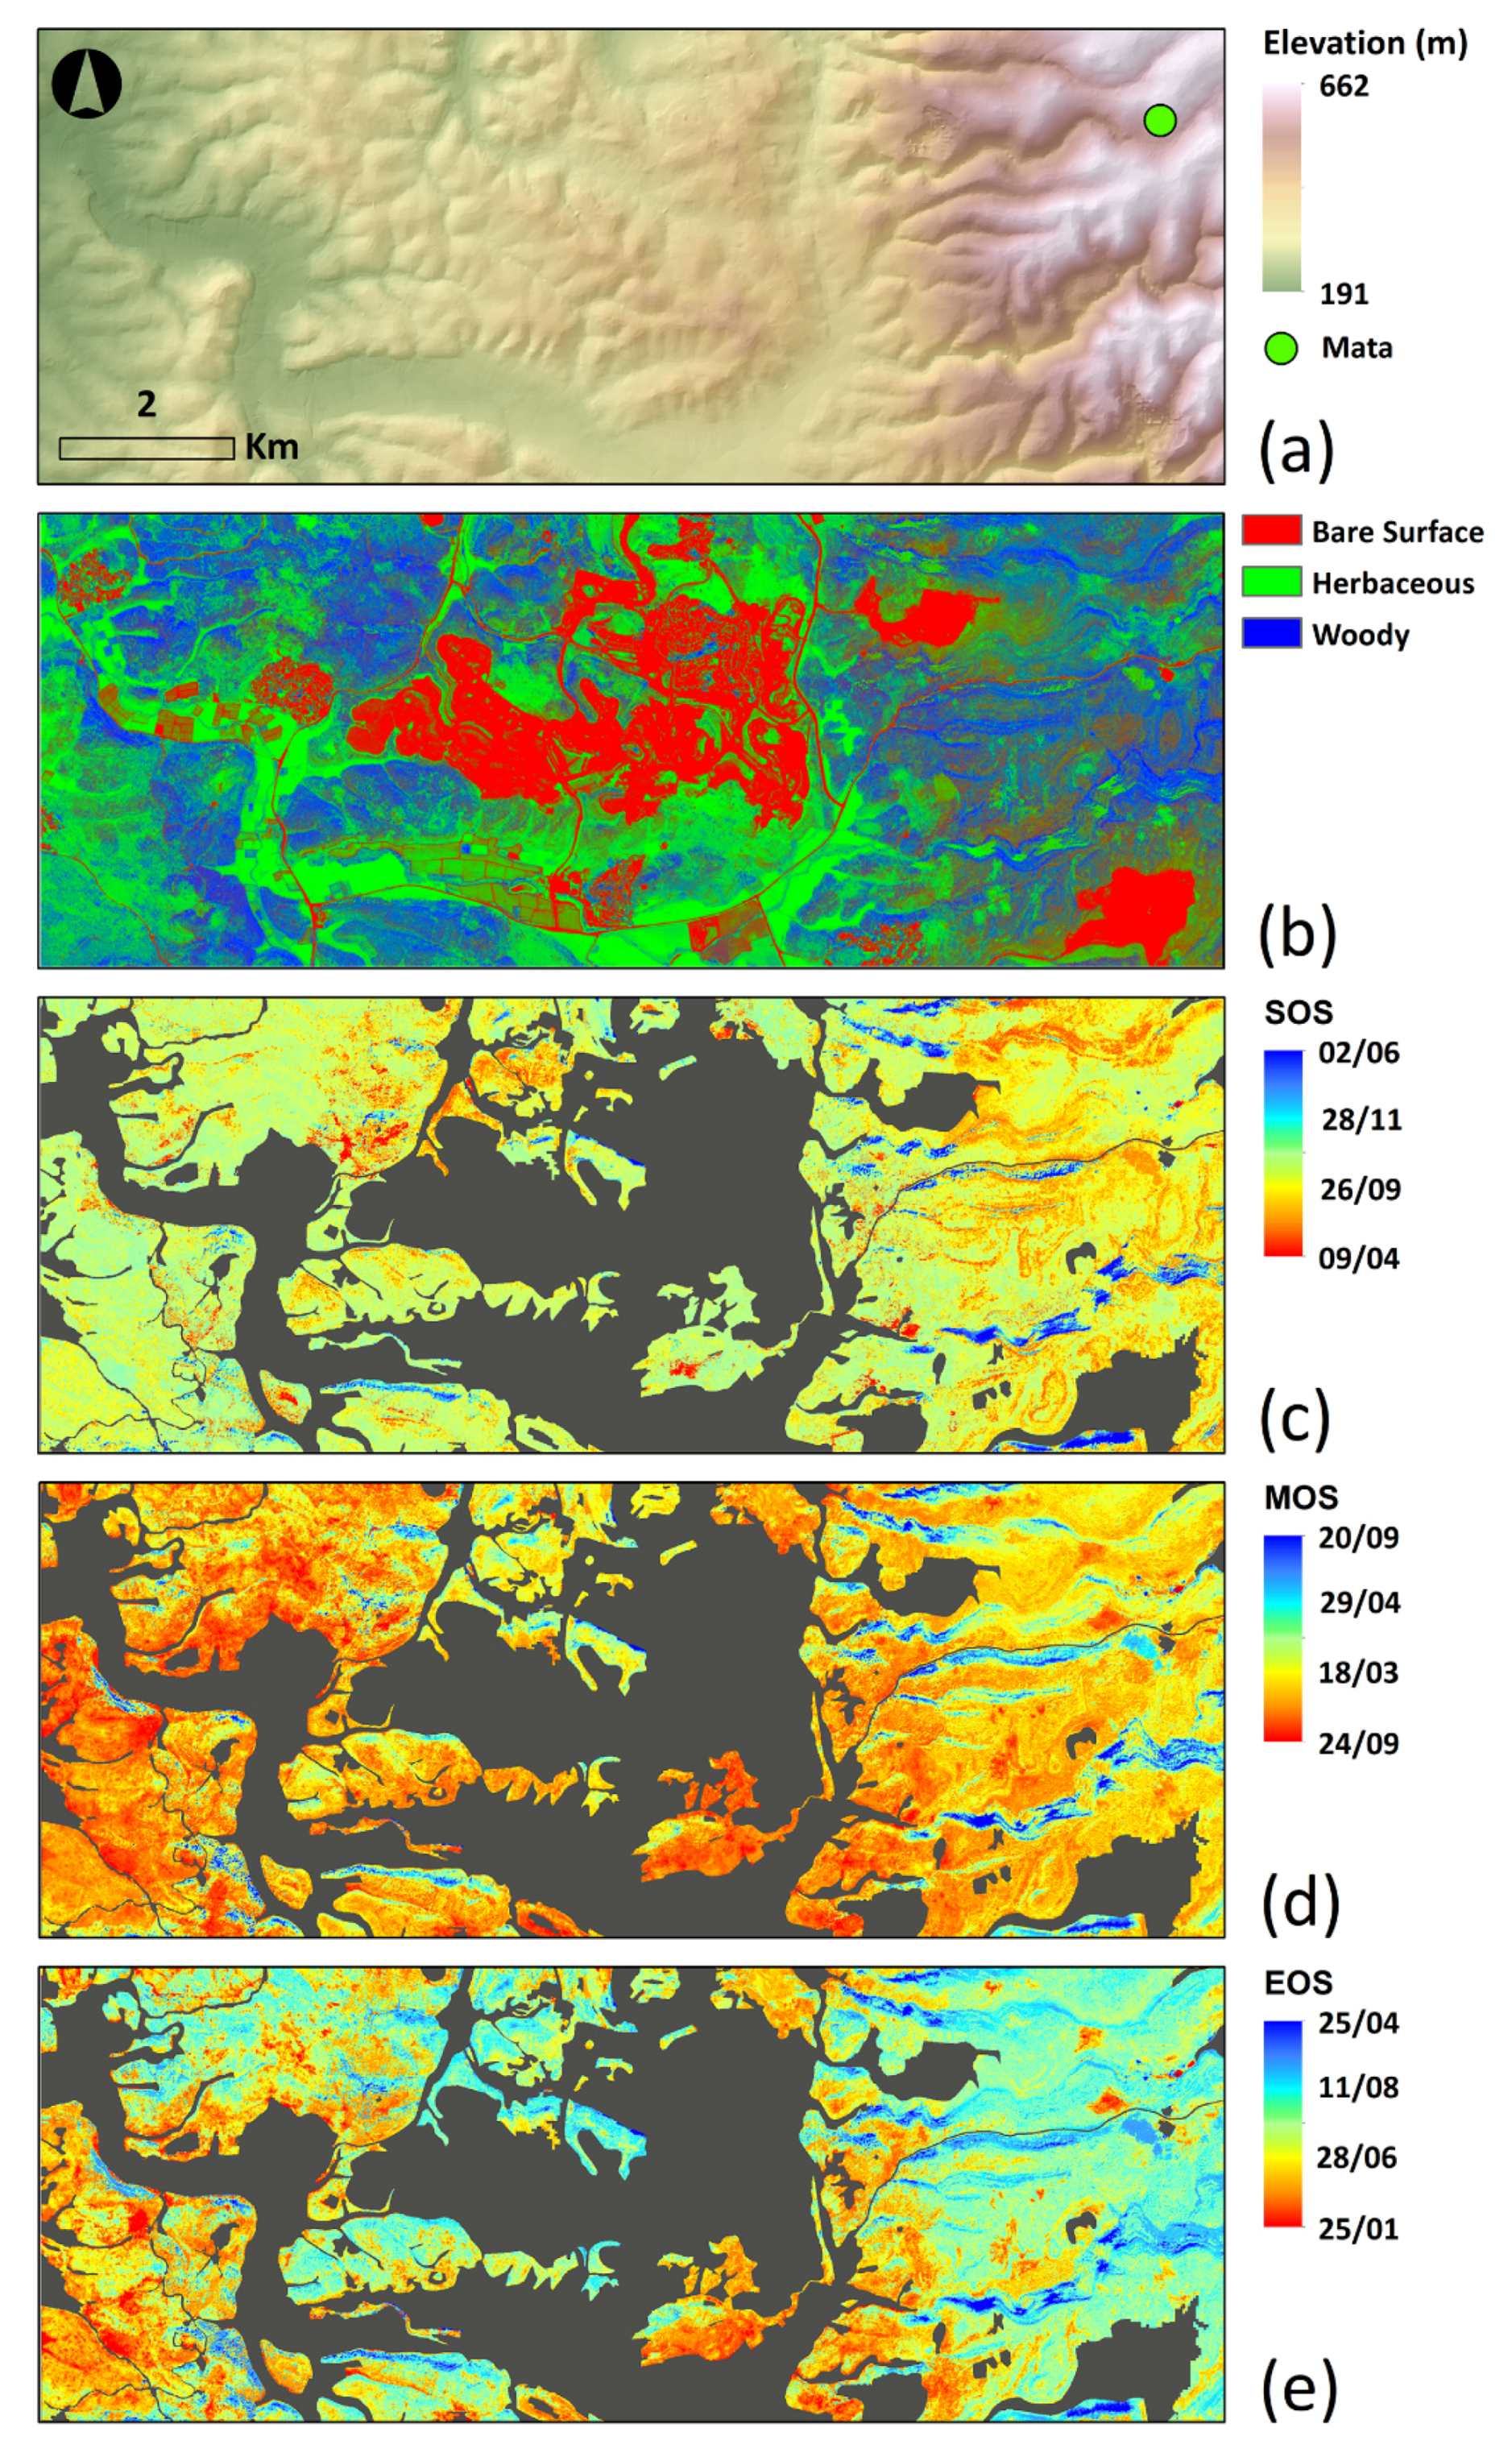
Dense woody vegetation located on the north-facing slope presented later dates in all of the phenological indices computed (SOS, MOS and EOS) from VENμS NDVI 2018–2019 time series, mostly on the more mountainous eastern area, where the Mata field site was located, visualized here as blue pixels (Figure 13c–e). In the majority of pixels, the season started (SOS) between 30 September and 31 October (greenish hue). Areas with a larger percent of herbaceous vegetation reached a maximum (MOS) between 25 January and 2 February (reddish pixels) and areas with more rocky terrain had their maximum between 24 February and 18 March (yellow-orange). The end of the season (EOS) occurred earlier (at the end of May) where the herbaceous component was more dominant (orange pixels), while in areas where the woody component was more dominant the season ended between 14 July and 11 August (cyan).
The percent cover of herbaceous vegetation was negatively correlated with both MOS and EOS (with correlation coefficients of about −0.5; Table 8). Slope and aspect were more correlated with the MOS with correlation coefficients of 0.36 and −0.36, respectively (Table 8). SOS had a weak relationship with all the variables which we examined.

4. Discussion

4.1. Overall Findings

Although identifying woody vegetation in a natural, heterogeneous and sparse woodlands at the species level using satellites is a challenging task, our results suggest that in some cases it may be possible. The VIs varied in their ability to describe plant species phenology, when most often a particular index that had a strong correlation between the sensors for a given species (species-VI combinations), did so in all four spatial resolutions. In most species, the seasonal patterns of ExG maintained high similarity (descriptively) and correlation with the ground camera data (quantitatively) after resampling to coarser resolutions of 30 and 125 cm. Moreover, ExG had high classification accuracies (pixel size ≤30 cm; 8 species with >70%), demonstrating the possibility for detailed mapping from space using pan-sharpened images from sensors with very high spatial resolution with panchromatic band of 31 cm (such as Worldview 3 and 4; [49] or such as Geoeye 1 (with a panchromatic band of 41 cm; [50]. However, space-borne images often have lower spatial resolution than provided at nadir, given that many images are acquired off-nadir. In addition, high quality atmospheric corrections are needed to improve the radiometric quality of space borne sensors, to better match imagery acquired by UAVs. Examining the classification accuracies of the condition of macadamia trees, Johansen et al. [51] have shown that for some metrics, the results from both pan-sharpened and multispectral images acquired by Worldview 3 were on par with or performed better than the results from UAV images.
Examining the seasonal patterns of VIs derived from VENμS showed a low discrimination between all species and an overall seasonal pattern of summer deciduous vegetation. The red-edge of VENμS did not improve the classification results. Consequently, it seems that in this spatially heterogeneous and sparse Mediterranean vegetation, the combination of the off-nadir acquisition angle and spatial resolution of the VENμS satellite (effectively being 7.5 m) inhibited the discrimination between plant species, and mostly reflected the seasonal pattern of the herbaceous vegetation (due to spectral mixture of signals). However, considering the challenging characteristics of the research site, it may be that using a VENμS type sensor (with a higher spatial resolution) from a nadir point of view and in more homogeneous and dense areas would allow for detailed mapping of Mediterranean species.

4.2. Compatibility between Sensors in Seasonal Patterns of Vegetation Indices

The seasonal patterns of vegetation indices of Mediterranean species were derived from three sensors and examined for their consistency across different spatial resolutions. Although monitoring the same area, the metrics derived from the sensors varied, among other factors, based on the viewing geometry (horizontal vs. vertical), the level of data used (VENµS with TOA reflection, UAV with corrected surface reflectance, and camera with data pre-processing methods), the radiometric resolution (higher sensitivity in the UAV and VENµS-16 bit), and the different bandwidths (spectral overlap in the camera, and different number and bandwidth between platforms).
Unique phenological dynamics of a specific species will increase the likelihood of identifying and separating this species from the environment and will probably lead to a greater agreement between the results of the different sensors. Therefore, it was not surprising that the herbaceous vegetation, which in this work were regarded as one “species”, showed high similarity and maintained a strong correlation across the different sensors [11,14], in most of the vegetation indices and the spatial resolutions examined for VENμS (Table 5 and Table S8) and UAV (Table 6 NDVI; Figure 9 ExG) data, and had a high classification success (UAV, pixel size ≤125 cm; >82%) (Table 7).
In contrast, due to their more developed root systems woody species are not directly affected by the rainy season as herbaceous vegetation, and their seasonal dynamics are also influenced by other factors such as temperature [18,52,53], nutrient availability [5], water retention (moisture) in deeper layers of soil [54], and the evolutionary history of the species [55]. Thus, the seasonal change in resource availability such as temperature increase in the spring months [5], when access to water in the soil is still high was expressed with the increase of greenness of all the woody species (including the evergreen) as derived from the camera (Figure 6) and the UAV (Figure 7), with most of the species presenting a later season maximum (of about two months) than the herbaceous [54].
Apart from the evolutionary history of each species and its interaction with environmental conditions, the measured time series of VIs were influenced, inter alia, from a combination of factors such as the sensor resolutions (spatial, temporal, and spectral) [24], vegetation composition [11,12], the viewing angle of the platform [14,21], the VI in use [17] and the accuracy of the ROIs used for sampling.
At 14 cm resolution the UAV ExG time series allowed for the discrimination between woody species (as in [17]), and in most species resulted with high classification accuracies (>70%) (Table 7). To a large extent, the VI patterns maintained high similarity (descriptively) through the transition to medium resolutions of 30 and 125 cm (Figure 8), including a high correlation with the ground camera data (pixel size ≤125 cm; 9 of 12 species with R ≥ 0.85; p < 0.001; Figure 9), and a little change (especially in 30 cm) in the classification accuracy results (Table 7). Woody species such as the Prickly Burnet, Common Almond, and Aleppo Pine demonstrated high classification rate of about 70% in the 125 cm resolution. However, it should be noted that values derived at a fine resolution will not necessarily correspond with the values obtained (for that same area) after resampling to a coarser resolution [56]. This discrepancy between remote sensing products at different spatial resolutions is related to phenological heterogeneity and variation in vegetation growth speed among fine pixels within a coarse pixel [24]. Thus, a measurement interpreted as a phenological change of a particular species, at a given resolution, may in fact reflect a difference in plant composition [12], and a particularly coarse resolution (relative to the endmember) will not reflect the seasonal pattern of the endmember.
Accordingly, the results of the resampled UAV VI time series, aggregated to coarser spatial resolutions, may not be consistent with the values measured by satellites. Although we used the same index (NDVI) and ROIs for both the UAV and VENμS, VENμS acquires the images over this scene at an incidence angle of 29.7° (i.e., not at nadir) and at a coarser spatial resolution (approximately 7.5 m), resulting with an overall uniform and noisier seasonal pattern for all species with slight differences in species on a given date (Figure 10). VENμS’s VIs were highly correlated with the UAV data mostly for summer woody deciduous species (especially with the herbaceous vegetation; Table 5, R > 0.910, p < 0.001 not including R Blue), reflecting the dominance of the herbaceous vegetation on the signal measured by VENμS [14], which covers a significant percentage of the study area.
Therefore, it appears that when monitoring a natural and heterogeneous Mediterranean woodland on the rich and patchy south-facing slope with VENμS’s spatial resolution, the seasonal patterns measured by the UAV at the species level are averaged with the environment signal contribution (mixed pixel), reflecting landscape-scale results [11,17] that is too coarse to discriminate between plant species. In other words, due to the decrease of spatial variation in phenology with increasing pixel size [11], both the off-nadir acquisition angle, and the relatively coarse pixel size of VENμS, did not allow for detailed mapping of woody species in the research site. However, it is likely that in more homogeneous and dense areas (like the north-facing slope) VENμS will allow for more accurate detection of Mediterranean species.

4.3. The Ability of Vegetation Indices to Describe the Seasonality of Vegetation

The comparison between the ability of different spectral vegetation indices to describe the phenology of woody Mediterranean species, at different spatial resolutions, was conducted by examining the similarity between the seasonal patterns obtained from the ground camera, and the UAV data after resampling. The limitations of using spectral values measured by sensors as a representation of the species phenology (in contrast to physical field measurements) should be noted. Although the quantification of seasonal information is more objective and convenient for comparison [17], the nature of the relationship between this spectral information and physiology-based phenology at the individual plant level is complex and unclear [8]. Moreover, the phenological variance (within species and between seasons) of Mediterranean species [27] and their interactions with local environmental factors with high spatial variability such as micro-climate and grazing [5], mean that the use of an average value per species (sensitive to extreme values), combined with a small number of individual plants in some species (Table 2), will not necessarily accurately characterize the seasonal dynamics.
Similar to Weil et al. [27], the use of visible-light-based indices, derived from near-surface platforms, allowed for a reliable description of the phenology at a detailed level [18,19], more often than NDVI that contains the NIR range [17] (Table 6). The ExG index (VIS) had a low number of outlier dates and maintained a species-specific pattern (descriptively) at different spatial resolutions (Figure 8). Comparing the ground camera and UAV data showed a high correlation between most species (Table 4, 9 of 12 species with R ≥ 0.87; p < 0.01), and in all resolutions tested except at 5 m (Figure 9, at 5 m only 5 species had R > 0.7). Nevertheless, ExG was not necessarily the best index to describe the seasonality of a given species, and better species-VI combinations were found (Table 6).
A given VI expresses a certain spectral reflectance ratio between two (or more) wavelengths, from which it was computed. Therefore, while many VIs are highly correlated, the use of multiple VIs allowed for more comprehensive monitoring of a species’ phenological properties [12,57,58]; that is, even by using indices with similar wavelengths (bands), the same ROIs and the same sensor, each index provided a slightly different result that emphasized certain features of the seasonal pattern. For example, the Mediterranean Stinkbush in the ground camera (Figure 6) showed particularly high NDVI and GRVI values in the spring, compared to lower values and a more moderate pattern in ExG and Relative Green. This may be due to the influence of the red band, which is useful for detecting seasonal patterns of leaf pigments [58].
In addition, familiarity with a species appearance (such as a unique leaf color) relative to its environment, throughout the year can justify using a combination of several indices for the same species, or matching a particular index to a specific period (phase). As presented with Terebinth (Figure 11), in contrast to the ExG and NDVI indices, relative red failed to produce a clear seasonal pattern. However, using relative red at a time when the color of the leaves has changed to red, emphasized the unique appearance of Terebinth trees in relation to the environment [16,19] better than the other indices, as seen in November-December (Figure 11).
In contrast to the high correlation obtained between the ground camera and UAV in visible light indices (Table 6), comparing these sensors to VENµS yielded better results for indices containing infrared bands (NDVI, NDVIre) (Table 5). However, as stated, descriptively the general VI patterns derived from VENµS showed low variance between species, and the improvement in correlation (i.e., R > 0.7) was obtained mainly for summer deciduous species (but also for Aleppo Pine, R = 0.9, p < 0.001) (Table 5). Therefore, it seems that the red edge range in VENµS (5 m) did not make a significant contribution to the description of the phenology of woody Mediterranean species, and therefore for detailed mapping.

4.4. The Impacts of Herbaceous Vegetation on the Seasonal Patterns

Ephemeral herbaceous vegetation may have a dominant impact on the measured spectral signal from a pixel [12]. In addition, the viewing geometry and its interaction with characteristics such as the slope of the ground in a particular area of the site, may also affect the signal measured by the sensor and emphasize different characteristics of vegetation composition of that specific area. On the one hand, a tall individual plant (or herbaceous vegetation) compared to its surrounding (and the spatial resolution of the sensor), will register in a larger number of pixels in horizontal than in vertical angle (which mainly represents its canopy). On the other hand, depending on the site’s characteristics, an object vertically recorded as having extensive ground coverage may have significantly limited representation in the horizontal angle (for example, a fixed vegetation height on a plain).
It seems that in some cases, the signal received at a horizontal angle may be more exposed to the contribution from the understory vegetation [8], which in our case mostly is the herbaceous component, than from an overhead image with a similar spatial resolution. This characteristic may explain the high resemblance between species of the UAV patterns under 5 m, with no significant additional influence of the area surrounding the canopy (Figure 8). In addition, the herbaceous vegetation showed the largest difference between patterns derived from the UAV and the ground camera (Figure 7), with low values in the UAV (14 cm). Also, some of the woody species (Palestine Oak, Terebinth, Common Almond) presented an earlier season maximum in the camera than in the UAV data, perhaps as an expression of the combination of the viewing angle and the herbaceous effect [30], whose activity predates that of Mediterranean woody species [54]. Quantitative comparison of the agreement between the values of all species from the different sensors showed a decrease in correlation with the increase in pixel size, except in the case of the herbaceous component, which showed a certain increase in correlation with the decrease in resolution (ExG, 500 cm, R = 0.94, p < 0.001) (Figure 9) [14].
Due to the significant impact of the herbaceous vegetation on the signal acquired by the off-nadir images of VENμS (Figure 10, Table 8), when tasking the acquisition of space-borne images for monitoring vegetation, images close to nadir should be preferred. Using a vertical viewing angle, may enable the mapping of woody Mediterranean species by satellites with extremely high spatial resolution, such as World View 3, World View 4, and SkySat. The possibility for detailed mapping by the mentioned satellites arose from the classification results of the resampled UAV data.

4.5. Detailed Vegetation Mapping

In contrast to other studies that have presented detailed mapping of woody Mediterranean species using hyperspectral sensors [31,32,33,59], this work emphasizes the importance of the spatial resolution of sensors and the use of their seasonality patterns for identifying species.
The supervised classification results in the 30 cm resolution presented the possibility for mapping woody species with a distinct seasonal pattern such as Prickly Burnet, Common Almond, and Rock Rose, but also evergreen species with more moderate phenology, such as Olive tree, Aleppo Pine, Palestine Oak, and Mastic tree (Table 7). It should be noted that despite the proximity and sometimes the combined growth of Palestine Oak and Mastic tree at our research site, the percentage of classification success (>72%) and the separation between the species in the 30 cm resolution were high (Table S9) probably due to a large number of trees (>200) sampled for both species.
As expected, the classification success decreased with the increase in pixel size, and at a pixel size of 125 cm or more, the percentages of success were low for most species. Despite the high classification success at 30 cm, the UAV resampled data produced relatively consistent results (without significant change in pattern, except for the Teberinth winter deciduous species), as shown in the same index (ExG) at different pixel sizes in Figure 8. By comparing the VENµS patterns to those of the resampled UAV at 5 m (ExG, Figure S6) it is evident how the values measured by satellites may produce less successful mapping results. The poorer outcomes with VENµS may result from is greater tilt angle over this scene, in comparison with the UAV. However, the developments in the satellite field and the increasing accessibility of products at very high resolutions (such as Planet’s SkySat at 50 cm), raise the possibility of species-specific mapping based on phenological changes on a global scale [60].

4.6. Spatial Factors Explaining Phenological Metrics in VENμS

We found that phenological metrics calculated from the VENμS satellite mostly reflected the seasonal pattern of the herbaceous vegetation, as demonstrated by its −0.5 correlation with MOS and EOS (Table 8). The dominant contribution of herbaceous vegetation to phenological patterns as observed from VENμS are due to its coarse spatial resolution, off-nadir viewing angle, and the natural heterogeneity of Mediterranean maquis in the study region (as also reported by [28]). Given the differences between northern and southern aspect in terms of vegetation composition (i.e., dominance of herbaceous vegetation and small shrubs on southern facing slopes, contrasted with denser maquis on northern facing slopes; [48,61]), the impact of slope and aspect on the phenological metrics (Table 8), is attributed to the gradient of herbaceous vegetation as a function of slope and aspect [62].

5. Conclusions

Although identifying woody vegetation in natural, heterogeneous, and sparse woodlands at the species level using satellites is a challenging task, our results suggest that in some cases it is possible. The results of the study presented a difference in the success of the various spectral vegetation indices in describing the phenology of woody Mediterranean plant species. Most often a particular index that had a strong correlation between the sensors for a given species, did so in all spatial resolutions. For most species, ExG was found as the index that represented the phenology in the most reliable way up to a pixel size of 125 cm, and maintained a high correlation among the sensors. For most species, the resampled UAV ExG 30 cm time series presented a classification success of more than 70%, demonstrating the possibility for detailed mapping from space. However, we can assume that due to scaling effects the measurements of satellites at a similar pixel size will impair the mapping results.
Examining the seasonal dynamics of the woody species obtained from VENμS demonstrated the crucial role of ephemeral herbaceous vegetation on the signal recorded by the sensor at an effective spatial resolution of 7.5 m. All spectral indices derived from VENμS showed a low variance between the species and an overall summer deciduous seasonal pattern that did not allow for detailed mapping at the species level. In addition, no significant contribution was found using the red-edge range to improve results. However, considering the challenging characteristics of the research site as a highly heterogeneous woodland, it may be that using a VENμS type sensor with a higher spatial resolution from a nadir point of view and in more homogeneous and dense areas would allow for detailed mapping of Mediterranean species even from spaceborne platforms.
In conclusion, since plant phenology is highly influenced by the climate system and local environmental factors, the ability to monitor various woody Mediterranean plant species according to their phenological-spectral characteristics will help identify processes and trends in the function of ecosystems, efficiently and cost-effectively. Given the preservation of the seasonal pattern (at least up to a resolution of 30 cm), and the classification results, it may be possible to use visible light indices and especially ExG, for a successful detailed mapping of some of the woody Mediterranean species, by sensors with extremely high spatial resolution such as World View 3, World View 4 (both offering pan-sharpened images of 31 cm at nadir), and GeoEye 1 (offering pan-sharpened images of 41 cm at nadir), to name a few satellites.

Supplementary Materials

The following are available online at https://www.mdpi.com/article/10.3390/rs13101958/s1, Table S1: Range of values per index measured by the ground camera (after preprocessing) for all 12 species during 57 dates (mean index value per date), Table S2: Pearson correlation coefficients of the ExG index mean values for each species per date (11 dates), between values derived from the ground camera data (after pre-processing), and those from the UAV data after resampling to different pixel sizes of 14, 30, 125, and 500 cm, Table S3: Pearson correlation coefficients of the GRVI index mean values for each species per date (11 dates), between values derived from the ground camera data (after pre-processing), and those from the UAV data after resampling to different pixel sizes of 14, 30, 125, and 500 cm, Table S4: Pearson correlation coefficients of the NDVI index mean values for each species per date (11 dates), between values derived from the ground camera data (after pre-processing), and those from the UAV data after resampling to different pixel sizes of 14, 30, 125, and 500 cm, Table S5: Pearson correlation coefficients of the relative blue index mean values for each species per date (11 dates), between values derived from the ground camera data (after pre-processing), and those from the UAV data after resampling to different pixel sizes of 14, 30, 125, and 500 cm, Table S6: Pearson correlation coefficients of the relative green index mean values for each species per date (11 dates), between values derived from the ground camera data (after pre-processing), and those from the UAV data after resampling to different pixel sizes of 14, 30, 125, and 500 cm, Table S7: Pearson correlation coefficients of the relative red index mean values for each species per date (11 dates), between values derived from the ground camera data (after pre-processing), and those from the UAV data after resampling to different pixel sizes of 14, 30, 125, and 500 cm, Table S8: Pearson correlation coefficients of six spectral indices mean value for each species per date (35 dates), between values derived from the ground camera data (after pre-processing), and those from VENμS, Table S9: Confusion matrix of the average results of ten MLC iterations, of the UAV ExG time series (11 dates) after resampling to 30 cm pixel size. After the classification smoothing and removal of small areas was conducted, Figure S1: Standardize mean NDVIre values of the 12 species based on the ground photos after preprocessing (57 dates), UAV data (11 dates, 14 and 500 cm), and VENμS acquisitions (47 dates, nominal resolution of 5.3 m at nadir, effective resolution of about 7.5 m due to the off-nadir acquisition angle of 29.7°), Figure S2: Standardize mean GRVI values of the 12 species based on the ground photos after preprocessing (57 dates), UAV data (11 dates, 14 and 500 cm), and VENμS acquisitions (47 dates, nominal resolution of 5.3 m at nadir, effective resolution of about 7.5 m due to the off-nadir acquisition angle of 29.7°), Figure S3: Standardize mean Relative Red values of the 12 species based on the ground photos after preprocessing (57 dates), UAV data (11 dates, 14 and 500 cm), and VENμS acquisitions (47 dates, nominal resolution of 5.3 m at nadir, effective resolution of about 7.5 m due to the off-nadir acquisition angle of 29.7°), Figure S4: Standardize mean Relative Green values for the 12 species based on the ground photos after preprocessing (57 dates), UAV data (11 dates, 14 and 500 cm), and VENμS acquisitions (47 dates, nominal resolution of 5.3 m at nadir, effective resolution of about 7.5 m due to the off-nadir acquisition angle of 29.7°), Figure S5: Standardize mean Relative Blue for the 12 species based on the ground photos after preprocessing (57 dates), UAV data (11 dates, 14 and 500 cm), and VENμS acquisitions (47 dates, nominal resolution of 5.3 m at nadir, effective resolution of about 7.5 m due to the off-nadir acquisition angle of 29.7°), Figure S6: Standardize mean ExG of 12 species based on the ground photos after preprocessing (57 dates), UAV data (11 dates, 14 and 500 cm), and VENμS acquisitions (47 dates, nominal resolution of 5.3 m at nadir, effective resolution of about 7.5 m due to the off-nadir acquisition angle of 29.7°). The y-axis represents the index mean value as a percent of the possible range of values. The left y-axis displays the camera (ground photos) and UAV values; the right y-axis displays the VENμS values.

Author Contributions

Conceptualization, N.L.; methodology, N.L., E.S., I.M.L.; investigation, S.E.; data curation, S.E.; writing—original draft preparation, S.E.; writing—review and editing, N.L., E.S., I.M.L.; visualization, S.E.; supervision, N.L., E.S., I.M.L.; funding acquisition, N.L., I.M.L. All authors have read and agreed to the published version of the manuscript.

Funding

This research was funded by the Israel Ministry of Science, Technology and Space.

Data Availability Statement

https://venus.bgu.ac.il/venus/ (accessed on 17 May 2021).

Acknowledgments

We would like to thank the Israel Nature and Parks Authority for supporting this research. We also thank Gilad Weil for his invaluable help with this research.

Conflicts of Interest

The authors declare no conflict of interest.

References

  1. Hernandez-Santin, L.; Rudge, M.L.; Bartolo, R.E.; Erskine, P.D. Identifying Species and Monitoring Understorey from UAS-Derived Data: A Literature Review and Future Directions. Drones 2019, 3, 9. [Google Scholar] [CrossRef] [Green Version]
  2. Lieth, H. Purposes of a phenology book. In Phenology and Seasonality Modeling; Springer: Berlin/Heidelberg, Germany, 1974; pp. 3–19. [Google Scholar]
  3. Tucker, C.J. Red and photographic infrared linear combinations for monitoring vegetation. Remote Sens. Environ. 1979, 8, 127–150. [Google Scholar] [CrossRef] [Green Version]
  4. Lechowicz, M.J. Why do temperate deciduous trees leaf out at different times? Adaptation and ecology of forest communities. Am. Nat. 1984, 124, 821–842. [Google Scholar] [CrossRef]
  5. Schwartz, M.D. Phenology: An Integrative Environmental Science; Springer: Berlin/Heidelberg, Germany, 2013. [Google Scholar]
  6. Cleland, E.E.; Chuine, I.; Menzel, A.; Mooney, H.A.; Schwartz, M.D. Shifting plant phenology in response to global change. Trends Ecol. Evol. 2007, 22, 357–365. [Google Scholar] [CrossRef] [PubMed]
  7. Gordo, O.; Sanz, J.J. Impact of climate change on plant phenology in Mediterranean ecosystems. Glob. Chang. Biol. 2010, 16, 1082–1106. [Google Scholar] [CrossRef]
  8. Zeng, L.; Wardlow, B.D.; Xiang, D.; Hu, S.; Li, D. A review of vegetation phenological metrics extraction using time-series, multispectral satellite data. Remote Sens. Environ. 2020, 237, 111511. [Google Scholar] [CrossRef]
  9. Tehrany, M.S.; Kumar, L.; Drielsma, M.J. Review of native vegetation condition assessment concepts, methods and future trends. J. Nat. Conserv. 2017, 40, 12–23. [Google Scholar] [CrossRef]
  10. Lawley, V.; Lewis, M.; Clarke, K.; Ostendorf, B. Site-based and remote sensing methods for monitoring indicators of vegetation condition: An Australian review. Ecol. Indic. 2016, 60, 1273–1283. [Google Scholar] [CrossRef] [Green Version]
  11. Klosterman, S.; Melaas, E.; Wang, J.A.; Martinez, A.; Frederick, S.; O’Keefe, J.; Orwig, D.A.; Wang, Z.; Sun, Q.; Schaaf, C. Fine-scale perspectives on landscape phenology from unmanned aerial vehicle (UAV) photography. Agric. For. Meteorol. 2018, 248, 397–407. [Google Scholar] [CrossRef]
  12. Helman, D. Land surface phenology: What do we really ‘see’ from space? Sci. Total Environ. 2018, 618, 665–673. [Google Scholar] [CrossRef]
  13. Chen, X.; Wang, D.; Chen, J.; Wang, C.; Shen, M. The mixed pixel effect in land surface phenology: A simulation study. Remote Sens. Environ. 2018, 211, 338–344. [Google Scholar] [CrossRef]
  14. Liu, Y.; Hill, M.J.; Zhang, X.; Wang, Z.; Richardson, A.D.; Hufkens, K.; Filippa, G.; Baldocchi, D.D.; Ma, S.; Verfaillie, J. Using data from Landsat, MODIS, VIIRS and PhenoCams to monitor the phenology of California oak/grass savanna and open grassland across spatial scales. Agric. For. Meteorol. 2017, 237, 311–325. [Google Scholar] [CrossRef]
  15. Crimmins, M.A.; Crimmins, T.M. Monitoring plant phenology using digital repeat photography. Environ. Manag. 2008, 41, 949–958. [Google Scholar] [CrossRef] [PubMed]
  16. Klosterman, S.; Richardson, A.D. Observing spring and fall phenology in a deciduous forest with aerial drone imagery. Sensors 2017, 17, 2852. [Google Scholar] [CrossRef] [PubMed] [Green Version]
  17. Berra, E.F.; Gaulton, R.; Barr, S. Assessing spring phenology of a temperate woodland: A multiscale comparison of ground, unmanned aerial vehicle and Landsat satellite observations. Remote Sens. Environ. 2019, 223, 229–242. [Google Scholar] [CrossRef]
  18. Ide, R.; Oguma, H. Use of digital cameras for phenological observations. Ecol. Inform. 2010, 5, 339–347. [Google Scholar] [CrossRef]
  19. Peltoniemi, M.; Aurela, M.; Böttcher, K.; Kolari, P.; Loehr, J.; Hokkanen, T.; Karhu, J.; Linkosalmi, M.; Tanis, C.M.; Metsämäki, S. Networked web-cameras monitor congruent seasonal development of birches with phenological field observations. Agric. For. Meteorol. 2018, 249, 335–347. [Google Scholar] [CrossRef] [Green Version]
  20. Brown, T.B.; Hultine, K.R.; Steltzer, H.; Denny, E.G.; Denslow, M.W.; Granados, J.; Henderson, S.; Moore, D.; Nagai, S.; SanClements, M. Using phenocams to monitor our changing Earth: Toward a global phenocam network. Front. Ecol. Environ. 2016, 14, 84–93. [Google Scholar] [CrossRef] [Green Version]
  21. Keenan, T.F.; Darby, B.; Felts, E.; Sonnentag, O.; Friedl, M.A.; Hufkens, K.; O’Keefe, J.; Klosterman, S.; Munger, J.W.; Toomey, M. Tracking forest phenology and seasonal physiology using digital repeat photography: A critical assessment. Ecol. Appl. 2014, 24, 1478–1489. [Google Scholar] [CrossRef] [Green Version]
  22. Richardson, A.D.; Hufkens, K.; Milliman, T.; Frolking, S. Intercomparison of phenological transition dates derived from the PhenoCam Dataset V1. 0 and MODIS satellite remote sensing. Sci. Rep. 2018, 8, 5679. [Google Scholar] [CrossRef] [Green Version]
  23. Brown, L.A.; Dash, J.; Ogutu, B.O.; Richardson, A.D. On the relationship between continuous measures of canopy greenness derived using near-surface remote sensing and satellite-derived vegetation products. Agric. For. Meteorol. 2017, 247, 280–292. [Google Scholar] [CrossRef] [Green Version]
  24. Liu, L.; Cao, R.; Shen, M.; Chen, J.; Wang, J.; Zhang, X. How Does Scale Effect Influence Spring Vegetation Phenology Estimated from Satellite-Derived Vegetation Indexes? Remote Sens. 2019, 11, 2137. [Google Scholar] [CrossRef] [Green Version]
  25. Nijland, W.; Bolton, D.K.; Coops, N.C.; Stenhouse, G. Imaging phenology; scaling from camera plots to landscapes. Remote Sens. Environ. 2016, 177, 13–20. [Google Scholar] [CrossRef]
  26. Shmida, A. Mediterranean vegetation in California and Israel: Similarities and differences. Isr. J. Bot. 1981, 30, 105–123. [Google Scholar]
  27. Weil, G.; Lensky, I.M.; Levin, N. Using ground observations of a digital camera in the VIS-NIR range for quantifying the phenology of Mediterranean woody species. Int. J. Appl. Earth Obs. Geoinf. 2017, 62, 88–101. [Google Scholar] [CrossRef]
  28. Shoshany, M.; Svoray, T. Multidate adaptive unmixing and its application to analysis of ecosystem transitions along a climatic gradient. Remote Sens. Environ. 2002, 82, 5–20. [Google Scholar] [CrossRef]
  29. Manevski, K.; Manakos, I.; Petropoulos, G.P.; Kalaitzidis, C. Discrimination of common Mediterranean plant species using field spectroradiometry. Int. J. Appl. Earth Obs. Geoinf. 2011, 13, 922–933. [Google Scholar] [CrossRef]
  30. Helman, D.; Lensky, I.M.; Tessler, N.; Osem, Y. A phenology-based method for monitoring woody and herbaceous vegetation in Mediterranean forests from NDVI time series. Remote Sens. 2015, 7, 12314–12335. [Google Scholar] [CrossRef] [Green Version]
  31. Rud, R.; Shoshany, M.; Alchanatis, V.; Cohen, Y. Application of spectral features’ ratios for improving classification in partially calibrated hyperspectral imagery: A case study of separating Mediterranean vegetation species. J. Real-Time Image Process. 2006, 1, 143–152. [Google Scholar] [CrossRef]
  32. Dadon, A.; Mandelmilch, M.; Ben-Dor, E.; Sheffer, E. Sequential PCA-based Classification of Mediterranean Forest Plants using Airborne Hyperspectral Remote Sensing. Remote Sens. 2019, 11, 2800. [Google Scholar] [CrossRef] [Green Version]
  33. Paz-Kagan, T.; Silver, M.; Panov, N.; Karnieli, A. Multispectral approach for identifying invasive plant species based on flowering phenology characteristics. Remote Sens. 2019, 11, 953. [Google Scholar] [CrossRef] [Green Version]
  34. Weil, G.; Lensky, I.M.; Resheff, Y.S.; Levin, N. Optimizing the timing of unmanned aerial vehicle image acquisition for applied mapping of woody vegetation species using feature selection. Remote Sens. 2017, 9, 1130. [Google Scholar] [CrossRef] [Green Version]
  35. Coops, N.C.; Hilker, T.; Bater, C.W.; Wulder, M.A.; Nielsen, S.E.; McDermid, G.; Stenhouse, G. Linking ground-based to satellite-derived phenological metrics in support of habitat assessment. Remote Sens. Lett. 2012, 3, 191–200. [Google Scholar] [CrossRef]
  36. Zhang, X.; Friedl, M.A.; Schaaf, C.B. Global vegetation phenology from Moderate Resolution Imaging Spectroradiometer (MODIS): Evaluation of global patterns and comparison with in situ measurements. J. Geophys. Res. Biogeosci. 2006, 111, G04017. [Google Scholar] [CrossRef]
  37. Wang, Q.; Blackburn, G.A.; Onojeghuo, A.O.; Dash, J.; Zhou, L.; Zhang, Y.; Atkinson, P.M. Fusion of Landsat 8 OLI and Sentinel-2 MSI data. IEEE Trans. Geosci. Remote Sens. 2017, 55, 3885–3899. [Google Scholar] [CrossRef] [Green Version]
  38. Müllerová, J.; Brůna, J.; Dvořák, P.; Bartalo, T.; Vítková, M. Does the data resolution/origin matter? Satellite, airborne and uav imagery to tackle plant invasions. Int. Arch. Photogramm. Remote Sens. Spat. Inf. Sci. 2016, XLI-B7, 903–908. [Google Scholar] [CrossRef]
  39. Dedieu, G.; Hagolle, O.; Karnieli, A.; Ferrier, P.; Crébassol, P.; Gamet, P.; Desjardins, C.; Yakov, M.; Cohen, M.; Hayun, E. Venμs: Performances and first results after 11 months in orbit. In Proceedings of the IGARSS 2018 IEEE International Geoscience and Remote Sensing Symposium, Valencia, Spain, 22–27 July 2018; IEEE: New York, NY, USA, 2018; pp. 7756–7759. [Google Scholar]
  40. Cleveland, W.S. Robust locally weighted regression and smoothing scatterplots. J. Am. Stat. Assoc. 1979, 74, 829–836. [Google Scholar] [CrossRef]
  41. Richardson, A.D.; Jenkins, J.P.; Braswell, B.H.; Hollinger, D.Y.; Ollinger, S.V.; Smith, M.-L. Use of digital webcam images to track spring green-up in a deciduous broadleaf forest. Oecologia 2007, 152, 323–334. [Google Scholar] [CrossRef]
  42. Motohka, T.; Nasahara, K.N.; Oguma, H.; Tsuchida, S. Applicability of green-red vegetation index for remote sensing of vegetation phenology. Remote Sens. 2010, 2, 2369–2387. [Google Scholar] [CrossRef] [Green Version]
  43. Woebbecke, D.M.; Meyer, G.E.; Von Bargen, K.; Mortensen, D.A. Color indices for weed identification under various soil, residue, and lighting conditions. Trans. ASAE 1995, 38, 259–269. [Google Scholar] [CrossRef]
  44. Gitelson, A.; Merzlyak, M.N. Spectral reflectance changes associated with autumn senescence of Aesculus hippocastanum L. and Acer platanoides L. leaves. Spectral features and relation to chlorophyll estimation. J. Plant Physiol. 1994, 143, 286–292. [Google Scholar] [CrossRef]
  45. Gitelson, A.A.; Merzlyak, M.N. Remote estimation of chlorophyll content in higher plant leaves. Int. J. Remote Sens. 1997, 18, 2691–2697. [Google Scholar] [CrossRef]
  46. RedEdge-MX. Available online: https://micasense.com/rededge-mx/ (accessed on 9 December 2020).
  47. Levin, N.; Heimowitz, A. Mapping spatial and temporal patterns of Mediterranean wildfires from MODIS. Remote Sens. Environ. 2012, 126, 12–26. [Google Scholar] [CrossRef]
  48. Nevo, E.; Fragman, O.; Dafni, A.; Beiles, A. Biodiversity and interslope divergence of vascular plants caused by microclimatic differences at “Evolution Canyon”, Lower Nahal Oren, Mount Carmel, Israel. Isr. J. Plant Sci. 1999, 47, 49–59. [Google Scholar] [CrossRef]
  49. Kwan, C.; Budavari, B.; Bovik, A.C.; Marchisio, G. Blind quality assessment of fused worldview-3 images by using the combinations of pansharpening and hypersharpening paradigms. IEEE Geosci. Remote Sens. Lett. 2017, 14, 1835–1839. [Google Scholar] [CrossRef]
  50. Tu, T.-M.; Hsu, C.-L.; Tu, P.-Y.; Lee, C.-H. An adjustable pan-sharpening approach for IKONOS/QuickBird/GeoEye-1/WorldView-2 imagery. IEEE J. Sel. Top. Appl. Earth Obs. Remote Sens. 2012, 5, 125–134. [Google Scholar] [CrossRef]
  51. Johansen, K.; Duan, Q.; Tu, Y.-H.; Searle, C.; Wu, D.; Phinn, S.; Robson, A.; McCabe, M.F. Mapping the condition of macadamia tree crops using multi-spectral UAV and WorldView-3 imagery. ISPRS J. Photogramm. Remote Sens. 2020, 165, 28–40. [Google Scholar] [CrossRef]
  52. Fisher, J.I.; Mustard, J.F.; Vadeboncoeur, M.A. Green leaf phenology at Landsat resolution: Scaling from the field to the satellite. Remote Sens. Environ. 2006, 100, 265–279. [Google Scholar] [CrossRef]
  53. Peñuelas, J.; Filella, I. Responses to a warming world. Science 2001, 294, 793–795. [Google Scholar] [CrossRef]
  54. Maseyk, K.S.; Lin, T.; Rotenberg, E.; Grünzweig, J.M.; Schwartz, A.; Yakir, D. Physiology–phenology interactions in a productive semi-arid pine forest. New Phytol. 2008, 178, 603–616. [Google Scholar] [CrossRef]
  55. Filippa, G.; Cremonese, E.; Migliavacca, M.; Galvagno, M.; Sonnentag, O.; Humphreys, E.; Hufkens, K.; Ryu, Y.; Verfaillie, J.; di Cella, U.M. NDVI derived from near-infrared-enabled digital cameras: Applicability across different plant functional types. Agric. For. Meteorol. 2018, 249, 275–285. [Google Scholar] [CrossRef]
  56. Zhang, X.; Wang, J.; Gao, F.; Liu, Y.; Schaaf, C.; Friedl, M.; Yu, Y.; Jayavelu, S.; Gray, J.; Liu, L. Exploration of scaling effects on coarse resolution land surface phenology. Remote Sens. Environ. 2017, 190, 318–330. [Google Scholar] [CrossRef] [Green Version]
  57. Huete, A.R. Vegetation indices, remote sensing and forest monitoring. Geogr. Compass 2012, 6, 513–532. [Google Scholar] [CrossRef]
  58. Nagai, S.; Saitoh, T.M.; Kobayashi, H.; Ishihara, M.; Suzuki, R.; Motohka, T.; Nasahara, K.N.; Muraoka, H. In situ examination of the relationship between various vegetation indices and canopy phenology in an evergreen coniferous forest, Japan. Int. J. Remote Sens. 2012, 33, 6202–6214. [Google Scholar] [CrossRef]
  59. Paz-Kagan, T.; Caras, T.; Herrmann, I.; Shachak, M.; Karnieli, A. Multiscale mapping of species diversity under changed land use using imaging spectroscopy. Ecol. Appl. 2017, 27, 1466–1484. [Google Scholar] [CrossRef]
  60. Tamiminia, H.; Salehi, B.; Mahdianpari, M.; Quackenbush, L.; Adeli, S.; Brisco, B. Google Earth Engine for geo-big data applications: A meta-analysis and systematic review. ISPRS J. Photogramm. Remote Sens. 2020, 164, 152–170. [Google Scholar] [CrossRef]
  61. Shoshany, M. Satellite remote sensing of natural Mediterranean vegetation: A review within an ecological context. Prog. Phys. Geogr. 2000, 24, 153–178. [Google Scholar] [CrossRef]
  62. Carmel, Y.; Kadmon, R. Effects of grazing and topography on long-term vegetation changes in a Mediterranean ecosystem in Israel. Plant Ecol. 1999, 145, 243–254. [Google Scholar] [CrossRef]
Figure 1. Mata research site overview map; red lines represent the field of view of the ground camera, with a black dot indicating the location of the camera; the green polygon represents the extent of the UAV mosaics; and the yellow polygon represents part of VENμS S01 tile (appearing in the inset map) which overlaps the research area.
Remotesensing 13 01958 g001
Figure 2. The spectral bands of the three sensors: UAV (16 bit), VENμS (16 bit), and ground photos (8 bit).
Remotesensing 13 01958 g002
Figure 3. Data availability of ground photos, UAV and VENμS acquisitions in the research area, between December 2017 and January 2019.
Remotesensing 13 01958 g003
Figure 4. Identification of four different woody Mediterranean species at the individual plant level. Palestine oak in yellow, Terebinth in red, Mastic in green, and Carob in blue, over true color ground photo (a) and the 14 cm true color UAV mosaic (b), which were both acquired on 6 August 2018 at Mata. The two photos on the bottom right present an individual oak tree as acquired by the ground camera (c) and the UAV (d).
Remotesensing 13 01958 g004
Figure 5. Data availability of VENμS for the TimeSat pixel-based analysis of seasonality. The first (NDVI) date was produced as an average of two neighbor clear dates (11 September 2018 and 29 October 2018).
Remotesensing 13 01958 g005
Figure 6. Mean values of the six vegetation indices for 12 species based on the ground photos after preprocessing. The y-axis represents the standardized mean value of the vegetation index as a percent of the range of its values (12 species in 57 dates, i.e., one year, per index, min and max values in Table S1), to ease comparison across the species and between the indices.
Remotesensing 13 01958 g006
Figure 7. Standardized mean ExG values for the 12 species based on the ground photos after preprocessing (57 dates), and UAV data (11 dates, 14 cm resolution). The y-axis represents the index mean value as a percent of the range of the possible values for each sensor.
Remotesensing 13 01958 g007
Figure 8. Standardized mean ExG values for the 12 species based on the UAV data (11 dates) after resampling to spatial resolutions of 14, 30, 125, and 500 cm. The y-axis represents the index mean value as a percent of the range of the possible values for each sensor.
Remotesensing 13 01958 g008
Figure 9. Scatter plots showing the correlations between the ExG mean values from the ground photos time series (x-axis) and from the UAV (11 dates), at pixel sizes (cm) of 14 (red), 30 (black), 125 (green), and 500 (blue). The colors of the linear trend lines correspond to the pixel sizes colors in the diagram. The asterisks represent the statistical significance of the correlations: *** p < 0.01, ** p < 0.01, * p < 0.05.
Remotesensing 13 01958 g009
Figure 10. Standardized mean NDVI values of the 12 species based on the ground photos after preprocessing (57 dates), UAV data (11 dates, 14 and 500 cm), and VENμS acquisitions (47 dates, nominal resolution of 5.3 m at nadir, effective resolution of about 7.5 m due to the off-nadir acquisition angle of 29.7°). The y-axis represents the index mean value as a percent of the possible range of values.
Remotesensing 13 01958 g010
Figure 11. Standardized mean ExG (green), NDVI (black) and Relative Red (red) of Terebinth (n = 32), based on the ground photos after preprocessing. The left y-axis represents the index mean value as a percent of the range of values, and the daily minimum air temperature (C°, grey dots), recorded at Israeli Meteorological Service station #7220 (Netiv HaLamed-Heh, located about 7 km west of Mata). The right y-axis represents the daily precipitation (mm, blue bars), recorded at Israeli Meteorological Service station #246630 (Tzur Hadassah, located about 4.5 km east of Mata).
Remotesensing 13 01958 g011
Figure 12. Correlations between ExG values of individual plants extracted from the ground photos and UAV images (11 dates) of the following species: Palestine Oak (A), Terebinth (B), Carob (C), Mastic tree (D), and mean ExG values of Herbaceous vegetation (all ROIs per date), detected by the same sensor (ground photos and UAV), at the individual plant level. Negative correlations range in the bluish background.
Remotesensing 13 01958 g012
Figure 13. VENμS processed study area; (a) the location of Mata over the elevation base map. (b) bare surface, woody vegetation and herbaceous vegetation components. (ce) a pixel-based analysis of phenological indices—start of season (SOS), maximum of season (MOS), and end of season (EOS), computed by TimeSat 3.3 software, for the time period between October 2018 and September 2019, using 62 cloud-free VENμS images. Grey areas represent urban, bare surface and agricultural land uses, which were masked out and not included in our analysis.
Remotesensing 13 01958 g013
Table 1. Vegetation indices calculated for the ground camera (a–f), UAV and VENµS data (a–g).
Vegetation IndexFormulaReferences
(a)Green excess\Excess green; ExG 2G − (R + B) [41]
(b)Normalized Difference Vegetation Index; NDVI N I R R N I R + R [3]
(c)Green-Red Vegetation Index; GRVI G R G + R [42]
(d)Relative red/RCC; Red chromatic coordinate R R + G + B
(e)Relative green/GCC; Green chromatic coordinate G R + G + B [43]
(f)Relative blue/BCC; Blue chromatic coordinate B R + G + B
(g)Normalized Difference Vegetation Index red-edge; NDVIre N I R R e d   E d g e N I R + R e d   E d g e [44,45]
Table 2. List of the species analyzed with the number of individuals for each species per platform.
Phenological GroupSpeciesCommon NameNumber of ROIs
Ground Camera UAV & VENμS
EvergreenPinus halepensisAleppo Pine1142
EvergreenQuercus calliprinosPalestine Oak157350
EvergreenPistacia lentiscusMastic tree, Lentisk74324
EvergreenOlea europaeaOlive tree1849
EvergreenCeratonia siliquaCarob, Locust tree2164
EvergreenCistus salviifolius/creticusRock Rose-94
Summer deciduousAnagyris foetidaMediterranean Stinkbush1333
Summer deciduousCalicotome villosaSpiny Broom4340
Summer semi-deciduousRhamnus lycioidesPalestine Buckthorn39139
Summer semi-deciduousSarcopoterium spinosumPrickly Burnet23155
Winter deciduousPistacia palaestinaTerebinth3247
Winter deciduousPrunus dulcisCommon Almond89120
Annual Herbaceous2794
Total 5471551
Table 3. UAV data acquisition dates and adjacent dates of ground photography.
Ground PhotosUAV
31 January 20181 February 2018
5 March 20184 March 2018
12 April 20188 April 2018
2 May 20183 May 2018
14 June 201813 June 2018
27 June 201827 June 2018
6 August 20186 August 2018
24 September 201825 September 2018
20 November 201822 November 2018
25 December 201824 December 2018
22 January 201921 January 2019
Table 4. Pearson correlation coefficients of six Vegetation Indices mean values for each species per date (11 dates), between values derived from the ground camera data (after pre-processing), and those from the UAV data (spatial resolution of 14 cm). The asterisks indicate the statistical significance as follows: * p < 0.05, ** p < 0.01, *** p < 0.001. H0: R2 = 0.
SpeciesExGGRVINDVIRelative BlueRelative GreenRelative Red
Aleppo Pine0.65 *−0.190.310.70 *0.51−0.51
Terebinth0.95 ***0.490.470.540.580.24
Palestine Oak0.88 ***−0.080.83 **0.63 *0.160.06
Mastic0.87 ***−0.130.72 **0.40−0.140.19
Palestine Buckthorn0.91 ***0.550.230.82 **0.61 *0.82 **
Olive0.72 *0.310.270.39−0.130.75 **
Carob0.76−0.150.470.64 *0.33−0.36
Prickly Burnet0.91 ***0.96 ***0.86 ***0.62 *0.80 **0.81
Annual Herbaceous0.93 ***0.95 ***0.96 ***0.71 *0.88 ***0.86 ***
Mediterranean Stinkbush0.87 ***0.70 **0.80 **0.74 **0.70 *0.50
Spiny Broom0.91 ***0.85 ***0.79 **0.61 *0.63 *0.68 *
Almond0.92 ***0.90 ***0.77 **0.92 ***0.91 ***0.38
Table 5. Pearson correlation coefficients of seven spectral indices mean value for each species per date (10 dates), between values derived from the UAV data and those from VENμS. The asterisks indicate the statistical significance as follows: * p < 0.05, ** p < 0.01, *** p < 0.001. H0: R2 = 0.
Spatial Resolution (cm)Aleppo PineTerebinthPalestine OakMastic TreePalestine BuckthornOlive TreeCarobAnnual HerbaceousMediterranean StinkbushSpiny BroomCommon AlmondPrickly Burnet
ExG0.02−0.75 *−0.21−0.430.09−0.08−0.360.97 ***0.74 *0.66 *−0.290.90 ***
GRVI0.67 *−0.420.600.590.68 *0.67 *0.580.93 ***0.92 ***0.86 **−0.080.95 ***
NDVI0.74 *−0.320.600.67 *0.69 *0.65 *0.600.92 ***0.85 **0.87 **0.190.90 ***
NDVIre0.90 ***−0.530.510.70 *0.76 **0.70 *0.69 *0.93 ***0.83 **0.88 ***0.320.88 ***
R Blue−0.38−0.10−0.270.270.390.03−0.54−0.65 *−0.140.140.610.45
R Green0.52−0.270.63 *0.590.71 *0.68 *0.520.91 ***0.91 ***0.88 ***0.020.95 ***
R Red0.69 *−0.500.570.600.73 *0.64 *0.580.91 ***0.94 ***0.84 **0.030.95 ***
Table 6. Summary of the strongest Pearson correlations coefficients of the spectral indices between values derived from the ground camera data (after pre-processing), and those from the UAV data, after resampling to different pixel sizes. For each cell in the table, the correlation coefficient is shown only for the vegetation index with the strongest correlation: ExG in black, GRVI in orange, NDVI in purple, Relative Blue in blue, Relative Green in green, and Relative Red in red. The asterisks indicate the statistical significance as follows: * p < 0.05, ** p < 0.01, *** p < 0.001. H0: R2 = 0.
Spatial Resolution (cm)Aleppo PineTerebinthPalestine OakMastic TreePalestine BuckthornOlive TreeCarobAnnual HerbaceousMediterranean StinkbushSpiny BroomCommon AlmondPrickly Burnet
140.70 *0.95 ***0.88 ***0.87 ***0.91 ***0.75 **0.760.96 ***0.87 ***0.91 ***0.92 ***0.96 ***
300.70 *0.95 ***0.87 ***0.86 ***0.90 ***0.75 **0.750.96 ***0.87 ***0.91 ***0.92 ***0.96 ***
1250.66 *0.93 ***0.87 ***0.87 ***0.85 ***0.73 **0.72 *0.96 ***0.86 ***0.90 ***0.89 ***0.96 ***
5000.52−0.710.81 **0.83 **0.73 **0.68 *−0.580.95 ***0.71 *0.89 ***0.70 *0.94 ***
Table 7. An overview of the classification accuracy assessment results (average producer’s accuracies) of the ExG time series, based on the UAV images, after resampling them to 4 different spatial resolutions.
SpeciesPixel Size (cm)
1430125500
Aleppo Pine80%77%71%11%
Terebinth64%50%44%12%
Palestine Oak63%73%61%21%
Mastic72%72%50%23%
Palestine Buckthorn48%53%34%9%
Olive80%78%55%27%
Carob48%42%36%35%
Rock Rose71%73%66%54%
Prickly Burnet92%90%78%52%
Annual Herbaceous98%97%82%49%
Mediterranean Stinkbush76%66%58%23%
Spiny Broom56%47%39%19%
Almond87%80%67%51%
total accuracy0.720.690.570.23
Kappa0.700.670.530.19
Table 8. Matrix of Spearman’s rank correlation coefficients of the phenological indices (SOS, MOS, EOS) and the environmental factors after normalization. n = 1,716,915 pixels per variable, including only areas of Mediterranean vegetation, as shown in Figure 13. The phenological indices were calculated for the time period between October 2018 and September 2019, using 62 cloud-free VENμS images.
SOSMOSEOSElevationAspectSlope% Woody
MOS−0.140-
EOS−0.1750.863-
Elevation−0.2900.2720.326-
Aspect−0.054−0.363−0.2820.133-
Slope−0.0580.3620.3490.332−0.073-
% woody−0.2480.3220.318−0.093−0.2230.019-
% herbaceous0.331−0.500−0.515−0.2070.032−0.222−0.644
Publisher’s Note: MDPI stays neutral with regard to jurisdictional claims in published maps and institutional affiliations.