Abstract
Monitoring glacier flow is vital to understand the response of mountain glaciers to environmental forcing in the context of global climate change. Seasonal and interannual variability of surface velocity in the temperate glaciers of the Parlung Zangbo Basin (PZB) has attracted significant attention. Detailed patterns in glacier surface velocity and its seasonal variability in the PZB are still uncertain, however. We utilized Landsat-8 (L8) OLI data to investigate in detail the variability of glacier velocity in the PZB by applying the normalized image cross-correlation method. On the basis of satellite images acquired from 2013 to 2020, we present a map of time-averaged glacier surface velocity and examined four typical glaciers (Yanong, Parlung No.4, Xueyougu, and Azha) in the PZB. Next, we explored the driving factors of surface velocity and of its variability. The results show that the glacier centerline velocity increased slightly in 2017–2020. The analysis of meteorological data at two weather stations on the outskirts of the glacier area provided some indications of increased precipitation during winter-spring. Such increase likely had an impact on ice mass accumulation in the up-stream portion of the glacier. The accumulated ice mass could have caused seasonal velocity changes in response to mass imbalance during 2017–2020. Besides, there was a clear winter-spring speedup of 40% in the upper glacier region, while a summer speedup occurred at the glacier tongue. The seasonal and interannual velocity variability was captured by the transverse velocity profiles in the four selected glaciers. The observed spatial pattern and seasonal variability in glacier surface velocity suggests that the winter-spring snow might be a driver of glacier flow in the central and upper portions of glaciers. Furthermore, the variations in glacier surface velocity are likely related to topographic setting and basal slip caused by the percolation of rainfall. The findings on glacier velocity suggest that the transfer of winter-spring accumulated ice triggered by mass conservation seems to be the main driver of changes in glacier velocity. The reasons that influence the seasonal surface velocity change need further investigation.
1. Introduction
Since the mid-19th century, most glaciers in High Mountain Asia have experienced a recession and thinning [1,2], which has raised many concerns including sea-level change [3,4], sustainable water resources [5], glacier hazards such as glacier lake outburst floods (GLOFs) and glacier surge [6,7,8]. There is an urgent need to understand glacier dynamics in High Mountain Asia because monitoring mountain glacier velocity is a useful way to identify glacier related environmental changes and hazards [9]. Glacier surface velocity is a crucial feature of glacier dynamics, which is a combined consequence of ice deformation, basal sliding, and base deformation [10] in response to mass flow. Therefore, glacier surface velocity captures the overall effect of multiple aspects of glacier dynamics, e.g., glacier mass flow and surges [11,12,13,14].
The eastern Nyainqentanglha Mountain Range is a critical region where a small amplitude of atmospheric forcing may result in dramatic glacier advance or recession [15]. It is a specific region of temperate glaciers in the Tibetan Plateau. The temperate glaciers in the southeastern Tibetan Plateau are characterized by large accumulation and intense ablation [15], with summer mean air temperature about 1–5 °C at the equilibrium-line altitude [16]. These temperate glaciers are sensitive climatic indicators since they are highly affected by the monsoon system [17,18,19] because the monsoon nourishes these glaciers with abundant snowfall [2]. The eastern Nyainqentanglha Mountain Range is a transition zone between the warm-humid subtropical in the forelands and the cold-dry continental climate on the Tibetan Plateau [20] and is influenced by the invasion of the Indian Summer Monsoon (ISM) through the Brahmaputra Valley in summer and the westerly winds in winter [21]. As a consequence of this situation, the climate in the eastern Nyainqentanglha Mountain shows a distinct seasonality [20]. The investigation of temperate glaciers seasonal surface velocity is useful, therefore, to improve our understanding of seasonal glacier dynamics.
It has been reported that glaciers can display substantial seasonal variations in surface velocity. Vijay et al. [22] and Sole et al. [23] suggested that these changes occur because the seasonality in the production of meltwater affects how much water is retained in the subglacial system. Moon et al. [24] observed three distinct seasonal velocity patterns in the Greenland Ice Sheet: one pattern exhibits a relatively high correlation with glacier front retreat, while the other two patterns seem to be controlled by meltwater. Armstrong et al. [25] attributed seasonal changes in glacier velocity to subglacial drainage, specifically to subglacial slip associated with water pressure at the glacier-bedrock interface. Burgess et al. [26] noted that glacier flow acceleration in summer is caused by increased surface melt rates, while winter flow is related to meltwater released in the preceding summer. Kenner et al. [27] suggested that increased water supply from precipitation might have an impact on glacier deformation and on the seasonality of surface velocity. These changes occur because the seasonal variation of meltwater affects how much water is retained in the subglacial system [23,27]. Hence, it remains an open question why and how the water pressure affects the glacier surface velocity. New continuous measurements are required to reach a thorough understanding.
Additionally, measurements of inter-annual variability in glacier surface velocity provide relevant information on the glacier response to atmospheric forcing [28]. With the weakening Indian monsoon, summer precipitation decreased, and air temperature increased in the southeast Tibetan Plateau in the past decades, which enhanced the mass loss of glaciers in the eastern Nyainqentanglha Mountain Range [2]. There have been a few velocity observations in the study region [13,29]. Dehecq et al. [13] retrieved glacier surface velocity by applying a feature-tracking method to panchromatic bands of Landsat-7 and Landsat-8 image pairs (15 m resolution) over the High Mountain Asia (HMA). Their results show that the largest velocity slowdown happened in Nyainqentanglha with a rate of –37.2 ± 1.1% decade−1, and the mean rate of mass loss was –0.62 ± 0.23 m w.e.y−1 [13]. The surface velocity experienced a steady and continuous slowdown from 1999 to 2015, which is consistent with trends in yearly glacier mass balance and elevation [13,29]. This slowdown is mainly due to glacier mass loss. However, recent studies report increased summer precipitation (2014–2018) over the Inner Tibetan Plateau based on the ERA-interim reanalysis [30]. Under changing atmospheric conditions, the dynamic behavior of the glaciers requires further exploration.
Field observations have long been the mainstream method to measure glacier surface velocities, but in practice, it is not feasible to do in situ measurements repeatedly over a large number of glaciers in the harsh environment of HMA [31,32]. Remote sensing has the capability to measure consistently surface properties of large areas frequently and offer alternate methods to estimate glacier surface velocity [33]. Cross-correlation of multi-temporal optical images is a widely used method to retrieve glacier displacements and then convert to the surface velocity [34,35,36,37,38]. Optical satellite imagery is often more reliable than satellite-borne radar data for velocity estimation in mountain glaciers because it is less prone to decorrelation on the steep, rapidly changing surfaces often found on mountain valley glaciers [39].
The Parlung Zangbo Region is a challenging area for the application of remote sensing technology due to frequent cloud coverage and complex terrain [15,21,40]. In comparison with other regions in China, few studies focused on temperate glaciers in the Parlung Zangbo region [29]. Wu et al. [41] used Landsat TM/ETM+/OLI imagery from 1990 to 2018 to measure glacier surface velocity and reported overall trends of −5.26 m a−1 dec−1 (–19.8% dec−1) and 7.16 m a−1 dec−1 (25.2% dec−1) at elevations below and above 4600 m a.s.l. in southeastern Tibetan Plateau, respectively. Ke et al. [42] provided ice-velocity retrievals in the Yigong Zangbo basin in the summer 2007 based on L-band PALSAR data, and documented velocities of 12 glaciers to be in the range 15 to 206 m/y. They also suggested that the valley geometry and topography affect the overall spatial pattern of the velocity. Neckel et al. [29] investigated five debris-covered glaciers in the Nyainqentanglha Range, suggesting a mean glacier velocity deceleration of 51% from 1999/2003 to 2013/2014. Scambos et al. [43] and Fahnestock et al. [33] generated a near-real-time global ice velocity database from Landsat 8 panchromatic imagery called Global Land Ice Velocity Extraction from Landsat 8 (GoLIVE), with 300 m spatial resolution, which is too coarse to analyze the flow mechanism in individual mountain glaciers. The dynamic behavior of the glaciers in different seasons and the resulting impact on interannual glacier motion, therefore, remain uncertain in the Parlung Zangbo Basin.
Observations of surface velocity provide essential information to understand the mechanism driving ice motion [10,44,45]. Generally, transects of surface velocity across a glacier center flowline can be used to infer dominant motion mechanisms [44,46]. When the velocities are high and relatively stable around the center flowline, while decreasing rapidly towards the edges, the glacier motion is dominated by basal sliding and the drag on the lateral moraine. On the other hand, when the surface velocity increases from the glacier edges to the center in a parabolic pattern, the glacier motion is dominated by internal deformation [35,47].
We have systematically characterized spatial and temporal variations of the surface velocity of the Parlung Zangbo Region using Landsat-8 data spanning 2013–2020. We applied the image cross-correlation method to panchromatic satellite images to retrieve the glacier surface velocity. To explore the variability of the seasonal surface velocity, we utilized a time averaging filter to capture the seasonal signal. These results reveal the dynamics of the selected temperate glacier with seasonal and interannual velocity variations that provide insights into the underlying dynamics. Updating and extending knowledge on the glacier velocity in the Parlung Zangbo Basin is vital for exploring the relationship between glaciers and climate change.
The purposes of this study were to: (1) document and analyze the temporal variability in glacier velocity; (2) produce updated maps of glacier surface velocity in the Parlung Zangbo Basin; (3) explore glacier motion mechanisms using central flowline and transversal velocity profiles of four typical glaciers; (4) interpret the controlling parameters on glacier velocity patterns by using topographic profiling and glacier thickness analyses.
2. Study Area and Data
2.1. Study Area
The Parlung Zangbo Basin (PZB) (28.5–29.8N to 95.5–97.5E) in southeast Nyainqentanglha is located between the Tanggula Mountains to the north and the Hengduan Mountains to the east. The geomorphological features of the PZB are high mountains, deep gorges, wide gullies, and glaciers, with elevation varying from 1000 to 7000 m above sea level [48]. Glaciers are widely distributed in the mountain ranges above 3000 m, with the Equilibrium Line Altitude (ELA) being about 4600 m in the southeast Nyainqentanglha [2]. According to the Second Chinese Glacier Inventory (SCGI) data in 2005, there are 1242 glaciers in the PZB, covering an area of 1977.95 km2. However, with the increasing temperature in recent decades, glaciers in this region shrank significantly, which makes this region ecologically vulnerable [4].
The PZB has a warm, humid climate that is strongly affected by the seasonal variation of precipitation controlled by the monsoons. The Indian summer monsoon penetrates to the north through the Brahmaputra River Basin. During winter and spring, the westerly jet is blocked by the Tibetan Plateau and splits into two parts—the southern branch forms a trough in the Kangri Karpo Mountains after evading the Himalayas. Moisture from the Bay of Bengal is delivered to this trough, causing heavy snowfalls and developing temperate glaciers [49]. The rain season typically begins in March and ends in October based on the observation record at the national meteorological station at Chayu (28°39’N, 97°28’E; 2327 m above sea level, about 90 km to the southeast of the Parlung No.4 Glacier) (Figure 1a green dots) [48]. The southeastern parts of Nyainqentanglha glaciers can be classified as “summer-accumulation type”, i.e., influenced by the seasonal precipitation [48]. Mass movement in most temperate glaciers is large, with high accumulation and ablation rates [49]. The red rectangle in Figure 1a shows our study region Parlung Zangbo Basin.
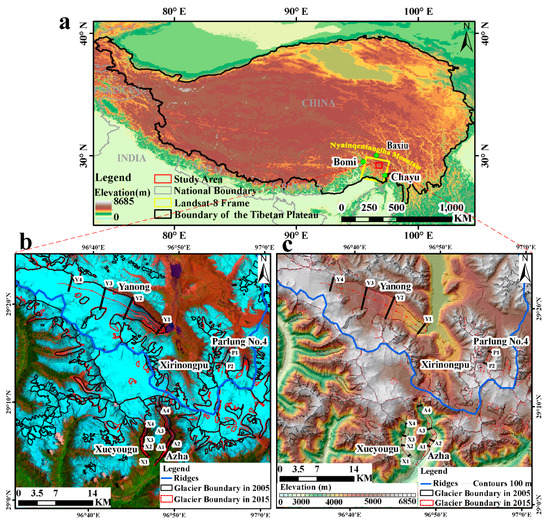
Figure 1.
SRTM (Shuttle Radar Topography Mission) terrain elevation at 30 m × 30 m spatial resolution and location map of the study area: (a) Geographical location of the studied area (red rectangle) in the Tibetan Plateau, including glacier distribution and meteorological stations (green dots); (b) study area on a Landsat-8/OLI image on 25 May 2013 false-color composite with RED = band 7, GREEN = 5, and BLUE = 3; (c) elevation map of the study area.
2.2. Data
In this section, the Landsat-8 OLI dataset was used to retrieve glacier surface velocity. Then, the DEM (Digital Elevation Model) was applied to estimate terrain slope. Finally, the meteorological data was applied to interpret changes in glacier velocity.
2.2.1. Landsat-8 OLI
We used panchromatic images acquired by the Landsat-8 OLI L1TP (Precision and Terrain Correction) images (DN value) to retrieve the glacier velocity between May 2013 and June 2020. The Operational Land Imager and the Thermal InfraRed Sensor (TIRS) are onboard the Landsat-8 satellite, launched on 11 February 2013. The OLI images are acquired with a 16-day repeat cycle and geolocated in the Worldwide Reference System-2 (WRS-2) path/row system. Landsat-8 provides high-quality moderate-resolution image data, processed and distributed through the United States Geological Survey (USGS) Earth Explorer [50]. Data products are re-projected onto the Universal Transverse Mercator (UTM) reference system. The OLI offers several enhancements over the Landsat-4, 5 TM, and Landsat-7 ETM+ sensors, including improved radiometric resolution and noise reduction. The OLI images have been widely used to estimate glacier velocities [33,51,52] and are suitable to track glacier movement [53].
We used 58 images in total and generated 288 maps of displacement retrievals, using different combinations of acquisition dates, as detailed in Supplementary Materials. As previously mentioned, the study area is located in a challenging region with frequent cloud cover. In order to capture the seasonal glacier dynamics, we proposed a redundant temporal strategy, where one master image was correlated with six slave images (see Section 3.1 for details). All the panchromatic images (15 m spatial resolution) used in this study were in the same path/row (134/40) to diminish geometric distortions.
2.2.2. DEM
The NASA Shuttle Radar Topography Mission (SRTM) provided a Digital Elevation Model (DEM) of the Earth land surface between 60° north and 56° south latitude. The C-band and X-band SRTM DEM was produced with the data acquired by the SRTM and can be freely downloaded from data repositories at the United States Geological Survey (USGS) and the German Aerospace Center (DLR). The SRTM data were acquired in February 2000, while our velocity retrievals covered the period between May 2013 and June 2020. In this study, the 30-meter resolution SRTM data were used as reference elevation because it was widely used in analyzing the surface velocity [35,41]. In addition, the DEM was used to generate a slope map in ArcGIS 10.3 and to extract glacier surface elevation profiles in support of the velocity analyses.
2.2.3. Other Datasets
Glacier outlines are needed to divide the glacier region and off-glacier area for accuracy assessment. Here, the glacier outlines were obtained from the SCGI, based on remote sensing data [54]. For the east Nyainqentanglha region, the glacier outlines were derived from Landsat TM images on 8 September 2005 [54]. The SCGI glacier outline in this study area was adopted by the Randolph Glacier Inventory (RGI) 6.0 [55]. Zhang et al. [56] refined mapping of glacier facies in our study area by applying a random forest classifier to L8/OLI and TIRS radiometric data acquired in 2015, using the GF-1 Panchromatic and Multi-Spectral (PMS) image data at high spatial resolution to construct the training set. This study provided a slightly different delineation of glaciers (see Figure 1c) in our study area, when compared to the SCGI (2005). Accordingly, we used the SCGI/RGI 6.0 as a reference, in agreement with other studies, see e.g., Wu et al. [41]. We also use the modeled ice thickness distribution from RGI 6.0 in the discussion to analyze the velocity relationship in combination with slope and glacier thickness. The glacier thickness calculation was based on five models to provide a consensus estimate for individual glaciers. The Yanong Glacier in the RGI 6.0 was marked as a possible surging glacier, while the other glaciers (Azha, Xueyougu, Parlung No.4) in this study have yet to be assessed individually [57].
In addition, to analyze the response of glaciers to climate, the air temperature and precipitation data were acquired from the China Meteorological Data Service Center (http://data.cma.cn/en, accessed on 3 June 2020). The monthly mean temperature and precipitation from 2013 to 2020 were observed at Bomi (Longitude: 95.46°, Latitude: 29.52°, Elevation: 2736 m) and Baxiu (Longitude: 96.55°, Latitude: 30.03°, Elevation: 3260 m) weather stations. Daily observations of 1.2–1.5 m air temperature and precipitation span the period between 2007 and 2017 at the integrated observation and research station of the alpine environment in southeast Tibetan Plateau at 94°44’18" E and 29°45’56" N, elevation: 3326 m [58] (Data source: http://www.tpedatabase.cn).
3. Methods
With the improvements in available spaceborne optical image data, an increasing number of studies documented ice flow dynamics. The cross-correlation method (Figure 2) is useful to monitor glacier surface displacement. We followed the method presented in [51] to extract the glacier surface displacement in the eastern Nyainqentanglha Mountains between 2013 and 2020. Firstly, image preprocessing was performed which included the removal of clouds by applying a manually delineated cloud mask. Then, displacement maps were derived from each pair of images using the image cross-correlation method. Finally, all the velocity fields (annual or seasonal) were temporally averaged within each time interval in the database with all retrieved maps of surface velocity (see Section 3.2). The temporal averaging is needed to construct regularly spaced time series on estimated velocity and to minimize the gaps due to decorrelation and residual clouds. The uncertainty on velocity was estimated by retrieving the velocity in the off-glacier regions. In this section, we describe the methods and parameters used in this study.
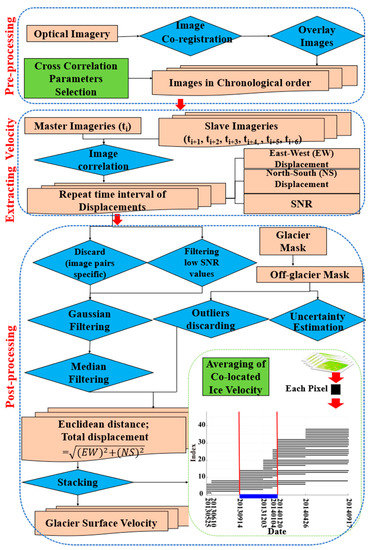
Figure 2.
Flowchart of the methodology used to retrieve glacier surface velocity from Landsat image-pairs; the box “Averaging of co-located ice velocity” applies to the estimation of the stack velocity: the black lines represent image pairs having the unique index indicated on the y-axis; the dates of image acquisitions are shown on the x-axis; the blue segment under the lowest gray line indicates the temporal window applied to select the retrievals to be extracted and averaged to estimate the stack velocity.
3.1. Preprocessing and Extracting Velocity Field
It is impossible to find optical images without clouds in this challenging region, as documented by the efforts needed to compile glacier inventories in such regions [51,54,59,60]. Images were co-registered in a common reference system using COSI-Corr, i.e., the UTM with a co-registration error smaller than an image pixel. A time series was constructed with available images before image correlation.
Surface displacements are estimated by automatic tracking of surface features, such as debris, moraine, texture, between two OLI images acquired on different dates. It should be noted that the temporal coverage of multiple pairs of images will partly overlap, which can be used to improve the accuracy of retrieved velocity by averaging multiple maps of velocity over a given temporal window. The maps of surface displacement were generated by using the software package COSI-Corr (Co-registration of Optically Sensed Images and Correlation), developed by Leprince et al. [61]. This method is widely used for similar glacier applications, and its excellent performance has been documented [35,51,52].
The Fourier-based feature-tracking method is applied, which can effectively deal with the rough glacier surface due to e.g., crevasses and debris [61]. This correlator retrieves the surface displacement in two steps by applying a variable size window. A large-scale window (called Initial window) maximizes the correlation between two different images, while a small window (called Final window) estimates a finer displacement. The optimal window size is related to the estimated largest surface displacement. The moving window size must be large enough to contain tracking features useful to match the two images. The cross-correlation computation continues by moving the Final window in every iteration by 1 pixel until the entire Initial window is covered. After the computation, the pixel in the Final window with the peak correlation coefficient is regarded as the best match for the central pixel of the Initial template. The Euclidean distance between the coordinates of the peak correlation point and the matching point in the Initial window is regarded as the horizontal displacement magnitude [61]. Then, the Initial window will move to the next region, and the same computation continues. The detailed theory can be found in [61].
According to [42], the mean velocity in this region is between 15 and 206 m/y, with a maximum of 423 m/y. The spatial resolution of the Landsat-8 OLI panchromatic band is 15 m. After extensive testing, the horizontal displacements along the East/West (E/W) and North/South (N/S) direction were measured using a 32 × 32 (pixels) window as the Initial search window and a 16 × 16 (pixels) window as the Final window. The Signal to Noise (SNR) value represents the correlation, within the [0, 1] range. Higher SNR values indicate a better match [61]. Image correlation always generates three maps: East-West (EW) displacement, North-South (NS) displacement, and SNR maps.
Finally, we obtained the displacement maps at a resolution of 15 m, i.e., with a sliding step set as one pixel (Table 1). Each master image was combined with six slave images covering partly overlapping time intervals to calculate displacements by minimizing the mismatches due to e.g., cloud cover, snow cover, and melting ice.

Table 1.
Specifications and processing parameters of Landsat 8 OLI.
3.2. Post-Processing
In our study area, the coverage of velocity retrievals is not continuous due to the high accumulation and ablation rates of temperate glaciers, where image correlation fails and gaps appear. This generally occurs in feature-less glacier surfaces, for example, in extensive accumulation troughs, and where rapid changes of the glacier surface conditions complicate feature tracking, such as in the areas of snow avalanches [51]. We improved some post-processing steps to minimize data gaps in glacier velocity maps.
Specifically, we performed the following seven steps:
- (1)
- To discard potential outliers, we removed pixels with lower SNRs in both East/West and North/South directions. The decision of whether a SNR threshold is suitable helps to select reliable retrievals of displacement. We removed pixels where SNR < 0.9.
- (2)
- The second step was to apply Gaussian filtering to remove noise on each velocity map. The width of the filter was set with σ = 1.6, and the search area was 3 × 3 pixels [62].
- (3)
- The third step was to use a median filter for noise reduction, with a 3 × 3 pixels kernel. This filter is an effective method to remove isolated pixels and to fill small gaps.
- (4)
- The fourth step was to estimate the glacier velocity :
- (5)
- The off-glacier mask was generated according to the RGI 6.0 and applied to extract stable ground velocity over the entire image frame to estimate the uncertainty in the velocity retrievals [63].
- (6)
- To maximize the reliability of the velocity retrievals, the random error was estimated to be equal to 3 times the standard deviation (SD) of the off-glacier velocity [62]. We then discarded any retrieval smaller than the estimated random error.
- (7)
- To retrieve the seasonal and annual glacier velocity, all the velocity maps overlapping a specific time interval were stacked together (Figure 2). Before stacking, velocities in each map were referenced to a common spatial reference. Pixels that were valid in three or more of the maps were included in the stack. The set of image pairs overlapping the same time interval were referred to as “stack”. The “stack” velocity was then:
COSI-Corr calculates the displacement between the dates of acquisition of the two images in each pair. The velocity was calculated by applying Equation (1) to each image pair. The stack velocity is estimated for each pixel according to Equation (2) by taking into account the overlap in the temporal coverage of different pairs (see Figure 2 averaging of co-located ice velocity). Once defined a specific interval of time for which we intended to estimate the mean (stack) velocity, a filter was defined and applied to extract from the stacked maps of velocity the retrievals covering the required interval of time. Finally, Equation (2) was applied to estimate the mean (stack) velocity. The processing steps described above yielded a stack of velocity maps retrieved from image pairs co-registered to subpixel accuracy. The dates of acquisition of image pairs might differ each year, but we resampled temporally overlapping image pairs by applying the same temporal window.
The specific time interval was determined according to the monsoon season. We defined summers, i.e. the wet season, from March to October, and winter, i.e. the dry season, from October to next year March. Due to the snow cover and low contrast in the accumulation area, a few data gaps might occur in a single velocity map. The use of temporally overlapping image pairs to estimate the stack velocity mitigated this problem since gaps in the estimated displacement maps were unlikely to occur in all image pairs. The stacking process improved the signal-to-noise ratio above that of individual velocity maps, so that a more robust pattern of glacier surface velocity can be retrieved [64]. Remaining system errors in individual velocity maps should be reduced by stacking, since cloud and other orbital errors in each image pair were uncorrelated. After the stack processing, the data gaps were too few to affect the statistics on surface velocity significantly.
3.3. Uncertainty Assessment
Due to the inaccessible study region, it was impossible to evaluate our velocity retrievals against in situ observations. As done in other studies, we used retrievals of the off-glacier velocity to assess the accuracy of our retrievals [65,66].
Taking into account that ground in the off-glacier area should not move, the displacement retrievals in the off-glacier area are generally regarded as a reference to evaluate the accuracy of estimated glacier velocities. Assuming the true value of the off-glacier surface velocity is zero, the error on velocity retrievals in the entire off-glacier area is [67]:
where is the error on off-glacier area velocity, and MEAN is the mean velocity value in the entire off-glacier area. SE is the standard error of the stack velocity in the off-glacier area, applied as a metric of random error on the retrieval of glacier surface velocity [67]:
where STD represents the standard deviation of the off-glacier area velocity retrievals within the entire off-glacier region, and is the number of pixels in the off-glacier region.
An appropriate number of pixels within such a sample can be estimated as:
where PS is the pixel size, and B is the distance of spatial auto-correlation. According to the literature review [35,68], B is approximately 20 times PS.
We statistically estimated the uncertainty by evaluating the error in the off-glacier region and applied the estimated as a metric of uncertainty in our retrievals of glacier surface flow velocity. The temporal separation of a pair can also affect the quality of the matching (Figure 3). The error of estimate decreased with increasing temporal separation between two acquisitions. We choose the pairs to retrieve the annual and seasonal velocity with a separation sufficient to achieve < 0.03 m/d, i.e., 10.95 m/y.
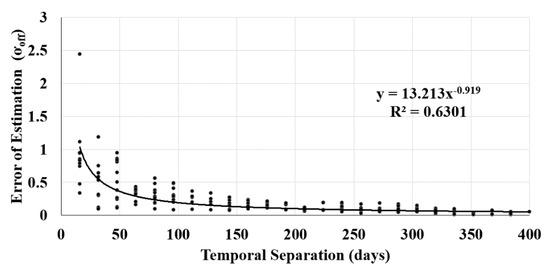
Figure 3.
Error of Estimation () on retrievals of glacier surface flow velocity for L8/OLI optical images vs. temporal separation of paired images.
4. Results
Surface velocity maps for the PZB were obtained from 288 image pairs spanning the period from 2013 to 2020. The database (see Section 3.2 for details) on mean velocity and temporal coverage for each image pairs was queried, applying different time intervals to construct time series. These time intervals included summer (March to October), winter (November to February), and specific months of a year according to the monsoon season [48]. The dates of acquisition of image pairs might differ each year, but we resampled temporal overlapping image pairs by applying the temporal window.
4.1. Overall Spatial Distribution
Overall, large-size glaciers flowed faster than the small-size glaciers (Figure 4). In general, the glacier flow pattern of individual glaciers shows similarities in shape, that is, the flow rate gradually increases from the glacier margin to the centerline and the glacier velocity increased from the glacier snout to the upper area [35].
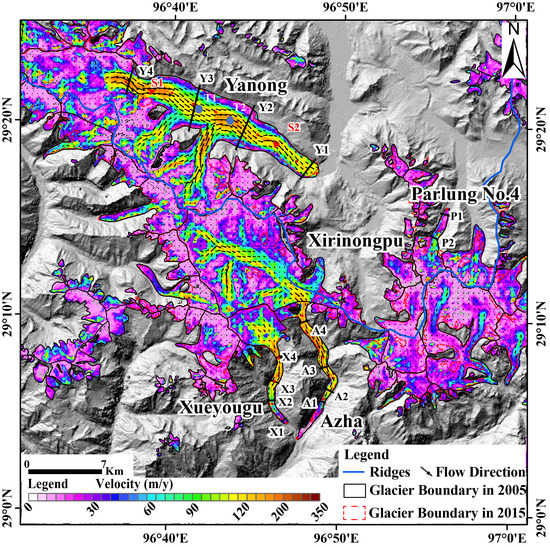
Figure 4.
Mean annual glacier velocity in the Parlung Zangbo Basin during 2013–2020. The velocity maps overlay the gray-shade void-filled SRTM DEM. The blue lines are mountain ridges, and the black lines are glacier boundaries in 2005 (SCGI). The red dashed lines are glacier boundaries in 2015 [56]. The blue dots (T1, T2) are junction points of Yanong Glacier where tributary glaciers merge into the main trunk glacier. Red lines with dots in some glaciers show the flow centerline. The thick black lines across glaciers indicate the transects analyzed.
The Yanong Glacier is the largest one in the study region. The velocities of the middle and upper glacier zones of the Yanong Glacier are larger than in the glacier terminus zone (Figure 4). The two southern tributary glaciers are of a smaller size than the mainstream. At the junction (T1, T2 blue points in Figure 4) of a tributary and the trunk of Yanong Glacier, the flow regime of the trunk glacier is affected by the tributary-trunk interaction. This interaction has a long-term effect on ice flow dynamics, particularly in ice stream behavior [69,70], where tributary and trunk glaciers join at around T2 (Figure 4). There is a higher velocity in the junction point, as shown as a yellowish blob upstream of T2.
The Parlung No.4 Glacier flows southward from elevation 5937 to 4621 m, with an area of around 11.7 km2 and a length of nearly 8000 m. The highest velocity is at P2 (Figure 4), where crevasses are formed by variable shear stresses [71]. When glaciers flow downstream, the glacier speed decreases towards the glacier tongue.
The Azha and Xueyougu Glaciers are two debris-covered glaciers. The Azha Glacier is a typical valley-type glacier with an area of about 12.41 km2, and flows southward from an elevation of 5482 m. The mass of ice is constrained by narrow, steep terrain and the glacier surface velocity changes along with the bending of the glacier stream (Figure 4). According to the SCGI outline, the Azha Glacier has a much larger accumulation area compared to the Xirinongpu Glacier, which may explain the higher surface velocity observed in the average velocity patterns (Figure 4). The Azha Glacier is located on the southern side of the mountain range, while the Xirinongpu Glacier is located on the northern side.
4.2. Atmospheric Forcing
The temporal variability in glacier velocity is closely linked to the synoptic atmospheric circulation and the seasonality in precipitation, such as the southern westerlies, the Bay of Bengal vortex in the spring season, and the Indian monsoon in the summer season [48]. Monthly precipitation and temperature between 2013 and 2020 at the two meteorological stations close to the study area were usually higher in spring and summer (Figure 5a,b), which is related to the Indian monsoon. A better insight on the seasonal and interannual variability of air temperature and precipitation is provided by the daily observations (Figure 6) from 2007 to 2018 at the integrated observation and research station of the alpine environment in southeast Tibetan Plateau. After careful comparison, the precipitation from 2017 to 2020 was higher than in previous years.
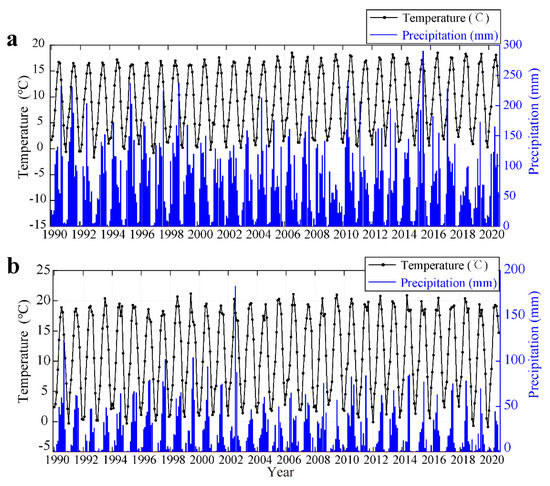
Figure 5.
Monthly mean air temperature and precipitation from 1990 to 2020 at the two nearest stations (a) Bomi and (b) BaXiu; see Figure 1a for location.
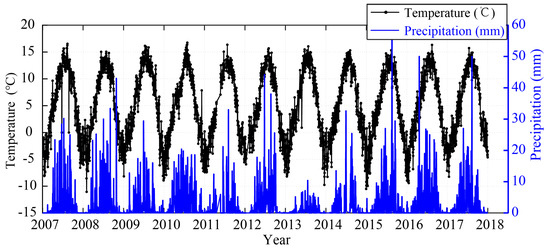
Figure 6.
Daily values of 1.2–1.5 m air temperature (black dots), precipitation at 3326 m elevation (blue right axis). Data Source: http://www.tpedatabase.cn. (Station Location: Longitude: 94°44′18″; Latitude: 29°45′56″).
4.3. The Overall Inter-Annual Velocity Change
We acquired information on the debris-cover (Table 2) in four glaciers from the SCGI when they were mapped manually using Landsat images acquired in 2005. The published debris-covered mask was the one used in Zhang et al. [56] and based on Landsat images acquired in 2015. It is worth noting that the glacier debris-covered area in 2015 was larger than in 2005.
Table 2.
Attributes of the four glaciers analyzed in this study. The median velocity refers to the median value of glacier centerline. Detailed information on the fractional debris cover and ELA in 2005 is from the Second Chinese Glacier Inventory [54]. Fractional debris cover 2015 is from [56], see Figure 4 for location of the four glaciers.
The annual surface velocity from 5 May 2013 to 29 June 2020 for the four selected glaciers (Figure 4) was estimated. To better display the temporal variations of glacier velocity, we extracted the centerline profiles of the investigated glaciers, as the velocity along the centerline was regarded as the most variable. Moreover, the velocity retrievals by COSI-Corr are most accurate for the homogenous pixels along the centerline, where the disturbance due to lateral friction is smaller than that in the margins. The interannual variability of glacier velocity was evaluated by extracting from the velocity profiles of individual glaciers along the central lines in October, when glacier flow is relatively stable (Table 3).
Table 3.
Annual (Image pair covering from October to October the following year) median centerline velocity of the four glaciers in the Parlung Zangbo Basin from 2013 to 2020; accuracy is estimated using samples in the entire off-glacier portion of our study area (see Section 3.3 for details).
The median velocity value of all the pixels in the central flowline was extracted for each glacier (Table 3). The annual median glacier velocity of Parlung No.4 has a slight general downward trend during 2013–2017, followed by fluctuations after 2017. In contrast, the Yanong, Xueyougu and Azha Glacier annual velocity display small fluctuations or slight increases during 2013–2017. During 2017–2018, the velocity of the four glaciers increased significantly, however, especially in the Azha and Xueyougu Glaciers.
The annual velocity map (Figure 7a) shows that the Yanong Glacier is currently active over its entire clean ice and moraine area. The first velocity peak is approximately 8300 m from the terminus (transverse section T2 in Figure 4) at an elevation of 4400 m, where the speed was between 100 and 300 m/y with a slight increasing trend from 2013 to 2020 (Figure 7a). At 13,000 m from the terminus at elevation 4595 m, i.e., around Y3 in Figure 4, the centerline speed ranges from 98 to 180 m/y in different years. The annual velocity profiles are generally similar, with limited interannual variability, especially between 7000 and 14,000 m from the terminus (Figure 7a). The largest interannual changes between 130 and 430 m/y were observed 18,000 m from the glacier terminus with elevation between 4800 and 5200 m. More specifically, in the up-stream, we may distinguish two periods: between 2013 and 2017 the velocity increased slightly, while past 2017, the increase was very large.
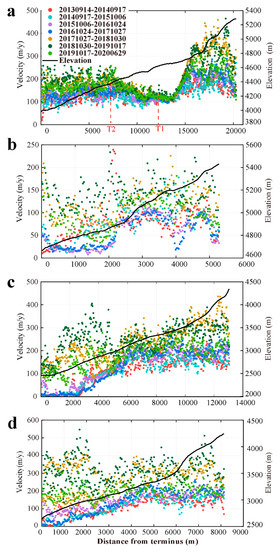
Figure 7.
Annual glacier velocity along the centerline from 2013 to 2020: (a) Yanong Glacier (GLIMS ID G096657E29334N); (b) Parlung No.4 Glacier (GLIMS ID G096920E29228N); (c) Azha (GLIMS ID G096818E29132N); and (d) Xueyougu Glacier (GLIMS ID G096758E29147N). The black line indicates the glacier central line elevation. Red dashed lines mark the tributary glacier location.
In the Parlung No.4 Glacier, the largest velocity was also observed at higher elevation (Figure 7b). The mean ELA of Parlung No.4 Glacier in 2005–2006 and 2006–2007 was about 5396 m [72], with higher velocity in the upper, accumulation zone than in the lower ablation zone (Figure 7b). From the glacier snout to about 2200 m, the velocity gradually increased in 2014–2016, while in 2013–2014 and 2017–2020 the velocity did not change much in the same lower part of the glacier, but increased year after year from 50 to 250 m/y. In the central part of the glacier, i.e., from 2200 to 3500 m, and in the period spanned by the retrievals, the velocity increased to 200 m/y. In the upper part of the glacier, i.e., from 3500 to 5500 m away from the terminus, the velocity varied significantly between 50 and 200 m/y from 2013 to 2020.
The Azha Glacier velocity is increasing from the terminus to the accumulation zone (Figure 7c). In the lower part of the glacier, i.e., from the terminus to 7000 m, the velocity increased significantly over the entire period, reaching 300 m/y in 2018–2019. In the upper section, i.e., between 8000 and 13,000 m from the terminus, the velocity was relatively stable, i.e., between 100 and 200 m/y during 2013–2017, while past 2017 the velocity increased gradually from 200 to 400 m/y.
The velocity pattern in the Xueyougu glacier was similar to Azha (Figure 7d). During 2013–2017, the velocity was relatively stable, i.e., lower than 20 m/y close to the glacier terminus. Further on, the velocity increased gradually from 10 to 230 m/y. At larger distances from the terminus, the velocity did not vary significantly with elevation. After 2017, the centerline velocity increased from 100 to 450 m/y in the entire glacier.
4.4. Seasonal Changes of Glacier Velocity
The analysis of seasonal velocities in the Yanong, Parlung No.4, Azha, and Xueyougu Glaciers revealed additional insights on temporal and spatial changes (Figure 8). As explained in Section 3.2, we have retrieved the total displacement, i.e., the mean velocity, for each available image pair. To estimate summer and winter velocities, we defined two temporal windows, i.e., three dates (see also Figure 2), for each year to sample the summer and winter seasons. The legend in Figure 8 indicates the windows identified by these three dates. This implies that the end of summer coincides with the start of the next winter.
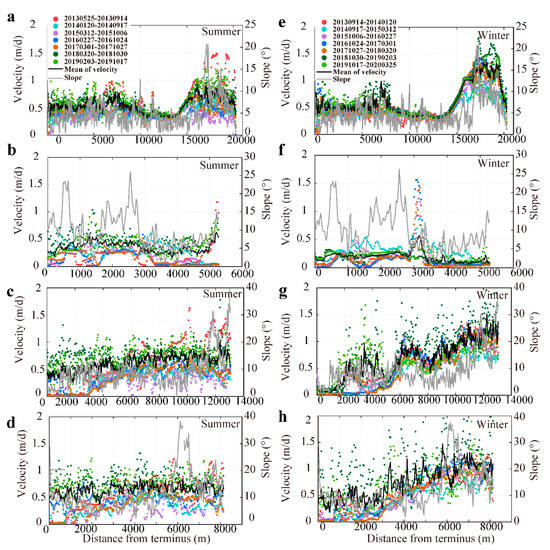
Figure 8.
Summer (left, 2013–2019) and winter (right, 2013–2020) center flowline velocities vs. distance from terminus: Yanong Glacier (a,e) (GLIMS ID G096657E29334N); Parlung No.4 Glacier (b,f) (GLIMS ID G096920E29228N); Azha (c,g) (GLIMS ID G096818E29132N) and Xueyougu Glacier (d,h) (GLIMS ID G096758E29147N); mean of velocity (black solid line).
In the Yanong Glacier (Figure 8a,e), winter and summer profiles are rather similar in the lower 14,000 m of the glacier trunk, including the peak in velocity at the confluence of the tributary glacier (see Figure 4 T1, T2). In the upper part of the glacier, i.e., from 18,000 to 20,000 m from the terminus, velocity increases with increasing slope in both summer and winter, but the increase is larger in winter and it was observed every year. It should be noted that the 2013 summer velocity was significantly higher than in other years at distances of about 8000 and 18,000 m. The first peak of velocity is at 8000 m from the terminus and the speed was about 1.5 m/d. Much higher velocities were observed between 18,000 and 19,000 m location, i.e., in the transition from the accumulation to and ablation zone of the glacier, with the largest difference between summer and winter observed between 15,000 and 21,000 m. In this zone, the summer speed was 1 m/d, while in winter it was almost twice as much, i.e., up to 1.9 m/d. Similar winter velocities were observed every year between 2014 and 2020 at this elevation.
Summer and winter velocities for seven years, i.e., from 2013 till 2020, were also retrieved for the Parlung No.4 Glacier (Figure 8b,f). Overall, differences between summer and winter were smaller than the ones observed in the other glaciers. Compared with the other glaciers, Parlung No.4 is characterized by a smaller range in elevation and by slope being higher and more variable near the terminus (Figure 8b,f). Some fluctuations in the mean velocity were observed, especially in summer and closer to the terminus, i.e., up to 2000 m, with a summer mean velocity of 0.5 m/d. The mean winter velocity shows a peak up to 1.5 m/d between 3000 and 3200 m where interannual variability is very large.
The summer and winter velocity profiles were quite different in the Azha Glacier (Figure 8c,g). In summer (Figure 8c), the interannual variability of the velocity is rather large with mean velocity (black line), around 0.5 m/d in the entire glacier. Higher velocities up to 1.5 m/d were observed between 2017 and 2019, local peaks in velocity, i.e., up to 2 m/d, were observed in 2013 in the upper (accumulation) zone of the glacier. In winter (Figure 8g), the velocity increases with elevation and slope, while interannual variability is relatively small. Higher velocities up to 2 m/d were observed in the year 2017–2018. This seasonal pattern was observed every year between May 2013 and November 2020, although with different magnitudes from year to year.
The velocity pattern in the Xueyougu (Figure 8d,h) is similar to the Azha Glacier. In summer, the mean velocity is about 0.5 m/d throughout the glacier, and interannual variability is large, with slightly higher values observed between 2017 and 2019. Lower velocities were observed in the debris-covered ablation zone (see also [40]). In winter, a clear increase with elevation, i.e., up to 2 m/d, is observed between 3000 and 8000 m from the terminus. Interannual variability was limited, except 2018–2019 when much higher velocities were observed.
4.5. Detailed Analysis of Velocity Profiles
The transverse profiles of stacked inter-annual velocities of the four glaciers are presented in Figure 9, according to [35,44,46]. The Yanong Glacier at Y2, Y3, and Y4 (Figure 9b–d; location marked in Figure 4) shows a parabolic pattern in the increasing velocity from the edges to the center. Similar results were described by Copland et al. [47] and Quincey et al. [44]. Contrariwise, the transect at Y1 across the lower ablation zone (see Figure 9a) shows a rapid increase away from both glacier margins, with velocity being high and relatively constant across most of the glacier (Figure 9a). A completely different pattern in surface velocity was observed across the flow centerline in the Parlung No.4 Glacier (Figure 9e,f, see location in Figure 4). At P1 (see Figure 9e), lower velocities were observed in the center of the glacier and the transect did not match the patterns described above. Interannual variability was large, while the observed transect could not be easily related to a dominant flow mechanism. In the Azha Glacier, the four transects are rather similar (Figure 9g–j) and glacier velocity increased from 2013 to 2019. Transects in the Xueyougu Glacier (Figure 9k–n) are even more complex to interpret because debris cover on this glacier is widespread. The transect at X1 (Figure 9k) is at the glacier terminus, where debris-cover is large. At X2, X3, and X4 (Figure 9l–n), the surface velocity is higher in the center of the glacier.
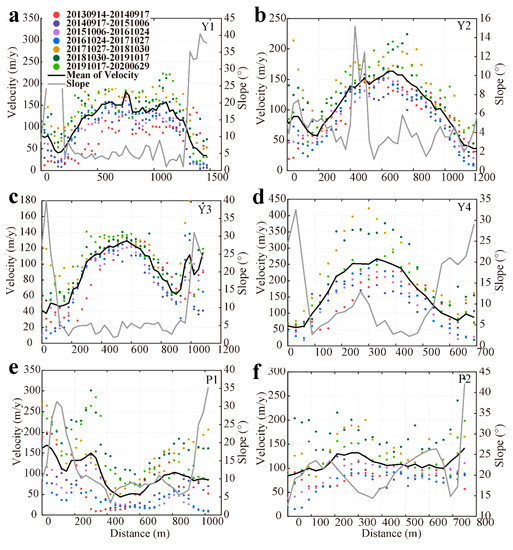
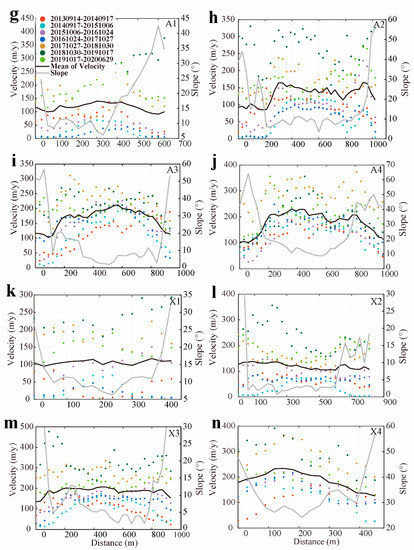
Figure 9.
Transects of surface velocity 2013–2020. Yanong Glacier at: (a) Y1, (b) Y2, (c) Y3, and (d) Y4; Parlung No 4. Glacier at: (e) P1 and (f) P2; Azha Glacier at: (g) A1, (h) A2, (i) A3, and (j) A4; Xueyougu Glacier at: (k) X1, (l) X2, (m) X3, and (n) X4; location of transects shown in Figure 4; Date format is yyyymmdd-yyyymmdd; solid black line is the mean velocity profile.
5. Discussion
5.1. Atmospheric Forcing
The temperature and precipitation are important drivers of glacier dynamics over the PZB [2], and are closely related to monsoon dynamics [2]. With the weakening Indian monsoon in the summer and the strengthening westerlies in the winter [21], atmospheric forcing on the glacier dynamics changes. In general, the response of temperate glaciers in Nyainqentanglha Mountain Range glaciers to the warming climate has been to retreat [73], thin [49], and decelerate [13].
On the one hand, changes in glacier velocity in this region are due to increasing air temperature [2,19]. Increasing evidence on elevation-dependent warming [21] and amplified warming [74] rate in the Tibetan Plateau was retrieved from tree-rings [75] and ice cores [76]. The warming trend at higher elevation is especially pronounced during winter and fall [77]. In the eastern Nyainqentanglha Range, meteorological data show that the rate of warming is higher at higher elevations, i.e., 0.42 °C decade−1 than at lower elevations, i.e., 0.27 °C decade−1. In other words, the glacier accumulation zone is warming faster than the ablation zone [21]. The warming and its elevation dependence have a great impact on the glacier dynamics. The increasing temperature at higher elevation will have an impact on the thermal conditions within and beneath the glacier such as to lead to an unstable glacier ice–bedrock interface, therefore increasing the glacier velocity at higher elevation. Mass loss from glaciers can form supraglacial or proglacial lakes and establish drainage channels, and then the surface meltwater and rainfall penetrate into the glacier and transfer heat to the underlying ice [41,78]. The crevasse formation and thermo-mechanical modeling indicated that basal sliding occurred in the central parts of the Aru Glaciers [79]. We infer that the seasonal variation in velocity we observed was also related to the glacier hydrology, but in situ data are quite limited to draw any firm conclusion.
On the other hand, precipitation is affected by the changing temperature due to variations in monsoon activity [77]. Precipitation observed at the Chinese meteorological stations in the southeastern Tibetan Plateau presents a positive trend: precipitation amounts have increased significantly from 1961 to 2006 [77]. The widespread growth of the region endorheic lakes was caused by increasing precipitation since mid-1990 [80]. In summer, precipitation often falls as rain on the lower parts of the glaciers [17], which will increase glacier velocity. However, newly fallen fresh snow at higher altitudes can increase the albedo, thus reducing melting [17]. The warmer and wetter climate observed at the two nearest meteorological stations (Bomi and Baxiu) (Figure 5a,b) supports surface velocity increases observed in the upper-glacier zones due to mass transfer seasonally. The study region is influenced by the monsoon. We have used both meteorological observations (see Figure 5 and Figure 6) and the full time series of velocity retrievals to define summer, i.e., the wet season, from March to October, and winter, i.e., the dry season, from October to next year March. Seasonal changes in surface velocity have also been observed as expected, e.g., higher velocity in late winter and early spring due to redistribution of mass accumulated by snowfall (Figure 8) [81]. Liu et al. [82] provided region-specific relationships between surface velocities and mass changes in the central Tibetan Plateau. The same authors also observed in most glaciers a pattern of mass loss in the terminus regions, while a slight mass gain was estimated in the central portion interior areas. According to the SCGI, the Equilibrium Line Altitude (ELA) of Yanong Glacier was 5186 m in 2005 [54], with expected large mass transfer around this elevation. The interannual variability is rather large at higher elevations, reflecting the variability of snowfall seasonally. The likely explanation is the winter-spring snowfall at and above this zone. Azha Glacier is similar to Yanong Glacier with higher velocities at high elevation in winter and spring. The evidence provided above on glacier surface velocities suggests extensive accumulation at higher elevation, providing sufficient ice flux to the glacier trunk [27]. Kääb et al. [79] used several DEMs generated with satellite data to observe the glacier ice deformation in Aru glaciers. They found that high-elevation thickening, low-elevation thinning, and terminus retreat led to steeper slopes in the glaciers of western Tibetan Plateau. In Alaskan glaciers similar changes have been related to simultaneous increase of temperature and snowfall [83], causing increased glacier melt and accumulation. Similarly, higher velocities were observed from October to March in the accumulation zone in our study area, while from May to September, the velocity increased in the lower (ablation) zone due to melting. In short, the seasonal snow accumulation does not necessarily indicate a positive mass balance of glaciers.
This study captured the glacier seasonal velocity change in this region and provided some hints about main drivers of glacier flows in different seasons. The mass redistribution responds to the complex terrain [84], so the response of glaciers velocity may differ from place to place, e.g., variability in surface velocity is different in the upper and lower glacier zone. Likewise, the complex terrain determines differences in mass redistribution across glaciers. For example, at 13,000 m from the terminus (Figure 7a T1), we infer that the higher velocity is related to the tributary–trunk interaction, where the southern tributary glacier promotes flow of the main trunk where the two glaciers merge to form one larger stream [85,86]. The location T2 in Figure 7a indicates where the second tributary enters the main trunk from the south.
In addition, the atmospheric aerosols such as black carbon and dust can decrease the albedo of the glacier surface and enhance glacier ablation [87,88]. It has been estimated that impurities causing a reduction in albedo accounts for an average of about 15% of the total glacier melt in the southeast Tibetan Plateau [89].
5.2. Seasonality
Temperate glaciers can display seasonal variations in surface velocity. The interannual centerline profile of Parlung No. 4 Glacier shows a periodic pattern each year. Specifically, the mean summer velocity appears to respond to the steeper and more variable slope in the zone closer to the terminus [41,71,79], although higher summer temperature and melt remain important drivers in this zone.
To estimate the stack velocities for each season, we need to define a specific time interval and apply it to extract all the velocity retrievals included in such time interval (see Section 3.2 for details). We defined summer and winter as explained above, and to assess our definition we have constructed and evaluated time series of stack velocity at selected locations over the entire period of the study, i.e., 2013 to 2020 (Figure 10). Especially the time series in the accumulation zone of the Yanong Glacier confirms that our definition of summer and winter leads to a correct estimation of mean seasonal velocities.
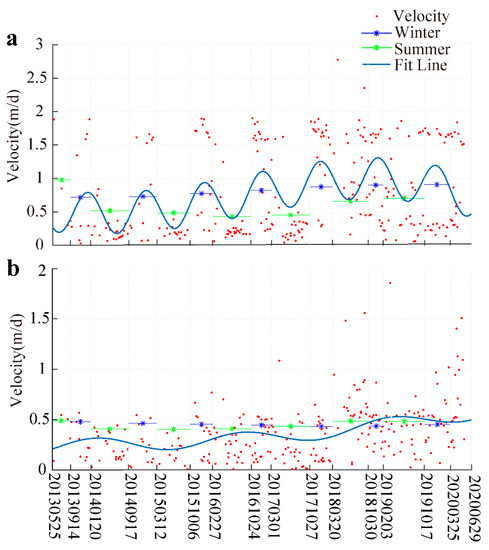
Figure 10.
Surface velocity in the Yanong Glacier at two locations: (a) near the ELA line (Figure 4, S1); (b) near the terminus (Figure 4 S2); data points are velocity retrievals from image pairs acquired in a short time interval; mean summer (green) and winter velocities indicated by dots with horizontal segments indicating the temporal window applied to estimate the mean seasonal velocities (see Figure 2). The blue line has been obtained by fitting a three-terms Fourier series to the observations.
Higher velocities in the upper part of the glacier (Figure 10a) can be explained by a combination of larger snowfall, higher temperature, and larger melt. The evolution of surface velocity in the upper part of the Yanong Glacier (Figure 10a) clearly shows the seasonal oscillation and the increasing multiannual trend. This seems to confirm the combined effect of snowfall and melt on glacier flow [22,27]. Similarly, Sam et al. [84] reported a considerable number of instances in which the pre-melt velocities exceed the melting season velocities at higher elevations and are not due to high melting. Their results indicate the dominance of deformational flow at the regional scale. Closer to the terminus (Figure 10b), the seasonal mean velocity is relatively low, i.e., around 0.5 m/d with slightly higher velocity during the melting season.
To conclude, compared to the long-term average, meteorological conditions during the years covered by this study may have resulted in a trend in seasonal snowfall (see Figure 10a,b), as indicated by the weather station data. The high summer temperature could have generated large glacier melting and triggered sliding processes [23,24,25,26].
5.3. Comparison with Previous Studies
Recent literature suggests that many glaciers in our study area are slowing considerably [13]. Little is known regarding the behavior of individual glaciers in the PZB, and no ground measurements of glacier velocity in the PZB are available. Remote-sensing studies on glacier movement are scarce, thus we also choose some results on glacier velocity in the neighboring regions for comparison.
Wu et al. [41] reported interannual median ice velocities from 10 to 30 m/y below an elevation of 4600 m and from 30 to 46 m/y at elevations between 4600 and 6000 m. Their results showed robust overall trends of −5.26 and 7.16 m y−1 dec−1 at elevations below and above 4600 m a.s.l. during 1991–2018, respectively. These surface velocities trends are in line with our results, in the sense that the slowdown was observed at lower elevation (glacier snout), and an accelerated ice flow was found in the upper portion of glaciers.
Wang [90] applied InSAR (Interferometric Synthetic Aperture Radar) typically Sentinel-1A data to calculate glacier surface velocity in the Tibetan plateau in 2017–2018. They report a velocity of 1.5 m/d in summer for the Yanong Glacier, with higher velocity in the upper part of the glacier. From 11 November 2017 to 25 March 2018, glacier velocity was stable at 1 m/d. From 25 March to 21 September 2018, large fluctuations in glacier velocity were observed, particularly in late summer when the velocity reached 1.5 m/d. Later on, the velocity decreased to 1 m/d and stabilized. Wang [90] also reported that the glacier velocity in the Kangri Karpo was 140–150 m/y, with the peak velocity close to 500 m/y [90]. In our study, the centerline velocity in the Yanong Glacier ranged between 0.4 and ~1.9 m/d seasonally (Figure 8a,e). The interannual profile of Yanong Glaciers shows the maximum velocity at 490 m/y (Figure 7a). The difference between the two findings might be due to the procedure applied to estimate the yearly velocity. Wang [90] used the summer velocity only to estimate the annual velocity, while we averaged summer and winter velocities. Our seasonal result is close to the velocities observed by Wang [90] who suggested that the higher speeds observed in the Yanong Glacier around October 2018 and October 2019 were outliers. In addition, the variation of velocity along the centerline responds also to variations in ice thickening and thinning, also considering the reported ablation rates of –1.1 w.e.y−1 [40]. The centerline velocities between 15,000 and 21,000 m from the terminus range from 0.8 to ~2 m/d during winter, in agreement with to the velocities retrieved by InSAR by Wang [90], which suggests that the higher speeds around October 2017 and October 2018 were anomalies.
Dehecq et al. [13] reported that the most considerable velocity slowdown occurred in the glaciers in the Nyainqentanglha Range was –37.2 ± 1.1% decade−1 during 2000–2017. They claim that a steady and continuous yearly slowdown in this region is related to ice thinning. The mean mass balance in the Nyainqentanglha Region is –0.62 ± 0.23 m w.e.y−1 (meter water-equivalent per year) [91]. In our study, the annual velocity in the Parlung No.4 Glacier is decreasing, whereas velocity is stable or increasing in other glaciers. The difference with our findings might be due to the different temporal coverage. Dehecq et al. [13] studied the period prior to 2015 while we studied the period from 2013 to 2020. Our results indicate that the velocity started to increase in 2017. In our study, the Parlung No.4 Glacier velocity also slowed down during 2013–2017, while after 2017, there was a slight velocity increase, possibly associated with higher temperature as discussed in 5.1. The regional climate change, especially the increase in precipitation, may increase glacier accumulation and cause higher surface velocity during the winter-spring period.
Ke et al. [42] applied feature-tracking to derive detailed motion patterns of glaciers in the Yigong Zangbo Basin during the summer 2007 using SAR data. The Yigong Zangbo and Parlung Zangbo Basins are similarly impacted by the Indian Ocean monsoon. The glacier velocities during the summer are typically greater than those during the other seasons in western China. Ke et al. [42] gave the mean annual velocities of 12 glaciers to be between 15 and 206 m/y, with a maximum summer velocity of 423 m/y [42]. Their result is consistent with the averaged annual velocities between 30 and 287.88 m/y estimated by our study. They also claim that most glaciers display high and low velocities in their upper and lower regions, respectively. The variability in derived velocity is similar to the findings in our study.
Zhang et al. [81] measured ice velocities in the summer of 2008 by differential GPS (DGPS). They measured the displacements of 28 fixed stakes installed in the ablation area and up-stream (at the base of an icefall) of the Hailuogou Glacier and observed a glacier velocity between 41 and 205 m/y, respectively. The Hailuogou Glacier is located in the Hengduan Mountain, with similar monsoon influence in our study region. Our conclusions on velocity are comparable with their in situ measurements, which show higher velocity in the upper glacier and lower velocity in the glacier terminus. This phenomenon is related to the ice flux change, which correlates with the variability in mass accumulation, i.e., increase or decrease in precipitation [92]. Our study provides the seasonal velocity pattern that shows that the upper-stream velocity is higher than in the glacier terminus during winter-spring (see Section 5.3 for details). In addition, their field measurements of velocity illustrate the effect of lateral drag on surface velocity. The glacier velocity reaches the maximum near the center, while it decreases towards margins [81]. Our transverse profile of glacier velocity also shows the pattern due to basal drag (Figure 9a).
As we mentioned in the Introduction, the variation in surface velocity along transverse profiles across the glacier center line reflects dominant motion mechanisms [35,44,46]. Here, a simple visual inspection of the transverse profiles of the mean annual velocity was used to propose our interpretation of such profiles and their relation with glacier flow mechanisms. The Y1 transect (Figure 9a) shows a large interannual variability in glacier surface velocity, which suggests then interannual variability in ice melting and associated basal sliding [93]. Likewise, the parabolic pattern shown in Y2, Y3, Y4 (Figure 9b–d) suggests internal deformation to be the dominant mechanism in glacier flow. The transect at P2 (see Figure 9f) shows a variation in surface velocity somewhat flatter, i.e. nearly constant except in the vicinity of the sides, which suggests that glacier flow is likely to be determined by basal sliding. The transects A2, A3, A4 (Figure 9h–j) also show a flatter velocity profile, which suggests the dominance of basal sliding, in agreement with the findings of [17,94]. The pattern at X2, X3, X4 (Figure 9l–n) suggests basal sliding especially at X2.
Regarding the change in the debris-covered area, the methods used in the 2005 and 2015 delineation of glaciers were different. The debris-covered glaciers were also manually digitized in the Second Chinese Glacier Inventory [53]. Zhang [56] applied the Random Forest classifier to map ice and debris-covered glaciers. On the other hand, glaciers in this region shrank significantly, e.g. [40] observed similar glacier thinning rates between debris-covered glaciers and clean-ice glaciers (−0.50 ± 0.32 m w.e. a−1) but a remarkable mass loss, i.e. −0.89 ± 0.36 m w.e. a−1 in debris-covered glaciers was connected with glacial lakes, which may suggest a different evolution of debris-covered glaciers in the monsoon-influenced region. Accordingly, we tend to conclude that the increase in the debris-covered glacier area was due to geomorphic activities (see also [95]), although the evolution of debris-covered glaciers requires further investigations.
According to [17,94], in the tongue of the Azha Glacier at 3482 m elevation, the annual velocity was 438 m/y while it was 533 m/y in the Minyong Glacier in the Meilixue Mountain. Our summer observations at around 3482 m elevation are at about 8200 m distance from the terminus and gave a 438 m/y (1.2 m/d) velocity. The velocity is the same as determined with field observations.
5.4. Glacier Velocity Relationship with Elevation, Slope, and Glacier Thickness
The long-term (decadal) changes in ice surface velocity can be evaluated in relation with ice thickness and slope [13]. Here, we use simple centerline profiles of four glaciers to illustrate the relationship between retrieved surface velocity, glacier thickness (from RGI 6.0), and terrain slope. The velocity is extracted from the mean velocity from 2013 to 2020. Changes in glacier surface velocity are related to ice thickness, because glacier thickening and steepening increase the gravitational forces acting on the ice and increase the glacier flow [10]. The glacier thickness is relatively low in the steep region (large slope) in four glaciers. In the Yanong Glacier, the velocity was largest where slope is steeper at 18,000–21,000 m (Figure 11a). Glacier velocity varies with slope at distances between 5000–15,000 m from the glacier terminus. The Yanong Glacier was thicker at the lowest slope at 13,000 m, where the ice mass moved down along the steeper slope and accumulated in this region. The Yanong Glacier has a glacier lake at the glacier terminus. The higher velocity in recent years (Figure 7a) suggests glacier thinning in the glacier tongue, leading to the appearance of lakes and a subsequent decline in glacier flow [40].
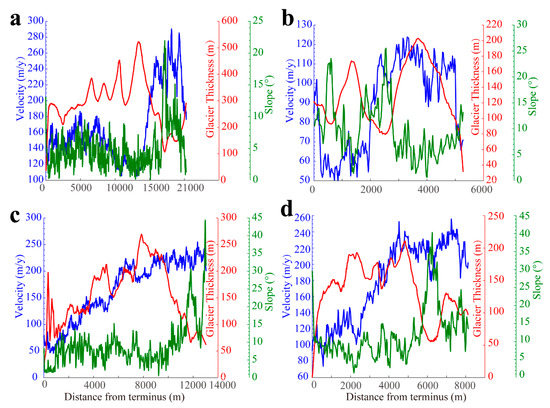
Figure 11.
Annual mean centerline glacier velocity (blue line) versus glacier thickness (red line) versus slope (green line): (a) Yanong Glacier (GLIMS ID G096657E29334N); (b) Parlung No.4 Glacier (GLIMS ID G096920E29228N); (c) Azha (GLIMS ID G096818E29132N); and (d) Xueyougu Glacier (GLIMS ID G096758E29147N).
In the Parlung No.4 Glacier (Figure 11b) velocity seems to respond more to thickness than to slope from 3000 to 6000 m from the terminus. The slope is high at the 3000 m distance and the winter velocity also shows high velocity in the same region (see Figure 8f). It is evident that the mass accumulated during the winter transfers downstreams.
In the Azha and Xueyougu Glaciers (Figure 11c,d), we see a limited effect of slope because both glaciers are thinner where the slope is steeper and the highest velocity is observed where the glacier is thicker. The Azha Glacier velocity correlates with the glacier thickness, although the effect of slope is clearly visible in the upper part of the glacier. The results of our analysis on the response of surface velocity to terrain elevation and slope indicate that the glacier flow is constrained by the valley geometry and terrain complexity at the Azha and Xueyougu Glacier (Figure 7d,e). The mass loss in the Azha Glacier increased from –1.75 m.w.e. y−1 in 2000–2013 to –3.63 m.w.e. y−1 in 2013–2017 [71]. In the Xueyougu Glacier, the mass loss increased from –0.88 to –1.76 m.w.e. y−1 [71]. In addition, the Azha and Xueyougu are largely debris-covered. More investigations into the dynamics of ice-velocity and the evolution of debris-covered glaciers are needed for a better understanding of the behavior of glaciers.
6. Conclusions
This study investigated in detail the spatial pattern and the temporal variability of surface velocity of four glaciers in the Parlung Zangbo Basin by applying the cross-correlation method to Landsat-8 OLI images acquired between June 2013 and June 2020. The results revealed that the larger glaciers flowed faster than the smaller glaciers. The highest surface velocity reached up to 450 m/y and occurred in the Yanong Glacier. We observed patterns in the interannual and seasonal variability of surface velocity. The annual velocity increased slightly from 2017 to 2020, which is contrary to previous studies [13]. The acceleration in the upper portion of glaciers is the main reason. This difference might be attributed to the increasing precipitation after 2017 because the accumulated ice mass is redistributed through changes in glacier flow, which resulted in higher velocities in the upper part of glaciers between October and March. However, changes in snowfall do not necessarily imply a positive mass balance of glaciers in this region. The seasonality in the velocity profiles, along and across the glaciers, reveal seasonal changes in mass transfer within a glacier. The seasonal fluctuations in surface velocity are largest in the upper portion of glaciers, i.e., in the accumulation zone. Finally, we propose an interpretation of the transects of our surface velocity maps at high spatial resolution by relating the velocity profiles to dominant mechanisms driving glacier flow. The upper part of the Yanong Glacier seems to respond more to internal deformation. The Azha and Xueyougu Glaciers are more affected by the slow-down in the debris-covered glacier tongue. Seasonal changes in surface velocity may also be due to melt water retained within the glacier. Due to the absence of in situ measurements, we could not directly assess the influence of drivers such as ice deformation, debris-cover, and water retained at the ice-bed interface. The analysis on the drivers of seasonal and interannual variability in surface velocity requires further studies.
Supplementary Materials
The following are available online at https://www.mdpi.com/2072-4292/13/1/80/s1. Summary of remote sensing imagery used in this study.
Author Contributions
Conceptualization, J.Z., L.J. and M.M.; methodology, J.Z., L.J. and M.M.; software, J.Z.; validation, J.Z.; formal analysis, J.Z., L.J., M.M. and S.R.; investigation, J.Z.; resources, L.J. and M.M.; data curation, J.Z. and L.J.; writing—original draft preparation, J.Z.; writing—review and editing, L.J. and M.M.; visualization, J.Z.; supervision, L.J. and M.M.; project administration, L.J.; funding acquisition, L.J. and M.M. All authors have read and agreed to the published version of the manuscript.
Funding
This work was jointly supported by the Strategic Priority Research Program of the Chinese Academy of Sciences (Grant No. XDA19070102), National Natural Science Foundation of China project (Grant No. 91737205), the Second Tibetan Plateau Scientific Expedition and Research Program (STEP) (Grant No. 2019QZKK0103), the Chinese Academy of Sciences President’s International Fellowship Initiative (Grant No. 2020VTA0001), and the MOST High Level Foreign Expert Program (Grant No. GL20200161002).
Data Availability Statement
The data presented in this study are available on request from the corresponding author.
Acknowledgments
We thank USGS for freely providing SRTM-C DEM and Landsat data. We thank the National Tibetan Plateau Data Center (http://data.tpdc.ac.cn) and China Meteorological Data Service Center for offering the meteorological data.
Conflicts of Interest
The authors declare no conflict of interest.
References
- Bolch, T.; Kulkarni, A.; Kääb, A.; Huggel, C.; Paul, F.; Cogley, J.G.; Frey, H.; Kargel, J.S.; Fujita, K.; Scheel, M.; et al. The State and Fate of Himalayan Glaciers. Science 2012, 336, 310–314. [Google Scholar] [CrossRef] [PubMed]
- Yao, T.; Thompson, L.; Yang, W.; Yu, W.; Gao, Y.; Guo, X.; Yang, X.; Duan, K.; Zhao, H.; Xu, B.; et al. Different glacier status with atmospheric circulations in Tibetan Plateau and surroundings. Nat. Clim. Chang. 2012, 2, 663–667. [Google Scholar] [CrossRef]
- Jacob, T.; Wahr, J.M.; Pfeffer, W.T.; Swenson, S.C. Recent contributions of glaciers and ice caps to sea level rise. Nat. Cell Biol. 2012, 482, 514–518. [Google Scholar] [CrossRef] [PubMed]
- Song, C.; Sheng, Y.; Wang, J.; Ke, L.; Madson, A.; Nie, Y. Heterogeneous glacial lake changes and links of lake expansions to the rapid thinning of adjacent glacier termini in the Himalayas. Geomorphology 2017, 280, 30–38. [Google Scholar] [CrossRef]
- Yu, Y.; Pi, Y.; Yu, X.; Ta, Z.; Sun, L.; Disse, M.; Zeng, F.; Li, Y.; Chen, X.; Yu, R. Climate change, water resources and sustainable development in the arid and semi-arid lands of Central Asia in the past 30 years. J. Arid. Land 2018, 11, 1–14. [Google Scholar] [CrossRef]
- Veh, G.; Korup, O.; Walz, A. Hazard from Himalayan glacier lake outburst floods. Proc. Natl. Acad. Sci. USA 2020, 117, 907–912. [Google Scholar] [CrossRef]
- Haemmig, C.; Huss, M.; Keusen, H.; Hess, J.; Wegmüller, U.; Ao, Z.; Kulubayi, W. Hazard assessment of glacial lake outburst floods from Kyagar glacier, Karakoram mountains, China. Ann. Glaciol. 2014, 55, 34–44. [Google Scholar] [CrossRef]
- Carrivick, J.L.; Tweed, F.S. A global assessment of the societal impacts of glacier outburst floods. Glob. Planet. Chang. 2016, 144, 1–16. [Google Scholar] [CrossRef]
- Ding, M.; Huai, B.; Sun, W.; Wang, Y.; Zhang, D.; Guo, X.; Zhang, T. Surge-type glaciers in Karakoram Mountain and possible catastrophes alongside a portion of the Karakoram Highway. Nat. Hazards 2017, 90, 1017–1020. [Google Scholar] [CrossRef]
- Cuffey, K.M.P. The Physics of Glaciers; Academic Press: Cambridge, MA, USA, 2010. [Google Scholar]
- Wu, K.; Liu, S.; Jiang, Z.; Xu, J.; Wei, J. Glacier mass balance over the central Nyainqentanglha Range during recent decades derived from remote-sensing data. J. Glaciol. 2019, 65, 422–439. [Google Scholar] [CrossRef]
- Wang, P.; Li, Z.; Xu, C.; Xing, W.; Zhou, P.; Zhang, H. Multi-decadal variations in glacier flow velocity and the influencing factors of Urumqi Glacier No. 1 in Tianshan Mountains, Northwest China. J. Arid. Land 2017, 9, 900–910. [Google Scholar] [CrossRef][Green Version]
- Dehecq, A.; Gourmelen, N.; Gardner, A.; Brun, F.; Goldberg, D.; Nienow, P.W.; Berthier, E.; Vincent, C.; Wagnon, P.; Trouve, E. Twenty-first century glacier slowdown driven by mass loss in High Mountain Asia. Nat. Geosci. 2019, 12, 22–27. [Google Scholar] [CrossRef]
- Mayer, C.; Fowler, A.C.; Lambrecht, A.; Scharrer, K. A surge of North Gasherbrum Glacier, Karakoram, China. J. Glaciol. 2011, 57, 904–916. [Google Scholar] [CrossRef]
- Yang, W.; Yao, T.; Xu, B.; Ma, L.; Wang, Z.; Wan, M. Characteristics of recent temperate glacier fluctuations in the Parlung Zangbo River basin, southeast Tibetan Plateau. Chin. Sci. Bull. 2010, 55, 2097–2102. [Google Scholar] [CrossRef]
- Shi, Y.; Liu, S. Estimation on the response of glaciers in China to the global warming in the 21st century. Chin. Sci. Bull. 2000, 45, 668–672. [Google Scholar] [CrossRef]
- Su, Z.; Shi, Y. Response of monsoonal temperate glaciers to global warming since the Little Ice Age. Quat. Int. 2002, 123–131. [Google Scholar] [CrossRef]
- Fujita, K. Effect of precipitation seasonality on climatic sensitivity of glacier mass balance. Earth Planet. Sci. Lett. 2008, 276, 14–19. [Google Scholar] [CrossRef]
- Yao, T.; Xue, Y.; Chen, D.; Chen, F.; Thompson, L.; Cui, P.; Koike, T.; Lau, W.K.-M.; Lettenmaier, D.; Mosbrugger, V.; et al. Recent Third Pole’s Rapid Warming Accompanies Cryospheric Melt and Water Cycle Intensification and Interactions between Monsoon and Environment: Multidisciplinary Approach with Observations, Modeling, and Analysis. Bull. Am. Meteorol. Soc. 2019, 100, 423–444. [Google Scholar] [CrossRef]
- Maussion, F.; Scherer, D.; Mölg, T.; Collier, E.; Curio, J.; Finkelnburg, R. Precipitation Seasonality and Variability over the Tibetan Plateau as Resolved by the High Asia Reanalysis. J. Clim. 2014, 27, 1910–1927. [Google Scholar] [CrossRef]
- Ji, Q.; Yang, T.-B.; Dong, J.; He, Y. Glacier variations in response to climate change in the eastern Nyainqêntanglha Range, Tibetan Plateau from 1999 to 2015. Arct. Antarct. Alp. Res. 2018, 50, e1435844. [Google Scholar] [CrossRef]
- Vijay, S.; Khan, S.A.; Kusk, A.; Solgaard, A.M.; Moon, T.; Bjørk, A.A. Resolving Seasonal Ice Velocity of 45 Greenlandic Glaciers with Very High Temporal Details. Geophys. Res. Lett. 2019, 46, 1485–1495. [Google Scholar] [CrossRef]
- Sole, A.J.; Nienow, P.; Bartholomew, I.; Mair, D.; Cowton, T.; Tedstone, A.J.; King, M.A. Winter motion mediates dynamic response of the Greenland Ice Sheet to warmer summers. Geophys. Res. Lett. 2013, 40, 3940–3944. [Google Scholar] [CrossRef]
- Moon, D.T.; Joughin, I.; Smith, B.; Broeke, M.R.V.D.; Van De Berg, W.J.; Noël, B.; Usher, M. Distinct patterns of seasonal Greenland glacier velocity. Geophys. Res. Lett. 2014, 41, 7209–7216. [Google Scholar] [CrossRef] [PubMed]
- Armstrong, W.H.; Anderson, R.S.; Fahnestock, M.A. Spatial Patterns of Summer Speedup on South Central Alaska Glaciers. Geophys. Res. Lett. 2017, 44, 9379–9388. [Google Scholar] [CrossRef]
- Burgess, E.W.; Larsen, C.F.; Forster, R.R. Summer melt regulates winter glacier flow speeds throughout Alaska. Geophys. Res. Lett. 2013, 40, 6160–6164. [Google Scholar] [CrossRef]
- Kenner, R.; Phillips, M.; Beutel, J.; Hiller, M.; Limpach, P.; Pointner, E.; Volken, M. Factors Controlling Velocity Variations at Short-Term, Seasonal and Multiyear Time Scales, Ritigraben Rock Glacier, Western Swiss Alps. Permafr. Periglac. Process. 2017, 28, 675–684. [Google Scholar] [CrossRef]
- Berthier, E.; Vadon, H.; Baratoux, D.; Arnaud, Y.; Vincent, C.; Feigl, K.; Rémy, F.; Legresy, B. Surface motion of mountain glaciers derived from satellite optical imagery. Remote Sens. Environ. 2005, 95, 14–28. [Google Scholar] [CrossRef]
- Neckel, N.; Loibl, D.; Rankl, M. Recent slowdown and thinning of debris-covered glaciers in south-eastern Tibet. Earth Planet. Sci. Lett. 2017, 464, 95–102. [Google Scholar] [CrossRef]
- Sun, J.; Yang, K.; Guo, W.; Wang, Y.; He, J.; Lu, H. Why Has the Inner Tibetan Plateau Become Wetter since the Mid-1990s? J. Clim. 2020, 33, 8507–8522. [Google Scholar] [CrossRef]
- Aoyama, Y.; Doi, K.; Shibuya, K.; Ohta, H.; Tsuwa, I. Near real-time monitoring of flow velocity and direction in the floating ice tongue of the Shirase Glacier using low-cost GPS buoys. Earth Planets Space 2013, 65, 103–108. [Google Scholar] [CrossRef]
- Ponton, F.; Trouve, E.; Gay, M.; Walpersdorf, A.; Fallourd, R.; Nicolas, J.M.; Vernier, F.; Mugnier, J.L. Observation of the Argentiere Glacier Flow Variability from 2009 to 2011 by TerraSAR-X and GPS Displacement Measurements. IEEE J. Stars 2014, 7, 3274–3284. [Google Scholar] [CrossRef]
- Fahnestock, M.A.; Scambos, T.A.; Moon, T.; Gardner, A.S.; Haran, T.M.; Klinger, M. Rapid large-area mapping of ice flow using Landsat 8. Remote Sens. Environ. 2016, 185, 84–94. [Google Scholar] [CrossRef]
- Leprince, S.; Ayoub, F.; Klinger, Y.; Avouac, J. Co-Registration of Optically Sensed Images and Correlation (COSI-Corr): An Operational Methodology for Ground Deformation Measurements. In Proceedings of the 2007 IEEE International Geoscience and Remote Sensing Symposium, Barcelona, Spain, 23–28 July 2007; pp. 1943–1946. [Google Scholar]
- Sun, Y.L.; Jiang, L.; Liu, L.; Sun, Y.; Wang, H. Spatial-Temporal Characteristics of Glacier Velocity in the Central Karakoram Revealed with 1999–2003 Landsat-7 ETM+ Pan Images. Remote Sens. 2017, 9, 1064. [Google Scholar] [CrossRef]
- Fu, X.; Li, Z.; Zhou, J. Characterizing the surge behavior of Alakesayi Glacier in the West Kunlun Shan, Northwestern Tibetan Plateau, from remote-sensing data between 2013 and 2018. J. Glaciol. 2019, 65, 168–172. [Google Scholar] [CrossRef]
- Quincey, D.J.; Glasser, N.F.; Cook, S.J.; Luckman, A. Heterogeneity in Karakoram glacier surges. J. Geophys. Res. Earth Surf. 2015, 120, 1288–1300. [Google Scholar] [CrossRef]
- Dehecq, A.; Gourmelen, N.; Trouve, E. Deriving large-scale glacier velocities from a complete satellite archive: Application to the Pamir–Karakoram–Himalaya. Remote Sens. Environ. 2015, 162, 55–66. [Google Scholar] [CrossRef]
- Joughin, I.; Smith, B.E.; Abdalati, W. Glaciological advances made with interferometric synthetic aperture radar. J. Glaciol. 2010, 56, 1026–1042. [Google Scholar] [CrossRef]
- Ke, L.; Song, C.; Yong, B.; Lei, Y.; Ding, X. Which heterogeneous glacier melting patterns can be robustly observed from space? A multi-scale assessment in southeastern Tibetan Plateau. Remote Sens. Environ. 2020, 242, 111777. [Google Scholar] [CrossRef]
- Wu, K.; Liu, S.; Zhu, Y.; Liu, Q.; Jiang, Z. Dynamics of glacier surface velocity and ice thickness for maritime glaciers in the southeastern Tibetan Plateau. J. Hydrol. 2020, 590, 125527. [Google Scholar] [CrossRef]
- Ke, C.-Q.; Kou, C.; Ludwig, R.; Qin, X. Glacier velocity measurements in the eastern Yigong Zangbo basin, Tibet, China. J. Glaciol. 2013, 59, 1060–1068. [Google Scholar] [CrossRef]
- Scambos, T.F.M.; Moon, T.; Gardner, A.S.; Klinger, M. Global Land Ice Velocity Extraction from Landsat 8 (GoLIVE); NSIDC: Boulder, CO, USA, 2016. [Google Scholar]
- Quincey, D.; Copland, L.; Mayer, C.; Bishop, M.; Luckman, A.; Belo, M. Ice velocity and climate variations for Baltoro Glacier, Pakistan. J. Glaciol. 2009, 55, 1061–1071. [Google Scholar] [CrossRef]
- Paul, F.; Bolch, T.; Kääb, A.; Nagler, T.; Nuth, C.; Scharrer, K.; Shepherd, A.; Strozzi, T.; Ticconi, F.; Bhambri, R.; et al. The glaciers climate change initiative: Methods for creating glacier area, elevation change and velocity products. Remote Sens. Environ. 2015, 162, 408–426. [Google Scholar] [CrossRef]
- Shi, J.; Menenti, M. Monitoring recent variations of the surface displacements of eight Nyainqêntanglha glaciers. Hydrol. Earth Syst. Sci. Discuss. 2014, 11, 1555–1581. [Google Scholar] [CrossRef]
- Copland, L.; Pope, S.; Bishop, M.P.; Shroder, J.F.; Clendon, P.; Bush, A.; Kamp, U.; Seong, Y.B.; Owen, L.A. Glacier velocities across the central Karakoram. Ann. Glaciol. 2009, 50, 41–49. [Google Scholar] [CrossRef]
- Yang, W.; Yao, T.; Guo, X.; Zhu, M.; Li, S.; Kattel, D.B. Mass balance of a maritime glacier on the southeast Tibetan Plateau and its climatic sensitivity. J. Geophys. Res. Atmos. 2013, 118, 9579–9594. [Google Scholar] [CrossRef]
- Wu, K.; Liu, S.-Y.; Jiang, Z.; Xu, J.; Wei, J.; Guo, W.Q. Recent glacier mass balance and area changes in the Kangri Karpo Mountains from DEMs and glacier inventories. Cryosphere 2018, 12, 103–121. [Google Scholar] [CrossRef]
- USGS. Earth Explorer. Available online: https://earthexplorer.usgs.gov/ (accessed on 1 October 2017).
- Scherler, D.; Leprince, S.; Strecker, M. Glacier-surface velocities in alpine terrain from optical satellite imagery—Accuracy improvement and quality assessment. Remote Sens. Environ. 2008, 112, 3806–3819. [Google Scholar] [CrossRef]
- Lv, M.; Guo, H.; Lu, X.; Liu, G.; Yan, S.; Ruan, Z.; Ding, Y.; Quincey, D.J. Characterizing the behaviour of surge- and non-surge-type glaciers in the Kingata Mountains, eastern Pamir, from 1999 to 2016. Cryosphere 2019, 13, 219–236. [Google Scholar] [CrossRef]
- Sam, L.; Bhardwaj, A.; Singh, S.; Kumar, R. Remote sensing flow velocity of debris-covered glaciers using Landsat 8 data. Prog. Phys. Geogr. Earth Environ. 2015, 40, 305–321. [Google Scholar] [CrossRef]
- Guo, W.; Liu, S.; Xu, J.; Wu, L.; Shangguan, D.; Yao, X.; Wei, J.; Bao, W.; Yu, P.; Liu, Q.; et al. The second Chinese glacier inventory: Data, methods and results. J. Glaciol. 2015, 61, 357–372. [Google Scholar] [CrossRef]
- RGI Consortium. Randolph Glacier Inventory—A Dataset of Global Glacier Outlines: Version 6.0: Technical Report, Global Land Ice Measurements from Space; RGI Digital Media: Boulder, CO, USA, 2017. [Google Scholar]
- Zhang, J.; Jia, L.; Menenti, M.; Hu, G. Glacier Facies Mapping Using a Machine-Learning Algorithm: The Parlung Zangbo Basin Case Study. Remote Sens. 2019, 11, 452. [Google Scholar] [CrossRef]
- Sevestre, H.; Benn, D.I. Climatic and geometric controls on the global distribution of surge-type glaciers: Implications for a unifying model of surging. J. Glaciol. 2015, 61, 646–662. [Google Scholar] [CrossRef]
- Luo, L. Meteorological Observation Data from the Integrated Observation and Research Station of the Alpine Environment in Southeast Tibet (2007–2017); National Tibetan Plateau Data Center: Beijing, China, 2018. [Google Scholar]
- Ke, L.; Ding, X.; Zhang, L.; Hu, J.; Shum, C.K.; Lu, Z. Compiling a new glacier inventory for southeastern Qinghai–Tibet Plateau from Landsat and PALSAR data. J. Glaciol. 2016, 62, 579–592. [Google Scholar] [CrossRef]
- Nuimura, T.; Sakai, A.; Taniguchi, K.; Nagai, H.; Lamsal, D.; Fujita, S.; Kozawa, A.; Hoshina, Y.; Takenaka, S.; Omiya, S.; et al. The GAMDAM glacier inventory: A quality-controlled inventory of Asian glaciers. Cryosphere 2015, 9, 849–864. [Google Scholar] [CrossRef]
- Leprince, S.; Barbot, S.; Ayoub, F.; Avouac, J.-P. Automatic and Precise Orthorectification, Coregistration, and Subpixel Correlation of Satellite Images, Application to Ground Deformation Measurements. IEEE Trans. Geosci. Remote Sens. 2007, 45, 1529–1558. [Google Scholar] [CrossRef]
- Lv, M.; Guo, H.; Yan, J.; Wu, K.; Liu, G.; Lu, X.; Ruan, Z.; Yan, S. Distinguishing Glaciers between Surging and Advancing by Remote Sensing: A Case Study in the Eastern Karakoram. Remote Sens. 2020, 12, 2297. [Google Scholar] [CrossRef]
- Paul, F.; Bolch, T.; Briggs, K.; Kääb, A.; McMillan, M.; McNabb, R.; Nagler, T.; Nuth, C.; Rastner, P.; Strozzi, T.; et al. Error sources and guidelines for quality assessment of glacier area, elevation change, and velocity products derived from satellite data in the Glaciers_cci project. Remote Sens. Environ. 2017, 203, 256–275. [Google Scholar] [CrossRef]
- Ryder, I.; Bürgmann, R. Spatial variations in slip deficit on the central San Andreas Fault from InSAR. Geophys. J. Int. 2008, 175, 837–852. [Google Scholar] [CrossRef]
- Yasuda, T.; Furuya, M. Short-term glacier velocity changes at West Kunlun Shan, Northwest Tibet, detected by Synthetic Aperture Radar data. Remote Sens Environ 2013, 128, 87–106. [Google Scholar] [CrossRef]
- Pritchard, H.D.; Murray, T.; Luckman, A.; Strozzi, T.; Barr, S. Glacier surge dynamics of Sortebræ, east Greenland, from synthetic aperture radar feature tracking. J. Geophys. Res. Space Phys. 2005, 110, 03005. [Google Scholar] [CrossRef]
- Koblet, T.G.-R.; Zemp, M.; Jansson, P.; Thee, P.; Haeberli, W.; Holmlund, P. Reanalysis of Multi-Temporal Aerial Images of Storglaciären, Sweden (1959–99)—Part 1: Determination of Length, Area, and Volume Changes. Cryosphere 2020, 4, 333–343. [Google Scholar] [CrossRef]
- Bolch, T.; Pieczonka, T.; Benn, D.I. Multi-decadal mass loss of glaciers in the Everest area (Nepal Himalaya) derived from stereo imagery. Cryosphere 2011, 5, 349–358. [Google Scholar] [CrossRef]
- Jiskoot, H. Tributary Glaciers. In Encyclopedia of Snow, Ice and Glaciers; Singh, V.P., Singh, P., Haritashya, U.K., Eds.; Springer: Dordrecht, The Netherlands, 2011; pp. 1209–1210. [Google Scholar]
- Usman, M.; Furuya, M. Interannual modulation of seasonal glacial velocity variations in the Eastern Karakoram detected by ALOS-1/2 data. J. Glaciol. 2018, 64, 465–476. [Google Scholar] [CrossRef]
- Ren, S.; Menenti, M.; Jia, L.; Zhang, J.; Zhang, J.; Li, X. Glacier Mass Balance in the Nyainqentanglha Mountains between 2000 and 2017 Retrieved from ZiYuan-3 Stereo Images and the SRTM DEM. Remote Sens. 2020, 12, 864. [Google Scholar] [CrossRef]
- Yao, T.; Li, Z.; Yang, W.; Guo, X.; Zhu, L.; Kang, S.; Wu, Y.; Yu, W. Glacial distribution and mass balance in the Yarlung Zangbo River and its influence on lakes. Chin. Sci. Bull. 2010, 55, 2072–2078. [Google Scholar] [CrossRef]
- Li, Y.J.; Ding, Y.J.; Shangguan, D.H.; Wang, R.J. Regional differences in global glacier retreat from 1980 to 2015. Adv. Clim. Chang. Res. 2019, 10, 203–213. [Google Scholar] [CrossRef]
- Li, X.; Wang, L.; Guo, X.; Chen, D. Does summer precipitation trend over and around the Tibetan Plateau depend on elevation? Int. J. Clim. 2017, 37, 1278–1284. [Google Scholar] [CrossRef]
- Liu, Y.; An, Z.; Linderholm, H.W.; Chen, D.; Song, H.; Cai, Q.; Sun, J.; Tian, H. Annual temperatures during the last 2485 years in the mid-eastern Tibetan Plateau inferred from tree rings. Sci. China Ser. D Earth Sci. 2009, 52, 348–359. [Google Scholar] [CrossRef]
- Yao, T.; Jiao, K.; Tian, L.; Yang, Z.; Shi, W.; Thompson, L.G. Climatic variations since the Little Ice Age recorded in the Guliya Ice Core. Sci. China Ser. D Earth Sci. 1996, 39, 587–596. [Google Scholar]
- Li, L.; Yang, S.; Wang, Z.; Zhu, X.; Tang, H. Evidence of Warming and Wetting Climate over the Qinghai-Tibet Plateau. Arct. Antarct. Alp. Res. 2010, 42, 449–457. [Google Scholar] [CrossRef]
- Irvine-Fynn, T.D.L.; Hodson, A.J.; Moorman, B.J.; Vatne, G.; Hubbard, A.L. Polythermal Glacier Hydrology: A Review. Rev. Geophys. 2011, 49. [Google Scholar] [CrossRef]
- Kääb, A.; Leinss, S.; Gilbert, A.; Bühler, Y.; Gascoin, S.; Evans, S.G.; Bartelt, P.; Berthier, E.; Brun, F.; Chao, W.-A.; et al. Massive collapse of two glaciers in western Tibet in 2016 after surge-like instability. Nat. Geosci. 2018, 11, 114–120. [Google Scholar] [CrossRef]
- Zhang, G.; Yao, T.; Dai, C.; Yi, S.; Yang, K.; Xie, H.; Feng, W.; Bolch, T.; Wang, L.; Behrangi, A.; et al. Lake volume and groundwater storage variations in Tibetan Plateau’s endorheic basin. Geophys. Res. Lett. 2017, 44, 5550–5560. [Google Scholar] [CrossRef]
- Zhang, Y.; Fujita, K.; Liu, S.; Liu, Q.; Wang, X. Multi-decadal ice-velocity and elevation changes of a monsoonal maritime glacier: Hailuogou glacier, China. J. Glaciol. 2010, 56, 65–74. [Google Scholar] [CrossRef]
- Liu, L.; Jiang, L.M.; Sun, Y.F.; Wang, H.S.; Yi, C.L.; Hsu, H.S. Morphometric Controls on Glacier Mass Balance of the Puru-ogangri Ice Field, Central Tibetan Plateau. Water 2016, 8, 496. [Google Scholar] [CrossRef]
- Berthier, E.; Schiefer, E.; Clarke, G.K.C.; Menounos, B.; Remy, F. Contribution of Alaskan glaciers to sea-level rise derived from satellite imagery. Nat. Geosci. 2010, 3, 92–95. [Google Scholar] [CrossRef]
- Sam, L.; Bhardwaj, A.; Kumar, R.; Buchroithner, M.F.; Martín-Torres, F.J. Heterogeneity in topographic control on velocities of Western Himalayan glaciers. Sci. Rep. 2018, 8, 1–16. [Google Scholar] [CrossRef]
- Scherler, D.; Strecker, M.R. Large surface velocity fluctuations of Biafo Glacier, central Karakoram, at high spatial and temporal resolution from optical satellite images. J. Glaciol. 2012, 58, 569–580. [Google Scholar] [CrossRef]
- Hewitt, K. Tributary glacier surges: An exceptional concentration at Panmah Glacier, Karakoram Himalaya. J. Glaciol. 2007, 53, 181–188. [Google Scholar] [CrossRef]
- Qu, B.; Ming, J.; Kang, S.-C.; Zhang, G.-S.; Li, Y.-W.; Li, C.-D.; Zhao, S.-Y.; Ji, Z.-M.; Cao, J.-J. The decreasing albedo of the Zhadang glacier on western Nyainqentanglha and the role of light-absorbing impurities. Atmos. Chem. Phys. Discuss. 2014, 14, 11117–11128. [Google Scholar] [CrossRef]
- Yao, T. A comprehensive study of Water-Ecosystem-Human activities reveals unbalancing Asian Water Tower and accompanying potential risks. Chin. Sci. Bull. 2019, 64, 2761–2762. [Google Scholar] [CrossRef]
- Zhang, Y.; Kang, S.; Cong, Z.; Schmale, J.; Sprenger, M.; Li, C.; Yang, W.; Gao, T.-G.; Sillanpää, M.; Li, X.; et al. Light-absorbing impurities enhance glacier albedo reduction in the southeastern Tibetan plateau. J. Geophys. Res. Atmos. 2017, 122, 6915–6933. [Google Scholar] [CrossRef]
- Wang, S.Z. Estimation of Glacier Velocity over Tibetan Plateau. Ph.D. Thesis, School of Geographic and Oceanographic Sciences, Nanjing University, Nanjing, China, 2019. [Google Scholar]
- Brun, F.; Berthier, E.; Wagnon, P.; Kääb, A.; Treichler, D. A spatially resolved estimate of High Mountain Asia glacier mass balances from 2000 to 2016. Nat. Geosci. 2017, 10, 668–673. [Google Scholar] [CrossRef]
- Vincent, C.; Soruco, A.; Six, D.; Le Meur, E. Glacier thickening and decay analysis from 50 years of glaciological observations performed on Glacier d’Argentière, Mont Blanc area, France. Ann. Glaciol. 2009, 50, 73–79. [Google Scholar] [CrossRef]
- Satyabala, S. Spatiotemporal variations in surface velocity of the Gangotri glacier, Garhwal Himalaya, India: Study using synthetic aperture radar data. Remote Sens. Environ. 2016, 181, 151–161. [Google Scholar] [CrossRef]
- Zheng, B.; Zhao, X.; Li, T.; Wang, C. Features and fluctuation of the Melang Glacier in the Msinri Mountain. J. Glaciol. Geocryol. 1999, 21, 145–150. [Google Scholar]
- Lu, Y.; Zhang, Z.; Huang, D. Glacier Mapping Based on Random Forest Algorithm: A Case Study over the Eastern Pamir. Water 2020, 12, 3231. [Google Scholar] [CrossRef]
Publisher’s Note: MDPI stays neutral with regard to jurisdictional claims in published maps and institutional affiliations. |
© 2020 by the authors. Licensee MDPI, Basel, Switzerland. This article is an open access article distributed under the terms and conditions of the Creative Commons Attribution (CC BY) license (http://creativecommons.org/licenses/by/4.0/).