Article

Identification of Wheat Yellow Rust Using Spectral and Texture Features of Hyperspectral Images

1
Key Laboratory of Digital Earth Science, Aerospace Information Research Institute, Chinese Academy of Sciences, Beijing 100094, China
2
University of Chinese Academy of Sciences, Beijing 100190, China
3
Key Laboratory of Earth Observation, Hainan Province, Sanya 572029, China
4
Collaborative Innovation Center on Forecast and Evaluation of Meteorological Disasters, Nanjing University of Information Science & Technology, Nanjing 210044, China
*
Author to whom correspondence should be addressed.
Remote Sens. 2020, 12(9), 1419; https://doi.org/10.3390/rs12091419
Submission received: 29 March 2020 / Revised: 28 April 2020 / Accepted: 28 April 2020 / Published: 30 April 2020
(This article belongs to the Special Issue Plant Phenotyping for Disease Detection)

Abstract

:
Wheat yellow rust is one of the most destructive diseases in wheat production and significantly affects wheat quality and yield. Accurate and non-destructive identification of yellow rust is critical to wheat production management. Hyperspectral imaging technology has proven to be effective in identifying plant diseases. We investigated the feasibility of identifying yellow rust on wheat leaves using spectral features and textural features (TFs) of hyperspectral images. First, the hyperspectral images were preprocessed, and healthy and yellow rust-infected samples were obtained by creating regions of interest. Second, the extraction of spectral reflectance characteristics and vegetation indices (VIs) were performed from the preprocessed hyperspectral images, and the TFs were extracted using the grey-level co-occurrence matrix from the images transformed by principal component analysis. Third, the successive projections algorithm was employed to choose the optimum wavebands (OWs), and correlation-based feature selection was employed to select the optimal VIs and TFs (those most sensitive to yellow rust and having minimal redundancy between features). Finally, identification models of wheat yellow rust were established using a support vector machine and different features. Six OWs (538, 598, 689, 702, 751, and 895 nm), four VIs (nitrogen reflectance index, photochemical reflectance index, greenness index, and anthocyanin reflectance index), and four TFs (correlation 1, correlation 2, entropy 2, and second moment 3) were selected. The identification models based on the OWs, VIs, and TFs provided overall accuracies of 83.3%, 89.5%, and 86.5%, respectively. The TF results were especially encouraging. The models with the combination of spectral features and TFs exhibited better performance than those using the spectral features or TFs alone. The accuracies of the models with the combined features (OWs and TFs, Vis, and TFs) were 90.6% and 95.8%, respectively. These values were 7.3% and 6.3% higher, respectively, than those of the models using only the OWs or VIs. The model with the combined feature (VIs and TFs) had the highest accuracy (95.8%) and was used to map the yellow rust lesions on wheat leaves with different damage levels. The results showed that the yellow rust lesions on the leaves could be identified accurately. Overall, the combination of spectral features and TFs of hyperspectral images significantly improved the identification accuracy of wheat yellow rust.

Graphical Abstract

1. Introduction

Wheat yellow rust, caused by Puccinia striiformis f. sp. tritici (Pst), is an epidemic disease, which significantly reduces wheat yield and quality [1]. In epidemic years, yellow rust can reduce wheat yields by 10–30% or even by 100% if infection occurs under the right conditions [2]. Wheat yellow rust has occurred in more than 60 countries on five continents worldwide, and China is one of the countries most affected by the yellow rust of wheat [3]. Yellow rust causes substantial wheat yield loss in China annually, and the total loss in years with extensive damage (1950, 1964, 1990, 2002, and 2017) was about 13.8 billion kg [4]. A common method for controlling crop diseases is spraying pesticides, which requires the accurate identification of crop diseases. Otherwise, abuse or excessive use of pesticides may occur, resulting in losses of crop yield or soil pollution [5]. Traditionally, visual inspection is the most common method for monitoring and detecting wheat yellow rust in the field, but this method has many disadvantages because it is labor- and time-consuming and subjective. In recent years, remote sensing technology has made great progress in various applications, including the monitoring of plant diseases. Through the efforts of many researchers, plant disease monitoring by remote sensing has become a viable alternative.
Hyperspectral imaging, a relatively new non-destructive detection technique, has been proved to be useful for monitoring plant diseases in recent years [6]. Hyperspectral imaging provides spectral information on the internal properties of the target (e.g., biochemical composition and cellular structure) and spatial information, such as texture, shape, and color. Several studies on the detection of crop diseases using hyperspectral imaging were conducted. For instance, Yao et al. [7] successfully detected the early symptoms of wheat yellow rust in hyperspectral images using spectral bands chosen using the successive projections algorithm (SPA); the results indicated that yellow rust could be identified at least three days before symptoms appeared. Based on sensitive bands of hyperspectral images, Yao et al. [8] established models for identifying wheat powdery mildew and yellow rust using a least-squares support vector machine (SVM) and extreme learning machine; the identification accuracy of the all models was above 94.58% in this research. Bauriegel et al. [9] used the spectral angle mapper to detect fusarium head blight on wheat and mapped the severity of the disease using chlorophyll fluorescence imaging at multiple stages based on hyperspectral images. Furthermore, Bauriegel et al. [10] developed an index (head blight index) to identify early infection of wheat ears by fusarium head blight; the index exhibited good performance under outdoor conditions. Shi et al. [11] developed a model using the wavelet features extracted from the hyperspectral images for identifying yellow rust on wheat leaves and successfully extracted the lesions of leaves at different times of infection. In addition to ground-based use of hyperspectral images, airborne hyperspectral imaging was also used for crop disease monitoring. Huang et al. [12] quantified yellow rust levels of wheat at the field scale by extracting the photochemical reflectance index (PRI) from airborne hyperspectral imagery. The above studies yielded good results but only focused on the spectral information of the hyperspectral images for monitoring and detection of crop diseases. The spatial information (i.e., texture) of hyperspectral images also contains much information related to diseases, but most studies have not considered this information.
Texture, which describes the spatial distribution of brightness in adjacent pixels, is an important feature in an image [13]. Texture provides information on the spatial arrangement of the intensity of the image pixels, and different objects can be distinguished based on different texture features (TF) [14]. When plant leaves are infected by diseases, changes are caused not only in the physiological and biochemical characteristics of the leaves but also in the external characteristics, such as leaf color, texture, and morphology [15]. Previous studies have used the spatial characteristics of images to monitor plant diseases. For instance, Xie and He [16] successfully established the identification models of diseases on eggplant leaves using TFs of hyperspectral images; the results showed that the classification rates (CRs) of all models were higher than 88.46%. Pydipati et al. [17] created a model for detecting citrus disease based on TFs; the accuracy of the model was 95%. Ram et al. [18] successfully classified blotch, rot, and scab diseases of apples using spatial features (color, texture, and shape) of images; the results showed that color and texture provided good performance, but the shape features did not perform well.
The combination of spectral features and TFs provided good results for monitoring crop diseases. For example, Al-Saddik et al. [19] obtained good results for detecting yellowness and esca on grapevine leaves using the combination of TFs extracted from red, green, blue (RGB)images and spectral data; the overall accuracy (OA) was 99% for both diseases. Zhu et al. [20] used the SPA and machine-learning classifiers to detect tobacco diseases using a combination of spectral features and TFs from hyperspectral images; the models using the combination of spectral features and TFs obtained better results (classification accuracies higher than 80%) than those using only spectral or TFs. The above studies demonstrate that it is feasible to monitor crop diseases using spectral features, TFs, and the combination of both features. Although the studies using the combination of spectral features and TFs to monitor other plant diseases already exist, the use of the combined features (spectral features and TFs) for the identification of wheat yellow rust has not received much attention to date and requires a more in-depth study.
This study investigates the use of spectral features and TFs of hyperspectral images and the combination of both for the identification of yellow rust on wheat leaves. The objectives are to (1) select the optimum wavebands (OWs) using the SPA and the optimal vegetation indices (VIs) using the correlation-based feature selection (CFS); (2) extract the TFs using the grey-level co-occurrence matrix (GLCM) from the hyperspectral images and select the optimal TFs using the CFS; (3) evaluate the performance of different features (OWs, VIs, TFs, and their combinations) for identifying wheat yellow rust.

2. Materials and Methods

2.1. Study Site

The study area is located in Langfang city (39°30’42”N, 116°36’07”E), Hebei province, China; this region belongs to the North China Plain with wheat as the main crop. The region has a temperate continental monsoon climate with the average annual temperature and precipitation is 11.9 °C and 554.9 mm, respectively. The soil in the experimental field had nutrient content with organic matter, available phosphorus, and available potassium of 1.41–1.47%, 20.5–55.8 mg·kg−1, and 116.6–128.1 mg·kg−1, respectively. We set up three groups, each of which has an area of 22 × 10 m2, including one control group and two yellow rust-infected groups. We followed the National Plant Protection Standard (NPPS) and inoculated the wheat in the experimental groups with the yellow rust pathogen on 13 April 2017 [21]. The solution concentration of yellow rust spores used to inoculate the wheat was 9 mg 100−1 mL−1. The wheat in the control group was sprayed with pesticide to prevent yellow rust infection. The wheat cultivar planted in the experiment field was ‘Mingxian 169’, which has moderate susceptibility to yellow rust. All groups had the same management conditions in the whole growth period of wheat, including the reception of the same amount of water and nitrogen.

2.2. Data Acquisition and Processing

2.2.1. Leaf Sampling

Seven observations tests (20 April, 27 April, 4 May, 11 May, 15 May, 18 May, and 25 May) were conducted during the critical growth period of wheat. The healthy and yellow rust-infected leaves with different damage levels were collected randomly. In the first three periods (20 April, 27 April, and 4 May), 12 leaves were collected in each period, and in the last four periods (11 May, 15 May, 18 May, and 25 May), 15 leaves were collected in each period. A total of 96 leaves were obtained. Table 1 shows that the number of healthy and yellow rust-infected wheat leaves obtained during each observation period. Two-thirds of the leaves were used as the modeling set, and the remainder was used as the verification set in each period. The second leaf from the top on the wheat stalk was manually clipped for this experiment. In order to avoid the water loss in leaves caused by high temperatures during transportation, the leaves were put into the box with ice bags to keep them fresh. Subsequently, the leaves were scanned using the hyperspectral imager.

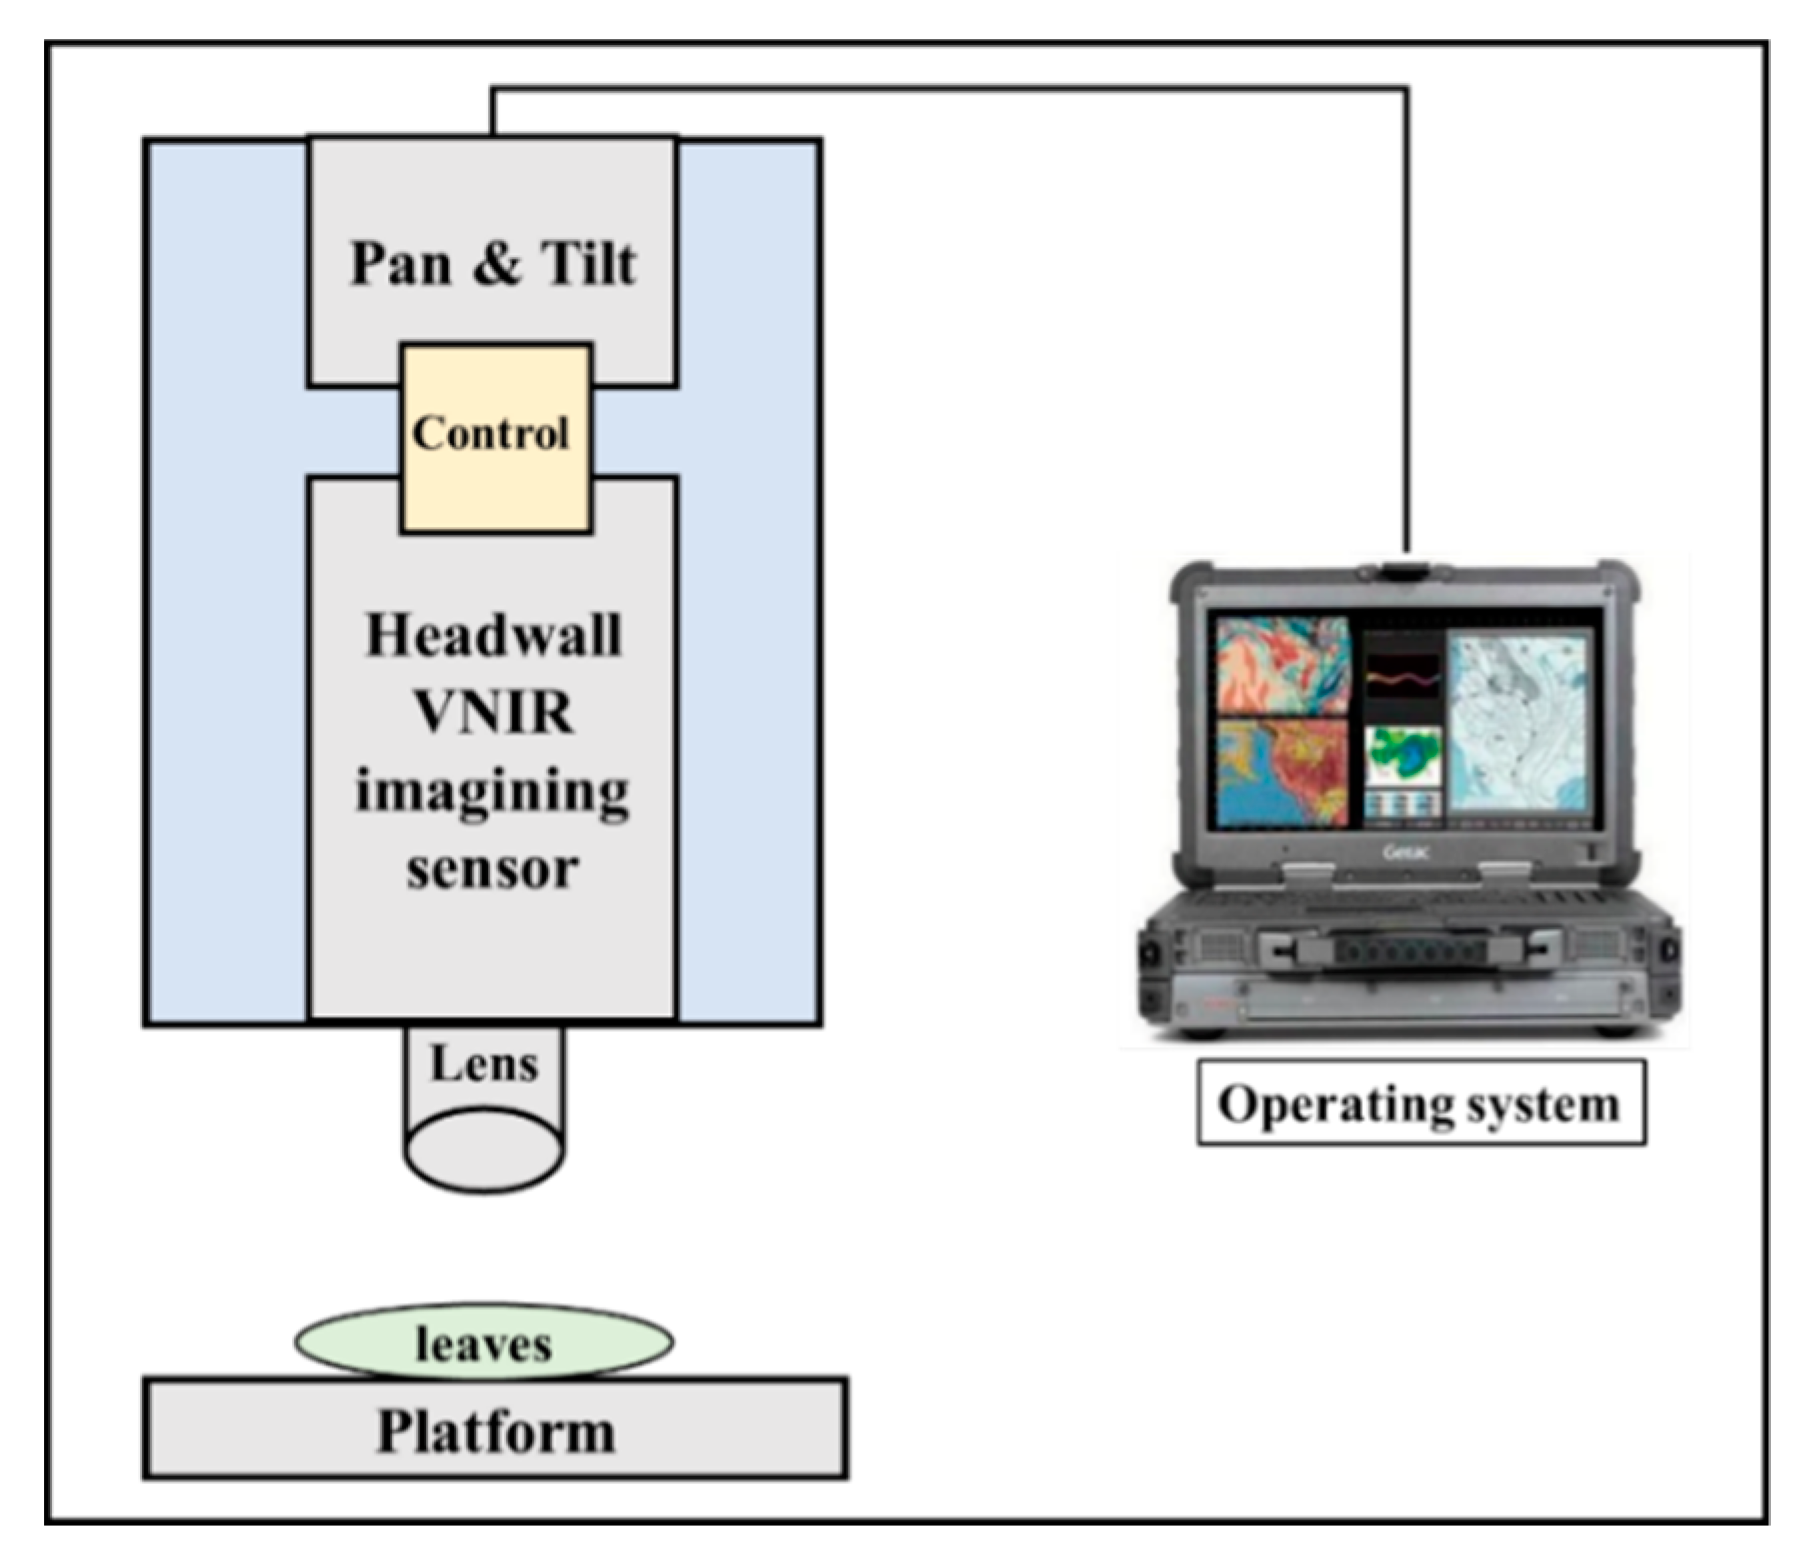
2.2.2. Hyperspectral Image Acquisition and Processing
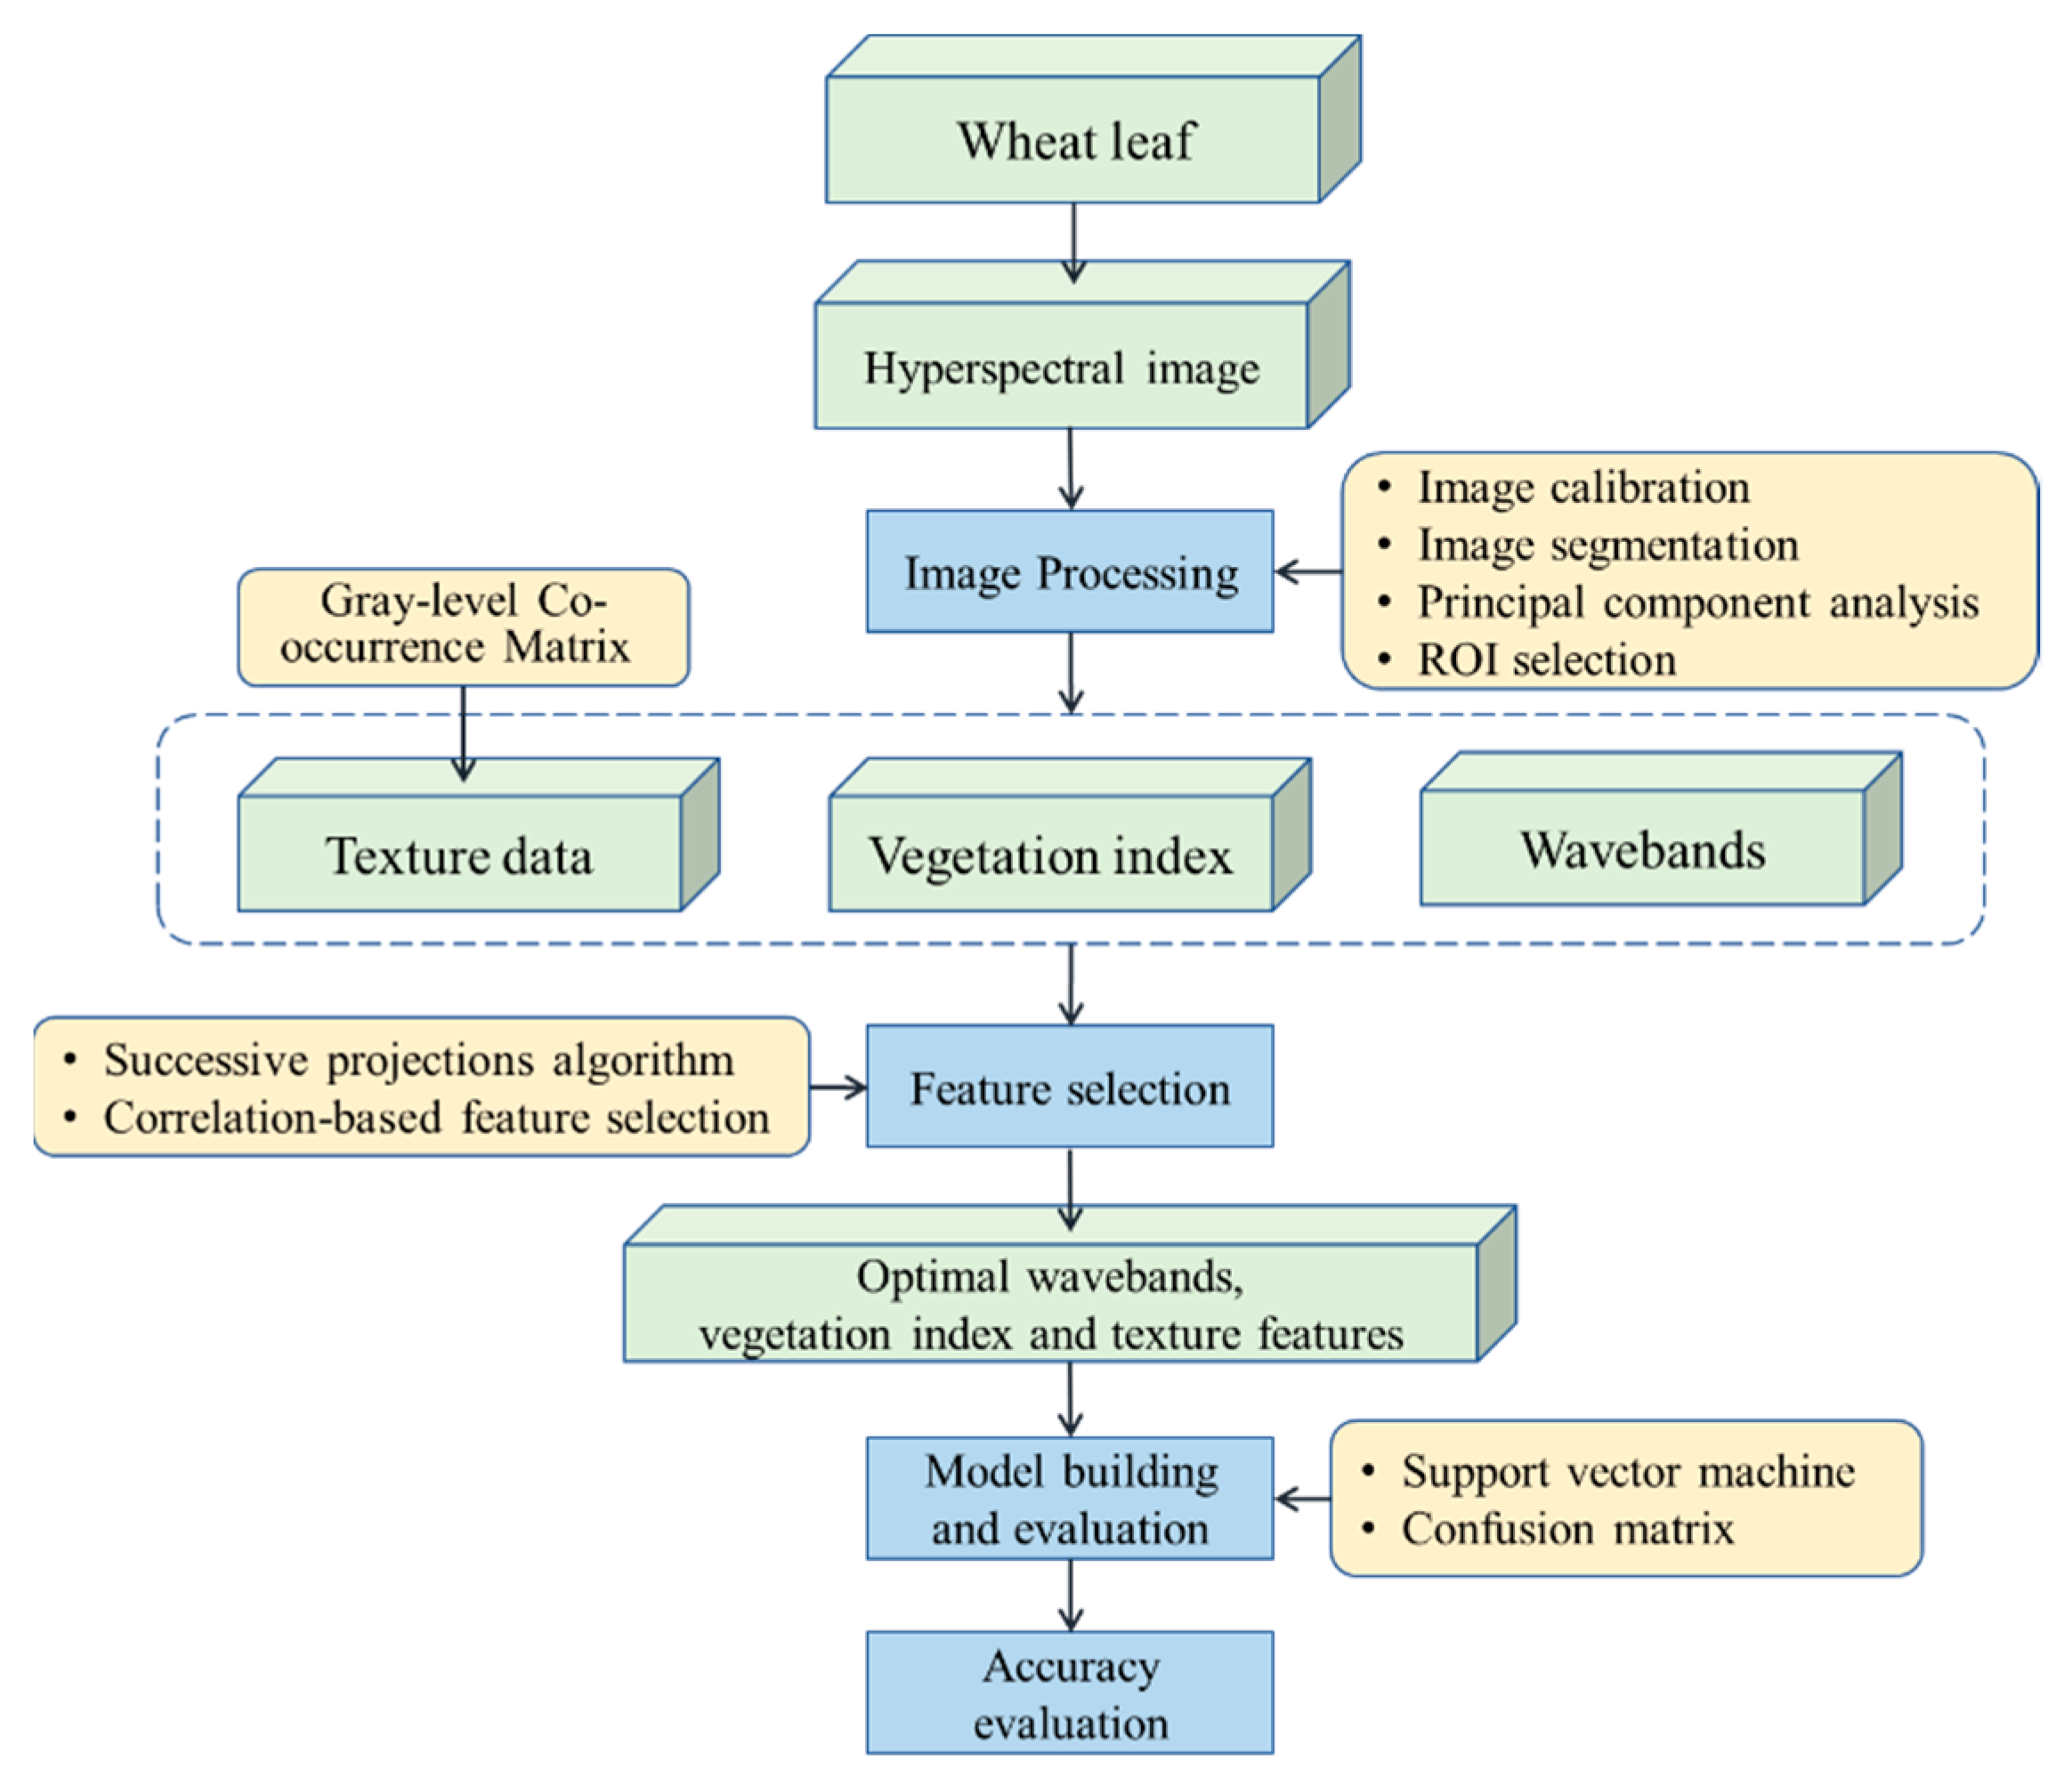
The hyperspectral images of the wheat leaves were acquired with a hyperspectral imaging system (Headwall VNIR imaging sensor, Headwall Photonics, Inc., Bolton, MA, USA), as shown in Figure 1. The system consisted of a tripod, a pan, and tilt (Headwall Photonics, Inc., Bolton, MA, USA), a Headwall VNIR imaging sensor, and a computer (Lenovo, Intel® Xeon®, E-2176M CPU @2.70 GHz, RAM 32.0 GB). The effective spectral range obtained by the sensor is 400–1000 nm, and the spectral resolution is approximately 1.48 nm. The pan and tilt head can control the movement of the sensor horizontally and vertically. After many adjustments and parameter optimizations, the imaging process of wheat leaves was performed at 50 frames per second (fps) with 25 ms integration time, and the object distance was 41 cm. The spatial resolution of the obtained hyperspectral image at this time was 0.5 mm (the area of each pixel is 0.5 mm × 0.5 mm). The Headwall VNIR imaging sensor had an optical focal length lens of 12 mm, and the instantaneous field of view (IFOV) and angular field of view (FOV) were 0.93 mrad and 39°, respectively. The proprietary software Headwall HyperspecTM (Headwall Photonics, Inc., Bolton, MA, USA), was used to complete the scanning process. The leaves were fixed on a pure black panel (100 × 100 cm) during image acquisition to minimize the effects of noise and background.
The raw hyperspectral images require calibration to reduce the effects of uneven intensity of illumination and dark current in the camera; the following equation was used in the calibration process [22].
I c a l i b r a t e d = I r a w I d a r k I w h i t e I d a r k ,
where Icalibrated is the calibrated image, Iraw is the raw hyperspectral image, Iwhite is the white reference image (a white ceramic tile with 99.9% reflectance), and Idark is the dark reference image (0% reflectance), which was obtained by covering the camera lens using a cap.
We used a threshold of 0.11 at 550 nm to extract the wheat leaf pixels from the calibrated hyperspectral images to eliminate background interference. Therefore, the hyperspectral images only contain the wheat leaf pixels; these data were used for the subsequent processing.

2.3. Methods

Figure 2 shows the flowchart of the wheat yellow rust identification using different features (OWs, VIs, TFs, and their combinations) from hyperspectral images. The procedure consisted of three steps: (1) The hyperspectral images of the wheat leaves were collected and processed. (2) The spectral features and TFs were extracted; the OWs were selected by the SPA, and the optimal VIs and TFs were obtained using the CFS. (3) The identification models of yellow rust were established using different features based on SVM, and we used confusion matrices, OA, and the kappa coefficient (kappa) to evaluate the model performance.

2.3.1. Extraction of Spectral Data and Selection of Optimum Wavebands

Regions of interest (ROIs) (10 × 10 pixels, three ROIs on each leaf) were defined manually for the extraction of spectral data from each leaf. ROIs located in healthy regions on the leaves were defined as 1, and ROIs located in diseased regions were defined as 0. The average reflectance of the pixels in each ROI was calculated to represent the spectral data of one sample. Finally, 288 samples were obtained, with 147 diseased samples, and 141 healthy samples; 192 samples (64 × 3) represented the training set, and 96 (32 × 3) represented the test set. We saved all spectral data extracted from the images of wheat in a matrix for subsequent analysis.
Hyperspectral images contain rich spectral information that facilitates disease identification but also results in challenges, including data redundancy. The hyperspectral images obtained by the Headwall system contained 406 wavebands. Redundancy and collinearity exist in the spectral information, causing difficulties in processing, increasing model complexity, and affecting model accuracy. Therefore, it is advisable to extract the most suitable wavebands before developing identification models of yellow rust. For our research, OWs were selected by SPA. The SPA is widely used in the selection of hyperspectral wavebands because it can select the wavebands with the least redundancy, thereby improving the speed and efficiency of the model [23]. Generally, SPA consists of three steps, including (1) the calculation and selection of wavebands with minimum collinearity and maximum projection vector; (2) the determination of the OWs number by comparing the minimum root mean square error (RMSE) in the validation set of the multiple linear regression calibration; (3) the removal of uninformative wavebands without affecting prediction capability using a variable elimination procedure [24]. Before the selection of OWs with the SPA, the Savitzky–Golay smoothing was performed to eliminate spectral signal noise. The Savitzky–Golay smoothing and SPA were performed in Matlab 2016a.

2.3.2. Extraction of Vegetation Indices

Through numerous studies, hyperspectral VIs have achieved good performance for discriminating and identifying crop diseases [21,25,26]. In this study, 14 VIs were selected to detect yellow rust; the VIs were selected from the literature on remote sensing of crop diseases. The VIs are related to crop growth, pigment variation, water and nitrogen content, photosynthetic activity, and crop diseases. Table 2 shows the equations and definitions of each VI.

2.3.3. Extraction of Texture Data

The texture of images represents the relationship of neighboring pixels, including the intensities, roughness, and their arrangement [39,40]. As such, texture reflects the biophysical characteristics of the leaves and the growth status of crops [16]. When crops are infected by diseases, changes in the pigment and structure in the leaves result in spectral changes, as well as changes in the color and morphology of the leaf surface, thereby causing textural changes. Studies have shown that the identification and detection of crop diseases based on TFs is feasible [41].
The GLCM is a common method for extracting TFs; second-order statistics are used to describe the gray level relationships within a neighborhood around a specific pixel [42]. Haralick [43] proposed 14 TFs; in this study, 8 frequently used TFs were selected to identify wheat yellow rust. Table 3 list the description and equations of the GLCM TFs used in this study. Redundancy will occur when the TFs are extracted from all spectral bands (in this study, the hyperspectral images contained 406 spectral bands), which has adverse effects on model accuracy. Principal component analysis (PCA), a common dimensionality reduction method, was used to generate the principal component (PC) images that contained most of the information. The first three PC images (with more than 97% of the cumulative variance) were used to calculate the texture data. Finally, the TFs were extracted from the ROIs of the first three PC images using the GLCM.
The calculation of the GLCM depends on two important parameters (the relative distance measured in pixel numbers (d) and their relative orientation (θ)) [39]. Many studies have demonstrated that it is effective to take the average value in 4 relative orientation (θ = 0°, 45°, 90°, and 135°) with d = 1 as the texture value of the sample [14,15,20]. Therefore, we first calculated the TFs in 4 relative orientation (θ = 0°, 45°, 90°, and 135°), respectively; the relative distance used to pair with each direction was a uniform distance (d = 1). Second, we calculated the average of 4 directions as the final TFs of the sample. The whole process of texture calculation is completed in MATLAB 2016a. Finally, 24 TFs were acquired from the first three PC images; these were abbreviated as combinations of the TFs and numbers. For example, the MEA of the first PC image (PC1) is abbreviated as “MEA1”, the CON of the second PC image (PC2) is abbreviated as “CON2”, and the DIS of the third PC image (PC3) is abbreviated as “DIS3”.

2.3.4. Selection of Optimal Vegetation Indices and Texture Features

The 14 VIs and 24 TFs were extracted as alternative features for establishing the identification model of wheat yellow rust. Choosing the optimal VIs and TFs will be beneficial to improve the accuracy of the model. In this study, CFS was employed to choose the optimal VIs and TFs. Many studies have demonstrated that CFS is an effective tool for selecting the optimal feature subsets [44,45].
CFS selected optimal features by estimating and ranking the merit of the feature subsets. A heuristic method was used to estimate the merit of feature subsets; the principle of this method is that the features in the selected feature subset are highly correlated with the classes, and the correlation between the features is the lowest [46]. In this work, the classes represent two types of wheat leaf samples (healthy and yellow rust-infected), and the features represent the OWs, Vis, and TFs. Furthermore, the best-first search method was combined with CFS to choose the optimal features. The CFS procedure was performed in Weka. The merit in CFS is defined as:
M e r i t S = k r c f ¯ k + k ( k 1 ) r f f ¯   ,
where M e r i t S represents the merit of the feature subset (S) containing k features, r c f ¯ represents the average correlations between the feature and the class, and r f f ¯ represents the average correlations between the features [47].

2.3.5. Performance Test of Different Features for Identifying Wheat Yellow Rust

In this work, the SVM was chosen to build the identification models of wheat yellow rust using the different features, including the OWs, VIs, TFs, and their combinations (OWs and TFs, VIs and TFs). The SVM, a two-class classifier, has good performance for the classification of hyperspectral images and has been a highly accepted method for monitoring crop diseases [48].
The principle of SVM is to construct a separating hyperplane that maximizes intervals of positive and negative samples on the feature space [49]. The key to class separation is the use of a kernel function, which maps the vectors to a higher dimensional space. The radial basis function (RBF) has been proven to be superior to other functions for improving the efficiency of the modeling [50]. Therefore, the RBF was selected in this work. The cost of the constraints (C) and sigma (σ) are key parameters of an SVM classifier and have a significant influence on the classification accuracy. Hence, we used a grid-based search strategy, as recommended by Hsu et al. [51], to determine the optimal C and sigma σ for developing the identification model of wheat yellow rust. A confusion matrix was used to determine the performance. The producer’s accuracy (P), user’s accuracy (U), OA, and kappa were chosen to assess the performance of the identification model. SVM was implemented using the MATLAB 16a software.

3. Results

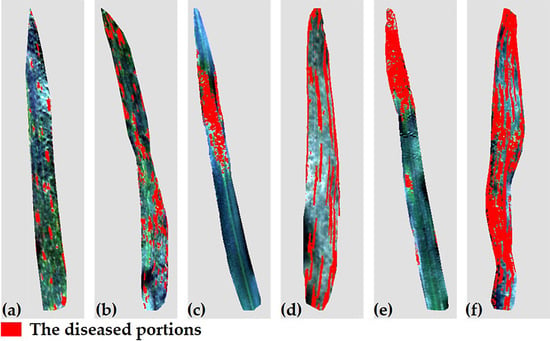
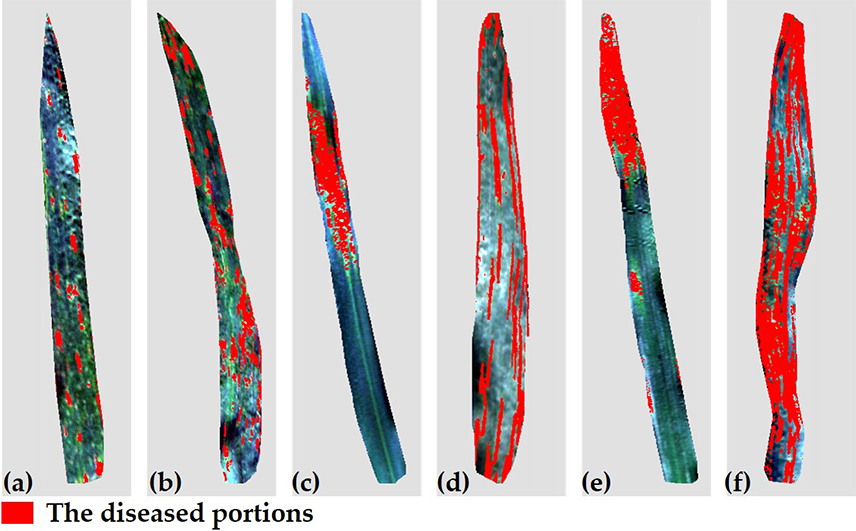
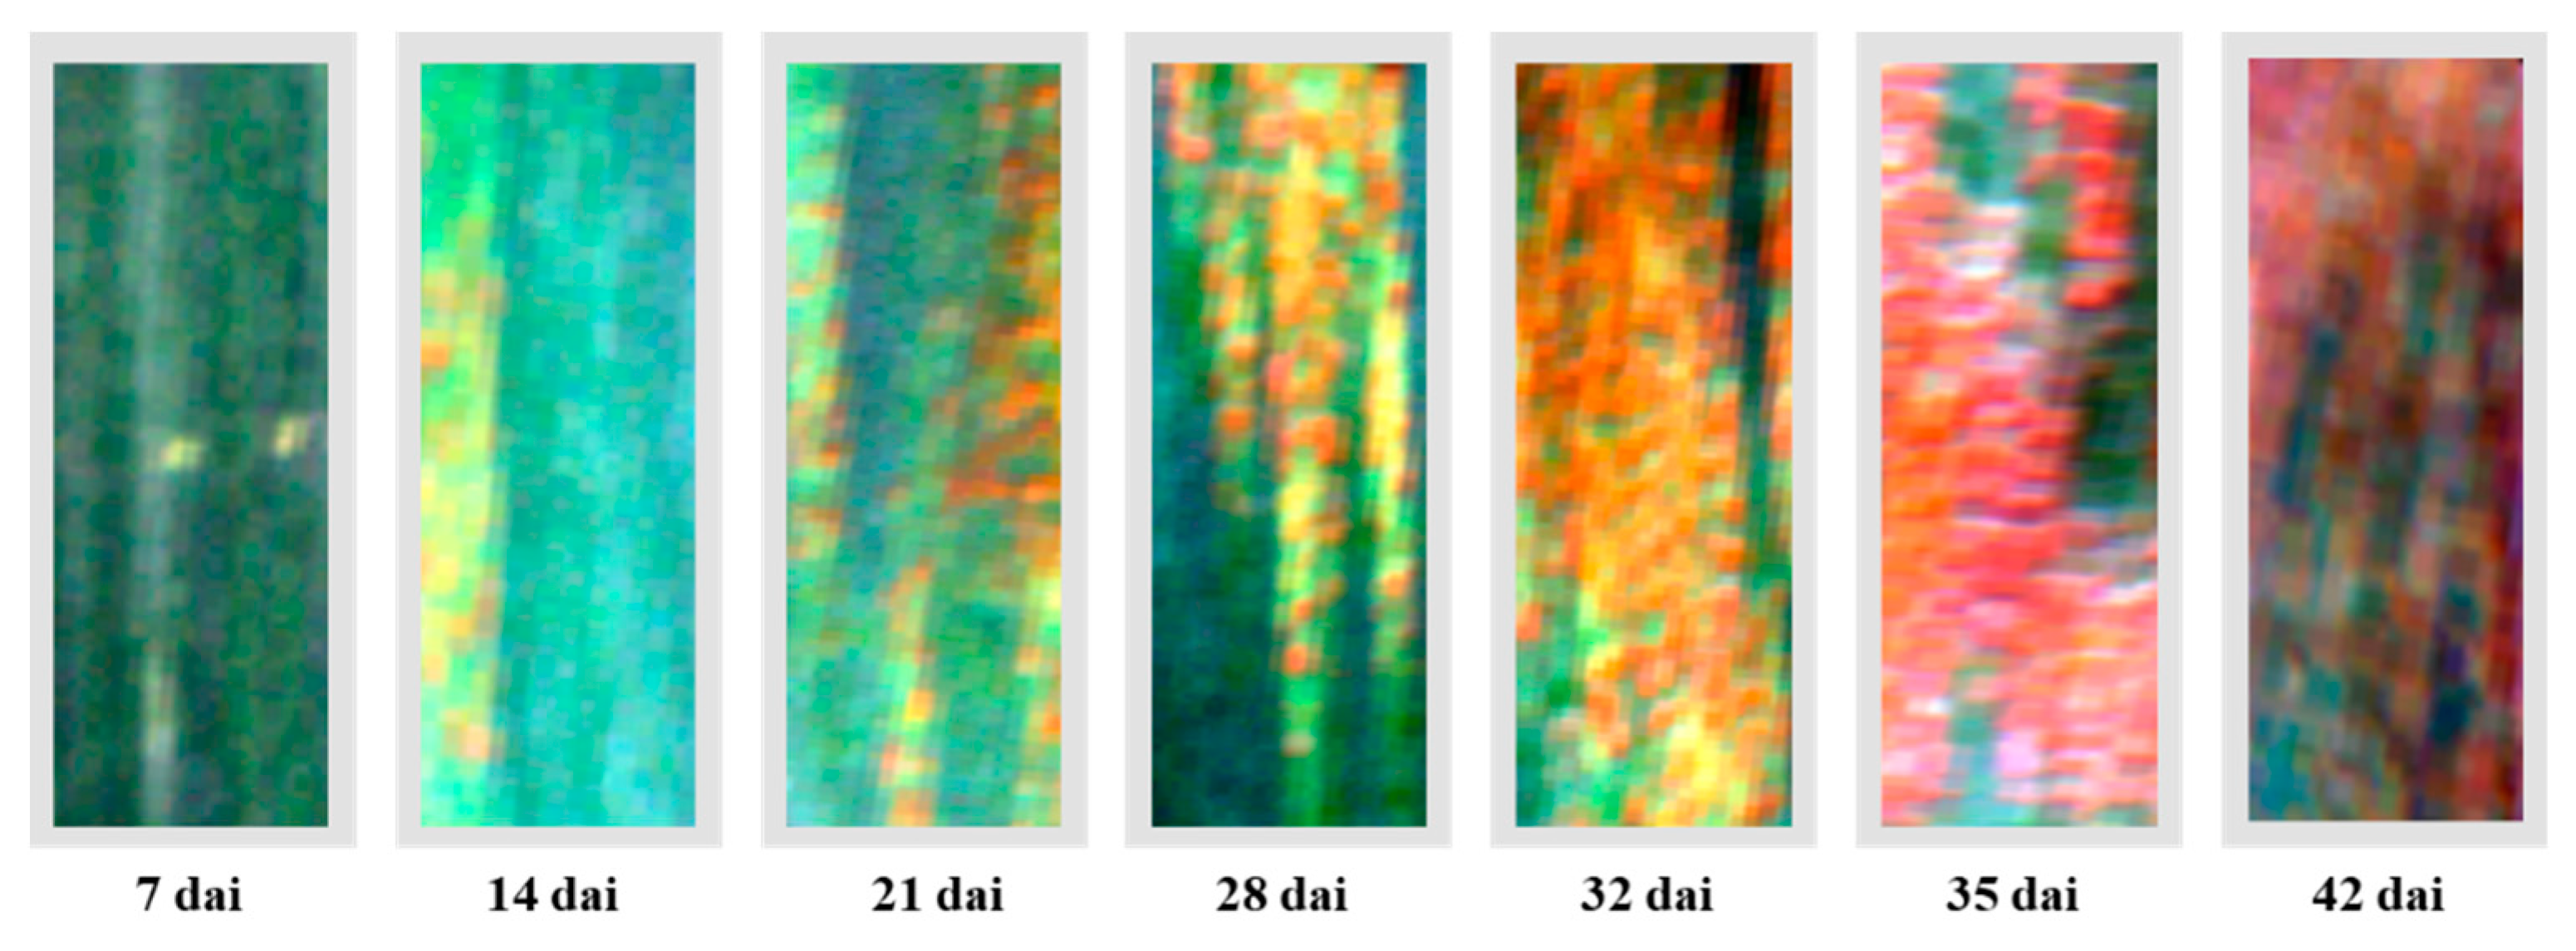
3.1. Disease Symptom Development

The wheat in the experimental group was inoculated with the yellow rust pathogen on 13 April. A total of seven experiments were conducted on the 7th, 14th, 21st, 28th, 32nd, 35th, and 42nd day after inoculation (dai), respectively. Figure 3 shows the development of wheat yellow rust symptoms from the 7th to 42nd dai. It could be seen from Figure 3 that the symptoms of yellow rust become obvious and severe over time. On the 7th dai, mild symptoms (light yellow spots) appeared on the wheat leaves. Parts of the leaves turned yellow with orange spots on the 14th dai. Obvious orange sorus appeared and attached to the leaves on the 21st dai, and its range expanded on the 28th dai. The sorus existed on the leaves in large areas on the 32nd dai, and its color changed from orange to tangerine on the 35th dai. Most of the areas on the wheat leaves had already dried out and become dark brown on the 42nd dai.

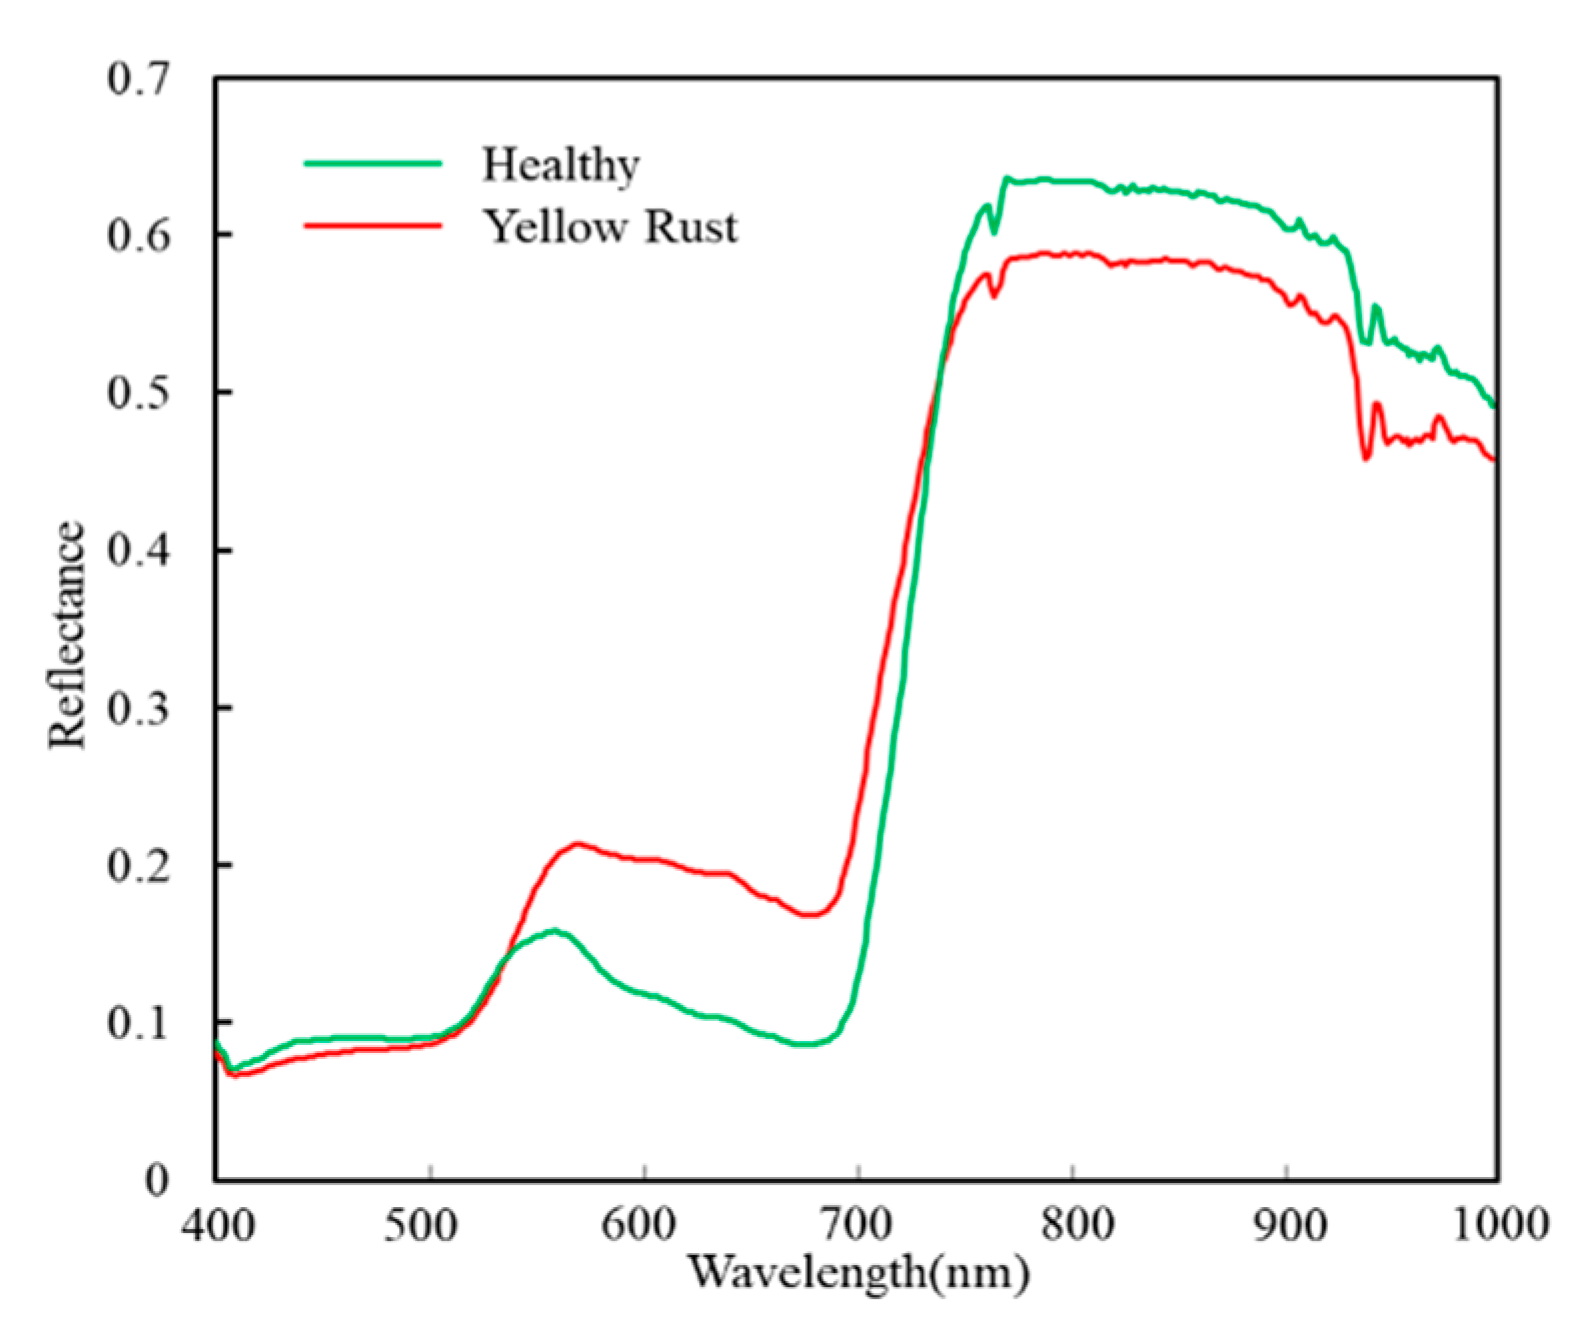
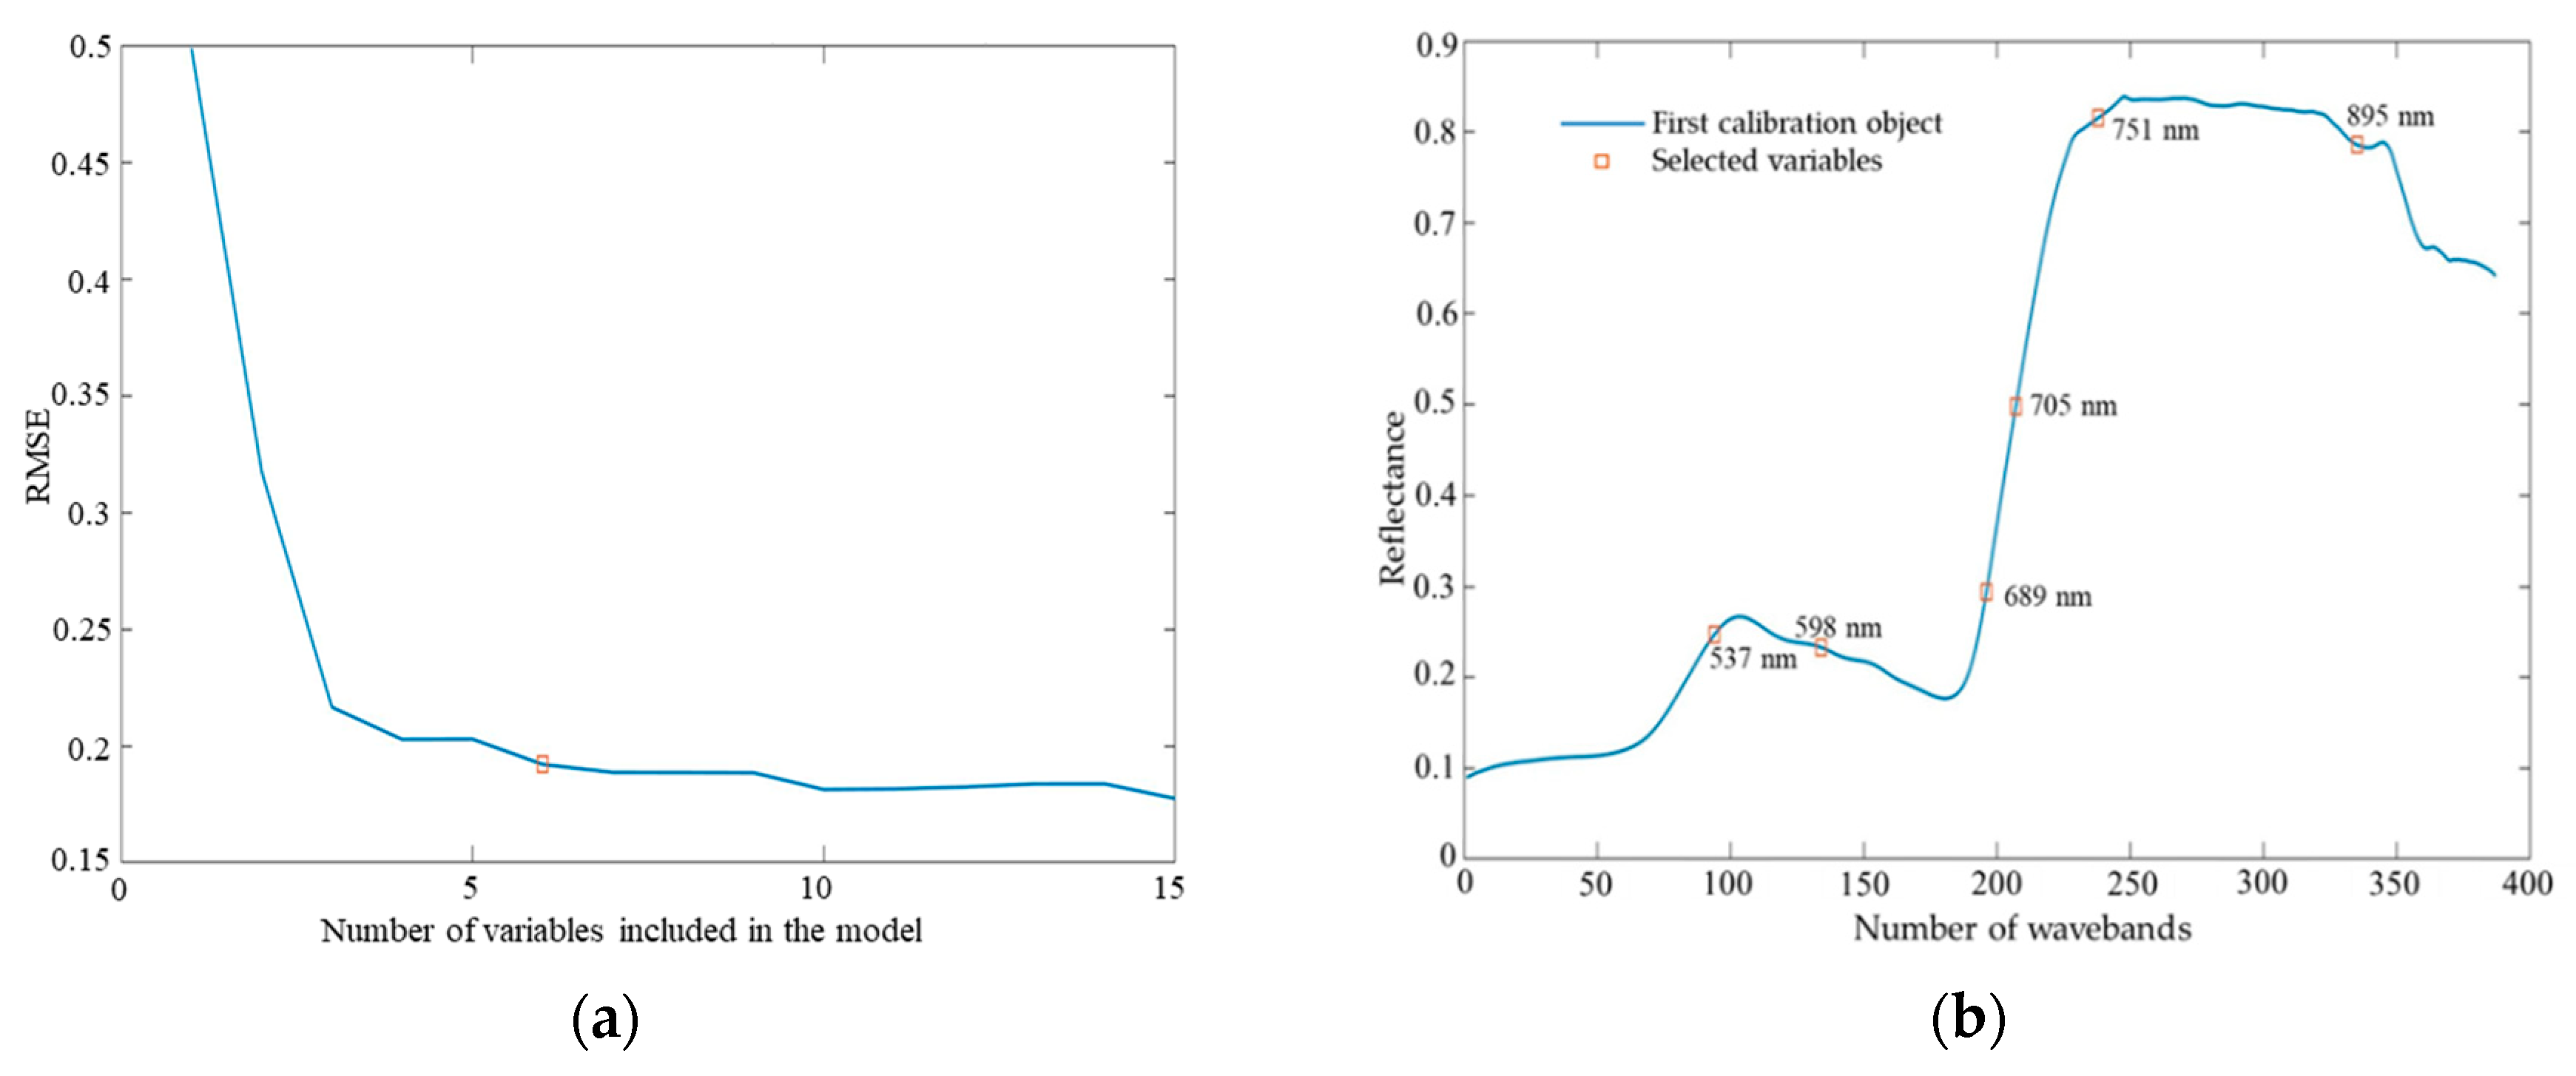
3.2. Spectral Response of Wheat Yellow Rust and Selection of Effective Wavebands

Figure 4 showed that the curves of average spectral reflectance of all healthy and yellow rust-infected samples obtained from seven experiments (20 April, 27 April, 4 May, 11 May, 15 May, 18 May, and 25 May). It can be intuitively seen from Figure 4 that the overall shape of the two curves is similar, with an increase from 407 nm to 563 nm, followed by a drop until 681 nm and a sharp increase after 770 nm. However, the two curves exhibited differences from 533 nm to the end. Specifically, from 553 nm to 681 nm, the reflectance of yellow rust-infected samples was higher than that of the healthy samples; from 738 nm to 1000 nm, the reflectance of the former was lower than that of the latter.
The root mean square error (RMSE) of the calibration values was used as the evaluation criterion for the selection of the optimal wavebands in the SPA. Figure 5a shows that the RMSE decreased sharply as the wavebands increased from 1 to 3 and then decreased slowly to a stable value of 0.19211 at six wavebands. Six wavebands were selected by the SPA (537, 598, 689, 705, 751, and 895 nm) (Figure 5b). The selected wavebands were located in the regions where the largest differences between the healthy and diseased samples in the visible and NIR regions. The proportion of selected OWs was 1.48% (six out of 406 bands). The data reduction significantly reduced the redundancy of the spectral dataset.

3.3. Selection of Sensitive Vegetation Indices and Textural Features for Identifying Wheat Yellow Rust

Four TFs (correlation1 (COR1), correlation2 (COR2), entropy2 (ENT2), and second moment3 (SEC3)) and four VIs (nitrogen reflectance index (NRI), photosynthetic radiation index (PRI), greenness index (GI), and anthocyanin reflectance index (ARI)) were selected by CFS. The ability of the selected features in seperating healthy and yellow rust-damaged samples was tested using independent t-Test in SPSS 20; the results are listed in Table 4. There were significant differences in the mean values and standard deviations of the four VIs and four TFs between the healthy and yellow rust-damaged samples, and all features selected by the CFS were significant at the 0.999 level. The optimal features, which were most sensitive to wheat yellow rust, were used in the SVM classifier to identify wheat yellow rust.

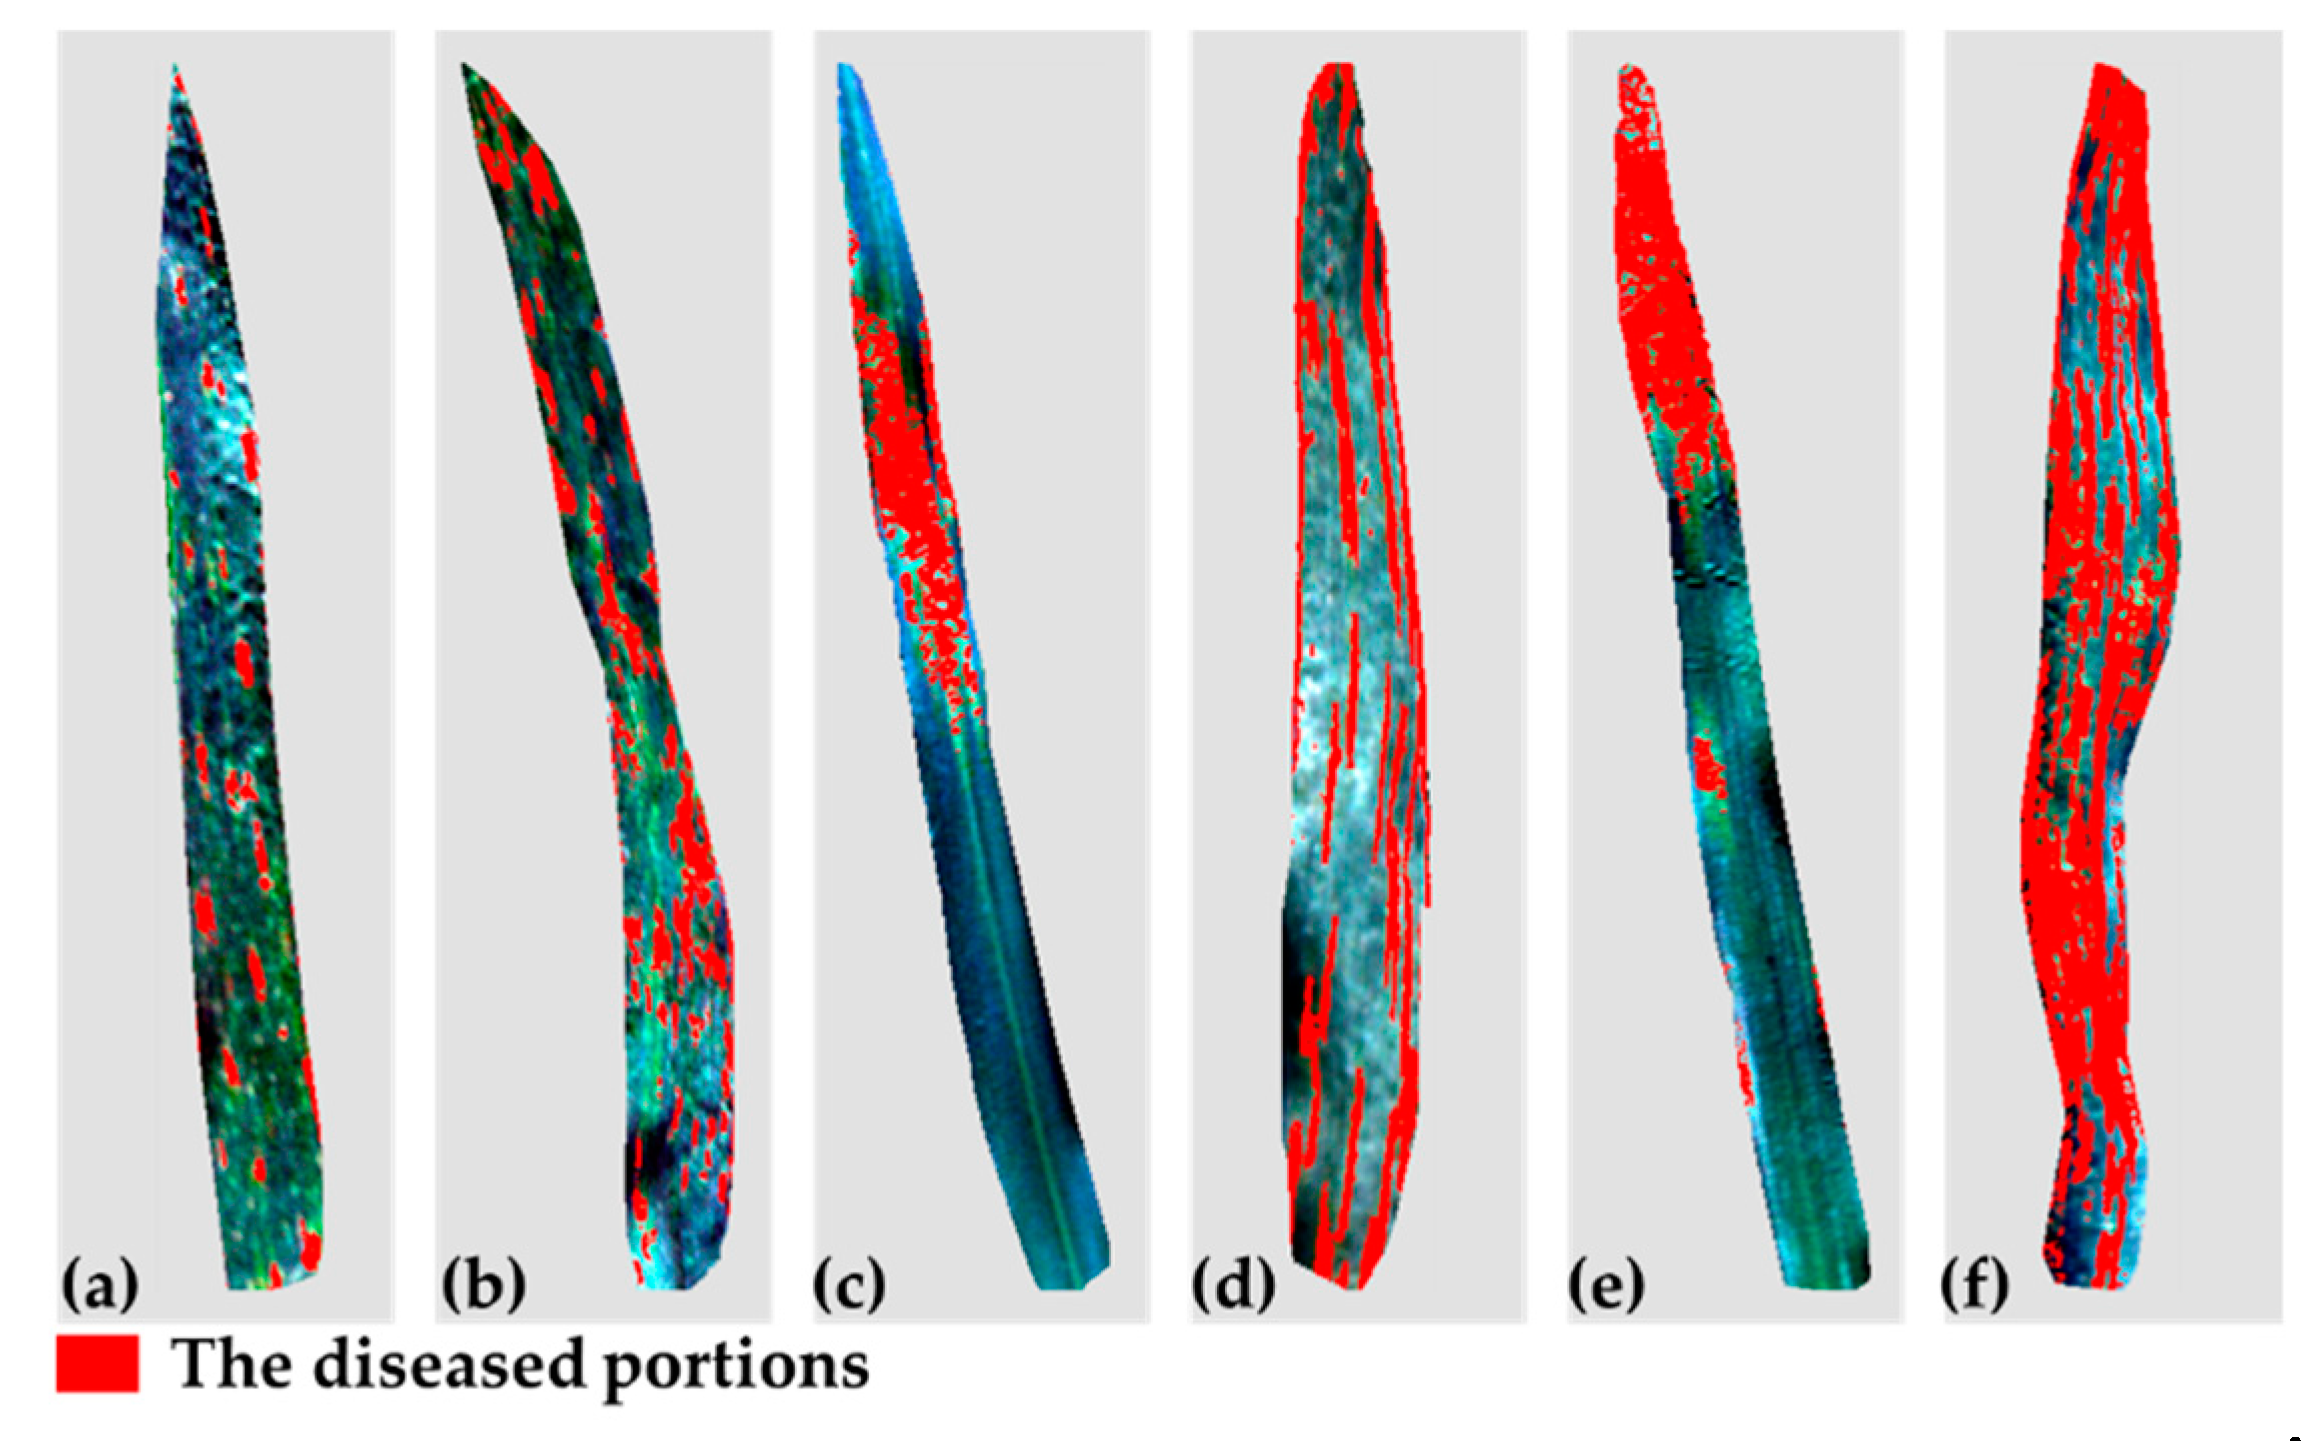
3.4. Comparison of the Performance of Models with Different Features

The performance of models based on the different features and their combinations were compared. Finally, five schemes were implemented to evaluate the performance of models for identifying yellow rust on wheat based on the SVM classifier:
  • OWs selected by the SPA (538, 598, 689, 703, 751, and 895 nm).
  • VIs selected by the CFS (NRI, PRI, GI, and ARI).
  • TFs selected by the CFS (COR1, COR2, ENT2, and SEC3).
  • The combination of OWs and TFs.
  • The combination of VIs and TFs.
Table 5 summarizes the results of the identification model of wheat yellow rust using different schemes. The use of the OWs only provided an OA of 83.3% and a kappa of 0.667. The identification accuracy of the healthy samples was 79.2%, and that of the yellow rust-infected samples was 88.4%. The proportion of wavebands selected by the SPA only accounted for 1.47% of the total number of wavebands, which improved the model efficiency. These results proved that it is feasible to identify wheat yellow rust based only on the OWs. For the VIs, the OA and the kappa were 89.5% and 0.789, respectively. The identification accuracy of the VI scheme was 6.2% higher than that of the OW scheme. The use of the TFs to identify wheat yellow rust provided an OA and kappa of 86.5% and 0.73, respectively. The OA of the TF scheme was 3% lower than that of the VI scheme, but 3.2% higher than that of the OW scheme. This result shows that it is feasible to identify yellow rust of wheat leaves using TFs of hyperspectral images.
The OA and the kappa of the schemes with the combined features were higher than that of the schemes with the single features. For the OWs + TFs, the OA and the kappa were 90.6% and 0.812, respectively. Compared to the OWs and TFs schemes, the OA was 7.3% and 4.1% higher, respectively. The best performance was observed for the VIs + TFs, with an OA of 95.8%, representing a 6.3% and 9.3% increase in the OA compared to the VIs and TFs schemes, respectively. In addition, the U of the healthy samples was 100.0%, and that of the yellow rust-infected samples was 92.5%, representing the highest U values in this study. This result revealed that the model established using the combined features resulted in the highest OA for identifying wheat yellow rust. The results of the VIs + TFs scheme are shown in Figure 6. The lesions in the wheat leaves with different damage levels are accurately identified.

4. Discussion

In this work, we demonstrated the feasibility of using spectral features (spectral wavebands and VIs), TFs, and their combinations to identify wheat yellow rust based on hyperspectral images. The models based on the feature combination (TFs and VIs, TFs, and OWs) achieved higher accuracies than those based on the spectral features or TFs alone. The model based on the combination of TFs and VIs obtained the highest OA (95.8%).
When plants are stressed by diseases, it can result in changes in some parameters inside leaves, such as pigments, water content, and cell structure; these changes can affect the spectral response characteristics of leaves [52]. These changes are exploited in remote sensing of plant diseases. When wheat leaves are infected by yellow rust pathogens, the color of the leaves will change from green to yellow as the infestation progresses, until the leaves wither and shrivel. The reason is that the uredospores destroy epidermal cells, resulting in reduced chlorophyll content and activity and the loss of water [7]. The spectral reflectance of healthy and yellow rust-damaged leaves can also differ due to these changes. Generally, compared to spectral reflectance of healthy leaves, diseased leaves are higher in the visible region and lower in the NIR region. The chlorophyll in the healthy leaves has a strong absorption capacity, which results in high energy absorption; therefore, spectral reflectance is low in the visible region. The light is repeatedly reflected by the internal tissues and cells of the leaf, which result in a sharp increase in reflectance in the NIR region. Conversely, the chlorophyll in the yellow rust-infected leaves is destroyed, and the absorption capacity is reduced, which results in increased reflectance in the visible region. The tissue structure and cells inside the leaf are damaged, which results in a reduced spectral reflection in the NIR region [53]. In this study, similar spectral characteristics were observed in the wheat leaves infected by yellow rust, as shown in Figure 4. For instance, in comparison with the reflectance of healthy leaves, diseased leaves were higher in the visible range from 553 nm to 681 nm and lowered in the NIR region from 738 nm to 1000 nm.
We obtained an OA of 83.3% using the OWs selected by SPA. Six wavebands, which were located in the regions of the spectral differences between the yellow rust-infected and the healthy samples, were selected to establish the identification model of wheat yellow rust. A low number of effective features used to establish a model can improve the model accuracy and speed. The proportion of the selected OWs only accounted for 1.47% of all bands in the hyperspectral images. Therefore, the use of the SPA to select the OWs for establishing the identification model was highly effective. Previous studies also obtained good results for using the SPA for selecting OWs to detect plant diseases [8,20]. In our study, the identification model based on the VIs resulted in an OA of 89.5%. In the research by Shi et al., the vegetation index was also used to identify yellow rust and achieved good results. This demonstrated that VIs alone are quite useful for identifying wheat yellow rust [11]. Compared with the accuracy of the OW model, the accuracy of the VI model was about 6.2% higher. The reason may be that VIs are band combinations of wavebands sensitive to yellow rust, and they may be less affected by interference. The CFS used to select the optimal VIs and TFs provided good performance, as demonstrated by the visible differences in the mean values between the healthy and rust-infected samples. Piedra-Fernández et al. also selected optimal features using the CFS from complex remote sensing datasets and obtained satisfactory results [54].
Wheat leaves infected by yellow rust not only cause changes in spectral characteristics but also changes in TFs. The reason is that yellow rust changes the physiological and biochemical characteristics inside the leaf, causing changes in the spectral reflectance. Yellow rust also produces lesions on the surface of the leaves, resulting in textural changes. However, TFs in the images have not been studied in-depth in terms of using hyperspectral images to monitor crop diseases. Although several studies used image texture to detect diseases of tomato and cucumber, the results were not satisfactory [15,16]. In this work, 24 TFs were extracted from the hyperspectral images, and four optimal TFs selected by CFS were used to create the model for identifying wheat yellow rust. The OA and kappa were 86.5% and 0.73, respectively. This is an encouraging result and demonstrates the feasibility of identifying wheat yellow rust using TFs of hyperspectral images. In addition, there are many methods to extract TFs, including statistical methods (grey-level co-occurrence matrix (GLCM), semivariogram), model methods (Markov random field, Gibbs random field model), and signal processing methods (the wavelet transform). Each method has its advantages and limitations, and in future studies, we will test different methods to extract TFs from hyperspectral images for constructing a yellow rust identification model with superior performance. In addition, we used sample data from multiple growing periods of wheat when building the identification model to make it accurately identify diseases in each growing period. This is consistent with the studies of Ma et al. [52] and Zheng et al. [1,21], they used data from multiple periods to establish identification models of wheat fusarium head blight and yellow rust, respectively, and acquired good results.
In this work, the focus was on the combination of spectral features and TFs to identify wheat yellow rust. In previous studies, only spectral features were used to identify wheat yellow rust, and although satisfactory results were obtained, the accuracy was not very high. The reason may be that spectral features only reflect the internal changes of wheat leaves caused by yellow rust. The feasibility of identifying yellow rust on the wheat leaves using TFs was confirmed in this study. The TFs were combined with OWs and VIs to determine the best model for identifying yellow rust. In the results, we found that the OA was higher when the combined features were used than the single features. For the combination of the OWs and TFs, the OA was 7.3% higher than that of the OWs alone, and for the combination of the VIs and TFs, the OA was 6.3% higher than that of the VIs alone. It is assumed that the reason for the better results of the model with combined features was that both spectral and textural information related to yellow rust were included. Spectral wavebands or VIs reflect the internal changes of wheat leaves caused by yellow rust, and TFs reflect the external changes. Therefore, the combined features take into account both internal and external changes of wheat leaves caused by yellow rust. Overall, the results demonstrate that it is feasible to identify wheat yellow rust using a combination of spectral and TFs.
This research achieved good results for using the combination of spectral features and TFs to identify wheat yellow rust at the leaf scale, thereby providing a basis for monitoring wheat yellow rust using combined features on a larger scale. Yellow rust of wheat is an epidemic disease, which occurs in patches at the field scale [55]. The increased use of unmanned aerial vehicles (UAVs) provides a convenient method for monitoring wheat yellow rust at the field scale. UAVs equipped with hyperspectral imaging systems can obtain hyperspectral images of fields of wheat. In previous studies that used UAV-based hyperspectral imagery to monitor crop diseases, only spectral features were used [56,57,58]. Therefore, in future research, we will focus on using a combination of spectral and TFs from UAV-acquired hyperspectral images to monitor wheat yellow rust at the field scale. On the other hand, the aim of this study is combining the spectral features and TFs of hyperspectral images to identify symptomatic wheat leaves, but we did not involve the pre-symptomatic detection of the wheat. Spectral features of hyperspectral remote sensing are commonly used to detect the changes in the parameters (cellular structure, chlorophyll, and water) in pre-symptomatic leaves [7,48]. The continuous wavelet analysis (CWA) is an advanced spectral analysis method, and has been proven to be promising for capturing subtle spectral characteristics in the detection of foliar constituents [59,60]. There is great potential for detecting subtle parameter changes caused by diseases in pre-symptomatic leaves using CWA. In the following research, we can try to use CWA and machine learning to conduct pre-symptomatic detection of wheat yellow rust.

5. Conclusions

In this research, hyperspectral imaging technology was used to identify wheat yellow rust. We scanned wheat leaves with a Headwall hyperspectral imaging system for obtaining hyperspectral images of leaves. The spectral features and TFs were extracted from the hyperspectral images and were used for establishing identification models of yellow rust on wheat leaves. We demonstrated the feasibility of using spectral features (OWs and VIs), TFs, and their combination to identify yellow rust. Six OWs, which were sensitive to wheat yellow rust, were selected by SPA (537, 598, 689, 705, 751, and 895 nm). Fourteen VIs were extracted from the hyperspectral images of wheat leaves, and 24 TFs were extracted from the first three PC images. All four VIs (NRI, PRI, GI, and ARI) and four TFs (COR1, COR2, ENT2, and SEC3) selected by CFS proved to have a strong sensitivity to yellow rust, and the mean values of the healthy and diseased leaves were significantly different. SVM models with different features were created for the identification of wheat yellow rust. The TF-based model provided a relatively good result with an OA of 86.5%. The OAs of the OW- and VI-based models were 83.3% and 89.5%, respectively. The models established using combined features had better performance than the models based on either the spectral features or TFs alone. Compared to the OW model, the OA of the model with combined features (OWs and TFs) was 7.3% higher. The model with combined features (VIs and TFs) provided the highest OA (95.8%), which was 6.3% higher than that of the VI model. The above results confirmed that it is feasible to combine spectral and TFs of hyperspectral images to identify wheat yellow rust. Compared with traditional methods, this method greatly improves the identification accuracy of wheat yellow rust. In addition, it provides a theoretical basis for wheat yellow rust monitoring using UAV hyperspectral remote sensing at the field scale. In the next research, we will explore the possibility of using the combination of spectral features and TFs in UAV-acquired hyperspectral images to identify wheat yellow rust at the field scale.

Author Contributions

A.G. conceived the overall study framework in this work, conducted the data processing and analysis, and completed the manuscript. W.H. proposed the research plan and raised research funds. H.Y., Y.D., and H.M. discussed the research content and revised the paper. A.G., H.M., Y.R., and C.R. participated in the collection and processing of samples in the experiment. All authors have read and agreed to the published version of the manuscript.

Funding

This work was supported by the National Key R&D Program of China (2017YFE0122400), the Strategic Priority Research Program of the Chinese Academy of Sciences (XDA19080304), the Science and Technology Service program of Chinese Academy of Sciences (KFJ-STS-ZDTP-054), the National Natural Science Foundation of China (41871339), the National Special Support Program for High-level Personnel Recruitment (Ten-thousand Talents Program) (Wenjiang Huang), the Youth Innovation Promotion Association CAS (2017085), and the Innovation Foundation of Director of Institute of Remote Sensing and Digital Earth, Chinese Academy of Sciences, China.

Conflicts of Interest

The authors declare no conflict of interest

References

  1. Zheng, Q.; Huang, W.; Cui, X.; Dong, Y.; Shi, Y.; Ma, H.; Liu, L. Identification of wheat yellow rust using optimal three-band spectral indices in different growth stages. Sensors 2019, 19, 35. [Google Scholar] [CrossRef] [PubMed] [Green Version]
  2. Chen, X.M. Epidemiology and control of stripe rust [Puccinia striiformis f.sp.tritici] on wheat. Can. J. Plant Pathol. 2005, 27, 314–337. [Google Scholar] [CrossRef]
  3. Wan, A.M.; Chen, X.M.; He, Z.H. Wheat stripe rust in China. Aust. J. Agric. Res. 2007, 58, 605–619. [Google Scholar] [CrossRef]
  4. Hu, X.; Cao, S.; Xu, X. Predicting overwintering of wheat stripe rust in central and north-western China. Plant Dis. 2020, 104, 44–51. [Google Scholar] [CrossRef] [PubMed]
  5. Sankaran, S.; Mishra, A.; Ehsani, R.; Davis, C. A review of advanced techniques for detecting plant diseases. Comput. Electron. Agric. 2010, 72, 1–13. [Google Scholar] [CrossRef]
  6. Gowen, A.A.; O’Donnell, C.P.; Cullen, P.J.; Downey, G.; Frias, J.M. Hyperspectral imaging—An emerging process analytical tool for food quality and safety control. Trends Food Sci. Technol. 2007, 18, 590–598. [Google Scholar] [CrossRef]
  7. Yao, Z.; Lei, Y.; He, D. Early visual detection of wheat stripe rust using visible/near-infrared hyperspectral imaging. Sensors 2019, 19, 952. [Google Scholar] [CrossRef] [Green Version]
  8. Yao, D.J.; He, Y.L. Identification of powdery mildew and stripe rust in wheat using hyperspectral Imaging. Spectrosc. Spectr. Anal. 2019, 39, 969–976. [Google Scholar]
  9. Bauriegel, E.; Giebel, A.; Herppich, W.B. Hyperspectral and chlorophyll fluorescence imaging to analyse the impact of fusarium culmorum on the photosynthetic integrity of infected wheat ears. Sensors 2011, 11, 3765–3779. [Google Scholar] [CrossRef] [Green Version]
  10. Bauriegel, E.; Giebel, A.; Geyer, M.; Schmidt, U.; Herppich, W.B. Early detection of Fusarium infection in wheat using hyper-spectral imaging. Comput. Electron. Agric. 2011, 75, 304–312. [Google Scholar] [CrossRef]
  11. Shi, Y.; Huang, W.; González-Moreno, P.; Luke, B.; Dong, Y.; Zheng, Q.; Ma, H.; Liu, L. Wavelet-based rust spectral feature set (WRSFs): A novel spectral feature set based on continuous wavelet transformation for tracking progressive host-pathogen interaction of yellow rust on wheat. Remote Sens. 2018, 10, 525. [Google Scholar] [CrossRef] [Green Version]
  12. Huang, W.; Lamb, D.W.; Niu, Z.; Zhang, Y.; Liu, L.; Wang, J. Identification of yellow rust in wheat using in-situ spectral reflectance measurements and airborne hyperspectral imaging. Precis. Agric. 2007, 8, 187–197. [Google Scholar] [CrossRef]
  13. Kavdir, I.; Guyer, D.E. Comparison of artificial neural networks and statistical classifiers in apple sorting using textural features. Biosyst. Eng. 2004, 89, 331–344. [Google Scholar] [CrossRef]
  14. Cen, H.; Lu, R.; Zhu, Q.; Mendoza, F. Nondestructive detection of chilling injury in cucumber fruit using hyperspectral imaging with feature selection and supervised classification. Postharvest Biol. Technol. 2016, 111, 352–361. [Google Scholar] [CrossRef]
  15. Lu, J.; Zhou, M.; Gao, Y. Using hyperspectral imaging to discriminate yellow leaf curl disease in tomato leaves. Precis. Agric. 2017, 19, 379–394. [Google Scholar] [CrossRef]
  16. Xie, C.; He, Y. Spectrum and image texture features analysis for early blight disease detection on eggplant leaves. Sensors 2016, 16, 676. [Google Scholar] [CrossRef] [Green Version]
  17. Pydipati, R.; Burks, T.; Lee, W. Identification of citrus disease using color texture features and discriminant analysis. Comput. Electron. Agric. 2006, 52, 49–59. [Google Scholar] [CrossRef]
  18. Ram, S.; Anand, D.; Jalal, S. Apple disease classification using color, texture and shape features from images. Signal Image Video Process. 2015, 10, 819–826. [Google Scholar]
  19. Al-Saddik, H.; Laybros, A.; Billiot, B.; Cointault, F. Using Image Texture and Spectral Reflectance Analysis to Detect Yellowness and Esca in Grapevines at Leaf-Level. Remote Sens. 2018, 10, 618. [Google Scholar] [CrossRef] [Green Version]
  20. Zhu, H.; Chu, B.; Zhang, C.; Liu, F.; Jiang, L.; He, Y. Hyperspectral Imaging for Presymptomatic Detection of Tobacco Disease with Successive Projections Algorithm and Machine-learning Classifiers. Sci. Rep. 2017, 7, 4125. [Google Scholar] [CrossRef] [Green Version]
  21. Zheng, Q.; Huang, W.; Cui, X.; Shi, Y.; Liu, L. New spectral index for detecting wheat yellow rust using sentinel-2 multispectral imagery. Sensors. 2018, 18, 868. [Google Scholar] [CrossRef] [PubMed] [Green Version]
  22. Jia, B.; Yoon, S.; Zhuang, H.; Wang, W.; Li, C. Prediction of pH of Fresh Chicken Breast Fillets by VNIR Hyperspectral Imaging. J. Food Eng. 2017, 208, 57–65. [Google Scholar] [CrossRef]
  23. Araújo, M.C.U.; Saldanha, T.C.B.; Galvão, R.K.H.; Yoneyama, T.; Chame, H.C.; Visani, V. The successive projections algorithm for variable selection in spectroscopic multicomponent analysis. Chemom. Intell. Lab. Syst. 2001, 57, 65–73. [Google Scholar] [CrossRef]
  24. Galvão, R.K.H.; Araújo, M.C.U.; Fragoso, W.D.; Silva, E.C.; José, G.E.; Soares, S.F.C.; Paiva, H.M. A variable elimination method to improve the parsimony of MLR models using the successive projections algorithm. Chemom. Intell. Lab. Syst. 2008, 92, 83–91. [Google Scholar] [CrossRef]
  25. Zhang, J.C.; Pu, R.L.; Wang, J.H.; Huang, W.J.; Yuan, L.; Luo, J.H. Detecting powdery mildew of winter wheat using leaf level hyperspectral measurements. Comput. Electron. Agric. 2012, 85, 13–23. [Google Scholar] [CrossRef]
  26. Huang, W.; Guan, Q.; Luo, J.; Zhang, J.; Zhao, J.; Liang, D.; Huang, L.; Zhang, D. New optimized spectral indices for identifying and monitoring winter wheat diseases. IEEE J. Sel. Top. Appl. Earth Obs. Remote Sens. 2014, 7, 2516–2524. [Google Scholar] [CrossRef]
  27. Gamon, J.A.; Penuelas, J.; Field, C.B. A Narrow-Waveband Spectral Index That Tracks Diurnal Changes in Photosynthetic Efficiency. Remote Sens. Environ. 1992, 41, 35–44. [Google Scholar] [CrossRef]
  28. Rouse, J.W.; Hass, R.H.; Schell, J.A.; Deering, D.W. Monitoring Vegetation Systems in the Great Plains with Erts. NASA Spéc. Publ. 1974, 1, 309–317. [Google Scholar]
  29. Chen, J.M. Evaluation of vegetation indices and a modified simple ratio for boreal applications. Can. J. Remote Sens. 1996, 22, 229–242. [Google Scholar] [CrossRef]
  30. Broge, N.H.; Leblanc, E. Comparing prediction power and stability of broadband and hyperspectral vegetation indices for estimation of green leaf area index and canopy chlorophyll density. Remote Sens. Environ. 2001, 76, 156–172. [Google Scholar] [CrossRef]
  31. Devadas, R.; Lamb, D.W.; Simpfendorfer, S.; Backhouse, D. Evaluating ten spectral vegetation indices for identifying rust infection in individual wheat leaves. Precis. Agric. 2009, 10, 459–470. [Google Scholar] [CrossRef]
  32. Penuelas, J.; Baret, F.; Filella, I. Semi-empirical indices to assess carotenoids/chlorophyll a ratio from leaf spectral reflectance. Photosynthetica 1995, 31, 221–230. [Google Scholar]
  33. Gitelson, A.A.; Merzlyak, M.N.; Chivkunova, O.B. Optical Properties and Nondestructive Estimation of Anthocyanin Content in Plant Leaves. Photochem. Photobiol. 2001, 74, 38. [Google Scholar] [CrossRef]
  34. Zarco-Tejada, P.J.; Berjón, A.; López-Lozano, R.; Miller, J.R.; Martín, P.; Cachorro, V.; González, M.R.; De Frutos, A. Assessing vineyard condition with hyperspectral indices: Leaf and canopy reflectance simulation in a row-structured discontinuous canopy. Remote Sens. Environ. 2005, 99, 271–287. [Google Scholar] [CrossRef]
  35. Haboudane, D.; Miller, J.R.; Tremblay, N.; Zarco-Tejada, P.J.; Dextraze, L. Integrated narrow-band vegetation indices for prediction of crop chlorophyll content for application to precision agriculture. Remote Sens. Environ. 2002, 81, 416–426. [Google Scholar] [CrossRef]
  36. Merzlyak, M.N.; Gitelson, A.A.; Chivkunova, O.B.; Rakitin, V.Y. Non-destructive optical detection of leaf senescence and fruit ripening. Physiol. Plant. 1999, 106, 135–141. [Google Scholar] [CrossRef] [Green Version]
  37. Merton, R.; Huntington, J. Early Simulation Results of the Aries-1 Satellite Sensor for Multi-Temporal Vegetation Research Derived from Aviris. In Proceedings of the Eighth Annual JPL Airborne Earth Science Workshop, Pasadena, CA, USA, 9–11 February 1999; pp. 1–10. [Google Scholar]
  38. Filella, I.; Serrano, L.; Serra, J.; Penuelas, J. Evaluating wheat nitrogen status with canopy reflectance indices and discriminant analysis. Crop Sci. 1995, 35, 1400–1405. [Google Scholar] [CrossRef]
  39. Zhang, C.; Xie, Z. Combining object-based texture measures with a neural network for vegetation mapping in the Everglades from hyperspectral imagery. Remote Sens. Environ. 2012, 124, 310–320. [Google Scholar] [CrossRef]
  40. Fu, Y.; Zhao, C.; Wang, J.; Jia, X.; Yang, G.; Song, X.; Feng, H. An improved combination of spectral and spatial features for vegetation classification in hyperspectral images. Remote Sens. 2017, 9, 261. [Google Scholar] [CrossRef] [Green Version]
  41. Knauer, U.; Matros, A.; Petrovic, T.; Zanker, T.; Scott, E.S.; Seiffert, U. Improved classification accuracy of powdery mildew infection levels of wine grapes by spatial-spectral analysis of hyperspectral images. Plant Methods 2017, 13, 1–15. [Google Scholar] [CrossRef]
  42. Jia, B.; Wang, W.; Yoon, S.-C.; Zhuang, H.; Li, Y.-F. Using a Combination of Spectral and Textural Data to Measure Water-Holding Capacity in Fresh Chicken Breast Fillets. Appl. Sci. 2018, 8, 343. [Google Scholar] [CrossRef] [Green Version]
  43. Haralick, R.M.; Shanmugam, K.; Dinstein, I.H. Textural features for image classification. Syst. Man Cybern. 1973, 6, 610–621. [Google Scholar] [CrossRef] [Green Version]
  44. Cao, J.; Leng, W.; Liu, K.; Liu, L.; He, Z.; Zhu, Y. Object-Based mangrove species classification using unmanned aerial vehicle hyperspectral images and digital surface models. Remote Sens. 2018, 10, 89. [Google Scholar] [CrossRef] [Green Version]
  45. Chuanlei, Z.; Shanwen, Z.; Jucheng, Y.; Yancui, S.; Jia, C. Apple leaf disease identification using genetic algorithm and correlation based feature selection method. Int. J. Agric. Biol. Eng. 2017, 10, 74–83. [Google Scholar]
  46. Hall, M.A.; Holmes, G. Benchmarking Attribute Selection Techniques for Discrete Class Data Mining. IEEE Trans. Knowl. Data Eng. 2003, 15, 1437–1447. [Google Scholar] [CrossRef] [Green Version]
  47. Karegowda, A.G.; Manjunath, A.S.; Ratio, G.; Evaluation, C.F. Comparative study of attribute selection using gain ratio and correlation based feature selection. Int. J. Inf. Technol. Knowl. Knowl. Manag. 2010, 2, 271–277. [Google Scholar]
  48. Rumpf, T.; Mahlein, A.; Steiner, U.; Oerke, E.; Dehne, H.; Plümer, L. Early detection and classification of plant diseases with Support Vector Machines based on hyperspectral reflectance. Comput. Electron. Agric. 2010, 74, 91–99. [Google Scholar] [CrossRef]
  49. Römer, C.; Bürling, K.; Hunsche, M.; Rumpf, T.; Noga, G.; Plümer, L. Robust fitting of fluorescence spectra for pre-symptomatic wheat leaf rust detection with Support Vector Machines. Comput. Electron. Agric. 2011, 79, 180–188. [Google Scholar] [CrossRef]
  50. Amari, S.; Wu, S. Improving support vector machine classifiers by modifying kernel functions. Neural Netw. 1999, 12, 783–789. [Google Scholar] [CrossRef]
  51. Hsu, C.W.; Chang, C.C.; Lin, C.J. A Practical Guide to Support Vector Classificatio; Dep. Comput. Sci. Natl. Taiwan Univ.: Taipei, Taiwan, 2008. [Google Scholar]
  52. Ma, H.; Huang, W.; Jing, Y.; Pignatti, S.; Laneve, G.; Dong, Y.; Ye, H.; Liu, L.; Guo, A.; Jiang, J. Identification of Fusarium Head Blight in Winter Wheat Ears Using Continuous Wavelet Analysis. Sensors 2019, 20, 20. [Google Scholar] [CrossRef] [Green Version]
  53. Zhang, J.; Huang, Y.; Pu, R.; Gonzalez-Moreno, P.; Yuan, L.; Wu, K.; Huang, W. Monitoring plant diseases and pests through remote sensing technology: A review. Comput. Electron. Agric. 2019, 165, 104943. [Google Scholar] [CrossRef]
  54. Piedra-Fernández, J.A.; Cantón-Garbín, M.; Wang, J.Z. Feature selection in AVHRR ocean satellite images by means of filter methods. IEEE Trans. Geosci. Remote Sens. 2010, 48, 4193–4203. [Google Scholar] [CrossRef]
  55. Xu, X.; Ma, L.; Hu, X. Overwintering of wheat stripe rust under field conditions in the northwestern regions of China. Plant Dis. 2019, 103, 638–644. [Google Scholar] [CrossRef] [PubMed] [Green Version]
  56. Su, J.; Liu, C.; Hu, X.; Xu, X.; Guo, L.; Chen, W.H. Spatio-temporal monitoring of wheat yellow rust using UAV multispectral imagery. Comput. Electron. Agric. 2019, 167, 105035. [Google Scholar] [CrossRef]
  57. Zhang, X.; Han, L.; Dong, Y.; Shi, Y.; Huang, W.; Han, L.; González-Moreno, P.; Ma, H.; Ye, H.; Sobeih, T. A Deep Learning-Based Approach for Automated Yellow Rust Disease Detection from High-Resolution Hyperspectral UAV Images. Remote Sens. 2019, 11, 1554. [Google Scholar] [CrossRef] [Green Version]
  58. Su, J.; Liu, C.; Coombes, M.; Hu, X.; Wang, C.; Xu, X.; Li, Q.; Guo, L.; Chen, W.H. Wheat yellow rust monitoring by learning from multispectral UAV aerial imagery. Comput. Electron. Agric. 2018, 155, 157–166. [Google Scholar] [CrossRef]
  59. Zhang, J.; Pu, R.; Loraamm, R.W.; Yang, G.; Wang, J. Comparison between wavelet spectral features and conventional spectral features in detecting yellow rust for winter wheat. Comput. Electron. Agric. 2014, 100, 79–87. [Google Scholar] [CrossRef]
  60. Cheng, T.; Rivard, B.; Sanchez-Azofeifa, A. Spectroscopic determination of leaf water content using continuous wavelet analysis. Remote Sens. Environ. 2011, 115, 659–670. [Google Scholar] [CrossRef]
Figure 1. A schematic diagram of the Headwall hyperspectral imaging.
Remotesensing 12 01419 g001
Figure 2. Flowchart of data analysis and processing.
Remotesensing 12 01419 g002
Figure 3. Development of disease symptoms of wheat yellow rust from 7 dai to 42 dai.
Remotesensing 12 01419 g003
Figure 4. The curves of average spectral reflectance of all healthy and yellow rust-infected samples obtained from seven experiments.
Remotesensing 12 01419 g004
Figure 5. (a) Change of the root mean square error (RMSE) in the successive projections algorithm (SPA); (b) the optimal wavebands (OWs) selected using SPA.
Remotesensing 12 01419 g005
Figure 6. Extraction of yellow rust-infected areas on wheat leaves with different damage levels using the combination of vegetation indices (VIs) and texture features (TFs). The infected areas of (af) account for 6%, 20%, 19%, 29%, 25%, and 61%, respectively; the lesions are scattered in (a,b), and (d) and concentrated in (c,e,f).
Remotesensing 12 01419 g006
Table 1. The number of healthy and yellow rust-infected wheat leaves obtained during each observation period.
20 April27 April 4 May11 May15 May18 May 25 May
Healthy8667756
Yellow Rust46688109
Sum12121215151515
Table 2. Vegetation indices used for the identification of wheat yellow rust in this study.
IndexDefinitionBands and EquationsRelated ToReference
PRIPhotosynthetic Radiation Index ( R 570 R 531 ) / ( R 570 R 531 ) Photosynthetic activity[27]
PHRIPhysiological Reflectance Index ( R 550 R 531 ) / ( R 550 + R 531 ) [27]
NDVINormalized Difference Vegetation Index ( R 830 R 675 ) / ( R 830 + R 675 ) [28]
MSRModified Simple Ratio ( R 800 / R 670 1 ) / sqrt ( R 800 R 670 + 1 ) Crop growth status[29]
TVITriangular Vegetation Index 0.5 ( 120 ( R 750 R 550 ) 200 ( ( R 670 R 550 ) ) [30]
SIPIStructural Independent Pigment Index ( R 800 R 445 ) / ( R 800 R 680 ) Pigment content [31]
NPCINormalized Pigment Chlorophyll Index ( R 680 R 430 ) / ( R 680 + R 430 ) [32]
ARIAnthocyanin Reflectance Index ( R 550 ) 1 ( R 700 ) 1 [33]
GIGreenness Index R 554 / R 667 [34]
TCARITransformed Chlorophyll Absorption in Reflectance Index 3 ( ( R 700 R 675 ) 0.2 ( R 700 R 500 ) ( R 700 / R 670 ) [35]
PSRIPlant Senescence Reflectance Index ( R 680 R 500 ) / R 750 [36]
RVSIRatio Vegetation Structure Index R 712 + R 752 2 R 732 Water and nitrogen content[37]
NRINitrogen Reflectance Index ( R 570 R 670 ) / ( R 570 + R 670 ) [38]
YRIYellow Rust Index, R 730 R 419 R 730 + R 419 + 0.5 R 736 Wheat disease[26]
Table 3. The grey-level co-occurrence matrix (GLCM) textural features used in this study.
TextureDescriptionEquation
Mean (MEA)The Mean is the average grey level of all pixels in the matrix. MEA = x , y = 1 G x P ( x , y )
Variance (VAR)The Variance describes the rate of change of the pixels’ values. V A R = x = 1 G y = 1 G ( x u ) 2 P ( x , y )
Homogeneity (HOM)The Homogeneity indicates the uniformity of the matrix. H O M = x = 1 G y = 1 G P ( x , y ) 1 + ( x y ) 2
Contrast (CON)The Contrast represents the local variations in the matrix. C O N = x = 1 G y = 1 G ( x y ) 2 P ( x , y )
Dissimilarity (DIS)The Dissimilarity reflects the difference in the grayscale. D I S = x = 1 G y = 1 G P ( x , y ) | x y |
Entropy (ENT)The Entropy expresses the level of disorder in the matrix. E N T = x = 1 G y = 1 G P ( x , y ) l o g P ( x , y )
Second moment (SEC)The Second Moment represents the uniformity degree of the grayscale. S E C = x = 1 G y = 1 G P 2 ( x , y )
Correlation (COR)The orrelation is a measurement of image linearity among the pixels. C O R = x = 1 G y = 1 G ( x y ) ( y x ) P ( x , y ) V A R x V A R y
Note: In the equations, x and y represent the row number and column number of the image, respectively; P(x,y) represents the relative frequency of two neighboring pixels.
Table 4. Summary statistics of VIs and TFs selected by the correlation-based feature selection (CFS).
FeaturesMeanStandard Deviations Significance of T-Test
Healthy Yellow RustHealthy Yellow Rust
VIsNRI0.2640.1160.0740.065***
PRI0.0840.2600.0680.092***
GI1.8581.2220.3260.231***
ARI−2.0380.8831.4890.949***
TFsCOR10.2410.3530.1200.101***
COR20.1400.1140.0880.017***
ENT20.2790.4620.1580.159***
SEC31.5031.9500.4290.160***
Note: *** indicates that the mean difference is significant at the 0.999 level.
Table 5. Comparison of the results of the identification model using the support vector machine (SVM) based on different features.
Input Feature Yellow RustHealthySumU (%)OA (%)Kappa
OWsYellow Rust38114977.583.30.667
Healthy5424789.4
Sum435396
P (%)88.479.2
VIsYellow Rust4814998.089.50.789
Healthy9384780.9
Sum573996
P (%)84.297.4
TFsYellow Rust4274985.786.50.73
Healthy6414787.2
Sum484896
P (%)87.585.4
OWs + TFsYellow Rust4454989.890.60.812
Healthy4434791.5
Sum484896
P (%)91.789.6
VIs + TFsYellow Rust4904910095.80.916
Healthy4434791.5
Sum534396
P (%)92.5100

