Article

CERES Energy Balanced and Filled (EBAF) from Afternoon-Only Satellite Orbits

Langley Research Center, NASA, Mail Stop 420, Hampton, VA 23681, USA
*
Author to whom correspondence should be addressed.
Remote Sens. 2020, 12(8), 1280; https://doi.org/10.3390/rs12081280
Submission received: 23 March 2020 / Revised: 13 April 2020 / Accepted: 15 April 2020 / Published: 17 April 2020

Abstract

:
The Clouds and the Earth’s Radiant Energy System (CERES) Energy Balanced and Filled (EBAF) data product uses a diurnal correction methodology to produce a shortwave (SW) top-of-atmosphere (TOA) radiative flux time series that accounts for diurnal cycle changes between CERES observation times while ensuring that the stability of the EBAF record is tied as closely as possible to CERES instrument calibration stability. The current EBAF Ed4.1 data product combines observations from Terra and Aqua after July 2002. However, the Terra satellite will start to drift in Mean Local Time (MLT) in early 2021, and Aqua’s MLT will start to drift in 2022. To ensure the EBAF record remains temporally stable, we explore the feasibility of using only CERES instruments from afternoon satellite orbits with a tight 1330 MLT after July 2002. We test this approach by directly comparing SW TOA fluxes generated after applying diurnal corrections to Aqua-only and to Terra + Aqua for 07/2002–06/2019. We find that global climatological mean SW TOA fluxes for these two cases are within 0.01 Wm−2 and the trend of the difference is < is 0.03 Wm−2 per decade.

Graphical Abstract

1. Introduction

Earth radiation budget (ERB) is a key indicator of the climate system as it describes the delicate balance between how much of the sun’s energy reaching Earth is absorbed and how much thermal infrared radiation is emitted back to space. If Earth absorbs more energy from the sun as visible light than it emits to space as thermal infrared radiation, it will eventually warm up, altering sea level, precipitation patterns, and extreme weather. Climate models project large changes in our climate due to changes in ERB that result from increases in well-mixed greenhouse gases, changes in aerosol concentration and land-usage [1]. The need to monitor ERB and the components of the climate system that it interacts with cannot be overstated: ERB observations provide crucial constraints on climate model projections of future warming and enable a process-level understanding of the energy flow within the climate system and how it is changing.
Since 2000, the Clouds and the Earth’s Radiant Energy System (CERES) has been providing global observations of ERB at the top-of-atmosphere (TOA), within the atmosphere and at the surface, together with the associated cloud, aerosol, surface and meteorological properties over a range of time and space scales [2,3]. To produce these data products, the CERES team combines measurements from CERES broadband radiometers and narrowband imagers aboard both sun-synchronous and geostationary (GEO) platforms [4]. CERES instruments are currently flying on the Terra (Launched L1999), Aqua (L2002), Suomi National Polar-Orbiting Partnership (S-NPP; L2011), and NOAA-20 (L2017) satellites. CERES instruments measure radiances in the shortwave (SW; wavelengths between 0.3 and 5 μm), total (TOT; wavelengths between 0.3 and 200 μm), and window (WN; wavelengths between 8 and 12 μm) regions (CERES on NOAA-20 replaces the WN channel with a longwave channel). The Terra satellite is in a descending sun-synchronous orbit with an equator-crossing mean local time (MLT) of 1030, while Aqua, SNPP, and NOAA-20 are in ascending sun-synchronous orbits with an equator-crossing MLT of 1330.
The CERES Energy Balanced and Filled (EBAF) product consists of monthly 1° × 1° regional TOA and surface radiative flux climate data records (CDRs). EBAF leverages off of other CERES data products that provide a spatially and temporally complete representation of ERB, but have certain limitations. First, the absolute calibration of CERES instruments [1% SW, 0.5% TOT; one standard deviation (1σ)] is insufficient to determine the absolute value of Earth’s energy imbalance (EEI) that is of order 0.5–1.0 Wm−2. To overcome this, EBAF adjusts the SW and LW global mean fluxes within uncertainty such that its 10-year mean EEI is consistent with EEI estimated from in-situ data [5]. A second issue is diurnal correction. To provide a diurnally complete representation of ERB, all available GEO imager data between 60°S and 60°N are used to account for cloud-radiation changes between CERES observation times. This involves converting the GEO imager narrowband radiances to broadband radiances, and then using the CERES Angular Distribution Models (ADMs) to infer fluxes from radiances. Since the start of the CERES record, a total of 20 GEO imagers of varying quality have been processed to produce the SYN1deg product [4]. While the GEO imager data quality for the infrared channels is good owing to the presence of stable onboard blackbodies, GEO artifacts for the visible bands are problematic in many cases (e.g., calibration, variation of sensor spectral response across sensors, bad scan lines, etc.). To avoid introducing spurious discontinuities in the CERES EBAF record due to GEO visible channel artifacts, EBAF relies on an empirical methodology for diurnal correction of SW TOA fluxes that is less susceptible to GEO imager problems [2]. In the current version of EBAF (Ed4.1), the SW empirical diurnal corrections are derived from and applied to Terra prior to the launch of Aqua in 2002, and to both Terra and Aqua from 2002 onward.
During the Terra and Aqua missions, the equator crossing MLTs have been maintained as close as possible to 1030 for Terra and 1330 for Aqua. However, due to limited fuel supplies, the MLTs of these satellites will soon drift in time. It is projected that the MLT of Terra’s descending node will change from 1030 in 2021 to 0900 in 2026 (Figure 1). For Aqua, the MLT of its ascending node will change from 1330 in 2022 to 1500 in 2025. When this occurs, the empirical diurnal adjustments currently used in EBAF will no longer be applicable. Furthermore, while the remaining CERES instruments aboard S-NPP and NOAA-20 are in afternoon orbits with MLTs close to Aqua’s 1330 MLT, there is no plan for a future ERB instrument in a morning orbit similar to Terra. Therefore, a different strategy for generating a stable, long-term CERES CDR of ERB after Terra and Aqua start to drift in MLT is needed.
This paper discusses the strategy that will be used to continue the EBAF record after Terra and Aqua start to drift in MLT. We focus mainly on the diurnal correction part of the problem and show validation results by comparing with the approach used in EBAF processing. In the following section, we review the empirical diurnal correction used in EBAF Ed4.1 and discuss the options for continuing the EBAF record after Terra and Aqua start to drift in MLT. Section 3 presents some validation results for an afternoon-only EBAF record, and Section 4 provides a summary and conclusions.

2. EBAF SW Empirical Diurnal Correction

2.1. Methodology

We provide a brief summary of the SW empirical diurnal correction used in EBAF Ed4.1. A more detailed description is given in Loeb et al. [2]. The two CERES data products used to generate the diurnal corrections are: SSF1deg-day and SYN1deg-day. Both use spatially averaged instantaneous SW TOA flux values on a 1° equal-area grid. In SSF1deg, SW radiative fluxes between CERES observation times are determined from the observed CERES fluxes and scene-dependent diurnal albedo models, which describe how TOA albedo (and therefore flux) changes with solar zenith angle. In SSF1deg, scene properties between CERES observation times are assumed to remain invariant. The diurnal albedo models are based upon the CERES Angular Distribution Models (ADMs) developed for the Tropical Rainfall Measuring Mission (TRMM) satellite for ocean and land [6] and Terra and Aqua over snow and sea-ice [7]. In SYN1deg, changes in clouds and radiation between CERES observation times are explicitly accounted for by supplementing CERES observations with 1-hourly imager data from five contiguous GEO satellites covering 60°S–60°N at any given time. The GEO data are calibrated against coincident MODIS radiances prior to being used [8]. A detailed description of the steps involved to determine broadband TOA fluxes from GEO imagers and merge them with CERES is given in Doelling et al. [4]. While SSF1deg provides global coverage daily with excellent calibration stability, its diurnal sampling is limited to CERES observation times. In contrast, by merging CERES and GEO, SYN1deg provides hourly diurnal coverage but is vulnerable to artifacts in the GEO data, which can introduce spurious jumps in the ERB record.
In order to maintain the excellent CERES instrument calibration stability of SSF1deg while at the same time preserving the diurnal information found in SYN1deg, diurnal correction in EBAF involves multiplying daily 1° × 1° regional mean SSF1deg SW fluxes by pre-determined empirical diurnal correction ratios (DCRs) over the GEO area of coverage (60°S–60°N). The diurnally adjusted daily SSF1deg fluxes are then temporally averaged to produce monthly SW TOA fluxes that are diurnally complete and analogous to SYN1deg, but without GEO artifacts. DCRs are SYN1deg-to-SSF1deg flux ratios derived from daily mean SW TOA fluxes between July 2002 and June 2015. Poleward of 60°, DCRs are set to unity. The DCRs are stratified according to calendar month, surface type, latitude, and a daily Diurnal Asymmetry Ratio (DAR), defined as follows:
DAR = F S W ( morn ) F S W ( aft ) F S W ( 24 h )
where F S W (morn) is the mean SW flux corresponding to 0 h to 12 h local time, F S W (aft) is the mean SW flux corresponding to 12 h to 24 h local time, and F S W (24h) is the mean 24-h SW flux. DAR is derived using GEO imager data over 60°S–60°N, and provides a measure of SW TOA flux difference associated with cloud changes between morning and afternoon. Because DAR is a difference between morning and afternoon TOA SW fluxes and is normalized by the 24-h flux, the impact of any systematic GEO imager calibration errors is minimized. In addition, because a single set of DCRs is applied to SSF1deg SW fluxes over the entire CERES record, the stability of the record is more closely tied to that of the CERES instruments than SYN1deg. The benefit of this approach over SYN1deg for determining regional trends in SW TOA flux is discussed in detail in Loeb et al. [2] (see their Figure 2).
An example of how DCR changes with DAR for ocean between 29°–30°S is shown in Figure 2 for Terra-only, Aqua-only and when Terra and Aqua are combined. The Terra-based DCR is <1 when DAR is positive and >1 when DAR is negative. For Aqua, the reverse is true. This is because Terra’s daytime observation occurs during morning while Aqua’s occurs during the afternoon. Note that the Terra-only and Aqua-only DCRs can reach 20% at DAR values of ±0.6. When diurnal corrections are developed for Terra and Aqua combined, the DCRs remain close to 1 for all DAR values. This is because the Terra and Aqua orbits are ideally placed in MLT to provide a very good representation of the daily mean without the need for large diurnal corrections.

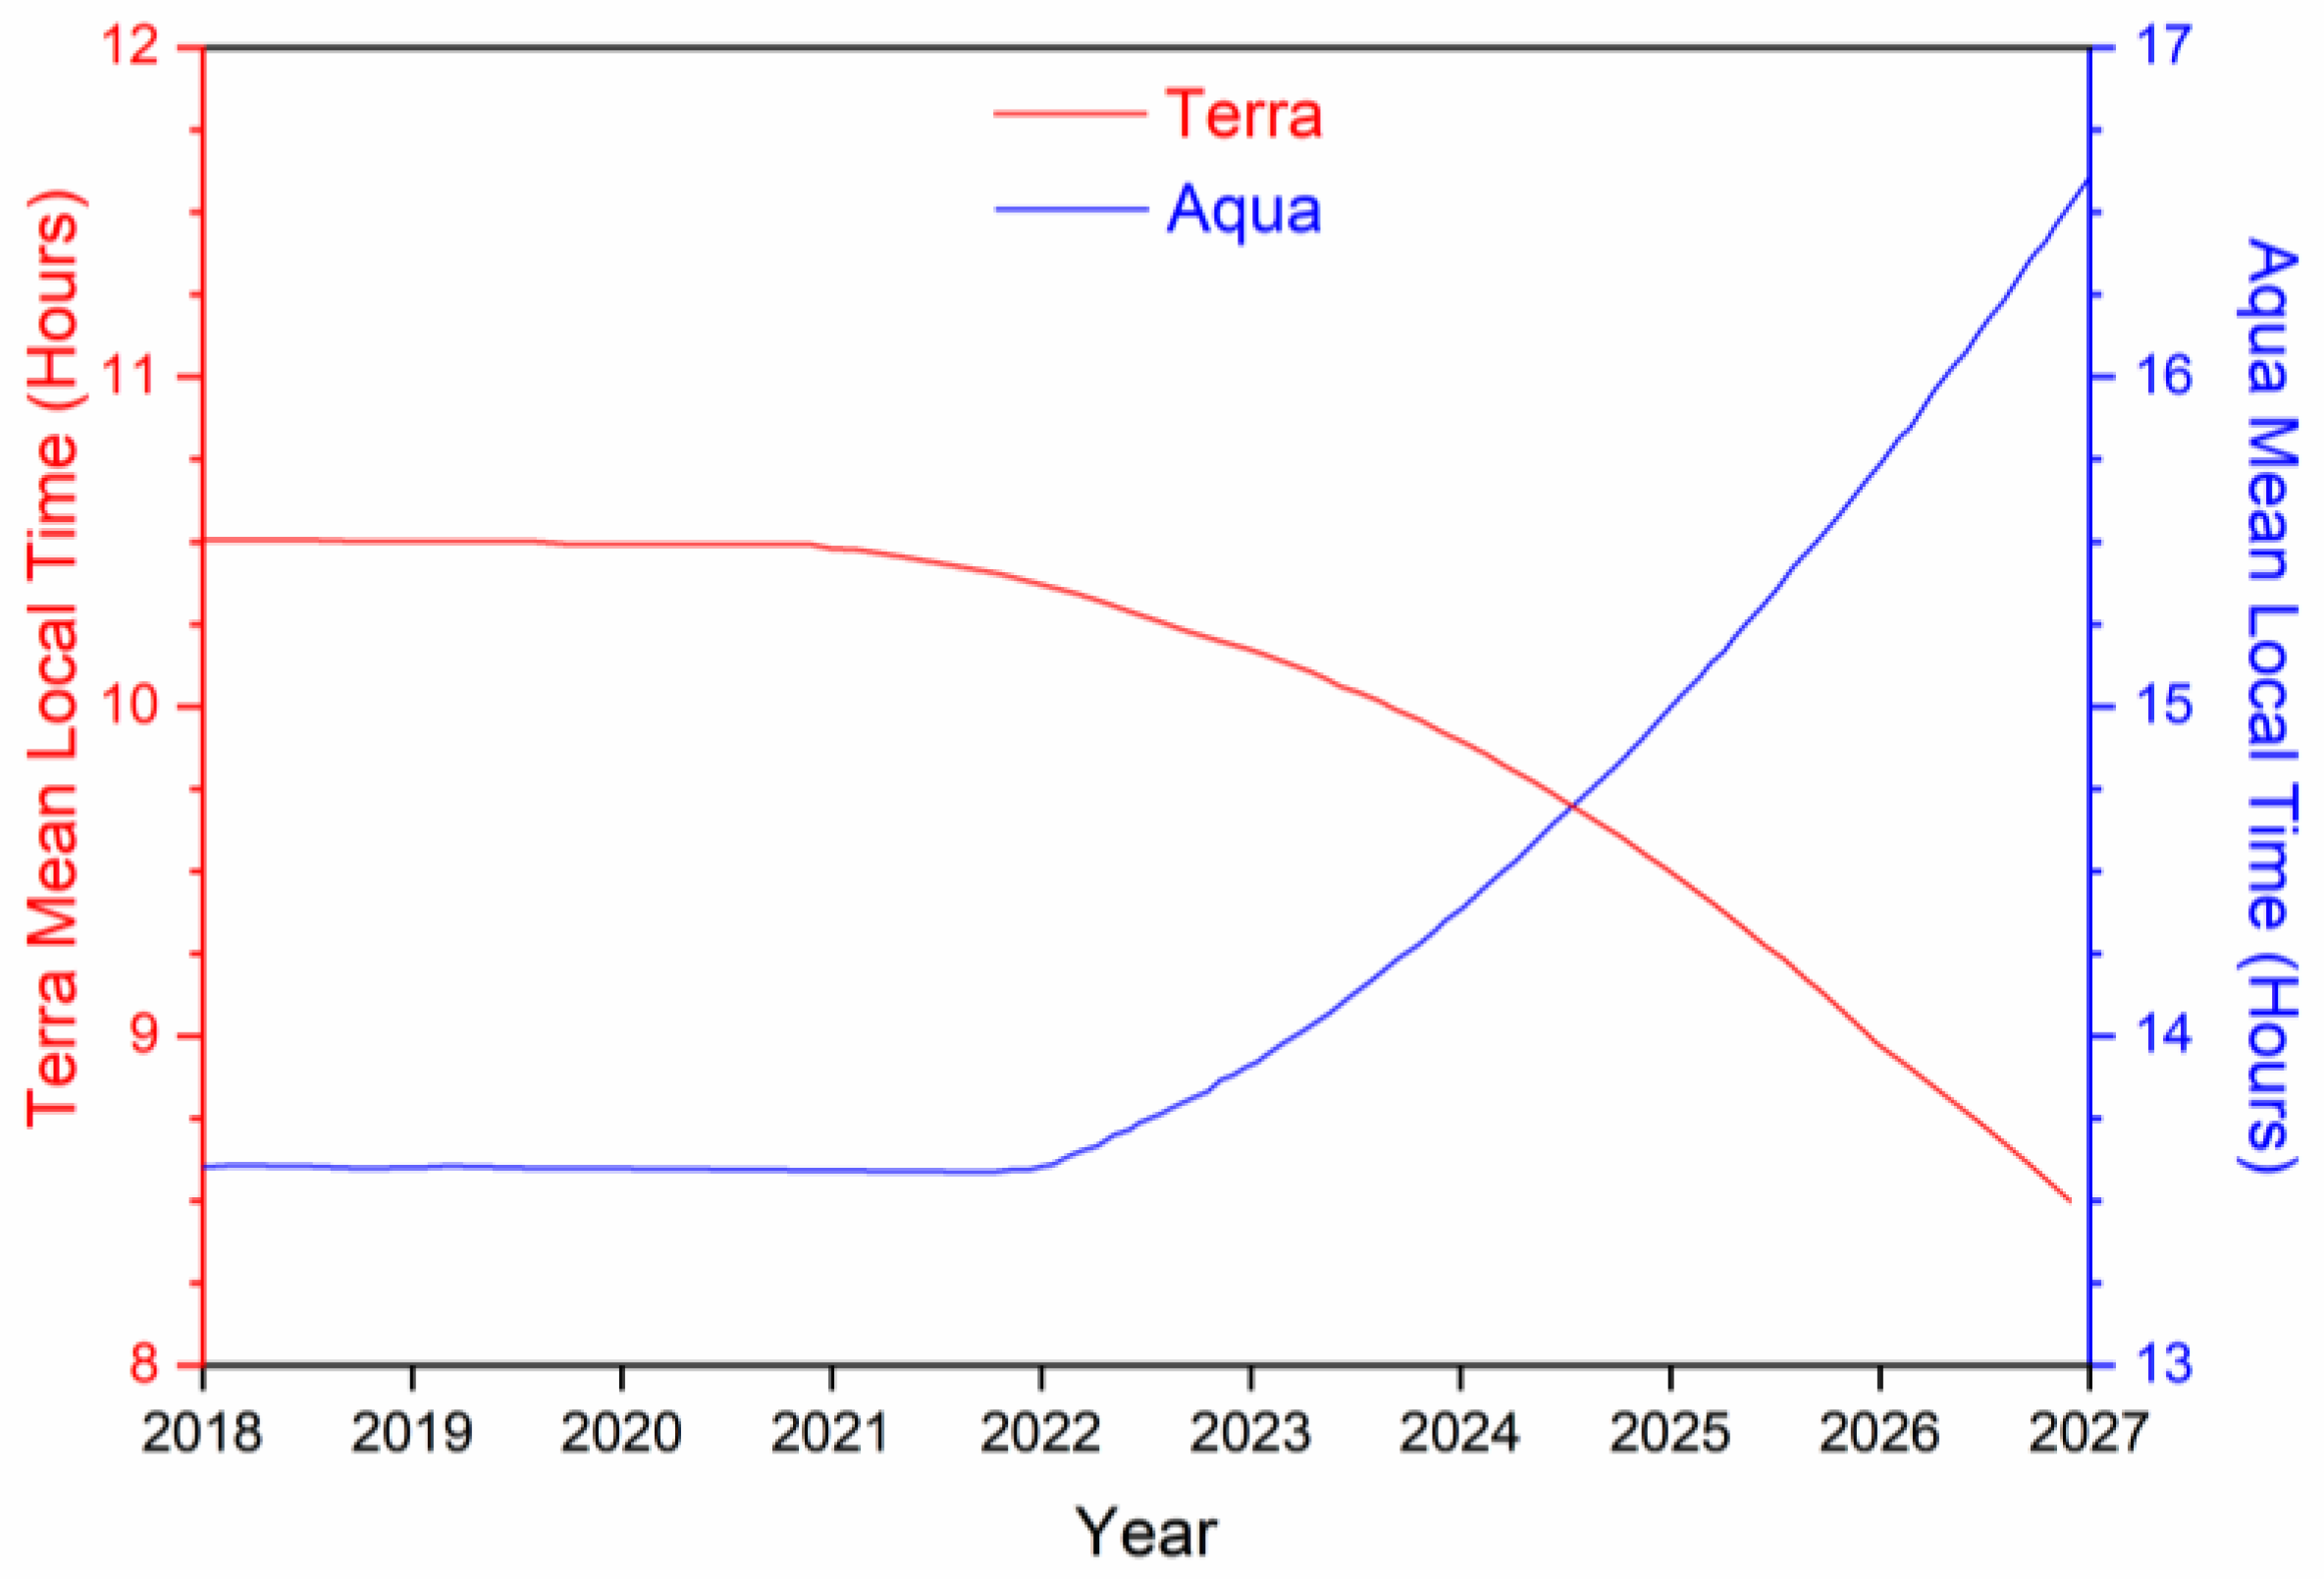
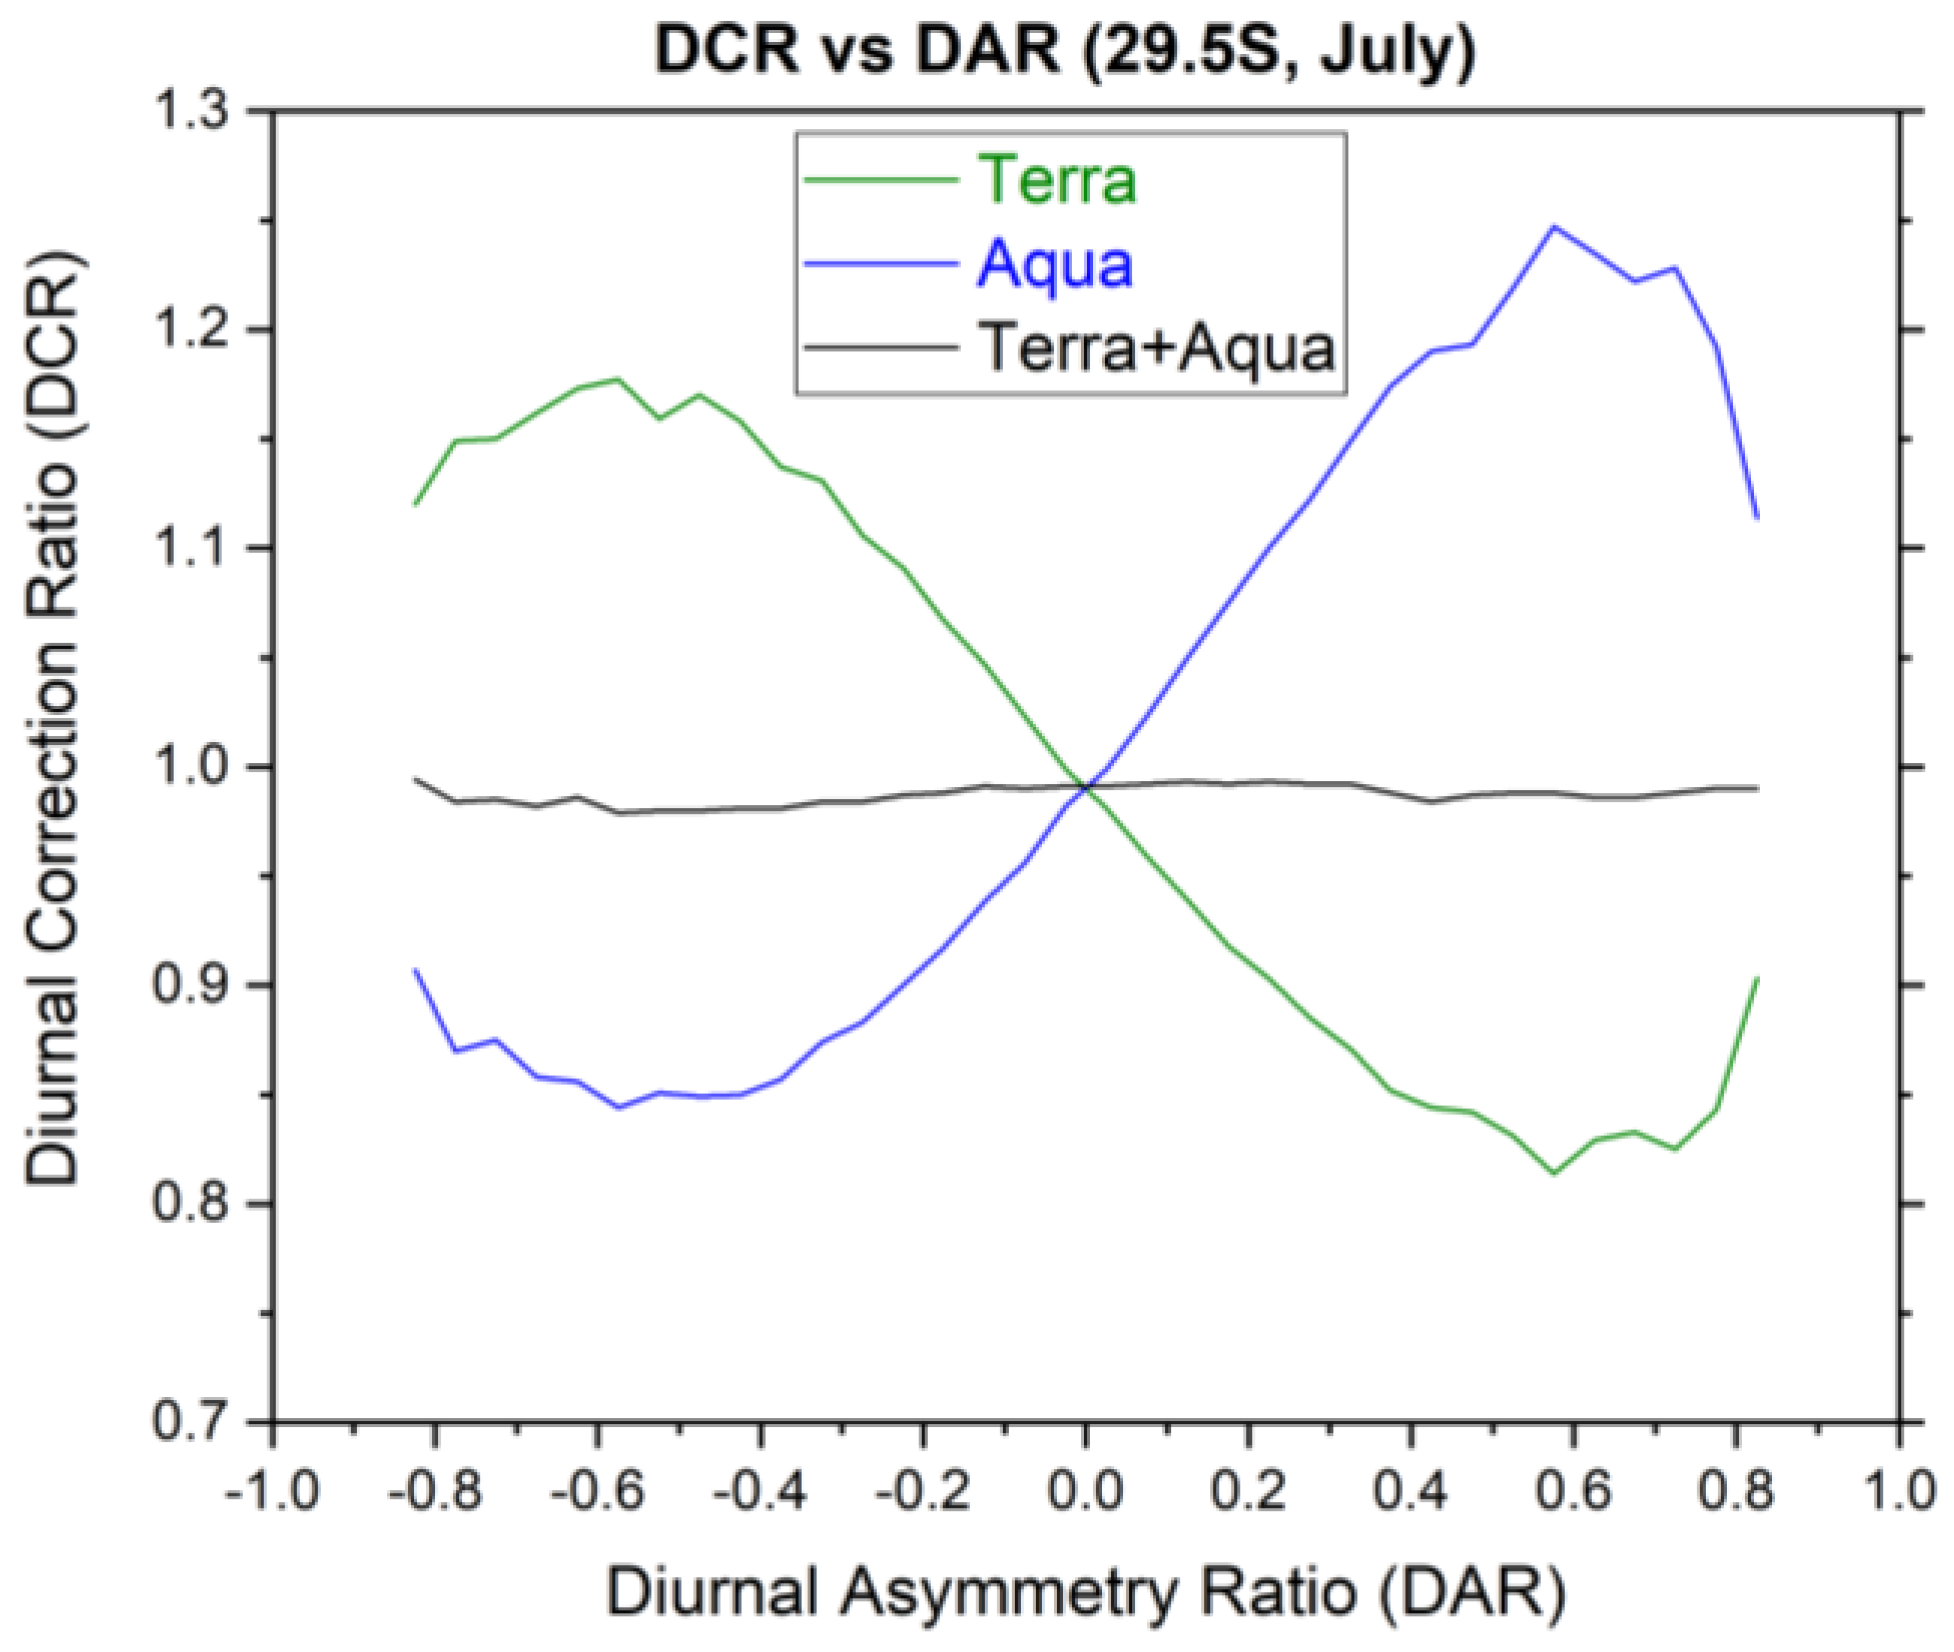
2.2. Diurnal Correction after Terra and Aqua Start to Drift in MLT

In EBAF Ed4.1, Terra-only DCRs are used for March 2000–June 2002, prior to the launch of Aqua. From July 2002 onwards, the DCRs are applied to SSF1deg daily means generated by combining Terra and Aqua. Starting in 2021, Terra’s MLT will no longer be maintained at 1030 and Aqua’s 1330 MLT will start to drift in 2022. This is problematic since the DCRs were developed for fixed Terra and Aqua MLTs. Applying the same DCRs after the satellites begin to drift in MLT would likely result in a systematic SW TOA flux trend since the current DCRs were not designed to account for shifts in MLT.
An alternative option is to use either the CERES instruments on S-NPP or NOAA-20 to continue the EBAF record after Terra and Aqua begin to drift. However, it is not immediately obvious that transitioning from an EBAF record constructed with Terra + Aqua to S-NPP or NOAA-20 would be free of discontinuities, particularly regionally. To illustrate, Figure 3 shows regional differences between SSF1deg monthly means for Aqua and Terra + Aqua after applying empirical diurnal corrections. Regional differences are apparent in the stratocumulus region off South America in January and October, and large positive differences are apparent in October to the east of Australia. Differences are also apparent poleward of 60°. The latter are primarily due to sampling differences rather than diurnal corrections since the diurnal corrections are not applied there. The overall global mean bias remains <0.13 Wm−2 and the monthly regional root-mean-square (RMS) difference ranges from 2.0 to 2.5 Wm−2. By comparison, the standard deviation in regional monthly mean SW TOA fluxes is 20 Wm−2. Thus, differences between Aqua-only and Terra + Aqua are an appreciable fraction of the monthly variability even after applying diurnal corrections. Continuing the current Terra + Aqua record with S-NPP or NOAA-20 after Terra and Aqua begin to drift would therefore result in regional discontinuities, which could introduce spurious regional SW TOA flux trends.
A better approach is to reprocess the CERES record using only the afternoon satellites with a tight 1330 MLT throughout the record (Figure 4). This would require making larger diurnal corrections than those in EBAF Ed4.1, which combine Terra and Aqua (Figure 2), but it would avoid introducing a discontinuity in the record after Terra and Aqua start to drift in MLT. Admittedly, both approaches rely on Terra only at the beginning of the record, prior to the launch of Aqua. While this is unavoidable, users have the option of not including this early part of the CERES record.

3. Validation of Afternoon-Only EBAF Record

This section evaluates the impact of using an Aqua-only time series of TOA fluxes in EBAF instead of the current Terra + Aqua time series. As such, we compute differences between TOA fluxes using diurnal corrections applied to Aqua only with those applied to both Terra and Aqua.

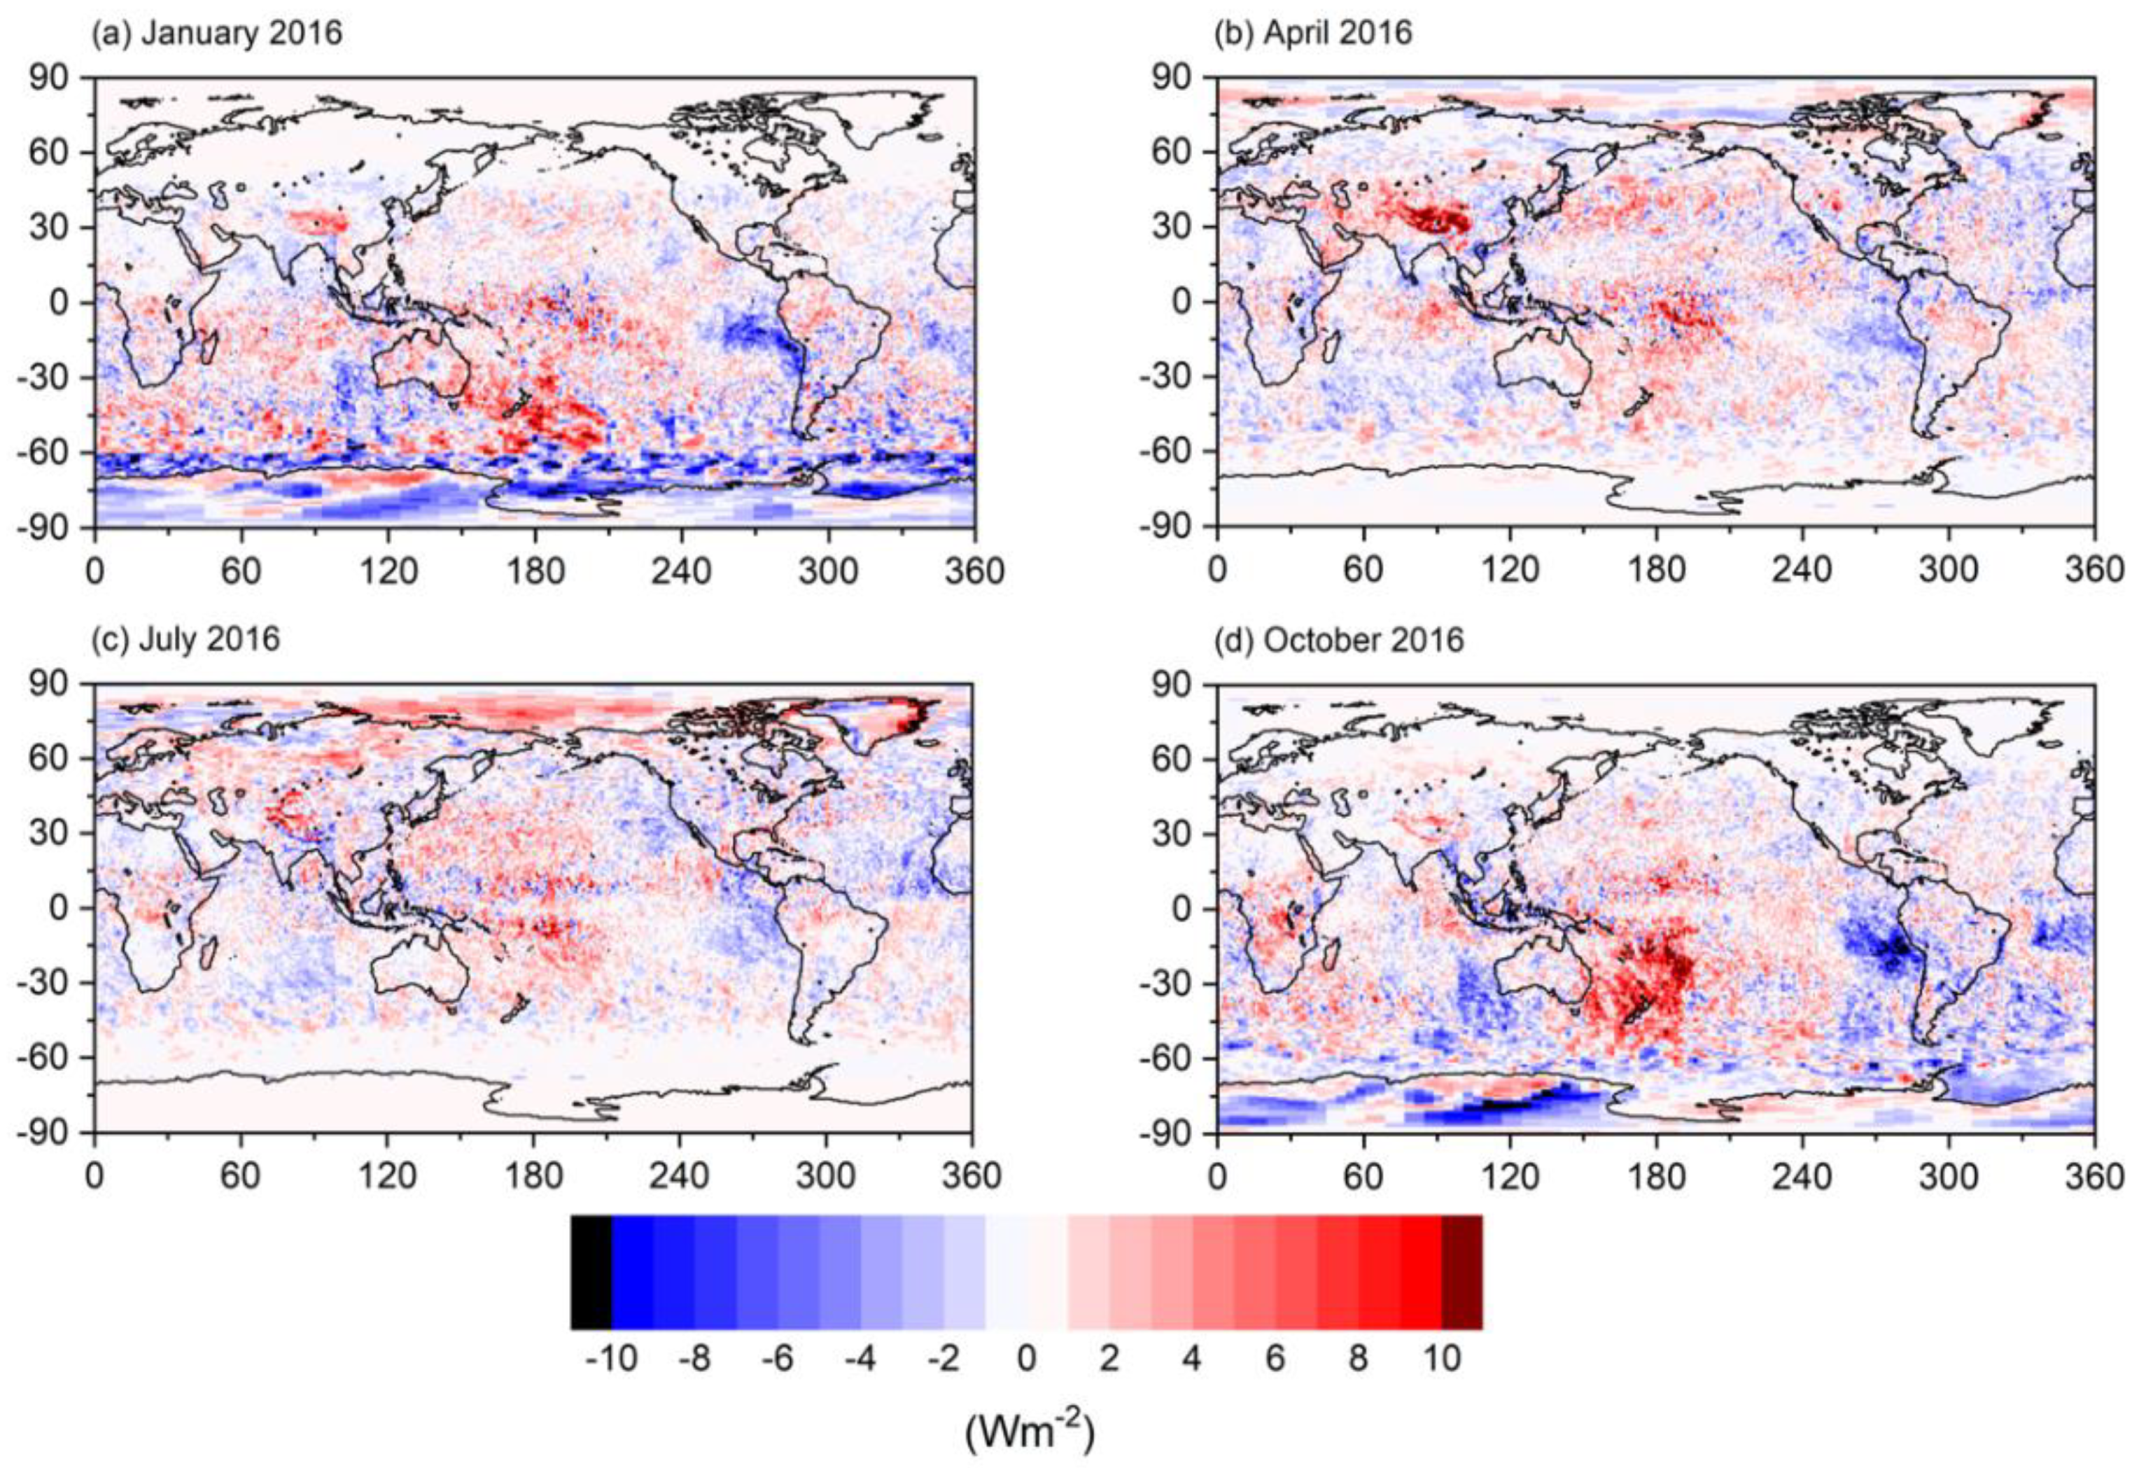
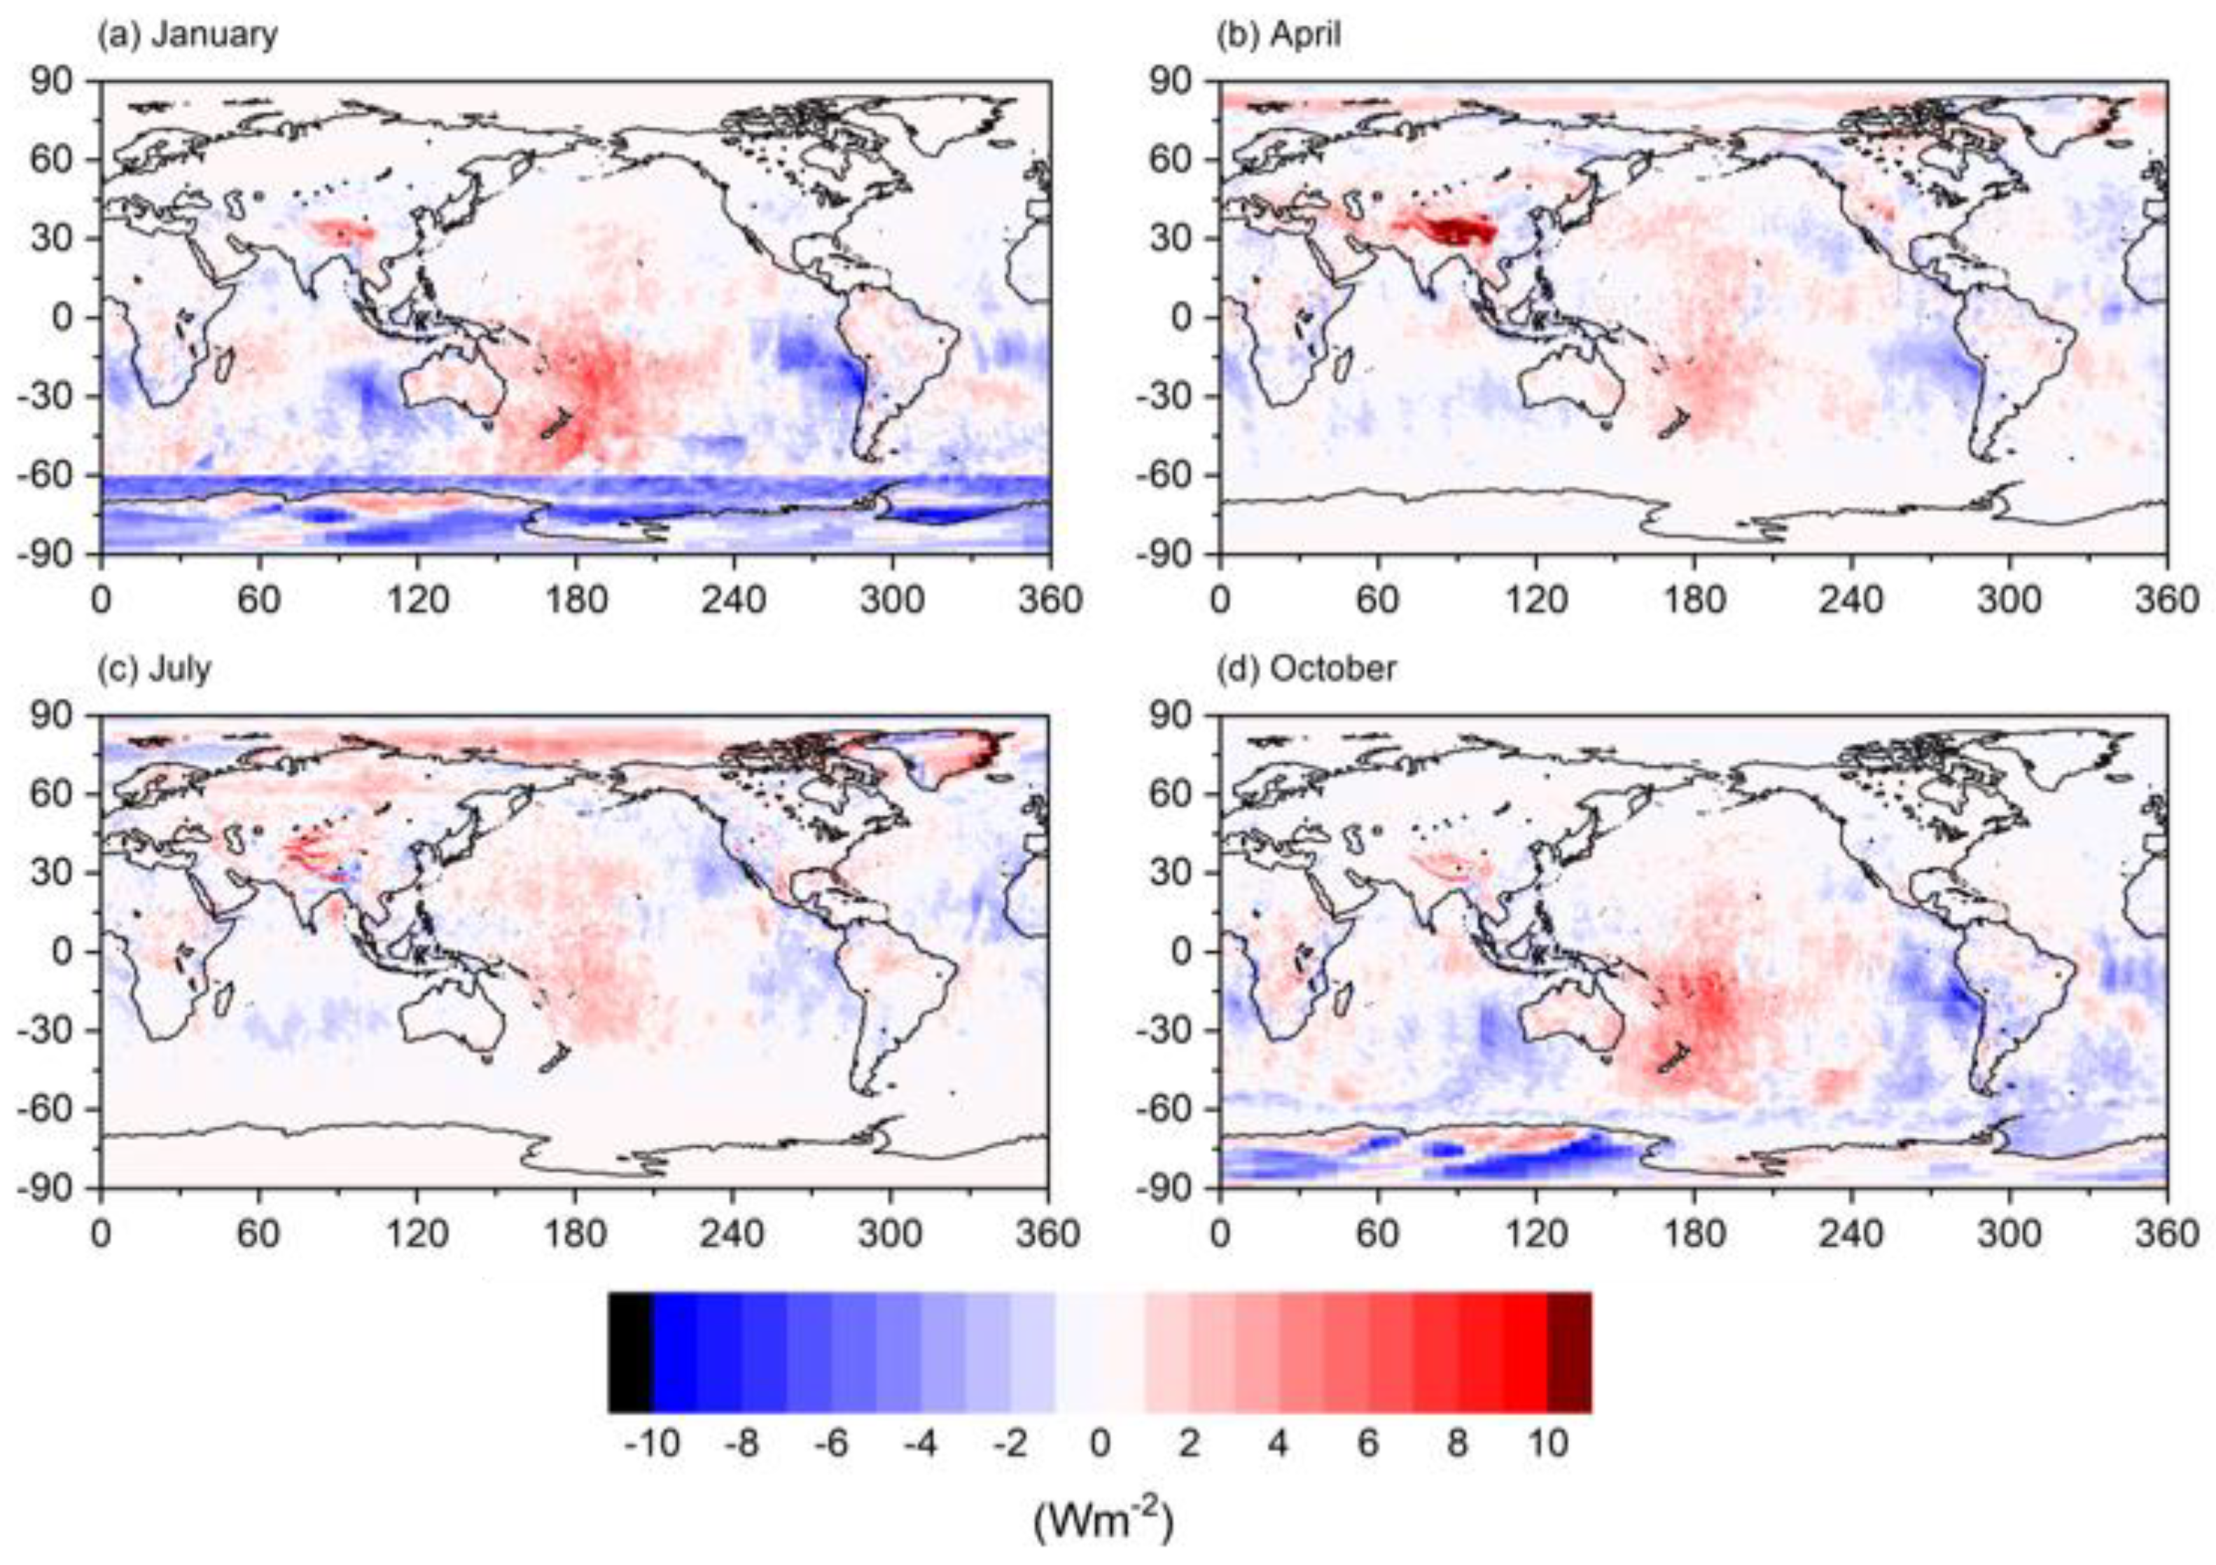
3.1. Climatological Mean Differences
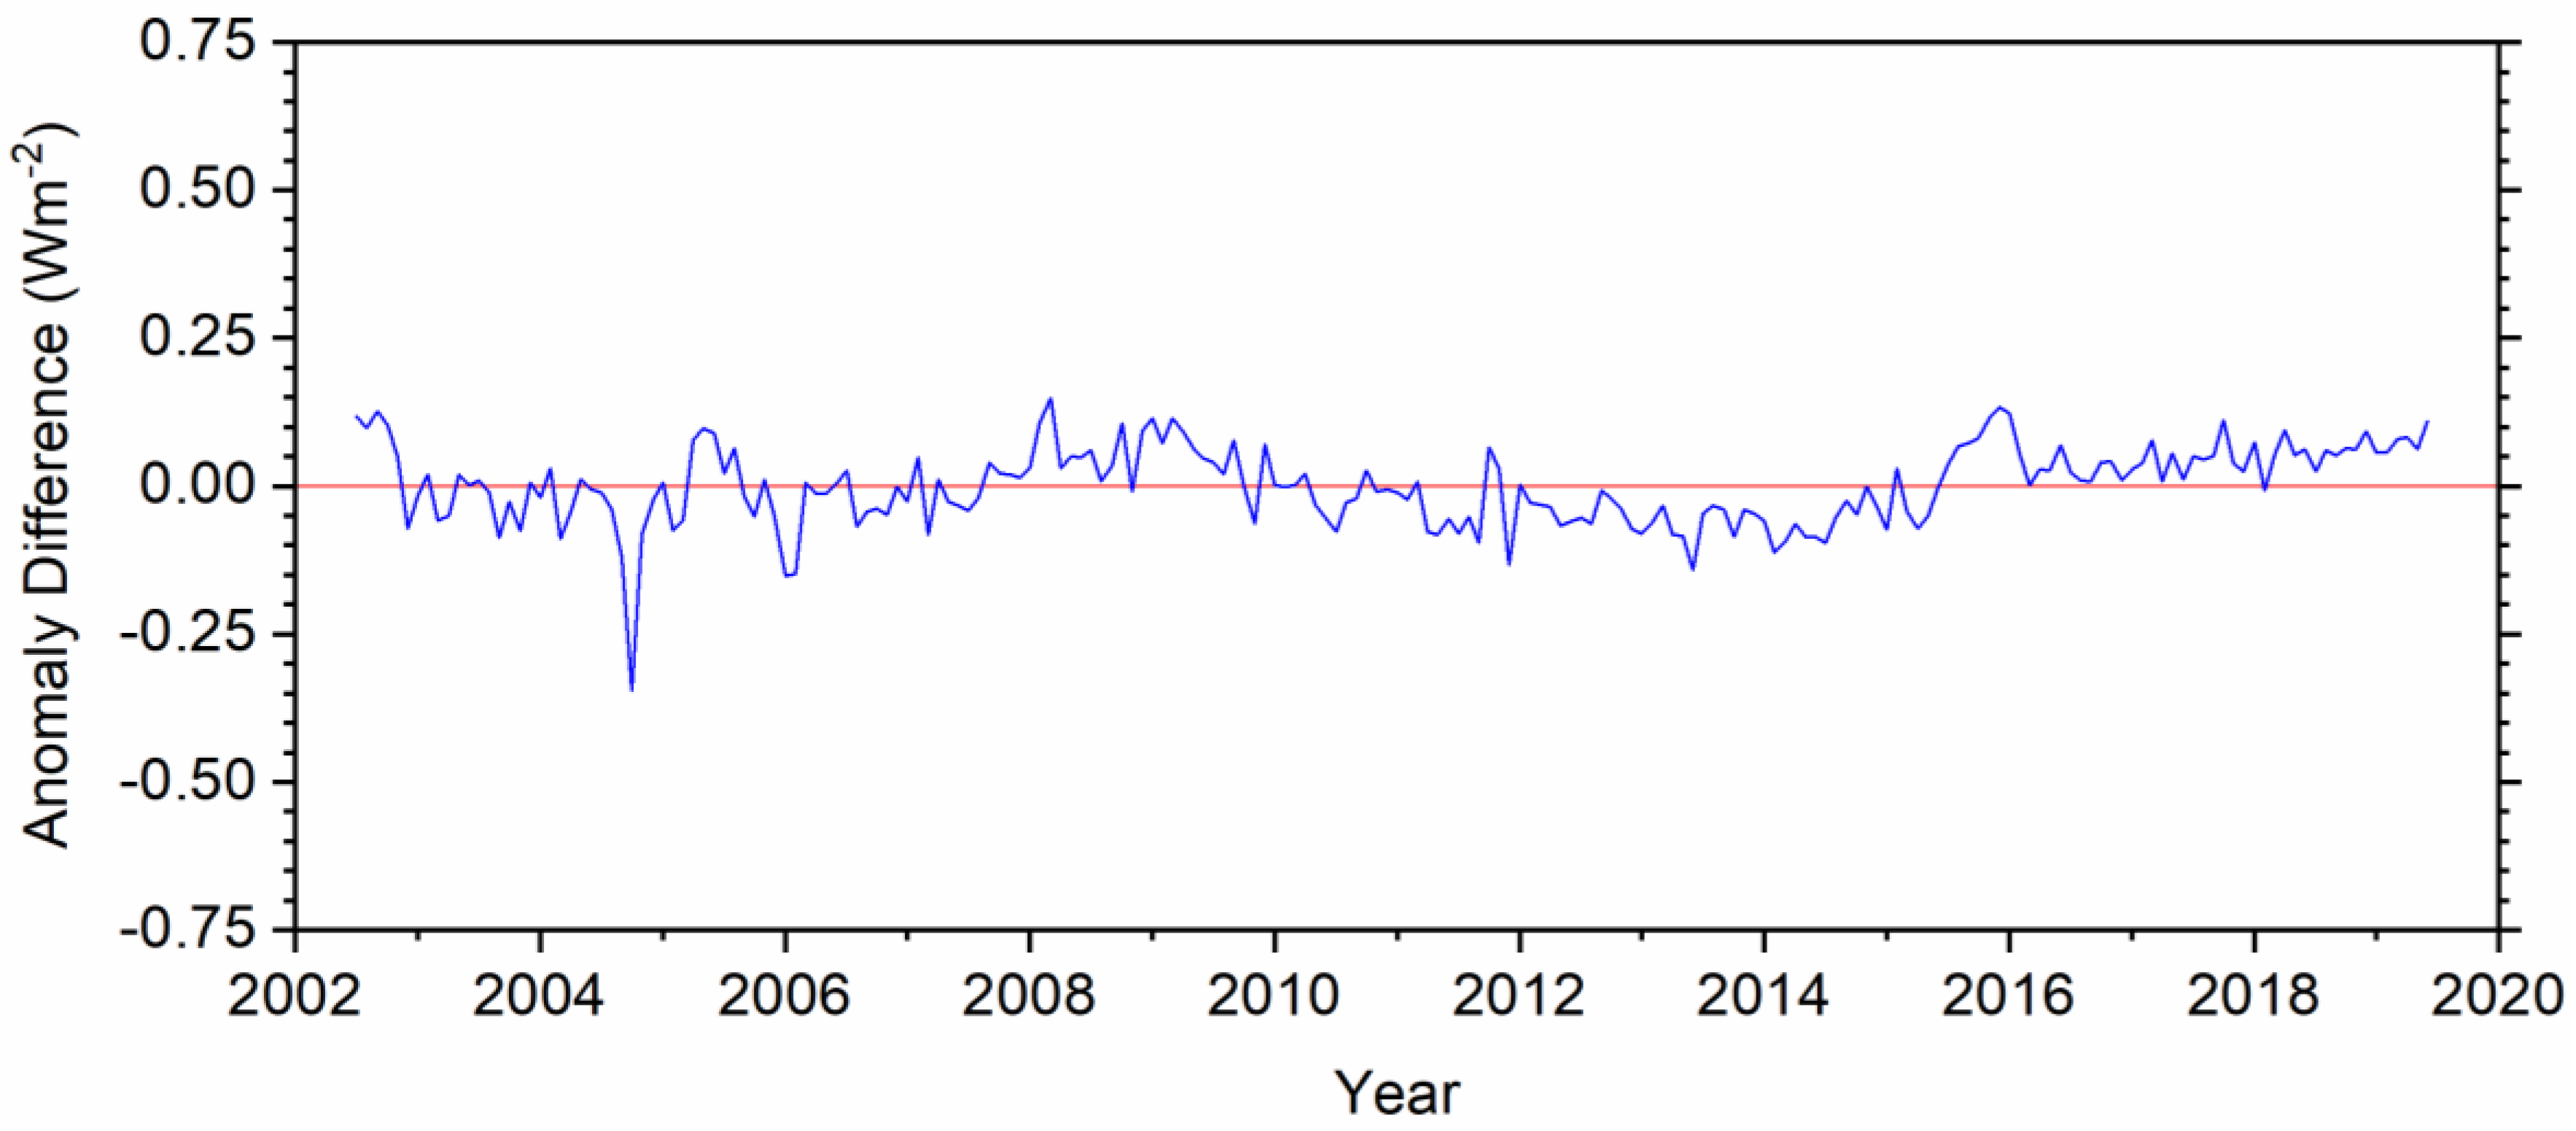
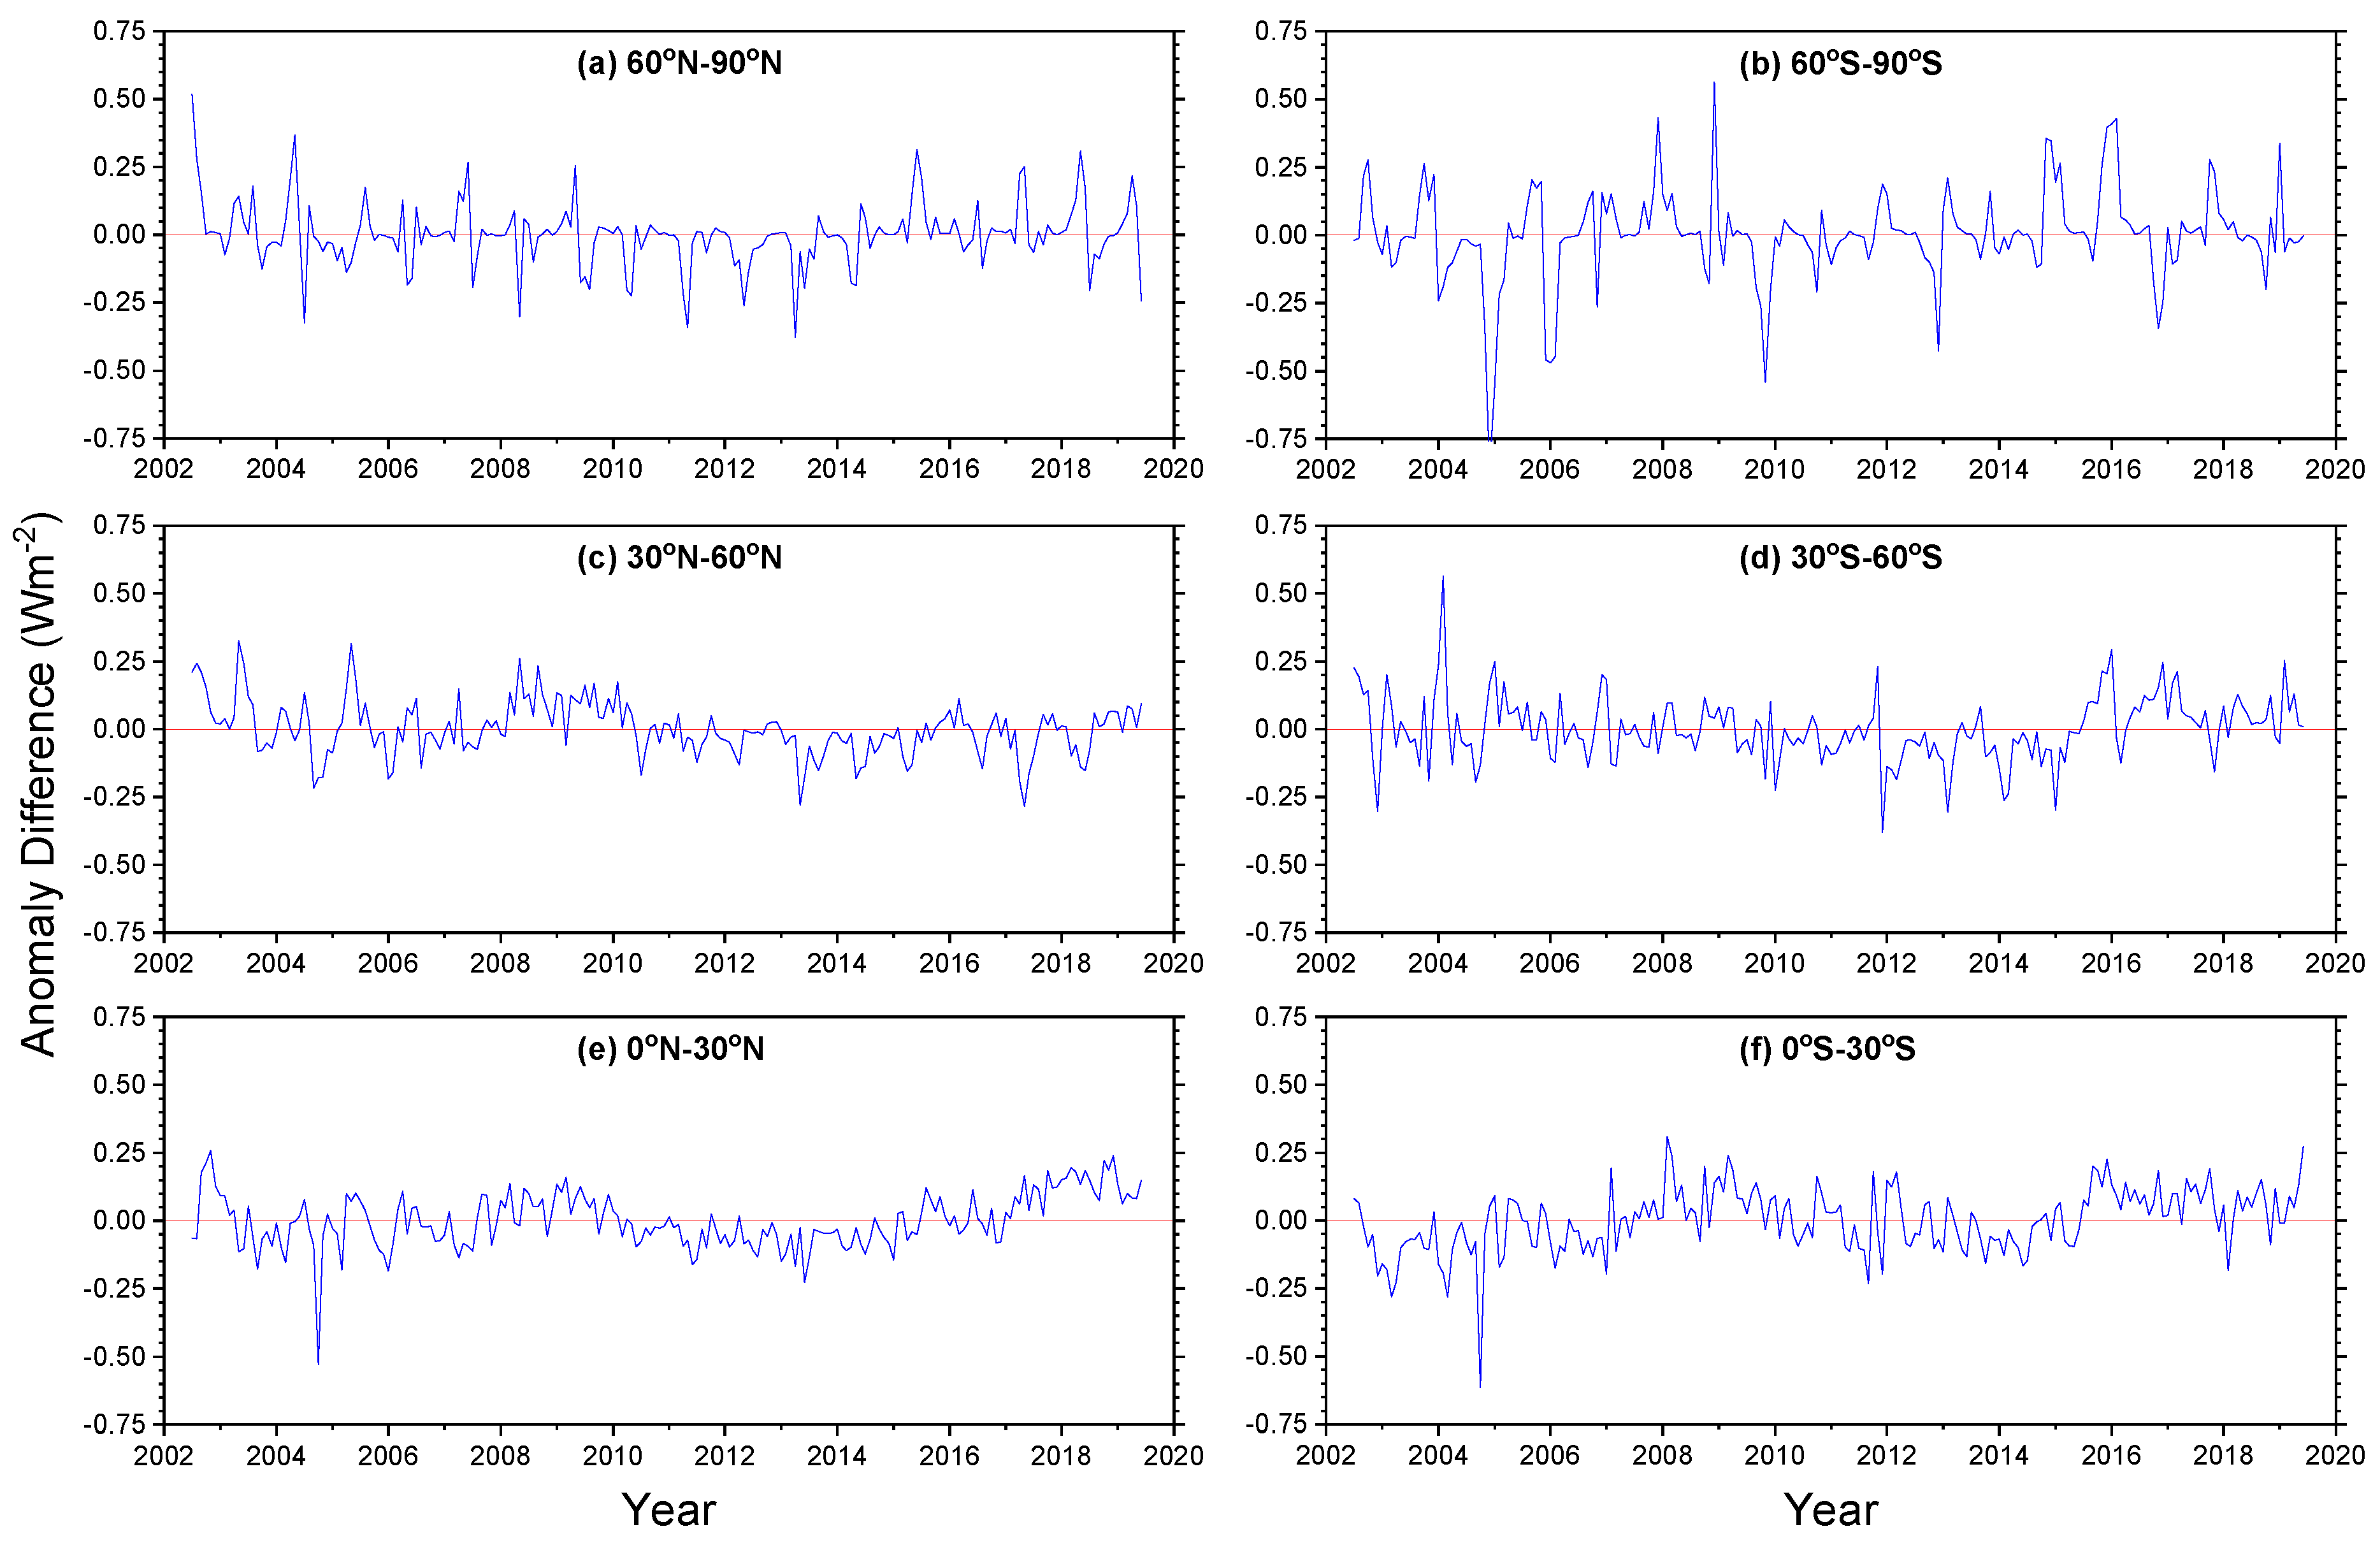
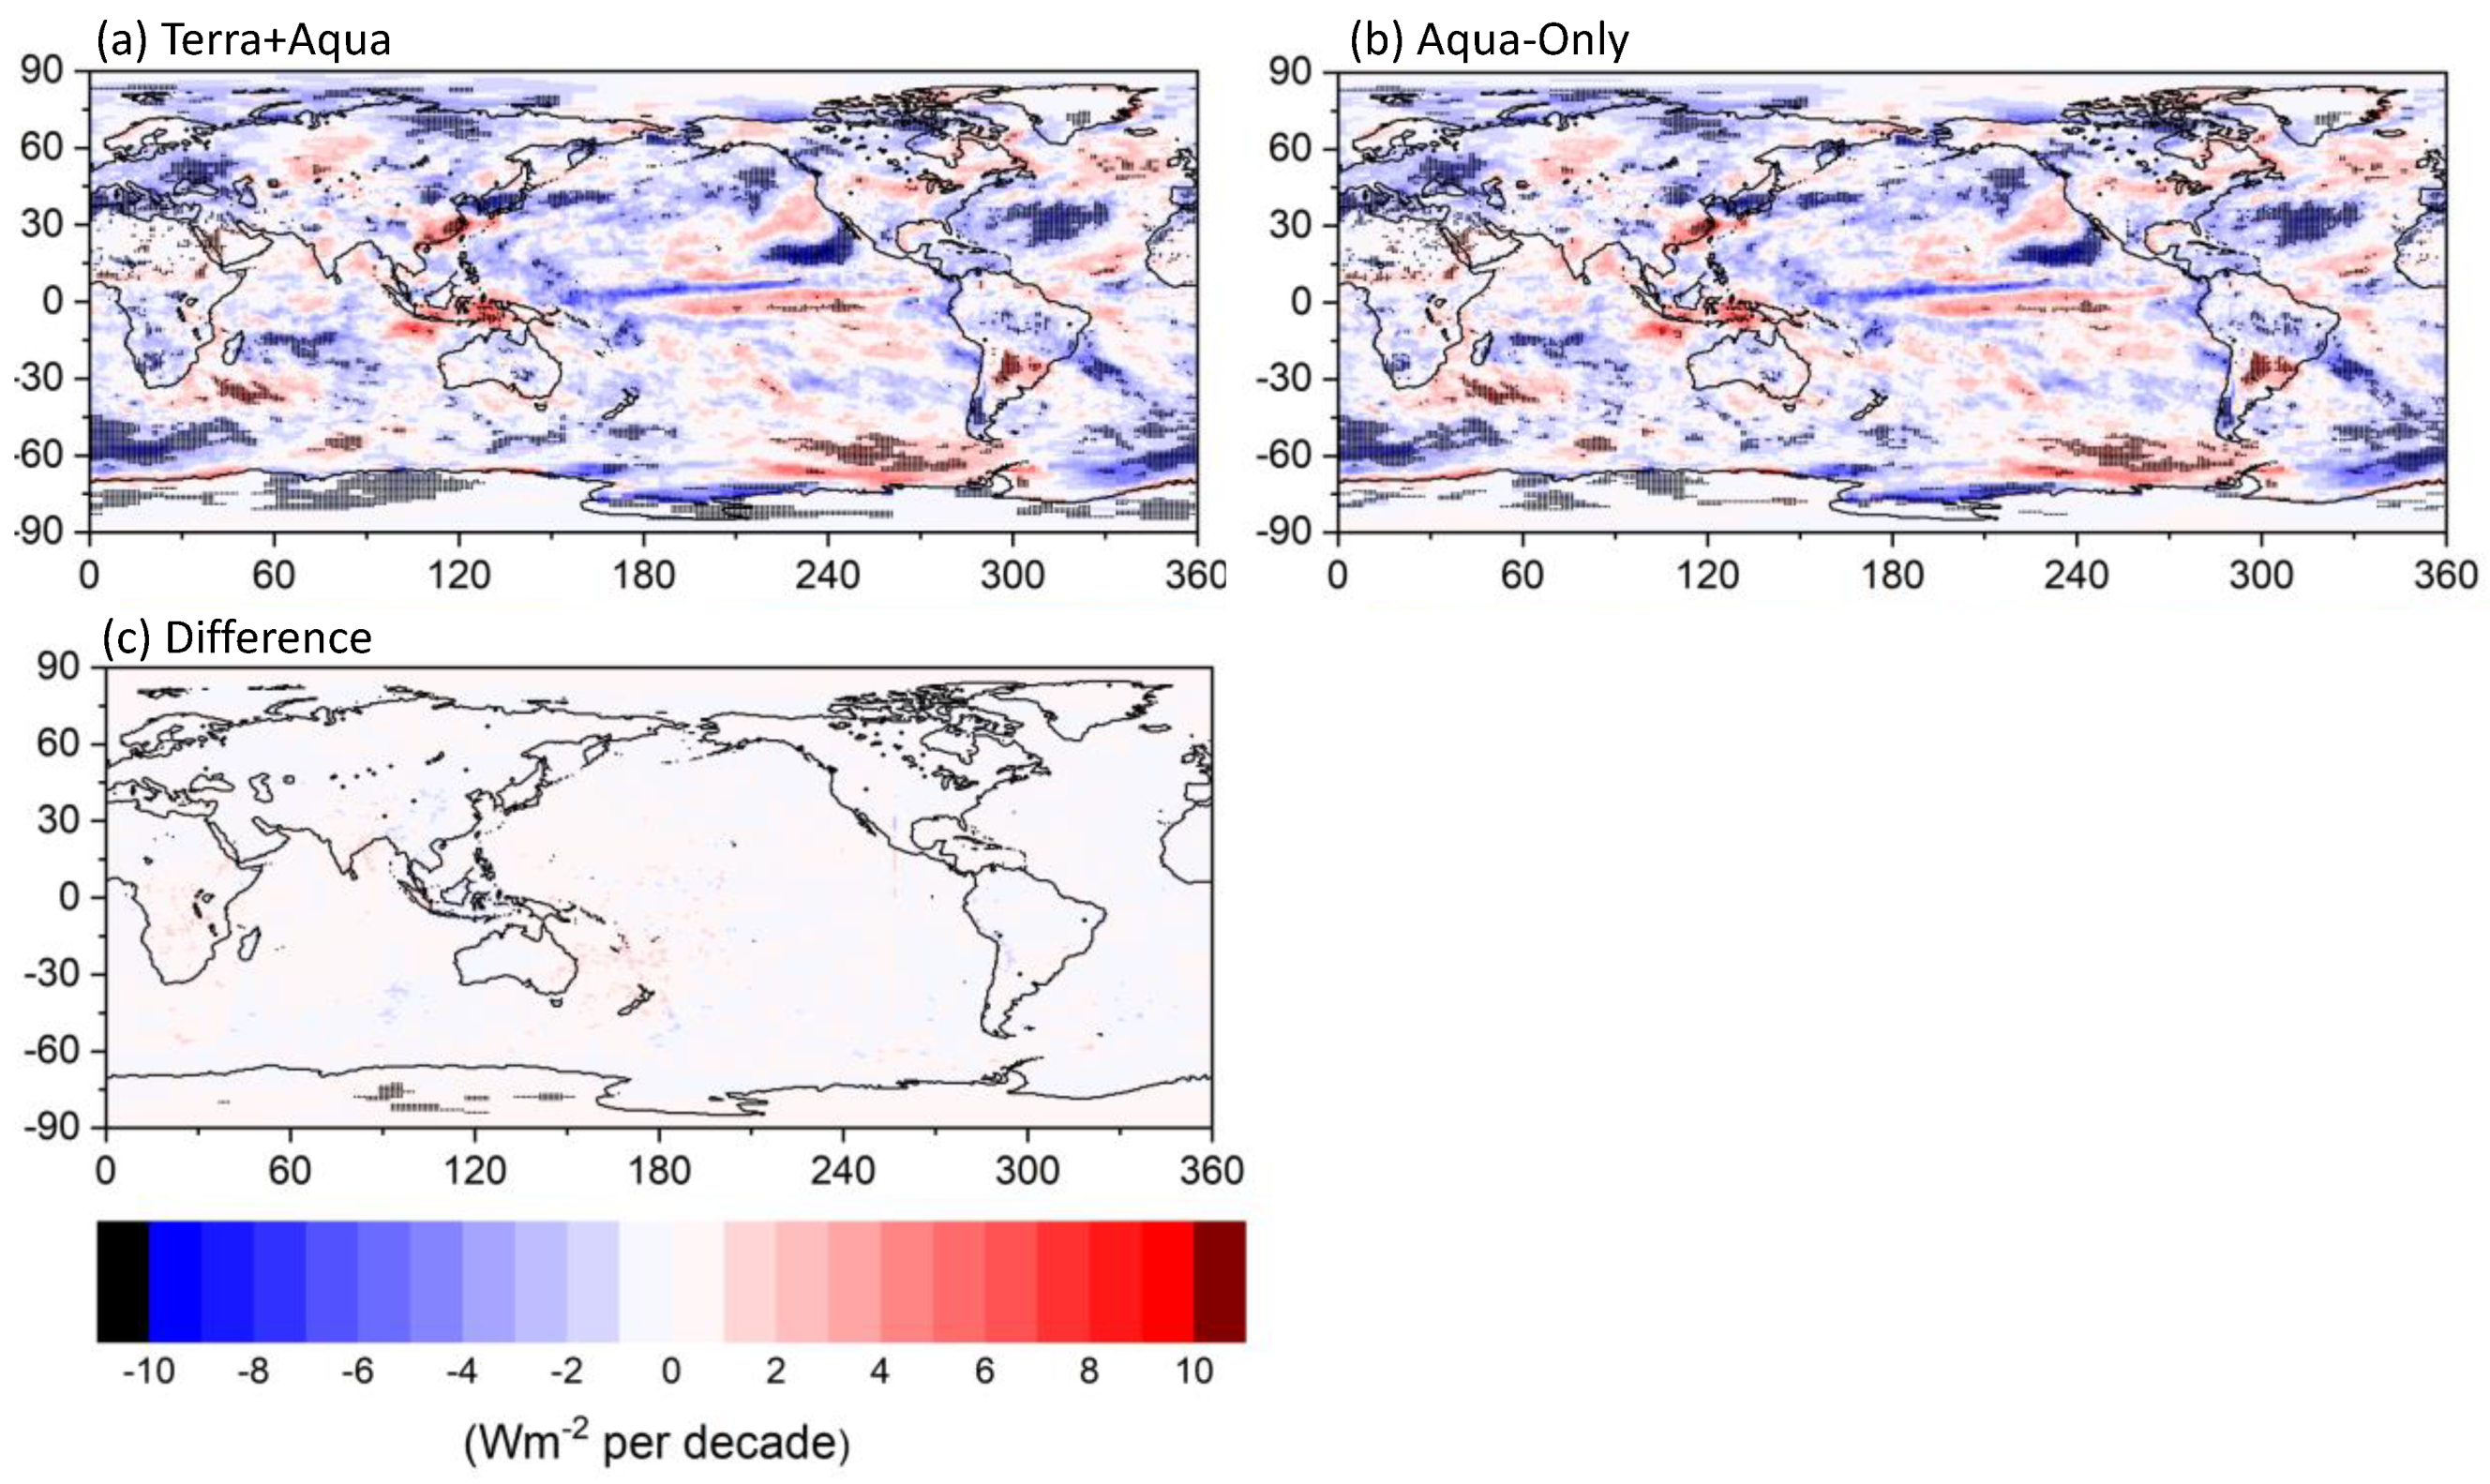
Applying DCRs to Aqua-only SSF1deg-day produces climatological mean SW TOA fluxes that are very similar to those for Terra + Aqua when considering large domains (Table 1). The mean difference is <0.13 Wm−2 in all domains, except for latitudes between 60°S–90°S and 60°N–90°N, which reach −0.79 Wm−2 and 0.32 Wm−2, respectively. Similarly, the standard deviation in monthly mean differences remains <0.15 Wm−2 everywhere, except for latitudes poleward of 60°. The larger differences poleward of 60° are independent of the DCR corrections, as the DCRs are only applied equatorward of 60°, corresponding to the limit of GEO imager coverage. The larger differences poleward of 60° are likely partly due to Terra-Aqua differences in scene identification and radiance-to-flux conversion. The reason differences are greater for 60°S–90°S than 60°N–90°N is likely because there is a greater difference in local time between Terra and Aqua poleward of 60°S.
The corresponding regional climatological mean differences (Figure 5) are obtained by averaging each month over the entire period from 07/2002–06/2019. The difference patterns are similar to those for individual seasonal months (Figure 3), but the magnitudes of the differences are smaller. For the seasonal months shown in Figure 5, the RMS of the climatological mean regional differences ranges from 1.0 to 1.5 Wm−2. For the same months, the RMS of monthly mean regional differences ranges from 2.0 to 2.5 Wm−2.
The larger differences near the International Date Line (IDL) in Figure 3 and Figure 5 are associated with a recently discovered problem with the DAR calculation that will need to be resolved prior to releasing an afternoon-only version of EBAF. As noted earlier, DAR is derived from the difference between morning and afternoon SW TOA fluxes derived from GEO. Since CERES data products use Greenwich Mean Time (GMT) instead of local time (LT) to define a 24-h day, morning and afternoon are separated by nighttime on a 24-h GMT day at longitudes near the IDL, instead of being contiguous in time. As a result, extreme DAR values can occur if cloud conditions change appreciably overnight. A better approach would be to calculate DAR using GMT hours from consecutive days in order to ensure morning and afternoon hours are contiguous in time and separated by the region’s local noon. This issue has a minimal effect for EBAF Ed4.1 since the DCRs are rather insensitive to DAR variations (Figure 2). Since this is not the case for a single afternoon satellite (e.g., Aqua), this will need to be addressed prior to releasing an afternoon-only EBAF product. After making this correction, we expect the differences seen in Figure 3 and Figure 5 near the dateline to be much smaller.

3.2. Anomalies

Applying DCRs to Aqua produces a global SW TOA flux monthly anomaly time series that is consistent with that for Terra + Aqua (Figure 6). The standard deviation of the anomaly difference is 0.07 Wm−2, much smaller than the 0.59 Wm−2 standard deviation in global monthly SW TOA flux anomalies (Table 2). Accordingly, global monthly anomalies in Aqua-only explain 98.7% of the variance in Terra + Aqua. The trend in the anomaly difference of 0.026 ± 0.039 Wm−2 per decade (uncertainty corresponds to 95% confidence interval) indicates that there is no significant drift in the Aqua-only record relative to that for Terra + Aqua (Table 2). The corresponding time series for individual latitude zones also shows good agreement in the Aqua-only and Terra + Aqua anomaly time series (Figure 7). As shown in Table 2, the standard deviation in the monthly anomaly differences are smaller than the standard deviation in SW TOA flux anomalies for Terra + Aqua by at least a factor of 9, and Aqua-only anomalies explain between 98.6% to 99.6% of the variance in Terra + Aqua. The trend in the anomaly difference for the individual latitude zones remains <0.085 Wm−2 per decade, with no significant trend at the 95% significance level for the global and zonal domains, except for the 0°–30°S zone.
It is interesting that the Terra + Aqua trends in Table 2 are negative in each latitude zone and exceed the 95% confidence interval for 30°N–60°N, 30°S–60°S and the global mean. To gain confidence that the observed changes are real and not due to instrument drift, Loeb et al. [9] compared individual time series from CERES instruments Terra, Aqua and S-NPP. From July 2002 onwards, Terra and Aqua monthly anomalies were consistent to a few tenths of a Wm−2, and when all three instruments were operational (February 2012 onwards), results were consistent at the same level.
Regional SW TOA flux trends for Terra + Aqua and Aqua-only are shown in Figure 8a-b along with their difference in Figure 8c. Both the Terra + Aqua and Aqua-only results show very similar patterns with broad regions of significant trends (above the 95% confidence level) off the west coast of North America, the North Atlantic, parts of the Southern Ocean and Antarctica. We note that although the trends over Antarctica exceed the 95% confidence interval, the 95% confidence level over those regions is very small (<1 Wm−2 per decade) since internal variability is weaker there. The largest trends, reaching 10 Wm−2 per decade, occur off the west coast of North America. As discussed in more detail in Loeb et al. [9], those negative trends are largely a result of a reduction in low cloud cover after 2014 that coincides with anomalously warm sea-surface temperatures (SSTs) in the eastern Pacific Ocean following the emergence of the so-called “warm blob” [10], a shift in the sign of the Pacific Decadal Oscillation (PDO) from negative to positive, and the 2015–2016 El Niño. This period also coincides with reductions in clear-sky SW TOA flux due to a reduction in aerosol optical depth over the Northern Hemisphere Pacific and Atlantic Oceans, consistent with stricter pollution controls in China and North America. The observed SW TOA flux changes are well reproduced in atmosphere-only climate model simulations in which climate forcings are specified along with observed SSTs and sea-ice boundary conditions [11]. Further modeling study is needed in order to determine how much of the trend is associated with climate forcing as opposed to internal variability in the climate system.
With the exception of a few regions, trend differences are smaller than 1 Wm−2 per decade and remain smaller than the 95% confidence in the Terra + Aqua trend (Figure 8c). This provides further confidence that diurnal corrections applied to the afternoon-only satellites should yield results consistent with the current Terra + Aqua values.

4. Summary and Conclusions

To produce SW TOA fluxes in the CERES EBAF data product, an empirical diurnal correction methodology is applied that: (i) preserves the diurnal information obtained when CERES and GEO imager data are combined, and (ii) minimizes the impact of GEO data artifacts that could introduce spurious discontinuities in the record. The stability of the EBAF time series is thus tied to CERES instrument calibration stability. In EBAF Ed4.1, diurnal corrections for Terra-only (1030 MLT) are used for March 2000–June 2002, prior to the launch of Aqua (1330 MLT), and combined Terra and Aqua from July 2002 onwards. However, Terra’s MLT will no longer be maintained at 1030 starting in 2021 and Aqua’s 1330 MLT will start to drift in 2022. In order to produce a stable climate data record after Terra and Aqua start to drift in MLT, the EBAF record will be reprocessed using only afternoon satellites with a tight 1330 MLT throughout (either with S-NPP or NOAA-20). To evaluate the impact of this change, we compare SW TOA fluxes derived using empirical diurnal corrections applied to Terra + Aqua with those for Aqua-only.
Aqua-only SSF1deg-day produces global climatological mean SW TOA fluxes for 07/2002–06/2019 that are within 0.01 Wm−2 of Terra + Aqua, with a standard deviation of 0.13 Wm−2. Equatorward of 60°, zonal mean climatological mean differences for 30° latitude zones remain <0.13 Wm−2 with standard deviations <0.15 Wm−2. Larger differences are observed poleward of 60°, where the diurnal sampling corrections are not applied. The larger differences at high latitudes are likely due to scene identification and radiance-to-flux conversion differences between Terra and Aqua. In addition, sampling differences between Terra and Aqua for 60°S–90°S likely also contribute as the satellites differ in local time by at least 5 h. While the overall regional climatological RMS difference between Aqua-only and Terra + Aqua is 1.0–1.5 Wm−2, local differences can reach 5 Wm−2 near the International Dateline, just east of Australia. These larger differences are associated with a problem in how diurnal corrections are calculated at longitudes in which there is a large difference between GMT and local time, such as near the dateline. This will be corrected prior to releasing an afternoon-only version of the EBAF product.
Anomalies and trends derived after applying diurnal corrections to Aqua-only are generally consistent with the corresponding Terra + Aqua values. The standard deviation of the difference in global monthly SW TOA flux anomalies is 0.07 Wm−2, much smaller than the global monthly SW TOA flux anomaly standard deviation of 0.59 Wm−2. The trend in the difference between Aqua-only and Terra + Aqua global anomaly time series is 0.03 Wm−2 per decade, confirming there is no significant drift in Aqua-only relative to Terra + Aqua. This difference is one order of magnitude smaller than the 95% uncertainty in the global mean SW TOA flux trend [12]. Similarly, for individual latitude zones, the standard deviation in monthly anomaly differences is at least a factor of 9 smaller than the corresponding standard deviation in monthly SW TOA flux anomalies, and trend differences remain <0.085 Wm−2 per decade.
For 1° × 1° regions, trend differences between Aqua-only and Terra + Aqua remain <1 Wm−2 per decade and are smaller than the 95% confidence in the Terra + Aqua trend. These results provide confidence that diurnal corrections applied to the afternoon-only satellites should yield results consistent with the current Terra + Aqua values.

Author Contributions

Conceptualization, N.G.L. and D.R.D.; methodology, N.G.L. and D.R.D.; formal analysis, N.G.L.; writing—original draft preparation, N.G.L.; writing—review and editing, N.G.L. and D.R.D.; project administration, N.G.L. All authors have read and agreed to the published version of the manuscript.

Funding

This research was funded by the NASA CERES project.

Acknowledgments

Hailan Wang processed the SSF1deg-day and SYN1deg-day files used in this analysis.

Conflicts of Interest

The authors declare no conflict of interest.

References

  1. Summary for Policymakers. In Climate Change 2013: The Physical Science Basis. Contribution of Working Group I to the Fifth Assessment Report of the Intergovernmental Panel on Climate Change; Stocker, T.F.; Qin, D.; Plattner, G.K.; Tignor, M.; Allen, S.K.; Boschung, J.; Nauels, A.; Xia, Y.; Bex, V.; Midgley, P.M. (Eds.) Cambridge University Press: Cambridge, UK; New York, NY, USA, 2013. [Google Scholar]
  2. Loeb, N.G.; Doelling, D.R.; Wang, H.; Su, W.; Nguyen, C.; Corbett, J.G.; Liang, L.; Mitrescu, C.; Rose, F.G.; Kato, S. Clouds and the Earth’s Radiant Energy System (CERES) Energy Balanced and Filled (EBAF) Top-of-Atmosphere (TOA) Edition-4.0 Data Product. J. Clim. 2018, 31, 895–918. [Google Scholar] [CrossRef]
  3. Kato, S.; Rose, F.G.; Rutan, D.A.; Thorsen, T.J.; Loeb, N.G.; Doelling, D.R.; Huang, X.; Smith, W.L.; Su, W.; Ham, S.-H. Surface Irradiances of Edition 4.0 Clouds and the Earth’s Radiant Energy System (CERES) Energy Balanced and Filled (EBAF) Data Product. J. Clim. 2018, 31, 4501–4527. [Google Scholar] [CrossRef]
  4. Doelling, D.R.; Loeb, N.G.; Keyes, D.F.; Nordeen, M.L.; Morstad, D.; Nguyen, C.; Wielicki, B.A.; Young, D.F.; Sun, M. Geostationary Enhanced Temporal Interpolation for CERES Flux Products. J. Atmos. Ocean. Technol. 2013, 30, 1072–1090. [Google Scholar] [CrossRef]
  5. Johnson, G.C.; Lyman, J.M.; Loeb, N.G. Improving estimates of Earth’s energy imbalance. Nat. Clim. Chang. 2016, 6, 639–640. [Google Scholar] [CrossRef]
  6. Loeb, N.G.; Manalo-Smith, N.; Kato, S.; Miller, W.F.; Gupta, S.K.; Minnis, P.; Wielicki, B.A. Angular Distribution Models for Top-of-Atmosphere Radiative Flux Estimation from the Clouds and the Earth’s Radiant Energy System Instrument on the Tropical Rainfall Measuring Mission Satellite. Part I: Methodology. J. Appl. Meteorol. 2003, 42, 240–265. [Google Scholar] [CrossRef]
  7. Su, W.; Corbett, J.; Eitzen, Z.; Liang, L. Next-generation angular distribution models for top-of-atmosphere radiative flux calculation from CERES instruments: Methodology. Atmos. Measure. Tech. 2015, 8, 611–632. [Google Scholar] [CrossRef] [Green Version]
  8. Doelling, D.R.; Haney, C.; Bhatt, R.; Scarino, B.; Gopalan, A. Geostationary Visible Imager Calibration for the CERES SYN1deg Edition 4 Product. Remote Sens. 2018, 10, 288. [Google Scholar] [CrossRef] [Green Version]
  9. Loeb, N.G.; Thorsen, T.J.; Norris, J.R.; Wang, H.; Su, W. Changes in Earth’s Energy Budget during and after the “Pause” in Global Warming: An Observational Perspective. Climate 2018, 6, 62. [Google Scholar] [CrossRef] [Green Version]
  10. Bond, N.A.; Cronin, M.F.; Freeland, H.; Mantua, N. Causes and impacts of the 2014 warm anomaly in the NE Pacific: 2014 WARM ANOMALY IN THE NE PACIFIC. Geophys. Res. Lett. 2015, 42, 3414–3420. [Google Scholar] [CrossRef]
  11. Loeb, N.G.; Wang, H.; Allan, R.P.; Andrews, T.; Armour, K.C.; Cole, J.N.S.; Dufresne, J.-L.; Gettelman, A.; Guo, H.; Mauritsen, T.; et al. New Generation of Climate Models Track Recent Unprecedented Changes in Earth’s Radiation Budget Observed by CERES. Geophys. Res. Lett. 2019, 47. [Google Scholar] [CrossRef]
  12. Loeb, N.; Manalo-Smith, N.; Su, W.; Shankar, M.; Thomas, S. CERES Top-of-Atmosphere Earth Radiation Budget Climate Data Record: Accounting for in-Orbit Changes in Instrument Calibration. Remote Sens. 2016, 8, 182. [Google Scholar] [CrossRef] [Green Version]
Figure 1. Mean local time of equator crossing for Terra’s descending and Aqua’s ascending nodes.
Remotesensing 12 01280 g001
Figure 2. DCRs for Terra-only, Aqua-only and Terra + Aqua at 29°S–30°S over ocean in July.
Remotesensing 12 01280 g002
Figure 3. SW TOA flux difference between Aqua-only SSF1deg with diurnal correction and combined Terra+Aqua SSF1deg with diurnal correction for (a) January, (b) April, (c) July, and (d) October 2016.
Remotesensing 12 01280 g003
Figure 4. Timeline of EBAF Ed4.1 through 01/2021 and an afternoon-only version of EBAF (Ed4.2).
Remotesensing 12 01280 g004
Figure 5. Difference between Aqua-only and Terra + Aqua regional climatological mean SW TOA fluxes after applying DCR corrections for (a) January, (b) April, (c) July, and (d) October for 07/2002–06/2019.
Remotesensing 12 01280 g005
Figure 6. Difference in global monthly anomalies between Aqua-only and Terra + Aqua after applying DCR corrections to both. Red line corresponds to the zero reference line.
Remotesensing 12 01280 g006
Figure 7. Same as Figure 6 but for the latitude domains indicated in each plot.
Remotesensing 12 01280 g007
Figure 8. SW TOA flux trend (Wm−2 per decade) for (a) Terra + Aqua, (b) Aqua-only, and (c) Terra + Aqua minus Aqua-only difference. Hatched areas in (a) and (b) correspond to trends that exceed the 95% confidence interval. In (c), hatched areas correspond to trend differences exceeding the 95% confidence interval in Terra + Aqua trend.
Remotesensing 12 01280 g008
Table 1. Difference between Aqua-only and Terra + Aqua mean SW TOA fluxes (Wm−2) after applying DCR corrections for 07/2002–06/2019. “Std Dev” is the standard deviation of monthly mean differences.
DomainMeanStd Dev
60°N–90°N0.320.58
30°N–60°N0.130.15
0°–30°N0.020.10
0°–30°S0.050.12
30°S–60°S0.000.12
60°S–90°S−0.791.24
Global0.010.13
Table 2. Standard deviation, explained variance and trend in monthly SW TOA flux anomalies (Wm−2) after applying DCR corrections for Terra + Aqua and for the difference between anomalies in Aqua-only and Terra + Aqua for 07/2002–06/2019. Trend uncertainty corresponds to 95% confidence interval.
Standard Deviation (Wm−2)Explained Variance (%)Trend (Wm−2 per Decade)
DomainTer + AquAqu − (Ter + Aqu) Ter + AquAqu − (Ter + Aqu)
60°N–90°N1.860.1299.6−0.78 ± 0.85−0.007 ± 0.047
30°N–60°N1.330.1099.4−0.94 ± 0.40−0.054 ± 0.054
0°–30°N1.450.1099.5−0.53 ± 0.620.048 ± 0.056
0°–30°S1.260.1299.1−0.38 ± 0.460.085 ± 0.047
30°S–60°S1.000.1298.6−0.48 ± 0.330.003 ± 0.052
60°S–90°S1.560.1798.8−0.44 ± 0.970.043 ± 0.085
Global0.590.0798.7−0.57 ± 0.200.026 ± 0.039

