Article

Variability of Kuroshio Surface Axis Northeast of Taiwan Island Derived from Satellite Altimeter Data

1
First Institute of Oceanography, Ministry of Natural Resources, Qingdao 266100, China
2
Laboratory for Regional Oceanography and Numerical Modeling, Qingdao National Laboratory for Marine Science and Technology, Qingdao 266200, China
3
Department of Atmospheric and Oceanic Science, University of Maryland, College Park, MD 20740-20742, USA
4
Institute of Oceanographic Instrumentation, Shandong Academy of Sciences, Qingdao 266071, China
5
Beijing Research Institute of Telemetry, Beijing 100176, China
*
Author to whom correspondence should be addressed.
Remote Sens. 2020, 12(7), 1059; https://doi.org/10.3390/rs12071059
Submission received: 9 March 2020 / Revised: 23 March 2020 / Accepted: 24 March 2020 / Published: 25 March 2020
(This article belongs to the Special Issue Synergy of Remote Sensing and Modelling Techniques for Ocean Studies)

Abstract

:
The spatial and temporal variability of the Kuroshio surface axis northeast of Taiwan Island is investigated using 24 years of surface geostrophic currents derived from satellite altimeter data from 1993 to 2016. The Kuroshio surface axis is derived by an extraction method with three selected parameters, including the length of the subsidiary line, the intervals between two adjacent points, and the distance between the two adjacent subsidiary lines. The empirical mode decomposition analysis on the 24-year Kuroshio axes reveals that the mean periods of intra-seasonal and inter-annual variability, which are the two dominant components, are about 3.2 months and 1.3 years, respectively. The self-organizing map analysis reveals that the variation of Kuroshio axis northeast of Taiwan Island has four best matching unit (BMU) patterns: straight-path (BMUS), meandering-path (BMUM) and two transition stages (BMUT1 and BMUT2). The straight-path pattern shows strong seasonality: more likely occurring in summer. The meandering-path pattern is less frequent than straight-path pattern. During a typical period from November 26, 2012 to January 27, 2013, which is chosen as an independent example, the analysis on the satellite altimeter and sea surface temperature data shows that the patterns of the Kuroshio axis change successively in order of BMUT1→BMUM→BMUT2→BMUS, i.e., the Kuroshio axis migrates from the meandering-path to the straight-path pattern. During the typical period the warm water intrusion and a mesoscale eddy occur at the second stage corresponding to BMUM and migrate northwestward gradually at the last two stages corresponding to BMUT2 and BMUS. The transient order appears only during this typical period but it is not common for the whole study period. The monthly mean relatively vorticity is calculated and analyzed to evaluate the impact of the eddies on the Kuroshio surface axis variability, the results show that the anticyclonic (cyclonic) eddies can promote the Kuroshio surface axis to present the meandering-path (straight-path) pattern because of the potential vorticity conservation. The impacts of the anticyclonic eddies and the cyclonic eddies on the variability of the Kuroshio surface axis are opposite. The long-term day-to-day detection contributes to improving understanding the variability of Kuroshio surface axis northeast of Taiwan Island.

Graphical Abstract

1. Introduction

The Kuroshio Current (KC) is a strong western boundary current in the western North Pacific Ocean, which plays an important role in mass, heat and nutrients transports of the subtropical gyre. It originates from a bifurcation of the westward-flowing North Equatorial Current at about 15° N, and then flows northward along the east coast of Luzon and Taiwan Island with a mean speed of 1–1.5 m/s [1]. In the East China Sea (ECS), the main path of the KC is relatively stable due to the topographic constraint, but intrudes into the ECS shelves through the East Taiwan Channel (ETC) between Taiwan Island and Iriomote Island (Figure 1) [2,3,4]. Further downstream, the main body of the KC bifurcates near 30° N because of the divergence of the isobaths [1].
The KC transports relatively warm water, therefore, variations in the KC position can affect sea surface temperature distribution that moderates the air-sea heat and moisture fluxes [1]. Previous investigations were performed to study the variability of the Kuroshio path northeast of Taiwan Island [5,6,7,8,9]. The Kuroshio surface path always has an anticyclonic meander pattern because of monsoon forcing [5,6]. In spring, the KC branch enters into the ECS continental shelf through the ETC [7,8] and mostly remerges to the Kuroshio main stream [6]. The spatio-temporal variability of the entire Kuroshio path in the ECS from 7-day averaged absolute geostrophic velocity (AGV) data was derived in [9], and they showed that the Kuroshio surface axis moves closer to the 200 m isobath, mostly in winter, and away from it in summer. The intra-seasonal variability of the Kuroshio subsurface water (KSSW) intruding onto the ECS shelf was analyzed based on hydrographic observations and dissolved inorganic iodine species [10], the results showed that the KSSW intrusion northeast of Taiwan Island is weaker in autumn than in spring.
The shoreward intrusion of the KC northeast of Taiwan Island greatly influences the circulation over the ECS shelf and is one of the key mechanism that forms the Taiwan warm current [11,12,13]. Owing to the baroclinic instability, abundant mesoscale eddies are generated and propagate to the western boundary and affect the Kuroshio path and volume transport [14,15]. Delman et al. [16] demonstrated that the vertical stretching of relative vorticity in eddies indicated a deceleration (acceleration) of the Kuroshio Extension coincident with northward (southward) quasi-permanent meanders. On the northeast region of the Taiwan Island, the onshore intrusion of KC is associated with the Kuroshio volume transport and the interaction between the westward propagating open-ocean eddies and the Kuroshio east of Taiwan Island [17,18,19,20]. Gawarkiewicz et al. [18] and Velez-Belchi et al. [19] reported that the cyclonic eddies can contribute to the intrusion of KC onto the ECS shelf, in contrast, less onshore intrusion occurred during the period that the anticyclonic eddies present on the east of Taiwan Island. The mesoscale eddies, which propagate westward to the east region of Taiwan Island, bring potential vorticity flux and modulate local vertical stratification, therefore, they are able to favor or inhibit the Kuroshio intrusion onto the ECS shelf [20].
While these studies have provided important information on the variability of the Kuroshio surface axis and the impact of the eddies, the analysis of the daily detection results of the Kuroshio surface axis using satellite AGV data and a vorticity analysis of eddy activities affecting the Kuroshio axis variability over a long period still need further research. The objectives of this study include: the variability of the Kuroshio axis northeast of Taiwan Island from 1993 to 2016 is analyzed using empirical mode decomposition (EMD) and self-organizing map (SOM) based on long-term day-to-day axis detection results; the impact of the eddies on the Kuroshio surface axis variability is investigated based on the vorticity analysis. The next section describes the data and methods used in this study. In Section 3, the variability of the surface Kuroshio axis northeast of Taiwan Island is quantified from satellite data using extraction method, EMD and SOM; the monthly mean relative vorticity is calculated and analyzed to evaluate the impact of the eddies on the Kuroshio surface axis variability. Section 4 presents the conclusions.

2. Data and Methods

2.1. Data

24-year time series of merged AGV data from 1993 to 2016, which are now distributed by the Copernicus Marine Environment Monitoring Service (CMEMS; http://marine.copernicus.eu/), are used in this study. The data are derived from the Ssalto multi-mission ground segment/Data Unification and Altimeter Combination System (Ssalto/Duacs) products which integrates the measurements from altimeter missions including: HY-2A, Saral/AltiKa, Cryosat-2, OSTM/Jason-2, Jason-1, Topex/Poseidon, Envisat, GFO, ERS-1&2. The AGV was calculated from the absolute dynamic topography (ADT), which is the sum of the sea level anomaly (SLA) and the mean dynamic topography (MDT), using the 9-point stencil width method [21]. More detailed information about the altimeter data can be found in [22]. In this study, the delayed-time gridded “allsat” product is chosen. The product is the time series of the merged maps computed with all the satellites available and provide the maps with the best mapping as possible but not homogeneous in time. All of the data can be downloaded from ftp://my.cmems-du.eu/. All users need an account on the website after a registration to obtain an access to a given list of altimetry data. The daily series of the satellite AGV data with a horizontal resolution of 0.25° × 0.25° are used to detect the Kuroshio axis; the ADT, AGV, SLA, and the geostrophic velocity anomaly data during a typical period from November 26, 2012 to January 27, 2013 are used for detailed SOM analysis to analyze the transient evolution of the Kuroshio surface axis. In addition, the sea surface temperature (SST) analysis products with a spatial grid resolution of 0.25° × 0.25° and temporal resolution of 1 day are also used to study the variation of the Kuroshio surface axis. The products are provided by National Centers for Environmental Information (NCEI; https://www.nodc.noaa.gov/) of National Ocean and Atmospheric Administration (NOAA; https://www.noaa.gov/) and use advanced very high resolution radiometer (AVHRR) satellite data from the Pathfinder AVHRR SST dataset available from September 1981 through December 2005, and the operational Navy AVHRR Multi-Channel SST data from 2006 to the present. More detailed information about the SST products can be found at https://data.nodc.noaa.gov/cgi-bin/iso?id=gov.noaa.nodc:AVHRR_Pathfinder-NCEI-L3C-v5.3#. The AVHRR SST data can be downloaded from ftp://ftp.nodc.noaa.gov/pub/data.nodc/pathfinder/Version5.2/. The structures of the Kuroshio axis and the intrusion are recognized based on the AVHRR SST with higher gradients.

2.2. Methods

2.2.1. Extraction Method for Kuroshio Surface Axis

The positions of the Kuroshio axis are estimated by tracking the locally strongest AGV in the subsidiary lines. Along each of the subsidiary lines, the local maximum velocity (V0) corresponds to the Kuroshio axis, and the velocities often decrease gradually from the axis to two sides. The method is established according to [23], which has been widely used [20,24,25]. Figure 2 shows the schematic diagram of the extraction method for the Kuroshio axis. At a certain point within the Kuroshio, a subsidiary line is provided crossing the Kuroshio almost perpendicularly. The AGV data are interpolated on the subsidiary line, and the position of the axis is determined as the point corresponding to the local maximum velocity V0. A new subsidiary line is then drawn at the new position moved from the upstream axis point by Δr along the direction of V0. The direction of the subsidiary line is further adjusted to be perpendicular to the direction of the new V0. The subsidiary line is not always centered on V0, but the distance between the midpoint of the subsidiary line and the V0 is often small, because the relative location of V0 for the new subsidiary do not change significantly within Δr. In this study, selection of several parameters is particular; the length of the subsidiary line l is chosen as 140 km to avoid that the subsidiary lines gradually deviate from the Kuroshio axis (locations of V0); the velocities are interpolated to the points of the subsidiary lines, and the intervals between two adjacent points on the subsidiary line Δl are chosen as 7 km; the distances between two adjacent subsidiary lines Δr are chosen as 15 km. The extraction method is applied on the 24-year daily gridded AGV data from 1993 to 2016 to identify the locations of the Kuroshio surface axes.

2.2.2. Empirical Mode Decomposition

The time series of the locations of the Kuroshio surface axis along a transect is analyzed by the EMD method [26]. The EMD was adopted to extract the inter-annual variability of the surface layer heat variance of the Kuroshio intrusion region in the South China Sea and the impact index of the Kuroshio water in southeastern Taiwan Strait [27,28], and used to extract a sea-level index for the Kuroshio Intrusion [29].
A brief introduction of EMD is given below for completeness. The EMD is used to decompose a long-term continuous time series dataset into a finite number of components, the so-called “intrinsic mode functions” (IMFs) and residual (mean trend), in the form of
x ( t ) = j = 1 N c j ( t ) + r ( t ) ,
where cj(t) is the jth IMF and r(t) is the residual. Each IMF satisfies two conditions: (1) The number of extrema and the number of zero crossings must be equal or differ by one; (2) the mean value of the upper and lower envelopes connecting all local maxima and minima, respectively, is zero at any data point. The extraction of the IMFs can be simply presented as a sifting process: (1) Locate all local maxima and minima of a data series and connect all maxima and all minima with two cubic spline lines separately to obtain the upper and lower envelops of the data series; (2) calculate the difference between the time series and the mean of the upper and lower envelops to yield a new series; (3) repeating steps (1) and (2) until the upper and the lower envelopes are symmetric with respect to zero mean under the certain criteria, then an IMF, cj(t), is derived; (4) subtract cj(t) from original time series to yield a residual r(t) and treat r(t) as the original time series and repeat steps (1)–(3) until r(t) becomes a monotonic function or a function with only one extremum. The EMD is adaptive and consists of independent IMFs, each of which has an orthogonal amplitude and frequency. For interpretation of temporally changing phenomena, the IMFs are more physically meaningful than the empirical orthogonal function (EOF) modes [26,29].
After the IMFs are obtained using the EMD method, we apply the Hilbert Transform (HT) to each component to calculate the instantaneous frequency by
H T ( t ) = X ( t ) 1 π t = 1 π P X ( ξ ) t ξ d ξ ,
where X(t) is an IMF vector, ⊗ denotes convolution operator, P represents the Cauchy principal value. With this expression, the corresponding analytic signal, Z(t), can be expressed as
Z ( t ) = X ( t ) + i H T ( t ) = a ( t ) e i θ ( t ) ,
in which a(t) is the amplitude and can be written as
a ( t ) = X 2 ( t ) + H T 2 ( t ) ,
θ ( t ) = tan 1 ( H T ( t ) X ( t ) ) is the phase. The HT provides a unique way for defining the imaginary part, so that the result is an analytic function [26]. The instantaneous frequency for the IMF can be defined as
ω ( t ) = d θ ( t ) d t .
In this study, the EMD method is performed on the 24-year daily series of the distance, which is between the locations of the daily axes and the location of the mean axis along Transect A, to generate variability components with different time scales.

2.2.3. Self-Organizing Map Analysis

With the derived Kuroshio surface axis locations, the SOM is used to cluster the Kuroshio axis. On the basis of unsupervised neural network, the SOM is an effective method for feature extraction and classification, and maps high-dimensional input data onto the elements of a regular, low-dimensional array to extract data features [30]. It is able to effectively preserve input data information because of the topology-preserving technique [31].
The SOM has been demonstrated to be powerful for feature extractions, especially when the signal is highly nonlinear [32,33]. It has been applied in the study of the interaction between the East China Sea Kuroshio and the Ryukyu Current [34], the variability of the Kuroshio intrusion through Luzon Strait [35], and the seasonal variability of Kuroshio intrusion northeast of Taiwan Island [31]. These applications suggest that the SOM may be a better way to cluster the Kuroshio axis information.
Prior to the neural network training process, the tunable SOM parameters need to be specified. Based on a brief analysis of the Kuroshio axis information, the parameters such as map shape, initial neighborhood size, layer topology function neuron distance function are specified. The SOM analysis is performed using selforgmap neural network toolbox in Matlab. Different SOM array sizes (1 × 2, 1 × 3, 2 × 2, 2 × 3, 3 × 3, 4 × 4, 5 × 5, and 6 × 6) are tested to evaluate the stability of the quantization error in the SOM analysis. A most optimized SOM array size can be determined based on the comparisons. The number of training steps and the initial neighborhood size are chosen as 100 and 3, respectively. The neurons in the layer of a SOM are arranged originally in positions according to a topology function. There are three functions, including grid, hexagonal, and random topology, in the Matlab selforgmap toolbox [36]. The hexagonal layer topology function is adopted in the classification process. The distance between neurons are computed from their positions with four distance functions, i.e., Euclidean, Manhattan, link, and box functions. The link function computes the number of links as distance, and the box function computes the layer neuron position vector based on distance. In previous studies on the SOM clustering technique application, the distance from a particular neuron to its neighbors has often been calculated using Euclidean [34,37,38] and link functions [39,40]. Comparisons of SOM results using the four distance functions [38,41,42] show that there is no “golden rule” to select a best distance function because each of the three functions, i.e., Euclidean, Manhattan, and link distance, is able to work better than others in different experiments. According to [36,43], the Euclidean and link distance functions are two of the most common for SOM analysis. In this study, the link function is adopted.
In this study, the input data for the SOM model is a matrix D M × N = { d 1 , d 2 , , d N } , where di denotes the vector containing the latitude information of the daily Kuroshio surface axis. The latitude of each axis is interpolated to the same meridional intervals from 122° E to 128° E. The spacing length is 0.1°. In this study, the length of the vector di (M) is 61, the number of the vectors (N) is 8737 because 41 failed extraction results are removed. In the learning stage of the SOM process, the data is introduced to SOM lattice with k neurons and the winning neurons (C1Ck) are updated to match the input data [44]. For this reason the winning neurons are often referred to as best matching units (BMU). According to [38,44], the winning element error (WEEi) can be expressed as
W E E i = ( d i S i ) . × ( d i S i )
where .× stands for the Hadamard (elementwise) product of vectors, Si is the neuron which is associated with the data vector di with the shortest Euclidian distance and expressed as S i = arg   min C k ( C k d i ) 2 . The SOM method is used to cluster the derived 24-year daily series of the Kuroshio surface axis location information.

3. Results and Discussion

3.1. General Features of the Kuroshio Mean Axis

The extraction method is applied on the 24-year AGV data to identify the location of the Kuroshio surface axis. Figure 3 shows mean ADT (color-filled contours), the detected Kuroshio mean axis (solid black curve), standard deviation (STD, dashed blue curves), envelopes (dashed cyan curves), 90 percentile (dashed green curve), and 10 percentile (dashed purple curve) from 1993 to 2016. The envelopes represent the farthest (closest) location that the KC reached the open ocean (shelf) over the study duration. The STD is a measure of how scattering the data are and can be calculated as the square root of the variance, which is the averaged squared deviations from the mean values.
From east of Taiwan Island to the Kuroshio middle segment in the ECS at about 128° E, the Kuroshio mean axis generally moves between 1.0 m and 1.2 m contours of the mean ADT. The STD is obviously smaller than the envelopes, implying that relatively small shifts of the Kuroshio axis occur frequently. For the Kuroshio middle segment in the ECS between about 125° E and 127.5° E, the Kuroshio axis appears nearly as a straight line, because the KC flows more stably and more straightly compared with other segments in the ECS [6,45]. The comparisons among STD, envelope, 90 and 10 percentile indicate that most of the Kuroshio axis shift with relatively small amplitude because 90 and 10 percentile is significantly closer to the STD than envelope. This implies that 80% of the daily detection results of the Kuroshio axis (between 90 and 10 percentile curves) are far away from the envelopes, while only 10% of those (between 90 percentile and upper envelope curves) correspond to the large anticyclonic turning, which indicate the Kuroshio intrusion into the ECS [7,31,46]. The reason why the 90 and 10 percentile curves are far away from the envelope curves is that relatively small axis fluctuations appear in most of the study period from 1993 to 2016. Furthermore, the envelopes represent extreme events and are part of 10% of the data in this study, so they do not represent most of the Kuroshio axis variation. Another reason is that the extraction method in this study detects the Kuroshio axis based on the local maximum velocity along a subsidiary line, it is hard to show the whole Kuroshio surface current field. Therefore, the detected Kuroshio axes will more likely be stable, which makes the fluctuation amplitudes of 80% of the Kuroshio axis (between 90 and 10 percentile curves) significantly smaller than the envelopes.

3.2. Variation of the Kuroshio Surface Axis

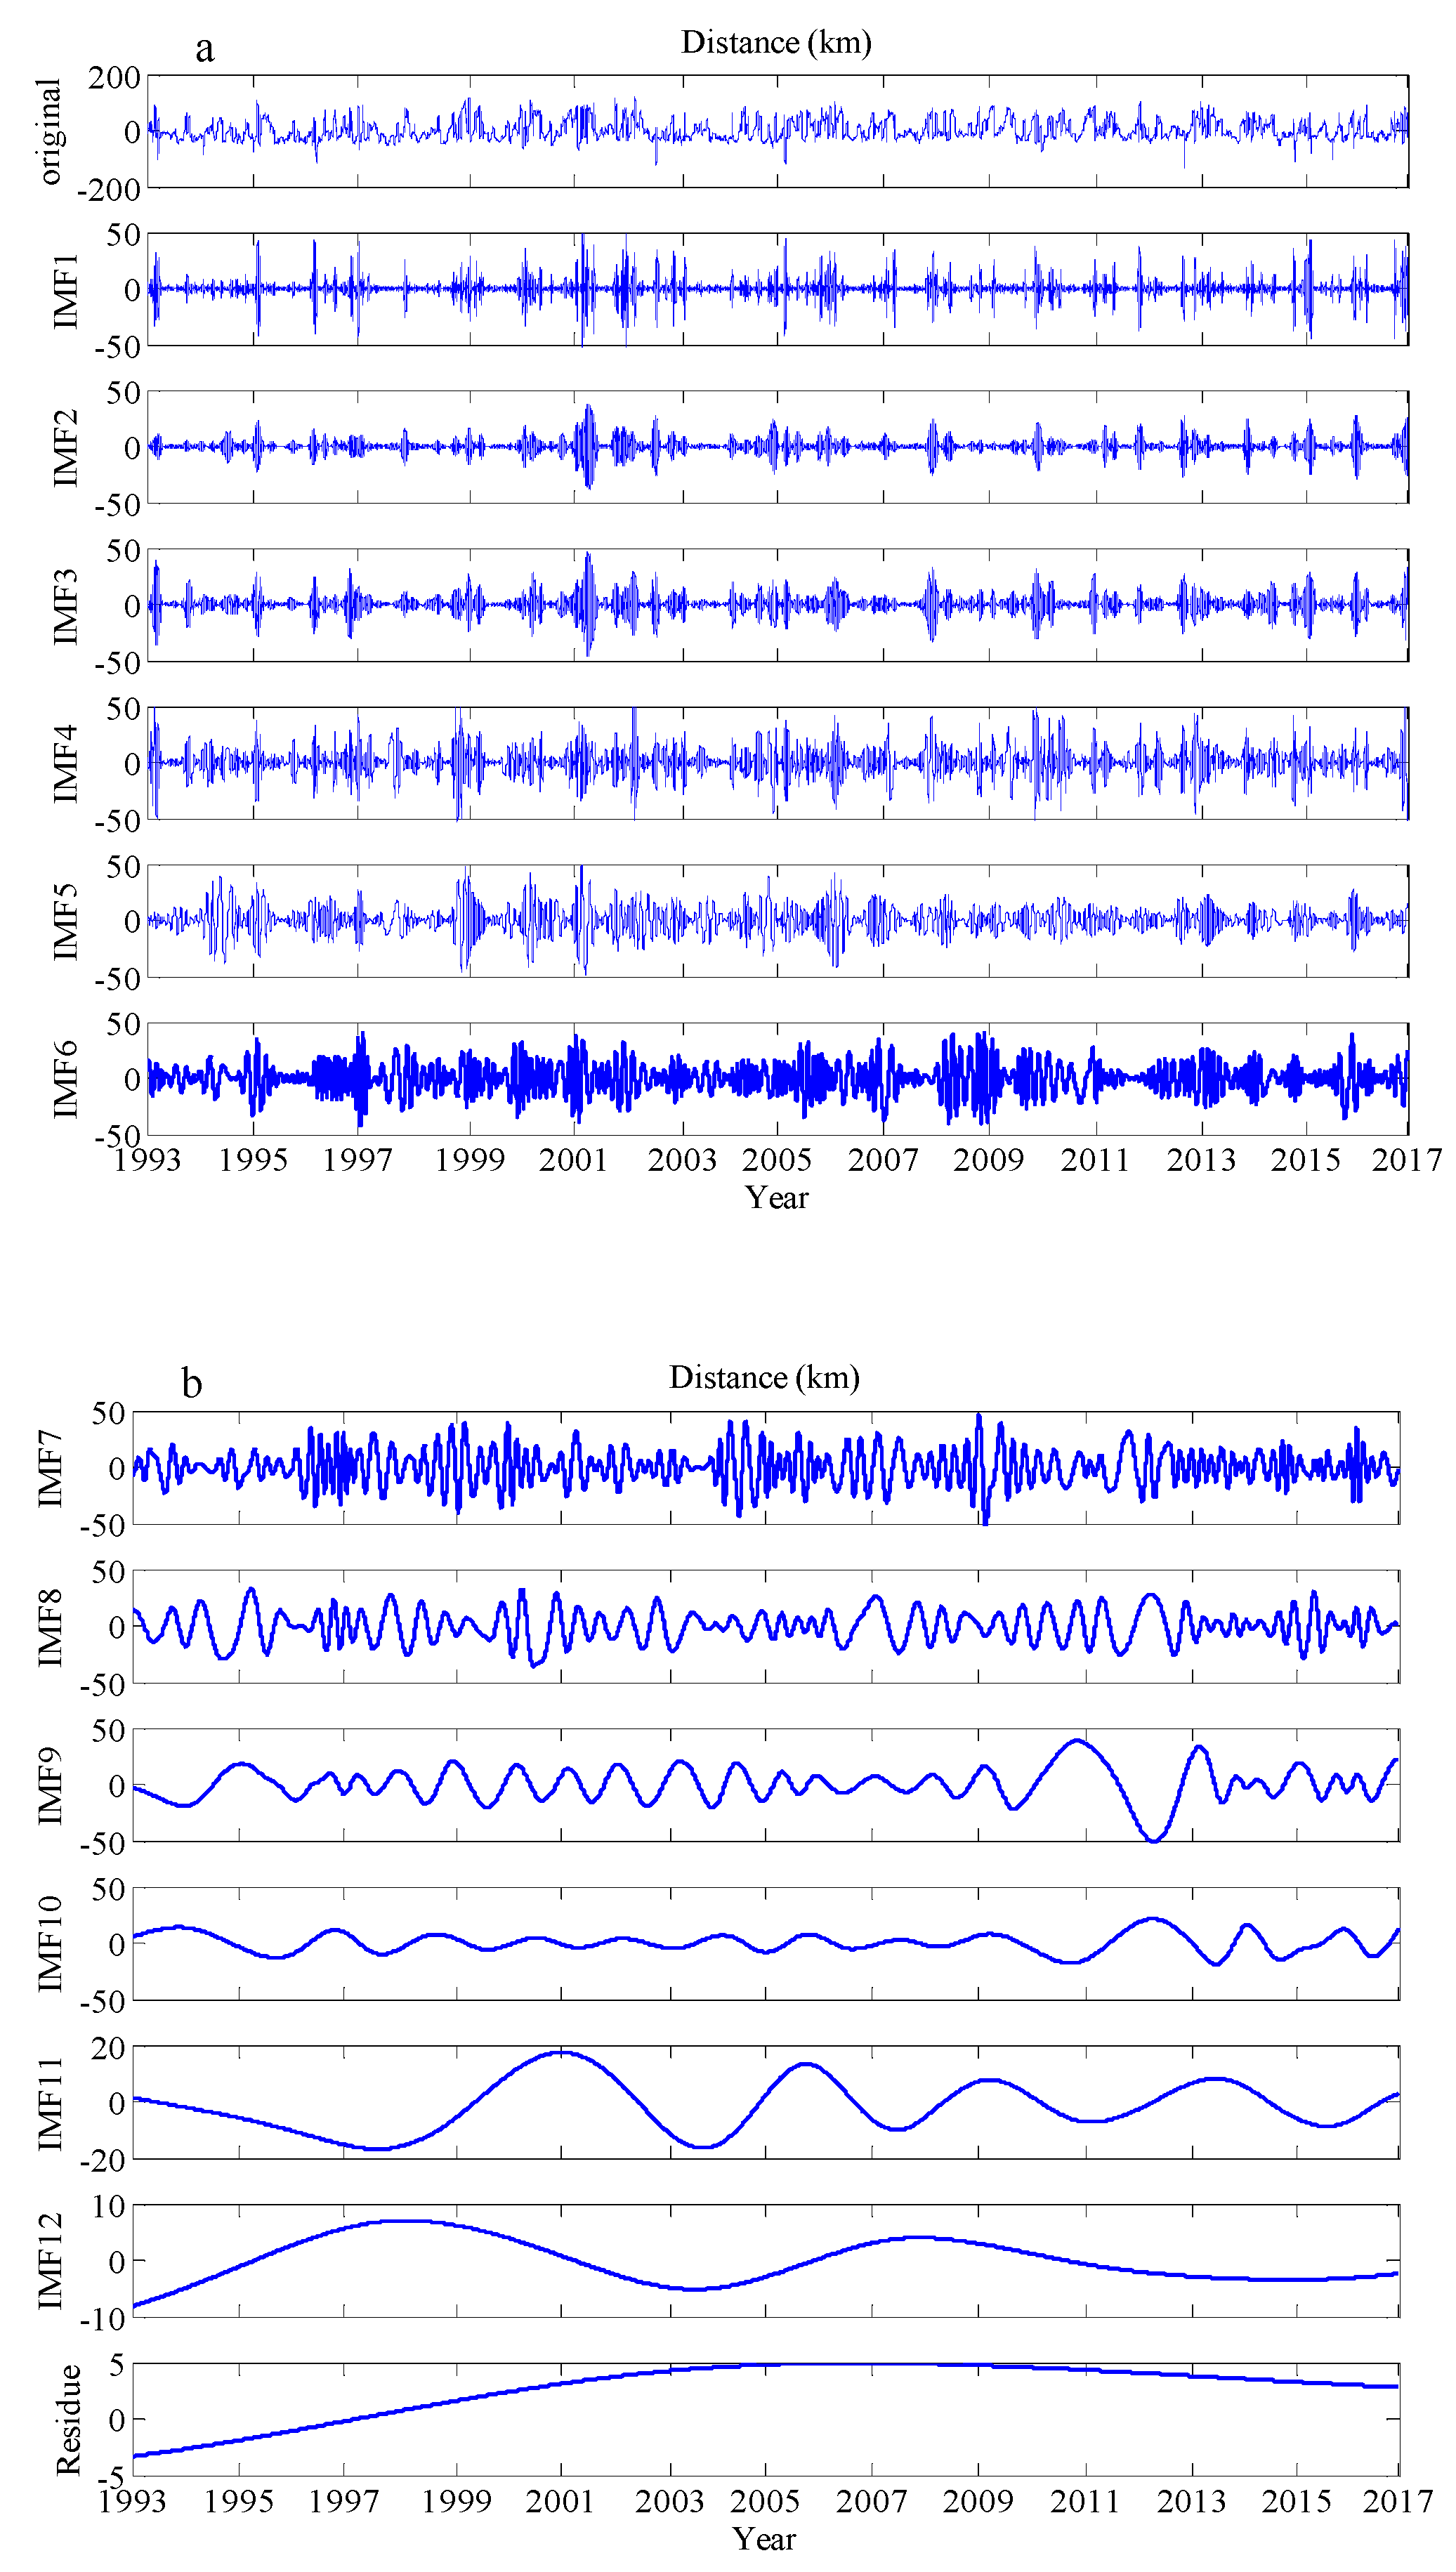
To further quantify the variation of the Kuroshio axis, the daily distances away from the location of the mean axis along Transect A are calculated. The positive values denote shoreward distances and negative values denote seaward distances. The distances of zero correspond to the intersection between the mean Kuroshio axis and Transect A. The top panel of Figure 4 shows the Kuroshio axis location relative to the mean axis along Transect A. The EMD method is performed on the 24-year time series of the distance to generate 12 IMFs and a residual (Figure 4), which represent the variability components of the surface Kuroshio axis with different time scales. We apply the discrete Hilbert transform (using Matlab HILBERT toolbox, i.e., “Hilbert” function) to calculate the instantaneous frequency for all of the IMFs by Equation (5). The mean period Tm can be expressed as
T m = 1 / ω m = 1 / t = 1 n 1 ω ( t ) ,
where ω(t) is the instantaneous frequency at time t, ωm represents the mean frequency. The energy E that represents the intensity of the signal can be calculated as
E = t = 1 N a 2 ( t ) ,
where a(t) is the instantaneous amplitude calculated by Equation (4).
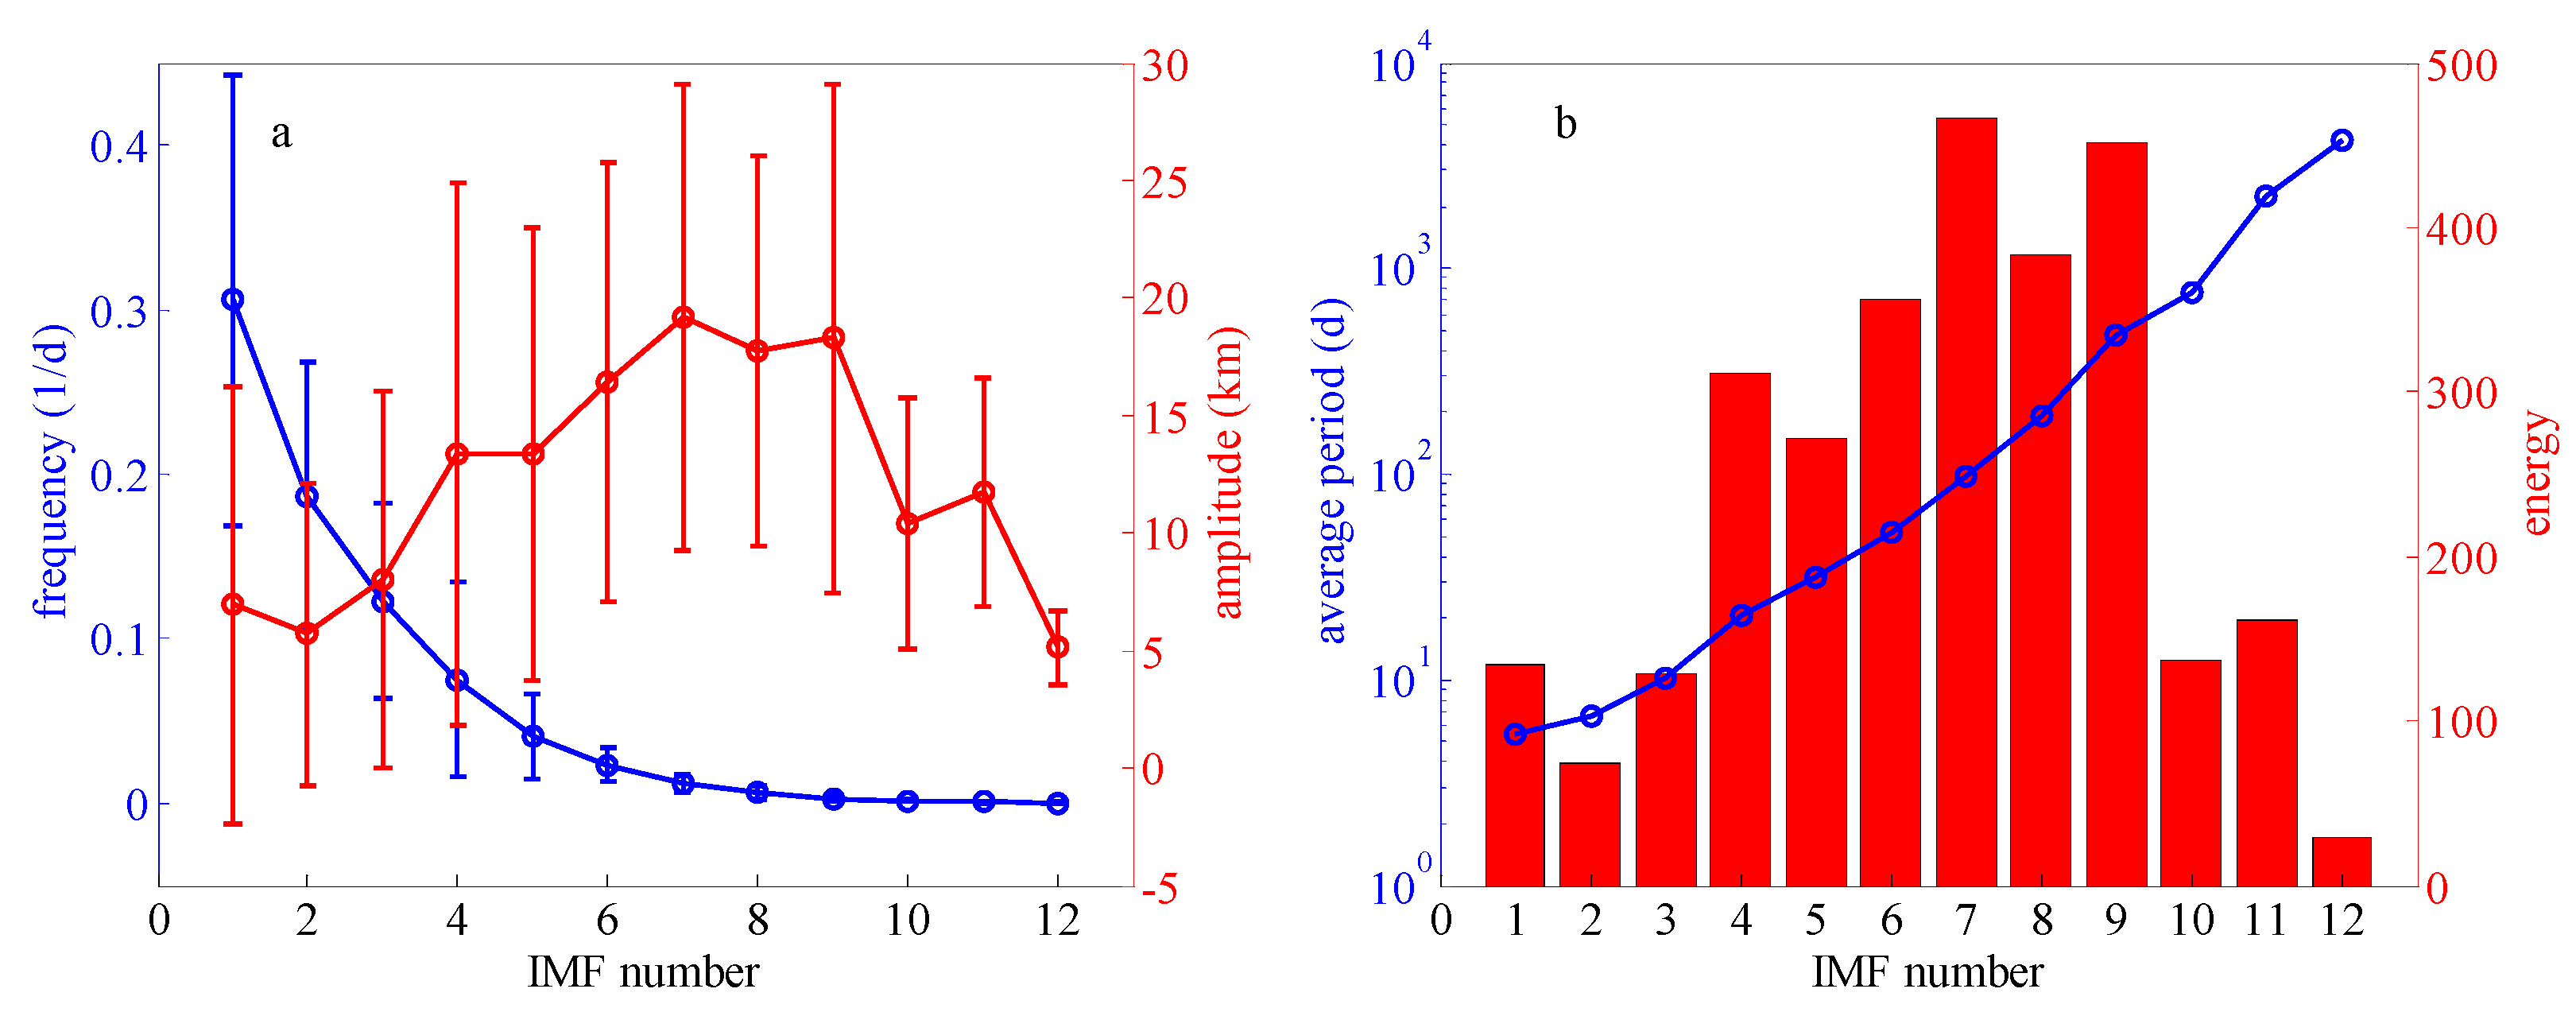
The error bars in Figure 5a represent the mean value and STD of the frequency and amplitude for each of the IMFs. The mean periods and energy of the IMFs are shown in Figure 5b. From Figure 5 one can see that the mean amplitude and energy of IMF4-IMF9 are larger than other IMFs, which means that the variability of the Kuroshio axis corresponding to IMF4-IMF9 is dominant during the study period from 1993 to 2016. IMF1-IMF4 have mean periods of 5.4, 6.6, 10.1, and 20.5 days, respectively, i.e., short-period fluctuations below the monthly timescale. As the ratio of large fluctuations for IMF4 is relatively higher compared with IMF1-IMF3, this means that the intensity of the Kuroshio axis variation with a mean period of 20.5 days is stronger than the other shorter-period variations. IMF5-IMF6 correspond to the monthly variation with mean periods of 31.6 and 51.8 days, respectively. The mean periods of IMF7-IMF8 are 96.4 and 191.3 days, which indicate the intra-seasonal and inter-annual variations. IMF9-IMF11 have mean periods of 1.3, 2.1, and 6.1 year, respectively, i.e., the inter-annual variations. The mean amplitude and energy of IMF9 are much larger than IMF10 and IMF11 (Figure 5), implying that the 1.3-year variation is the relatively important component among the three inter-annual variations. The longest mean period as long as 11.6 year occurs in IMF12 corresponding to decadal variation. The residual defines the variation trend of the Kuroshio surface axis, one can see that the Kuroshio axis northeast of Taiwan Island started with a seaward pattern in 1993, and gradually reversed toward the ECS continental shelf. The shoreward distance reached a maximum during the period from 2006 to 2008. Then the Kuroshio axis began to move back to the Pacific again. As the mean amplitude and energy of IMF7 and IMF9 are the largest of all the IMFs, implying that the intra-seasonal and inter-annual variations with mean periods of about 3.2 months and 1.3 years, are the two dominant components of the Kuroshio surface axis variation northeast of Taiwan Island.
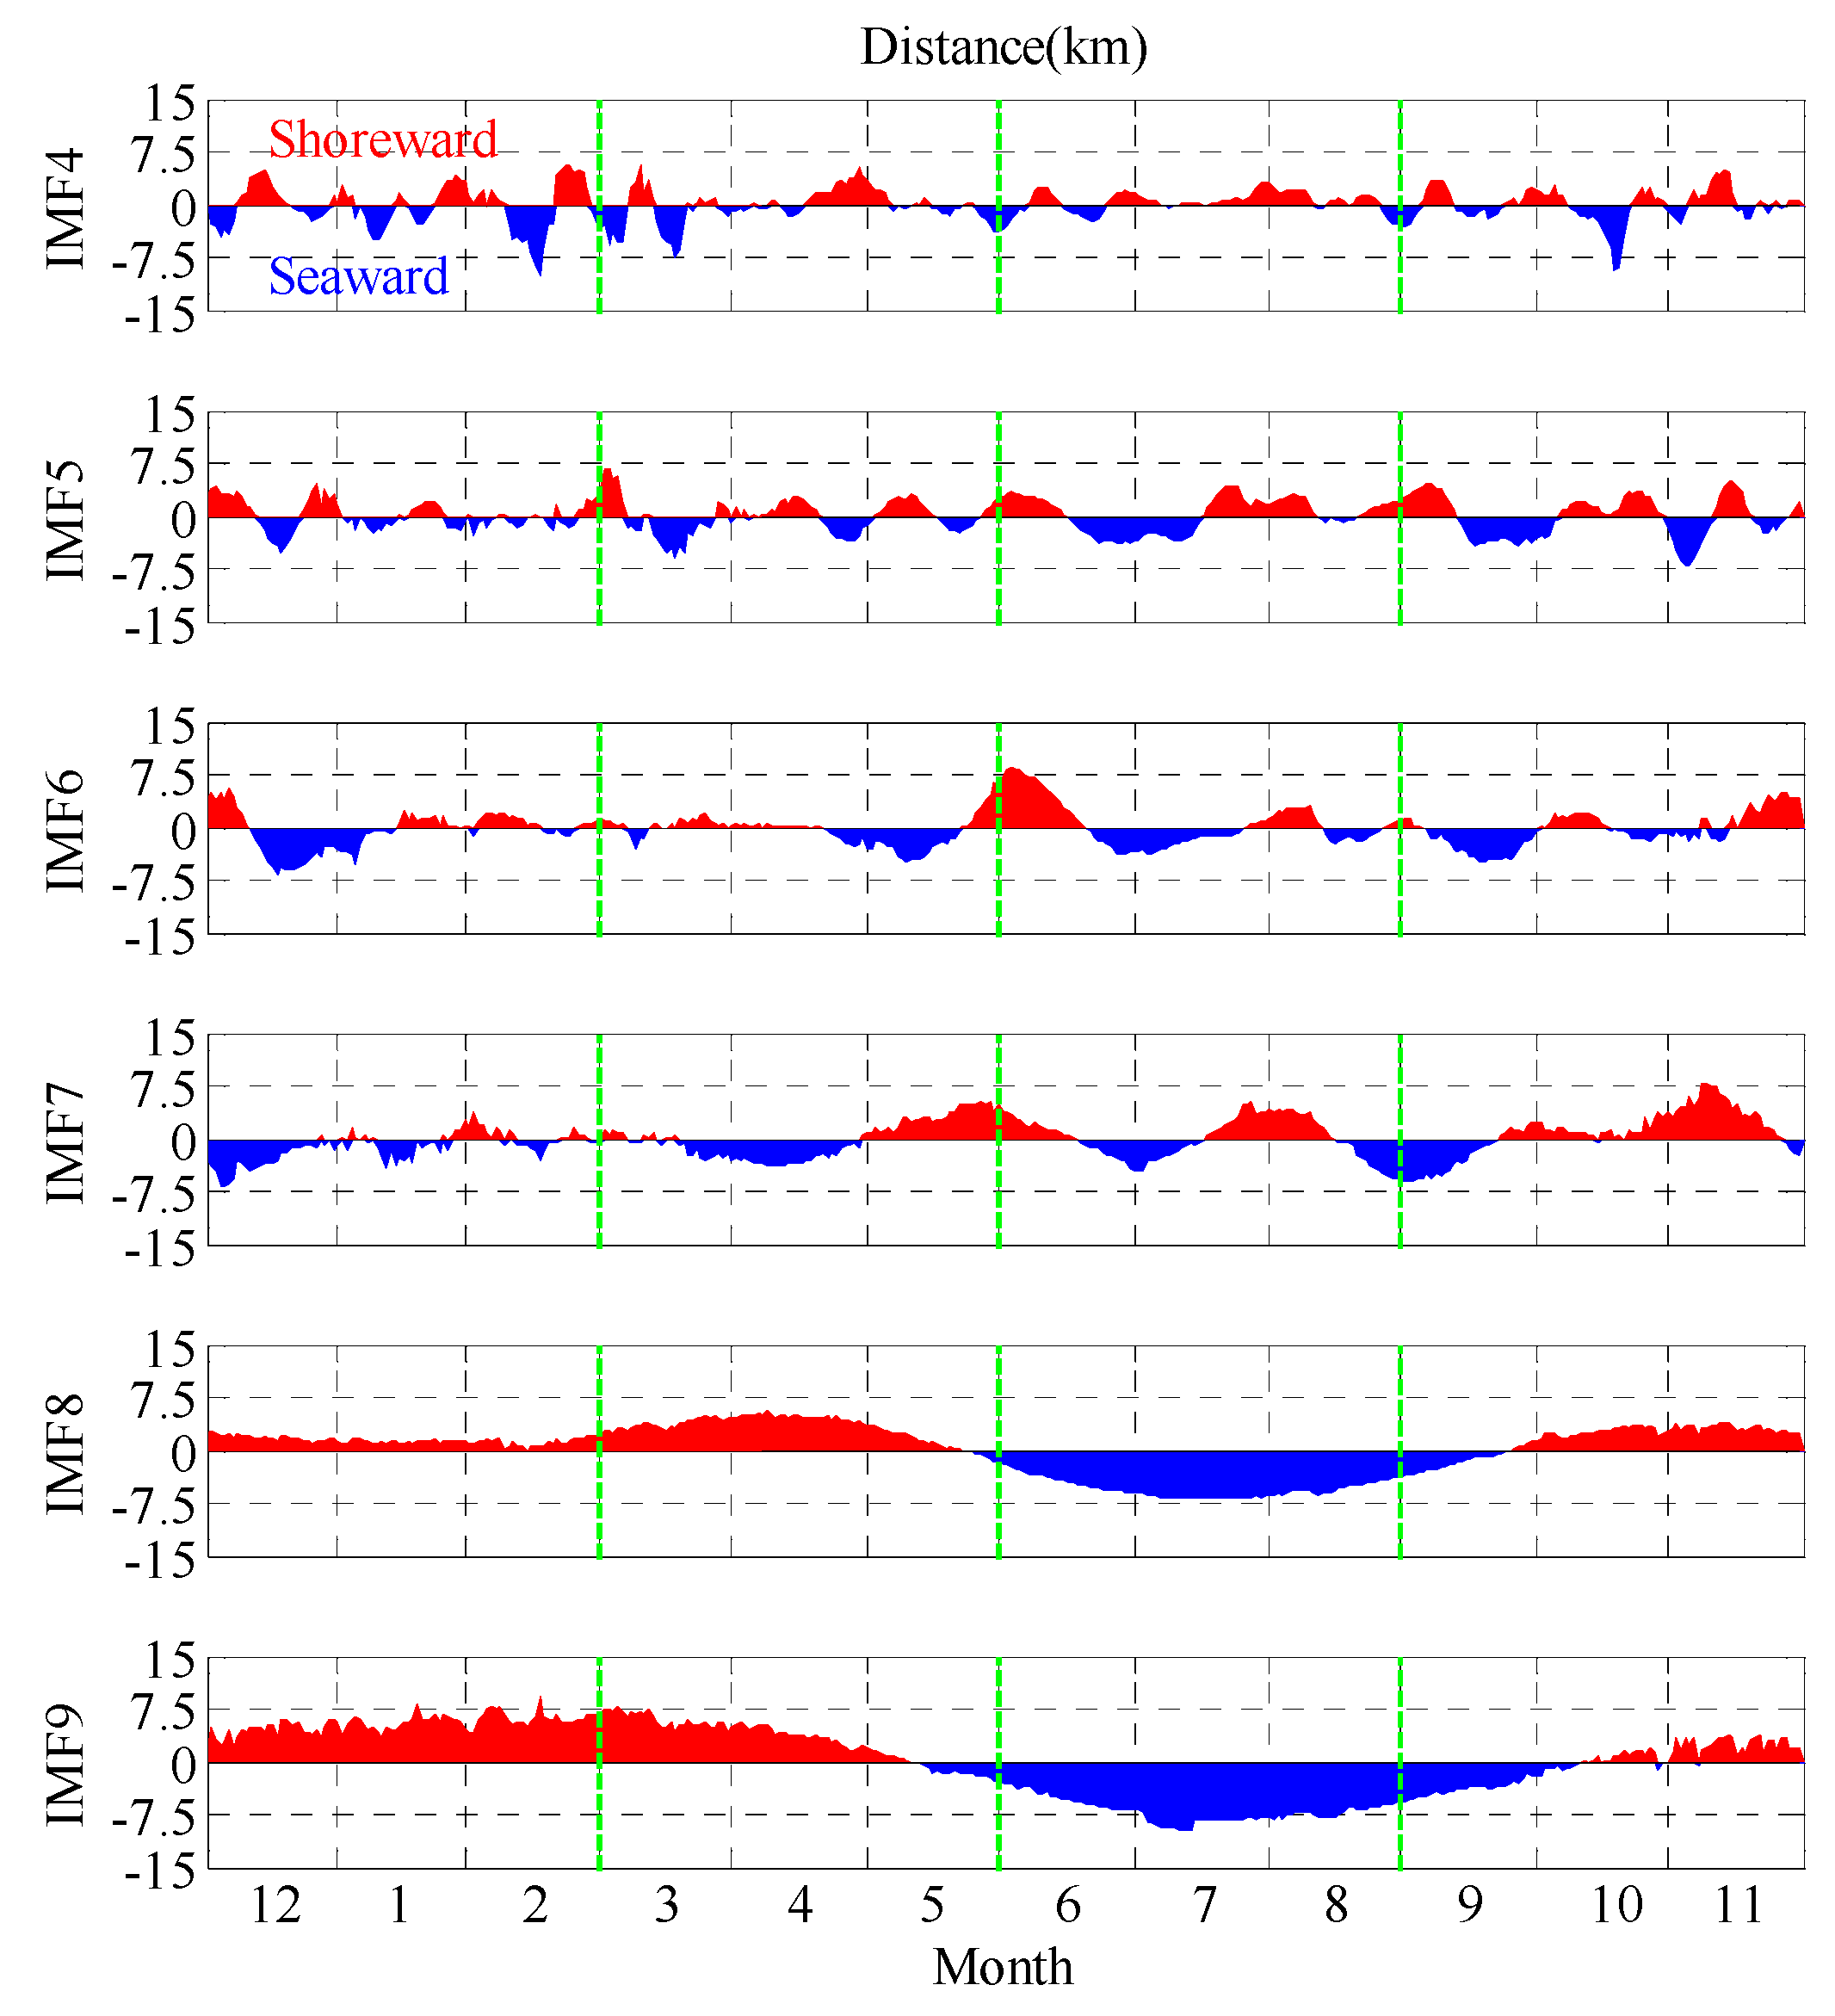
To examine the intra-seasonal variation of the Kuroshio surface axis, 24-year daily mean series of IMF4-IMF9, which are the dominant components of the variation, are shown in Figure 6. From Figure 6 one can see that remarkable seaward-shoreward oscillations of IMF4-IMF9 occur throughout the year. For the variation corresponding to IMF4, the fluctuation is the strongest in winter, next in spring and autumn, and weakest in summer for the Northern Hemisphere. For the monthly variations, the amplitude of IMF6 is generally larger than IMF5. IMF6 shows that the Kuroshio axis presents shoreward state distinctly in first half of June, second half of November and early December, while seaward state in most of March, late June, most of July, September and second half of December. Moreover, there are three crosses, at which the oscillation direction reverses, i.e., from shoreward to seaward in June and December, and from seaward to shoreward in March. For the intra-seasonal variation corresponding to IMF7, the fluctuation occurs frequently in winter, and the seasonal characteristics are weaker than that of IMF8, implying an extremely distinct intra-seasonal variation with a mean period of almost half a year. The intra-seasonal variability of IMF8 and IMF9 occurs quasi-periodically, implying the periodical variability of Kuroshio intrusion into the ECS. From IMF8, it can be seen that the Kuroshio axis shifts seaward in summer and shoreward in other seasons, because the KC, on the one hand, flows eastward directly with weak intrusion onto the shelf in summer, on the other hand, the Kuroshio intrusion is strong in other seasons [6]. The intra-seasonal variability of IMF9 is similar to IMF8. The intra-seasonal variation of the Kuroshio axis is consistent with that of the Kuroshio intrusion, which is related to the disposition of the current fields induced by monsoon [6,9].
It is worth noting that the EMD is applied only for the time series of the Kuroshio axis along Transect A. The variability along Transect A cannot represent the whole Kuroshio axis. However, Transect A is defined in Figure 3 for one of the main objectives of this study, which is studying the relation between the Kuroshio surface axis variation northeast of Taiwan Island and the onshore intrusion. Therefore, the EMD analysis along Transect A should be relatively representative in this study.
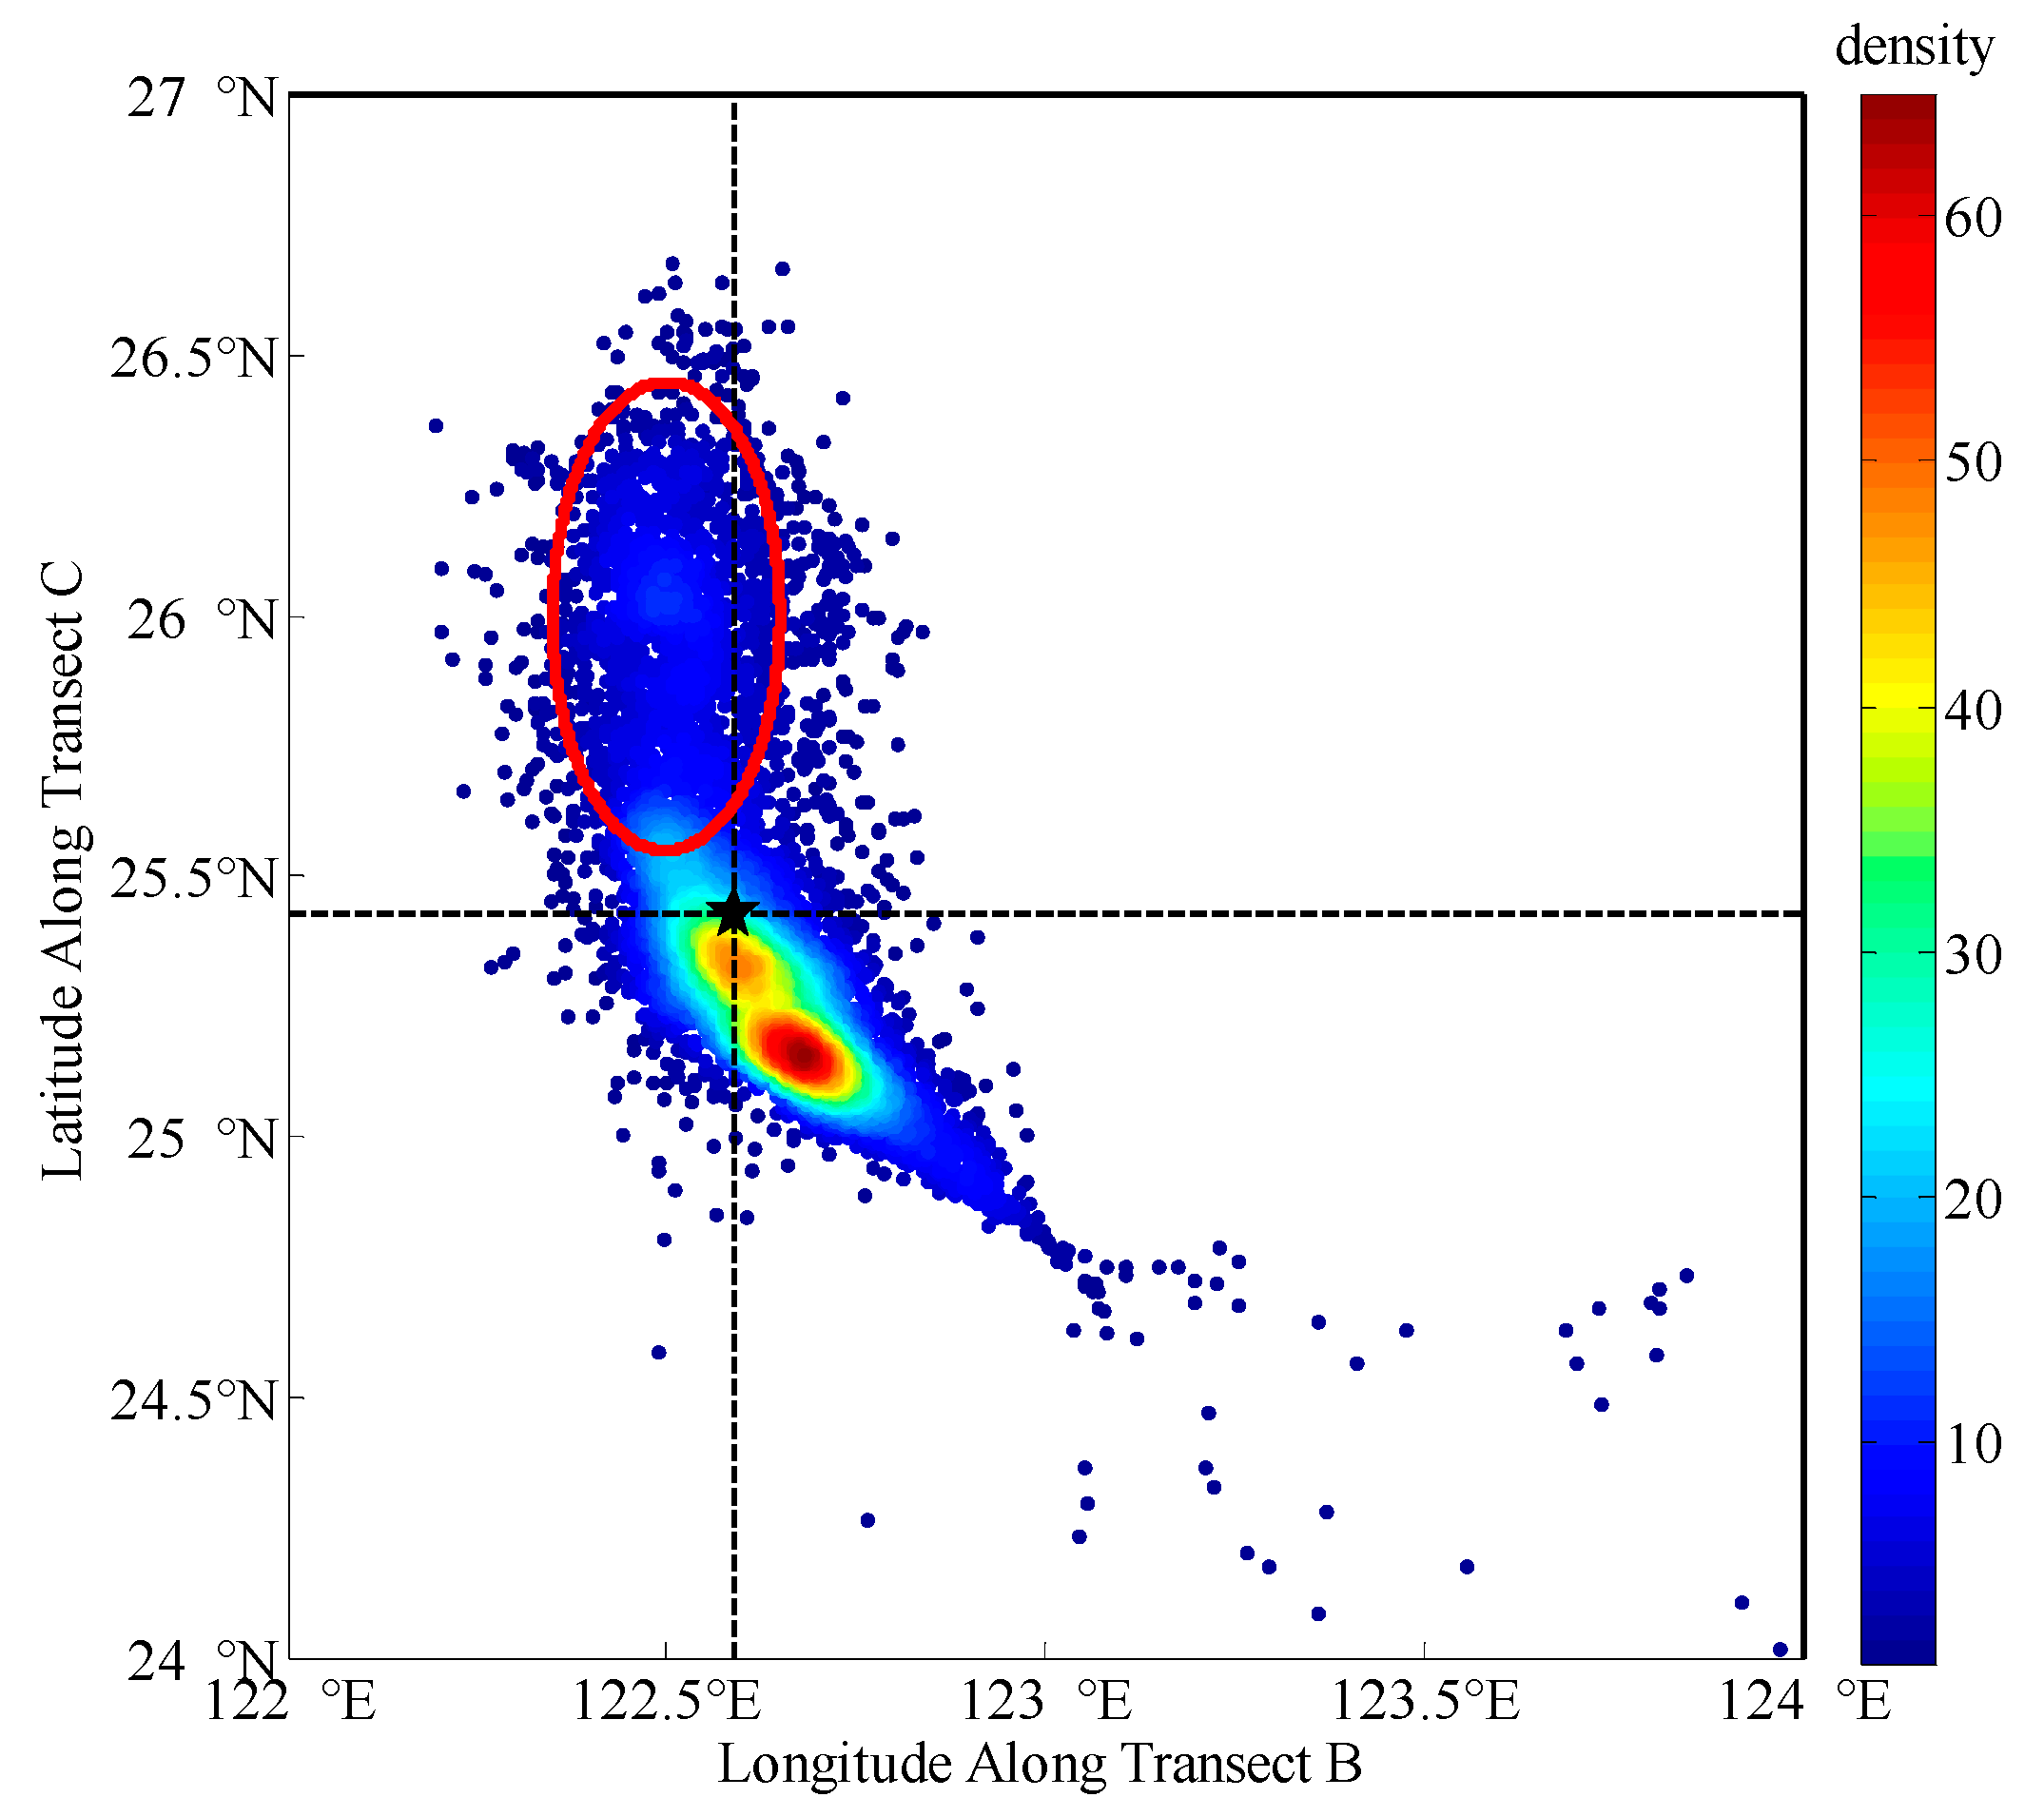
Two transects (Transects B and C shown in Figure 3) are used to analyze the relationship between the relatively upstream Kuroshio axis east of Taiwan Island (along Transect B) and the Kuroshio axis northeast of Taiwan Island corresponding to Kuroshio intrusion (along Transect C). The two transects are independent with Transect A. Each of the daily Kuroshio axis intersects Transect B and C at two points, the longitudes along Transect B versus the latitudes along Transect C are shown in Figure 7. The color scale represents the number of intersections, namely, the data density. One can see that there are two high-value centers of about 50 and 60 in the south and southeast of the intersection between the mean Kuroshio axis and the two transects (black pentagram in Figure 7). The results suggest that the Kuroshio flows directly eastward in northeast of Taiwan Island with weak intrusion for most the time. The intersections in the red ellipse shown in Figure 7 should correspond to the strong Kuroshio intrusion, because the intersections appear in the quite far north regions. Furthermore, it can be seen that when the Kuroshio intrudes into the ECS, the longitudes of the intersections along Transect C are generally in an interval from 122.4° E to 122.6° E, in other words, the KC flows closely to Taiwan Island in the upstream region east of Taiwan Island when the strong Kuroshio intrusion occurs.

3.3. Self-Organizing Map Analysis

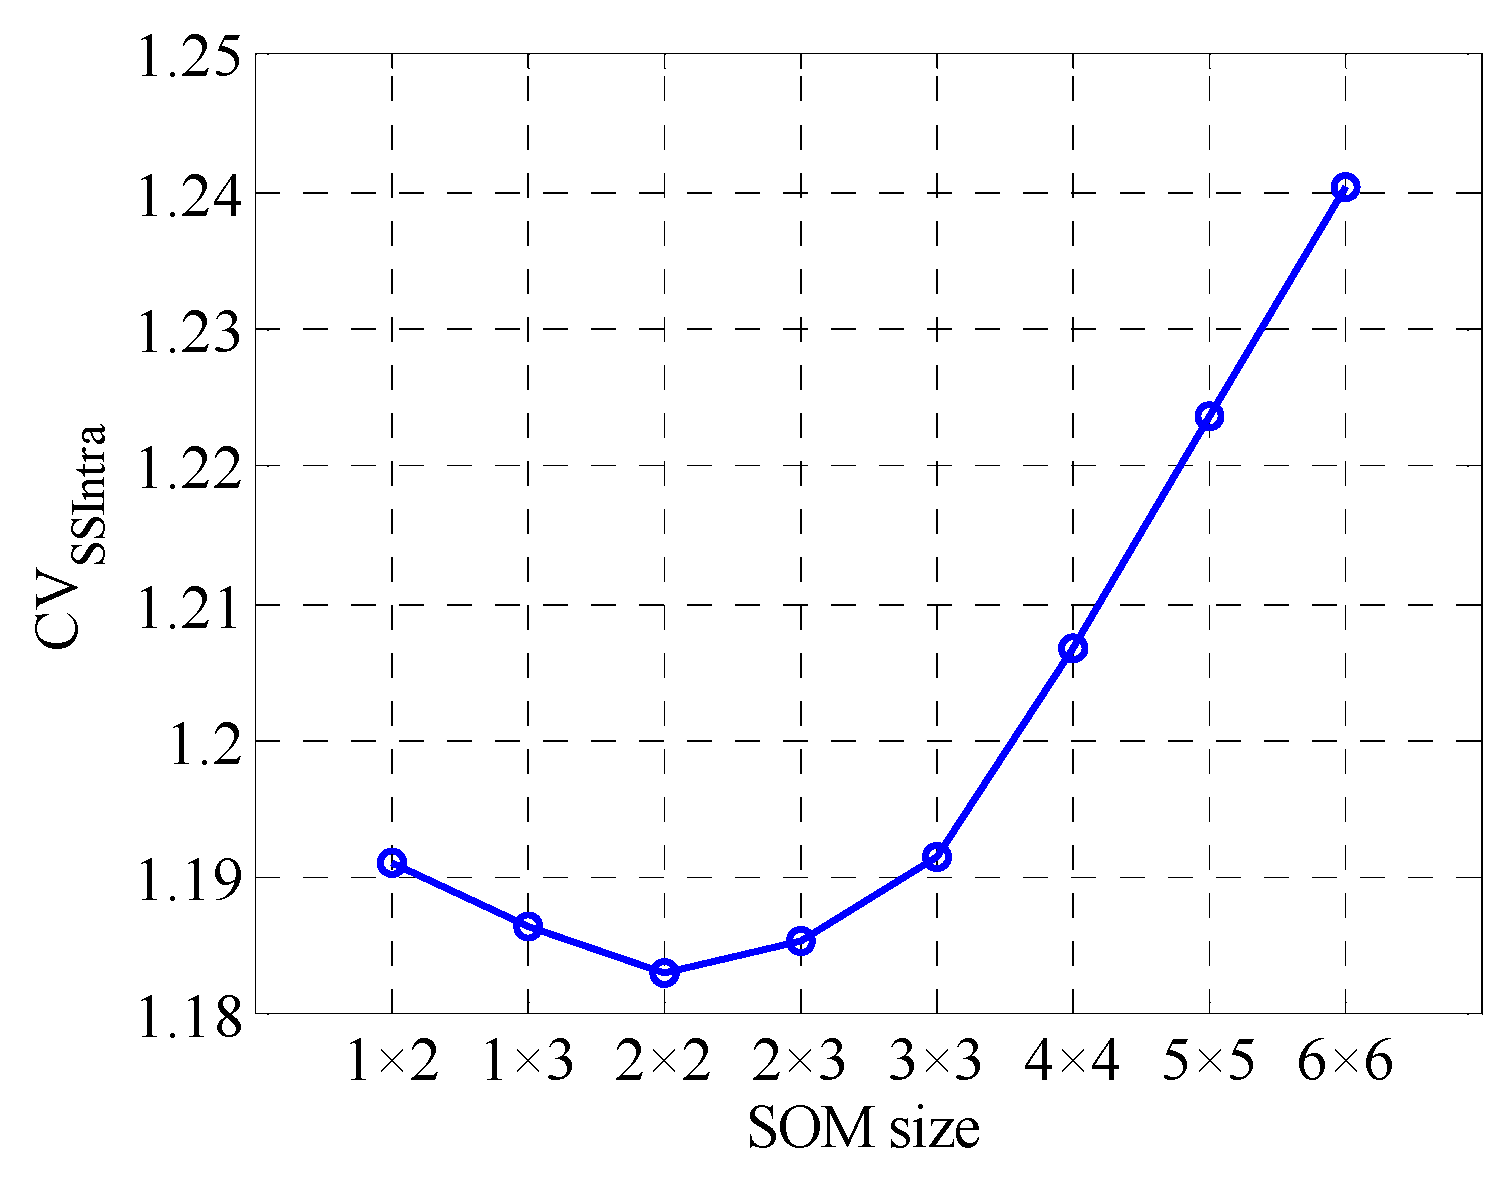
With the derived Kuroshio axis location information, the SOM method is used to cluster the Kuroshio axis over the last 24 years. First, the adequacy of the SOM array size is evaluated using the relative error, i.e., the coefficient of variation, of the intra-class sum of squares (CVSSIntra) [44,47]. Evolution of CVSSIntra shows one minimum (Figure 8) for 2 × 2 SOM array, implying that the most optimized SOM array size is 2 × 2. Therefore, the SOM analysis identifies four BMU patterns.
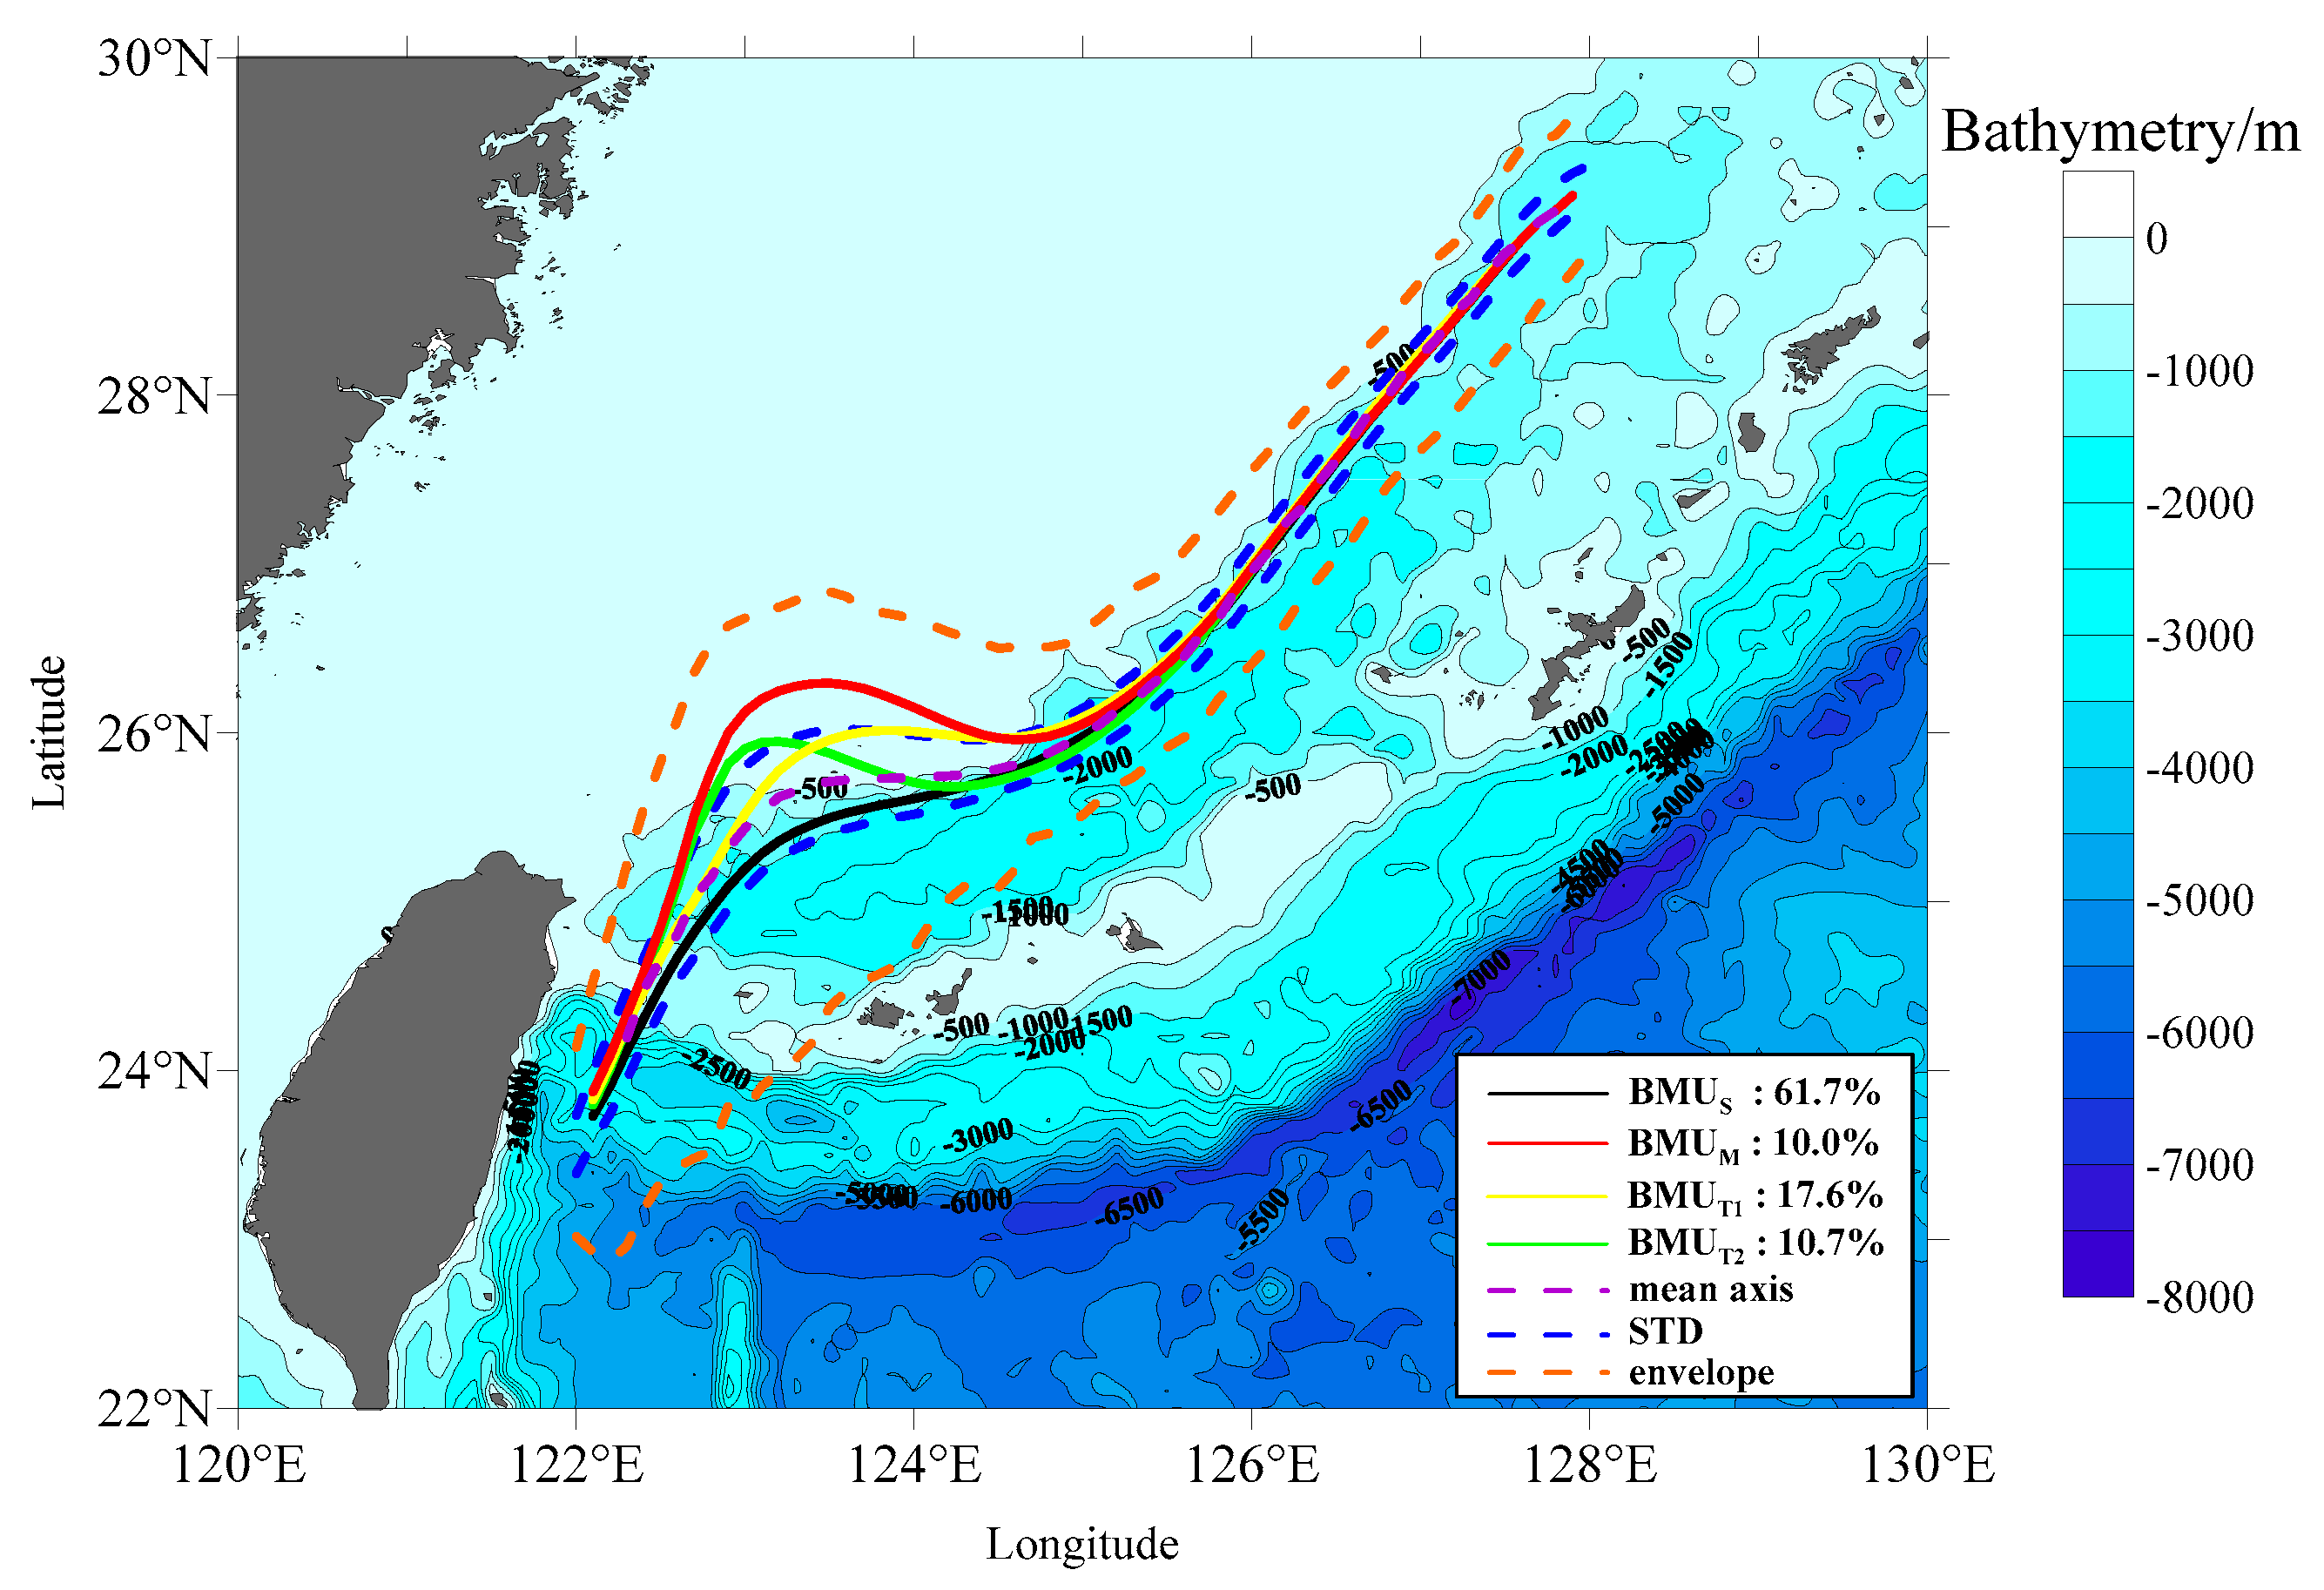
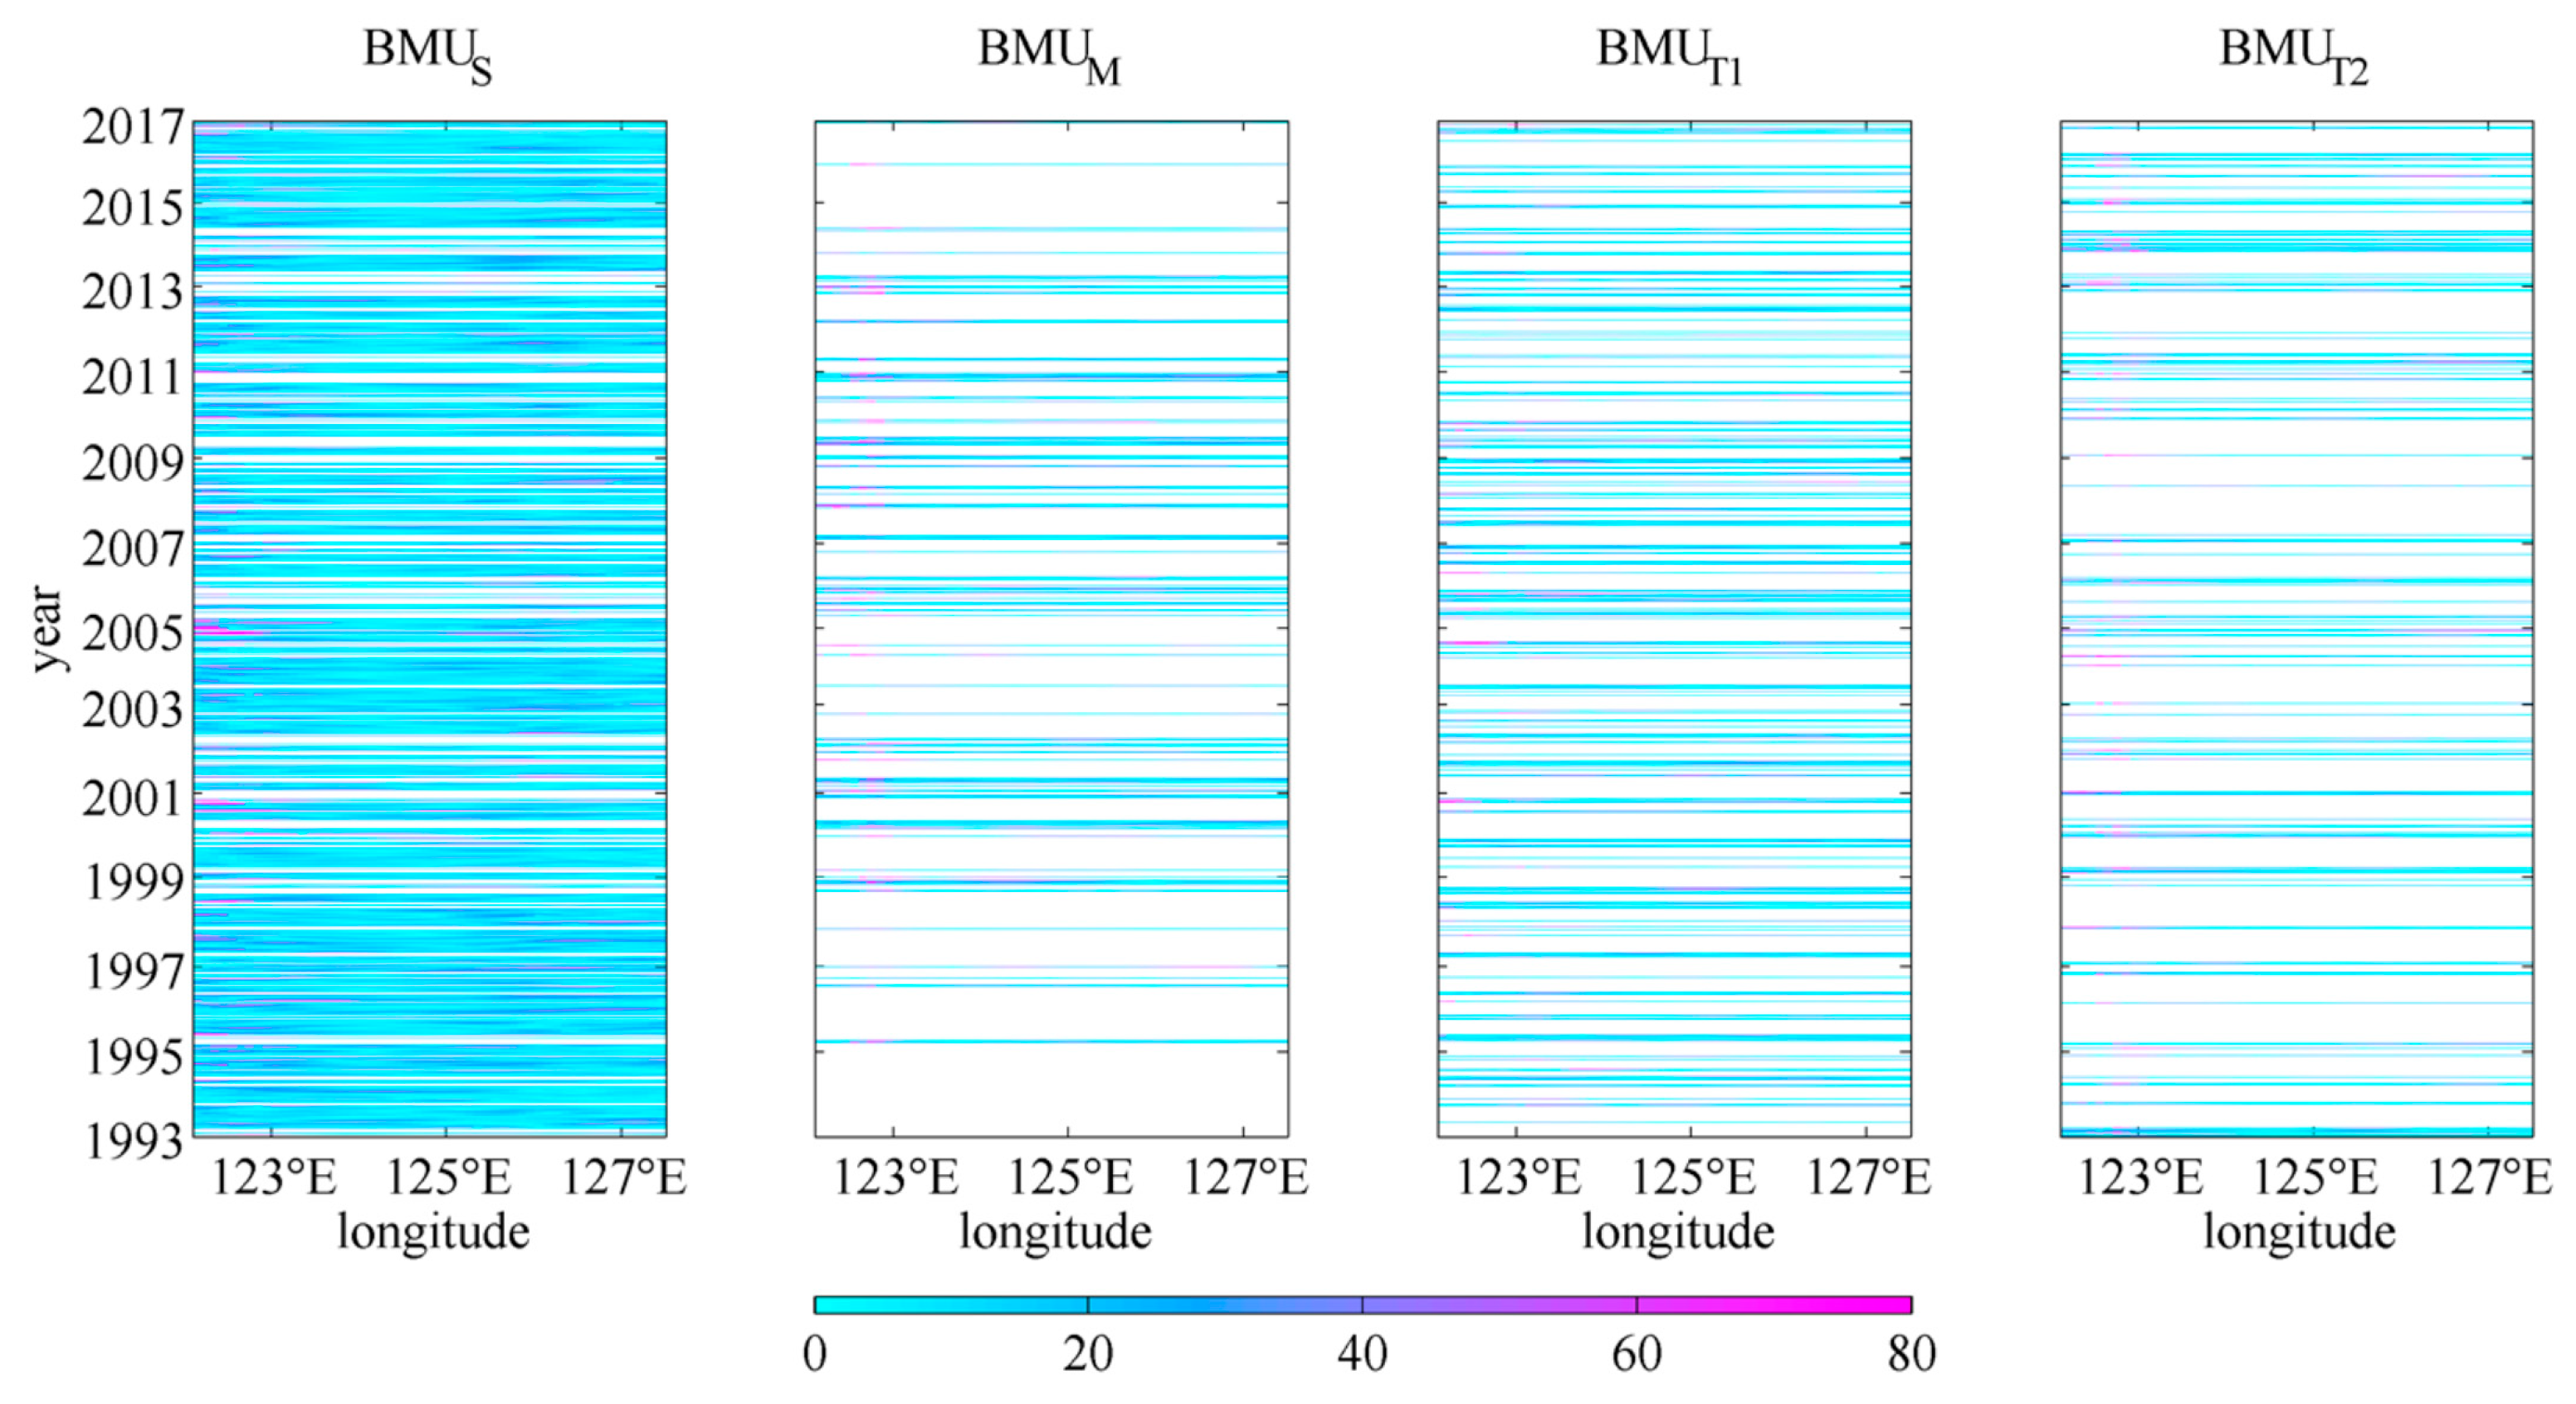
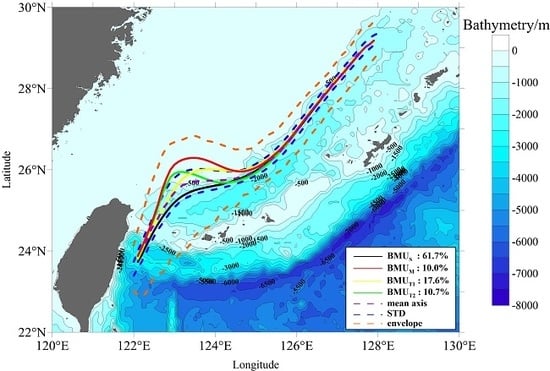
Figure 9 shows the mean axes for the four BMU patterns. BMUM and BMUS correspond to meandering-path and straight-path patterns. BMUT1 and BMUT2 are regarded as transition stages between BMUM and BMUS. The mean axis of BMUM shows a northward flow across the isobaths from 122.1° E to 123.0° E and entering the ECS, then deflects southeastward at 123.5° E. BMUT2 is similar to BMUM at the beginning, but the mean axis deflects southeastward as soon as it flows across the 200 m isobaths. Subsequently, the mean axis of BMUT2 remerges to that of BMUS corresponding to straight-path state. BMUT1 is closer to the Kuroshio mean axis than other three from 122.1° E to 122.8° E, continuously flows northwestward and finally remerges to the axis of BMUM. For BMUS, the mean axis shows a northeastward flow at the beginning and deflects eastward with weak intrusion onto the shelf. For each of the BMU patterns, the temporal evolution of the WEEi is shown in Figure 10, where the subscript i denotes the day number from 1993 to 2016. From Figure 10, one can see that the errors are significantly larger between 122° E and 123.5° E than other intervals for all of the four BMU patterns, indicating the high-amplitude variation of the Kuroshio surface axis northeast of Taiwan Island. At the end of 2001 and the beginning of 2005, there are relatively high errors for BMUS between 122° E and 123° E because the daily Kuroshio axes are located distantly to the south of the mean axis and close to the lower envelope curve (Figure 9). It indicates that the KC deflects directly northeastward at about 23° N during the particular time period (the end of 2001 and the beginning of 2005). However, the special situation occurs in only less than 20 days during the whole 24-year study time period and is located on the east of the Taiwan Island which is not mainly focused in this study, more detailed analysis for the situation and mechanism will be carried out in future.
To quantify the occurrence percentage of each pattern, an index of the occurrence frequency (IOF) is calculated by summing the occurrence number of each pattern divided by the total record length [33]. Over the 24 years, the IOFs of BMUS, BMUM, BMUT1, and BMUT2 are 61.7%, 10.0%, 17.6%, and 10.7%, respectively (Figure 9). One can see that the IOF of meandering-path pattern BMUM occupies only about 1/6 of that of straight-path patterns BMUS. In other words, the strong deflection of the Kuroshio axis corresponding to BMUM does not occur frequently. This conclusion is consistent with the analysis results from Figure 7.
To examine the most probable case of BMUS (large IOF of 61.7%), the principal component analysis (PCA) [48,49] is used for the detected results of the Kuroshio surface axis. The detailed analysis results based on the PCA are described in Appendix A, which is able to corroborate the SOM results that the straight-path pattern more likely occurs than other three patterns.
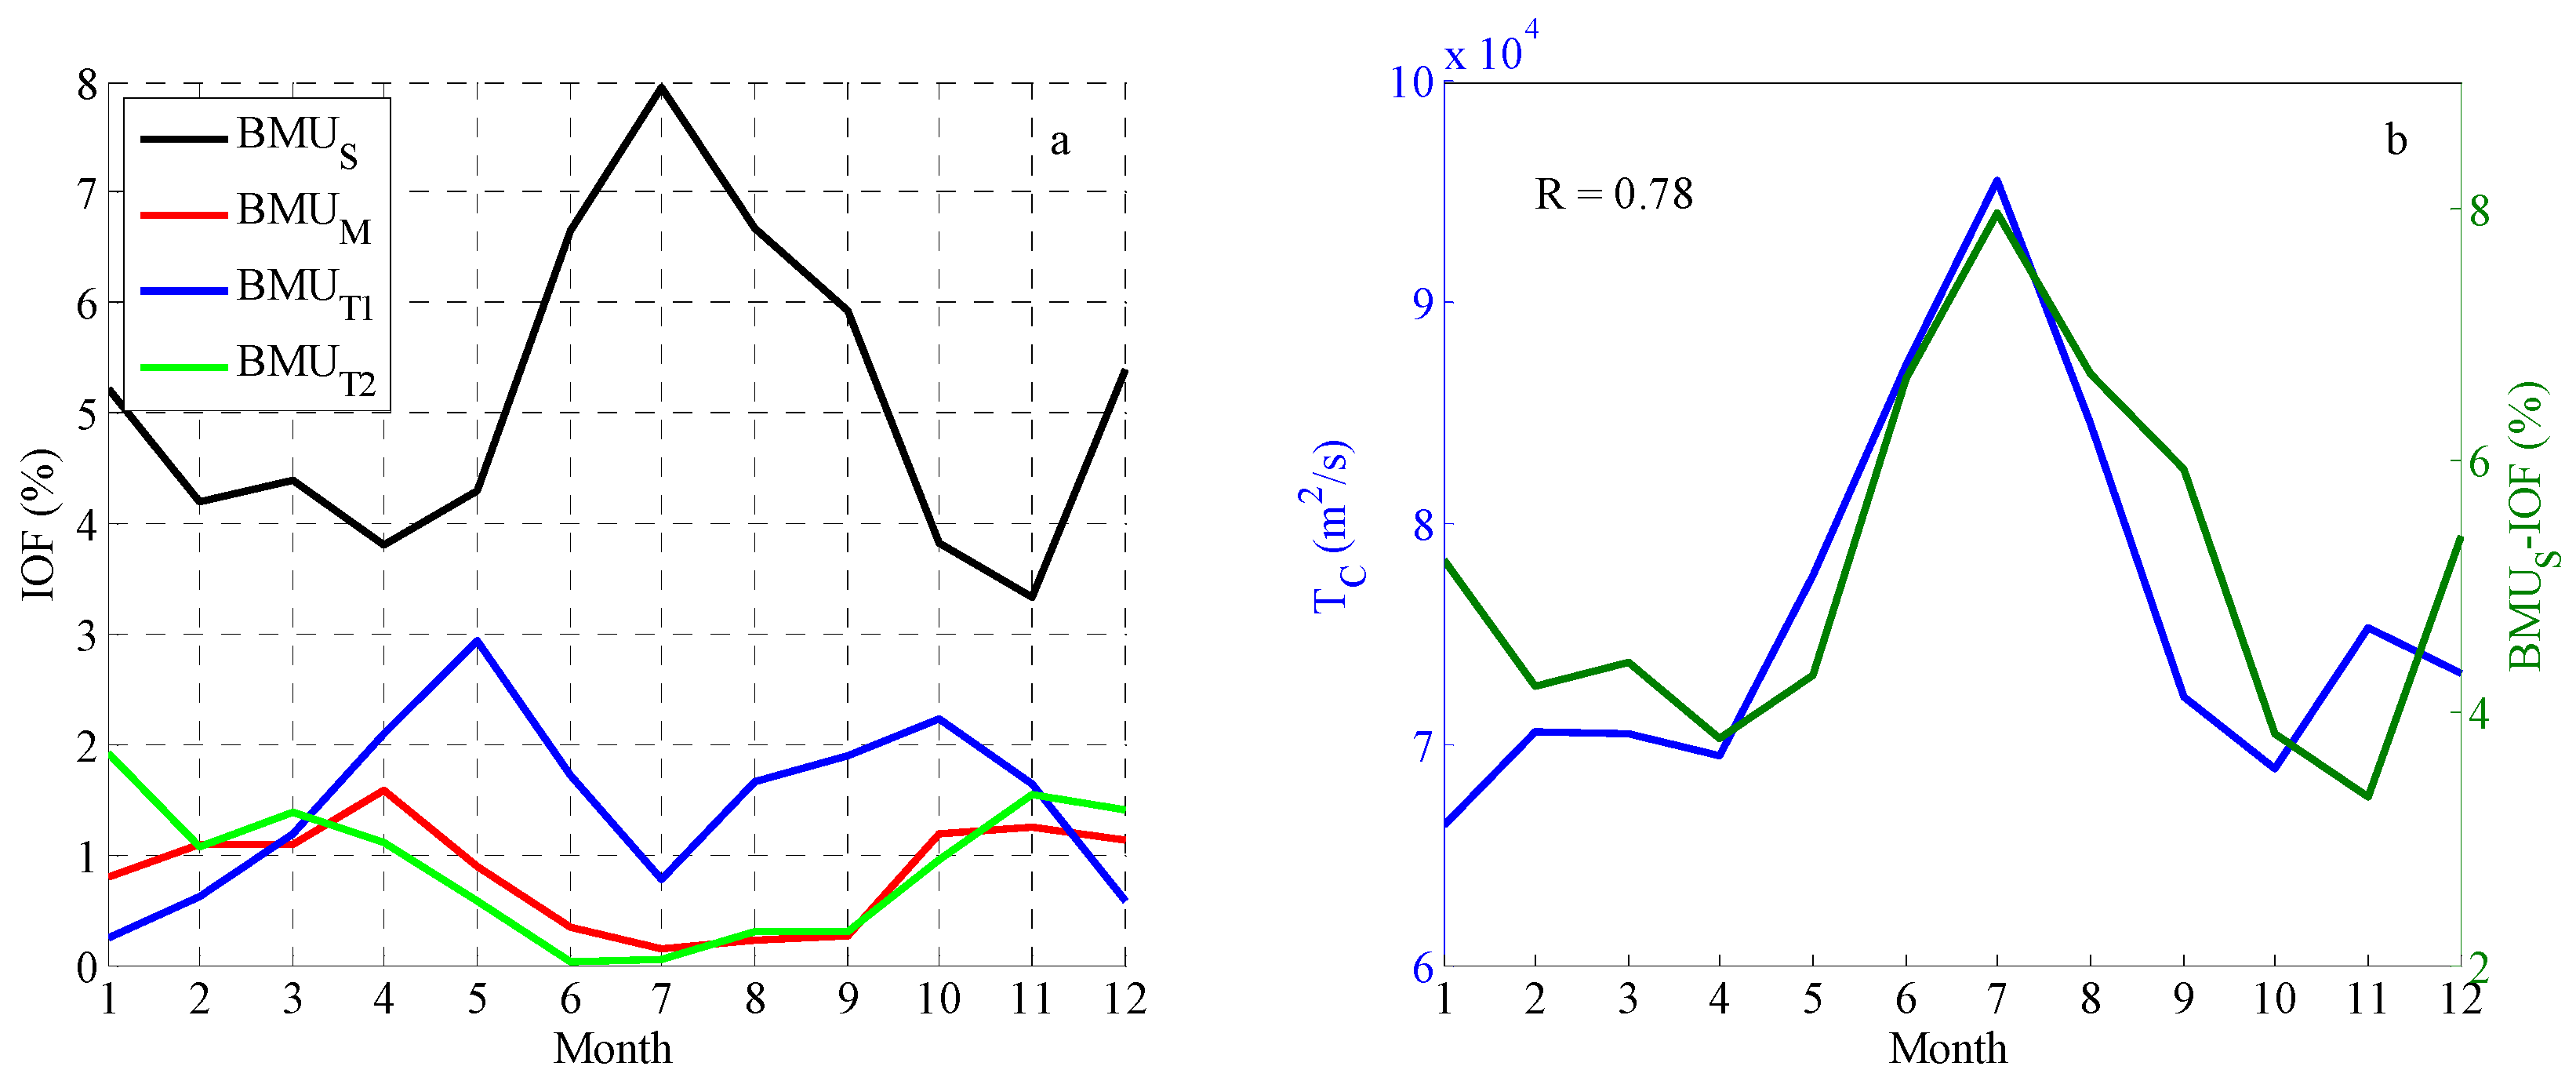
The monthly IOFs for the four patterns are shown in Figure 11a. The monthly IOFs are calculated by summing the occurrence number of each BMU pattern per climatological months divided by the total record length. For each of the BMU patterns, the sum of the monthly IOFs over 12 months is equal to the IOF values, as shown in Figure 8. The monthly IOFs of BMUS are higher than those of other patterns in all twelve months, and show strong seasonality: higher values in summer, and lower values in spring and autumn for the Northern Hemisphere. The IOFs of BMUM and BMUT2 are highest in winter and spring, while lowest in summer. Unlike BMUT2, the other transition pattern, BMUT1, has larger IOFs from April to November. BMUT1 shows relatively weak seasonality, because there is noticeable increase from January to May and from July to October and decrease from May to July and from October to December.
To explore a possible relationship between the upstream surface current transport along Transect B and the Kuroshio intrusion, the daily surface current transport time series are calculated from 24-year AGV data and expressed as
T C = p 1 p 2 U   d s ,
where TC is the surface transport along Transect B, U is the AGV and actually denote the meridional component because of the zonal Transect B, ds is the distance between two neighboring points across the width of the Kuroshio, p1 and p2 represent two endpoints of Transect B. At the monthly scale, the IOF of BMUS (straight-path pattern) is positively correlated with the monthly mean value of TC (R = 0.78; Figure 11b). The statistical results indicate that TC is larger in summer months, and the corresponding IOF of BMUS is higher, i.e., the straight-path pattern more likely occurs when the upstream surface transport increases especially in summer.
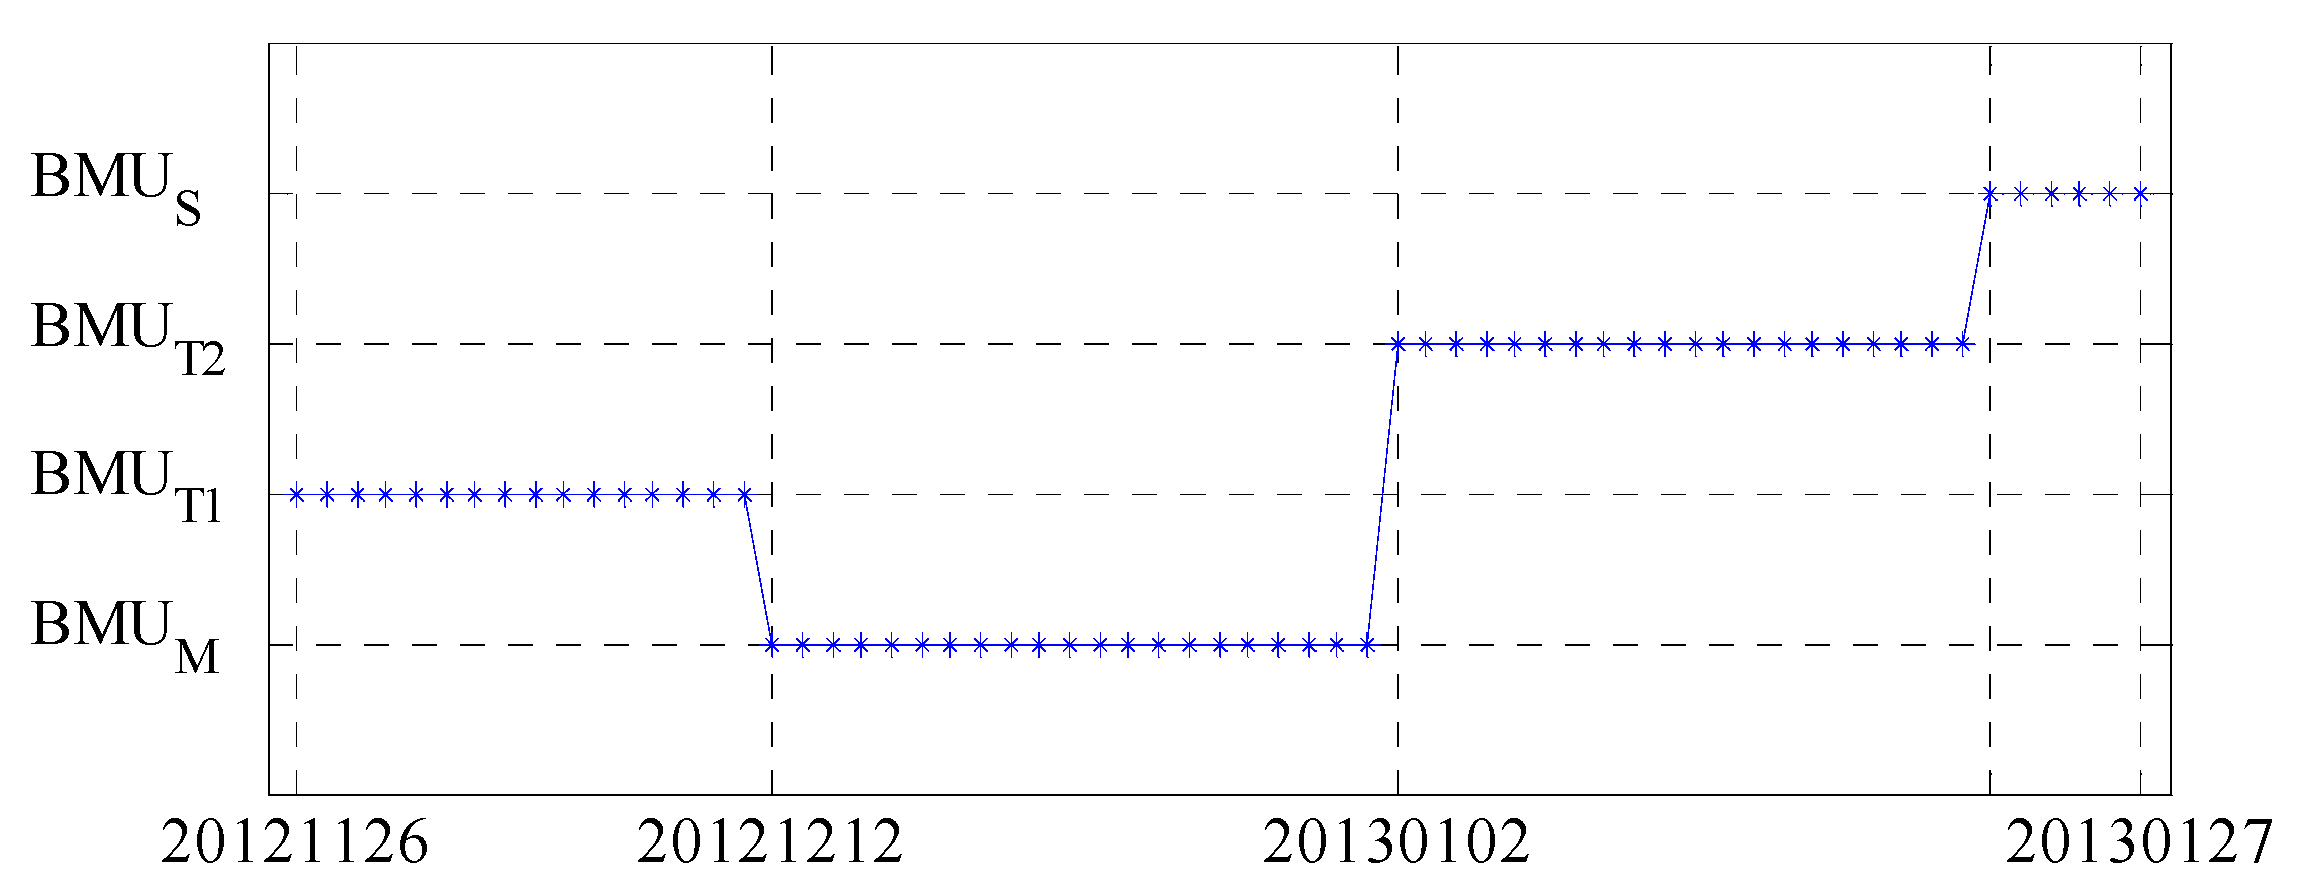
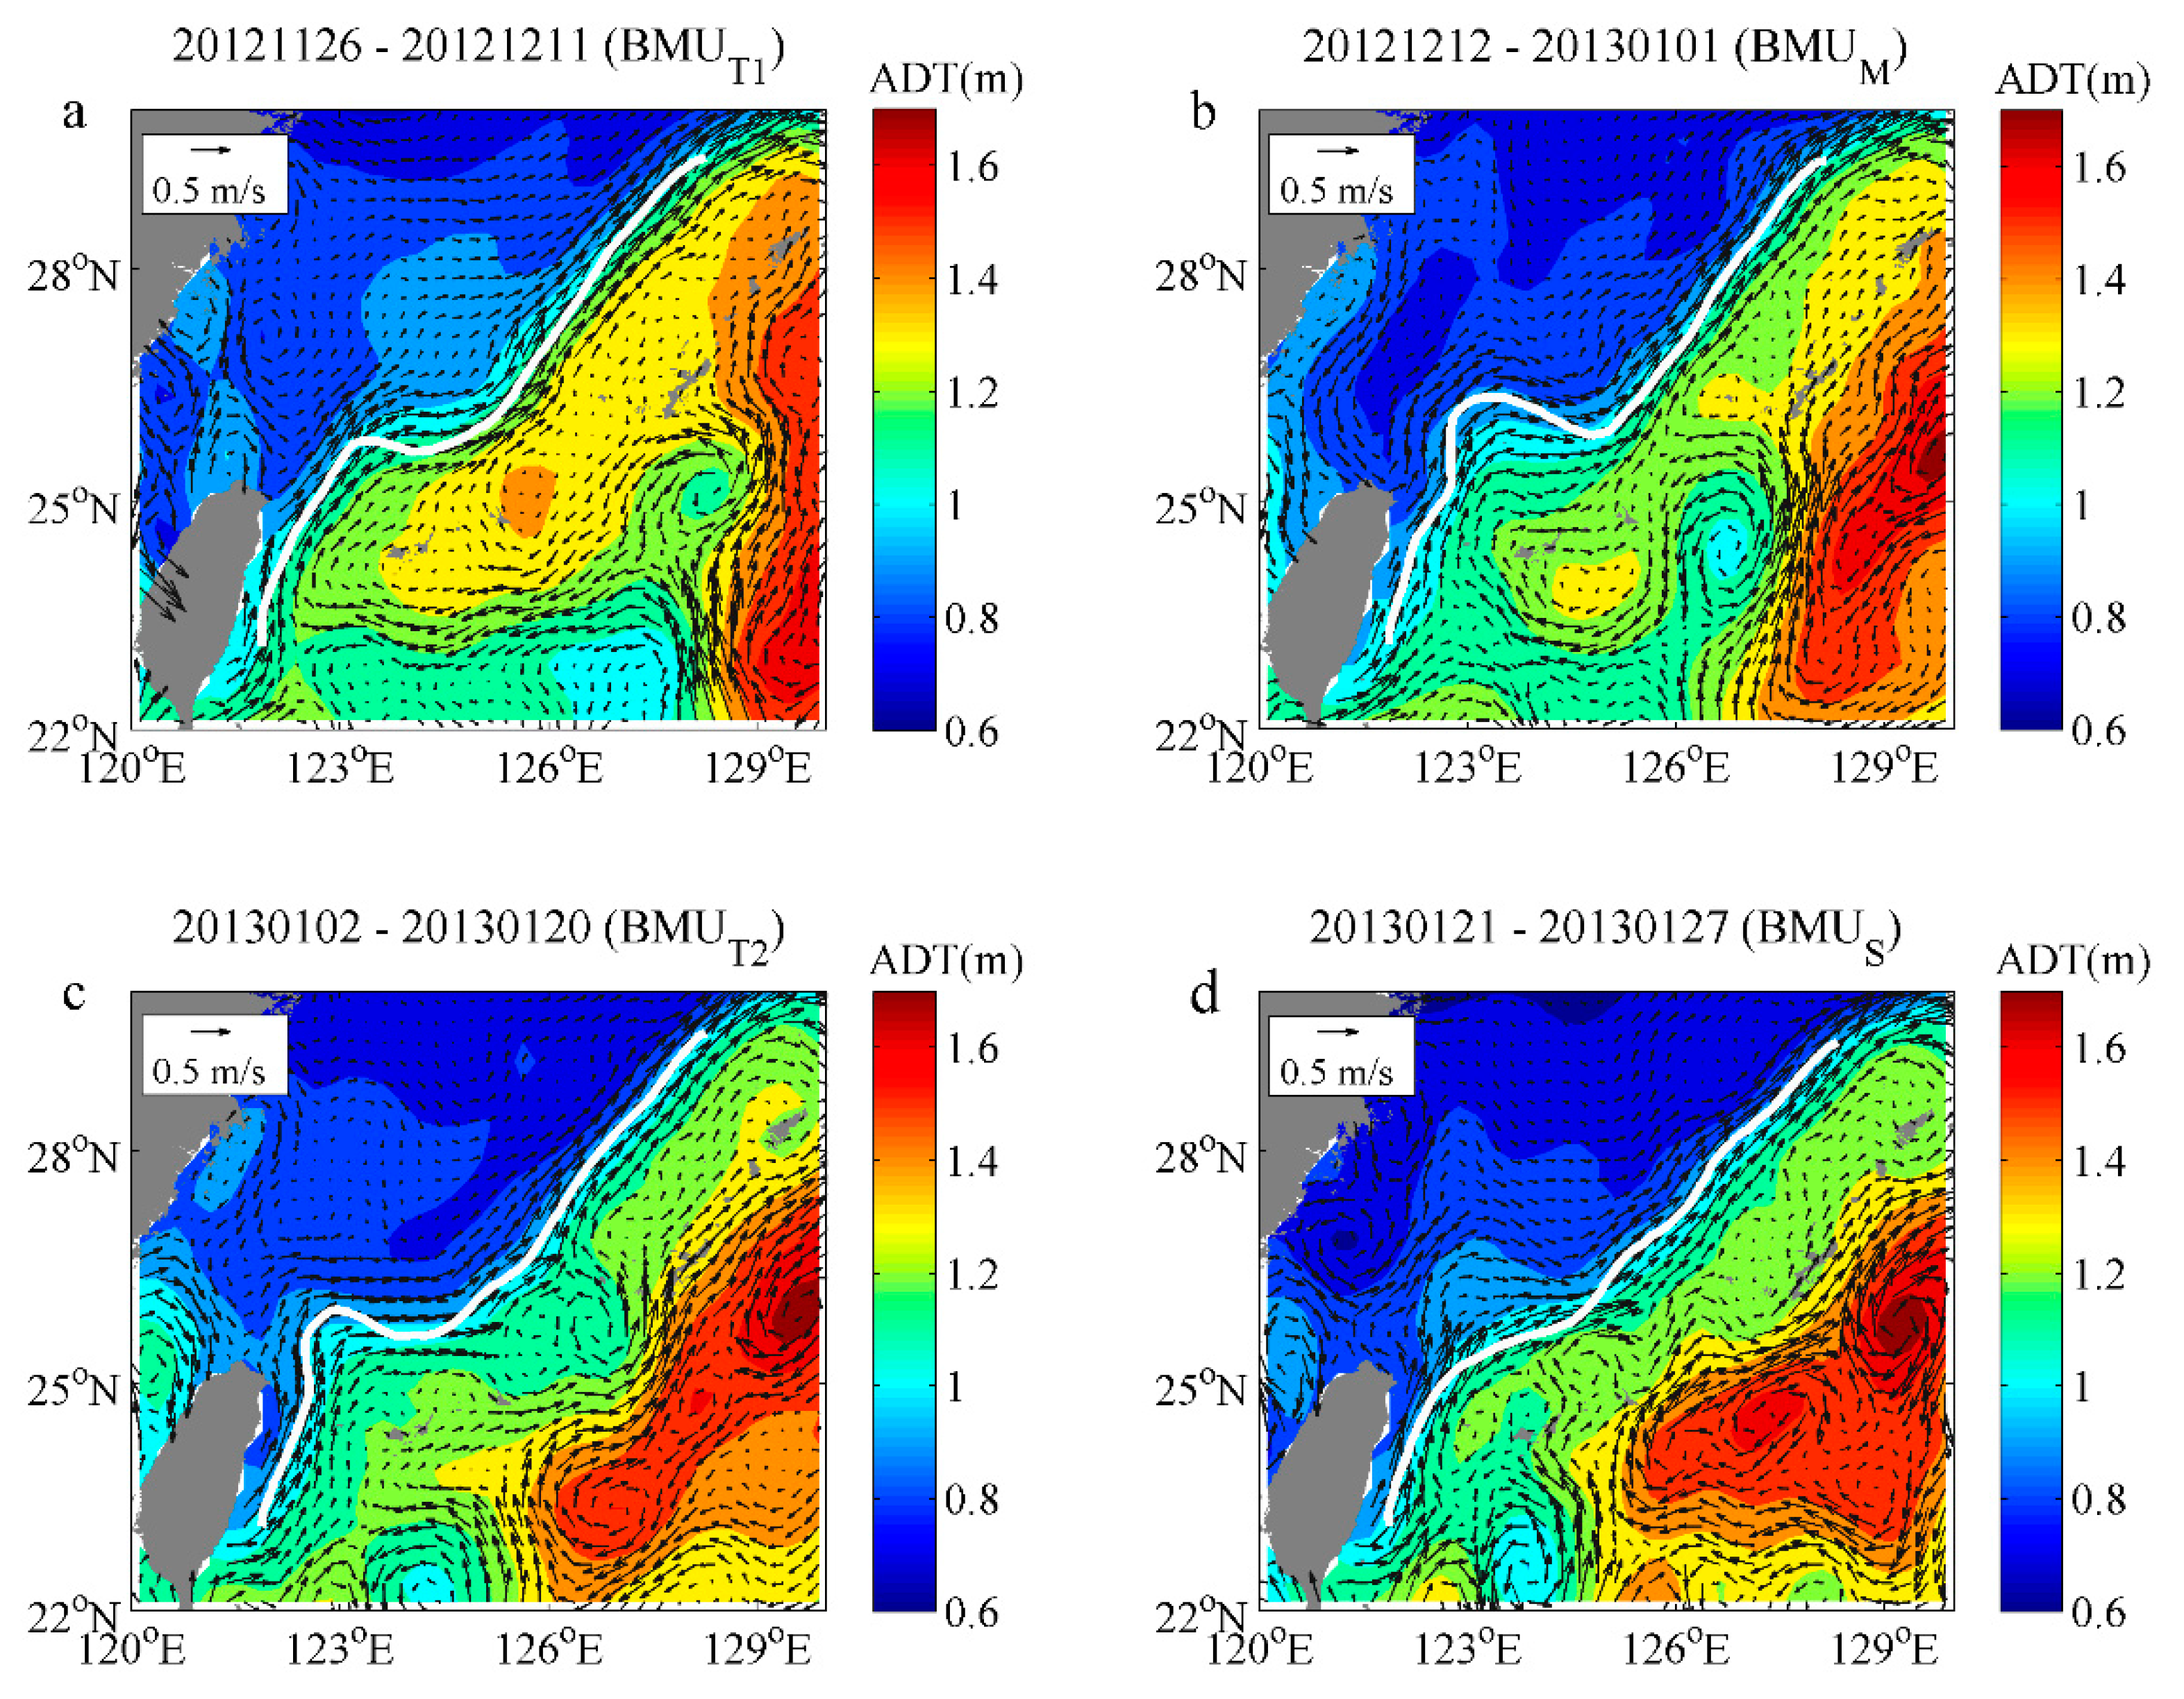
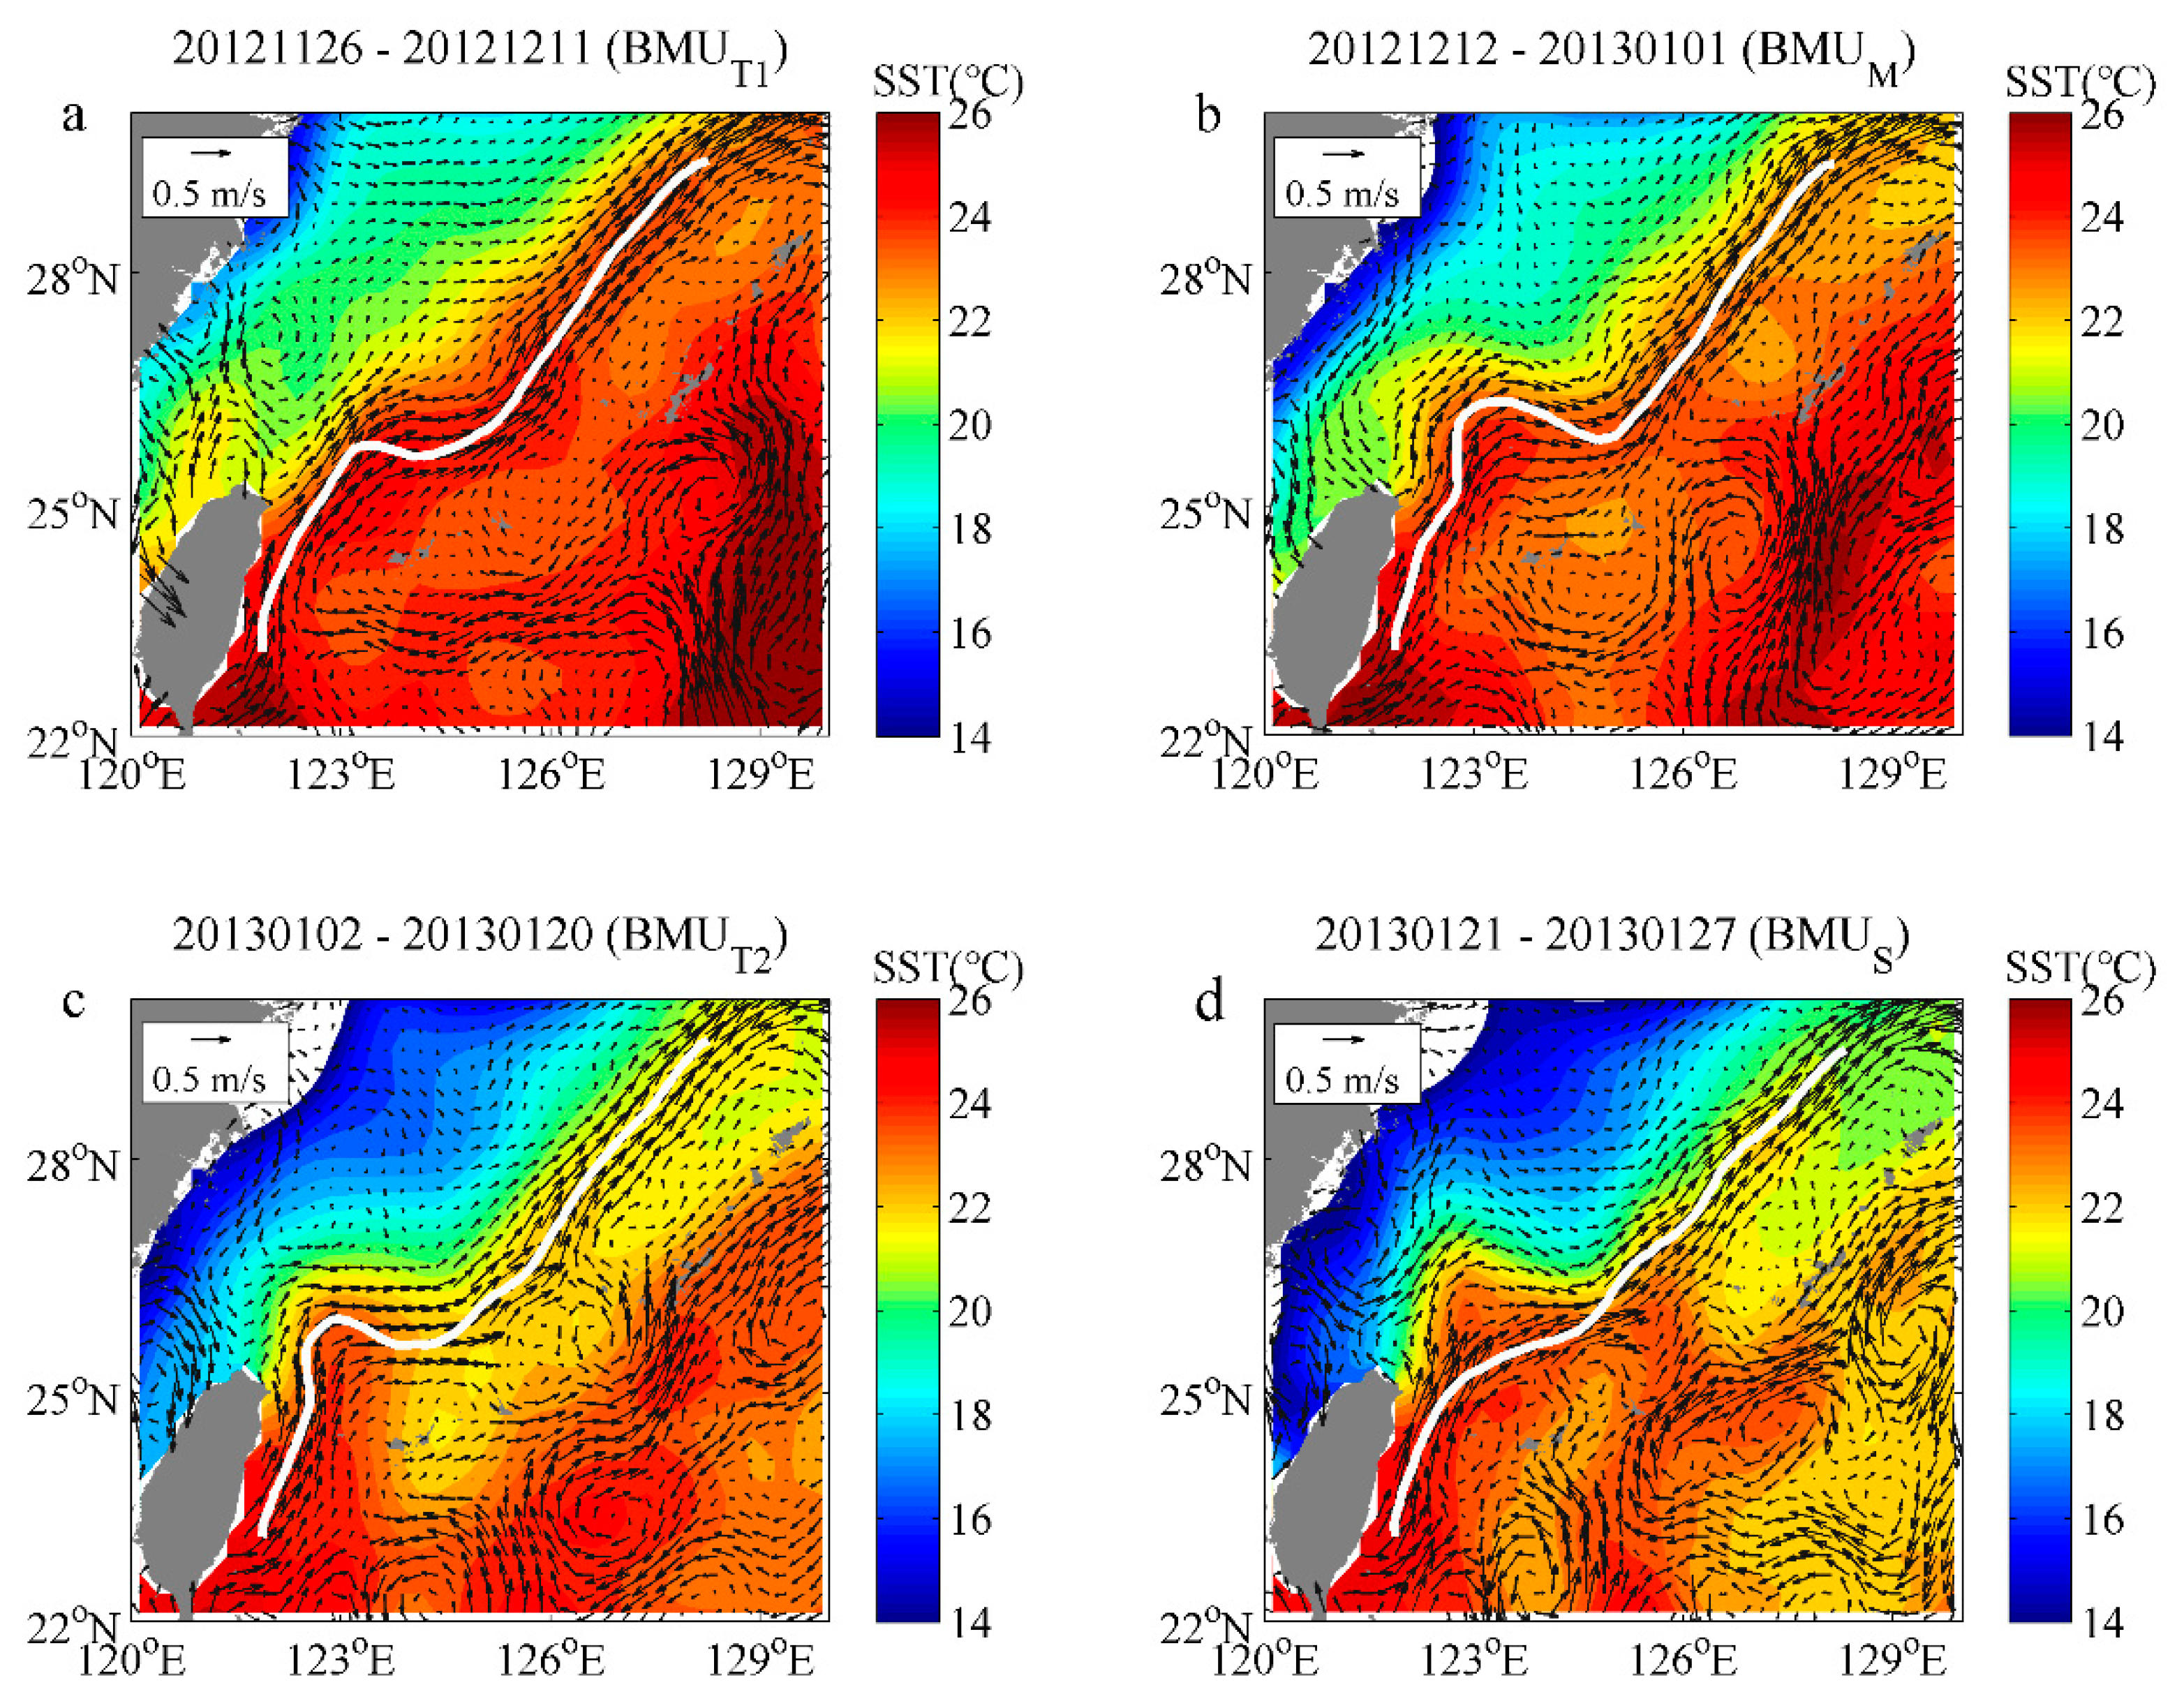
To examine the transient evolution of the four Kuroshio axis patterns, we choose a typical period from November 26, 2012 to January 27, 2013. An important reason for choosing this period is that the four Kuroshio axis BMU patterns occur alternately during a short time (two months). Figure 12 shows the time series of the BMU patterns during the typical period. The period is divided into four stages, in which the patterns of the Kuroshio axis change successively in order of BMUT1 (from November 26 to December 11, 2012) → BMUM (from December 12, 2012 to January 1, 2013) → BMUT2 (from January 2 to January 20, 2013) → BMUS (from January 21 to January 27, 2013). It is worth noting that the evolution order appears only for the typical period and is not common during the whole study period. One of the limitation of the SOM analysis in this study is that it is too hard to make generalization about the transient evolution based on only one single cycle. Therefore, more detailed analysis for the transient evolution needs to be performed in future. The corresponding ADT and geostrophic currents, SLA and geostrophic velocity anomaly, and AVHRR SST are shown in Figure 13, Figure 14 and Figure 15 to analyze the continuous evolution of the Kuroshio intrusion and the variability of the surface axis. The geostrophic currents show circulation structures in good agreement with the SST images (Figure 14). The results suggest that sometimes there are significant anticyclonic intrusions (Figure 13b and Figure 14b) from the KC onto the ECS shelf.
For the first stage of the time interval corresponding to the transient pattern BMUT1, small meander occurs at about 123° E (Figure 13a); however, the Kuroshio axis is generally close to straight-path pattern BMUS, and the intrusion of the surface warm water into the ECS between 25° N and 26° N and between 121.5° E and 122.5° E is not distinct (Figure 14a). From Figure 15a one can see that there is a cyclonic eddy between 26.5° N and 27.5° N and between 121.5° E and 122.5° E, of which the southmost edge is adjacent to the KC, the northeastward current anomalies northeast of Taiwan along the Kuroshio axis indicate that the meander of the Kuroshio axis, or the Kuroshio intrusion, may be strengthened.
For the second stage of the time interval corresponding to meandering-path pattern BMUM, the large meandering state and the corresponding surface geostrophic currents (Figure 13b) indicate that a great volume of Kuroshio warm water enters into the ECS shelf (Figure 14b), meanwhile, an anticyclonic eddy occurs between 25.5° N and 27° N and between 122° E and 123.5° E (Figure 15b).
Next, another transient pattern BMUT2 presents at the third stage of the period. The Kuroshio axis between about 123° E and 125° E starts to migrate southward compared with BMUM (Figure 13c) and becomes close to the axis of straight-path pattern BMUS, implying that the Kuroshio intrusion becomes weaker. The transition of the Kuroshio axis and the geostrophic currents from BMUM to BMUT2 is consistent with the SST images, which indicates that the warm water intrusion (Figure 14b,c) migrates westward. Similarly, the center of the anticyclonic eddy of BMUT2 (Figure 15c) indicates a westward migration, implying the state of the Kuroshio axis change from meandering-path (BMUM) to transient (BMUT2).
The final stage of the time interval corresponds to straight-path pattern BMUS. The Kuroshio axis migrates southward generally compared with other patterns. At this stage, the Kuroshio surface water still intrudes onto the ECS shelf which is shown as a warm water tongue in Figure 14d. Meanwhile, the eddy appearing at the third stage gradually flows northward and away from the main stream of the Kuroshio (Figure 13c,d). It means that the Kuroshio intrusion still occurs in boreal winter when the surface axis corresponds to straight-path pattern. The reason should be that there is the Kuroshio branch current (KBC) on the northeast of Taiwan Island especially in winter. The KBC is referred to as a quasi-steady current [31]. On intra-seasonal time scale, the intrusion events of the Kuroshio are more frequent in winter than in summer [50,51]. Therefore, the straight-path pattern in winter should not entirely correspond to the KC without intrusion or even weak intrusion. Since the extraction method in this study detects the Kuroshio axis based on the local maximum velocity along a subsidiary line, it is hard to reveal the KBC, i.e., the secondary Kuroshio surface axis. However, the ADT, SLA, and SST images (Figure 13, Figure 14 and Figure 15) are able to show them obviously. Further work will be directed toward a more detailed analysis of the Kuroshio surface currents from more remote sensing data and the three-dimensional structure of the Kuroshio from numerical modelling results.

3.4. Impact of Mesoscale Eddies on the Kuroshio Surface Axis Variability

As mentioned in Section 1, the westward propagating open-ocean eddies can affect the variability of the Kuroshio surface axis. Figure 16 shows the monthly mean geostrophic velocity anomaly and the relative vorticity, ζ = v x u y , in January and July, 2009 as an example. The reason why the monthly mean results in 2009 is selected is that the impacts of eddies are relatively obvious. January and July correspond to boreal winter and summer, respectively. The first-order principle of potential vorticity (PV) conservation, which is expressed as P V = f + ζ H = constant , is considered, where f is the Coriolis parameter, H is the water depth. In general, because of the difference of vertical stratification, the PV in the upper layer is larger on the shelf than in the open ocean and decreases gradually offshore, the strong PV gradient is generated across the slope and often blocks most of the Kuroshio water intrusion [20,52]. Over the small geographic region being considered, f changes little. Under the impact of anticyclonic eddies, the monthly mean ζ is negative during January 2009 in the region where the interaction between the eddies and Kuroshio often occurs (black square in Figure 16a), it indicates that the net relative vorticity decreases, then the water depth H must decrease in order to conserve the PV. Therefore, the water moves onshore because the water depth on the ECS shelf is shallower and the Kuroshio surface axis presents BMUM pattern (green line in Figure 16a). In contrast, in July 2009, the monthly mean ζ is positive in the same region because of the cyclonic eddies, then the water moves offshore and the Kuroshio surface axis presents BMUS pattern (Figure 16b). The impacts of the anticyclonic and cyclonic eddies are opposite.
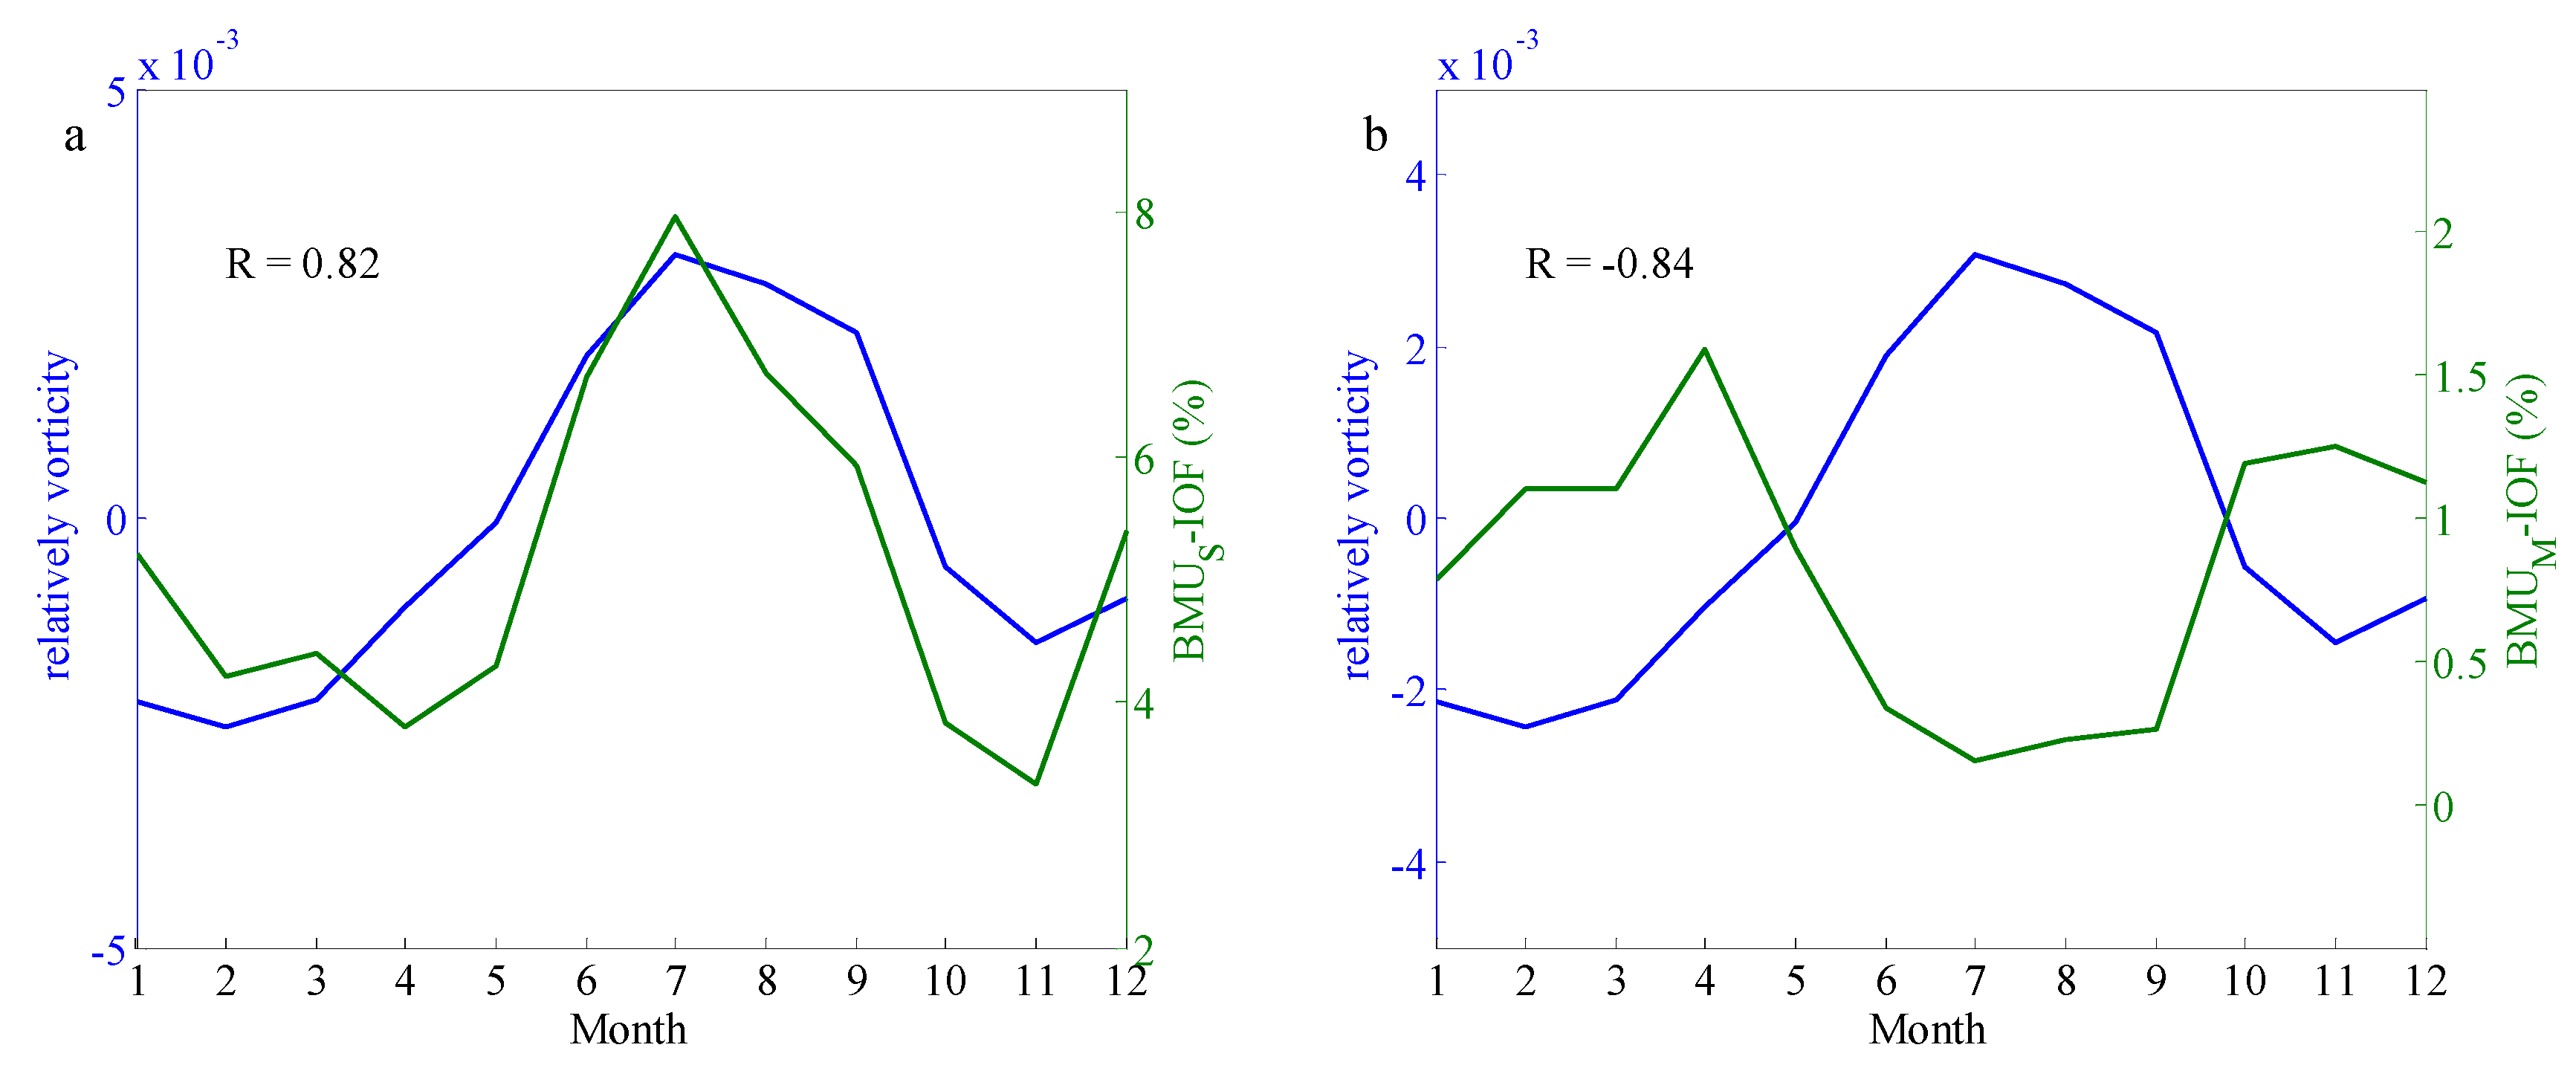
Figure 17 indicate that the multi-year monthly mean ζ in the region shown as the black square in Figure 16 is positively correlated with the monthly IOFs of BMUS and negatively correlated with BMUM. The correlation coefficient between the monthly mean ζ and the IOFs of BMUS is 0.82 during the study period which is from 1993 to 2016, implying that the mean relative vorticity increases in summer months, and the corresponding IOF of BMUS is higher, i.e., the straight-path pattern more likely occurs when the relative vorticity increases especially in summer. In contrast, from Figure 17b one can see that the meandering-path pattern of the Kuroshio axis more likely occurs when the relative vorticity decreases. In conclusion, for the multi-year monthly mean scale, the anticyclonic eddies can carry negative PV flux and promote the Kuroshio axis to present the meandering-path pattern, while the cyclonic eddies can carry positive PV flux and promote the Kuroshio axis to present the straight-path pattern. The results are similar to the analysis of Figure 16 and the dynamical interpretations in [18,19,20].

4. Conclusions

This study examines the variability of the Kuroshio surface axis northeast of Taiwan Island using satellite altimeter data. The 24-year time series of the Kuroshio axis are derived from the AGV data from 1993 to 2016 using the detection method established by [23] with particularly selected parameters, including the length of the subsidiary line, the intervals between two adjacent points, and the distance that the subsidiary line moves downstream once. The results indicate that the Kuroshio mean axis generally moves between 1.0 m and 1.2 m contours of the mean ADT, and large fluctuations on the region northeast of Taiwan Island appear because of the variation of the Kuroshio intrusion into the ECS shelf.
Based on the day-to-day Kuroshio axis detection, the daily distances away from the location of the mean axis along the Transect A are obtained. The EMD method is used to analyze the daily distance series and quantify the variability of the Kuroshio axis. The mean period and the energy of each of the IMFs are calculated using the discrete Hilbert transform. The results indicate that the intra-seasonal and inter-annual variability of the Kuroshio surface axis with a mean period of about 3.2 months and 1.3 year are the dominant components. To examine the intra-seasonal variation of the surface Kuroshio axis, 24-year mean daily series of IMF4-IMF9 is calculated. The fluctuation of IMF4 is the strongest in winter, followed by spring and autumn. IMF5 and IMF6 correspond to the monthly variations, the variations of the Kuroshio axis between shoreward and seaward are distinct, but the regularity remains non-obvious. IMF7-9 correspond to the intra-seasonal variations, the intra-seasonal variability of the Kuroshio axis occurs quasi-periodically, and is consistent with the variations of the Kuroshio intrusion. Transects B and C are used to analyze the relationship between the relatively upstream Kuroshio axis east of Taiwan Island and the Kuroshio axis northeast of Taiwan Island. The comparison results indicate that the KC flows closely to Taiwan Island when the Kuroshio intrusion into the ECS shelf occurs.
The SOM analysis identifies four patterns of the Kuroshio axis variation. BMUM and BMUS correspond to meandering-path and straight-path states, while BMUT1 and BMUT2 transition stages. The occurrence percentage of BMUM is only about 1/6 of that of BMUS, implying that the strong deflection of the Kuroshio axis occurs not frequently. The monthly IOFs of BMUS show strong seasonality: higher value in summer, and lower value in spring and autumn. The correlation analysis with the upstream surface current transport along Transect B indicates that the straight-path pattern more likely occurs when the upstream surface transport increases.
To examine the transient evolution of the four Kuroshio axis BMU patterns, the ADT and geostrophic currents, SLA and geostrophic velocity anomaly, and AVHRR SST during the typical period from November 26, 2012 to January 27, 2013 are used. The results indicate that during this period the patterns of the Kuroshio axis change successively in order of BMUT1→BMUM→BMUT2→BMUS, implying that the Kuroshio axis migrates from the meandering-path to the straight-path pattern. Meanwhile, the warm water intrusion and a mesoscale eddy occur at the second stage and migrate northwestward gradually at the last two stages. It should be noted that the evolution order appears only for the typical period and is not common during the whole study period. More detailed analysis to find out generalized characteristics of the transient evolution need further works in future.
The monthly mean relative vorticity is calculated and analyzed to evaluate the impact of the eddies on the Kuroshio surface axis variability, the results show that the anticyclonic eddies can make the Kuroshio water move onto the ECS shelf and promote the Kuroshio surface axis to present the meandering-path pattern because of the PV conservation, while the cyclonic eddies can make the Kuroshio water move offshore and promote the axis to present the straight-path pattern. It is worth noting that the PV conservation equation is the first-order approximation to the PV in the real and stratified ocean, where the baroclinic effect also contributes to the variation of vorticity [33,53]. The mechanistic explanation is simplified in this first-order form. Therefore, more quantitative vorticity analysis and more detailed study for longer period need to be performed in future.

Author Contributions

Data curation, Z.Z., G.Y., and T.Z.; formal analysis, Y.Y.; funding acquisition, Y.Y.; methodology, Z.Z. and X.Z. (Xinhua Zhao); validation, X.Z. (Xi Zhang); writing—original draft, Z.Z.; writing—review and editing, Q.Z. and L.C. All authors provided substantial input to the interpretation of the results. All authors have read and agreed to the published version of the manuscript.

Funding

This research was funded by National Science and Technology Major Project of the Ministry of Science and Technology of China, grant number 2018YFF01014100; Laboratory for Regional Oceanography and Numerical Modeling, Pilot National Laboratory for Marine Science and Technology (Qingdao), grant number 2019A06; NSFC-Shandong Joint Fund for Marine Science Research Centers, grant number U1606405; National Programme on Global Change and Air-Sea Interaction, grant number GASI-IPOVAI-01-05.

Acknowledgments

We thank the CMEMS and NCEI of NOAA for providing the satellite data used in this study.

Conflicts of Interest

The authors declare no conflict of interest.

Appendix A

The purpose of PCA is to reduce the large dimensionality of the data space to the smaller intrinsic dimensionality of feature space, which is also called eigenspace. The eigenspace is calculated by identifying the eigenvectors of the covariance matrix derived from the original data vectors [49]. The eigenvectors associated with the large eigenvalues are called the principal components (PCs) that reflects the great variance. In this study, the eigenvalues decrease in exponential phase roughly, implying that the most (more than 90%) of the total variance is contained in the first two dimensions. The contribution rate of the first two eigenvectors, which can be expressed as Ω i = λ i / j = 1 N λ j , where λi is the i-th eigenvalues, is 97.6%, so the projection on the first two PCs is able to represent the original Kuroshio axis detection results roughly by treating the first two eigenvectors as a basis set. Figure 10 shows the projected Kuroshio axis detection results (data vectors, denoted as di in Section 2.2.3) and the winning neurons (denoted as Ck in Section 2.2.3) on the first two PCs, the detection results are divided into four groups by different colors. From Figure A1 one can see that the most of the detection results and the winning neurons for BMUT1 (BMUT2) are closer to BMUS (BMUM), which is similar to the mean axes for the four BMU patterns shown in Figure 8. The data density for BMUS is larger than other three BMU patterns obviously, implying the large IOF of BMUS. It is worth noting that some projected results on the first two PCs are disorganized and far away from the corresponding winning neurons, the reason may be that there is still a little error created by projecting the results only on the first two PCs and clustering the results using SOM method, therefore the SOM analysis and PCA for the Kuroshio axis detection results should be improved further in future work.
Figure A1. The detected Kuroshio surface axis results from 1993 to 2016 and winning neurons projection on the first two principal components.
Remotesensing 12 01059 g0a1

References

  1. Qiu, B. Kuroshio and Oyashio currents. In Encyclopedia of Ocean Sciences; Steele, J.H., Turekian, K.K., Thorpe, S.A., Eds.; Academic Press: New York, NY, USA, 2001; Volume 6, pp. 1413–1425. [Google Scholar]
  2. Su, J.; Pan, Y. On the shelf circulation north of Taiwan. Acta Oceanol. Sin. 1987, 6, 1–20. [Google Scholar]
  3. Tang, T.Y.; Tai, J.H.; Yang, Y.J. The flow pattern north of Taiwan and the migration of the Kuroshio. Cont. Shelf Res. 2000, 20, 349–371. [Google Scholar] [CrossRef]
  4. Isobe, A. Recent advances in ocean-circulation research on the Yellow Sea and East China Sea shelves. J. Oceanogr. 2008, 64, 569–584. [Google Scholar] [CrossRef]
  5. Sun, X.P.; Su, Y.F. On the variation of Kuroshio in East China Sea. In Oceanology of China Seas; Zhou, D., Liang, Y., Zeng, C., Eds.; Kluwer Academic: Dordrecht, The Netherlands, 1994; Volume 1, pp. 49–58. [Google Scholar]
  6. Hu, X.; Xiong, X.; Qiao, F.; Guo, B.; Lin, X. Surface current field and seasonal variability in the Kuroshio and adjacent regions derived from satellite-tracked drifter data. Acta Oceanol. Sin. 2008, 3, 11–29. [Google Scholar]
  7. Qiu, B.; Imasato, N. A numerical study on the formation of the Kuroshio Counter Current and the Kuroshio Branch Current in the East China Sea. Cont. Shelf Res. 1990, 10, 165–184. [Google Scholar] [CrossRef]
  8. Tang, T.Y.; Hsueh, Y.; Yang, Y.J.; Ma, J.C. Continental slope flow northeast of Taiwan. J. Phys. Oceanogr. 1999, 29, 1353–1362. [Google Scholar] [CrossRef]
  9. Liu, Z.; Gan, J. Variability of the Kuroshio in the East China Sea derived from satellite altimetry data. Deep Sea Res. Part I 2012, 59, 25–36. [Google Scholar] [CrossRef]
  10. Zhou, P.; Song, X.; Yuan, Y.; Wang, W.; Yu, Z. Intrusion pattern of the Kuroshio Subsurface Water onto the East China Sea continental shelf traced by dissolved inorganic iodine species during the spring and autumn of 2014. Mar. Chem. 2017, 196, 24–34. [Google Scholar] [CrossRef]
  11. Nitani, H. Beginning of the Kuroshio. In Kuroshio, Physical Aspects of the Japan Current; Stommel, H., Yoshida, K., Eds.; University of Washington Press: Seattle, WA, USA, 1972; pp. 129–163. [Google Scholar]
  12. Teague, W.J.; Jacobs, G.A.; Ko, D.S.; Tang, T.Y.; Chang, K.I.; Suk, M.S. Connectivity of the Taiwan, Cheju, and Korea Straits. Cont. Shelf Res. 2003, 13, 63–77. [Google Scholar] [CrossRef]
  13. Lee, J.S.; Matsuno, T. Intrusion of Kuroshio water onto the continental shelf of the East China Sea. J. Oceanogr. 2007, 63, 309–325. [Google Scholar] [CrossRef]
  14. Chang, Y.L.; Oey, L.Y. Interannual and seasonal variations of Kuroshio transport east of Taiwan inferred from 29 years of tidegauge data. Geophys. Res. Lett. 2011, 38, L08603. [Google Scholar] [CrossRef]
  15. Soeyanto, E.X.; Guo, J.; Miyazawa, Y. Interannual variations of Kuroshio transport in the East China Sea and its relation to the Pacific Decadal Oscillation and mesoscale eddies. J. Geophys. Res. Ocean. 2014, 119, 3595–3616. [Google Scholar] [CrossRef]
  16. Delman, A.S.; McClean, J.L.; Sprintall, J.; Talley, L.D.; Yulaeva, E.; Jayne, S.R. Effects of eddy vorticity forcing on the mean state of the Kuroshio Extension. J. Phys. Oceanogr. 2015, 45, 1356–1375. [Google Scholar] [CrossRef]
  17. Ichikawa, K.; Tokeshi, R.; Kashima, M.; Sato, K.; Matsuoka, T.; Kojima, S.; Fujii, S. Kuroshio variations in the upstream region as seen by HF radar and satellite altimetry data. Int. J. Remote Sens. 2008, 29, 6417–6426. [Google Scholar] [CrossRef]
  18. Gawarkiewicz, G.; Jan, S.; Lermusiaux, P.F.; McClean, J.L.; Centurioni, L.; Taylor, K.; Sanford, T. Circulation and intrusions northeast of Taiwan: Chasing and predicting uncertainty in the cold dome. Oceanography 2011, 24, 110–121. [Google Scholar] [CrossRef]
  19. Velez-Belchi, P.; Centurioni, L.R.; Lee, D.-K.; Jan, S.; Niiler, P.P. Eddy induced Kuroshio intrusions onto the continental shelf of the East China Sea. J. Mar. Res. 2013, 71, 83–107. [Google Scholar] [CrossRef]
  20. Yin, Y.; Lin, X.; He, R.; Hou, Y. Impact of mesoscale eddies on Kuroshio intrusion variability northeast of Taiwan. J. Geophys. Res. Ocean. 2017, 122, 3021–3040. [Google Scholar] [CrossRef]
  21. Arbic, B.K.; Scott, R.B.; Chelton, D.B.; Richman, J.G.; Shriver, J.F. Effects of stencil width on surface ocean geostrophic velocity and vorticity estimation from gridded satellite altimeter data. J. Geophys. Res. Ocean. 2012, 117, 1–18. [Google Scholar] [CrossRef] [Green Version]
  22. CNES. SSALTO/DUACS Experimental Product Handbook. 2019. Available online: https://www.aviso.altimetry.fr/en/data/product-information/aviso-user-handbooks.html (accessed on 1 March 2020).
  23. Ambe, D.; Imawaki, S.; Uchida, H.; Ichikawa, K. Estimating the Kuroshio axis south of Japan using combination of satellite altimetry and drifting buoys. J. Oceanogr. 2004, 60, 375–382. [Google Scholar] [CrossRef]
  24. Cheng, K.H.; Lin, C.C.; Hsu, P.C.; Huang, S.J. Reconstruction and analysis of surface velocity from drifters in the Kuroshio region east of Taiwan. J. Mar. Sci. Technol. 2016, 24, 1217–1225. [Google Scholar]
  25. Yang, J.; Zhang, J.; Cui, W.; Zhao, X.; Han, W.; Martinez, B. Validation, analysis of the Chinese HY-2 satellite altimeter data and their applications in the China Sea and its vicinity. In Proceedings of the Dragon 3 Final Results and Dragon 4 Kick-Off Symposium, Wuhan, China, 4–8 July 2016; Volume 739. [Google Scholar]
  26. Huang, N.E.; Shen, Z.; Long, S.R.; Wu, M.C.; Shih, H.H.; Zheng, Q.; Yen, N.C.; Tung, C.C.; Liu, H.H. The empirical mode decomposition and the Hilbert spectrum for nonlinear and non-stationary time series analysis. Proc. R. Soc. Lond. Math. Phys. Sci. 1998, 454, 903–995. [Google Scholar] [CrossRef]
  27. Ho, C.R.; Zheng, Q.; Kuo, N.J.; Tsai, C.H.; Huang, N.E. Observation of the Kuroshio intrusion region in the South China Sea from AVHRR data. Int. J. Remote Sens. 2004, 25, 4583–4591. [Google Scholar] [CrossRef]
  28. Zhang, W.; Zhuang, X.; Chen, C.A.; Huang, T. The impact of Kuroshio water on the source water of the southeastern Taiwan Strait: Numerical results. Acta Oceanol. Sin. 2015, 34, 23–34. [Google Scholar] [CrossRef]
  29. Wu, C.R.; Wang, Y.L.; Lin, Y.F.; Chiang, T.L.; Wu, C.C. Weakening of the Kuroshio intrusion into the South China Sea under the global warming hiatus. IEEE J. STARS 2016, 9, 5064–5070. [Google Scholar] [CrossRef]
  30. Kohonen, T. Self-organized formation of topologically correct feature maps. Biol. Cybern. 1982, 43, 59–69. [Google Scholar] [CrossRef]
  31. Yin, Y.; Lin, X.; Li, Y.; Zeng, X. Seasonal variability of Kuroshio intrusion northeast of Taiwan Island as revealed by self-organizing map. Chin. J. Oceanol. Limnol. 2014, 32, 1435–1442. [Google Scholar] [CrossRef]
  32. Liu, Y.; Weisberg, R.H.; Yuan, Y. Patterns of upper layer circulation variability in the South China Sea from satellite altimetry using the self-organizing map. Acta Oceanol. Sin. 2008, 27, 129–144. [Google Scholar]
  33. Zeng, X.; He, R. Gulf Stream variability and a triggering mechanism of its large meander in the South Atlantic Bight. J. Geophys. Res. Ocean. 2016, 121, 8021–8038. [Google Scholar] [CrossRef]
  34. Jin, B.; Wang, G.; Liu, Y.; Zhang, R. Interaction between the East China Sea Kuroshio and the Ryukyu Current as revealed by the self-organizing map. J. Geophys. Res. Ocean. 2010, 115, 1–7. [Google Scholar] [CrossRef] [Green Version]
  35. Tsui, I.F.; Wu, C.R. Variability analysis of Kuroshio intrusion through Luzon Strait using growing hierarchical self-organizing map. Ocean Dyn. 2012, 62, 1187–1194. [Google Scholar] [CrossRef]
  36. Beale, M.H.; Hagan, M.T.; Demuth, H.B. Neural Network Toolbox™ User’s Guide; The MathWorks Inc.: Natick, MA, USA, 2010; pp. 267–310. [Google Scholar]
  37. Vesanto, J.; Alhoniemi, E. Clustering of the self-organizing map. IEEE Trans. Neural Netw. 2000, 11, 586–600. [Google Scholar] [CrossRef] [PubMed]
  38. Liu, Y.; Weisberg, R.H.; Mooers, C.N.K. Performance evaluation of the self-organizing map for feature extraction. J. Geophys. Res. 2006, 111, C05018. [Google Scholar] [CrossRef]
  39. Daqrouq, K.; Al-Qawasmi, A.; Daoud, O.; Al-Sawalmeh, W. Self-organizing map weights and wavelet packet entropy for speaker verification. Int. J. Circ. Syst. Signal Process. 2012, 6, 12–20. [Google Scholar]
  40. Zhu, C. Unified entropy in self-organizing feature maps neural network. In Proceedings of the 2017 2nd International Symposium on Advances in Electrical, Electronics and Computer Engineering (ISAEECE 2017), Shanghai, China, 25–26 March 2017; Volume 124. [Google Scholar]
  41. Chamundeswari, G.; Varma, G.P.S.; Satyanarayana, C. An edge based clustering technique with self-organizing maps. Inf. Technol. Comput. Sci. 2018, 5, 30–39. [Google Scholar] [CrossRef]
  42. Alikhani, M.; Nedaie, A.; Ahmadvand, A. Presentation of clustering-classification heuristic method for improvement accuracy in classification of severity of road accidents in Iran. Saf. Sci. 2013, 60, 142–150. [Google Scholar] [CrossRef]
  43. Kalteh, A.M.; Hjorth, P.; Berndtsson, R. Review of the self-organizing map (SOM) approach in water resources: Analysis, modelling and application. Environ. Modell. Softw. 2008, 23, 835–845. [Google Scholar] [CrossRef]
  44. Matić, F.; Kalinić, H.; Vilibić, I. Interpreting self-organizing map errors in the classification of ocean patterns. Comput. Geosci. 2018, 119, 9–17. [Google Scholar] [CrossRef]
  45. Guan, B. Variability of Kuroshio in the East China Sea. Oceanol. Limnol. Sin. 1979, 10, 297–306. [Google Scholar]
  46. Hsueh, Y.; Wang, J.; Chern, C.S. The intrusion of the Kuroshio across the continental shelf northeast of Taiwan. J. Geophys. Res. Ocean. 1992, 97, 14323–14330. [Google Scholar] [CrossRef]
  47. De Bodt, E.; Cottrell, M.; Verleysen, M. Statistical tools to assess the reliability of Self-Organizing Maps. Neural Netw. 2002, 15, 967–978. [Google Scholar] [CrossRef] [Green Version]
  48. Wold, S.; Esbensen, K.; Geladi, P. Principal component analysis. Chemom. Intell. Lab. Syst. 1987, 2, 37–52. [Google Scholar] [CrossRef]
  49. Kim, K. Face recognition using principle component analysis. In Proceedings of the International Conference on Computer Vision and Pattern Recognition, San Francisco, CA, USA, 25–29 August 1996; Volume 586. [Google Scholar]
  50. Oey, L.Y.; Hsin, Y.C.; Wu, C.R. Why does the Kuroshio northeast of Taiwan shift shelfward in winter? Ocean Dyn. 2010, 60, 413–426. [Google Scholar] [CrossRef]
  51. Wu, C.R.; Hsin, Y.C.; Chiang, T.L.; Lin, Y.F.; Tsui, I.F. Seasonal and interannual changes of the Kuroshio intrusion onto the East China Sea Shelf. J. Geophys. Res. Ocean. 2014, 119, 5039–5051. [Google Scholar] [CrossRef]
  52. Liang, X.S.; Su, J.L. A two-layer model for the circulation in the East China Sea. Acta Oceanol. Sin. 1994, 13, 45–72. [Google Scholar]
  53. Vallis, G.K. Atmospheric and Oceanic Fluid Dynamics: Fundamentals and Large-Scale Circulation; Cambridge University Press: Cambridge, UK, 2006; pp. 178–188. [Google Scholar]
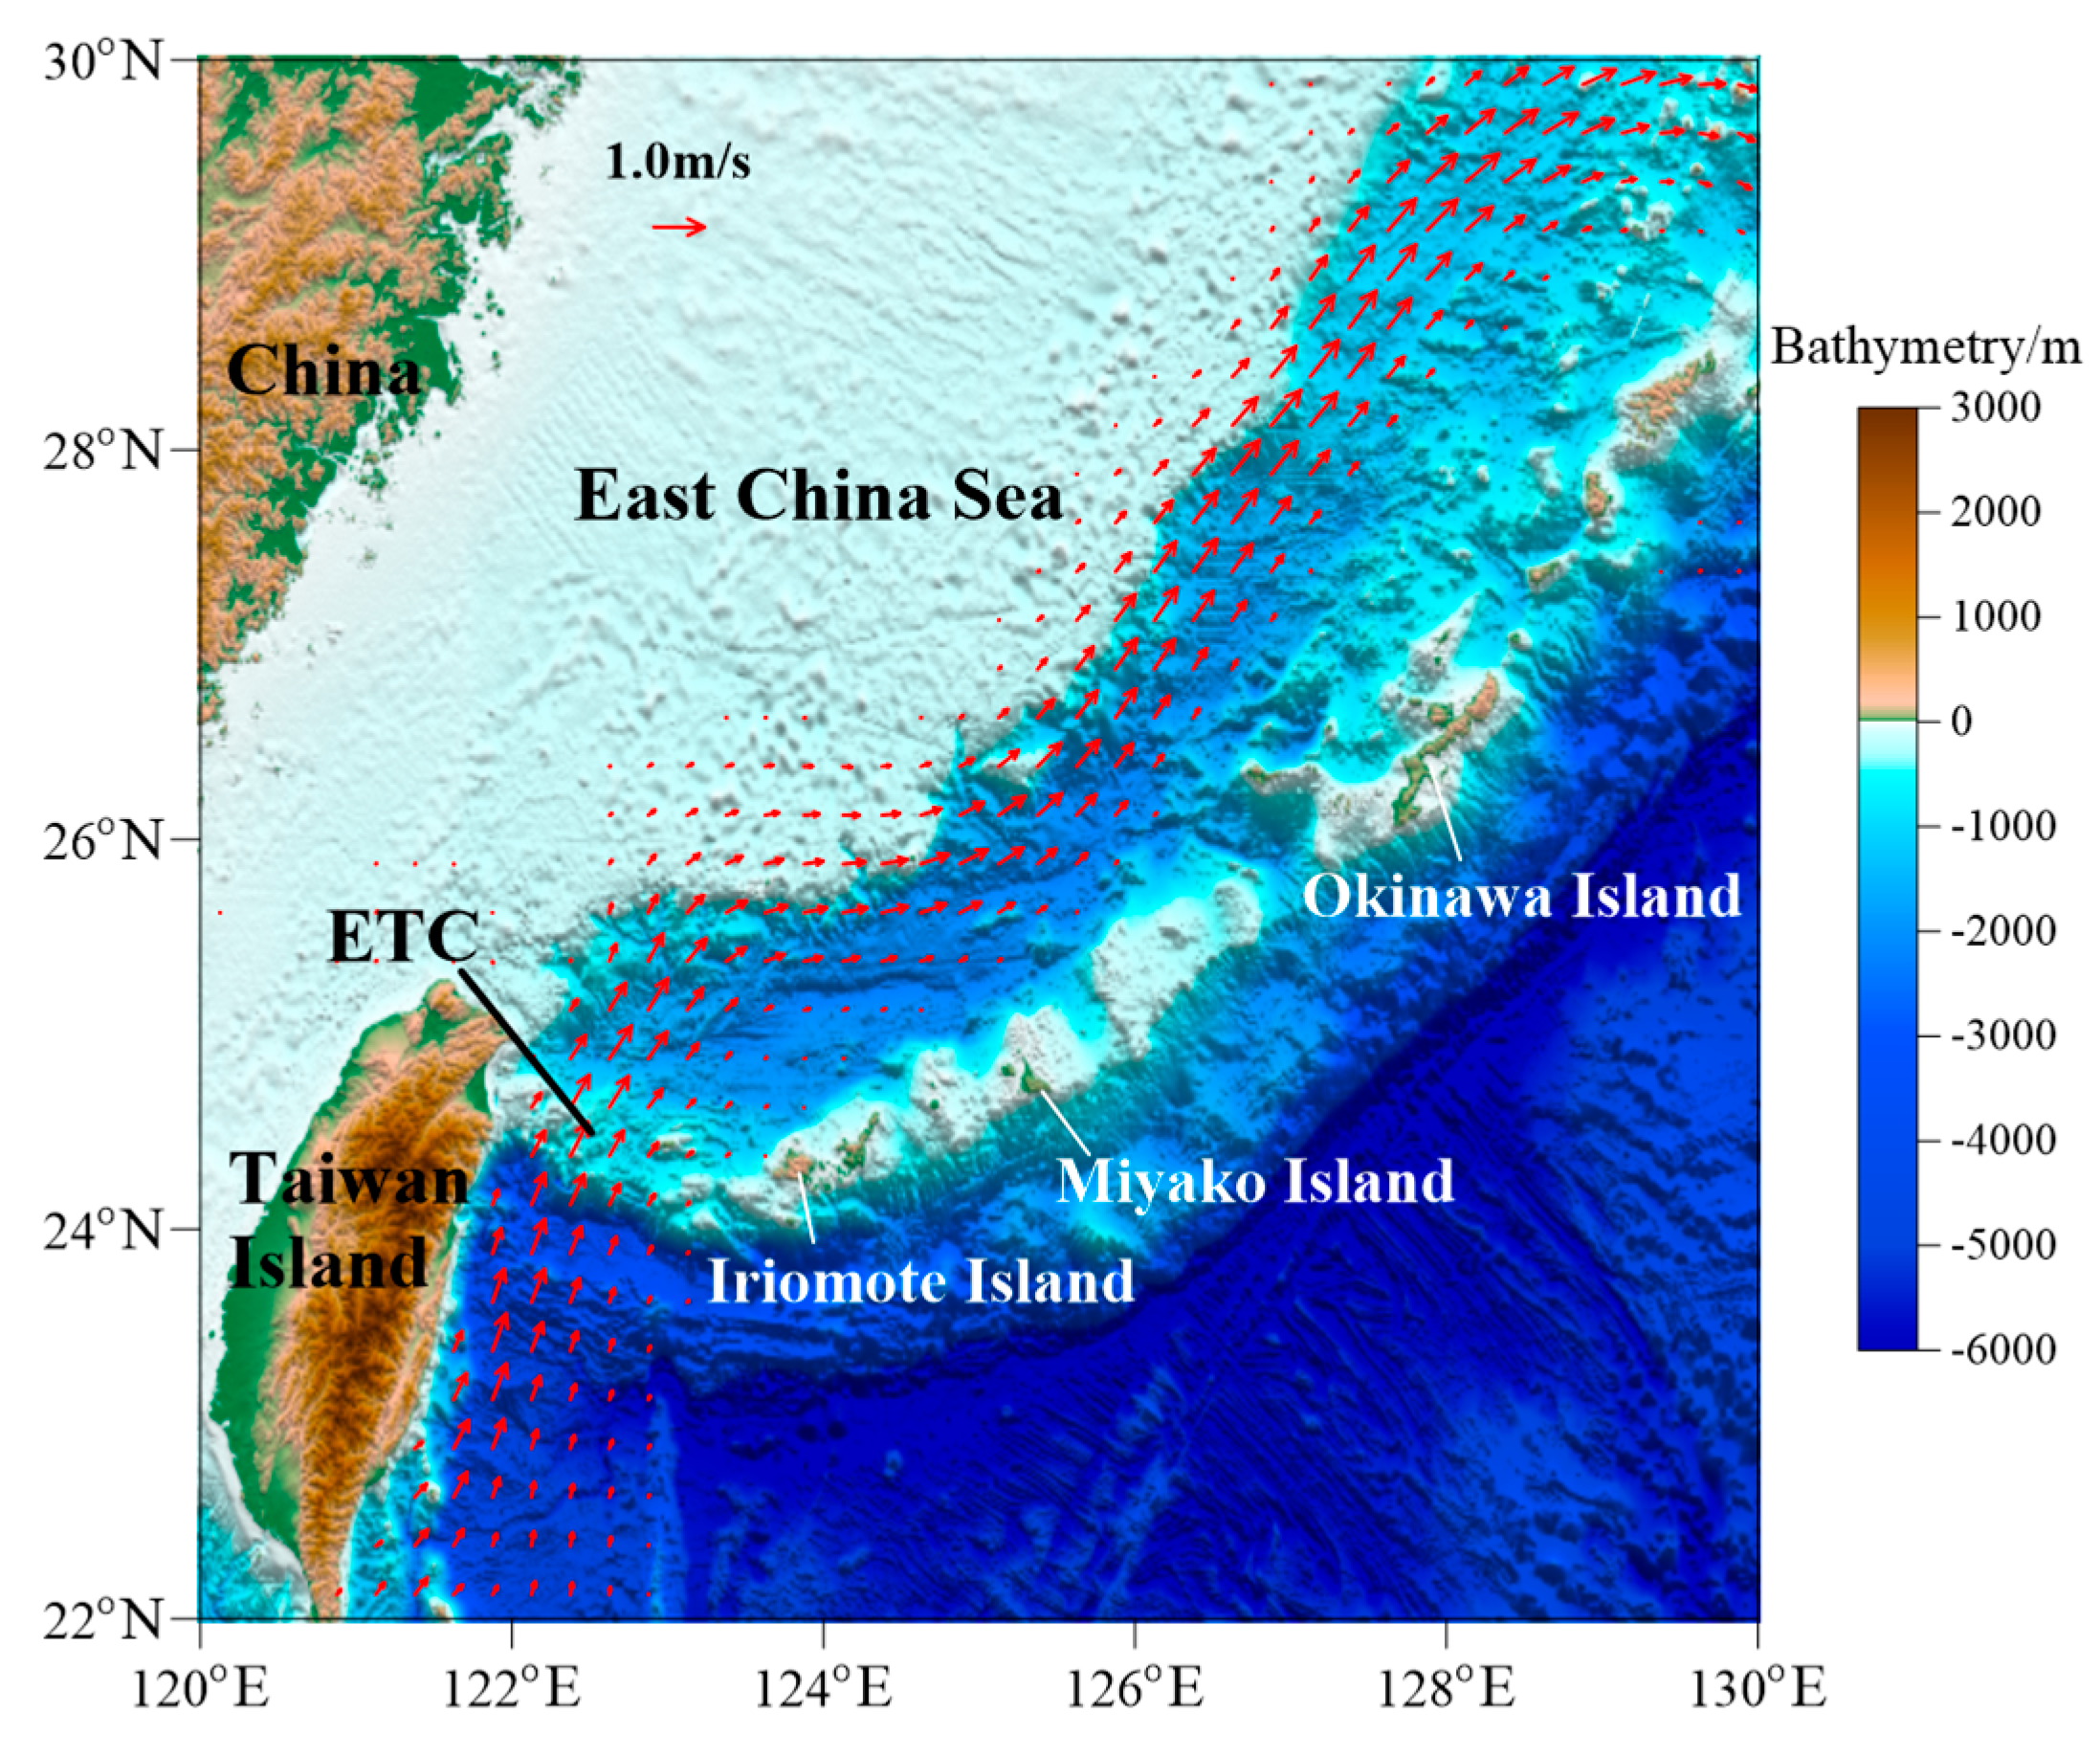
Figure 1. Topographic map (unit: m) in the East China Sea (ECS) with climatological geostrophic current vectors (value > 0.15 m/s; red arrows), which are derived from the multi-year averaged altimeter data from 1993 to 2016, superimposed.
Remotesensing 12 01059 g001
Figure 2. Schematic diagram showing the method how to detect the Kuroshio axis by tracking the maximum speed of the surface velocity. V0 denote the local maximum velocity, Δr is the distance between two adjacent subsidiary line (before the new subsidiary line being adjusted), l is the length of the subsidiary line, Δl is the interval between two adjacent points.
Remotesensing 12 01059 g002
Figure 3. Long-term (1993-2016) mean ADT (color-filled contours) overlaid with Kuroshio mean axis (solid black curve), standard deviation (STD, dashed blue curves), envelopes (dashed cyan curves), 90 percentile (dashed green curve), and 10 percentile (dashed purple curve). Transect A (solid green line perpendicular to the Kuroshio mean axis), B, and C (dotted yellow lines in zonal and meridional direction) are used to analyze the variation of the axis location. Gray contours are isobaths of 100, 200, 1000, and 1200 m.
Remotesensing 12 01059 g003
Figure 4. IMF components and the residue (unit: km) obtained from the time series of the distance away from the mean axis location along Transect A using empirical mode decomposition (EMD) method. (a) The time series of the distance and IMF1-IMF6, (b) IMF7-IMF12 and the residue.
Remotesensing 12 01059 g004
Figure 5. (a) Mean frequency (red circles) and amplitude (blue circles) for all IMFs shown in Figure 4. Error bars are the standard deviation. (b) Mean period of the IMFs (blue circles) and the signal energy (red histograms).
Remotesensing 12 01059 g005
Figure 6. 24-year averaged daily series of IMF4-IMF9 along Transect A, with shoreward direction (northwestward) positive (red), seaward (southeastward) negative (blue). The series are divided into four seasons by the green dashed lines: winter (December, January and February), spring (March to May), summer (June to August), and autumn (September to November).
Remotesensing 12 01059 g006
Figure 7. Scatter diagram of the longitudes of the intersections along Transect B versus latitudes of the intersections along Transect C for the long-term day-to-day detection of the Kuroshio axis from 1993 to 2016, Transects B and C are shown in Figure 3, the color codes represent the numbers of intersections, i.e., the data density. Black pentagram corresponds to the mean axis at (25.43°N, 122.59°E). Two black dashed lines are zonal and meridional extension lines. Latitudes along Transect C within the red ellipse represent the Kuroshio intrusion events.
Remotesensing 12 01059 g007
Figure 8. Coefficient variation of intra-class sum of the squared errors (CVSSIntra) with different self-organizing map (SOM) array sizes.
Remotesensing 12 01059 g008
Figure 9. Self-organizing map analysis of the Kuroshio axis northeast of Taiwan Island. BMUS, BMUM, BMUT1, and BMUT2 represent the derived four patterns. The numbers are corresponding index of the occurrence frequency for each pattern. The mean, STD, and envelope axes are indicated by purple, blue, and orange dashed curves, respectively. The color-filled contours indicate the bathymetry.
Remotesensing 12 01059 g009
Figure 10. Temporal evolution of the winning element errors (unit: km) for different best matching units identified from the SOM analysis. The winning element error at every time must correspond to only one best matching unit (BMU) pattern, so it is vacant for the other three BMU patterns (white areas).
Remotesensing 12 01059 g010
Figure 11. (a) Monthly IOFs of the four BMU patterns shown in Figure 8. (b) Comparison of surface current transport along Transect B, TC, and IOFs of BMUS at the monthly scale. Correlation coefficient is 0.78.
Remotesensing 12 01059 g011
Figure 12. The BMU time series from November 26, 2012 to January 27, 2013.
Remotesensing 12 01059 g012
Figure 13. Color filled contours represent ADT in m from November 26, 2012 to January 27, 2013 in the northeast of Taiwan Island. The period is divided into four parts: from November 26 to December 11, 2012 (a), from December 12, 2012 to January 1, 2013 (b), from January 2 to January 20, 2013 (c) from January 21 to January 27, 2013 (d). The vectors represent the geostrophic currents in m/s. White curves denote the Kuroshio surface axis corresponding to the four patterns.
Remotesensing 12 01059 g013
Figure 14. Same as Figure 13, but for AVHRR multi-day mean SST.
Remotesensing 12 01059 g014
Figure 15. Same as Figure 13, but for the SLA and the geostrophic velocity anomaly.
Remotesensing 12 01059 g015
Figure 16. The geostrophic velocity anomaly (vectors) and relative vorticity (color shading) during January (a) and July (b), 2009. Black squares delineates the region where the interaction between the eddies and Kuroshio often occurs on the northeast of Taiwan Island.
Remotesensing 12 01059 g016
Figure 17. Comparisons of the mean relative viscosity in the region shown as the black square in Figure 16 and IOFs of BMUS (a) and BMUM (b) at the monthly scale. Correlation coefficients are 0.82 (a) and −0.84 (b).
Remotesensing 12 01059 g017