Letter

Regional Mapping of Essential Urban Land Use Categories in China: A Segmentation-Based Approach

1
Ministry of Education Key Laboratory for Earth System Modeling, Department of Earth System Science, Tsinghua University, Beijing 100084, China
2
Department of Land, Air and Water Resources, University of California, Davis, CA 95616, USA
3
Tsinghua Urban Institute, Tsinghua University, Beijing 100084, China
4
Center for Healthy Cities, Institute for China Sustainable Urbanization, Tsinghua University, Beijing 100084, China
*
Author to whom correspondence should be addressed.
Remote Sens. 2020, 12(7), 1058; https://doi.org/10.3390/rs12071058
Submission received: 2 March 2020 / Revised: 23 March 2020 / Accepted: 24 March 2020 / Published: 25 March 2020
(This article belongs to the Special Issue Urban Land Use Mapping and Analysis in the Big Data Era)

Abstract

:
Understanding distributions of urban land use is of great importance for urban planning, decision support, and resource allocation. The first mapping results of essential urban land use categories (EULUC) in China for 2018 have been recently released. However, such kind of national maps may not sufficiently meet the growing demand for regional analysis. To address this shortcoming, here we proposed a segmentation-based framework named EULUC-seg to improve the mapping results of EULUC at the city scale. An object-based segmentation approach was first applied to generate the basic mapping units within urban parcels. Multiple features derived from high-resolution remotely sensed and social sensing data were updated and then recalculated within each unit. Random forest was adopted as the machine learning algorithm for classifying urban land use into five Level I classes and twelve Level II classes. Finally, an accuracy assessment was carried out based on a collection of manually interpreted samples. Results showed that our derived map achieved an overall accuracy of 87.58% for Level I, and 73.53% for Level II. The accurate and refined map of EULUC-seg is expected to better support various applications in the future.

Graphical Abstract

1. Introduction

Land use activities reflect human transformation on Earth’s surface. As the top performer among them, urban land use aims at constructing the settlement environment to suit human survival and development, and it has been dramatically changing in recent years due to population increase and urbanization. In this context, accurate, refined, and detailed urban land use data is helpful in grasping the dynamics and scales of existing urban land, predicting trends and changes of future construction areas, and determining the allocation and planning of land resources.
Recently, the concept of a two-level classification system entitled essential urban land use categories (EULUC) has been proposed by Gong et al. [1]. The EULUC criterion divides the urban land into five essential Level I classes and twelve Level II classes. The parcel-based urban land use map, named EULUC-China, was first implemented in 2018 across the entire country of China with the integration of various remotely sensed data, social big data, and the utilization of a machine learning method. This map reveals the differences in urban land use between regions, which can serve as a crucial input data for relevant research in the future.
However, the relatively low accuracy of EULUC data does not meet the demand for regional analysis. This is mainly caused by the inappropriate division of mapping units and low quality of data sources. On the one hand, parcels are the basic spatial units for urban land use mapping. A parcel is defined as a geographically meaningful region with relatively homogeneous socioeconomic functions [2]. The correct division of parcels contributes to the improvement of classification accuracy. In our previous work with EULUC, parcels were delineated by road vectors derived from the OpenStreetMap (OSM) data [1]; however, roads of the OSM data are usually sparse or even absent in some suburbs and rural areas. As a result, parcels based on road vectors are too big for urban land use mapping in those areas and normally have mixed functions (i.e., one road-based parcel could have two or more urban land use types simultaneously). Image segmentation techniques, which aim at grouping pixels into homogeneous objects with consistent visual cues (such as spectrums, textures, and shapes) [3], provide an alternative solution for generating spatial units of urban land use. Many studies have shown that object-based image segmentation approaches can effectively reduce the degree of parcel mixture [4,5,6,7,8]. On the other hand, as shown in the study of EULUC-China, the 1 km Tencent mobile phone locating-request (MPL) data seemed to be too coarse for parcel-based mapping, and the contribution of features obtained from this kind of data was reported to be the lowest [1]. Therefore, higher spatial resolution data is required to solve this problem. Furthermore, additional information such as height, texture, and parcel attributes, which has been proven to be useful in previous studies [8,9,10,11,12,13], should be given further consideration for accurate mapping of regional urban land use.
To address these issues, this study developed a segmentation-based framework entitled EULUC-seg that aims at improving the mapping results of EULUC. To begin with, an object-based segmentation approach, the simple non-iterative clustering (SNIC) algorithm [14], was adopted to segment the remotely sensed image into homogeneous objects. Then, those objects were overlapped with the original road-based parcels to produce new urban parcels. After that, multiple features derived from high-resolution remotely sensed and social sensing data were extracted and calculated within each parcel. Based on those features, a classic machine learning algorithm, random forest (RF) [15], was used to produce the parcel-level map of EULUC-seg in Ningbo, China in 2018. Finally, an accuracy assessment was carried out based on sample parcels collected through visual interpretation.

2. Study Area and Data Sources
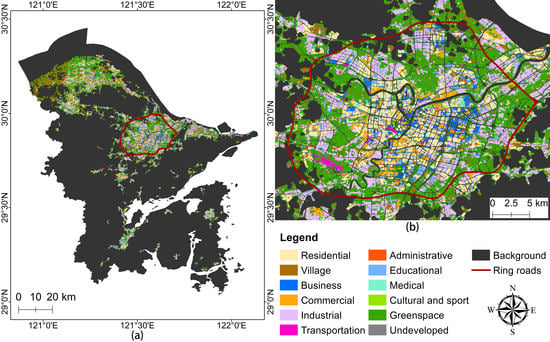
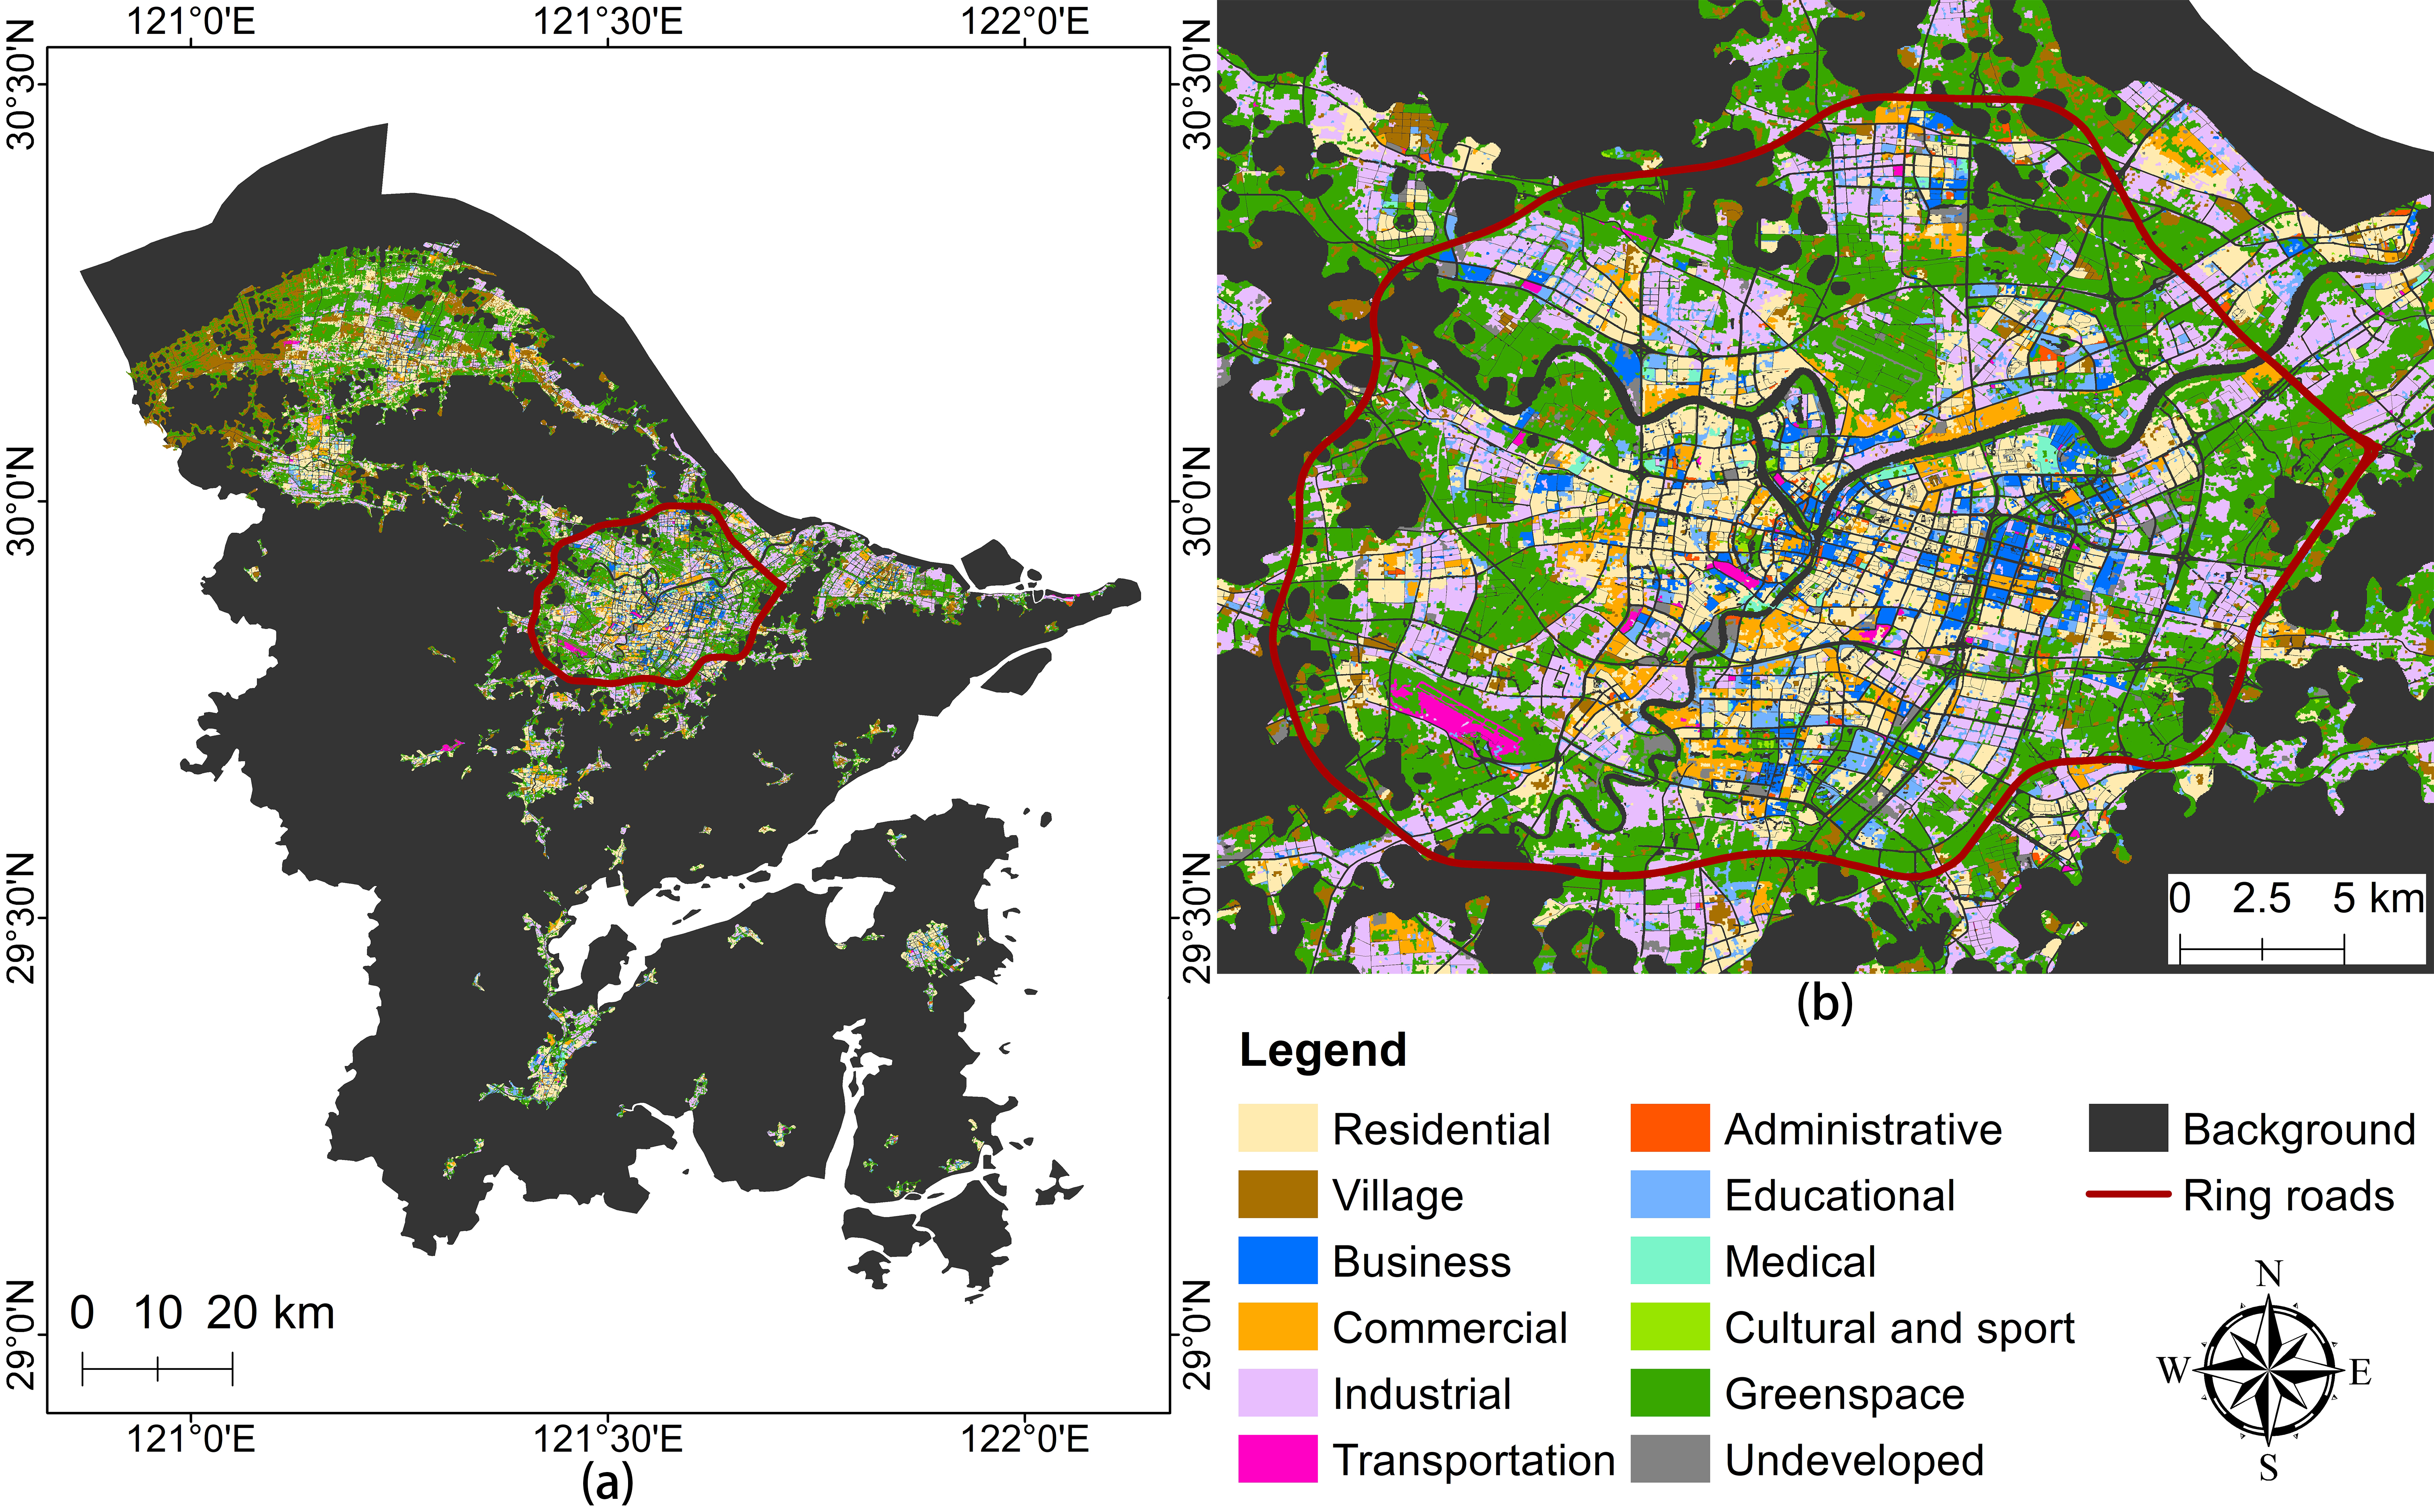
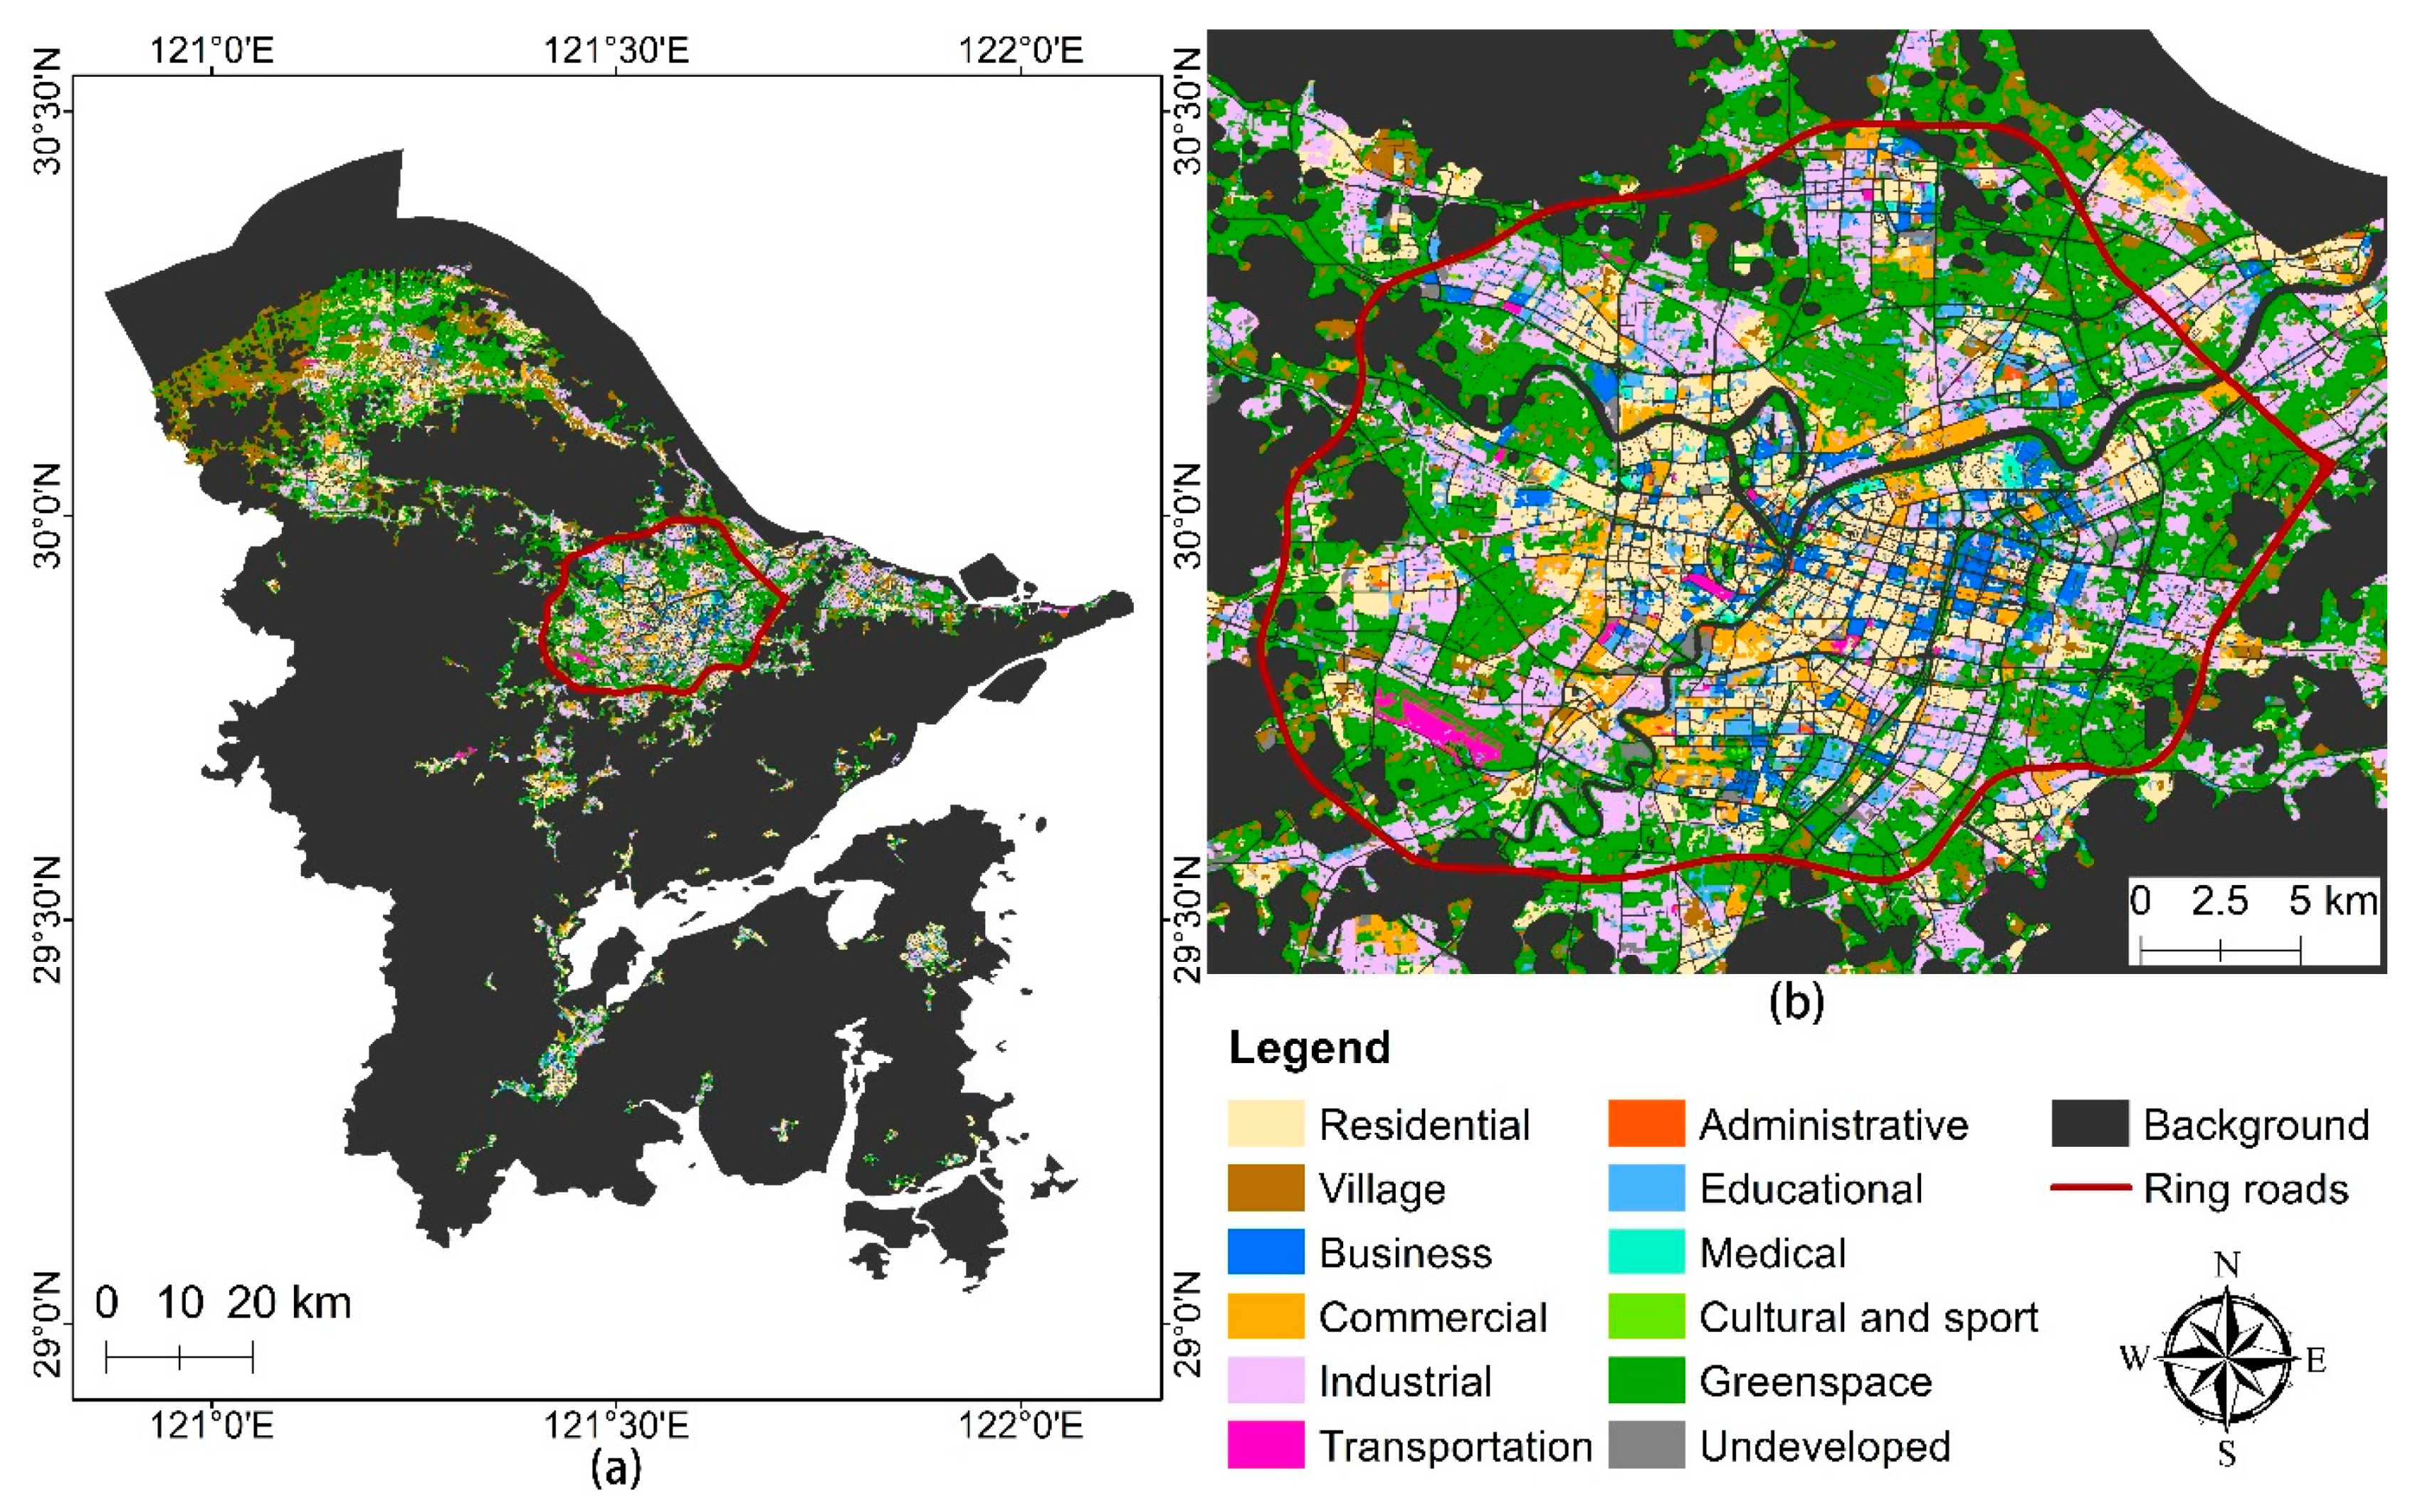
2.1. Study Area

Ningbo, a subprovincial city in the northeast of Zhejiang province, China, was chosen as the study area. Located in the south of the Yangtze River Delta (between 28°51′–30°33′N and 120°55′–122°16′E), Ningbo covers an area of 9816.23 km2 and has a population of around 8.20 million. As an important economic center, industrial base, and foreign trade port in East China, Ningbo has experienced rapid urbanization during the past four decades. According to Gong et al. [16], the artificial impervious areas (including roofs, paved surfaces, hardened grounds, and major road surfaces mainly found in human settlements) reached 1441.27 km2 in Ningbo in 2018, accounting for 14.68% of the city’s total area.

2.2. Data Sources

2.2.1. Sentinel-1 SAR and Sentinel-2 Optical Imagery

The Sentinel-1 synthetic aperture radar (SAR) imagery used in this study contained two dual-band cross-polarization bands of vertical transmit (VV) and horizontal receive (VH). As for the Sentinel-2 optical imagery, the Level-2A product was adopted to acquire the bottom of atmosphere reflectance values [17]. Specifically, the four 10 m spectral bands of blue, red, green, and near-infrared, and two additional layers of normalized difference vegetation index (NDVI) and the normalized difference water index (NDWI) in the Sentinel-2 data were used. Both types of Sentinel data were integrated from January 1 to December 31, 2018 as mean composites, and were freely downloaded from the Google Earth Engine platform (https://earthengine.google.com/).

2.2.2. Baidu Points of Interest (POIs)

The Baidu POI data in 2018 were acquired via the application programming interface (API) provided by Baidu Maps (http://map.baidu.com/), one of the most popular web mapping services in China. Each POI record consisted of a series of information including name, location coordinates, and urban function. All POIs were originally classified into 19 categories. We further filtered the original POIs by excluding those irrelevant points, and reclassified them into nine general categories including residential, business, commercial, industrial, transportation, administrative, educational, medical, and sport and culture. After cleaning and selecting, a total of 707,297 Baidu POIs were obtained within the study area.

2.2.3. Luojia-1 Nighttime Lights

The data of Luojia-1 nighttime lights (NTLs) in Ningbo, 2018 was downloaded from the website of http://59.175.109.173:8888/app/login_en.html. NTLs, recorded by satellite sensors from outer space, detect lights present at night on the earth’s surface. Given this unique night photoelectric zooming capacity, NTL data is invaluable for monitoring, characterizing, and understanding human activity. The data has a spatial resolution of around 130 m.

2.2.4. WorldPop Data
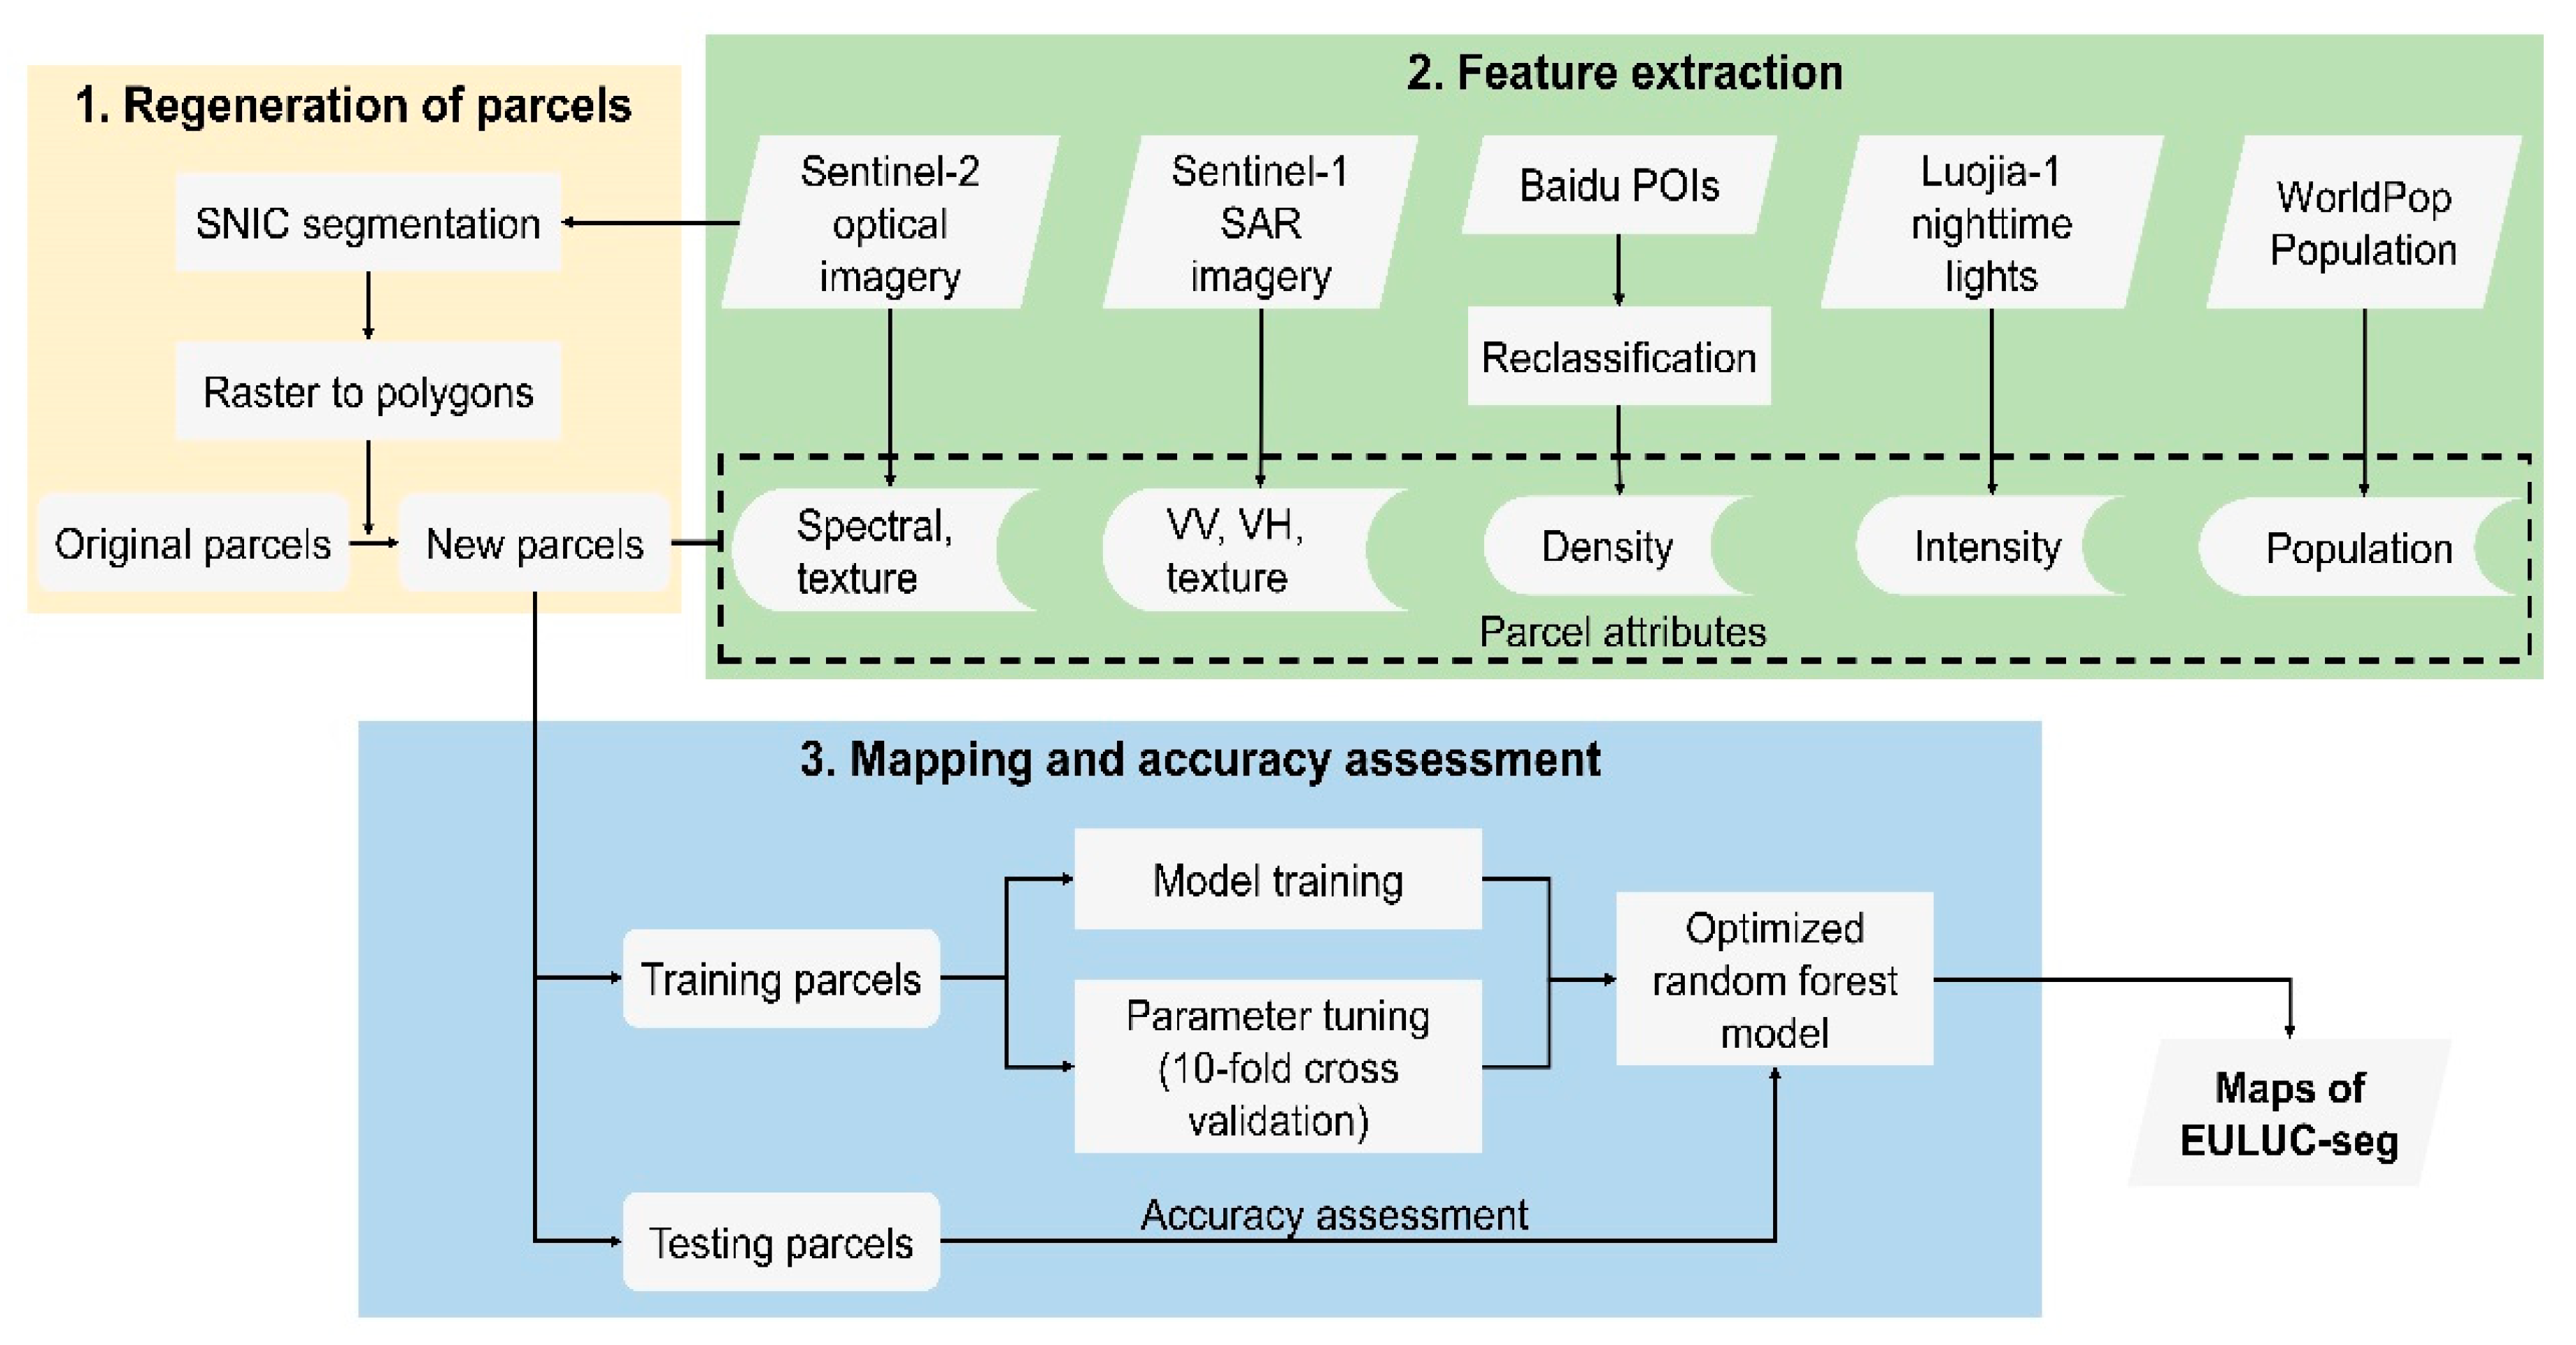
The WorldPop data provides high-resolution, contemporary, and accurate data on human population distributions. Based on the machine learning approaches, recent census-based population counts were matched to their associated administrative units and further disaggregated to grid cells with a spatial resolution of around 100 m [18]. The spatial demographics of Ningbo in 2018 were accessed from the WorldPop website (https://www.worldpop.org/).

3. Proposed Method

Figure 1 presents a flow chart of the proposed mapping scheme, which consists of three major parts: (1) regeneration of parcels, (2) feature extraction, and (3) mapping and accuracy assessment. In the following subsections, each component of our developed framework is described in detail.

3.1. Regeneration of Parcels

To better divide the mapping units of parcels, we first segmented the Sentinel-2 optical imagery using the SNIC algorithm [14] on the Google Earth Engine platform. The SNIC is a bottom-up, seed-based segmentation approach that groups neighboring pixels together into clusters based on input data and parameters such as compactness, connectivity, and neighborhood size [14]. A larger value of compactness causes the clusters to be more compact while the neighborhood size determines the spatial location of superpixel seeds [14]. In this study, after various experiments and visual analysis, we set the SNIC parameters as follows: compactness was set to 1 to enable larger clusters, connectivity was set to 8, the neighborhood size was set to 8 to avoid tile boundary artifacts, and the seeds were created in a square pattern using a superpixel seed spacing of 16 pixels. These values produced the most homogeneous and meaningful objects within the image. After that, we converted those segmentation objects into polygons and further overlapped them with the original parcels of EULUC [1]. In the end, a total number of 58,311 parcels was regenerated, which was approximately ten times that of the original parcels.

3.2. Feature Extraction

Table 1 summarizes the features of parcels used in this study. In total, 76 features derived from multiple data sources were included. For Sentinel-1 SAR imagery, mean values, standard deviations, and textures of VV and VH polarizations were calculated to represent the height information. For Sentinel-2 optical imagery, spectral attributes (mean values and standard deviations of blue, green, red, near-infrared bands, NDVI, and NDWI) and additional texture features were simultaneously considered into the classification model. Texture, which describes the tonal variations across pixels of remotely sensed images, has frequently been used to increase accuracy in land use classifications [8,9,10,11,12,13]. Specifically, for each band of VV, VH, blue, green, red, and near-infrared, the values of angular second moment, contrast, correlation, dissimilarity, entropy, and variance were computed based on the gray level co-occurrence matrix. For the 100 m WorldPop data, mean and sum values of population were extracted. Additionally, the area of each parcel was also computed. Moreover, following our previous study [1], features of POIs and Luojia-1 NTLs were recalculated within each parcel.

3.3. Mapping and Accuracy Assessment

3.3.1. Redefinition of Classification System

In this study, the two-level scheme of EULUC was adopted as the basic classification system [1]. This criterion divides the urban land into five Level I classes of residential, commercial, industrial, transportation, and public, and twelve Level II classes. Considering the characteristics of regional mapping, we further adjusted the Level II category as residential, village, business, commercial, industrial, transportation, administrative, educational, medical, sport and cultural, greenspace, and undeveloped. The redefined classification system of EULUC-seg can be seen in Table 2.

3.3.2. Samples for Training and Testing

A total of 485 actual urban parcels were identified based on high-resolution remote sensing images, online digital maps, and street views. The selected parcels were required to be typical and stable with low mixing of land uses (see Figure S1 for representative samples identified through Google Earth high-resolution images). If a parcel contained multiple or mixed functions, then its dominant function was determined as the land use type. We also conducted an on-site field survey on 437 of those samples (Figure S2) and their precision exceeded 99%. We then randomly split all collected samples into two datasets (315 for training and 170 for testing). The training data was used for model development and tuning model parameters through repeated 10-fold cross validation. The optimized model was then applied to the testing samples for an accuracy assessment.

3.3.3. Random Forest Model

RF, a popular machine learning algorithm, was applied for the training samples to produce the parcel-level mapping of EULUC-seg in Ningbo, 2018. As a bagging ensemble learning classifier, RF has proven its efficiency and robustness in processing high-dimensional data, and has been widely used in land use and land cover classification research [1,19,20,21]. The grid-search approach was used for tuning parameters of the RF model with 10-fold stratified cross validation. In this study, the optimal parameters of ‘n_estimators’ and ‘min_samples_leaf’ for the RF model were set to 70 and 2, respectively.

4. Results

4.1. Classification Results

Table 3 presents the confusion matrix of EULUC-seg for the Level I category. An overall accuracy (OA) of 87.58% and a kappa coefficient of 0.81 were obtained for the four Level I classes. The residential land use class had the highest user’s accuracy (UA) of 95.74% and the highest producer’s accuracy (PA) of 91.84%, whereas the commercial land use class had the lowest accuracies with a UA of 79.17% and a PA of 73.08%. As for the Level II category, the OA and the kappa coefficient were 73.53% and 0.70, respectively (Table S1). Out of the twelve Level II classes, residential, village, and greenspace can be classified relatively well, with both UA and PA above 80%. On the contrary, the parcel attributes and classification approaches used in this study have difficulties in accurately classifying public land use classes, such as administrative and educational, with both UA and PA lower than 60%. As shown in the confusion matrix, such kinds of land use categories, which aim at public management and service, can be easily confused with residential and business parcels. Meanwhile, using the same sample set, we have examined the classification performance under the Residential–Entertainment–Transportation–Industrial–Office (RETIO) schemes (see Table S2), another kind of EULUC classification system proposed by Gong et al. [1]. As shown in the supplementary materials, an OA of 85.71% for Level I and 71.76% for Level II can be achieved under the RETIO classification schemes.
Figure 2 shows the pattern and distribution of EULUC-seg for Level II categories in Ningbo, 2018. Most residential, business, and commercial lands were clustered in urban cores while village, industrial, and greenspace lands were mainly distributed in suburban areas. Table S5 summarizes the statistics of urban land use composition. Statistically, within the 1441.27 km2 impervious areas of Ningbo in 2018, residual lands accounted for 30.81% (444.07 km2), commercial lands accounted for 4.30% (61.97 km2), industrial lands accounted for 17.47% (251.72 km2), transportation lands accounted for 0.48% (6.95 km2), and public lands accounted for 46.94% (676.57 km2).

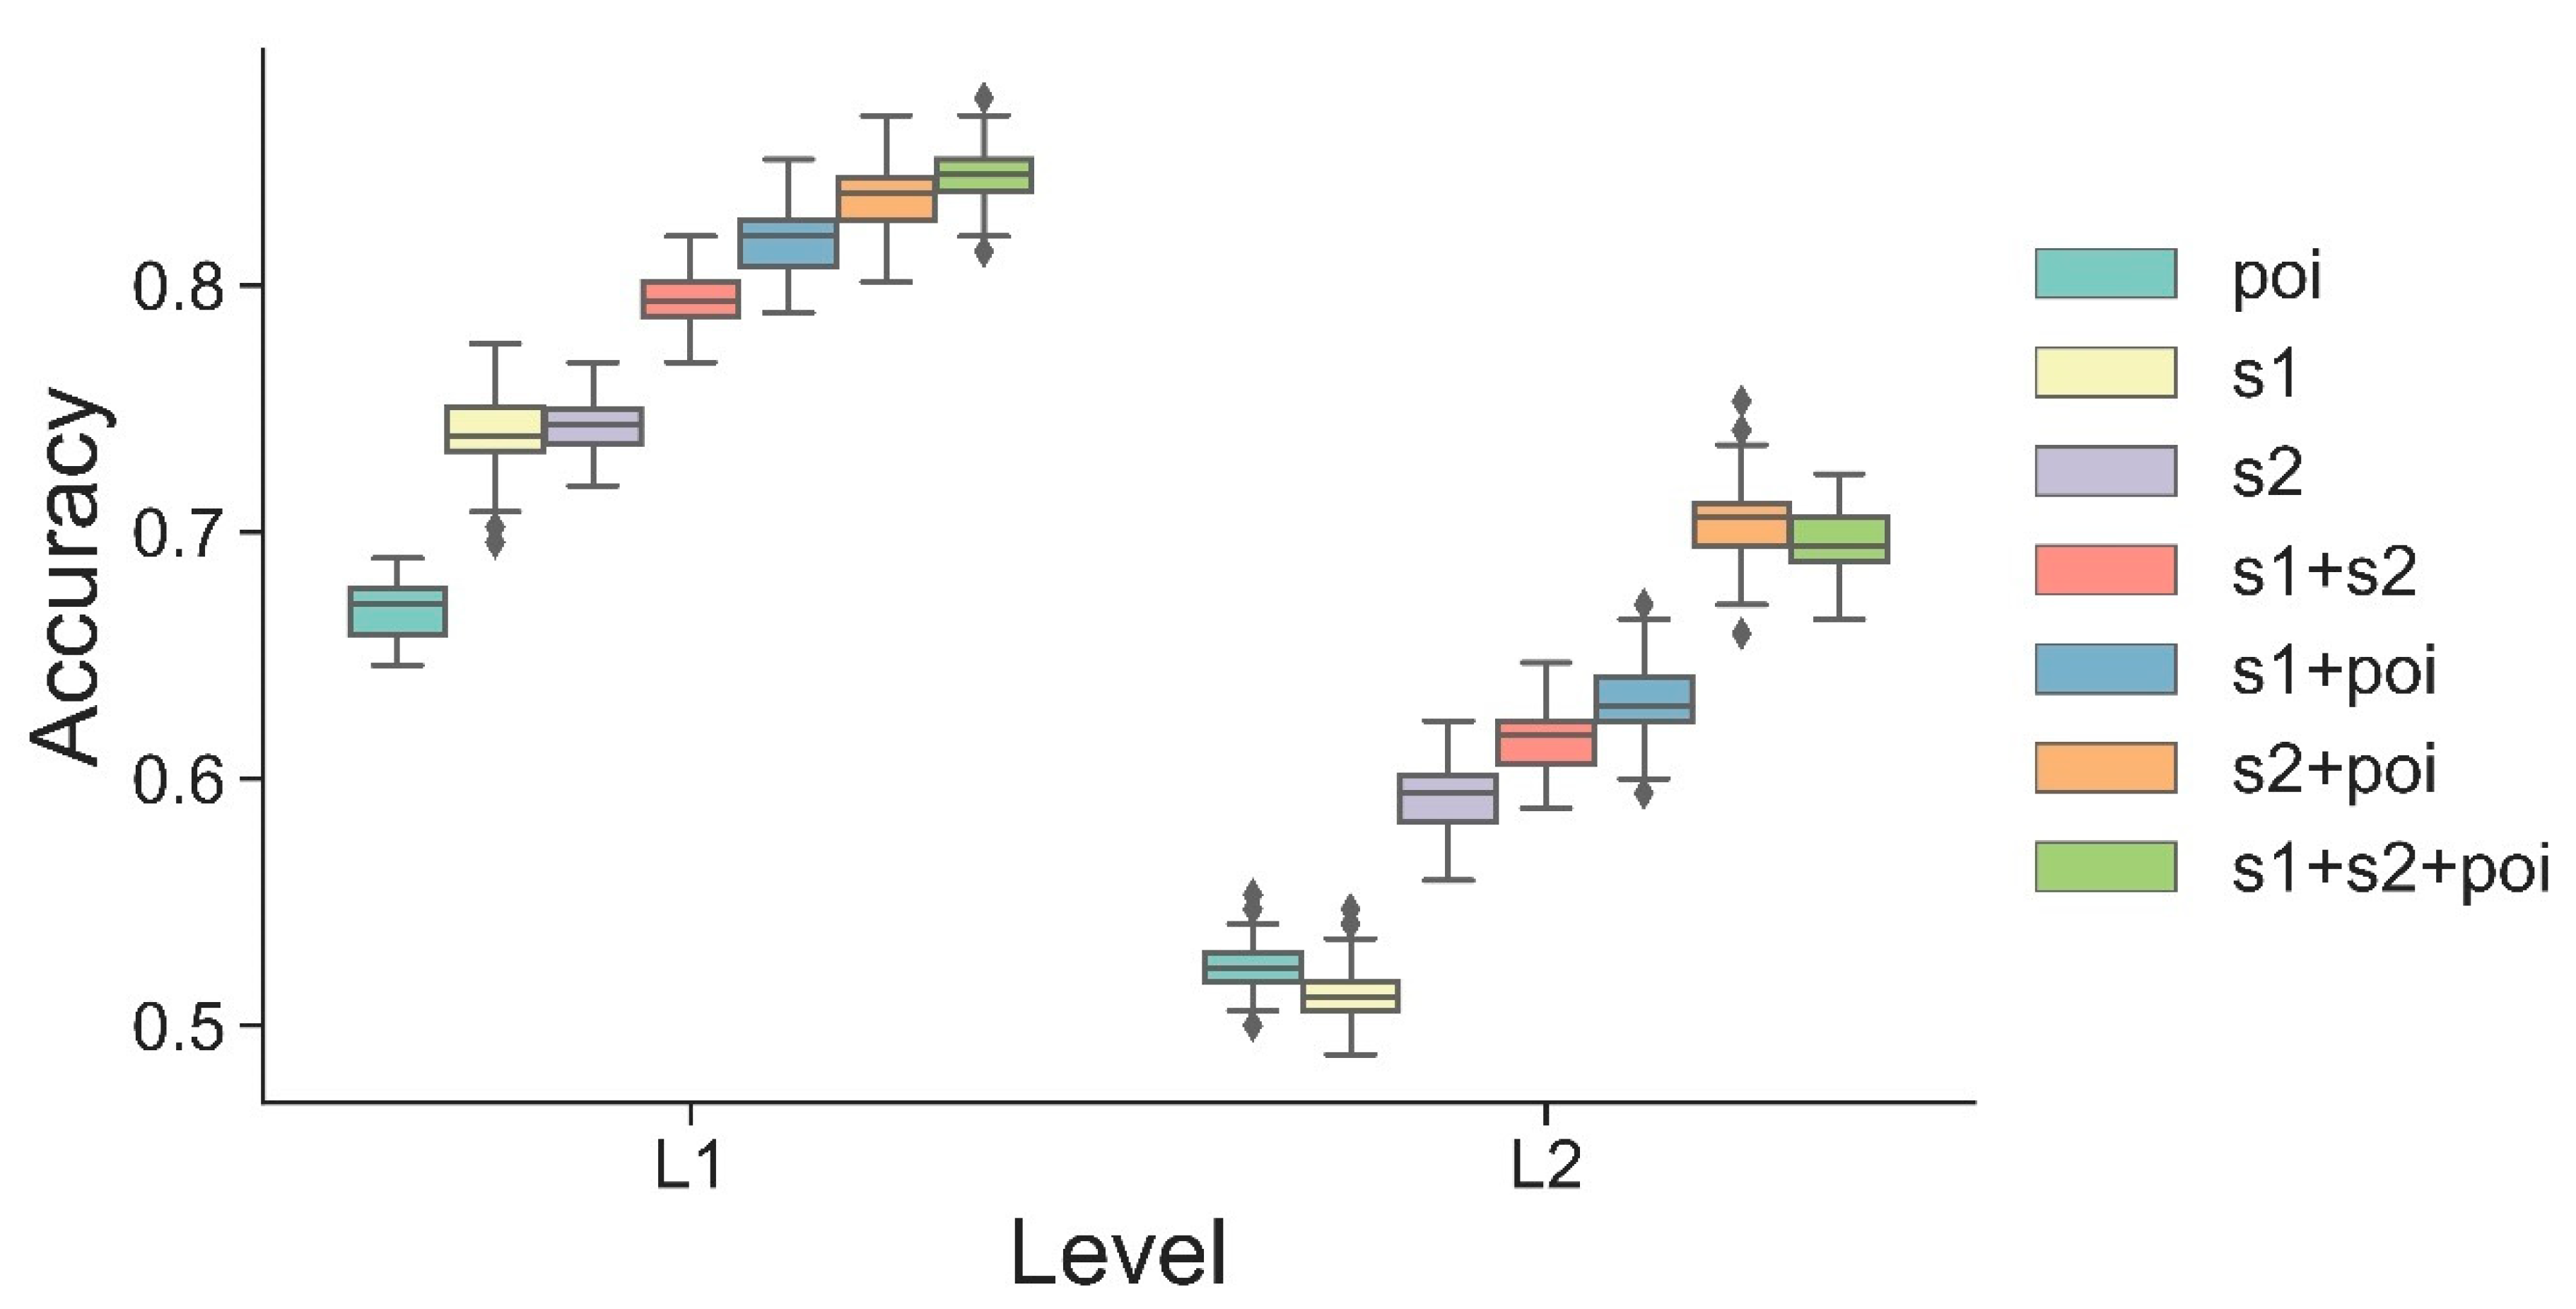
4.2. Importance of Feature Categories

Figure 3 compares the accuracies of EULUC-seg for Level I and Level II categories using different combinations of features. Features derived from Sentinel-2 data generally contributed more to the classification process, as compared to those from Sentinel-1 and POI data. When only using Sentinel-2 data, we obtained an OA of 74.29% ± 1.06% for Level I, and 59.20% ± 1.53% for Level II. In contrast, when only POI data was considered, the RF model had a lower accuracy of 66.90% ± 1.16% for Level I, and 52.56% ± 1.02% for Level II. Interestingly, features of Sentinel-1 data seemed to contribute more to the Level I classification while they would reduce the accuracy of Level II classification. For the Level I category, the highest classification accuracy occurred when Sentinel-1, Sentinel-2, and POI data were used together, with an OA of 84.43% ± 1.23%. Nevertheless, when only combining Sentinel-2 and POI data, a higher OA of 70.35% ± 1.56% could be achieved for the Level II category, as compared to that of other scenarios.
We further compared classification performance with and without additional features (i.e., features that were not used in the previous EULUC study). As shown in Figure S3, when features of Sentinel-1, Sentinel-2 texture, WorldPop and parcel area were excluded in the RF model, the OAs decreased by 8.63% for the Level I category (from 86.07% ± 1.12% to 79.23% ± 1.37%), and 6.01 % for the Level II category (from 71.73% ± 1.55% to 67.66% ± 1.31%).

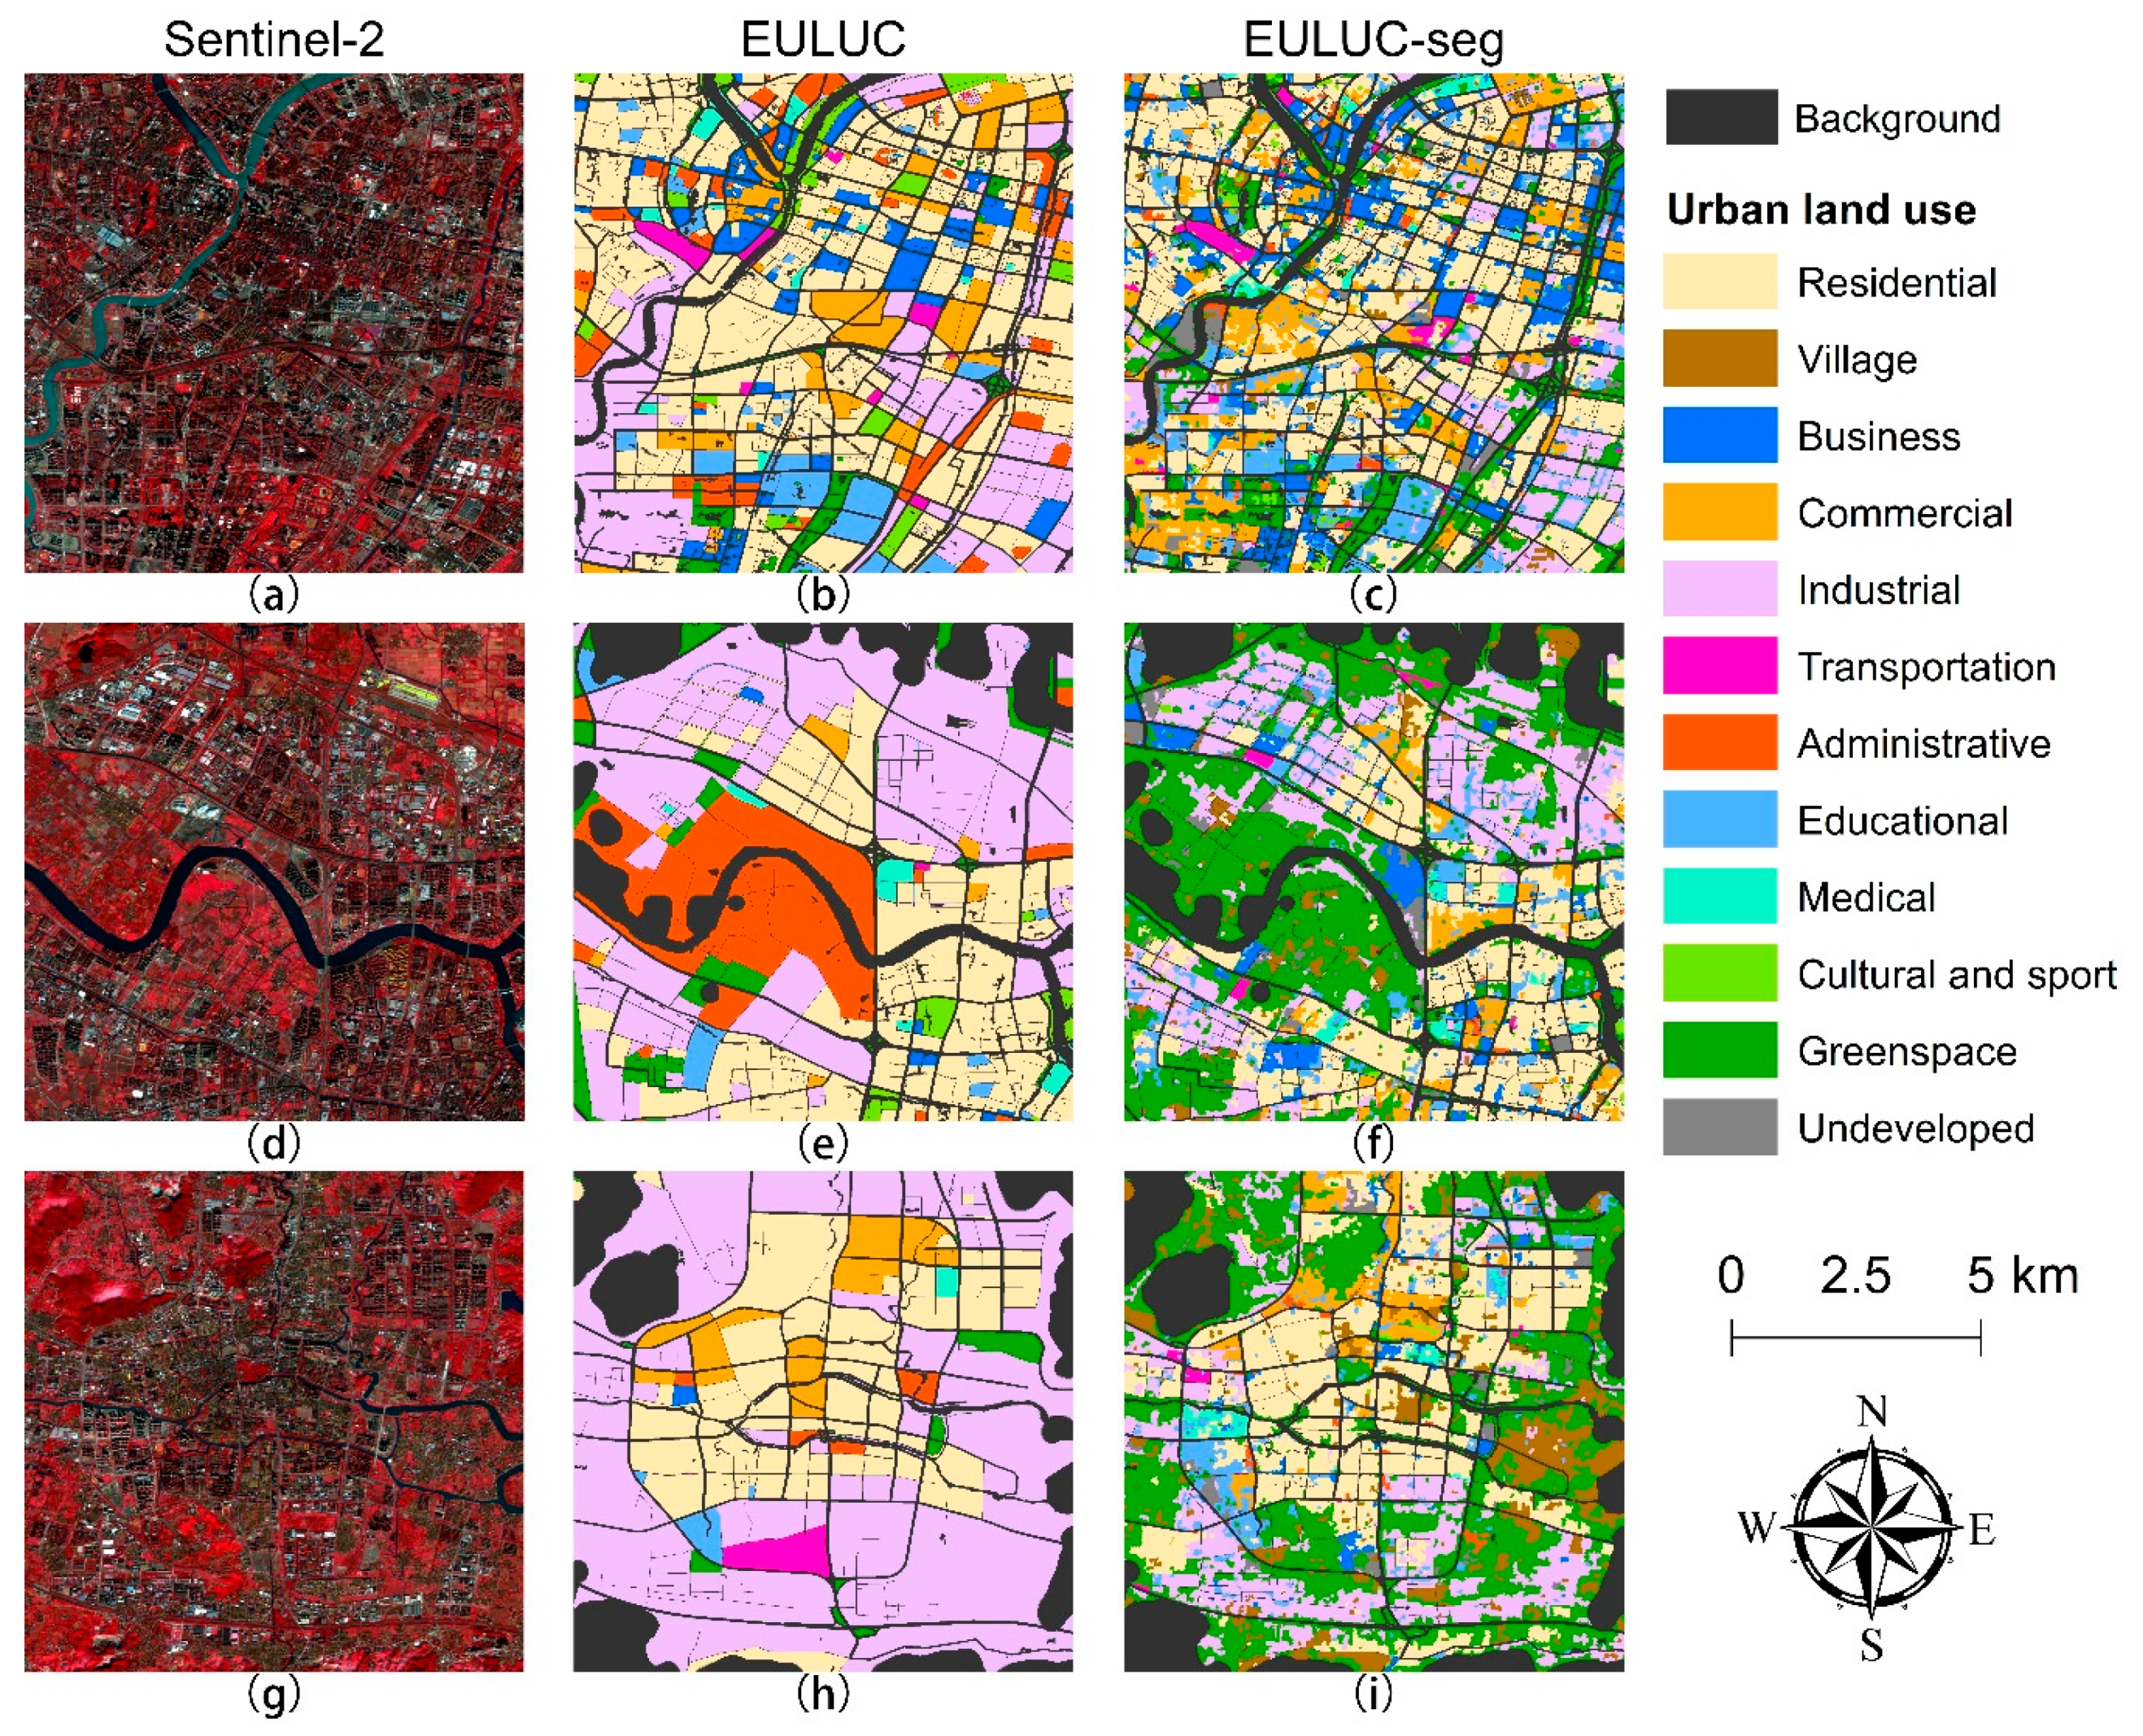
4.3. Comparison with EULUC Mapping Results

Figure 4 displays the comparison results of remotely sensed images and corresponding urban land use maps in Ningbo, 2018. Both the mapping results of EULUC and EULUC-seg reflect the spatial distributions of urban land use with some similarities and differences. On the one hand, for the urban core area where road density is high and parcel function is relatively unitary (Figure 4a–c), patterns of EULUC and EULUC-seg are similar. On the other hand, a huge difference occurs in the suburbs and villages (Figure 4d–i). Due to sparse or missing road data in those remote areas, parcels of EULUC often have a large area with multiple functions. This could have caused obstacles for the accurate classification of urban land use. Statistically, OAs for EULUC of China, 2018, were 61.2% for Level I and 57.5% for Level II [1], while OAs for EULUC-seg of Ningbo, 2018, were 87.6% for Level I and 73.5% for Level II (Table 3 and Table S1). Although these results cannot be compared directly due to the difference in study areas, classification systems, and samples, a horizontal comparison may work via visual interpretation. For example, according to the mapping results of EULUC, the Yuyao county of Ningbo was almost completely surrounded by industrial lands (Figure 4h). However, as shown in the remotely sensed image (Figure 4g), those rural–urban fringe zones were usually mixed with diverse lands such as industrial, residential, and greenspace. With the implementation of the SNIC segmentation algorithm, maps of EULUC-seg provided more accurate details of urban land use (Figure 4i), as compared to those of EULUC (Figure 4h).

5. Discussion

In this study, some improvements in use of finer spatial units and more features have been made to achieve the high-quality mapping of urban land use in Ningbo. A segmentation approach was adopted to further divide the original road-based parcels of EULUC. Based on the spectral difference in the Sentinel-2 optical imagery, the SNIC algorithm automatically grouped pixels with consistent spectra into one homogeneous object, which helped produce smaller and more compact urban parcels for EULUC-seg (Figure 4). Moreover, additional useful features derived from various data sources, such as height and texture information, were incorporated in the RF classifier. Those features contributed to an increase of classification accuracy of 8.63% for the Level I category, and 6.01% for the Level II category (Figure S3). As a result, an accurate and refined urban land use map was obtained in Ningbo city for 2018, with an OA of 87.58% for Level I, and 73.53% for Level II.
Despite our effective efforts, there are some limitations in this study and more work needs to be done in our future work. First, the mixture of urban parcels is still a challenge. Especially in old urban areas, parcels are normally composed of mixed land uses. One possible solution is to expand the classification from the current dominant-class only to multiple-class per parcel classification. Another issue refers to the choice of classification methods. Although the classic RF model has shown its robustness in many related land use and land cover classification studies [1,19,20,21], the potential of other sophisticated approaches, such as support vector machine (SVM) [22] and fully convolutional neural networks (FCNN) [23], has not been fully explored. Therefore, experimental comparisons among different classifiers could be conducted in the next stage.

6. Conclusions

Compared with EULUC maps, EULUC-seg maps have more compact and homogeneous parcels, and they have the advantages of delineating accurate and detailed urban land use patterns, especially in remote areas. The mapping scheme of EULUC-seg is simple and fast to implement, and can be applied to derive land use maps of a larger area in the future.

Supplementary Materials

The following are available online at https://www.mdpi.com/2072-4292/12/7/1058/s1, Figure S1: Examples for the identification of samples based on Google Earth high-resolution images; Figure S2: On-site survey photos of different urban land use in Ningbo taken by the authors; Figure S3: Accuracies of EULUC-seg for Level I and Level II categories with/without additional features. Table S1: Confusion matrix for the Level II category of EULUC-seg; Table S2: Residential–Entertainment–Transportation–Industrial–Office (RETIO) classification schemes; Table S3. Confusion matrix for the Level I category of RETIO; Table S4. Confusion matrix for the Level II category of RETIO. Table S5. Statistics of urban land use composition in Ningbo for 2018.

Author Contributions

Conceptualization, Y.T.; methodology, Y.T.; formal analysis, Y.T.; visualization, Y.T.; investigation, Y.T. and T.Z.; data curation, Y.T. and B.C.; writing—original draft preparation, Y.T.; writing—review and editing, B.C.; supervision, B.X.; funding acquisition, B.X. All authors have read and agreed to the published version of the manuscript.

Funding

This research is funded by Ministry of Science and Technology of the People’s Republic of China under the National Key Research and Development Program (2016YFA0600104), and donations from Delos Living LLC and the Cyrus Tang Foundation to Tsinghua University.

Acknowledgments

The authors would like to thank Peng Gong and the three anonymous reviewers for their insightful comments and suggestions, which have significantly improved this manuscript.

Conflicts of Interest

The authors declare no conflicts of interest.

References

  1. Gong, P.; Chen, B.; Li, X.; Liu, H.; Wang, J.; Bai, Y.; Chen, J.; Chen, X.; Fang, L.; Feng, S.; et al. Mapping essential urban land use categories in China (EULUC-China): Preliminary results for 2018. Sci. Bull. 2019, 65, 182–187. [Google Scholar] [CrossRef] [Green Version]
  2. Zhang, Y.; Li, Q.; Huang, H.; Wu, W.; Du, X.; Wang, H. The combined use of remote sensing and social sensing data in fine-grained urban land use mapping: A case study in Beijing, China. Remote Sens. 2017, 9, 865. [Google Scholar] [CrossRef] [Green Version]
  3. Du, S.; Du, S.; Liu, B.; Zhang, X.; Zheng, Z. Large-scale urban functional zone mapping by integrating remote sensing images and open social data. GIScience Remote Sens. 2020, 57, 1–20. [Google Scholar] [CrossRef]
  4. Zhou, W.; Troy, A. An object-oriented approach for analysing and characterizing urban landscape at the parcel level. Int. J. Remote Sens. 2008, 29, 3119–3135. [Google Scholar] [CrossRef]
  5. Blaschke, T. Object based image analysis for remote sensing. ISPRS J. Photogramm. Remote Sens. 2010, 65, 2–16. [Google Scholar] [CrossRef] [Green Version]
  6. Zhang, C.; Sargent, I.; Pan, X.; Li, H.; Gardiner, A.; Hare, J.; Atkinson, P.M. An object-based convolutional neural network (OCNN) for urban land use classification. Remote Sens. Environ. 2018, 216, 57–70. [Google Scholar] [CrossRef] [Green Version]
  7. Liu, S.; Qi, Z.; Li, X.; Yeh, A.G.-O. Integration of convolutional neural networks and object-based post-classification refinement for land use and land cover mapping with optical and sar data. Remote Sens. 2019, 11, 690. [Google Scholar] [CrossRef] [Green Version]
  8. Ruiz Hernandez, I.E.; Shi, W. A Random Forests classification method for urban land-use mapping integrating spatial metrics and texture analysis. Int. J. Remote Sens. 2018, 39, 1175–1198. [Google Scholar] [CrossRef]
  9. Gong, P.; Marceau, D.J.; Howarth, P.J. A comparison of spatial feature extraction algorithms for land-use classification with SPOT HRV data. Remote Sens. Environ. 1992, 40, 137–151. [Google Scholar] [CrossRef]
  10. Xu, B.; Gong, P.; Seto, E.; Spear, R. Comparison of gray-level reduction and different texture spectrum encoding methods for land-use classification using a panchromatic IKONOS image. Photogramm. Eng. Remote Sens. 2003, 69, 529–536. [Google Scholar] [CrossRef]
  11. Herold, M.; Liu, X.; Clarke, K. Spatial metrics and image texture for mapping urban land use. Photogramm. Eng. Remote Sens. 2003, 69, 991–1001. [Google Scholar] [CrossRef] [Green Version]
  12. Wu, S.-S.; Qiu, X.; Usery, E.L.; Wang, L. Using geometrical, textural, and contextual information of land parcels for classification of detailed urban land use. Ann. Assoc. Am. Geogr. 2009, 99, 76–98. [Google Scholar] [CrossRef]
  13. Hu, S.; Wang, L. Automated urban land-use classification with remote sensing. Int. J. Remote Sens. 2013, 34, 790–803. [Google Scholar] [CrossRef]
  14. Achanta, R.; Susstrunk, S. Superpixels and polygons using simple non-iterative clustering. In Proceedings of the IEEE Conference on Computer Vision and Pattern Recognition, Hawaii Convention Center, Honolulu, HI, USA, 21–26 July 2017; pp. 4651–4660. [Google Scholar]
  15. Breiman, L. Random forests. Mach. Learn. 2001, 45, 5–32. [Google Scholar] [CrossRef] [Green Version]
  16. Gong, P.; Li, X.; Wang, J.; Bai, Y.; Chen, B.; Hu, T.; Liu, X.; Xu, B.; Yang, J.; Zhang, W. Annual maps of global artificial impervious area (GAIA) between 1985 and 2018. Remote Sens. Environ. 2020, 236, 111510. [Google Scholar] [CrossRef]
  17. Louis, J.; Debaecker, V.; Pflug, B.; Main-Knorn, M.; Bieniarz, J.; Mueller-Wilm, U.; Cadau, E.; Gascon, F. Sentinel-2 Sen2Cor: L2A processor for users. In Proceedings of the Living Planet Symposium 2016, Prague, Czech Republic, 9–13 May 2016; pp. 1–8. [Google Scholar]
  18. Tatem, A.J. WorldPop, open data for spatial demography. Sci. Data 2017, 4, 1–4. [Google Scholar] [CrossRef] [PubMed]
  19. Gong, P.; Wang, J.; Yu, L.; Zhao, Y.; Zhao, Y.; Liang, L.; Niu, Z.; Huang, X.; Fu, H.; Liu, S. Finer resolution observation and monitoring of global land cover: First mapping results with Landsat TM and ETM+ data. Int. J. Remote Sens. 2013, 34, 2607–2654. [Google Scholar] [CrossRef] [Green Version]
  20. Gong, P.; Liu, H.; Zhang, M.; Li, C.; Wang, J.; Huang, H.; Clinton, N.; Ji, L.; Li, W.; Bai, Y.; et al. Stable classification with limited sample: Transferring a 30-m resolution sample set collected in 2015 to mapping 10-m resolution global land cover in 2017. Sci. Bull. 2019, 64, 370–373. [Google Scholar] [CrossRef] [Green Version]
  21. Hu, T.; Yang, J.; Li, X.; Gong, P. Mapping urban land use by using landsat images and open social data. Remote Sens. 2016, 8, 151. [Google Scholar] [CrossRef]
  22. Cortes, C.; Vapnik, V. Support-vector networks. Mach. Learn. 1995, 20, 273–297. [Google Scholar] [CrossRef]
  23. Long, J.; Shelhamer, E.; Darrell, T. Fully convolutional networks for semantic segmentation. In Proceedings of the IEEE Conference on Computer Vision and Pattern Recognition, Boston, MA, USA, 7–12 June 2015; pp. 3431–3440. [Google Scholar]
Figure 1. Workflow of the proposed mapping scheme.
Remotesensing 12 01058 g001
Figure 2. Map of EULUC-seg for Level II category in Ningbo, 2018: (a) overview map; (b) detailed zoomed-in view map of the central urban area.
Remotesensing 12 01058 g002
Figure 3. Accuracies of EULUC-seg for Level I and Level II categories using different combinations of features. poi, s1, and s2 denote features from data sources of Baidu POIs, Sentinel-1 SAR, and Sentinel-2 optical, respectively. For each scenario, the random forest (RF) model is repeated 100 times.
Remotesensing 12 01058 g003
Figure 4. Comparison of remotely sensed images and urban land use mapping results. (ac) The central urban area of Ningbo where three main rivers (Fenghua river, Yong river, and Yao river) run through. (df) A suburb located 10 km northwest of the central city. (gi) The Yuyao county located 40 km west of the central city. Three columns from left to right denote the Sentinel-2 optical imagery (false color composition), maps of EULUC [1], and maps of EULUC-seg implemented in this study, respectively.
Remotesensing 12 01058 g004
Table 1. Summary of features.
Data SourceFeaturesCount
Sentinel-1Mean of VV and VH2
Standard deviation of VV and VH2
Textures of VV and VH12
Sentinel-2Mean of blue, green, red, near-infrared bands, NDVI, and NDWI6
Standard deviation of blue, green, red, near-infrared bands, NDVI, and NDWI6
Textures of blue, green, red, and near-infrared bands24
Baidu POIsTotal number of all POIs1
Total number of each type of POIs9
Proportion of each type of POIs9
Luojia-1Mean of DN values1
Sum of DN values1
WorldPopMean of population1
Sum of population1
/Area of each parcel1
Table 2. Redefined classification system of EULUC-seg.
Level ILevel II
01 Residential0101 Residential
0102 Village
02 Commercial0201 Business
0202 Commercial
03 Industrial0301 Industrial
04 Transportation0401 Transportation
05 Public0501 Administrative
0502 Educational
0503 Medical
0504 Sport and cultural
0505 Greenspace
0506 Undeveloped
Table 3. Confusion matrix for the Level I category of EULUC-seg. Due to the limited testing samples of transportation lands, we exclude this kind of category here in the accuracy assessment. UA, PA, and OA denote user’s accuracy, producer’s accuracy, and overall accuracy, respectively.
ResidentialCommercialIndustrialPublicUAPA
Residential4500295.74%91.84%
Commercial0192379.17%73.08%
Industrial0010190.91%76.92%
Public4716784.81%91.78%
OA = 87.58%, kappa coefficient = 0.81

