Article

DFCNN-Based Semantic Recognition of Urban Functional Zones by Integrating Remote Sensing Data and POI Data

1
School of Information Engineering, China University of Geosciences (Beijing), 29 Xueyuan Road, Haidian, Beijing 100083, China
2
Polytechnic Center for Natural Resources Big-data, Ministry of Natural Resources of China, Beijing 100036, China
*
Author to whom correspondence should be addressed.
Remote Sens. 2020, 12(7), 1088; https://doi.org/10.3390/rs12071088
Submission received: 7 February 2020 / Revised: 25 March 2020 / Accepted: 27 March 2020 / Published: 28 March 2020
(This article belongs to the Special Issue Urban Land Use Mapping and Analysis in the Big Data Era)

Abstract

:
The urban functional zone, as a special fundamental unit of the city, helps to understand the complex interaction between human space activities and environmental changes. Based on the recognition of physical and social semantics of buildings, combining remote sensing data and social sensing data is an effective way to quickly and accurately comprehend urban functional zone patterns. From the object level, this paper proposes a novel object-wise recognition strategy based on very high spatial resolution images (VHSRI) and social sensing data. First, buildings are extracted according to the physical semantics of objects; second, remote sensing and point of interest (POI) data are combined to comprehend the spatial distribution and functional semantics in the social function context; finally, urban functional zones are recognized and determined by building with physical and social functional semantics. When it comes to building geometrical information extraction, this paper, given the importance of building boundary information, introduces the deeper edge feature map (DEFM) into the segmentation and classification, and improves the result of building boundary recognition. Given the difficulty in understanding deeper semantics and spatial information and the limitation of traditional convolutional neural network (CNN) models in feature extraction, we propose the Deeper-Feature Convolutional Neural Network (DFCNN), which is able to extract more and deeper features for building semantic recognition. Experimental results conducted on a Google Earth image of Shenzhen City show that the proposed method and model are able to effectively, quickly, and accurately recognize urban functional zones by combining building physical semantics and social functional semantics, and are able to ensure the accuracy of urban functional zone recognition.

Graphical Abstract

1. Introduction

Functional zones are the fundamental units of the city, which not only reflect the complex spatial distribution and socio-economic functions of the city but also help to understand the complex interaction between human space activities and environmental changes. Different functional zone units interact with each other, which results in shaping the complexity of the city [1,2,3]. Buildings are one of the most important components of a city, and the same kind of building often has the same requirements for area, location, and function, which leads to the aggregation of the same type of buildings in urban space. Thus, various functional zones are formed, such as commercial, residential, industrial, shantytown, campus, hospital, urban green spaces, etc. Therefore, urban buildings and their spatial distribution and semantic mining play an important role in urban functional zone recognition [4].
With the rapid development of the technologies of satellites and remote sensing, a large number of sophisticated, very high spatial resolution images (VHSRI) are continuously being commercialized nowadays. VHRSI have been allowed to perform feature recognition, as well as extraction, with higher accuracy. Meanwhile, accurately recognizing city objects (buildings and roads), as well as comprehending deeper semantic information (schools and hospitals), from remote sensing images has been one of the basic challenges of urban planning and management [5,6,7,8,9]. Urban functional zones are an organic combination that contains physical semantics (spectrum, texture, shape, etc.) and social functional semantics (living, shopping, etc.). Thus, utilizing shallow features extracted from VHRSI to recognize urban functional zones that contain deeper semantic information has quickly become a hot topic in the field of urban remote sensing [10,11,12].
Researches of urban functional zones contend for attention. Primitively, the recognition of functional zones is usually achieved by scene recognition based on VHRSI. Scene recognition has developed rapidly in the past ten years [13]. In previous researches, the use of shallow visual features (Scale-invariant feature transform (SIFT), Histogram of Oriented Gradient (HOG), Local Binary Pattern (LBP)) made certain achievements in scene recognition. However, these visual knowledge-based methods are mainly used in simple scenes with unique visual signs, but when it comes to heterogeneous scene recognition with different kinds of objects and complex visual features, these methods will not perform well. To solve this problem, the topic model (TM) has been proposed and widely applied to describe scenarios. The visual bag of words (BOVW) method performs scene recognition based on visual word frequency in a long distance [14,15,16]. To comprehend the spatial geometrical layout within the scene, BOVW is promoted based on a spatial pyramid, and this method is able to capture co-occurring visual words in the spatial domain [17]. Similarly, probabilistic topic models, such as the latent dirichlet assignment (LDA) and probabilistic latent semantic analysis (pLSA) models, have been introduced; these models utilize object features and categories that have latent semantics to describe image scenes as different topics [2,8,18,19]. The methods mentioned above simply rely on shallow features through the process of classification, and their results are often affected by inaccurate shallow context [20]. Consequently, deeper semantic information is one of the key factors restricting the recognition of urban functional zones [21].
The main question in this area is how to extract semantic information of buildings and urban functional zones from VHRSI, and how to make full use of this information. One answer is to use convolutional neural networks (CNNs). CNNs have already been used widely in remote sensing image classification in recent years [22,23,24,25,26,27,28,29]. However, these CNN-based methods mainly focus on classifying the entire scene directly [30], while the semantics at the object level, as well as the spatial structure and depth context information between objects, are ignored. Therefore, it is necessary to access remote sensing images at the object level before implementing the recognition of urban functional zones [24,25,31]. Zhou et al. pioneered the concept of the basic unit of the functional zone, which is based on the deep structure features contained within the super objects (SO), and used CNN to recognize the urban functional zones at the super object level, but only the remote sensing image data are limited in the expression of social functional information [32]. In addition, due to dividing functional zones directly and the use of convolution filters of CNNs, uncertainty might occur in the boundaries of urban information, and these problems feature in previous studies [33]. Based on CNNs’ limitation and to improve the effectiveness and accuracy of the recognition of urban functional zones, the depth of CNN networks, the precision of the selected sample, and the quantity and quality of features need to be further improved [32,34,35,36].
With the rapid development of information technology and the tide advent of big data in cities, emerging concepts such as “social perception”, “urban computing”, and “smart city” spring up. Using data of social perception, such as social media, mobile, bus, location-based service (LBS), and point of interest (POI) data, to recognize urban functional zones has gradually become a research hotspot [37,38,39,40,41]. Compared with remote sensing images, data of social perception can reflect urban socio-economic functions and human space activities, and as a result, analysis can be directly and effectively performed upon urban functional zones [42,43]. Nonetheless, data of social perception do not have the ability to describe geographic objects, and it is impossible to mine the features of geographic objects, spatial distribution, and geographic context information [24,25,44,45]. Therefore, the integration of remote sensing images and POI data is a trend used to describe complex urban functional zones, but the latent dirichlet assignment (LDA) and clustering methods still have certain limitations in the expression of data features [8,46]. In this paper, CNNs are used to overcome some limitations, as well as to become a catalyst for the organic fusion of data and the joint expression of features.
Buildings convey the main geographical description of cities and are the carriers of human space activities. The distribution of semantic buildings can reflect the functional structure of the city, as buildings bear a wealth of abstract information of social perception [47,48]. The semantic information of buildings can be divided into physical semantics and social functional semantics. The term physical semantics in this paper refers to the spatial and physical semantics of the geographic objects (such as spectrum, geometry, texture, spatial position, relationship, etc.) in the natural world, while the term social functional semantic information refers to, on the basis of practical attributes, a combination of socio-economic foundations and human practical activities (functional attributes and their distribution and interaction) within a certain spatial zone. However, previous research is mostly based on scene recognition and classification, ignoring building semantics in urban functional zone analysis [18,49]. Although there is also the super objects (SO) method based on image statistical features [32], the introduction of social perception data will improve the accuracy of urban functional zones. Therefore, a building semantics-based urban functional zone recognition strategy is proposed in this paper, which combines the complementary information of remote sensing images and information of social perception and fuses the practical semantic information and social functional semantic information of urban buildings. It is of great significance for comprehending the complex urban structure and function distribution quickly, effectively, and accurately.
In detail, we independently built a deeper-feature convolutional neural network (DFCNN) to extract more and deeper semantic information, and buildings were extracted by DFCNN at the object level from VHSRI. Then, when integrating remote sensing images and POI data, the spatial distribution and functional semantic information of buildings were comprehended in the context of social functions. Finally, to ultimately recognize urban functional zones, regional voting was conducted on buildings by interweaving the physical semantics and the social functional semantics.
The rest of the paper is organized as follows: In Section 2, a method for building semantic recognition based on DFCNN and related principles is proposed; in Section 3, the study area and experimental data, as well as the experimental results, are described; in Section 4 and Section 5, the work of this paper is discussed and summarized, respectively.

2. Methodology

As shown in Figure 1, the strategic structural framework of urban functional zone recognition proposed in this paper can be divided into four main steps. First, different geographic objects can be segmented into satisfactory scales through stratified scale estimation. Then, integrating the deeper edge feature map (DEFM) and VHSRI, the physical semantics of the segmented objects and the buildings can be recognized by using the pre-trained multi-scale DFCNN framework. Furthermore, it fuses POIs and VHSRI, retrains the DFCNN model, and explores the spatial distribution and functional semantics of buildings in the context of socio-economic functions. Finally, under the regional restrictions of OpenStreetMap (OSM), the urban functional zones are recognized according to the building semantics and area ratio.

2.1. Stratified Scale Estimation Strategy

Fixed parameters are not satisfactory for all geographic objects; the optimal segmentation scale of a building is different from vegetation, water, or other objects. In addition, the spatial distribution pattern of geographic objects is often affected by scale [50,51,52,53,54]. Similar geographic objects tend to gather and dominate in a certain space and have similar scale and features.
Based on the above reasons, we propose a stratified scale estimation strategy, which combines the area division based on the normalized grey level co-occurrence matrix (NGLCM) with the spatial scale estimation to obtain the segmentation object. As shown in Figure 2, first, the entire image is stratified into several large regions by multi-texture computing, and then the spatial scale of each region is estimated to implement fine-scale segmentation [52,55,56]. To some extent, the strategy can avoid the blindness and subjectivity of scale parameter selection, can satisfy the suitability and accuracy of different geographic objects, and can improve the efficiency of experiments.
The grey level co-occurrence matrix (GLCM) is a matrix that calculates the spatial combinations (angles and distances) of center pixels and neighborhood pixels with different window sizes and step sizes. Most texture calculations are weighted averages of the normalized GLCM (NGLCM) element values [57]. The purpose of weighted averages is to emphasize the relative importance of different values in the normalized GLCM. The value returned by homogeneity mainly measures the uniformity of the texture distribution of the image. Entropy measures the randomness of the information contained in the image, that is, the complexity of the gray distribution of the image. The division of image regions based on the normalized GLCM creates the premise for the appropriateness of geographic object scale estimation.
In this paper, spatial scale estimation is used to calculate the average local variance of different windows in global images [55,58]. The basic theories of spatial statistics and spectral statistics can be applied to object-oriented remote-sensing image segmentation scale estimation. Based on the spatial information and attributes of remote-sensing data, we can summarize the three basic meanings of the scale parameters of objects: the spatial scale parameter h s (the spatial distance or the range of spatial correlation between patches), the attribute scale parameter h r (attribute distance or attribute difference between patches), and the merge threshold parameter M (size of patch or number of pixels).
The stratified scale estimation strategy can satisfy the suitability and accuracy of different geographic object scales to a certain extent. This paper takes mean-shift segmentation as an example to demonstrate the feasibility of this strategy.

2.2. DFCNN-Based Semantic Recognition of Buildings

Semantics contain not only features of certain category objects but also include corresponding complex distribution patterns and spatial structures [20]. This study adopts the self-built DFCNN semantic recognition model and introduces the feature of self-learning, and therefore, is able to understand remote sensing images in more and deeper features and to realize structure semantic recognition.

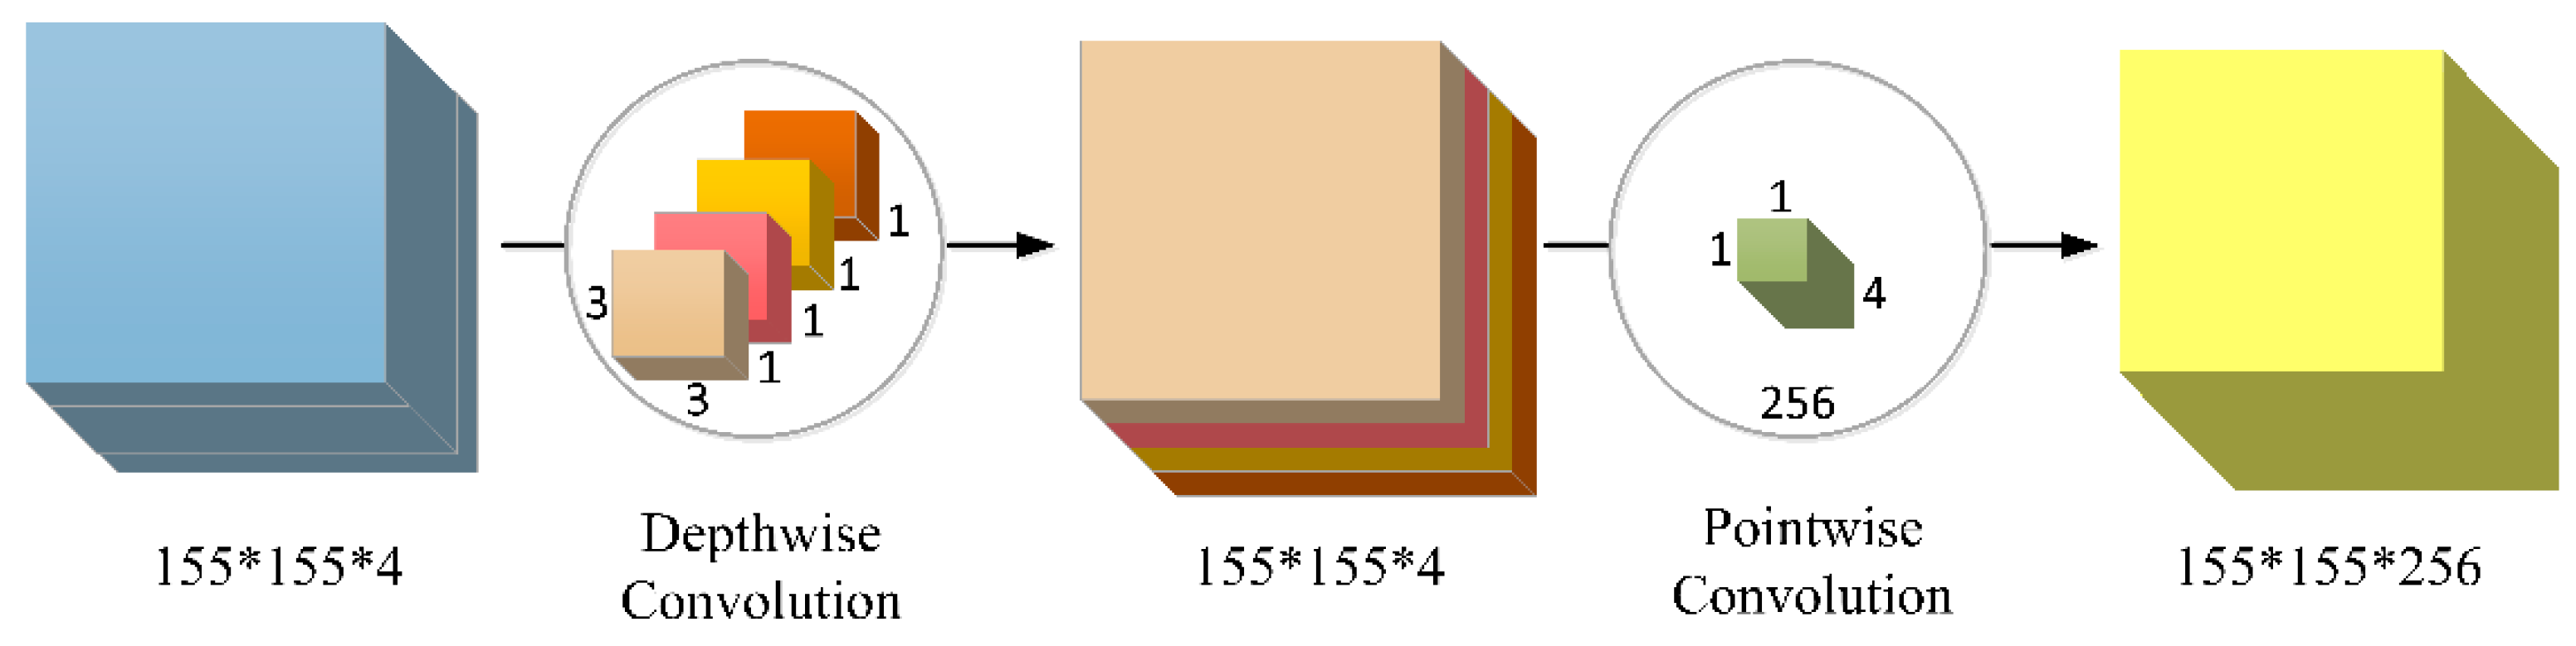
2.2.1. Deeper-Feature CNN (DFCNN)

Traditional classification methods have limited ability to express object features, especially for VHSRI, which contain more complex object information, and usually generate some less desired classification results [18,59,60,61,62,63]. Convolutional neural networks, as the core of deep learning, are suitable for image processing and image understanding, and are able to automatically extract rich deeper features from images, thanks to the close boundaries and spatial information between each convolution [64]. Therefore, CNNs show great potential in automatic feature extraction and complex object recognition for VHSRI [33,65,66,67].
Most current CNN models merely stack more convolution layers to deepen the network, and in the hope to obtain better performance. However, not only can the depth and width of the network be adjusted but also the perception width can be increased if the filter running on the same convolution layer is multi-scaled. Thus, inspired by the inception module, we built the Deeper-feature CNN (DFCNN) to promote the efficiency of mining deeper semantics and semantic information among objects [68,69]. The DFCNN consists of five convolution modules, five pooling layers, and a fully connected layer, and the score function is Softmax. The number of DFCNN channels is flexible and determined by specific data. Figure 3 is a self-explanatory description of the structure of DFCNN.
A convolutional module, which contains a 1 × 1 convolutional filter, two 3 × 3 convolution filters, and a 3 × 3 depthwise separable convolution, was adopted to replace the traditional convolutional layer. Depthwise separable convolutions divide the convolution kernel into two separate convolution kernels: depthwise convolution and pointwise convolution (Figure 4). Depthwise convolution is the normal convolution of the input image without changing the depth, whereas pointwise convolution uses a 1 × 1 kernel function whose depth is the number of channels of the input image. Unlike traditional convolution layers, the proposed convolutional module separates the region and channel and puts more emphasis on the region, which is favorable for the extraction of multi-layer deep features.
Compared to other convolutional neural networks, the DFCNN can mine deep semantics. As the DFCNN considers multiple convolutional cores with different sizes, it gains better robustness and a larger receptive field, and obtains more and deeper features than CNN with single filters. Moreover, the addition of depthwise separable convolutions ensures that the information from multi-channels is fully used and that more features are further extracted. The ability of DFCNN to fully extract more and deeper features is the key to probing physical and social semantics of buildings.

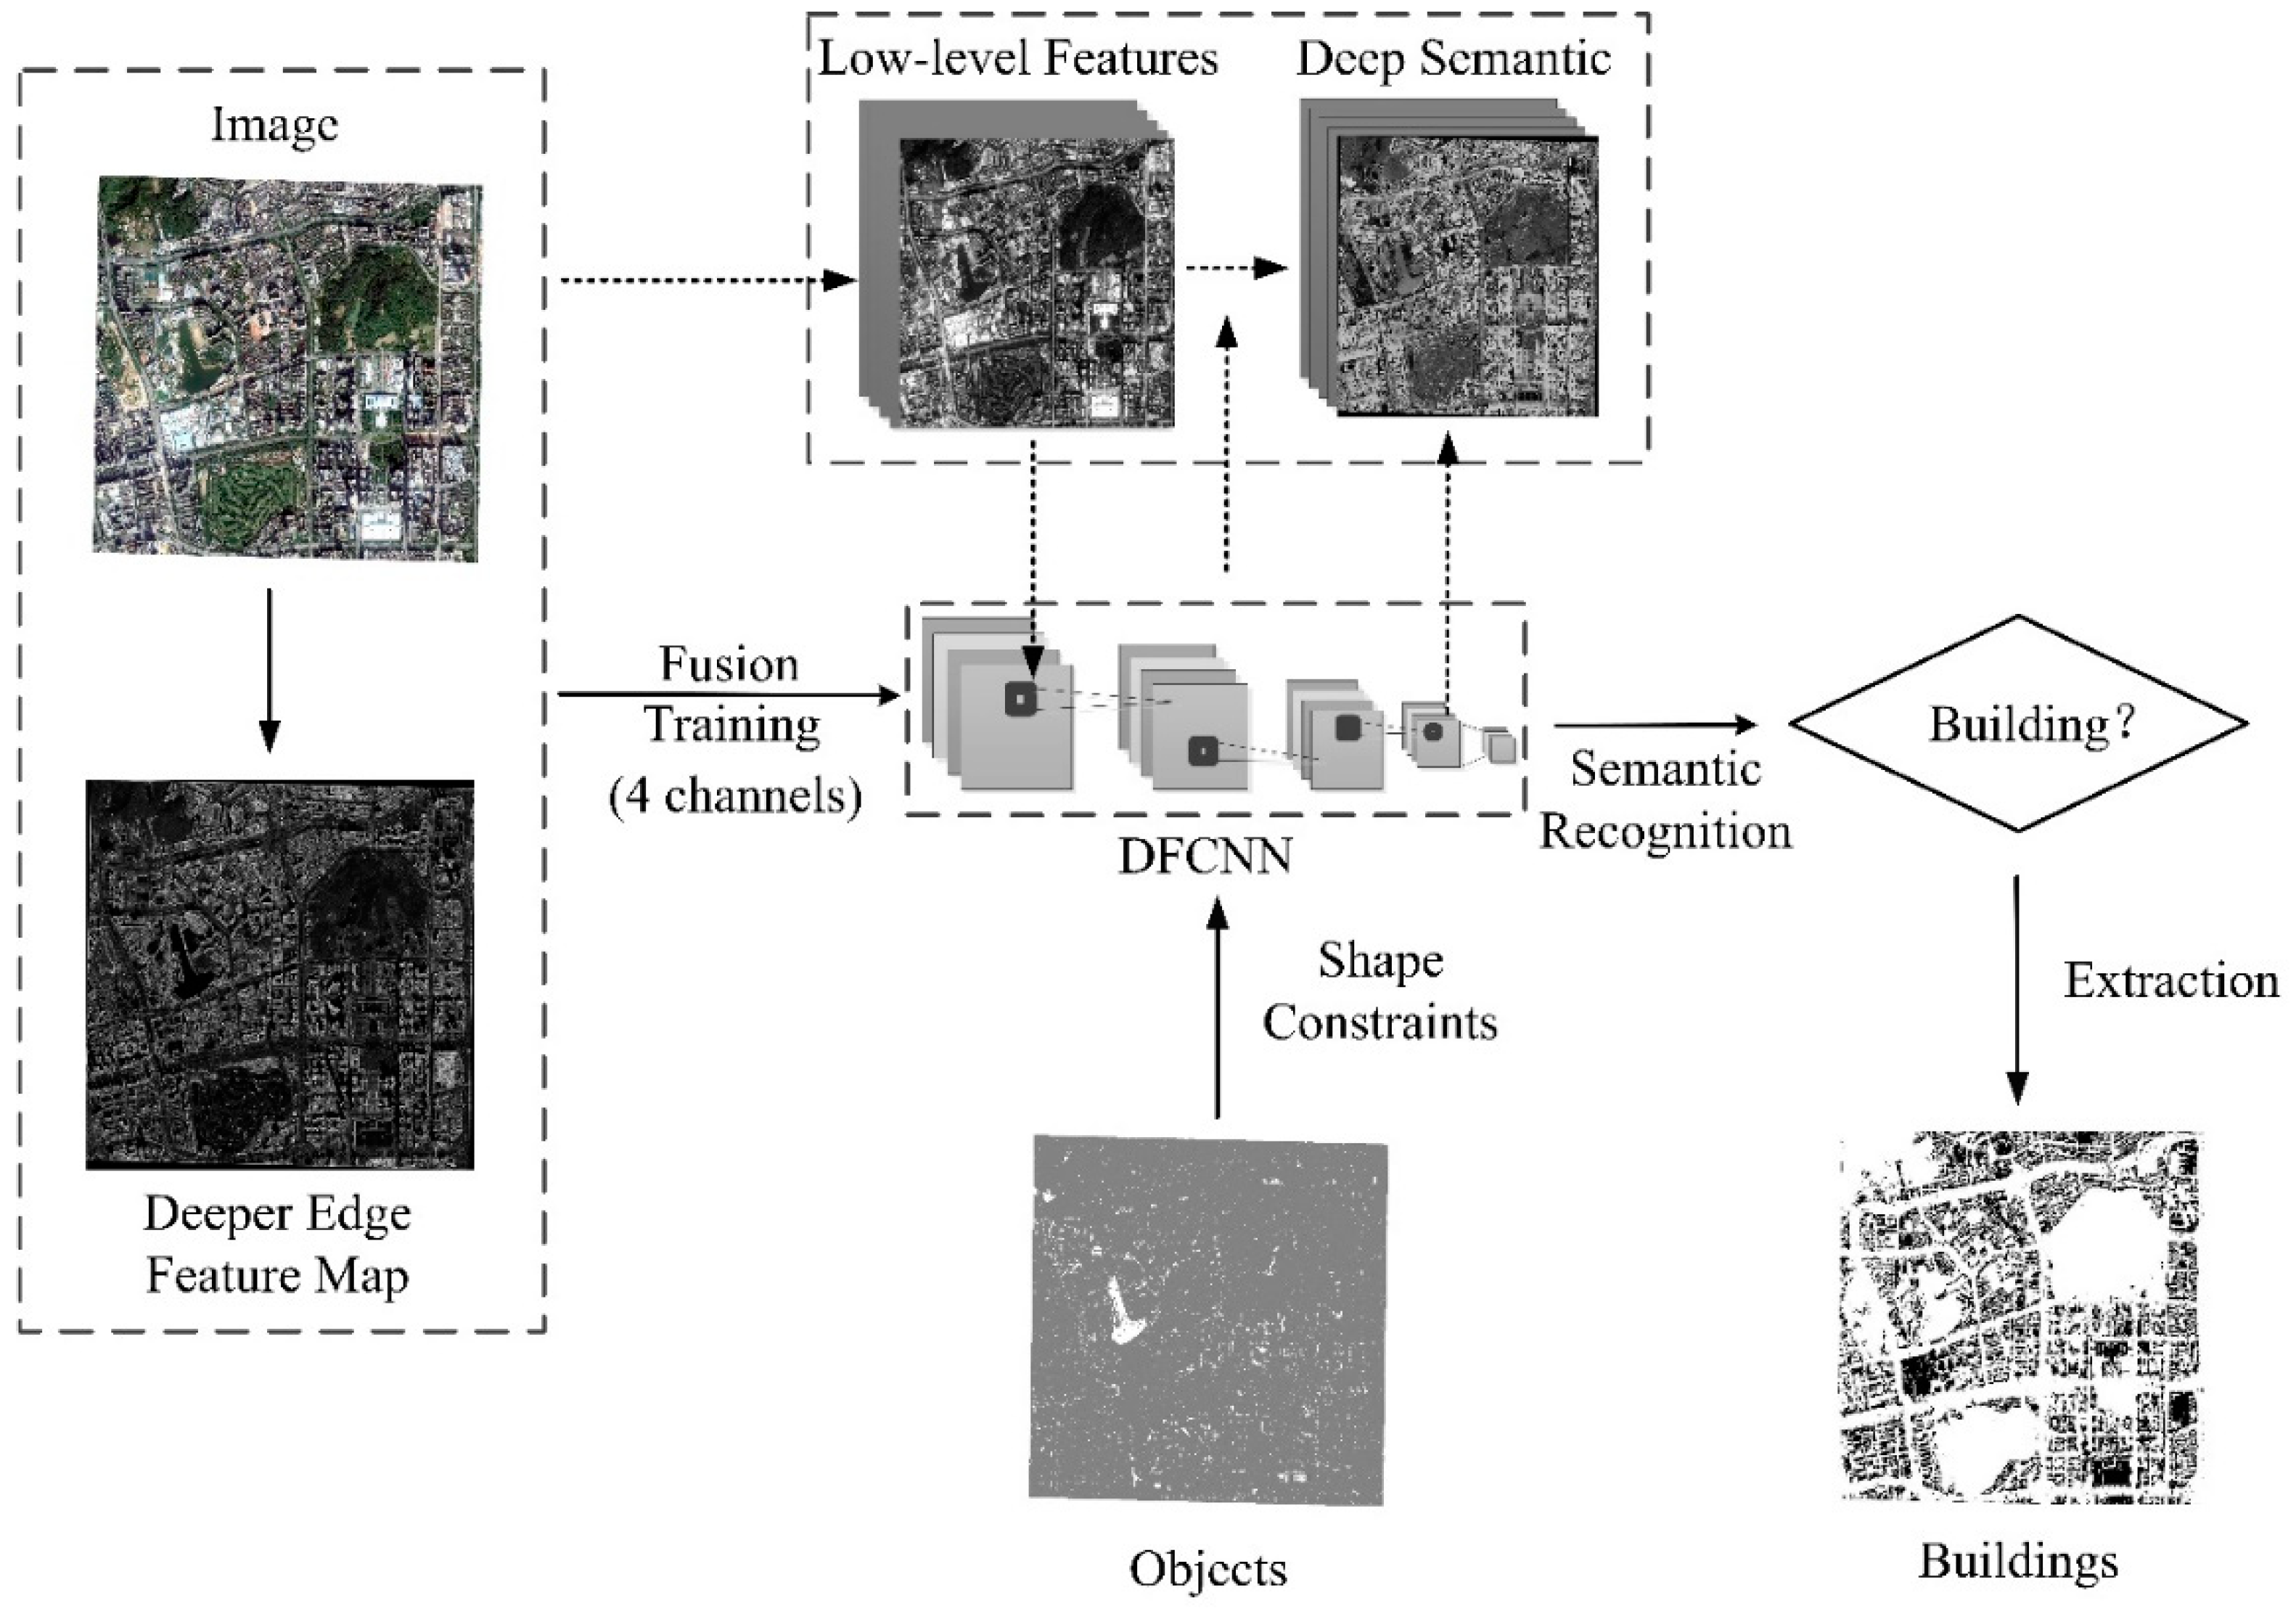
2.2.2. Physical Semantic Recognition of Buildings

Different objects with the same spectra characteristics and same objects with different spectra characteristics impact the recognition of buildings; therefore, it is difficult to obtain buildings satisfactorily with traditional shallow features. Therefore, we integrated VHSRI and DEFM to mine the deeper semantic information of geographic objects based on the DFCNN model, and to extract buildings from physical semantics. The process is shown in Figure 5.
The high-frequency part of the image is more sensitive and interesting, and the details of the image are often related to the high-frequency part. The deeper edge feature map (DEFM) can better reflect the detailed information of the image, and it also can be considered that the DEFM contains a lot of structure and edge information of the image. Due to the influence of the window on the image structure, the Gaussian weighting method was used to calculate the deeper edge features. The specific formula is calculated as:
V ( M x , y ) = p 1 L ω p ( η p M ¯ x , y ) 2 p 1 L ω p
M x , y = p = 1 L ω p η p p = 1 L ω p
where V M x , y ,   M x , y is the local variance and mean based on the centered pixel ( x , y ) , L is a window of m × m , η p is a pixel in the window, and ω p is the weight, where p L .

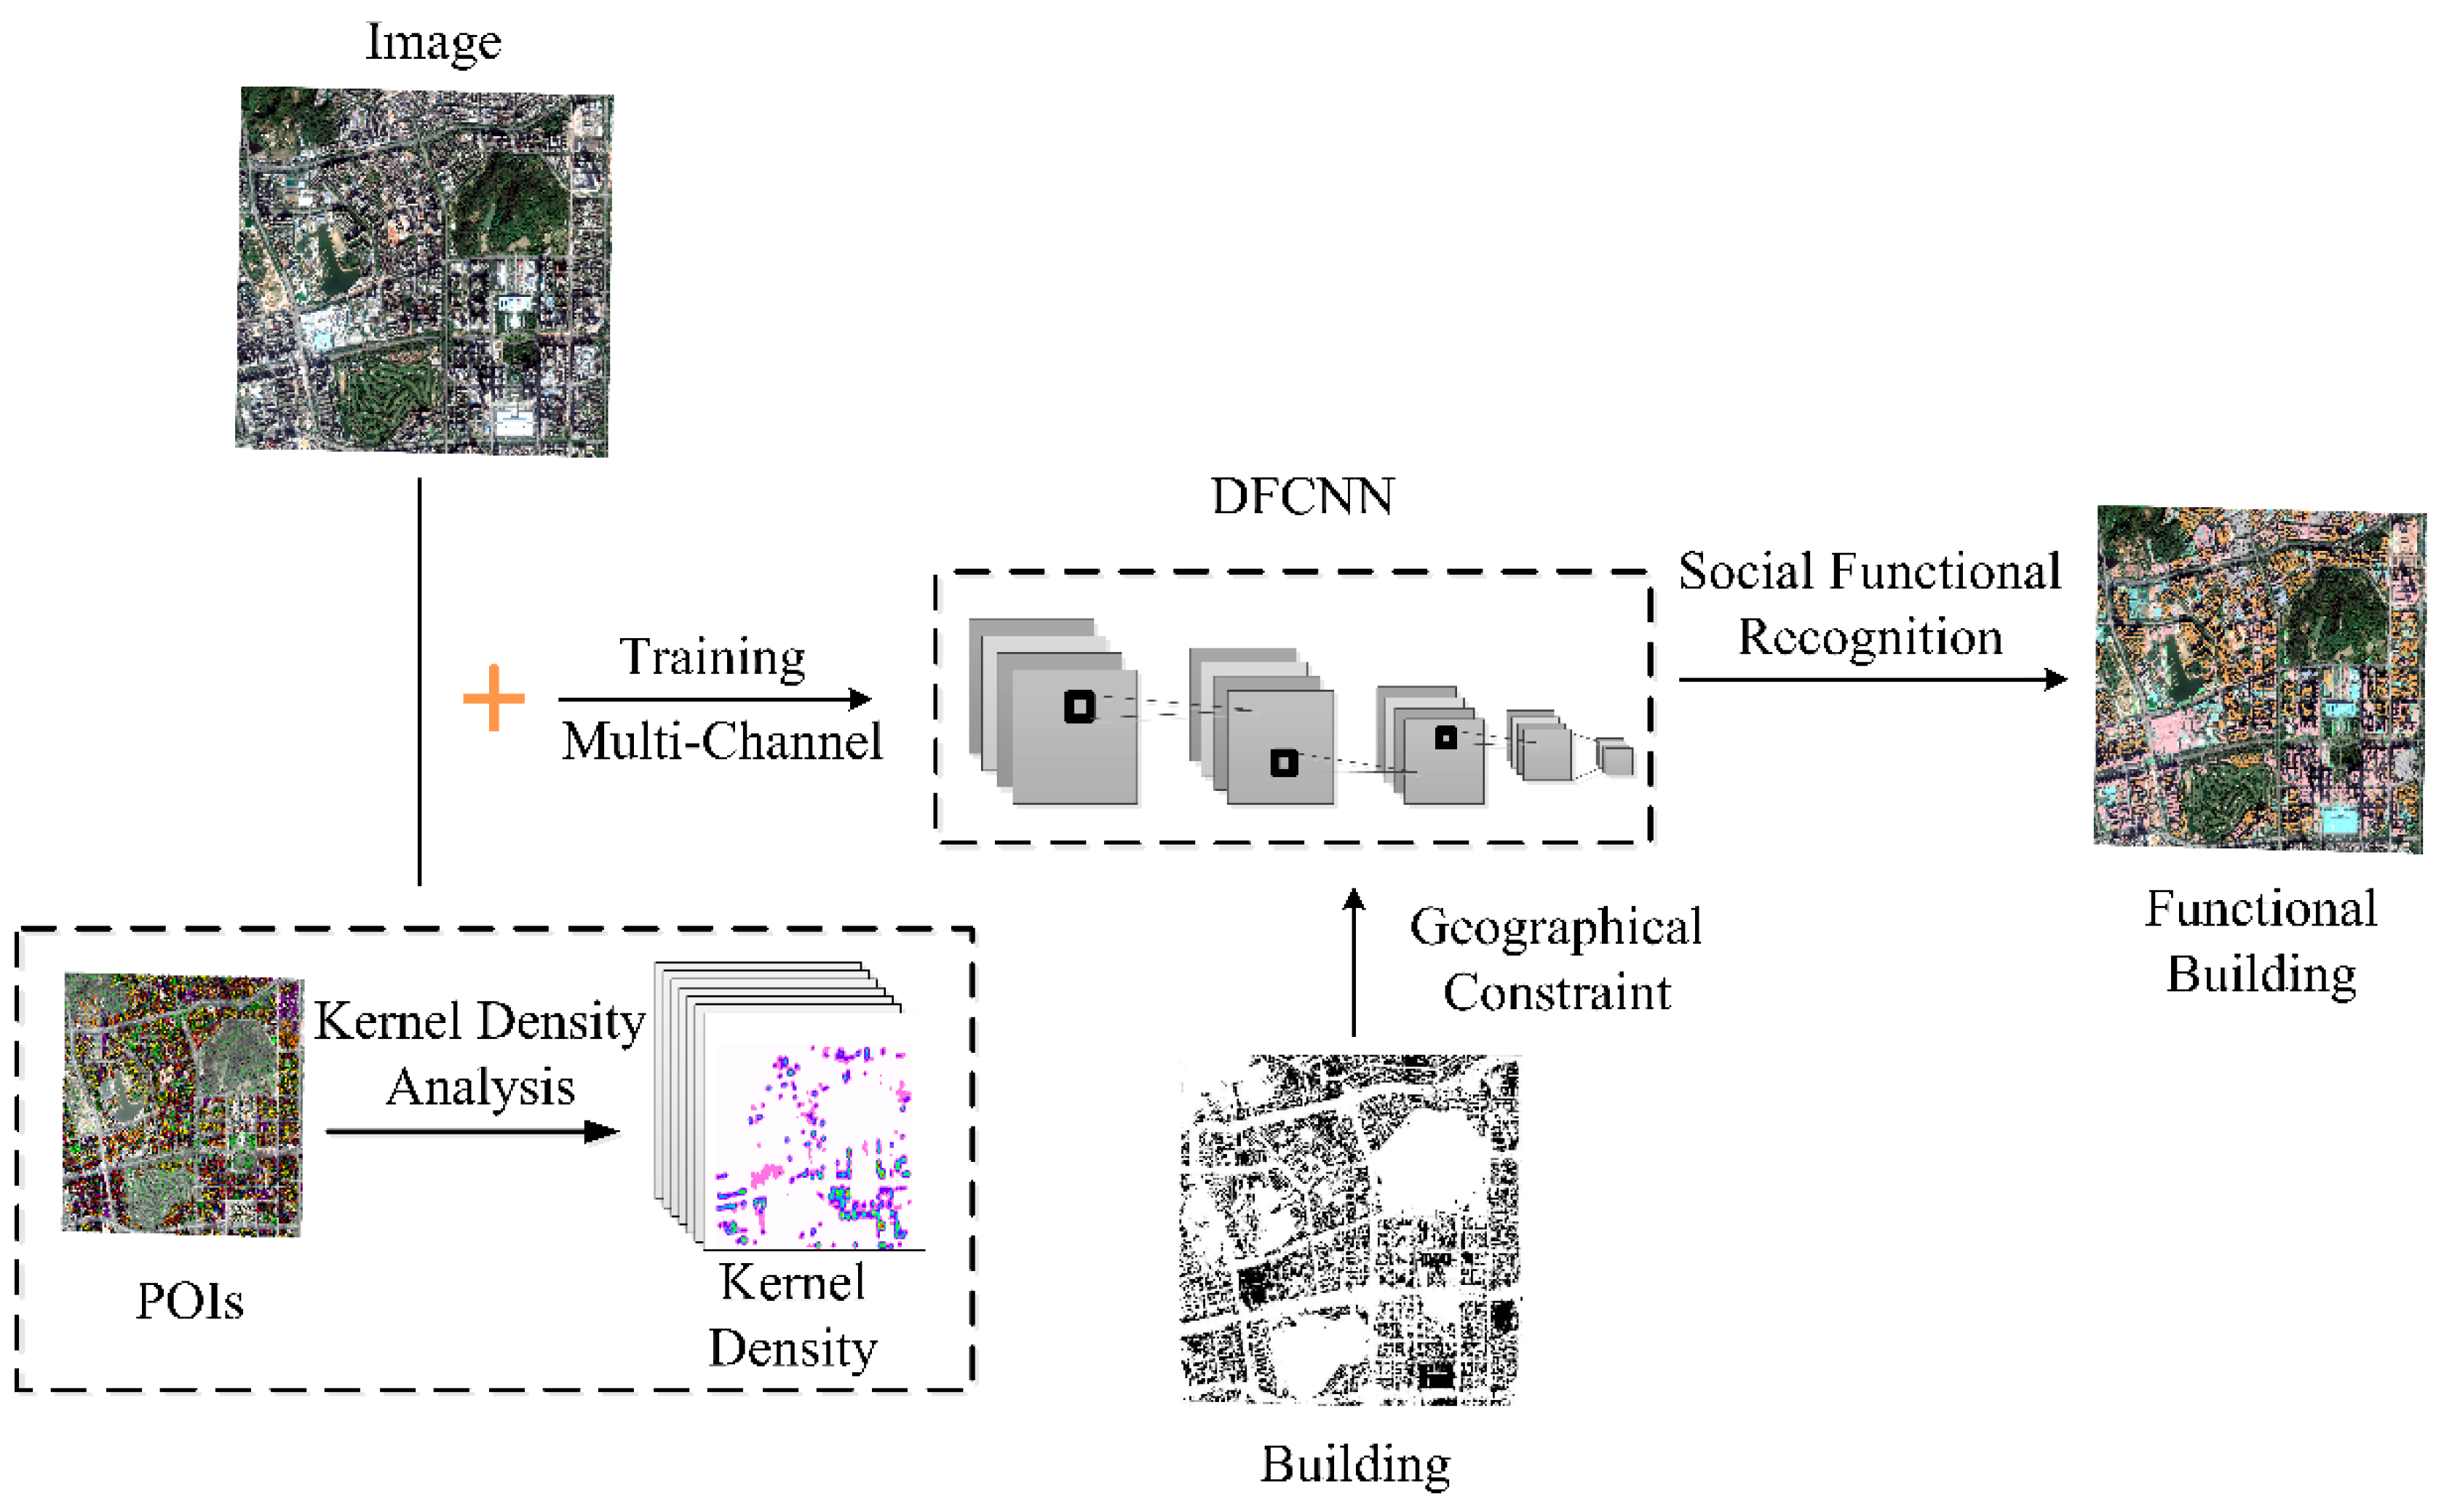
2.2.3. Social Semantic Recognition of Buildings

Although the method based on DFCNN is effective to recognize the physical semantics of buildings, it is difficult to detect the social function attributes of buildings. To fully comprehend the semantics of building object from VHRSI and social context information, we integrated POI with buildings at the object level. Building objects can be provided high-level social semantic information by DFCNN, such as residential districts, commercial districts, hospitals, and so on. The process of social functional semantic recognition of buildings is shown in Figure 6.
Unfortunately, the quality of POI data varies by category. For example, there are significantly more commercial POI data than other types, as POI data are generated by human activities, and so it is mainly concentrated in commercial areas. This results in an uneven distribution of POI data, so the original POI data are unable to satisfactorily represent the volume and spatial distribution of geographical objects. Therefore, the kernel density analysis method was adopted to fully mine the spatial and semantic granularity information of POI data, which is a convenient way to extract semantic information of social functions. The following formula defines how to calculate the kernel density of POI data and to determine the default search radius.
The predicted density at (x, y) is determined by the following formula:
D e n s i t y = 1 ( R a d i u s ) 2 i = 1 n [ 3 π p i ( 1 d i s t i r a d i u s 2 ) 2 ]
where i represents the input POI data, i = 1 , , n ; p i refers to the population field value of the POI data, which represents the magnitude of point i, and d i s t i is the distance between point i and position ( x , y ) .
The search radius is defined as follows:
R a d i u s = 0.9 m i n ( S D , 1 ln 2 D m ) n 0.2
where D m represents the median distance of the mean center; n refers to the sum of the population field value of POI data, and SD is the standard distance.
S D = i = 1 n ( x i X ¯ ) 2 n + i = 1 n ( y i Y ¯ ) 2 n
where x i , y i are the coordinates of point i; X ¯ , Y ¯ represent the mean center of point i, and n refers to the number of POI data.
The above formula calculates the density of each position, and then the density multiplies the sum of the population field value of POI data. Finally, the result is output to the center of each pixel to obtain the kernel density image of POI data.
To some extent, the kernel density image of POI data not only makes up for the imbalance of the number of POI types but also reduces the impact of the inaccurate position of POI data. The kernel density image allows POI and VHSRI to complement one another, which is conducive to the recognition of social function semantics.

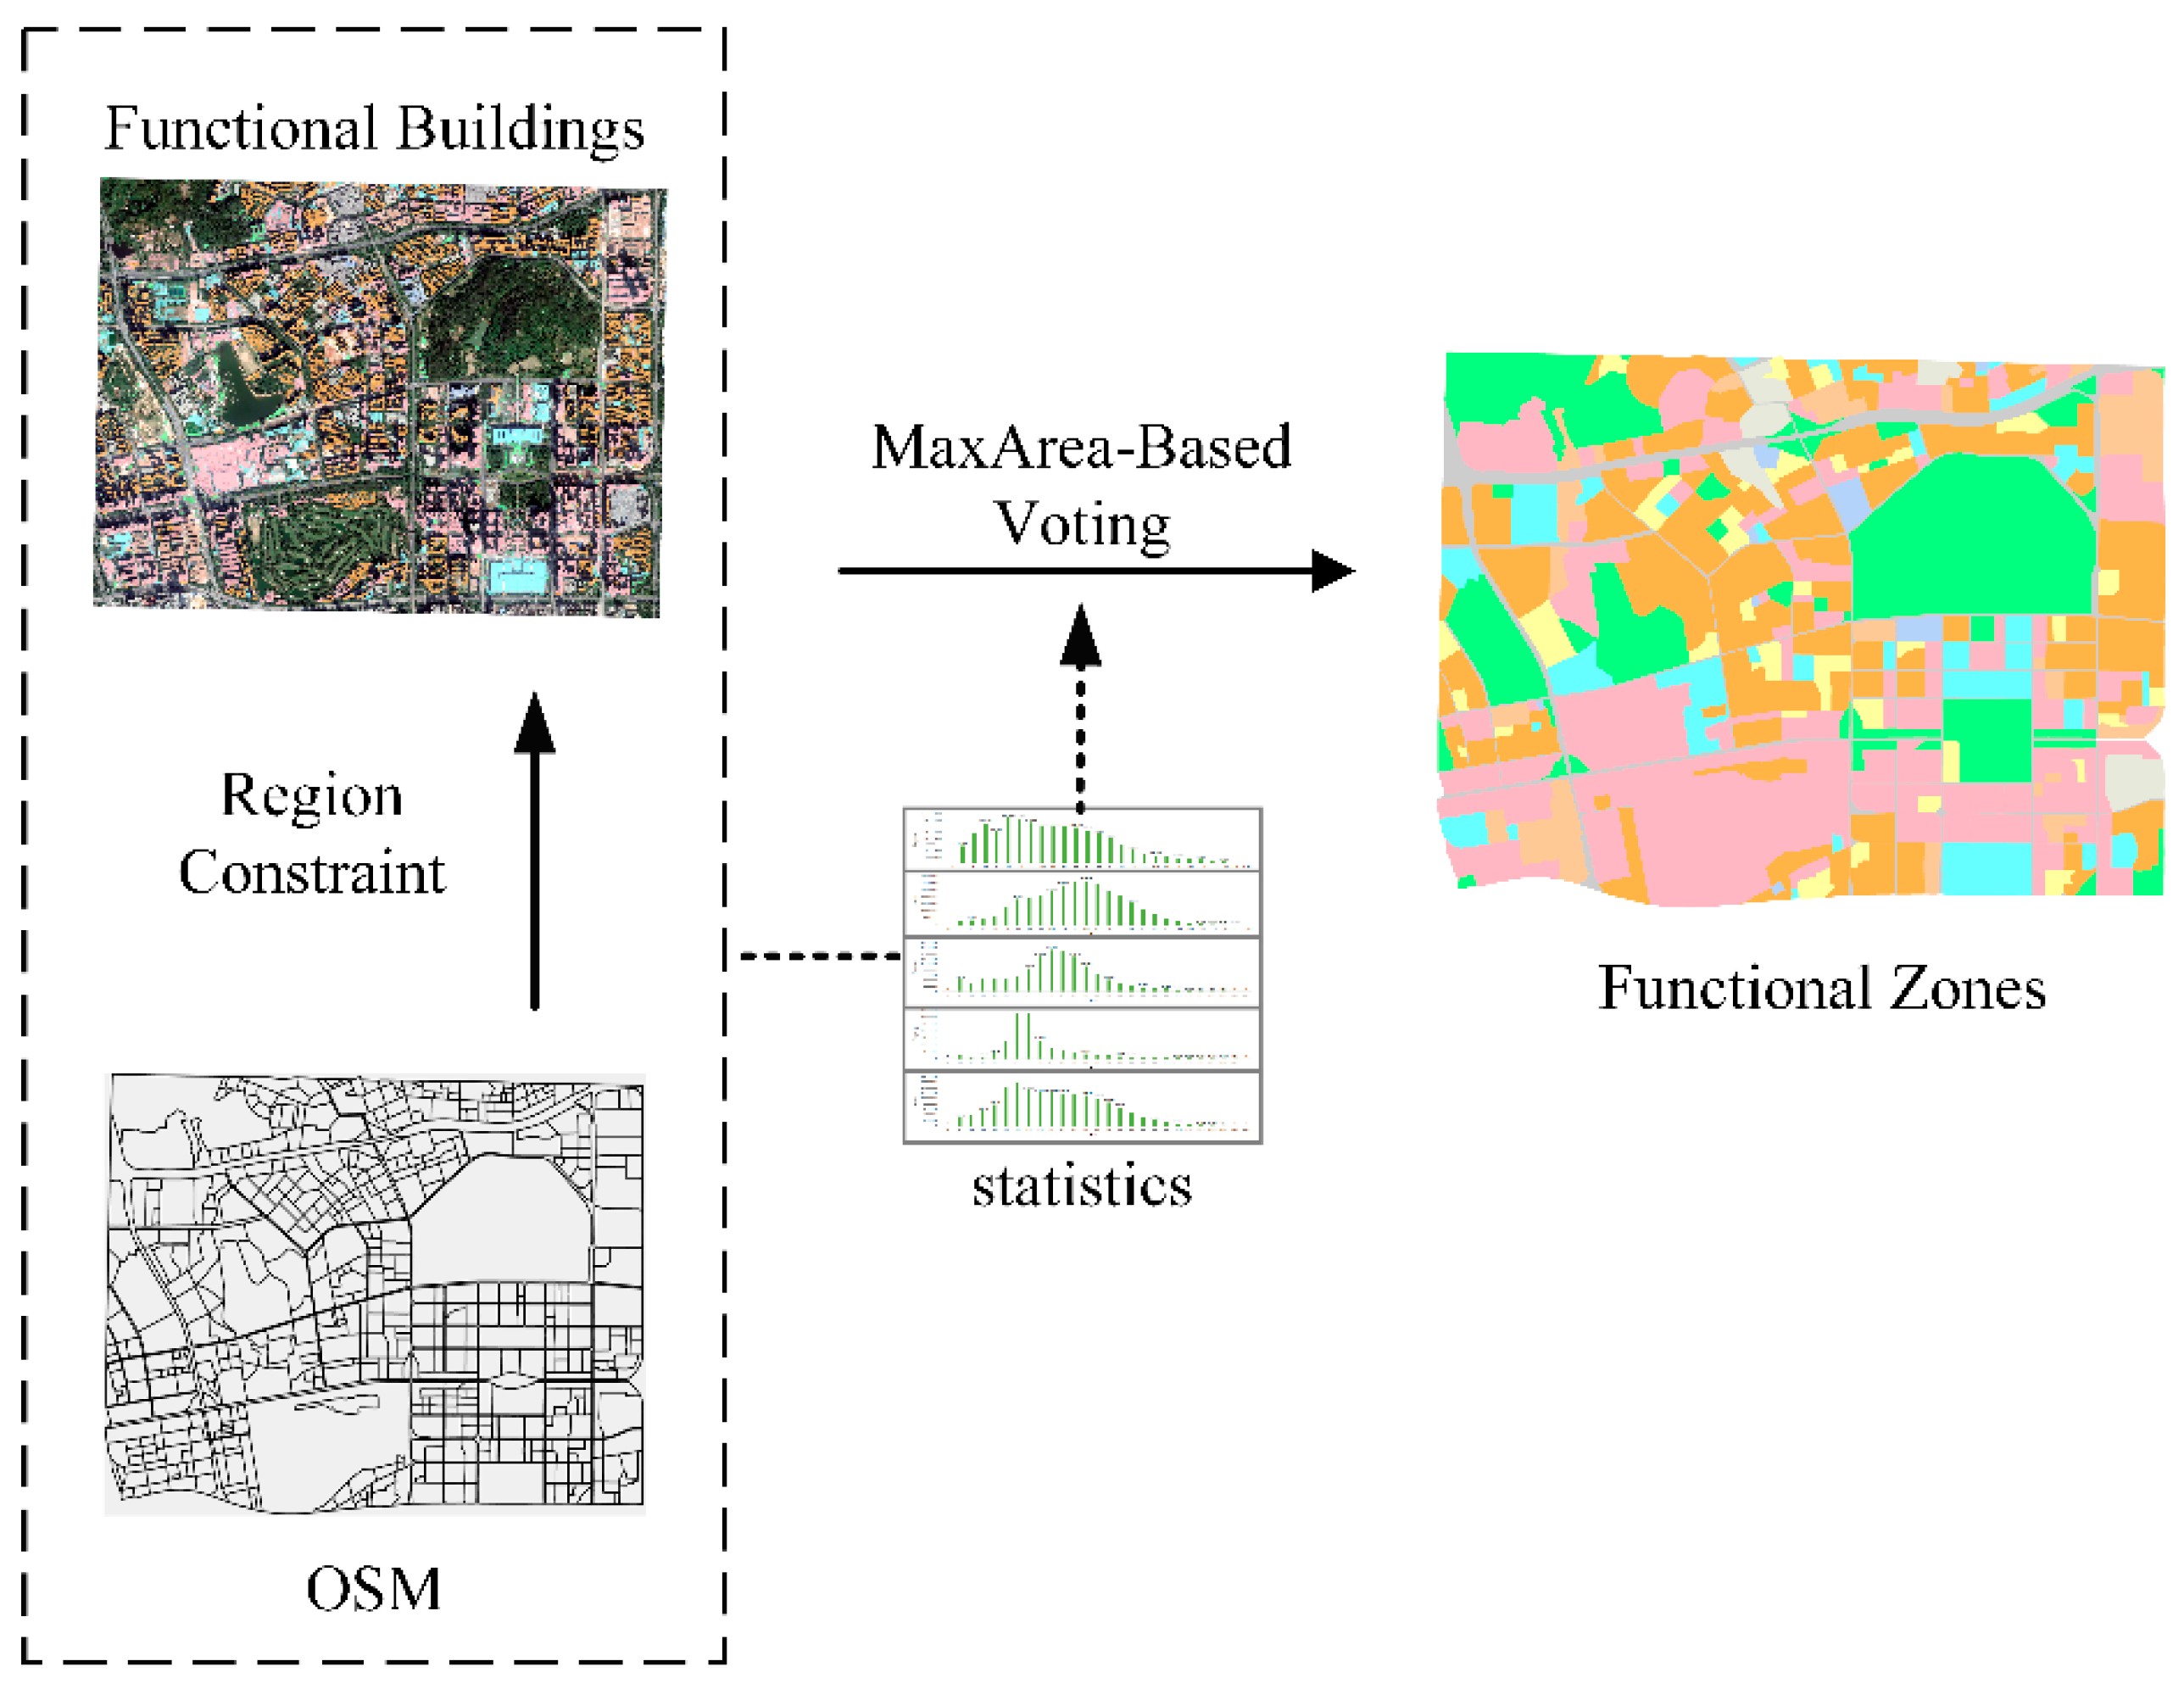
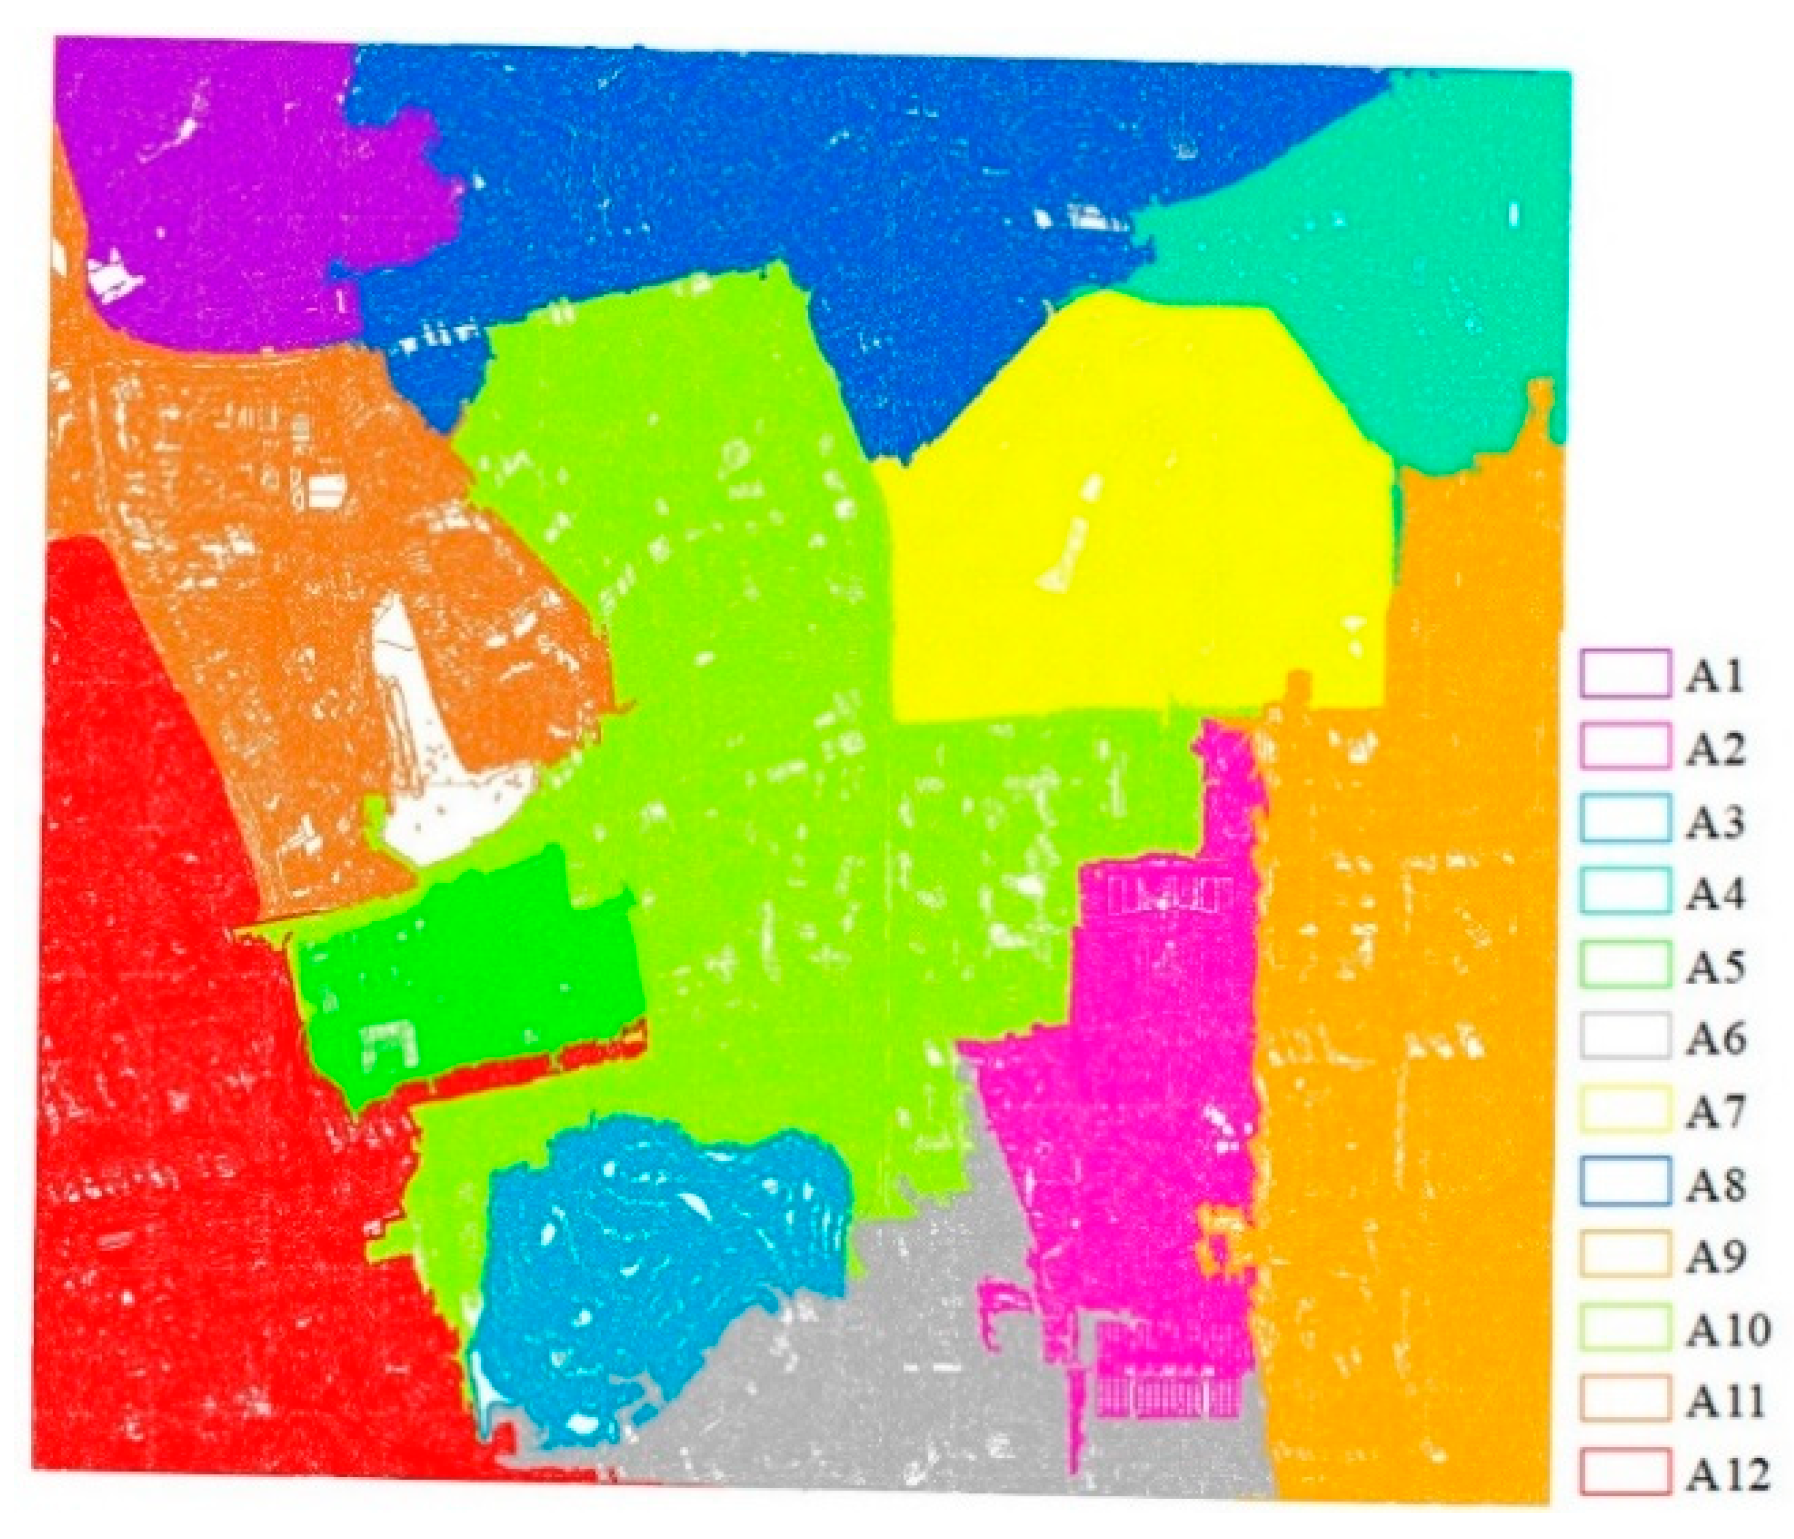
2.3. Maximum Area-Based Urban Functional Zone Recognition

Owing to buildings have multiple overlapping functions in a block, this paper adopts the method of maximum area. To be specific, we counted the building area of the same functional category in a block, then a functional building with a maximum area was selected to represent the main functional attributes of the zone. Based on this information, the map of the functional zones of the city is presented in this section.

3. Experiments and Results

The experiments were performed on an Ubuntu 16.04 operating system using a CPU (3.4 GHz core i7-6700), RAM (8 GB), and GPU (NVIDIA TITAN X 12 Gb GPU). TensorFlow1.7 was selected as the deep learning framework.

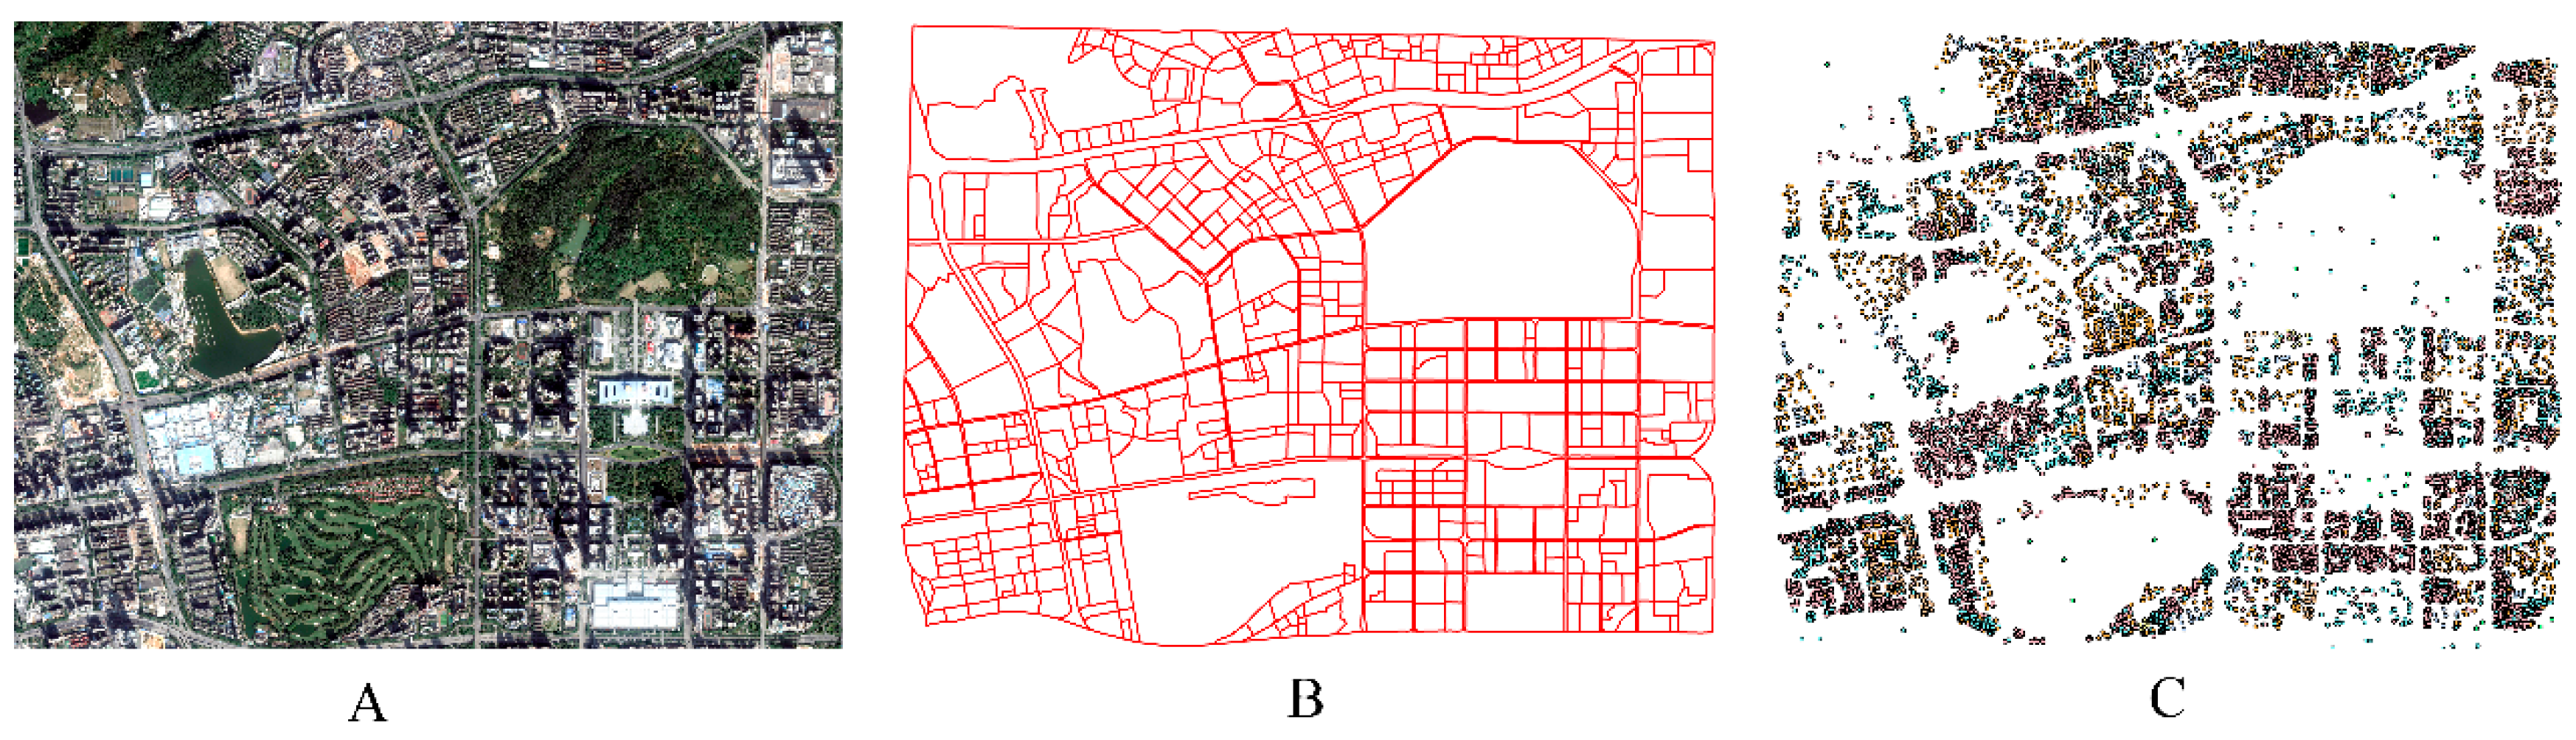
3.1. Study Area and Data Sets

This study focuses on urban functional zones, and the central city of Shenzhen (26.8 km2) was selected as the research area (Figure 7). Shenzhen is one of China’s mega-economic centers and is an international city, and it is also China’s first fully urbanized city.
The urban building styles are different, and the functional zones are extremely complex and heterogeneous, which presents a huge challenge for the proposed method. Three types of data were used in this experiment, as outlined below.
Google Maps image data: The image was provided by worldview-3 satellite in June 2018, with a size of 19,726 × 15,111 pixels and a spatial resolution of 0.31 m. The image was used to extract geographic objects and their features and spatial patterns, and this information was then used for classifying land cover and recognizing functional zones.
Urban road network data: As shown in Figure 8, 3880 detailed urban road vectors obtained from OpenStreetMap (OSM) were used to generate 551 blocks. After geometric correction, the urban road network was matched with the image.
POI data: 33,755 POIs acquired from Amap were divided into seven categories according to social function attributes, that is, commercial services, public services, residential quarters, factory industries, schools, hospitals, and urban green, as shown in Figure 8.

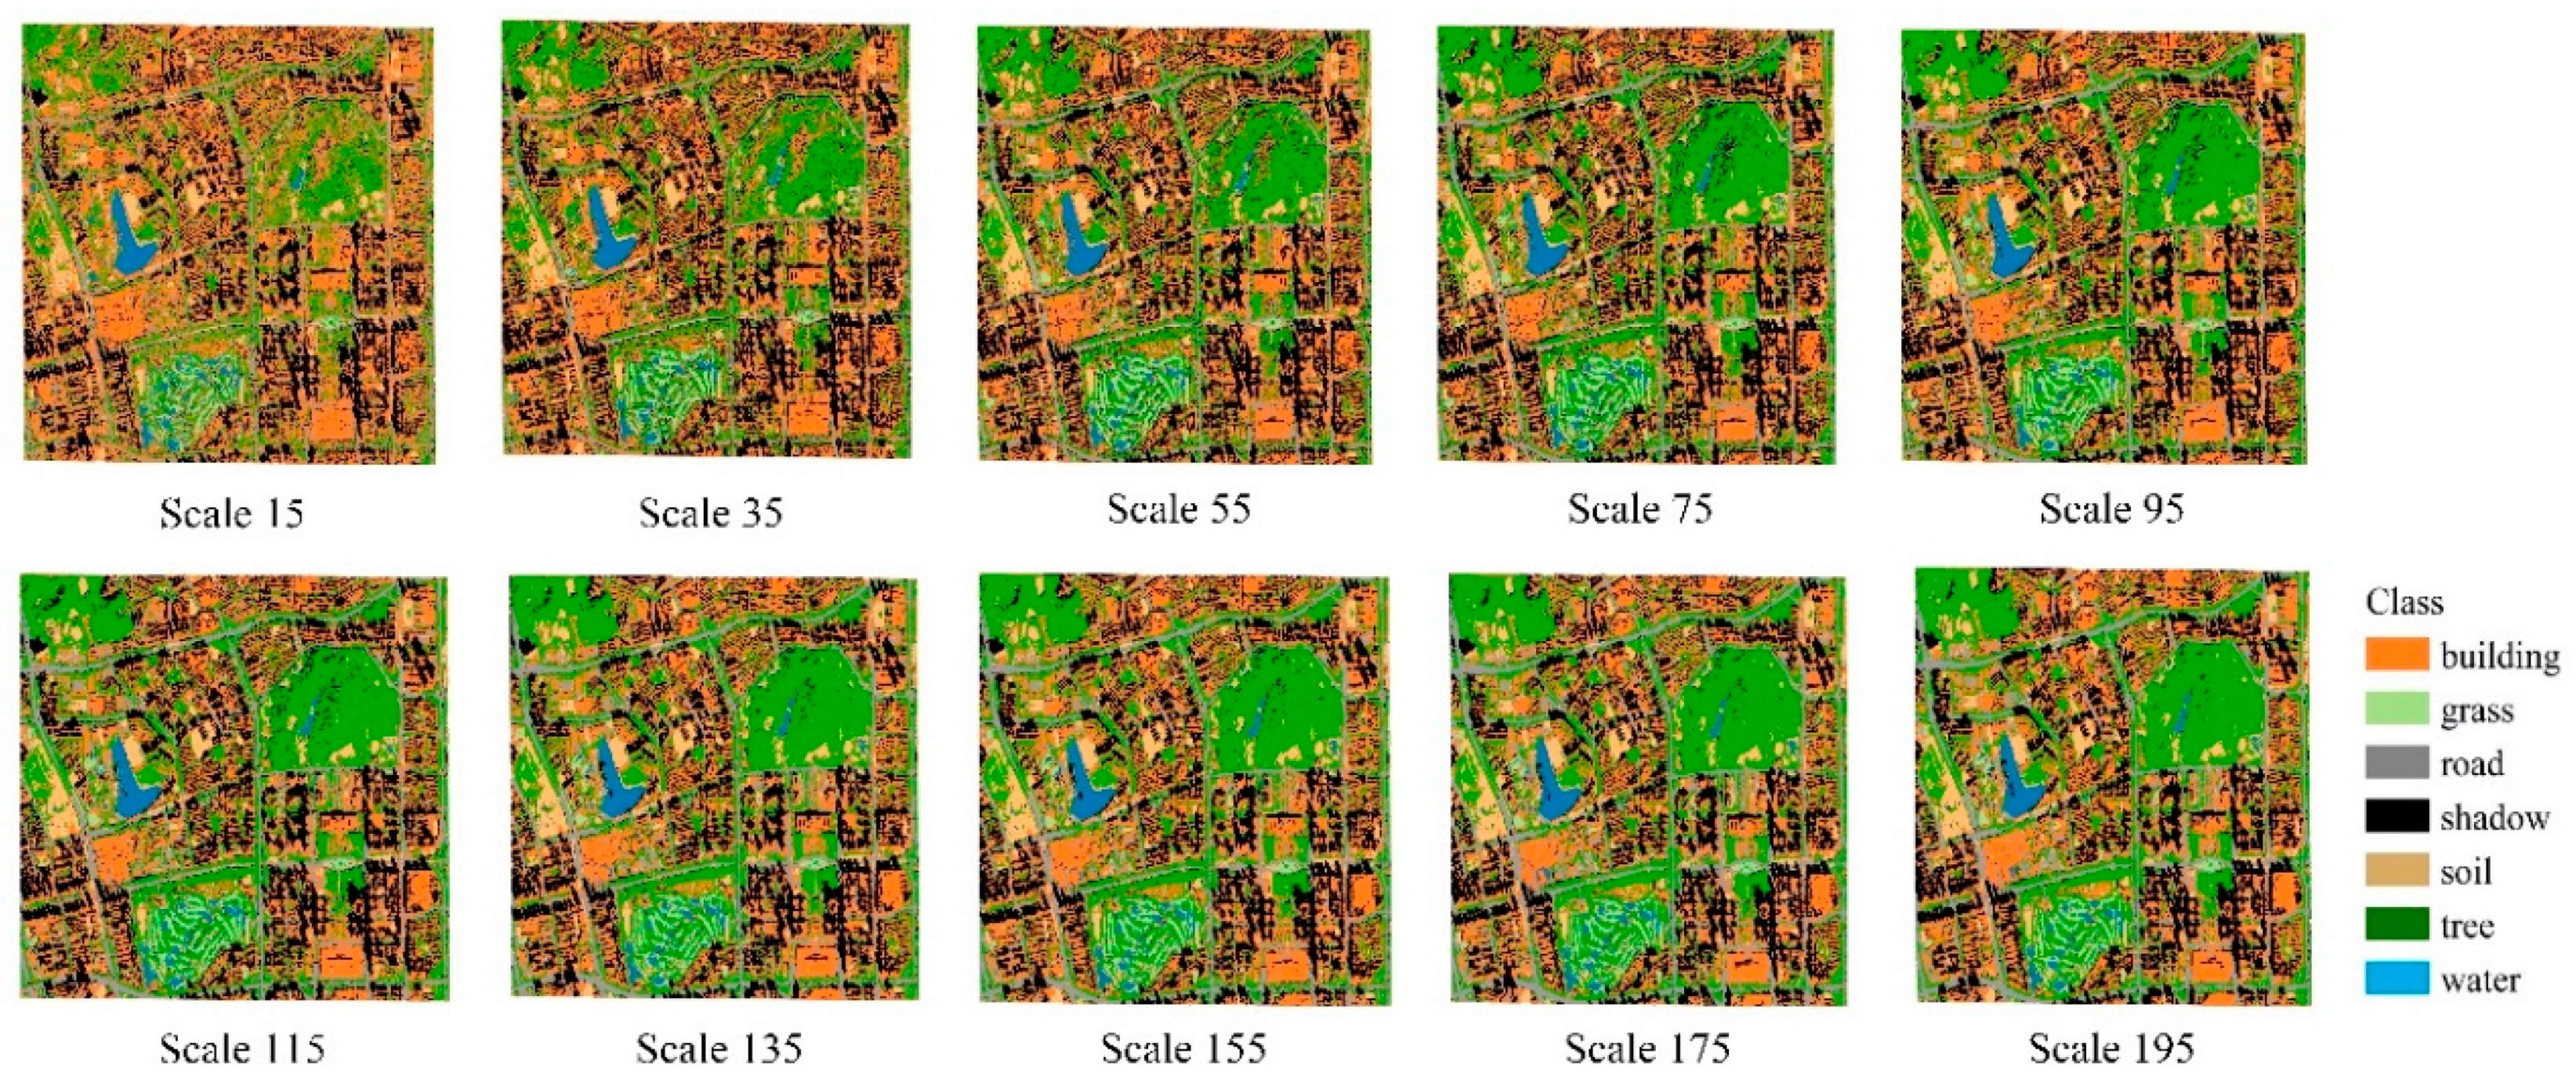
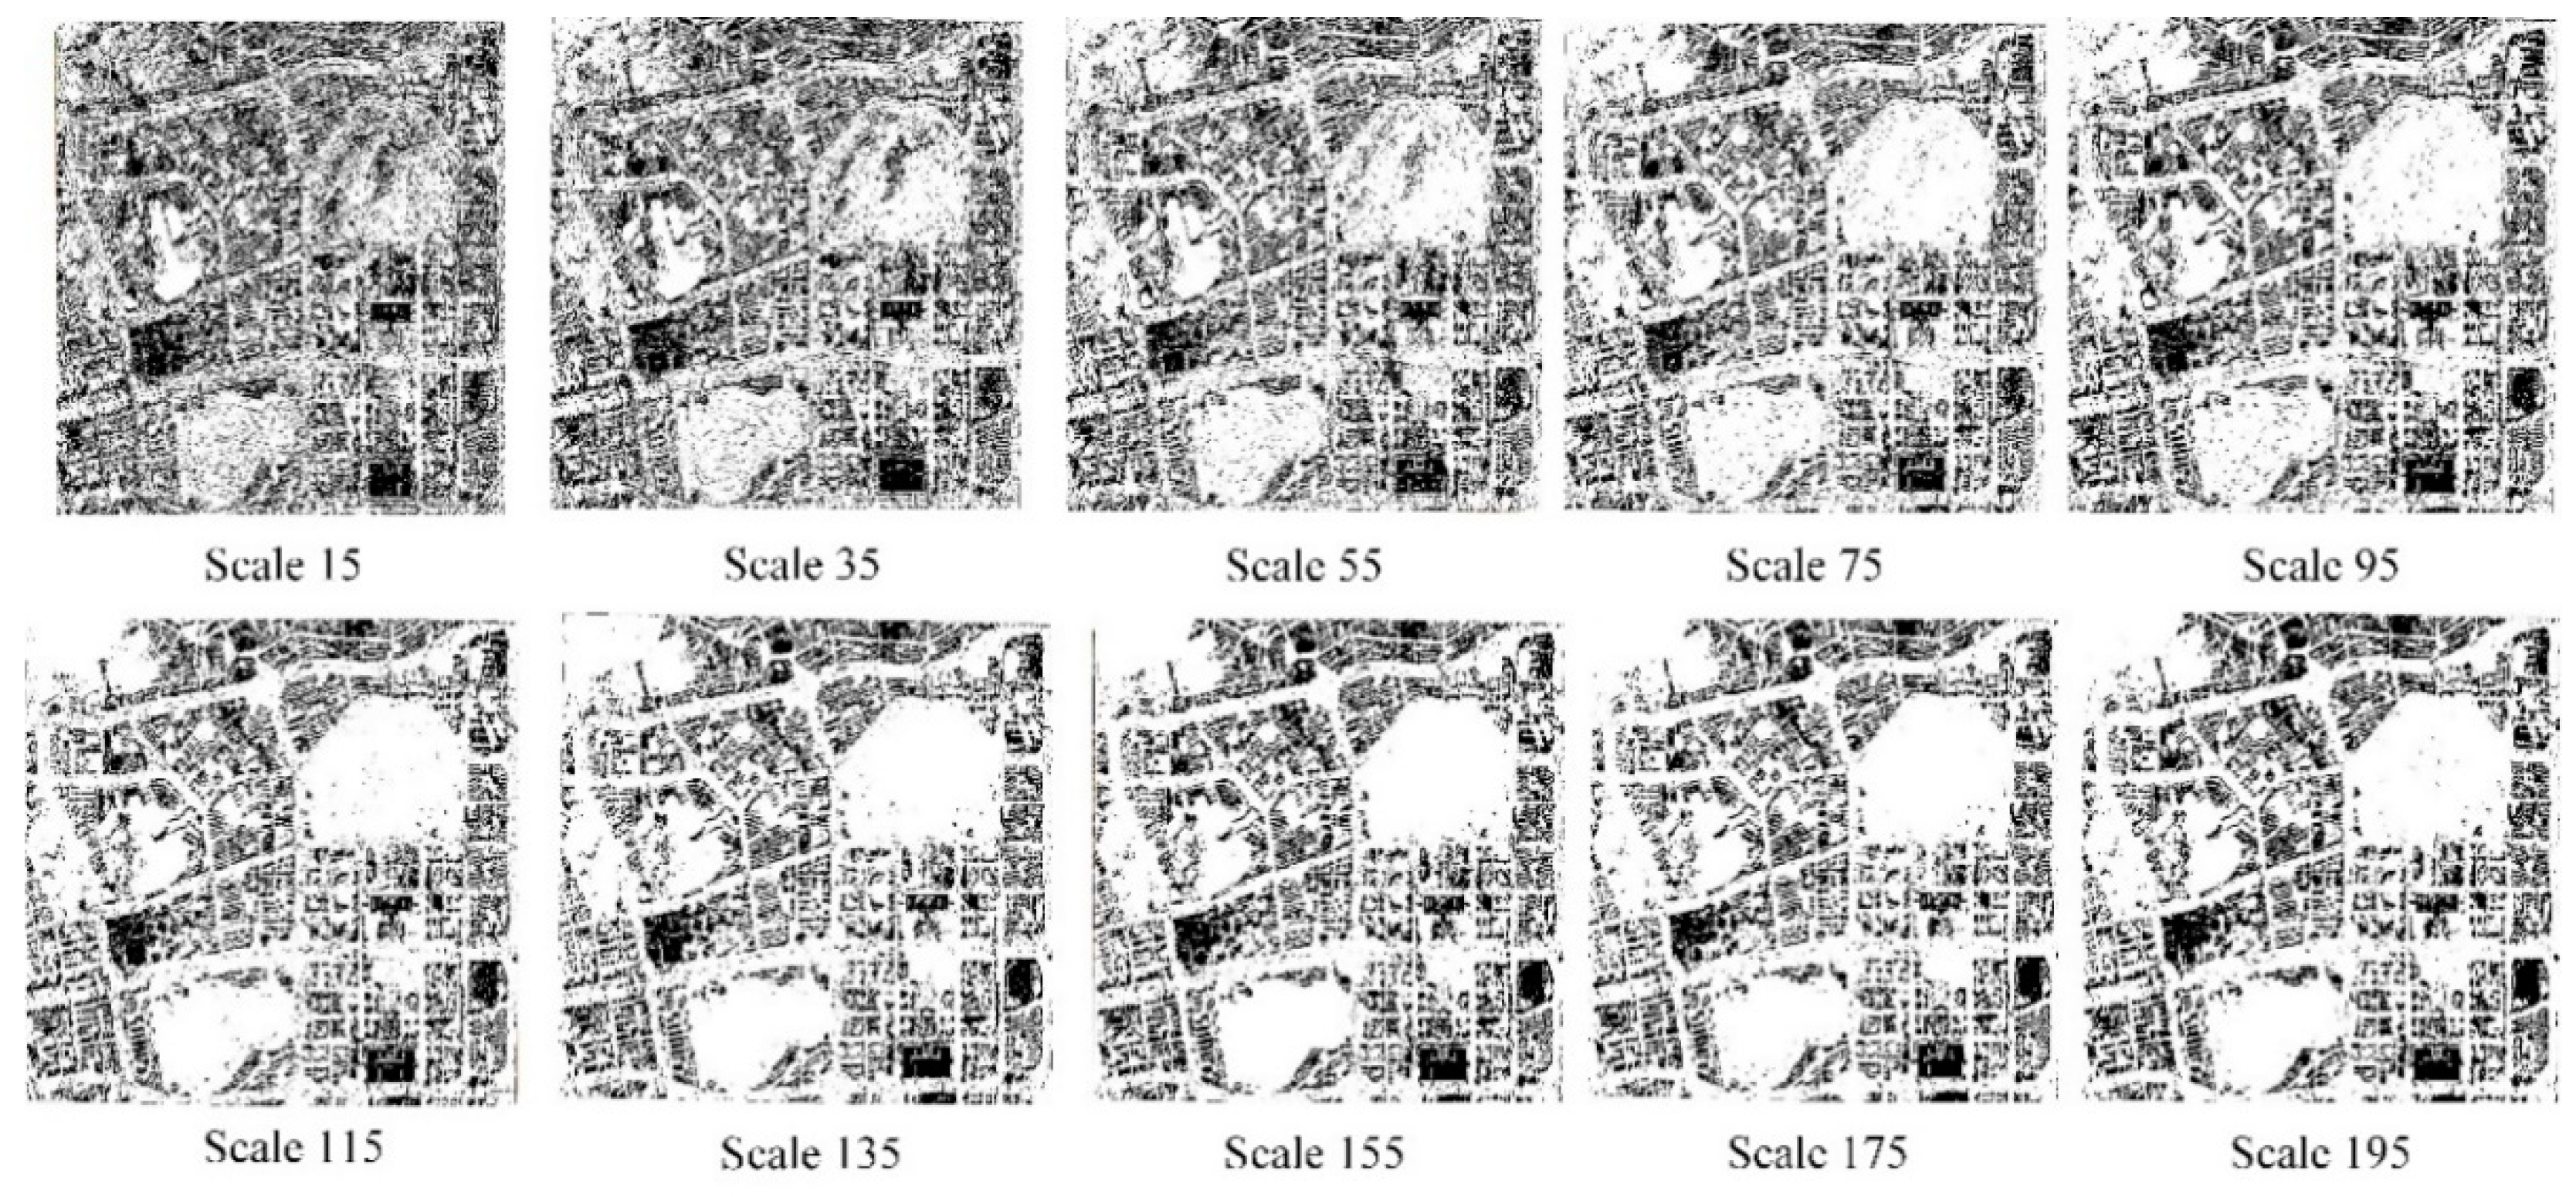
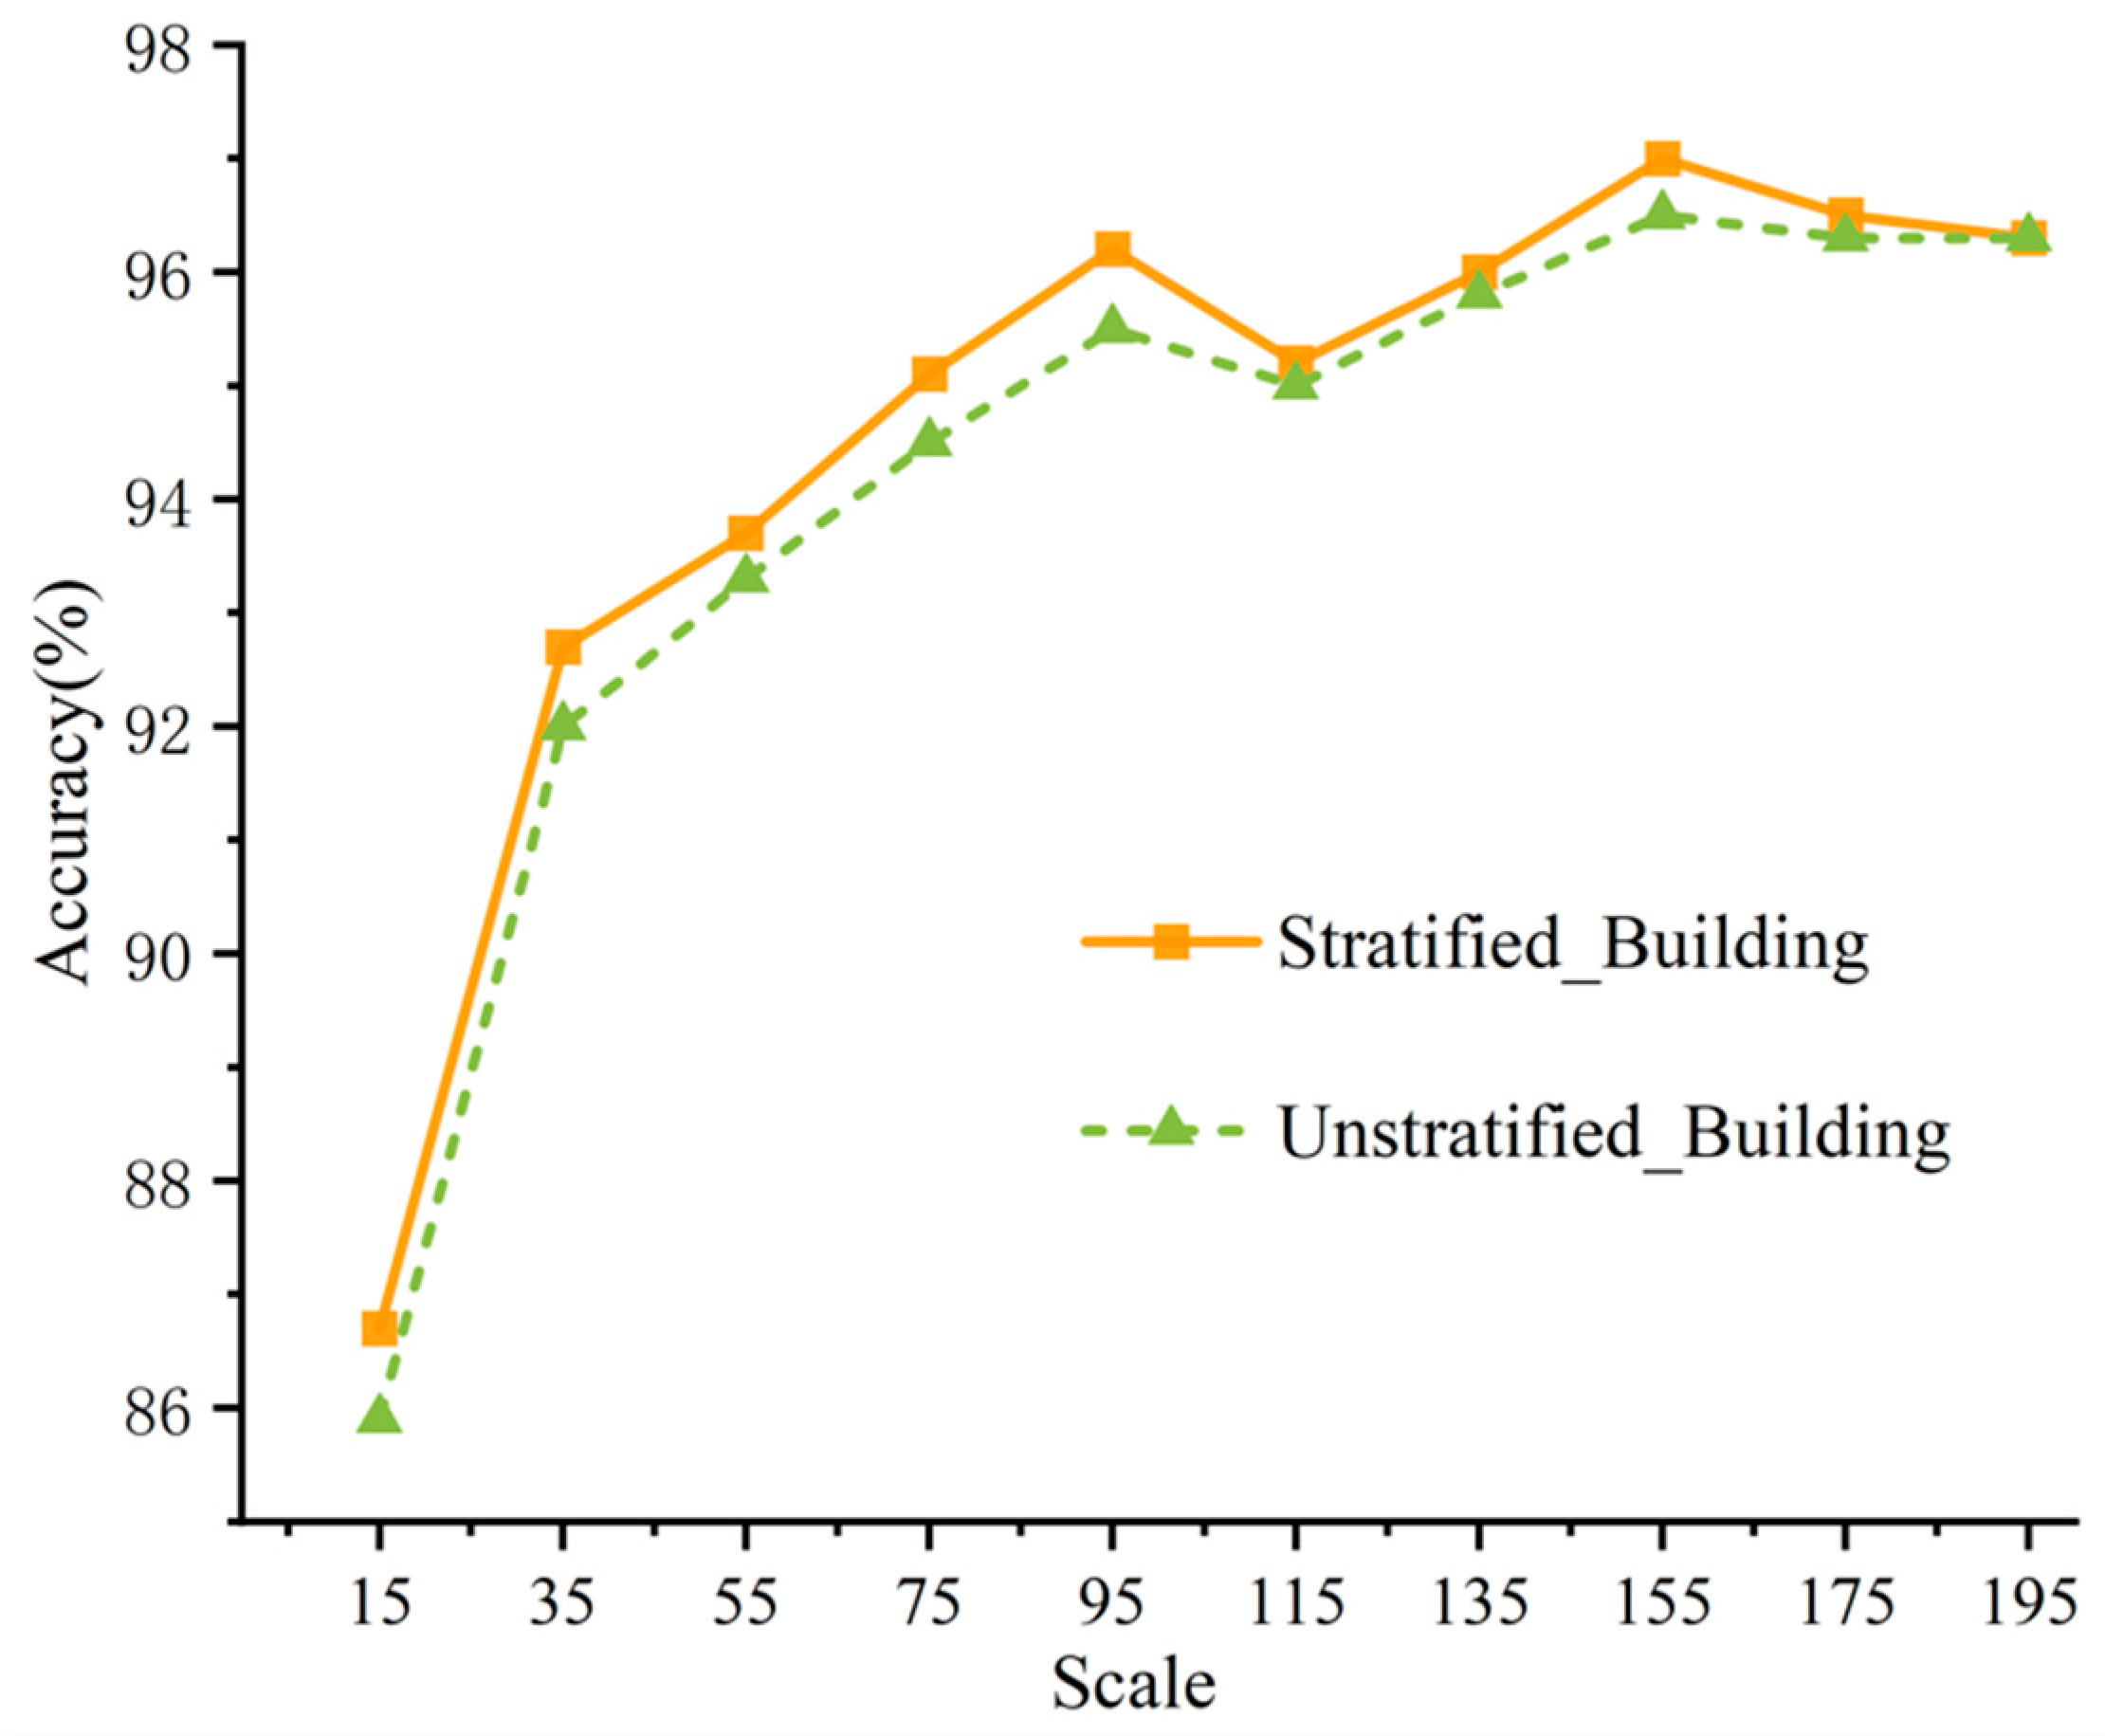
3.2. Results of the Stratified Scale Estimation

According to the strategy of stratified scale estimation based on normalized GLCM, the VHSRI was continuously fine-tuned with segmentation parameters by experience, and Shenzhen’s urban area was divided into 12 areas. Then, spatial scale estimation was performed on each region; the estimates of h s and h r are shown in Figure 9 and Figure 10. Moreover, taking mean-shift segmentation as an example, Table 1 outlines the local segmentation image estimation parameters, and the results of the stratified scale estimation are shown in Figure 11.

3.3. DFCNN-based Physical Semantic Recognition of Buildings

3.3.1. Samples for Training and Testing

Labeled samples are crucial in the training of DFCNN models, which can be divided into training data and validation data. Training data are used to train DFCNN weights and biases, while validation data are used to optimize hyper-parameters and to evaluate the overfitting phenomenon of DFCNN after training.
In this experiment, a label sample was composed of square patches and a land-cover class with each central patch pixel. The study area was divided into seven land-cover categories according to their characteristics, namely, building, road, tree, grassland, water, shadow, and bare land. The samples of each category were selected by manual visual interpretation separately. This not only considers all of the categories in the image but also ensures that the number of samples in each category is appropriate and accurate, so that different categories can be randomly and uniquely fused.
To enhance the robustness of the CNN, 80% were randomly selected as labeled samples. These labeled samples were then randomly divided into a training data set (80%) and a validation data set (20%). The labels of the samples were treated as true values, and were used to calculate the difference between the predicted value and the true value. The actual figures of the samples used for training and verification are listed in Table 2.

3.3.2. Parameter Setting for DFCNN

Before training the DFCNN network, some parameters needed to be preset. The number of input image channels was four, which was determined by the fusion of the remote sensing images and the deep edge feature map. The learning rate that controls the progress of the learning model was 0.01, which was derived from a large number of training results. When a complete data set is passed through a neural network and returned once, this process is called an epoch. According to empirical evidence, the number of epochs was set to 100, which can meet the training accuracy and improve the training speed of the model. Due to the large number of samples that cannot be passed through the neural network at one time, the data set needs to be divided into several batches with a size of 100, and the number of batches is the number of training data divided by the batch. To avoid overfitting of DFCNN, the drop-off rate was set to 0.5.

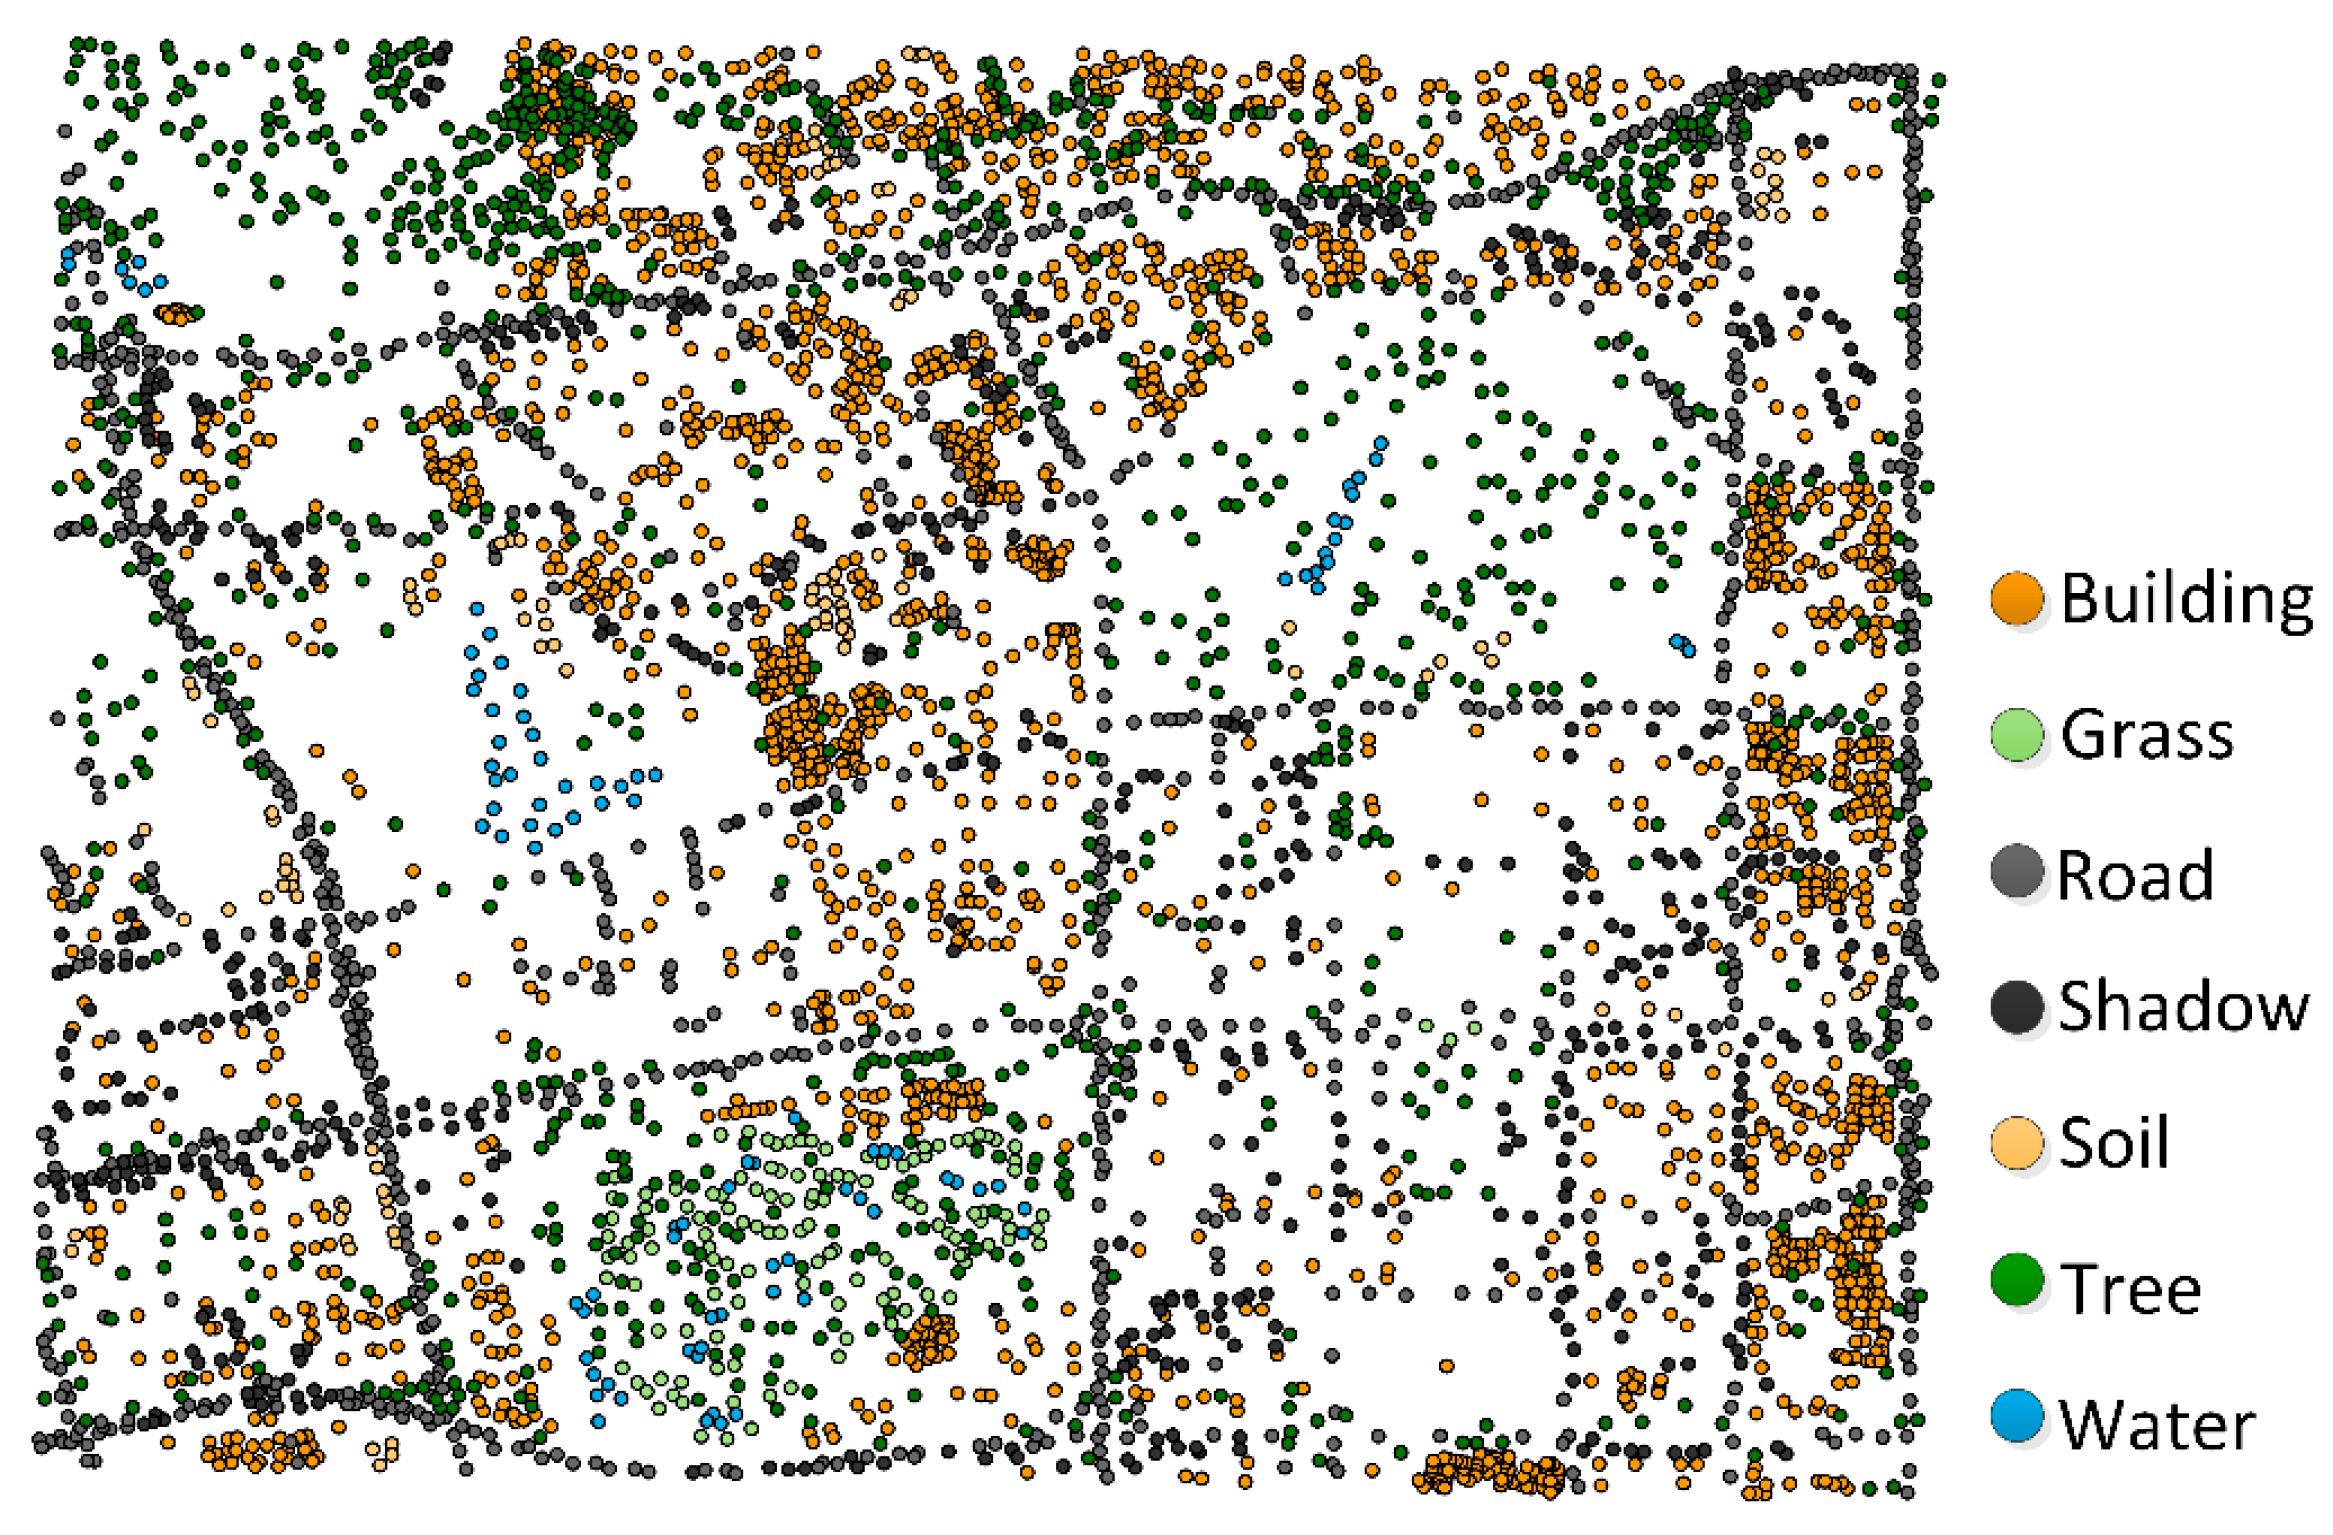
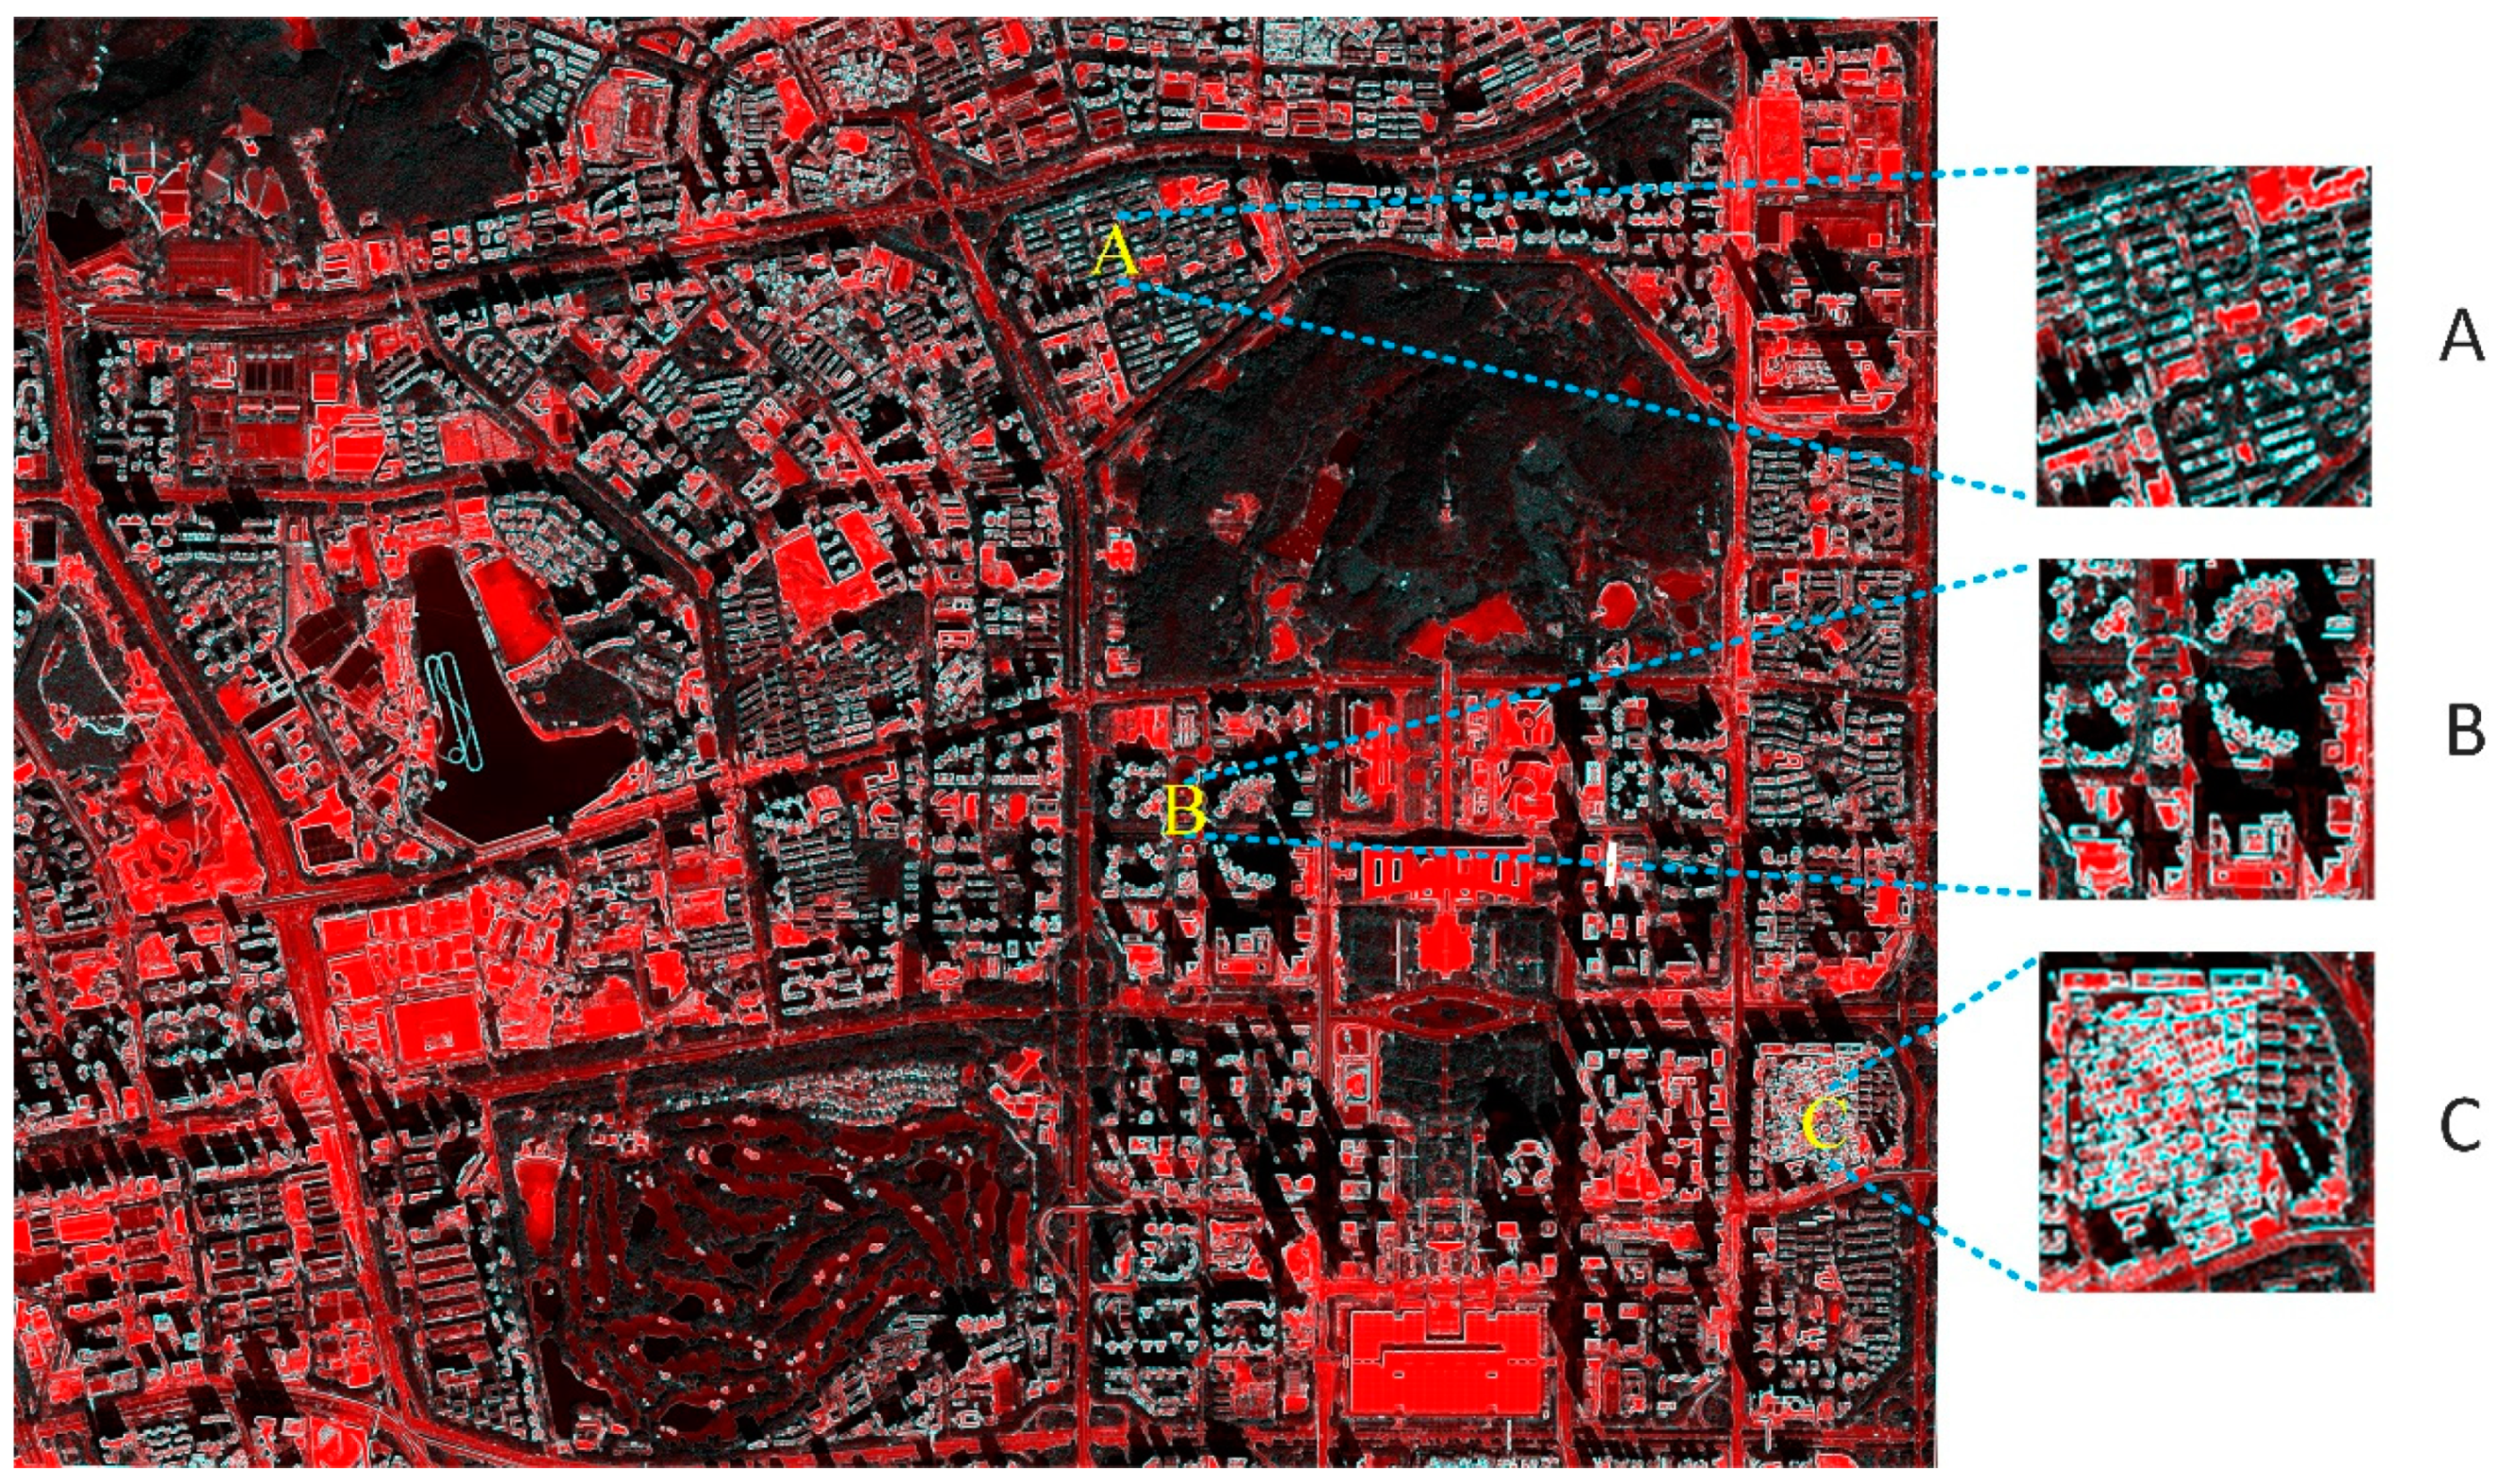
3.3.3. Ground Truth Validation Points

To reflect the classification of geographic objects accurately and to extract buildings appropriately, according to experience, the ratio of regular verification points to training sample points should be 4:1; thus, in this experiment, more than 5000 random ground truth verification points were generated separately, as shown in Table 3. These verification points are different from the verification data in Section 3.3.1, and they were used to evaluate the accuracy of the final classification results. Finally, the confounding matrix was introduced to compare the ground truth verification points with the classification results. Figure 12 illustrates the distribution of the ground truth verification points.

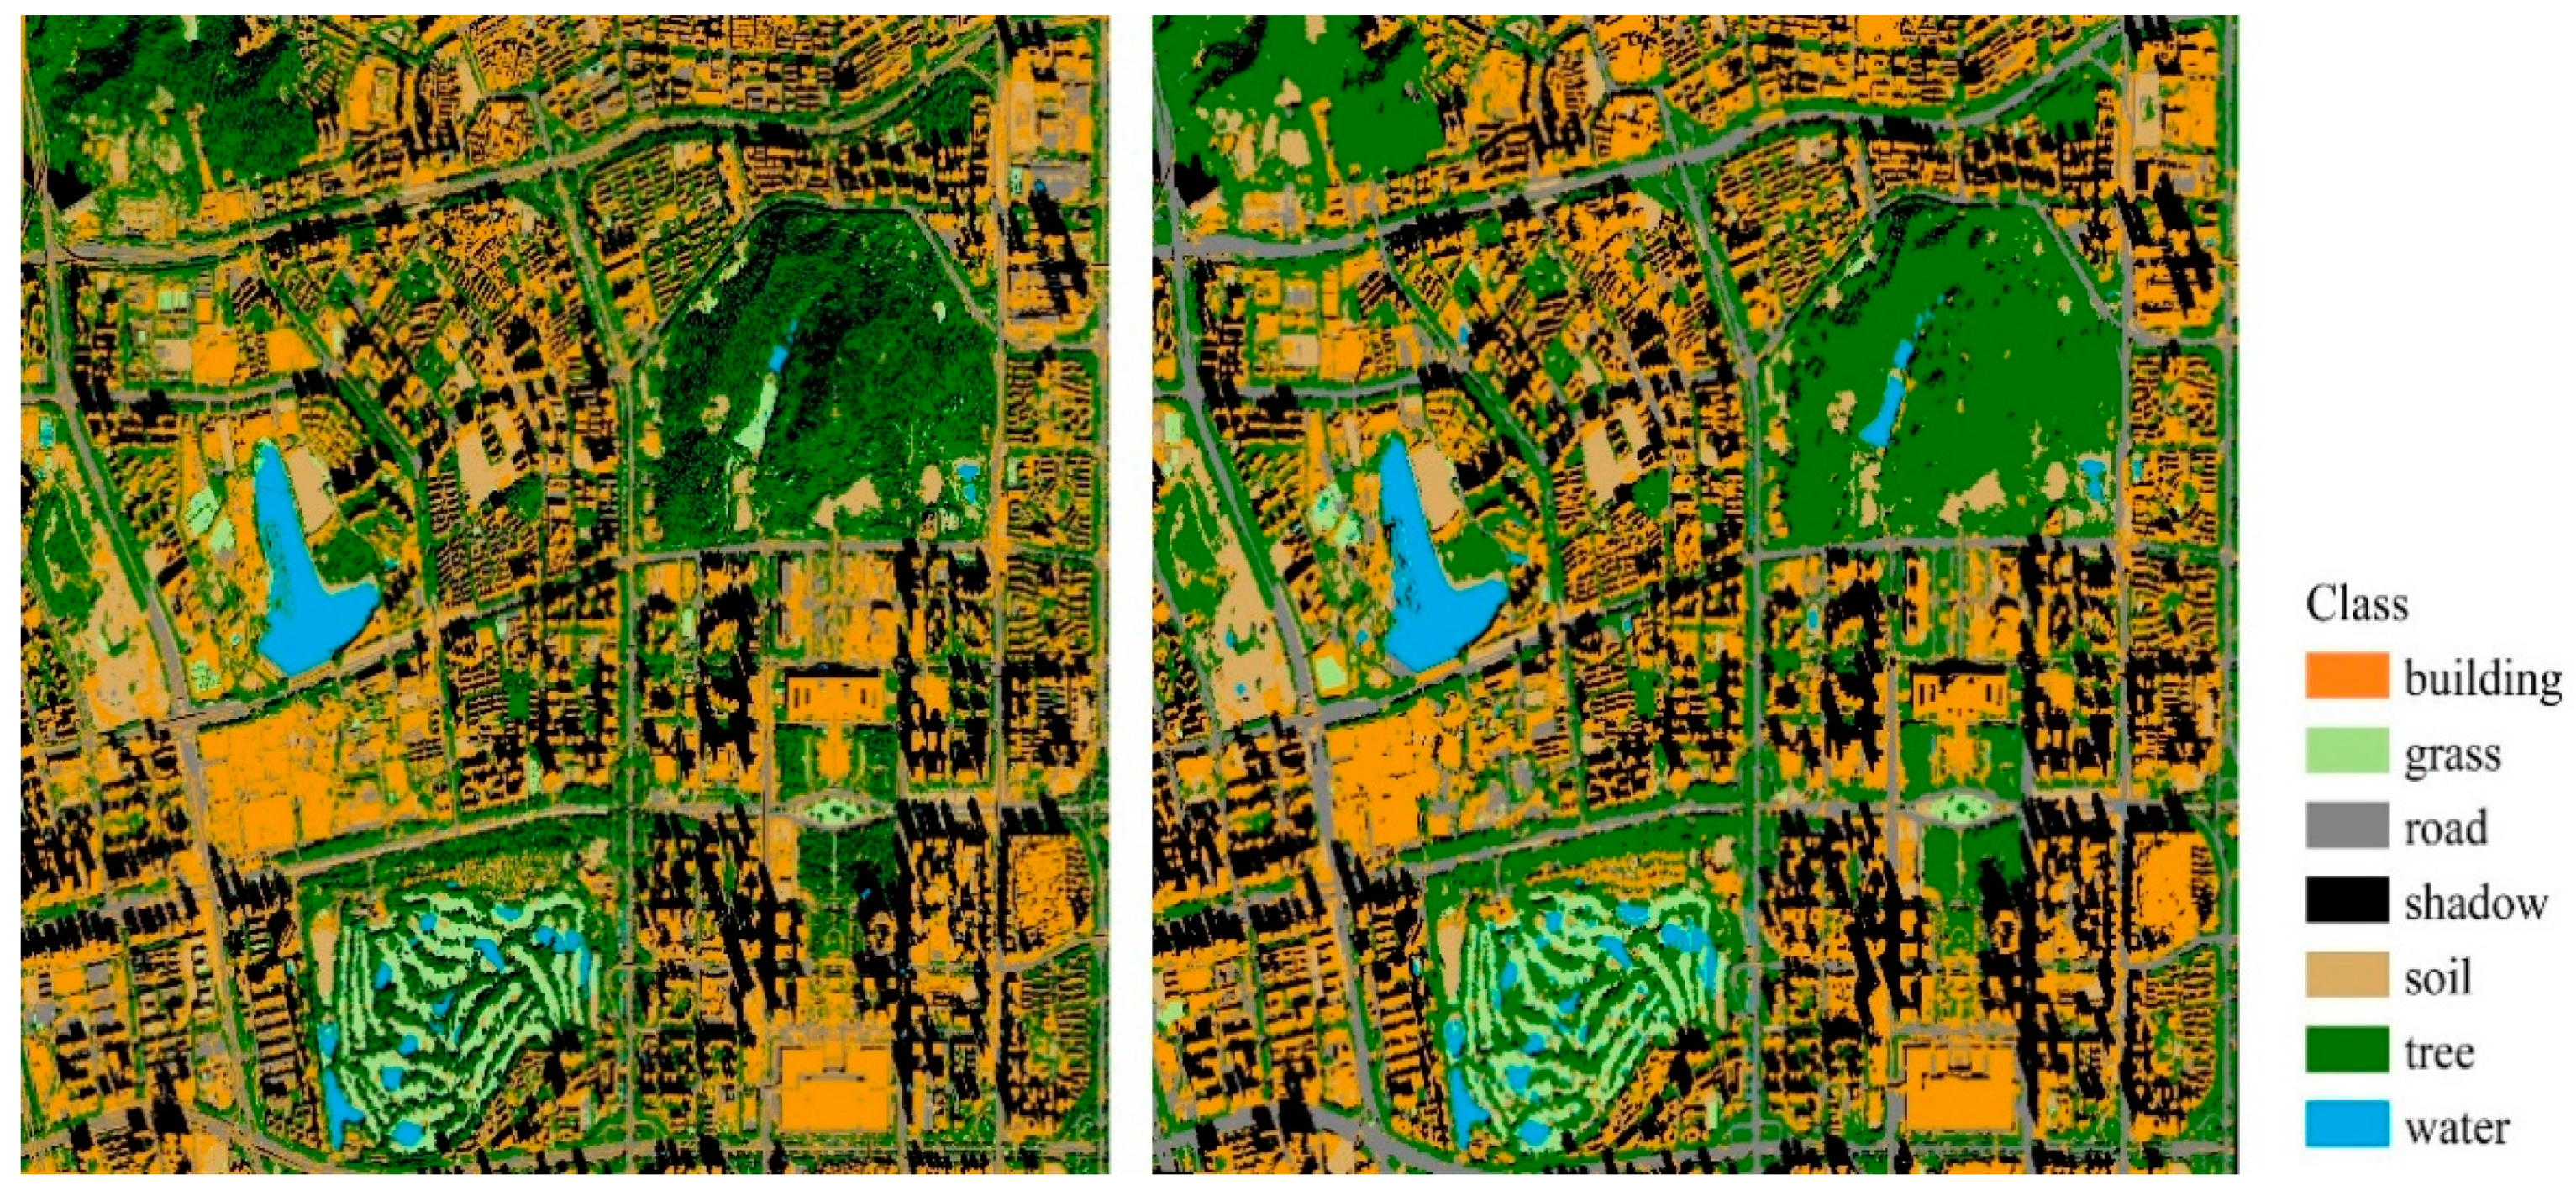
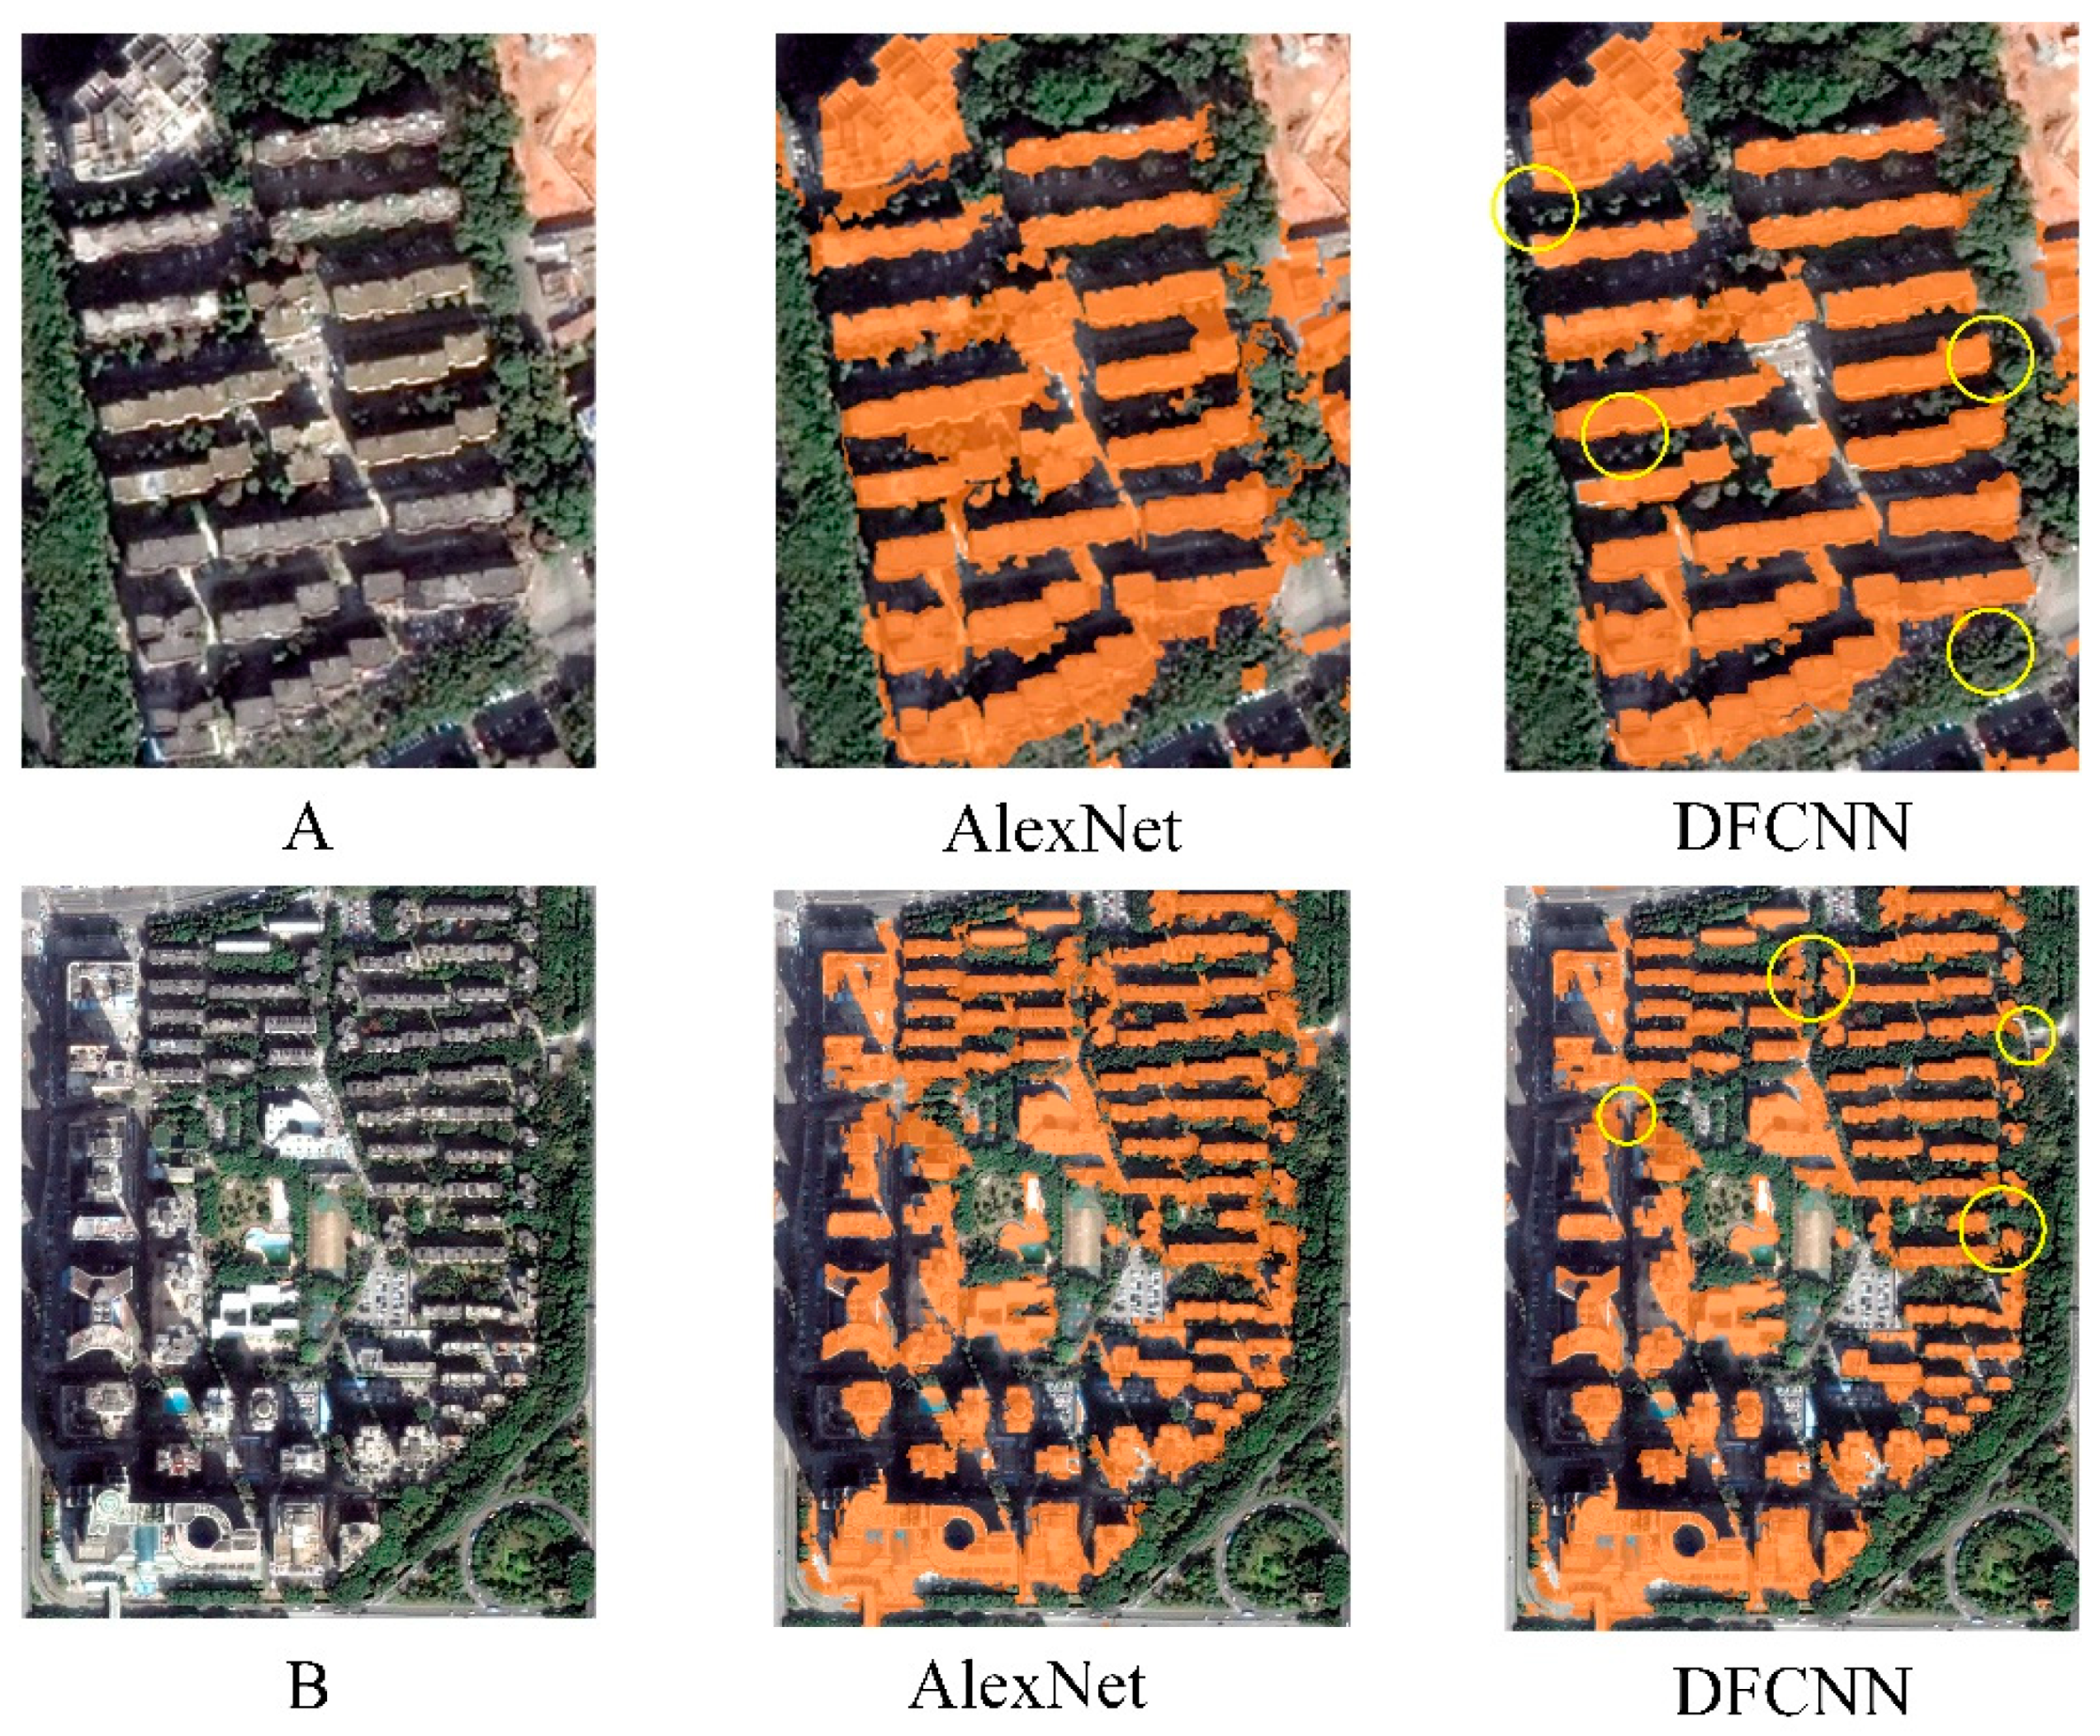
3.3.4. Results of the Building Extraction

The recognition of urban buildings based on physical semantics is a significant prerequisite for the recognition of urban functional zones. The results of the building extraction are shown in this section.
The scale effect is an inevitable and important issue in the VHSRI classification. The feature expression of the same training sample point varies with the size of the scale. The small scale contains more features of the object (spectrum, shape, texture, etc.), while the large scale focuses on the information of its surroundings (proximity, spatial distribution, etc.). Therefore, we considered the scale effect accordingly and carried out multiple sets of experiments in this paper. The size of the training window, that is, the scale, was set to 15–195, and the value was taken every 20 intervals. The specific experimental results are discussed in Section 4.2.3, combining multiple single-scale and multi-scale features at the same time.
In the area, the same types were classified in to different categories and scattered, and the originally homogeneous patch was “broken”, looking like TV snowflakes. This phenomenon is called the “salt and pepper effect”. As shown in Figure 13 and Figure 14, especially for small-scale results, there are obvious salt and pepper effects (scale 15 and scale 35). With the increase in the scale, this phenomenon gradually weakens, and the classification accuracy of geographic objects and the accuracy of building extraction gradually increases, and then decreases. When the scale was 155, the recognition of building accuracy was the best, which was 97.0%. Figure 15 shows the overall accuracy of geographic objects classification and the recognition accuracy of buildings.

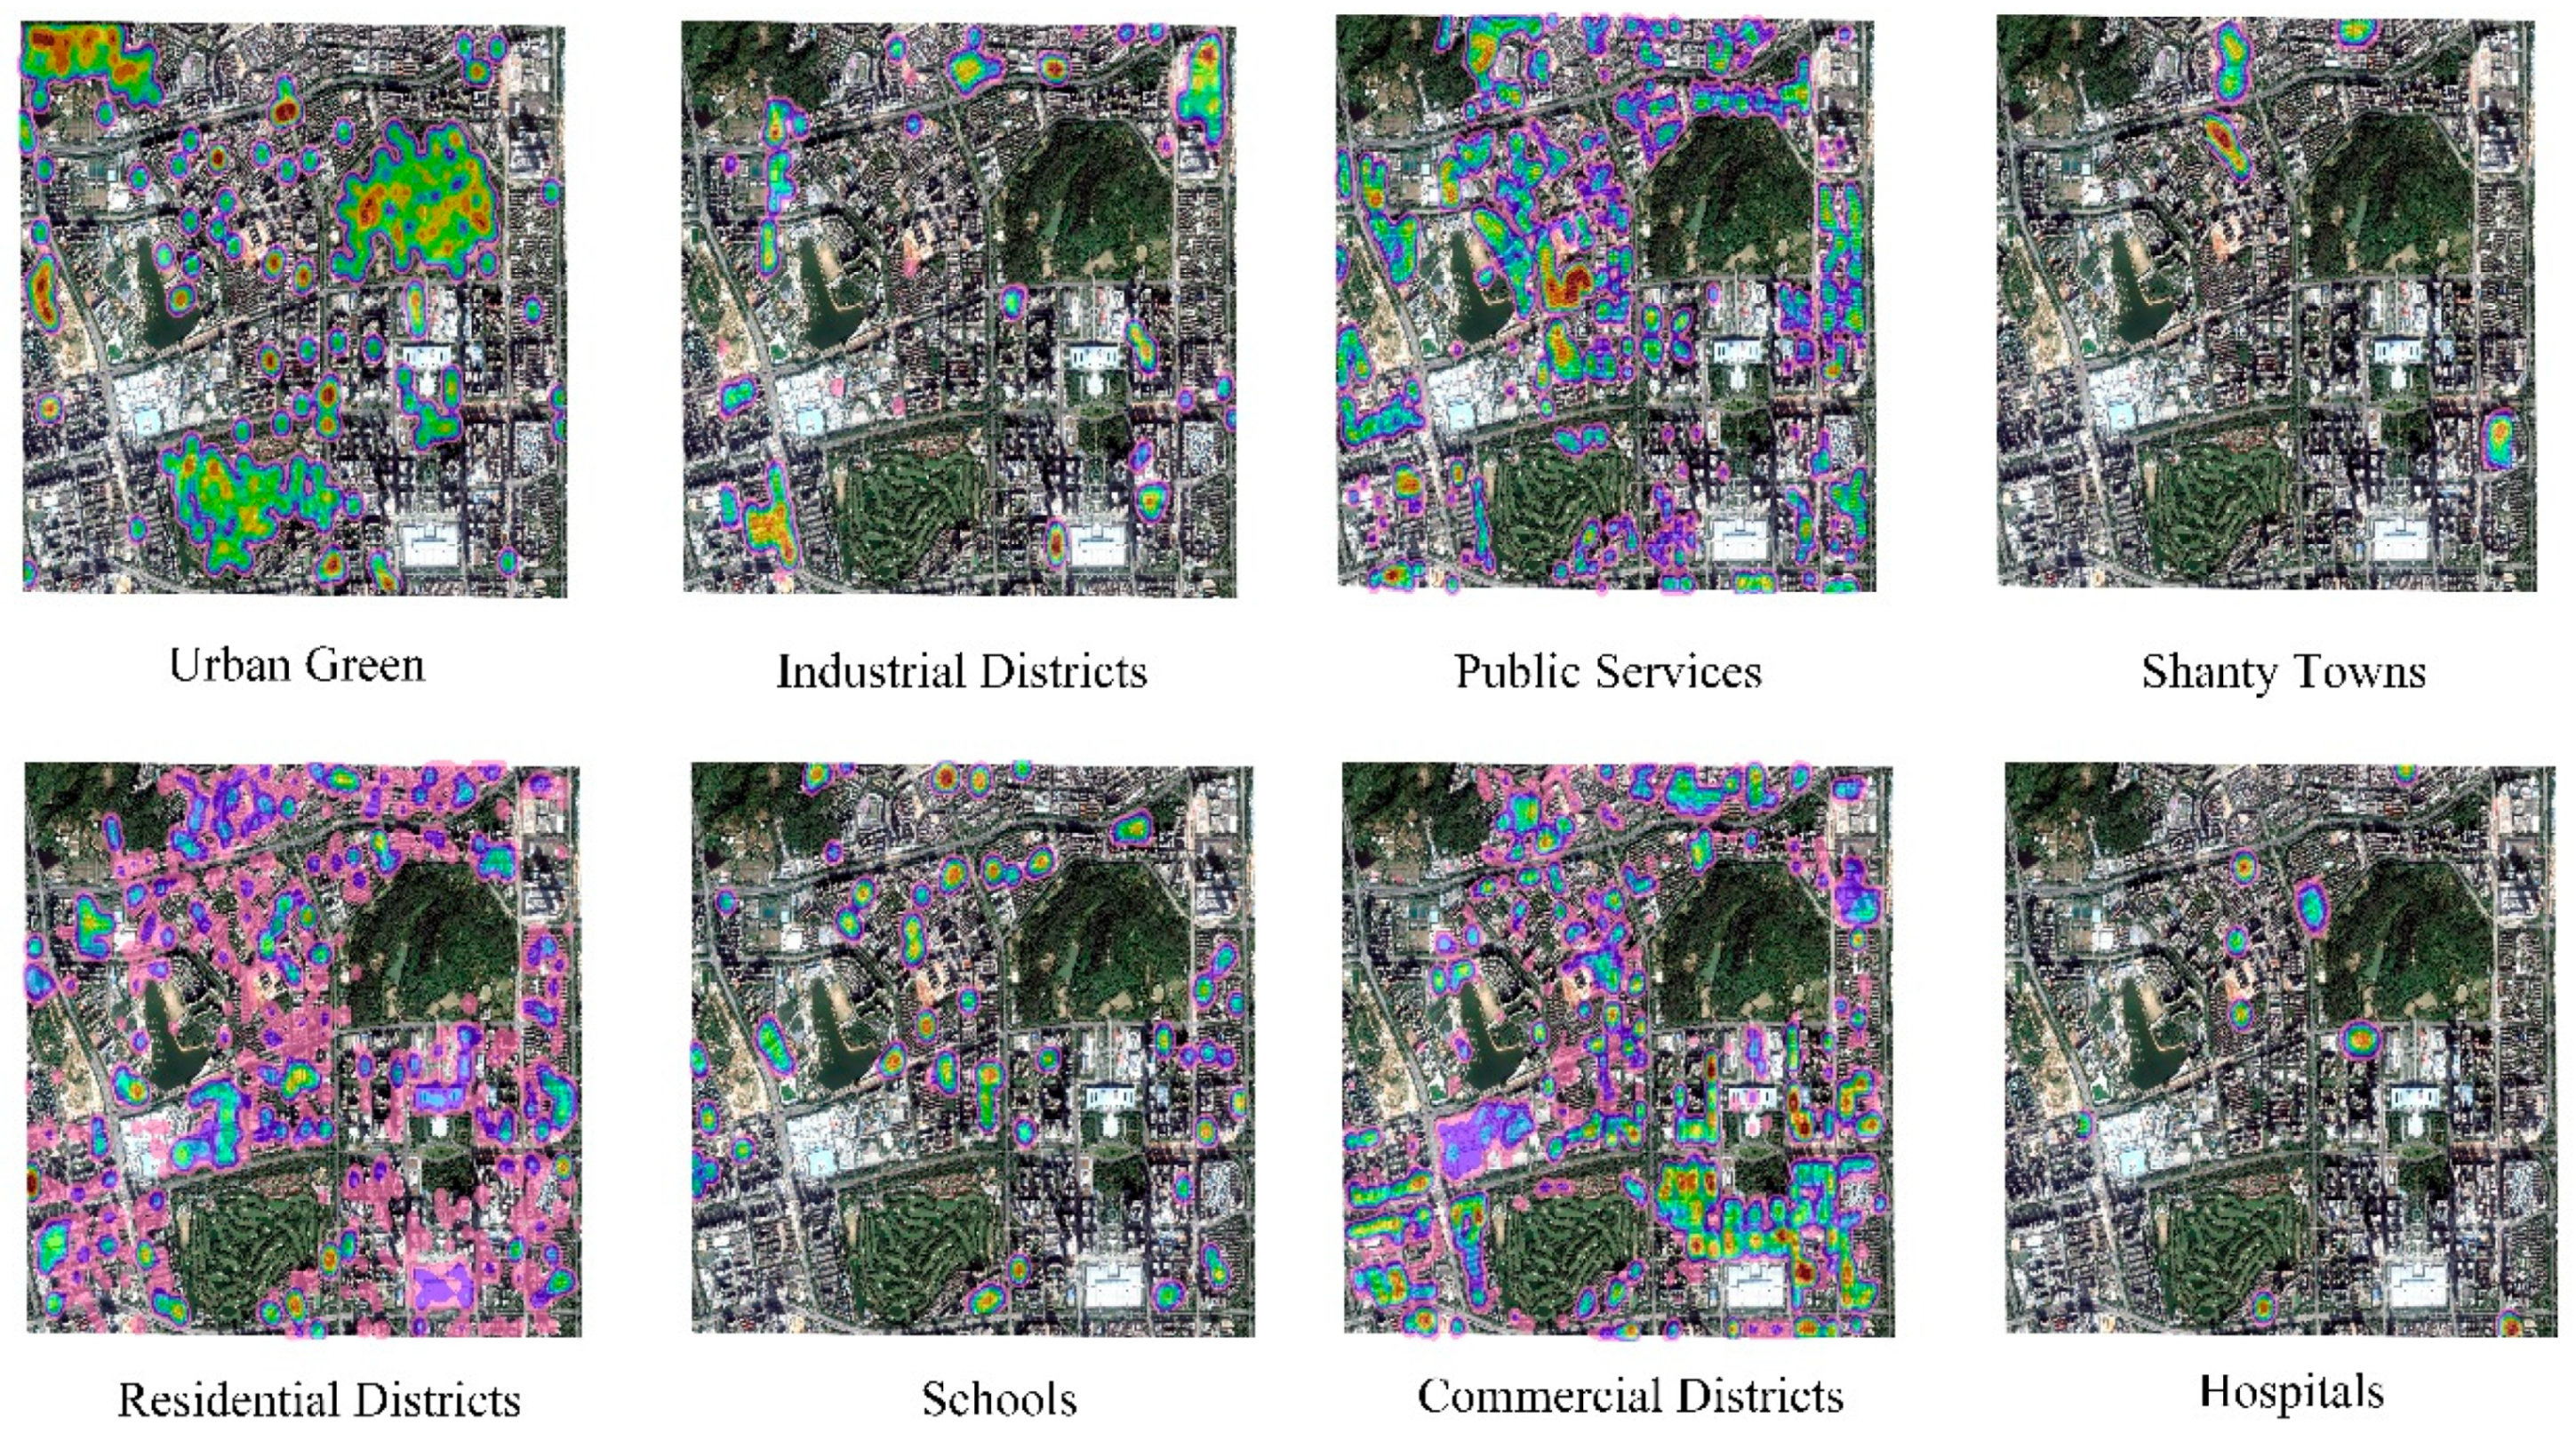
3.4. Social Functional Semantic Refinement for Buildings

Buildings with physical semantics were recognized and extracted in the previous stage. However, many buildings with similar appearances can also have different functions.
Figure 16 shows the kernel density analysis result of the POIs. According to the quality and quantity of POIs in different categories, the population field value and search radius were set. For example, the number of POIs in schools and hospitals was small. To obtain the appropriate functional radiation range of schools and hospitals, their weights and radii must be set larger. In this way, the commercial POIs can be set with a smaller weight and radius.
All kernel density images were integrated with the VSHRI, and the image with 11 channels was input into the DFCNN model for training. The buildings were mined for the social function semantic information under geographical constraints. Finally, the social attributes of the building were refined.

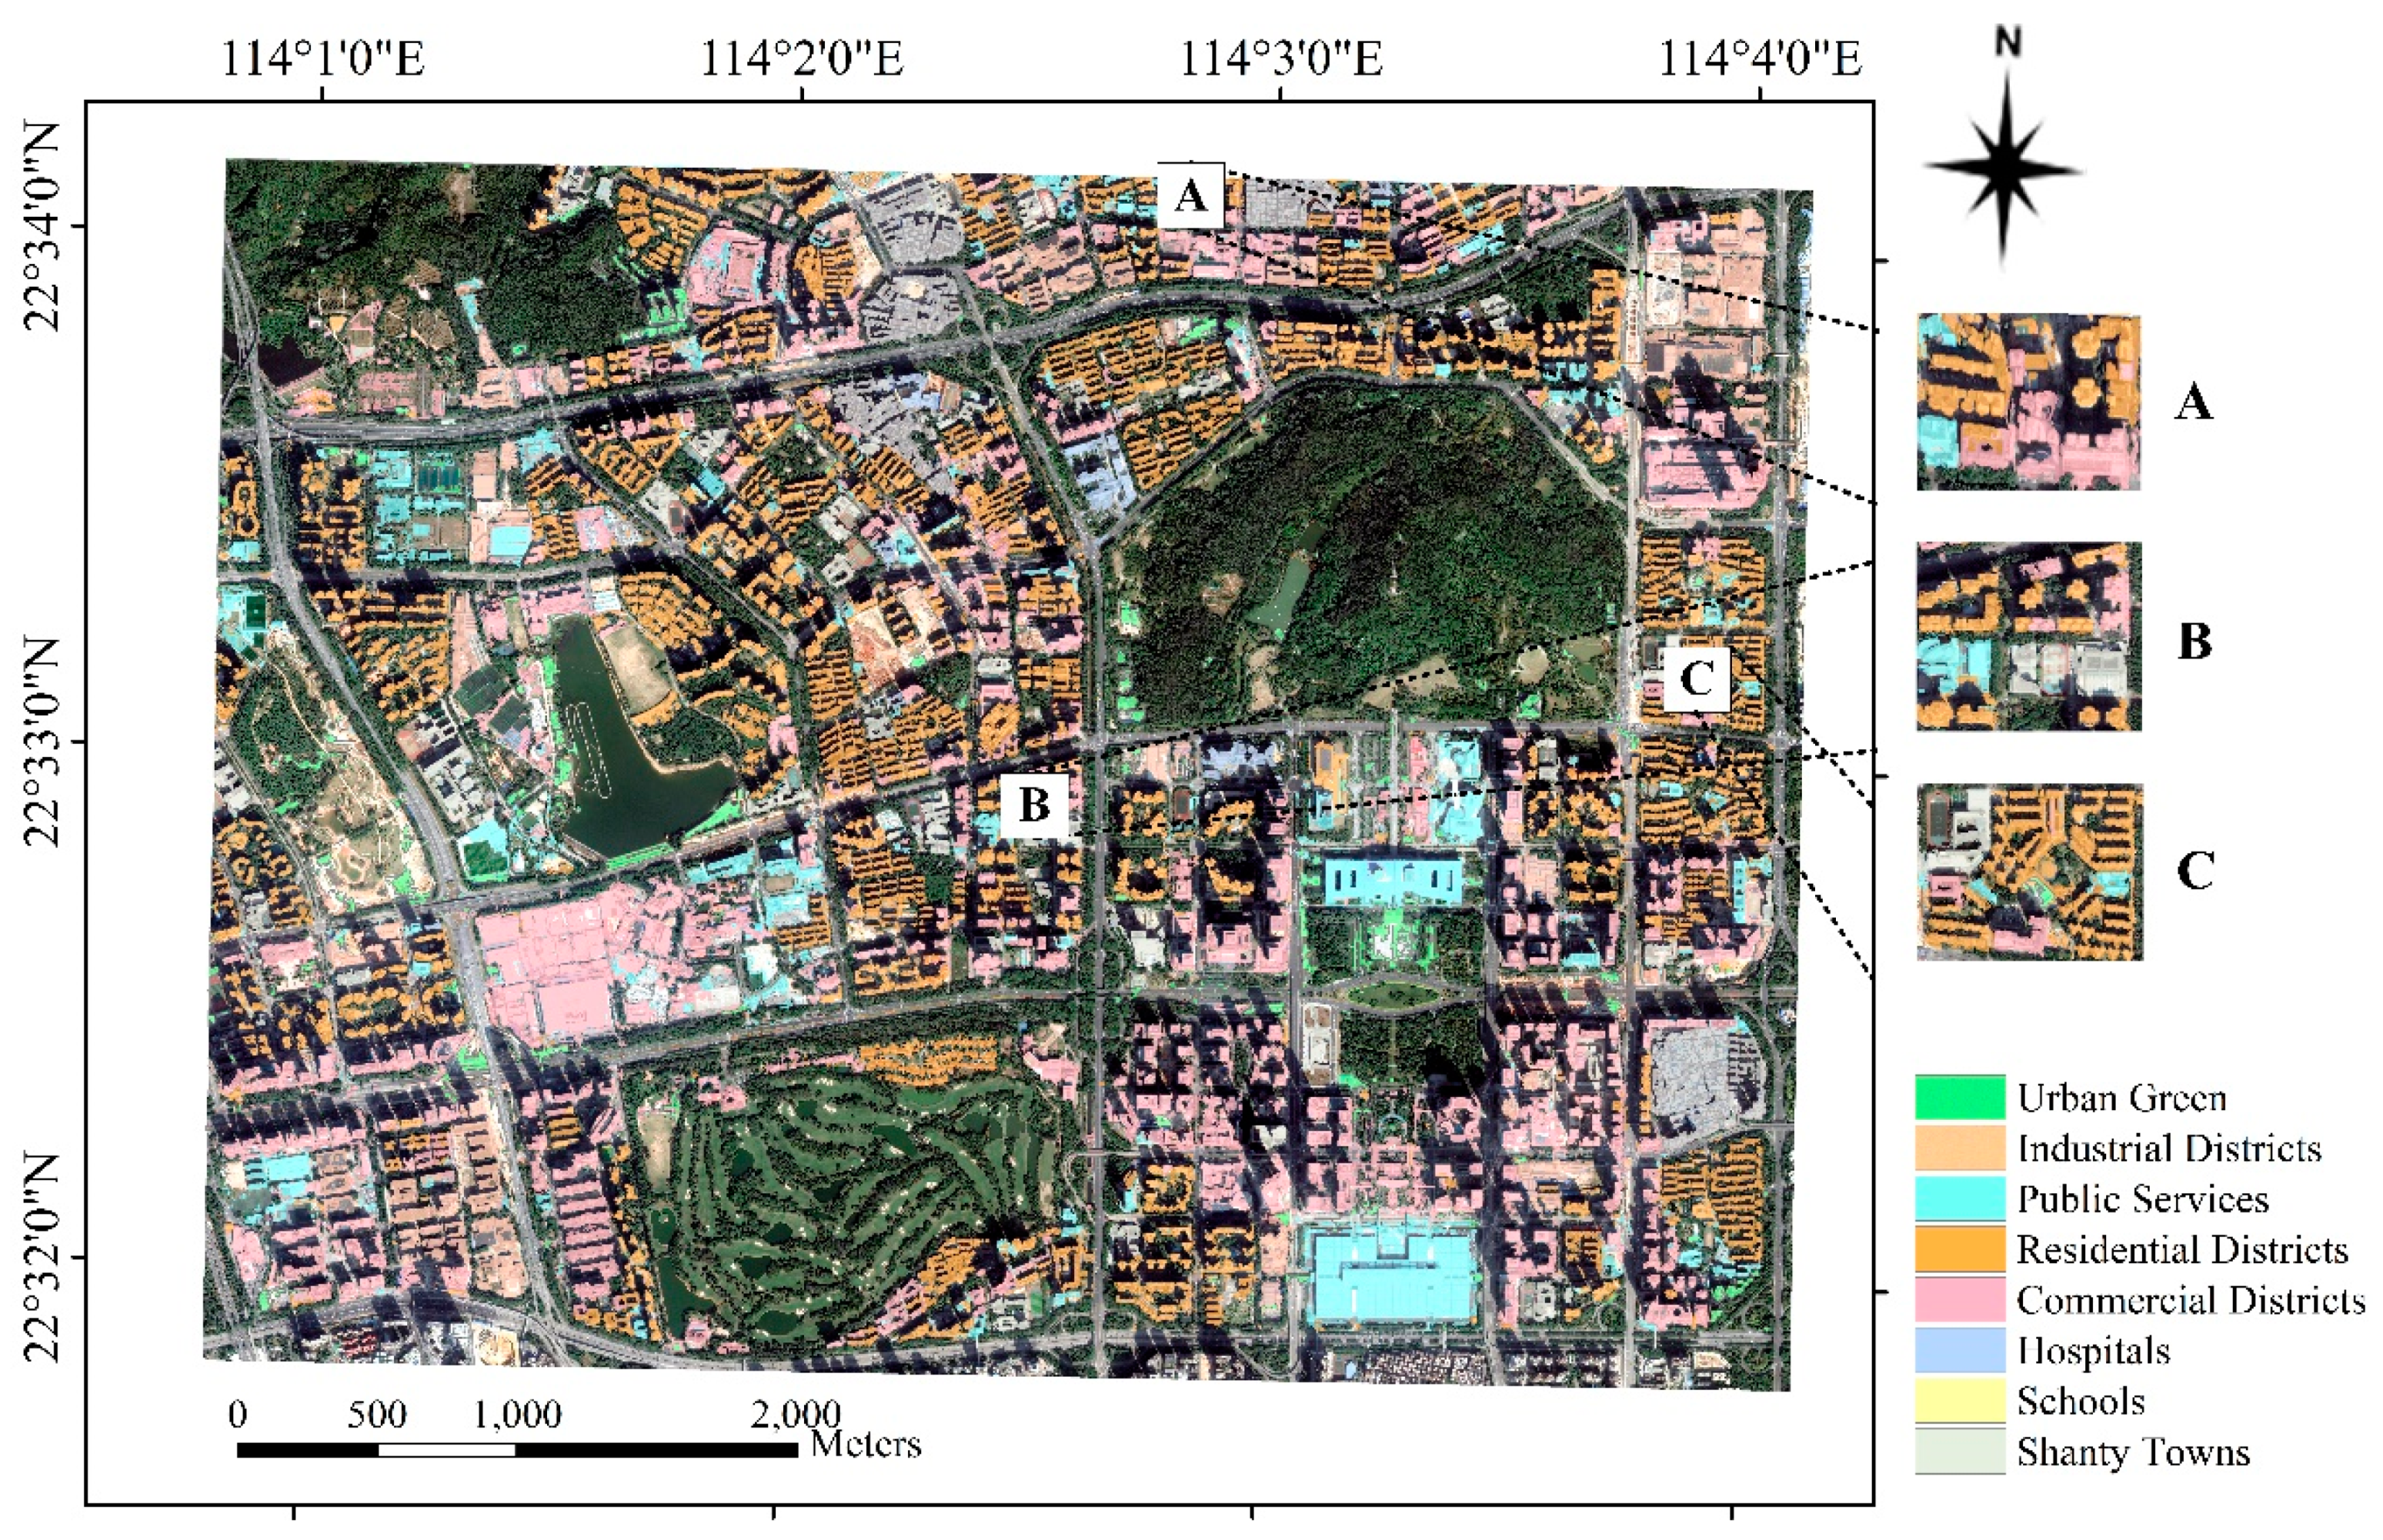
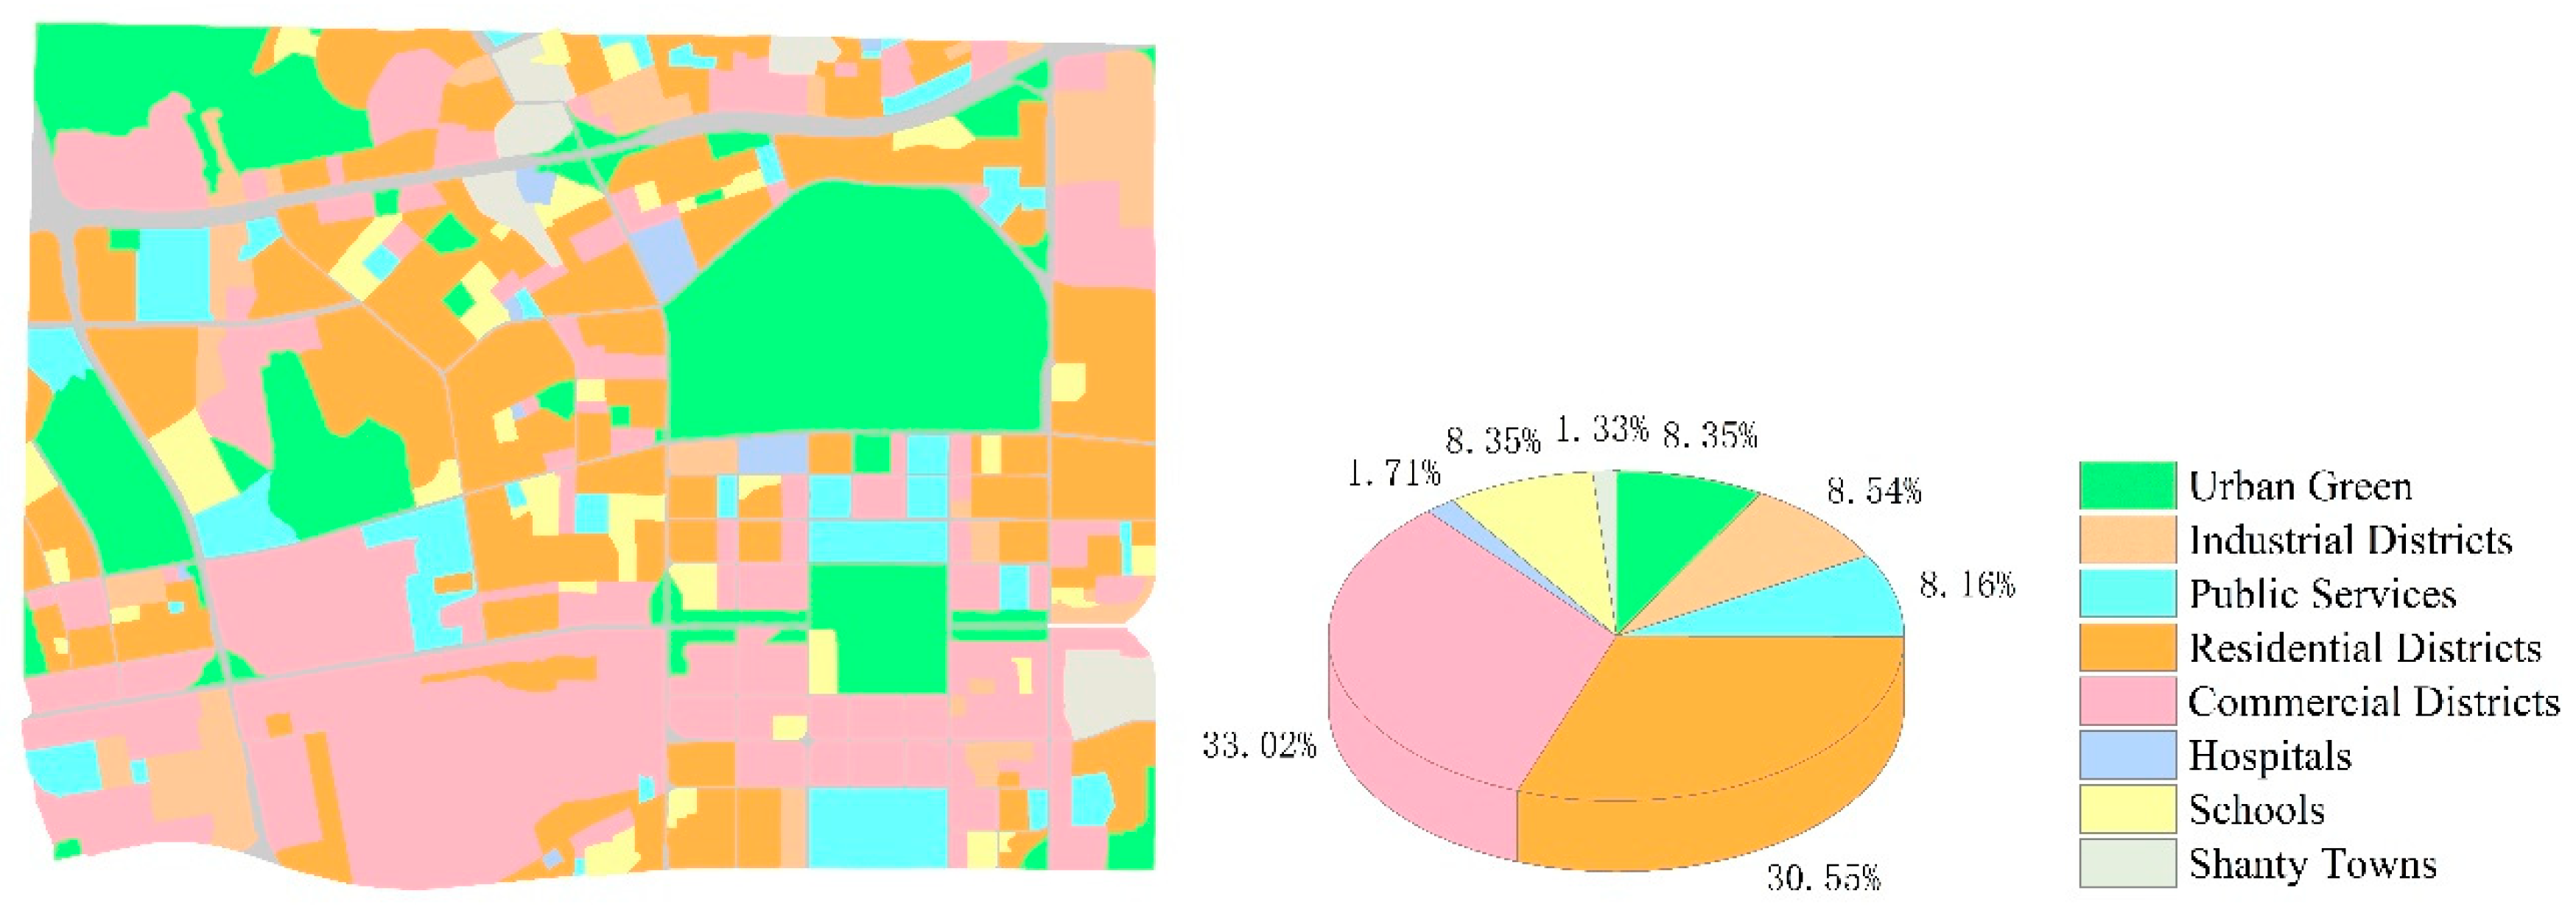
3.5. Results of the Urban Functional Zones

There will always be buildings with multiple functional attributes in one zone (Figure 17A–C), which means that the functions of the zones are overlapped or mixed, but there will always be a major social function to guide the zones. Therefore, we set the Maxarea voting strategy; that is, the dominant functional attribute of a certain zone is the social function with the largest building area in the zone. The results of the urban functional zones are shown in Figure 18. Shenzhen is a city with multiple functions and comprehensive distribution, but the commercial and residential zones occupy 63.57% of the total. Due to China’s national conditions and the relationship between people and land, Shenzhen’s urban structure was determined, which greatly facilitated people’s clothing, food, and shelter. To better verify the accuracy of the urban functional zones, the results were evaluated using a hybrid matrix, as shown in Table 4.

4. Discussion

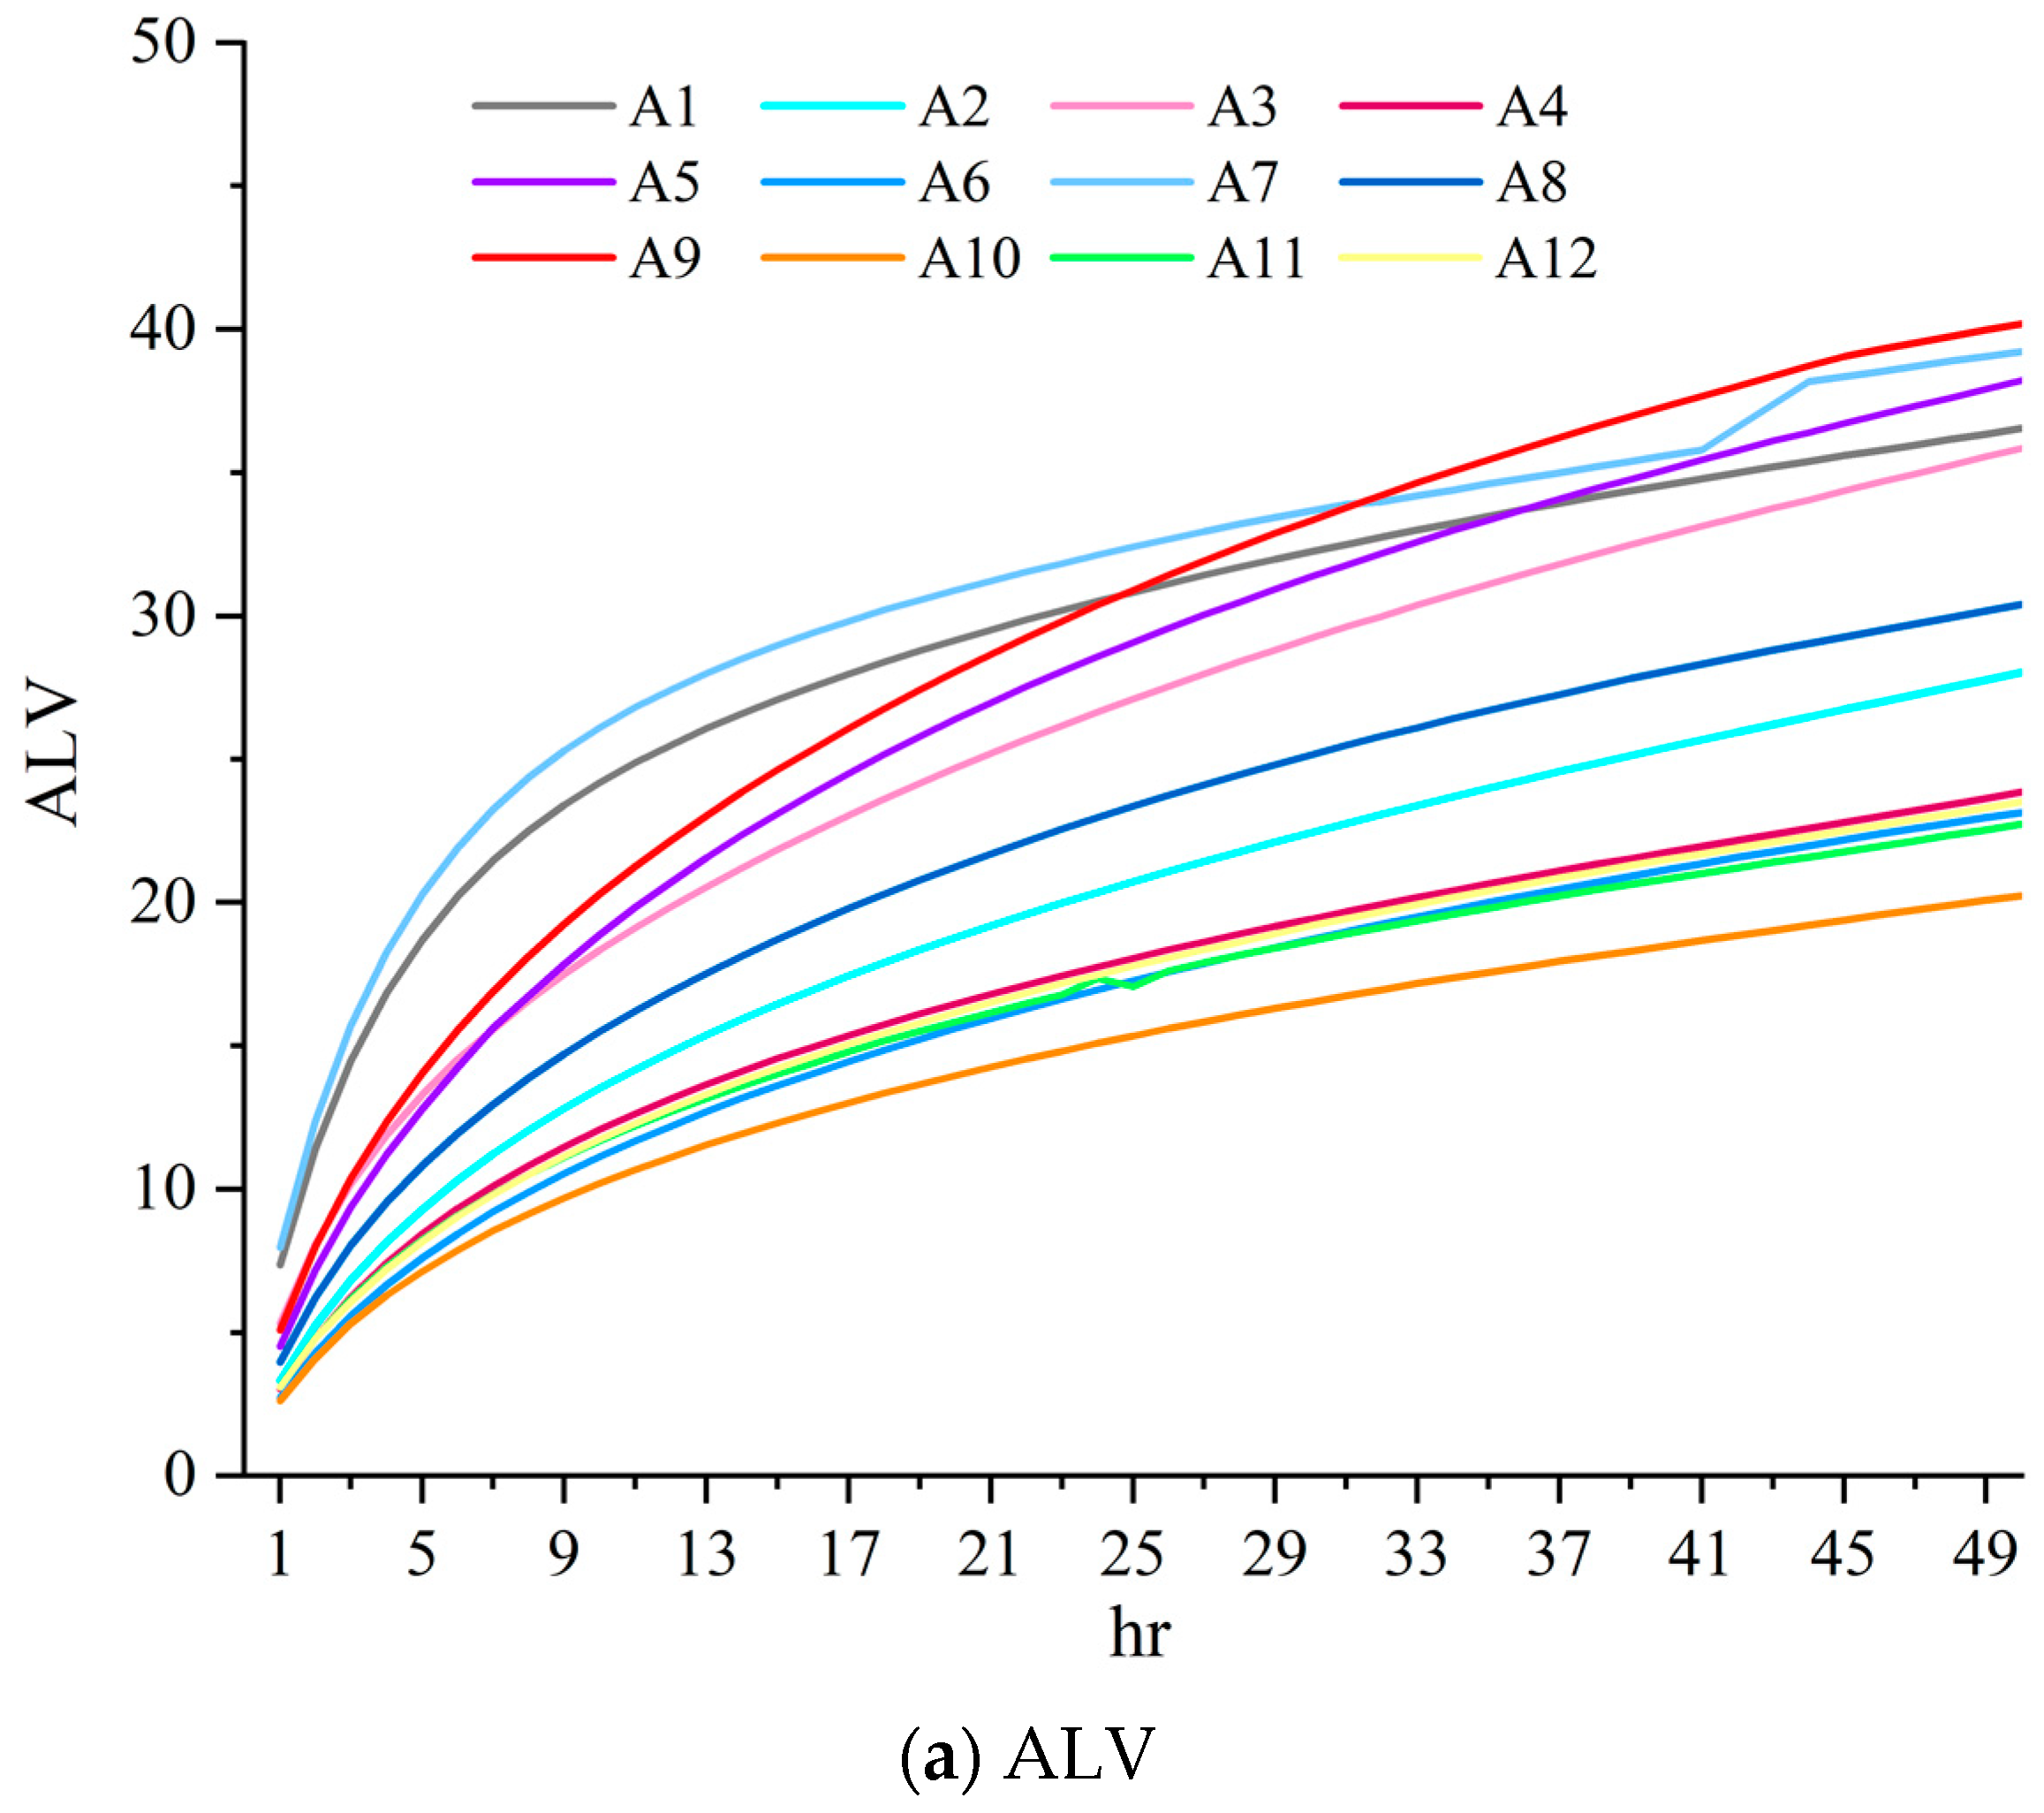
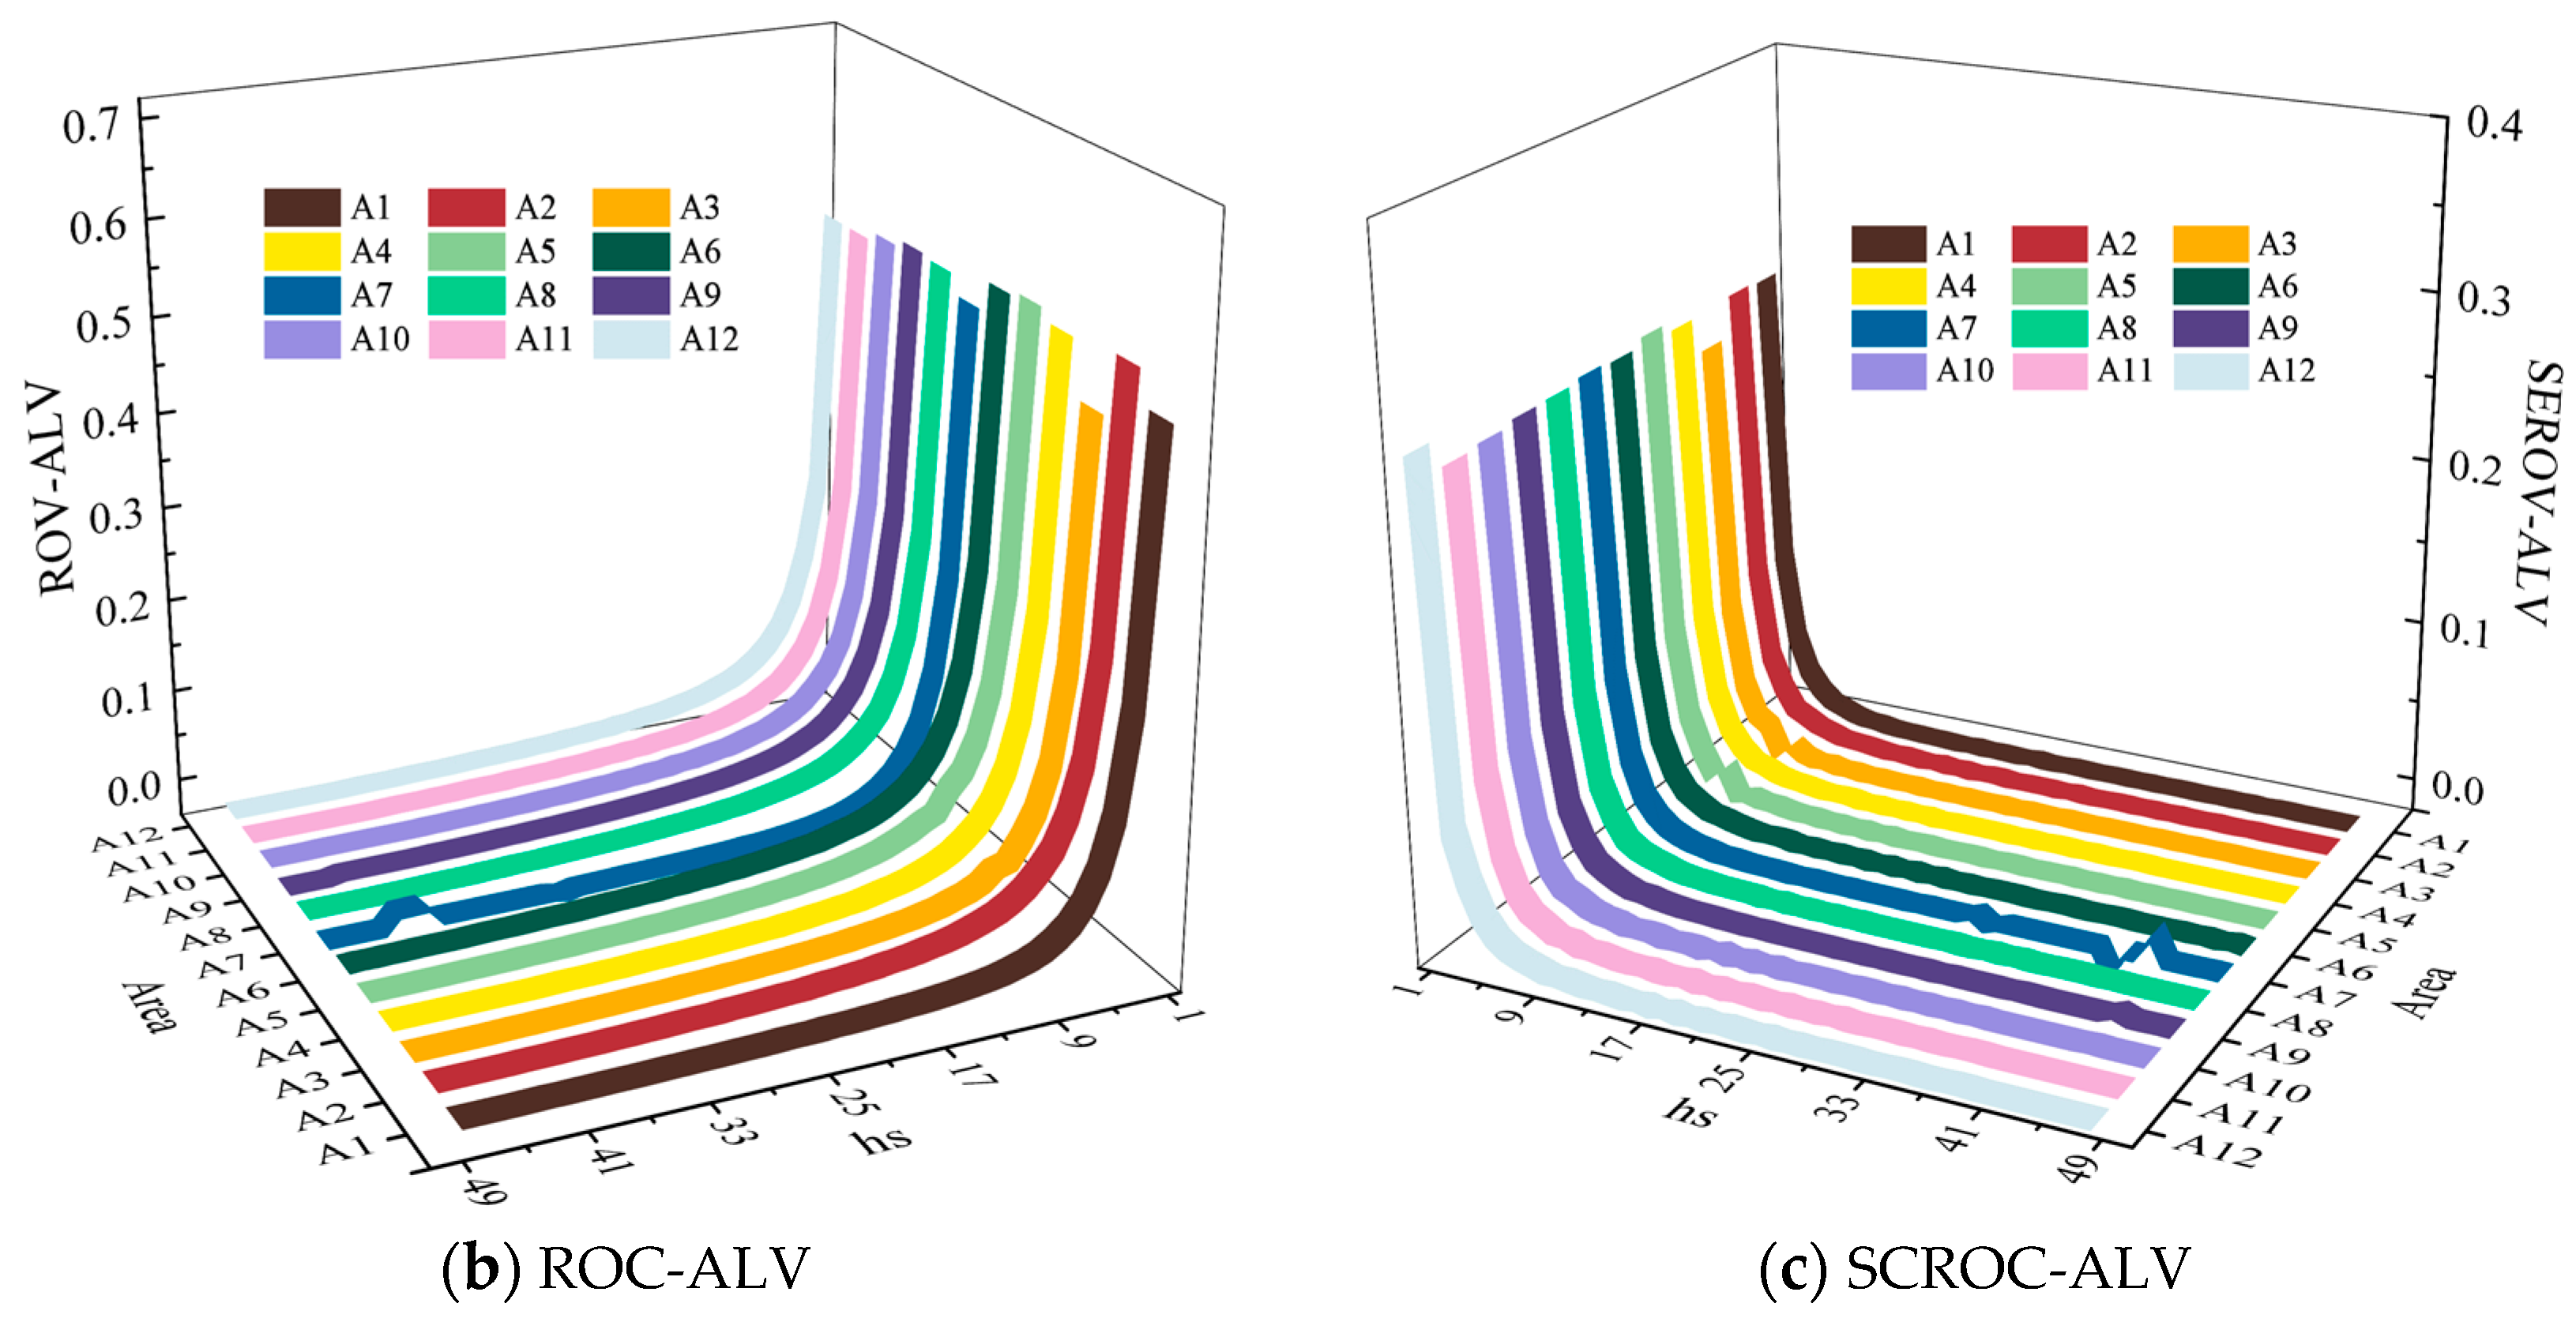
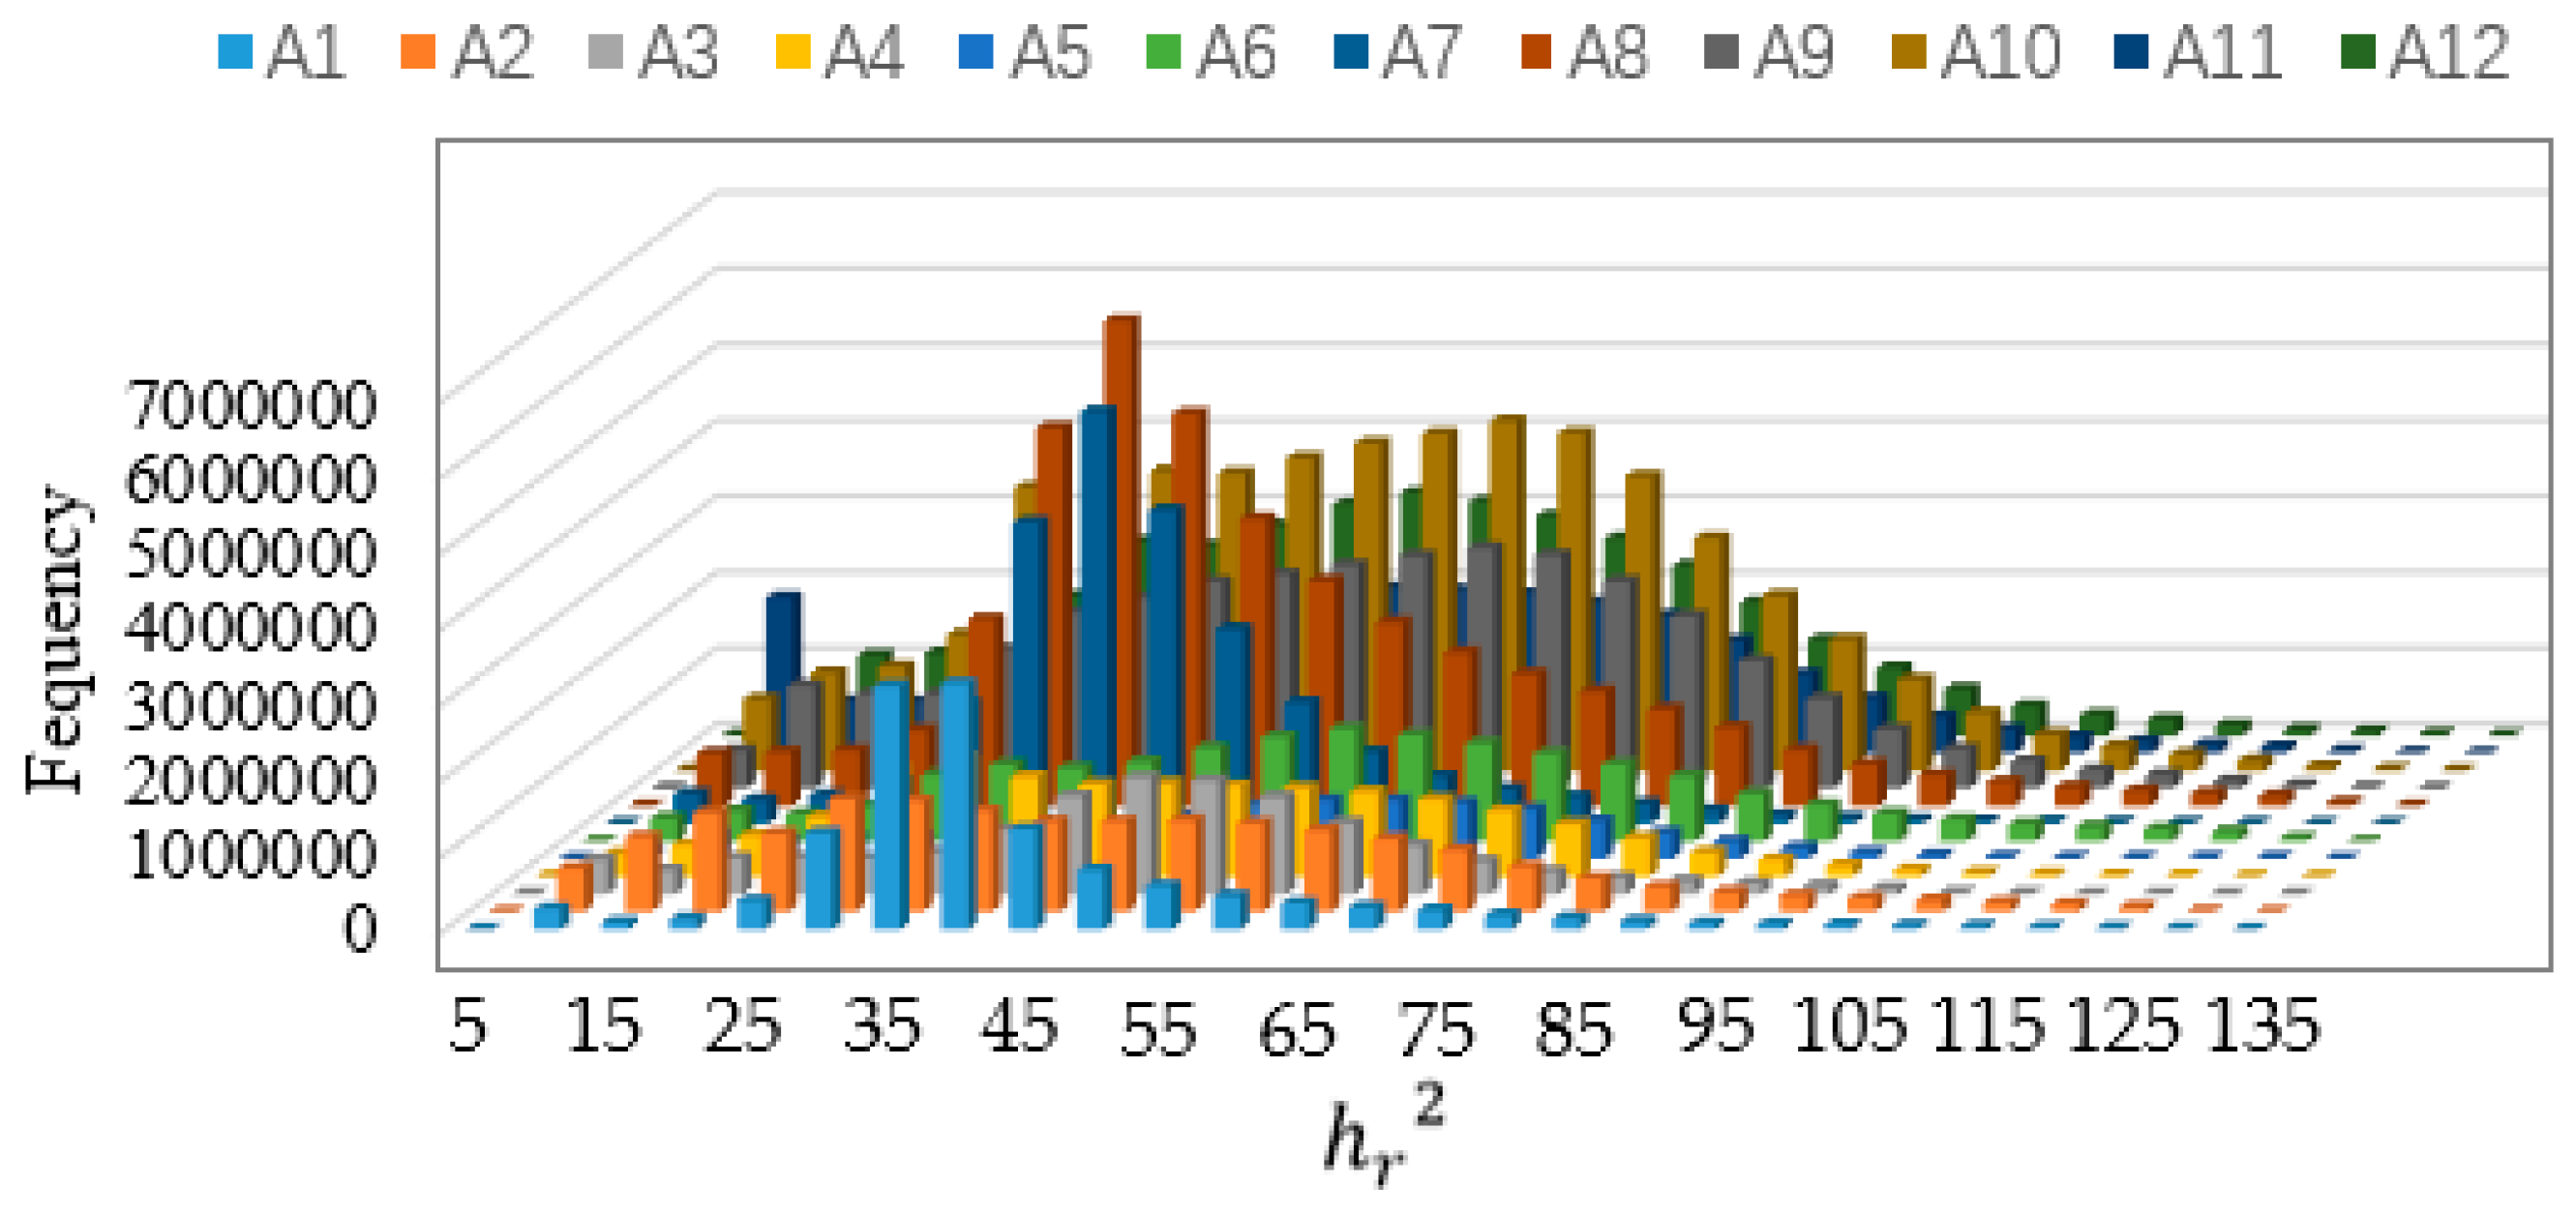
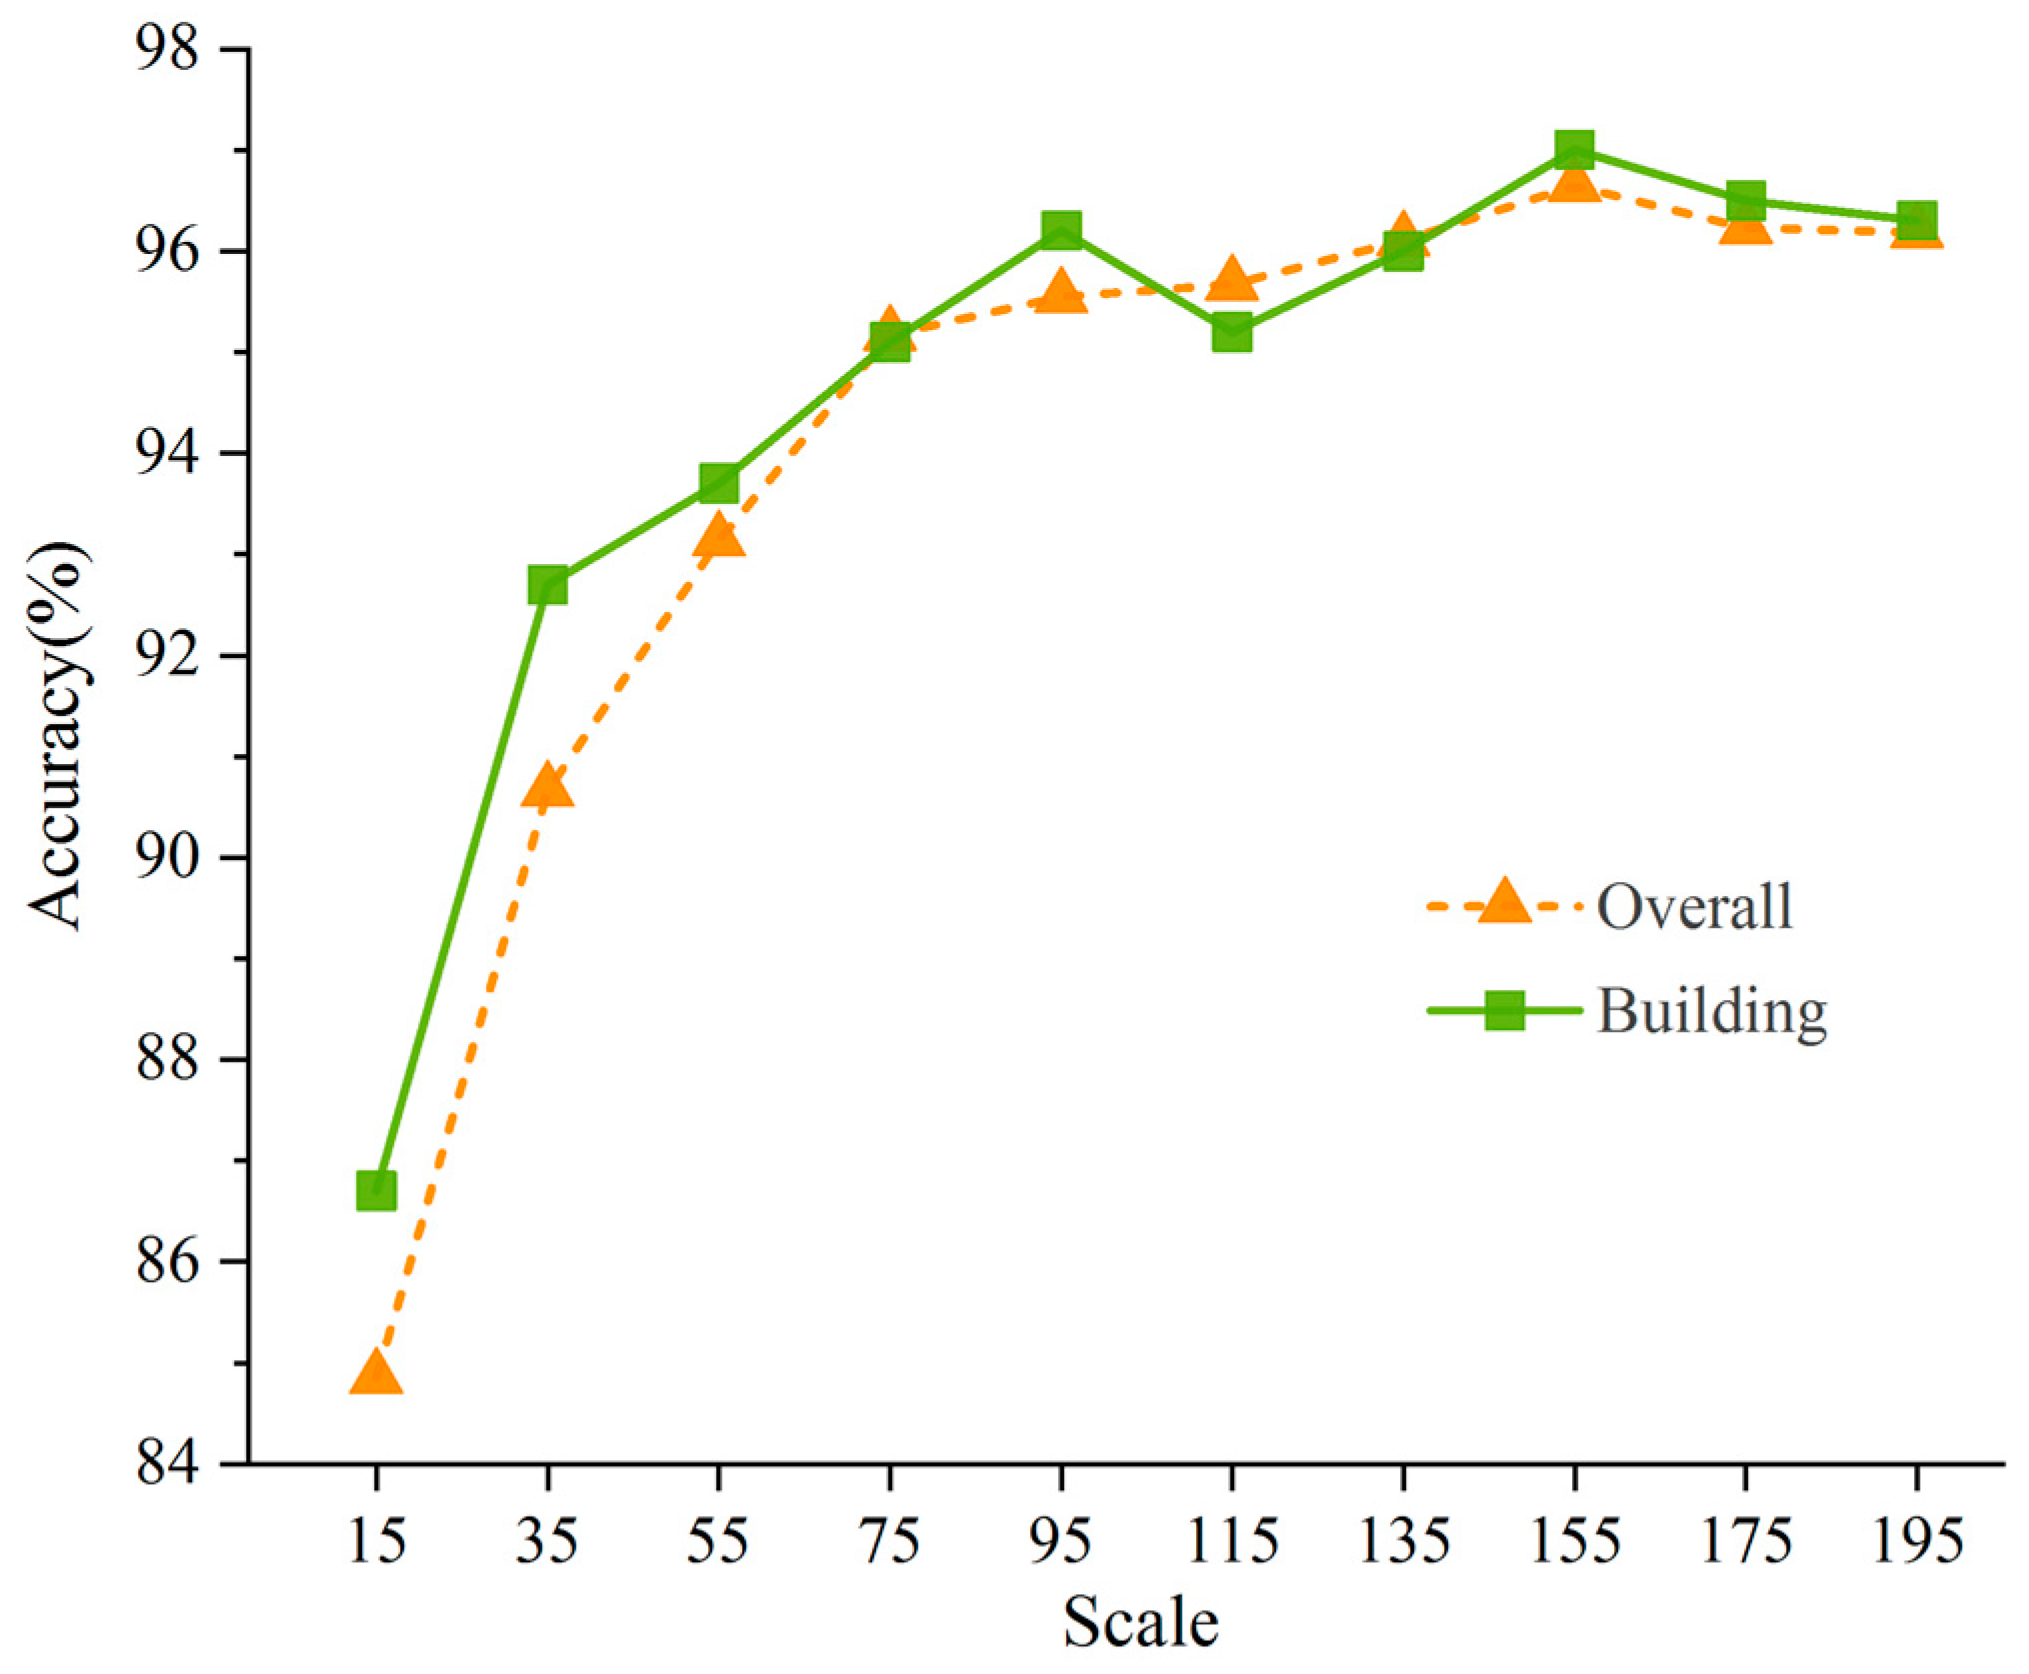
4.1. Effectiveness of the Stratified Scale Estimation

To verify the effectiveness of the stratified scale estimation, we directly recognized and extracted buildings across the entire image without using stratified processing. As shown in Figure 19, it is obvious that the accuracy of the stratified scale estimation is higher than that of the non-stratified process. The best single-scale precision appeared at the 155 scale. The stratified strategy assembles objects with homogeneous features to reduce the experimental time and to provide a better adaptation environment for segmentation. Scale estimation avoids a large number of experiments to find the most appropriate scale to a certain extent, and it also improves the efficiency of experiments while satisfying the accuracy of segmentation and classification. Therefore, it can be proved that the stratified scale estimation has certain suitability and effectiveness, and it has practical significance in the classification and feature extraction of remote sensing geology.

4.2. Contributions of DFCNN

4.2.1. Efficiency of Deeper Edge Features

Figure 20 shows the deeper edge feature map (DEFM) of the study area, and the three sub-regions (A–C) are the epitome of deeper edge features. To verify the contribution of the DEFM, this paper set deeper edge features as the only variable and conducted comparative experiments. The results are given in Table 5. According to the analysis, in the comparison of different scales, as the scale becomes larger, the accuracy of a group of experiments under the blessing of deeper edge features gradually improves, particularly when the building accuracy reaches its largest at the 155 scale. This proves that the deeper edge feature map can provide richer detailed features of buildings and semantic information, such as the surrounding environment, and can also validate the effectiveness of the training scale for building extraction from the other side.
The above experiments prove that the combination of VHSRI and DEFM is effective. On the one hand, it saves time in feature selection to a certain extent. On the other hand, it provides accurate target boundary information and surrounding semantic information for object-based deep learning methods.

4.2.2. Effectiveness of the DFCNN Structure for Building Extraction

To prove the superiority and robustness of DFCNN, we used Random Forest (RF) and AlexNet to compare and recognize buildings on Google data in Shenzhen. The traditional methods used for feature extraction and classification of high-resolution images, especially for complex urban cities, only consider shallow information. Therefore, the introduction of AlexNet solves the problem that semantic information is not used, and significantly improves the accuracy of building extraction. The self-built DFCNN model can make full use of the image information and can mine deeper semantic information, and thus can extract buildings more accurately. A comparison of the accuracy of the three methods can be found in Table 6. Based on DFCNN, the overall accuracy rate increased from 80.99% to 96.65%, and the building accuracy increased significantly by about 29.1%.
As shown in Figure 21, the Random Forest (RF) method is still somewhat unsatisfactory from a visual point of view. Many trees and buildings are mistakenly classified into shadows and accompanied by the salt and pepper effect. The buildings recognized by the AlexNet method almost correspond to the corresponding locations of the original image. As shown in Figure 22, almost all the buildings in areas A and B have been completely extracted. However, the recognition ability of the AlexNet method seems to be limited. Due to the complexity of buildings, and interference from roads with the same spectrum and texture as buildings, some misclassifications still occur. In contrast, DFCNN’s effect in this zone is better, so it further proves the advantages of DFCNN mining deeper semantics and its capability of semantic mapping.

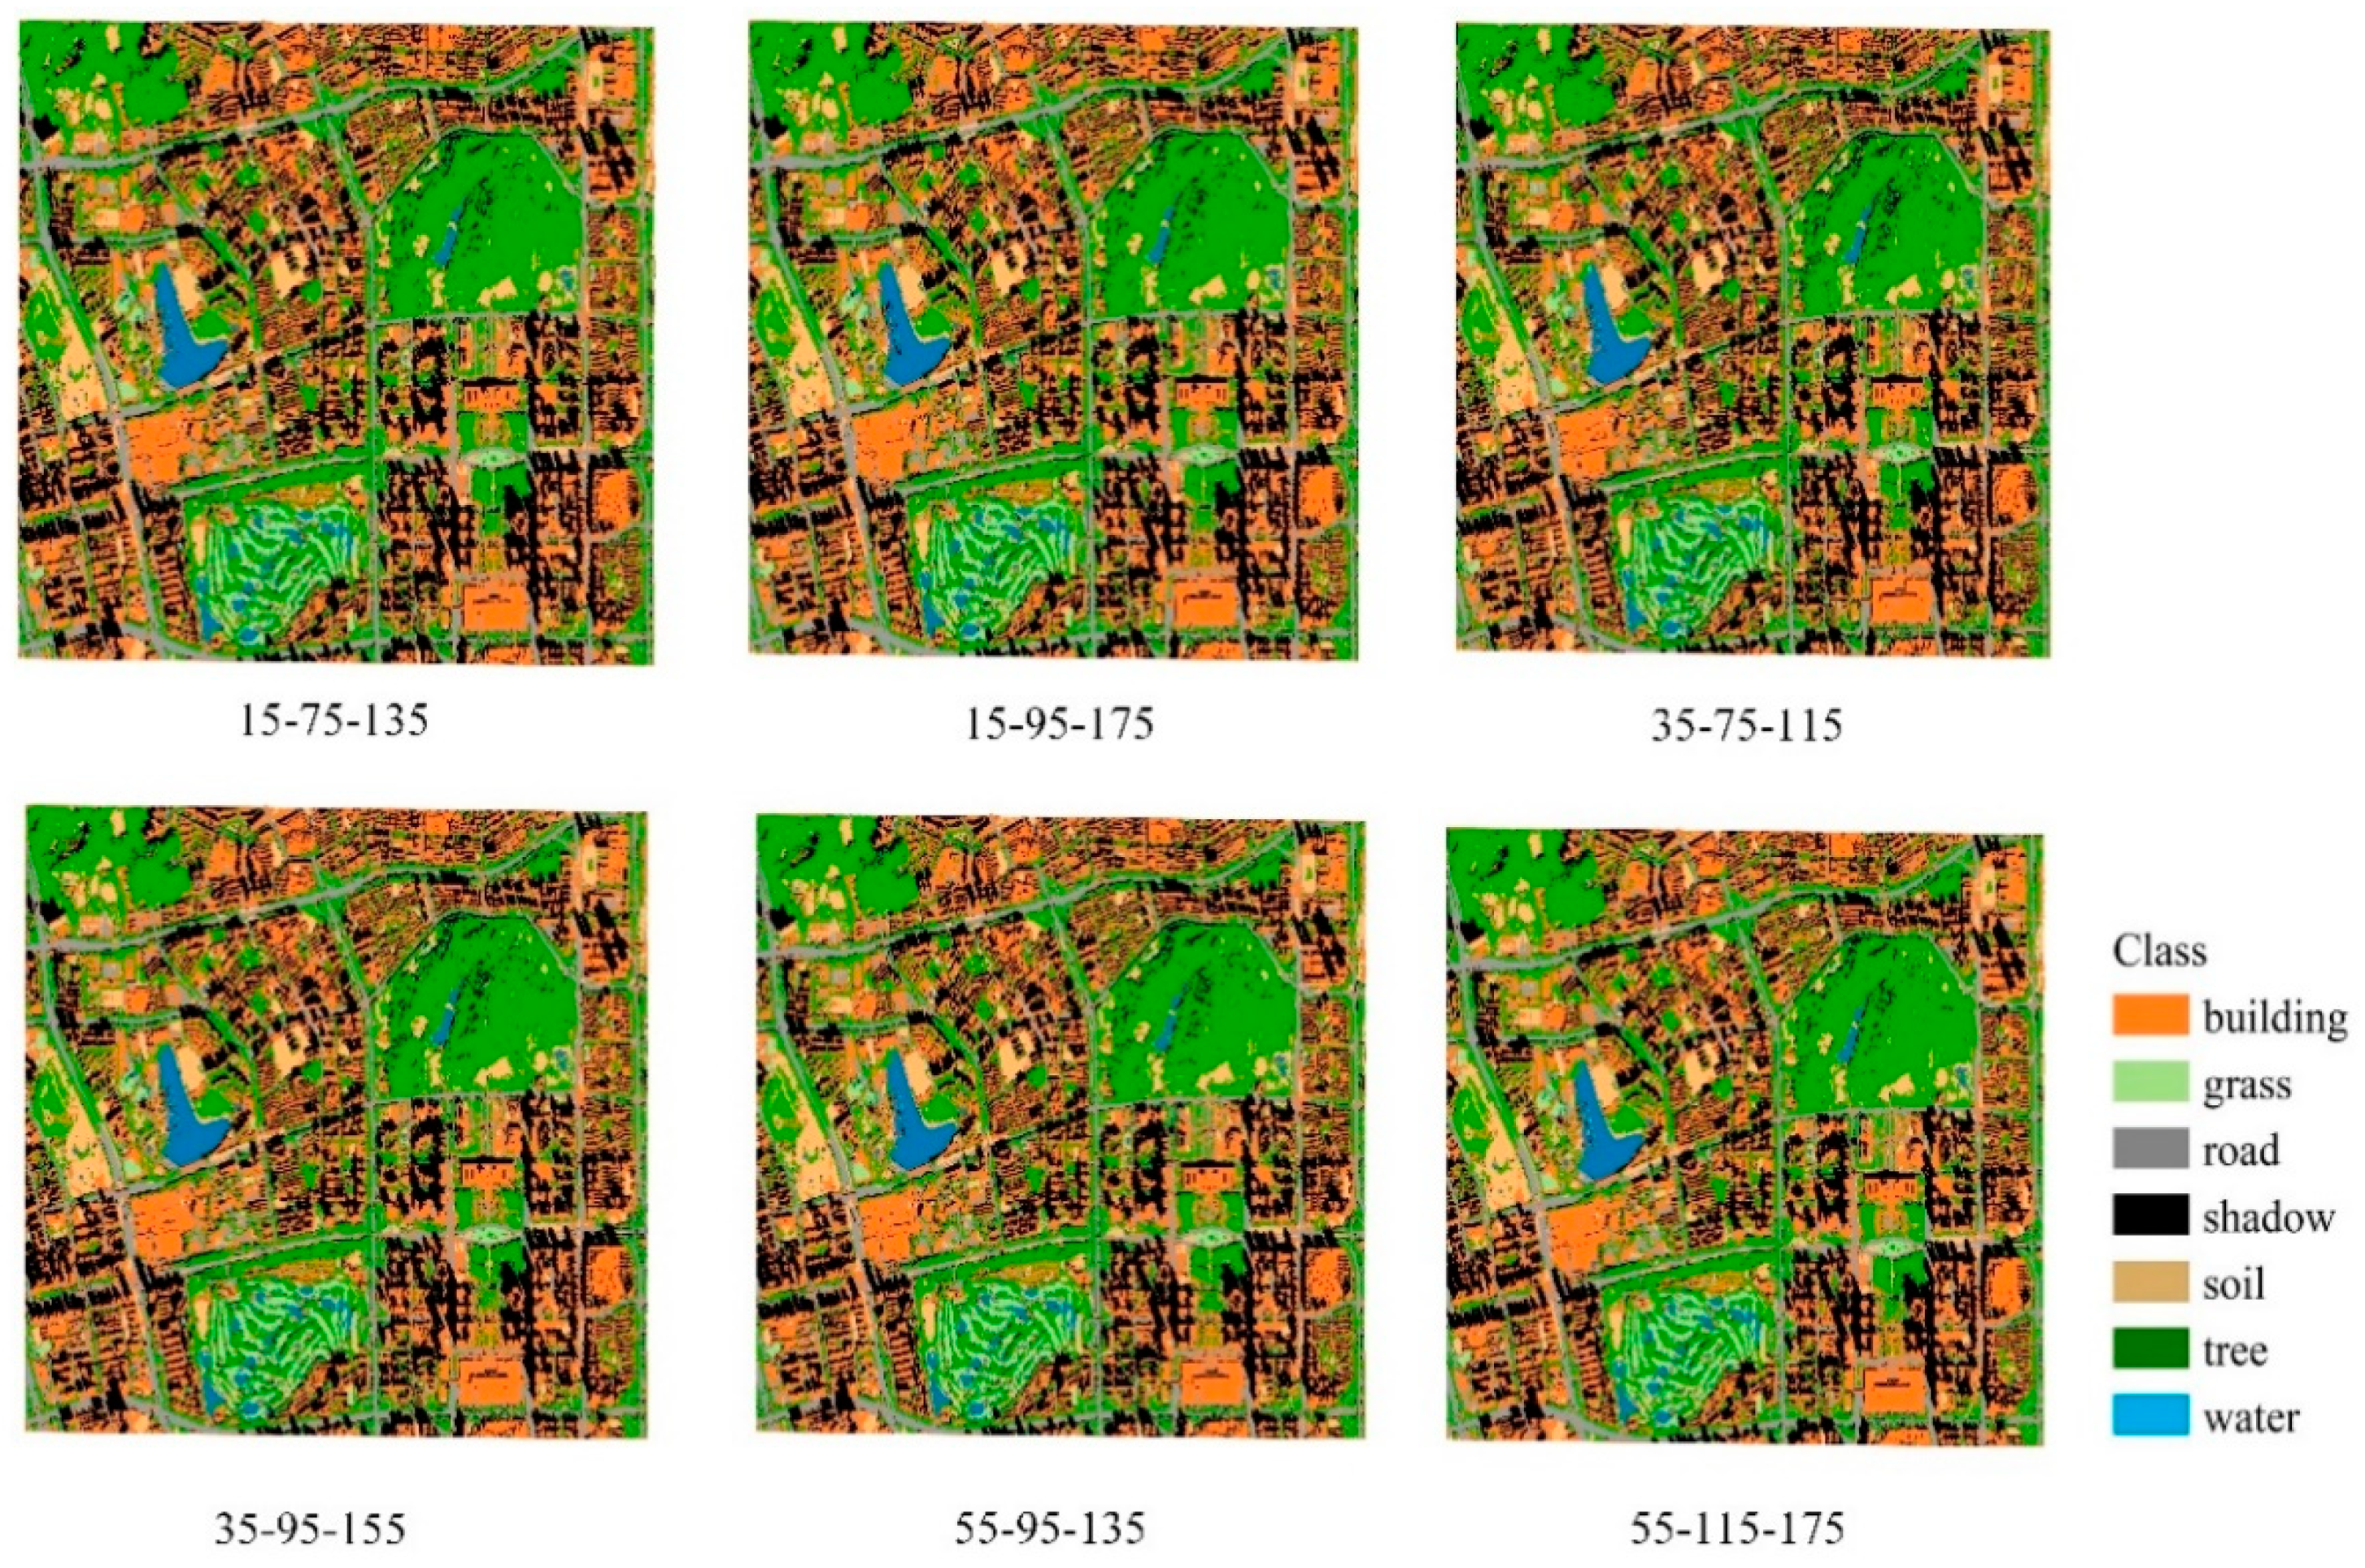
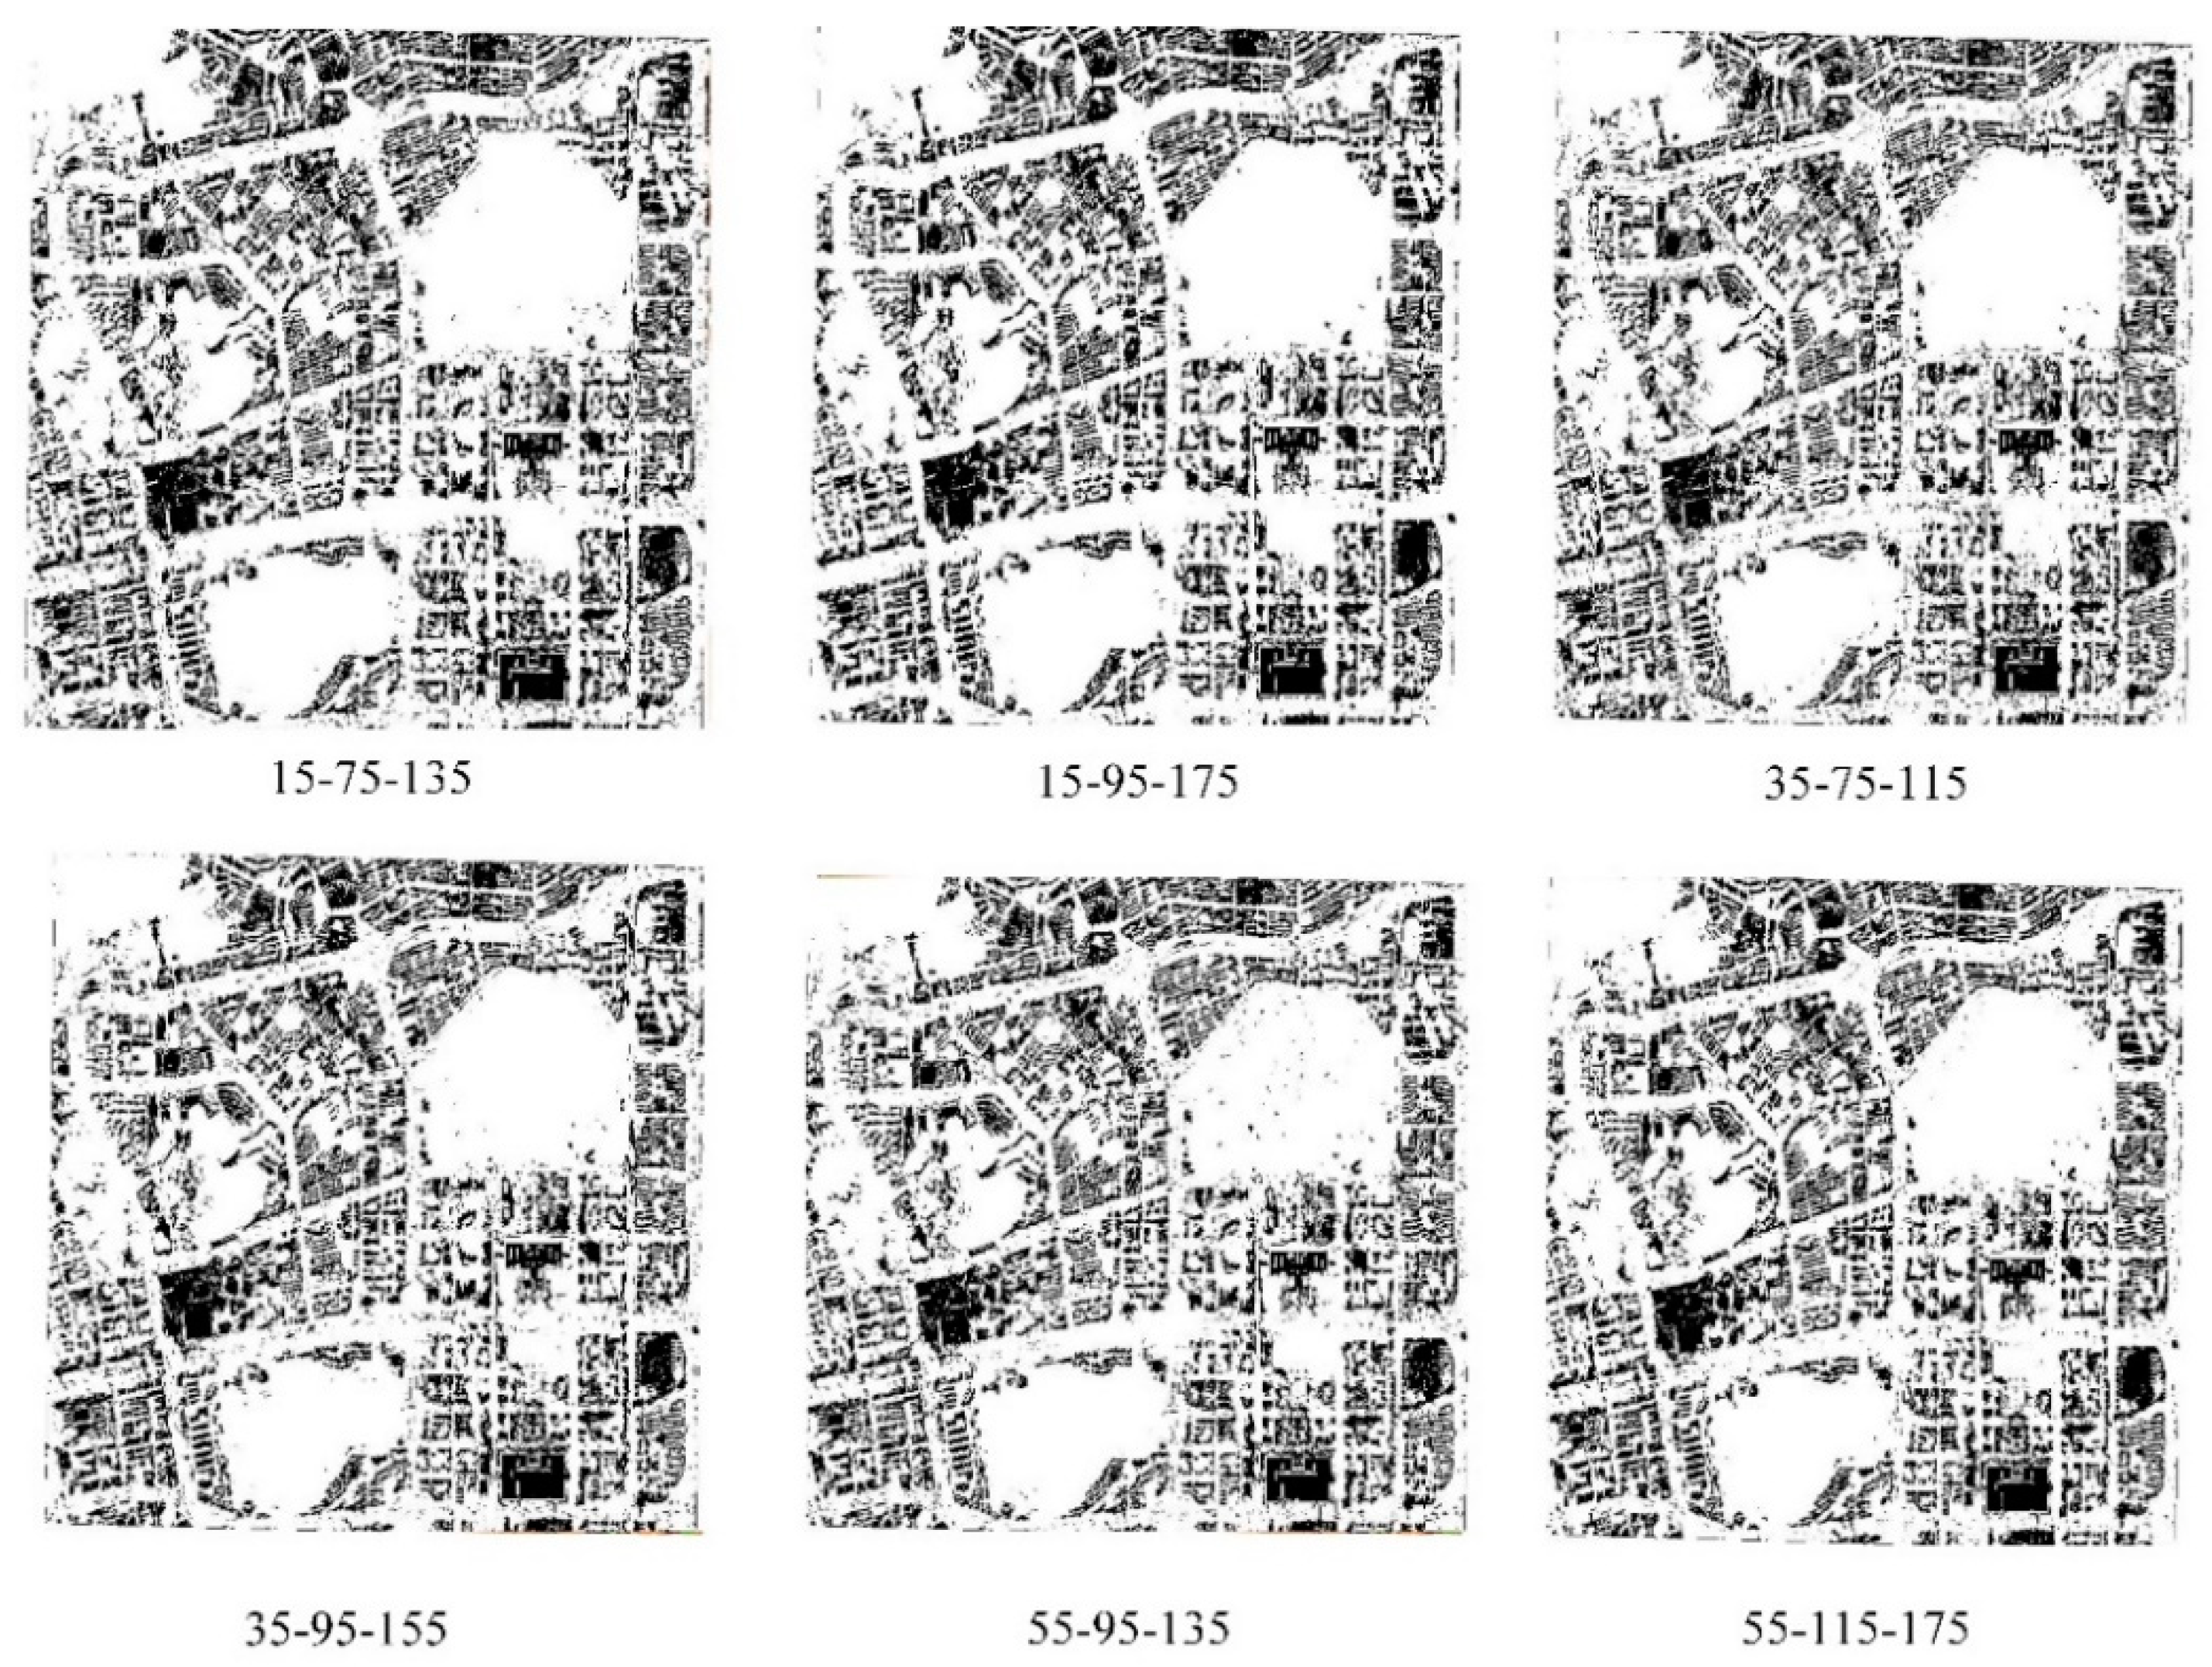
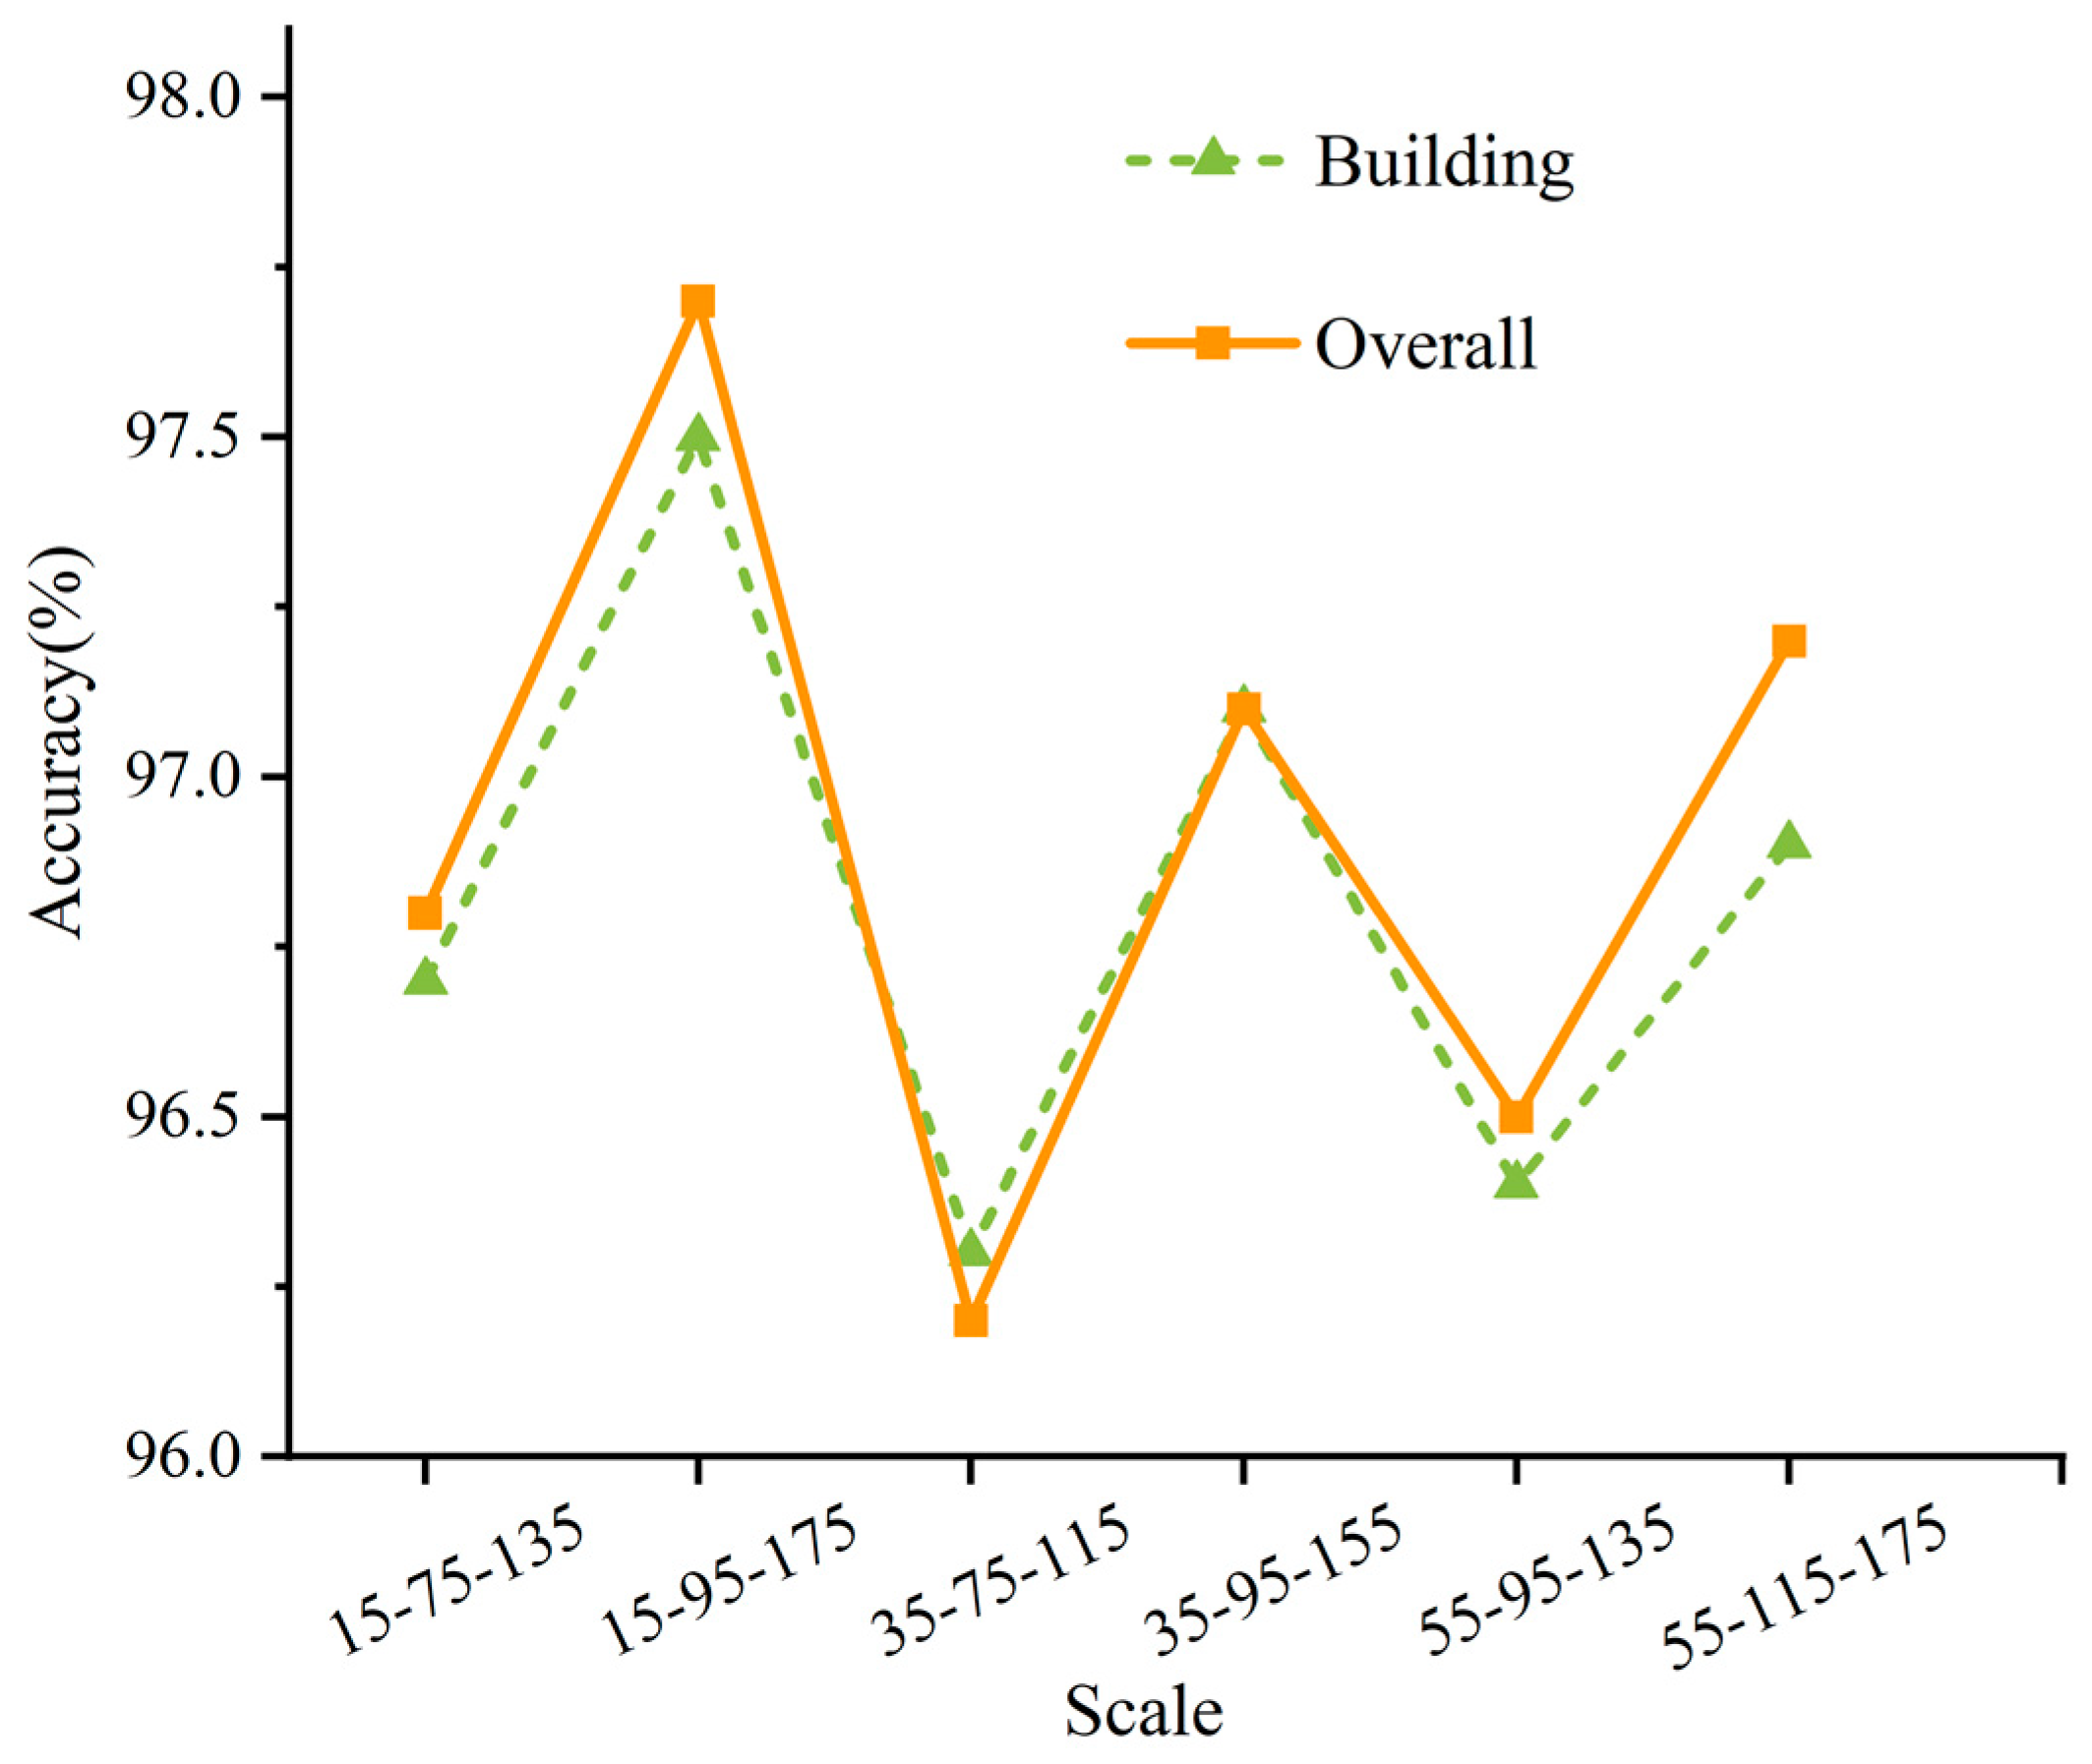
4.2.3. Multi-Scale Training

Objects in nature show different shapes, but a tile is difficult to map a building, and a leaf is difficult to explain a tree or whole forest [70,71]. Therefore, different scales need to be taken into account. A small scale can reflect the low-level features inside the object, while a large scale contains more high-level information of the surrounding environment [65,66,72]. The strategy of scale combination can take into account the information of different levels of macro- and micro-images, and can also analyze and explain different geographic phenomena at different scales.
Based on the above, a multi-scale strategy was adopted, and a single-scale experiment was conducted. Around 75 was set as the scale boundary, and three different scale combinations were used: large, medium, and small. Multi-scale classification results and building extraction are shown in Figure 23 and Figure 24. And Figure 25 shows a multi-scale precision point-line diagram. It can be seen from these figures that the multi-scale final classification results all show good performance, the salt and pepper phenomenon is almost eliminated, and the accuracy is almost improved. However, the accuracy of the three groups of scales 15-75-135, 35-75-115, 55-95-135 is lower than the accuracy of the single scale 155. On the contrary, the 15-95-175, 35-95-155, 55-115-175 three groups are higher than the best single scale. This is owing to the 155 scale having the best performance in a single scale experiment, which contains richer semantic information of its own depth and surrounding environment information. The large scales in the last three sets of scale combinations all contain deeper semantic information of the 155 scale, which further improves the classification accuracy and the building accuracy. Therefore, the multi-scale strategy still has guiding significance for further improving the accuracy of building extraction.

4.3. Pros and Cons

The strategy of functional zone recognition proposed in this paper replaces the method of directly recognizing urban functional zones with remote sensing data or social sensing data. The combination of POIs and VHSRI effectively realizes the geographical matching of the physical semantics and functional semantics of objects. The stratified scale estimation strategy solves the scale parameter problem to a certain extent, and the construction of the DFCNN model provides more and deeper semantics, as well as strong support for the realization of complex urban functional zone recognition.
However, this method faces the following problems:
  • The recognition of functional zones depends largely on the accuracy of the building extraction. The strategy of urban functional zone recognition in this paper is based on the functional semantics of buildings. Therefore, the misclassification and omission of buildings affect the division of functional zones.
  • Although the contribution of the buildings to the functional zones is huge, other geographic objects are also part of the functional zones. For example, in the park, the contribution of water and vegetation is greater, the greening rates of commercial and residential areas are different, and the complexity and grade of roads are also different. Therefore, a strategy that only considers the attributes of buildings has certain limitations, and the attributes of all geographic objects inside the area should be fully considered.
  • Furthermore, spatial relationships and distributions were not fully taken into account. The construction of zones must follow certain spatial syntax, which is directly reflected in the spatial relationship between buildings, and even between various geographic objects [73,74]. Similarly, the relationship between geographic objects also affects the evolution of functional zones.
Therefore, in future studies, we plan to explore the spatial relationship of geographical objects and the hybrid expression and evolution of regional functions.

5. Conclusions

This paper integrates POI social perception data and VHSRI to realize the recognition of urban functional zones based on the functional semantic recognition of urban buildings. The main contributions of this paper are integrating the deeper edge feature map (DEFM) and VHSRI, using multi-scale DFCNN to extract urban buildings. In addition, the recognition of urban functional zones in Shenzhen, which is a mega-city in China, verifies the accuracy and effectiveness of the method.
  • Due to the complexity of urban ground features, we adopted a strategy of stratified scale estimation. To some extent, this method avoids the blindness and subjectivity of scale parameter selection and effectively improves the efficiency of the experiment. At the same time, it can also meet the suitability of different geographic object scales and can improve the accuracy of building extraction.
  • In view of the diversity of the spectrum, shape, and texture of urban buildings, low-level information can no longer be satisfied in the recognition and extraction of buildings. In this paper, a DFCNN model was designed based on the inception module, and DEFM was used to mine higher-level semantics of buildings and to improve the accuracy of building extraction.
  • The organic fusion of POIs and VSHRI was put into the DFCNN model to explore geographic objects and to comprehend the functional semantics information in the context of social functions. Then, the Maxarea voting strategy was adopted to label zones as the dominant function. This method effectively facilitated the combination of the building’s physical and social functional semantics and realized the recognition of urban functional zones. Compared with previous studies, the method proposed in this paper can accurately describe semantic buildings in complex urban environments. In addition, semantic buildings can be abstracted into functional zones through social functional information, which realizes the recognition of urban functional zones from the bottom to the top, from objects to scenes.
However, although POIs and VHSRI greatly improve the accuracy of urban functional zones, there are still some problems that need to be addressed further. For example, the resolution of the three limitations identified in Section 4.3 needs to be the focus of future research. In addition, our method proved to be effective for the analysis of Shenzhen, but its adaptability to the country, and even the rest of the world, needs further verification. Finally, in our future research, we will use more effective strategies to mine the deeper semantic information and spatial relationships of objects, and the mapping and analysis of urban functional zones will be further advanced [75,76].

Author Contributions

Data curation, H.B.; Formal analysis, K.Z. (Kui Zhang); Methodology, H.B., D.M. and Y.G.; Project administration, D.M.; Resources, H.B., Y.G., K.Z. (Kui Zhang) and S.D.; Supervision, D.M. and K.Z. (Keqi Zhou); Validation, H.B.; Visualization, Y.G.; Writing—original draft, H.B.; Writing—review and editing, D.M., K.Z. (Kui Zhang), K.Z. (Keqi Zhou) and S.D. All authors have read and agreed to the published version of the manuscript.

Funding

This research was supported by the National Natural Science Foundation of China (41671369), the National Key Research and Development Program (2017YFB0503600), and the “Fundamental Research Funds for the Central Universities”. This paper is not the work of a single man, but of a great team, including members of Lab Ming of CUGB and some close friends who have helped a lot.

Conflicts of Interest

The authors declare no conflict of interest.

References

  1. Leichtle, T.; Geiß, C.; Wurm, M.; Lakes, T.; Taubenböck, H. Unsupervised change detection in VHR remote sensing imagery—An object-based clustering approach in a dynamic urban environment. Int. J. Appl. Earth Obs. Geoinf. 2017, 54, 15–27. [Google Scholar] [CrossRef]
  2. Zhong, Y.; Zhu, Q.; Zhang, L. Scene Classification Based on the Multifeature Fusion Probabilistic Topic Model for High Spatial Resolution Remote Sensing Imagery. IEEE Trans. Geosci. Remote Sens. 2015, 53, 6207–6222. [Google Scholar] [CrossRef]
  3. Yao, Y.; Liang, Z.; Yuan, Z.; Liu, P.; Bie, Y.; Zhang, J.; Wang, R.; Wang, J.; Guan, Q. A human-machine adversarial scoring framework for urban perception assessment using street-view images. Int. J. Geogr. Inf. Sci. 2019, 33, 2363–2384. [Google Scholar] [CrossRef]
  4. Heiden, U.; Heldens, W.; Roessner, S.; Segl, K.; Esch, T.; Mueller, A. Urban structure type characterization using hyperspectral remote sensing and height information. Landsc. Urban Plan. 2012, 105, 361–375. [Google Scholar] [CrossRef]
  5. Hong, Z.; Ming, D.; Zhou, K.; Guo, Y.; Lu, T. Road Extraction from a High Spatial Resolution Remote Sensing Image Based on Richer Convolutional Features. IEEE Access 2018, 6, 46988–47000. [Google Scholar] [CrossRef]
  6. Li, M. A Review of Remote Sensing Image Classification Techniques: The Role of Spatio-contextual Information. Eur. J. Remote Sens. 2014, 47, 389–411. [Google Scholar] [CrossRef]
  7. Lu, T.; Ming, D.; Lin, X.; Hong, Z.; Bai, X.; Fang, J. Detecting Building Edges from High Spatial Resolution Remote Sensing Imagery Using Richer Convolution Features Network. Remote Sens. 2018, 10, 1496. [Google Scholar] [CrossRef] [Green Version]
  8. Zhang, X.; Du, S.; Wang, Q. Hierarchical semantic cognition for urban functional zones with VHR satellite images and POI data. ISPRS J. Photogramm. Remote Sens. 2017, 132, 170–184. [Google Scholar] [CrossRef]
  9. Lu, X.; Zhong, Y.; Zheng, Z.; Liu, Y.; Zhao, J.; Ma, A.; Yang, J. Multi-Scale and Multi-Task Deep Learning Framework for Automatic Road Extraction. IEEE Trans. Geosci. Remote Sens. 2019, 57, 9362–9377. [Google Scholar] [CrossRef]
  10. Chen, K.; Jian, P.; Zhou, Z.; Guo, J.; Zhang, D. Semantic Annotation of High-Resolution Remote Sensing Images via Gaussian Process Multi-Instance Multilabel Learning. IEEE Geosci. Remote Sens. Lett. 2013, 10, 1285–1289. [Google Scholar] [CrossRef]
  11. Tokarczyk, P.; Wegner, J.D.; Walk, S.; Schindler, K. Features, Color Spaces, and Boosting: New Insights on Semantic Classification of Remote Sensing Images. IEEE Trans. Geosci. Remote Sens. 2015, 53, 280–295. [Google Scholar] [CrossRef]
  12. Wen, D.; Huang, X.; Zhang, L.; Benediktsson, J.A. A Novel Automatic Change Detection Method for Urban High-Resolution Remotely Sensed Imagery Based on Multiindex Scene Representation. IEEE Trans. Geosci. Remote Sens. 2016, 54, 609–625. [Google Scholar] [CrossRef]
  13. Zhu, Q.; Sun, X.; Zhong, Y.; Zhang, L. High-Resolution Remote Sensing Image Scene Understanding: A Review. In Proceedings of the IGARSS 2019, 2019 IEEE International Geoscience and Remote Sensing Symposium, Yokohama, Japan, 28 July–2 August 2019; pp. 3061–3064. [Google Scholar]
  14. Yang, Y.; Newsam, S. Bag-of-visual-words and spatial extensions for land-use classification. In Proceedings of the 18th SIGSPATIAL International Conference on Advances in Geographic Information Systems, San Jose, CA, USA, 3–5 November 2010; Association for Computing Machinery: San Jose, CA, USA, 2010; pp. 270–279. [Google Scholar]
  15. Zhu, Q.; Zhong, Y.; Bei, Z.; Xia, G.S.; Zhang, L. Bag-of-Visual-Words Scene Classifier with Local and Global Features for High Spatial Resolution Remote Sensing Imagery. IEEE Geosci. Remote Sens. Lett. 2016, 13, 1–5. [Google Scholar] [CrossRef]
  16. Lazebnik, S.; Schmid, C.; Ponce, J. Beyond Bags of Features: Spatial Pyramid Matching for Recognizing Natural Scene Categories. In Proceedings of the 2006 IEEE Computer Society Conference on Computer Vision and Pattern Recognition (CVPR’06), New York, NY, USA, 17–22 June 2006. [Google Scholar]
  17. Yi, Y.; Newsam, S. Spatial pyramid co-occurrence for image classification. In Proceedings of the 2011 International Conference on Computer Vision, Barcelona, Spain, 6–13 November 2011. [Google Scholar]
  18. Zhang, X.; Du, S. A Linear Dirichlet Mixture Model for decomposing scenes: Application to analyzing urban functional zonings. Remote Sens. Environ. 2015, 169, 37–49. [Google Scholar] [CrossRef]
  19. Zhao, W.; Du, S. Scene classification using multi-scale deeply described visual words. Int. J. Remote Sens. 2016, 37, 4119–4131. [Google Scholar] [CrossRef]
  20. Negri, R.G.; Silva, E.A.; Casaca, W. Inducing Contextual Classifications with Kernel Functions Into Support Vector Machines. IEEE Geosci. Remote Sens. Lett. 2018, 15, 962–966. [Google Scholar] [CrossRef]
  21. Han, W.; Feng, R.; Wang, L.; Gao, L. Adaptive Spatial-Scale-Aware Deep Convolutional Neural Network for High-Resolution Remote Sensing Imagery Scene Classification. In Proceedings of the IGARSS 2018—2018 IEEE International Geoscience and Remote Sensing Symposium, Valencia, Spain, 22–27 July 2018; pp. 4736–4739. [Google Scholar]
  22. Du, S.; Du, S.; Liu, B.; Zhang, X. Context-Enabled Extraction of Large-Scale Urban Functional Zones from Very-High-Resolution Images: A Multiscale Segmentation Approach. Remote Sens. 2019, 11, 1902. [Google Scholar] [CrossRef] [Green Version]
  23. Srivastava, S.; Vargas-Muñoz, J.E.; Tuia, D. Understanding urban landuse from the above and ground perspectives: A deep learning, multimodal solution. Remote Sens. Environ. 2019, 228, 129–143. [Google Scholar] [CrossRef] [Green Version]
  24. Zhao, W.; Bo, Y.; Chen, J.; Tiede, D.; Blaschke, T.; Emery, W.J. Exploring semantic elements for urban scene recognition: Deep integration of high-resolution imagery and OpenStreetMap (OSM). ISPRS J. Photogramm. Remote Sens. 2019, 151, 237–250. [Google Scholar] [CrossRef]
  25. Zhao, W.; Du, S.; Wang, Q.; Emery, W.J. Contextually guided very-high-resolution imagery classification with semantic segments. ISPRS J. Photogramm. Remote Sens. 2017, 132, 48–60. [Google Scholar] [CrossRef]
  26. Zhong, Y.; Wu, S.; Zhao, B. Scene Semantic Understanding Based on the Spatial Context Relations of Multiple Objects. Remote Sens. 2017, 9, 1030. [Google Scholar] [CrossRef] [Green Version]
  27. Qi, K.; Yang, C.; Hu, C.; Guan, Q.; Tian, W.; Shen, S.; Peng, F. Polycentric Circle Pooling in Deep Convolutional Networks for High-Resolution Remote Sensing Image Recognition. IEEE J. Sel. Top. Appl. Earth Obs. Remote Sens. 2020, 13, 632–641. [Google Scholar] [CrossRef]
  28. Jozdani, E.S.; Johnson, A.B.; Chen, D. Comparing Deep Neural Networks, Ensemble Classifiers, and Support Vector Machine Algorithms for Object-Based Urban Land Use/Land Cover Classification. Remote Sens. 2019, 11, 1713. [Google Scholar] [CrossRef] [Green Version]
  29. Zhang, X.; Du, S.; Zheng, Z. Heuristic sample learning for complex urban scenes: Application to urban functional-zone mapping with VHR images and POI data. ISPRS J. Photogramm. Remote Sens. 2020, 161, 1–12. [Google Scholar] [CrossRef]
  30. Qi, K.; Guan, Q.; Yang, C.; Peng, F.; Shen, S.; Wu, H. Concentric Circle Pooling in Deep Convolutional Networks for Remote Sensing Scene Classification. Remote Sens. 2018, 10, 934. [Google Scholar] [CrossRef] [Green Version]
  31. Zhang, C.; Sargent, I.; Pan, X.; Li, H.; Gardiner, A.; Hare, J.; Atkinson, P.M. An object-based convolutional neural network (OCNN) for urban land use classification. Remote Sens. Environ. 2018, 216, 57–70. [Google Scholar] [CrossRef] [Green Version]
  32. Zhou, W.; Ming, D.; Lv, X.; Zhou, K.; Bao, H.; Hong, Z. SO–CNN based urban functional zone fine division with VHR remote sensing image. Remote Sens. Environ. 2020, 236, 111458. [Google Scholar] [CrossRef]
  33. Lv, X.; Ming, D.; Lu, T.; Zhou, K.; Wang, M.; Bao, H. A New Method for Region-Based Majority Voting CNNs for Very High Resolution Image Classification. Remote Sens. 2018, 10, 1946. [Google Scholar] [CrossRef] [Green Version]
  34. Zhai, Y.; Yao, Y.; Guan, Q.; Liang, X.; Li, X.; Pan, Y.; Yue, H.; Yuan, Z.; Zhou, J. Simulating urban land use change by integrating a convolutional neural network with vector-based cellular automata. Int. J. Geogr. Inf. Sci. 2020, 1–25. [Google Scholar] [CrossRef]
  35. Han, W.; Feng, R.; Wang, L.; Chen, J. Supervised Generative Adversarial Network Based Sample Generation for Scene Classification. In Proceedings of the IGARSS 2019—2019 IEEE International Geoscience and Remote Sensing Symposium, Yokohama, Japan, 28 July–2 August 2019; pp. 3041–3044. [Google Scholar]
  36. Fan, R.; Wang, L.; Feng, R.; Zhu, Y. Attention based Residual Network for High-Resolution Remote Sensing Imagery Scene Classification. In Proceedings of the IGARSS 2019—2019 IEEE International Geoscience and Remote Sensing Symposium, Yokohama, Japan, 28 July–2 August 2019; pp. 1346–1349. [Google Scholar]
  37. Hu, T.; Yang, J.; Li, X.; Gong, P. Mapping Urban Land Use by Using Landsat Images and Open Social Data. Remote Sens. 2016, 8, 151. [Google Scholar] [CrossRef]
  38. Schultz, M.; Voss, J.; Auer, M.; Carter, S.; Zipf, A. Open land cover from OpenStreetMap and remote sensing. Int. J. Appl. Earth Obs. Geoinf. 2017, 63, 206–213. [Google Scholar] [CrossRef]
  39. Yao, Y.; Li, X.; Liu, X.; Liu, P.; Liang, Z.; Zhang, J.; Mai, K. Sensing spatial distribution of urban land use by integrating points-of-interest and Google Word2Vec model. Int. J. Geogr. Inf. Sci. 2017, 31, 825–848. [Google Scholar] [CrossRef]
  40. Zhai, W.; Bai, X.; Shi, Y.; Han, Y.; Peng, Z.R.; Gu, C. Beyond Word2vec: An approach for urban functional region extraction and identification by combining Place2vec and POIs. Comput. Environ. Urban Syst. 2019, 74, 1–12. [Google Scholar] [CrossRef]
  41. Zhong, C.; Huang, X.; Müller Arisona, S.; Schmitt, G.; Batty, M. Inferring building functions from a probabilistic model using public transportation data. Comput. Environ. Urban Syst. 2014, 48, 124–137. [Google Scholar]
  42. Mu, L.; Wang, L.; Wang, Y.; Chen, X.; Han, W. Urban Land Use and Land Cover Change Prediction via Self-Adaptive Cellular Based Deep Learning with Multisourced Data. IEEE J. Sel. Top. Appl. Earth Obs. Remote Sens. 2019, 12, 5233–5247. [Google Scholar] [CrossRef]
  43. Johnson, B.A.; Iizuka, K.; Bragais, M.A.; Endo, I.; Magcale-Macandog, D.B. Employing crowdsourced geographic data and multi-temporal/multi-sensor satellite imagery to monitor land cover change: A case study in an urbanizing region of the Philippines. Comput. Environ. Urban Syst. 2017, 64, 184–193. [Google Scholar] [CrossRef]
  44. Zhang, Y.; Li, Q.; Tu, W.; Mai, K.; Yao, Y.; Chen, Y. Functional urban land use recognition integrating multi-source geospatial data and cross-correlations. Comput. Environ. Urban Syst. 2019, 78, 101374. [Google Scholar] [CrossRef]
  45. Guan, Q.; Ren, S.; Yao, Y.; Liang, X.; Zhou, J.; Yuan, Z.; Dai, L. Revealing the Behavioral Patterns of Different Socioeconomic Groups in Cities with Mobile Phone Data and House Price Data. J. Geo-Inf. Sci. 2020, 22, 100–112. [Google Scholar]
  46. Tu, W.; Hu, Z.; Li, L.; Cao, J.; Jiang, J.; Li, Q.; Li, Q. Portraying Urban Functional Zones by Coupling Remote Sensing Imagery and Human Sensing Data. Remote Sens. 2018, 10, 141. [Google Scholar] [CrossRef] [Green Version]
  47. Kang, J.; Körner, M.; Wang, Y.; Taubenböck, H.; Zhu, X.X. Building instance classification using street view images. ISPRS J. Photogramm. Remote Sens. 2018, 145, 44–59. [Google Scholar] [CrossRef]
  48. Chen, J.; Liu, H.; Hou, J.; Yang, M.; Deng, M. Improving Building Change Detection in VHR Remote Sensing Imagery by Combining Coarse Location and Co-Segmentation. ISPRS Int. J. Geo-Inf. 2018, 7, 213. [Google Scholar] [CrossRef] [Green Version]
  49. Nogueira, K.; Penatti, O.A.B.; dos Santos, J.A. Towards better exploiting convolutional neural networks for remote sensing scene classification. Pattern Recognit. 2017, 61, 539–556. [Google Scholar] [CrossRef] [Green Version]
  50. Maggiori, E.; Tarabalka, Y.; Charpiat, G.; Alliez, P. Convolutional Neural Networks for Large-Scale Remote-Sensing Image Classification. IEEE Trans. Geosci. Remote Sens. 2017, 55, 645–657. [Google Scholar] [CrossRef] [Green Version]
  51. Zhang, X.; Du, S. Learning Self-Adaptive Scales for Extracting Urban Functional Zones from Very-High-Resolution Satellite Images. In Proceedings of the IGARSS 2019—2019 IEEE International Geoscience and Remote Sensing Symposium, Yokohama, Japan, 28 July–2 August 2019; pp. 7423–7426. [Google Scholar]
  52. Zhang, X.; Du, S.; Wang, Q.; Zhou, W. Multiscale Geoscene Segmentation for Extracting Urban Functional Zones from VHR Satellite Images. Remote Sens. 2018, 10, 281. [Google Scholar] [CrossRef] [Green Version]
  53. Zhang, X.; Du, S.; Wang, Q. Integrating bottom-up classification and top-down feedback for improving urban land-cover and functional-zone mapping. Remote Sens. Environ. 2018, 212, 231–248. [Google Scholar] [CrossRef]
  54. Johnson, A.B.; Jozdani, E.S. Identifying Generalizable Image Segmentation Parameters for Urban Land Cover Mapping through Meta-Analysis and Regression Tree Modeling. Remote Sens. 2018, 10, 73. [Google Scholar] [CrossRef] [Green Version]
  55. Xu, L.; Ming, D.; Zhou, W.; Bao, H.; Chen, Y.; Ling, X. Farmland Extraction from High Spatial Resolution Remote Sensing Images Based on Stratified Scale Pre-Estimation. Remote Sens. 2019, 11, 108. [Google Scholar] [CrossRef] [Green Version]
  56. Zhou, K.; Ming, D.; Lv, X.; Fang, J.; Wang, M. CNN-Based Land Cover Classification Combining Stratified Segmentation and Fusion of Point Cloud and Very High-Spatial Resolution Remote Sensing Image Data. Remote Sens. 2019, 11, 2065. [Google Scholar] [CrossRef] [Green Version]
  57. Guo, X.; Li, X.; Li, L.; Dong, Q. An Efficient Image Quality Assessment Guidance Method for Unmanned Aerial Vehicle. In Intelligent Robotics and Applications; Yu, H., Liu, J., Liu, L., Ju, Z., Liu, Y., Zhou, D., Eds.; Springer International Publishing: Cham, Switzerland, 2019; pp. 52–62. [Google Scholar]
  58. Ming, D.; Li, J.; Wang, J.; Zhang, M. Scale parameter selection by spatial statistics for GeOBIA: Using mean-shift based multi-scale segmentation as an example. ISPRS J. Photogramm. Remote Sens. 2015, 106, 28–41. [Google Scholar] [CrossRef]
  59. Drăguţ, L.; Csillik, O.; Eisank, C.; Tiede, D. Automated parameterisation for multi-scale image segmentation on multiple layers. ISPRS J. Photogramm. Remote Sens. 2014, 88, 119–127. [Google Scholar] [CrossRef] [Green Version]
  60. Du, S.; Zhang, X.; Luo, G. Urban scene classification with VHR images. In Proceedings of the 2017 Joint Urban Remote Sensing Event (JURSE), Dubai, UAE, 6–8 March 2017; pp. 1–4. [Google Scholar]
  61. Sun, S.; Chen, Q. Hierarchical Distance Metric Learning for Large Margin Nearest Neighbor Classification. Int. J. Pattern Recognit. Artif. Intell. 2011, 25, 1073–1087. [Google Scholar] [CrossRef]
  62. Bailey, T.; Jain, A.K. A Note on Distance-Weighted k-Nearest Neighbor Rules. IEEE Trans. Syst. Man Cybern. 2007, 8, 311–313. [Google Scholar]
  63. Tsyurmasto, P.; Zabarankin, M.; Uryasev, S. Value-at-risk support vector machine: Stability to outliers. J. Comb. Optim. 2014, 28, 218–232. [Google Scholar] [CrossRef]
  64. Zhang, C.; Sargent, I.; Pan, X.; Li, H.; Gardiner, A.; Hare, J.; Atkinson, P.M. Joint Deep Learning for land cover and land use classification. Remote Sens. Environ. 2019, 221, 173–187. [Google Scholar] [CrossRef] [Green Version]
  65. Chen, Y.; Ming, D.; Lv, X. Superpixel based land cover classification of VHR satellite image combining multi-scale CNN and scale parameter estimation. Earth Sci. Inform. 2019, 12, 341–363. [Google Scholar] [CrossRef]
  66. Lv, X.; Ming, D.; Chen, Y.; Wang, M. Very high resolution remote sensing image classification with SEEDS-CNN and scale effect analysis for superpixel CNN classification. Int. J. Remote Sens. 2019, 40, 506–531. [Google Scholar] [CrossRef]
  67. Zhang, X.; Du, S.; Yuan, Z. Semantic and Spatial Co-Occurrence Analysis on Object Pairs for Urban Scene Classification. IEEE J. Sel. Top. Appl. Earth Obs. Remote Sens. 2018, 11, 2630–2643. [Google Scholar] [CrossRef]
  68. Szegedy, C.; Liu, W.; Jia, Y.; Sermanet, P.; Reed, S.; Anguelov, D.; Erhan, D.; Vanhoucke, V.; Rabinovich, A. Going Deeper with Convolutions. In Proceedings of the 2015 IEEE Conference on Computer Vision and Pattern Recognition (CVPR), Boston, MA, USA, 7–12 June 2015. [Google Scholar]
  69. Szegedy, C.; Ioffe, S.; Vanhoucke, V.; Alemi, A. Inception-v4, Inception-ResNet and the Impact of Residual Connections on Learning. In Proceedings of the Thirty-First AAAI Conference on Artificial Intelligence, San Francisco, CA, USA, 4–10 February 2017. [Google Scholar]
  70. Zhang, C.; Harrison, P.A.; Pan, X.; Li, H.; Sargent, I.; Atkinson, P.M. Scale Sequence Joint Deep Learning (SS-JDL) for land use and land cover classification. Remote Sens. Environ. 2020, 237, 111593. [Google Scholar] [CrossRef]
  71. Qi, K.; Yang, C.; Guan, Q.; Wu, H.; Gong, J. A Multiscale Deeply Described Correlatons-Based Model for Land-Use Scene Classification. Remote Sens. 2017, 9, 917. [Google Scholar] [CrossRef] [Green Version]
  72. Lu, X.; Zhong, Y.; Zhao, J. Multi-Scale Enhanced Deep Network for Road Detection. In Proceedings of the IGARSS 2019—2019 IEEE International Geoscience and Remote Sensing Symposium, Yokohama, Japan, 28 July–2 August 2019; pp. 3947–3950. [Google Scholar]
  73. He, D.; Zhong, Y.; Zhang, L. Spectral-Spatial-Temporal MAP-Based Sub-Pixel Mapping for Land-Cover Change Detection. IEEE Trans. Geosci. Remote Sens. 2019, 58, 1696–1717. [Google Scholar] [CrossRef]
  74. Wei, L.; Yu, M.; Zhong, Y.; Zhao, J.; Liang, Y.; Hu, X. Spatial–Spectral Fusion Based on Conditional Random Fields for the Fine Classification of Crops in UAV-Borne Hyperspectral Remote Sensing Imagery. Remote Sens. 2019, 11, 780. [Google Scholar] [CrossRef] [Green Version]
  75. Yao, Y.; Liu, P.; Hong, Y.; Liang, Z.; Wang, R.; Guan, Q.; Chen, J. Fine-scale intra- and inter-city commercial store site recommendations using knowledge transfer. Trans. GIS 2019, 23, 1029–1047. [Google Scholar] [CrossRef]
  76. Chen, J.; Han, Y.; Wan, L.; Zhou, X.; Deng, M. Geospatial relation captioning for high-spatial-resolution images by using an attention-based neural network. Int. J. Remote Sens. 2019, 40, 6482–6498. [Google Scholar] [CrossRef]
Figure 1. Flowchart of the proposed urban functional zones recognition. DEF, Deeper Edge Features; DFCNN, Deeper-Feature Convolutional Neural Network; POI, point of interest; VHSRI, very high spatial resolution image.
Remotesensing 12 01088 g001
Figure 2. Flowchart of the stratified scale estimation strategy.
Remotesensing 12 01088 g002
Figure 3. Configuration of Deeper-Feature Convolutional Neural Network (DFCNN) framework.
Remotesensing 12 01088 g003
Figure 4. Working process of depthwise separable convolutions.
Remotesensing 12 01088 g004
Figure 5. Physical semantic recognition of buildings.
Remotesensing 12 01088 g005
Figure 6. Social functional semantic recognition of buildings.
Remotesensing 12 01088 g006
Figure 7. Social functional semantic recognition of buildings.
Remotesensing 12 01088 g007
Figure 8. (A) Google Maps; (B) OpenStreetMap (OSM); (C) point of interests (POIs).
Remotesensing 12 01088 g008
Figure 9. The average local variance and its relative parameters. (a) The average local variance (ALV); (b) The first-order rate of change in ALV (ROC-ALV); (c) The second-order rate of change in ALV (SCROC-ALV) is used to assess the dynamics of ALV along with hs.
Remotesensing 12 01088 g009aRemotesensing 12 01088 g009b
Figure 10. Histogram of local variance.
Remotesensing 12 01088 g010
Figure 11. Results of the stratified scale estimation. Different colors represent different areas; each region is individually scaled to obtain the object.
Remotesensing 12 01088 g011
Figure 12. The ground truth validation points of the image.
Remotesensing 12 01088 g012
Figure 13. The demonstration of 10 single-scale classification results.
Remotesensing 12 01088 g013
Figure 14. The demonstration of 10 single-scale building extractions.
Remotesensing 12 01088 g014
Figure 15. The building accuracy of all single scales.
Remotesensing 12 01088 g015
Figure 16. The demonstration of a variety of POI kernel density analysis results.
Remotesensing 12 01088 g016
Figure 17. Buildings with social functional semantic refinement using the DFCNN model. The three sub-regions (AC) indicate the versatility of the urban functional zones.
Remotesensing 12 01088 g017
Figure 18. The demonstration of urban functional zones.
Remotesensing 12 01088 g018
Figure 19. Single-scale accuracy of building extraction.
Remotesensing 12 01088 g019
Figure 20. Deeper edge feature map of the experimental region. The three sub-regions (AC) show details of the deeper edge features.
Remotesensing 12 01088 g020
Figure 21. The demonstration of Random Forest (RF) and AlexNet classification results.
Remotesensing 12 01088 g021
Figure 22. The demonstration of Alex and DFCNN building extraction results. The sub-regions (A,B) show details of building extraction with different methods.
Remotesensing 12 01088 g022
Figure 23. The demonstration of six multi-scale classification results.
Remotesensing 12 01088 g023
Figure 24. The demonstration of six multi-scale building extractions.
Remotesensing 12 01088 g024
Figure 25. The classification accuracy of six multi-scale building extractions.
Remotesensing 12 01088 g025
Table 1. The parameters of the stratified scale estimation.
ZonesA1A2A3A4A5A6A7A8A9A10A11A12
hs244340383840223740383739
hr657577688877
M144462400361361400121342400361342380
Table 2. The training and validation volumes of the image.
CategoryBuildingVegetationSoilShadowRoadGrassWater
Training34981956132926782668160339
Validation8754893317006724085
Table 3. The ground truth validation volumes of the image.
CategoryBuildingTreeSoilShadowRoadGrassWater
Number20751055100550101012595
Table 4. The accuracy of urban functional zones.
CategoryUrbanGreenIndustrial DistrictsPublic ServicesResidential DistrictsCommercial DistrictsHospitalsSchoolsShanty Towns
Accuracy (%)1.00.9780.9150.9760.9721.01.01.0
Table 5. Single-scale accuracy of building extraction.
Scale1535557595115135155175195
Original (%)0.8580.9160.9230.9340.9420.9300.9360.9460.9390.938
Original + DEFM (%)0.8670.9270.9370.9510.9620.9520.960.970.9650.963
Difference (%)0.91.11.41.72.02.22.42.42.62.5
Table 6. The accuracy of the three methods.
MethodsRandom Forest AlexNetDFCNN
Accuracy of Allover (%)80.9994.8796.65
Accuracy of Buildings (%)67.9093.3097.0

