Article

Spatio-Temporal Variation in AOD and Correlation Analysis with PAR and NPP in China from 2001 to 2017

1
State Key Laboratory of Resources and Environmental Information System, Institute of Geographic Sciences and Natural Resources Research, Chinese Academy of Sciences, Beijing 100049, China
2
The Hong Kong Polytechnic University, Hong Kong 999077, China
*
Author to whom correspondence should be addressed.
Remote Sens. 2020, 12(6), 976; https://doi.org/10.3390/rs12060976
Submission received: 14 January 2020 / Revised: 9 March 2020 / Accepted: 14 March 2020 / Published: 18 March 2020
(This article belongs to the Section Atmospheric Remote Sensing)

Abstract

:
Atmospheric aerosols can elicit variations in how much solar radiation reaches the ground surface due to scattering and absorption, which may affect plant photosynthesis and carbon uptake in terrestrial ecosystems. In this study, the spatio-temporal variations in aerosol optical depth (AOD) are compared with that in photosynthetically active radiation (PAR) and net primary productivity (NPP) during 2001–2017 in China using multiple remote sensing data. The correlations between them are analyzed at different scales. Overall, the AOD exhibited a northeast-to-southwest decreasing pattern in space. A national increasing trend of 0.004 year−1 and a declining trend of −0.007 year−1 of AOD are observed during 2001–2008 and 2009–2017. The direct PAR (PARdir) and diffuse PAR (PARdif) present consistent and opposite tendency with AOD during two periods, respectively. The total PAR (PARtotal) shows a similar variation pattern with PARdir. In terms of annual variation, the peaks of AOD coincide with the peaks of PARdif and the troughs of PARdir, indicating that aerosols have a significant positive impact on PARdir and a negative impact on PARdif. Furthermore, the PARdir has a stronger negative association with AOD than the positive correlation between PARdif and AOD at national and regional scales, indicating that PARdir is more sensitive to aerosol changes. The NPP has higher values in the east than in the west and exhibits a significant increasing trend of 0.035 gCm−2day−1 after 2008. The NPP has a negative correlation (−0.4–0) with AOD and PARdif and a positive correlation (0–0.4) with PARdir in most areas of China. The area covered by forests has the highest NPP-PAR correlation, indicating that NPP in forests is more sensitive to the PAR than is the NPP in grasslands and croplands. This study is beneficial for interpreting the aerosol-induced PAR impact on plant growth and for predicting plant production on haze days.

Graphical Abstract

1. Introduction

Aerosols—solid or liquid particles suspended in the air with diameters ranging from 0.001 to 100 µm—are one of the main sources of air pollution and play an important role in the atmospheric environment [1]. The amount of aerosols can be measured by aerosol optical depth (AOD), which is the integrated extinction coefficient over a vertical column of a unit cross-section [2]. Besides the influence on climate and public health, aerosol particles are believed to influence solar radiation by scattering and absorption and especially affect photosynthetically active radiation (PAR) (400–700 nm), which possibly affects plant growth and production [3,4]. Monitoring the variation of AOD is significant not only for the detection of solar radiation change but also for better understanding of the aerosol-induced radiation impact on plant growth.
Many studies have been conducted in terms of the spatio-temporal variations in AOD in different scales and time periods over the past decades. He, et al. [5] studied the AOD trend in China during 2002–2015 and analyzed the impact factors including terrain, vegetation and socio-economic indices. That study showed an increasing trend in AOD during 2002–2007 and a decreasing trend during 2008–2015. In addition, AOD was found to have a weak relation with NDVI and a strong relation with elevation and population. Wang, et al. [6] calculated the trend in AOD in north China in the period of 2001–2016 and found various trends in different regions. By using MODIS and MERRA-2 datasets from 1980 to 2017, Qin, et al. [7] found an increasing trend in southeastern China and a decrease trend in northernmost China. That study also showed that the dust and SO4 are the main constituents of aerosols. Alfaro-Contreras, et al. [8] analyzed the AOD trend over the global ocean during 2000–2015. Results showed AOD has a trend of 0.002 decade−1 and is highly correlated with shortwave aerosol radiative effect (SWARE), which is the impact of aerosols on shortwave radiation. However, most of these studies focus on spatio-temporal variation in AOD and its correlations with NDVI, terrain, solar radiation, or population. Few studies uncovered the underlying relationships between AOD and plant production. The aerosol particles can lead to the decrease in direct PAR and increase in diffuse PAR, which may influence the plant photosynthesis and production indirectly. This was also proved by some simulation studies based on the process-based models [3,9,10,11,12,13]. The production of terrestrial vegetation is often represented by net primary productivity (NPP), which quantifies the difference between the organic matter produced by photosynthesis and the loss of maintenance and growth respiration [10,14]. Cohan, et al. [10] pointed out that NPP peaks under moderately thick aerosol loadings on clear days using canopy photosynthesis models. Kumar and Kumar [11] predicted that the decrease or increase in rice yield caused by aerosol-induced PAR impact could range from −28% to +44% depending on sky conditions by using crop model. However, the correlations between AOD, PAR and NPP in reality have still not been comprehensively understood.
China has experienced persistent air pollution because of its fast-developing economy and urbanization [15]. In the meanwhile, China also accounts for 25% of the total net increase in green leaf area globally [16]. The correlations between AOD, PAR and plant production over China in different regions, seasons and vegetation types are still not well known. China has various weather conditions, aerosol properties, and vegetation covers in different areas, making the impacts of aerosols on solar radiation change and plant growing heterogeneous.
In order to extend our understanding of how the plant production responds to the AOD and PAR change, this paper investigates the spatio-temporal characteristics of AOD and its correlations with PAR and NPP in China during 2001–2017 using multiple types of satellite data (MOD08, CERES, MOD17). The variation in AOD in different seasons, vegetation types and typical regions is compared with that in PAR and NPP at the national, regional and pixel scales. Considering that seasonal effects might bias the significance of long-term trends, we adopted the Seasonal Kendall test, which is insensitive to the data seasonality, to investigate the spatio-temporal trend of AOD, PAR and NPP.
This paper is organized as follows. Section 2 describes the materials used and the methodology. Section 3 presents and discusses the results of the variations AOD and its interrelations with PAR, and NPP in terms of annual distributions, seasonal changes and trends. Section 4 summarizes the main findings.

2. Materials and Methods
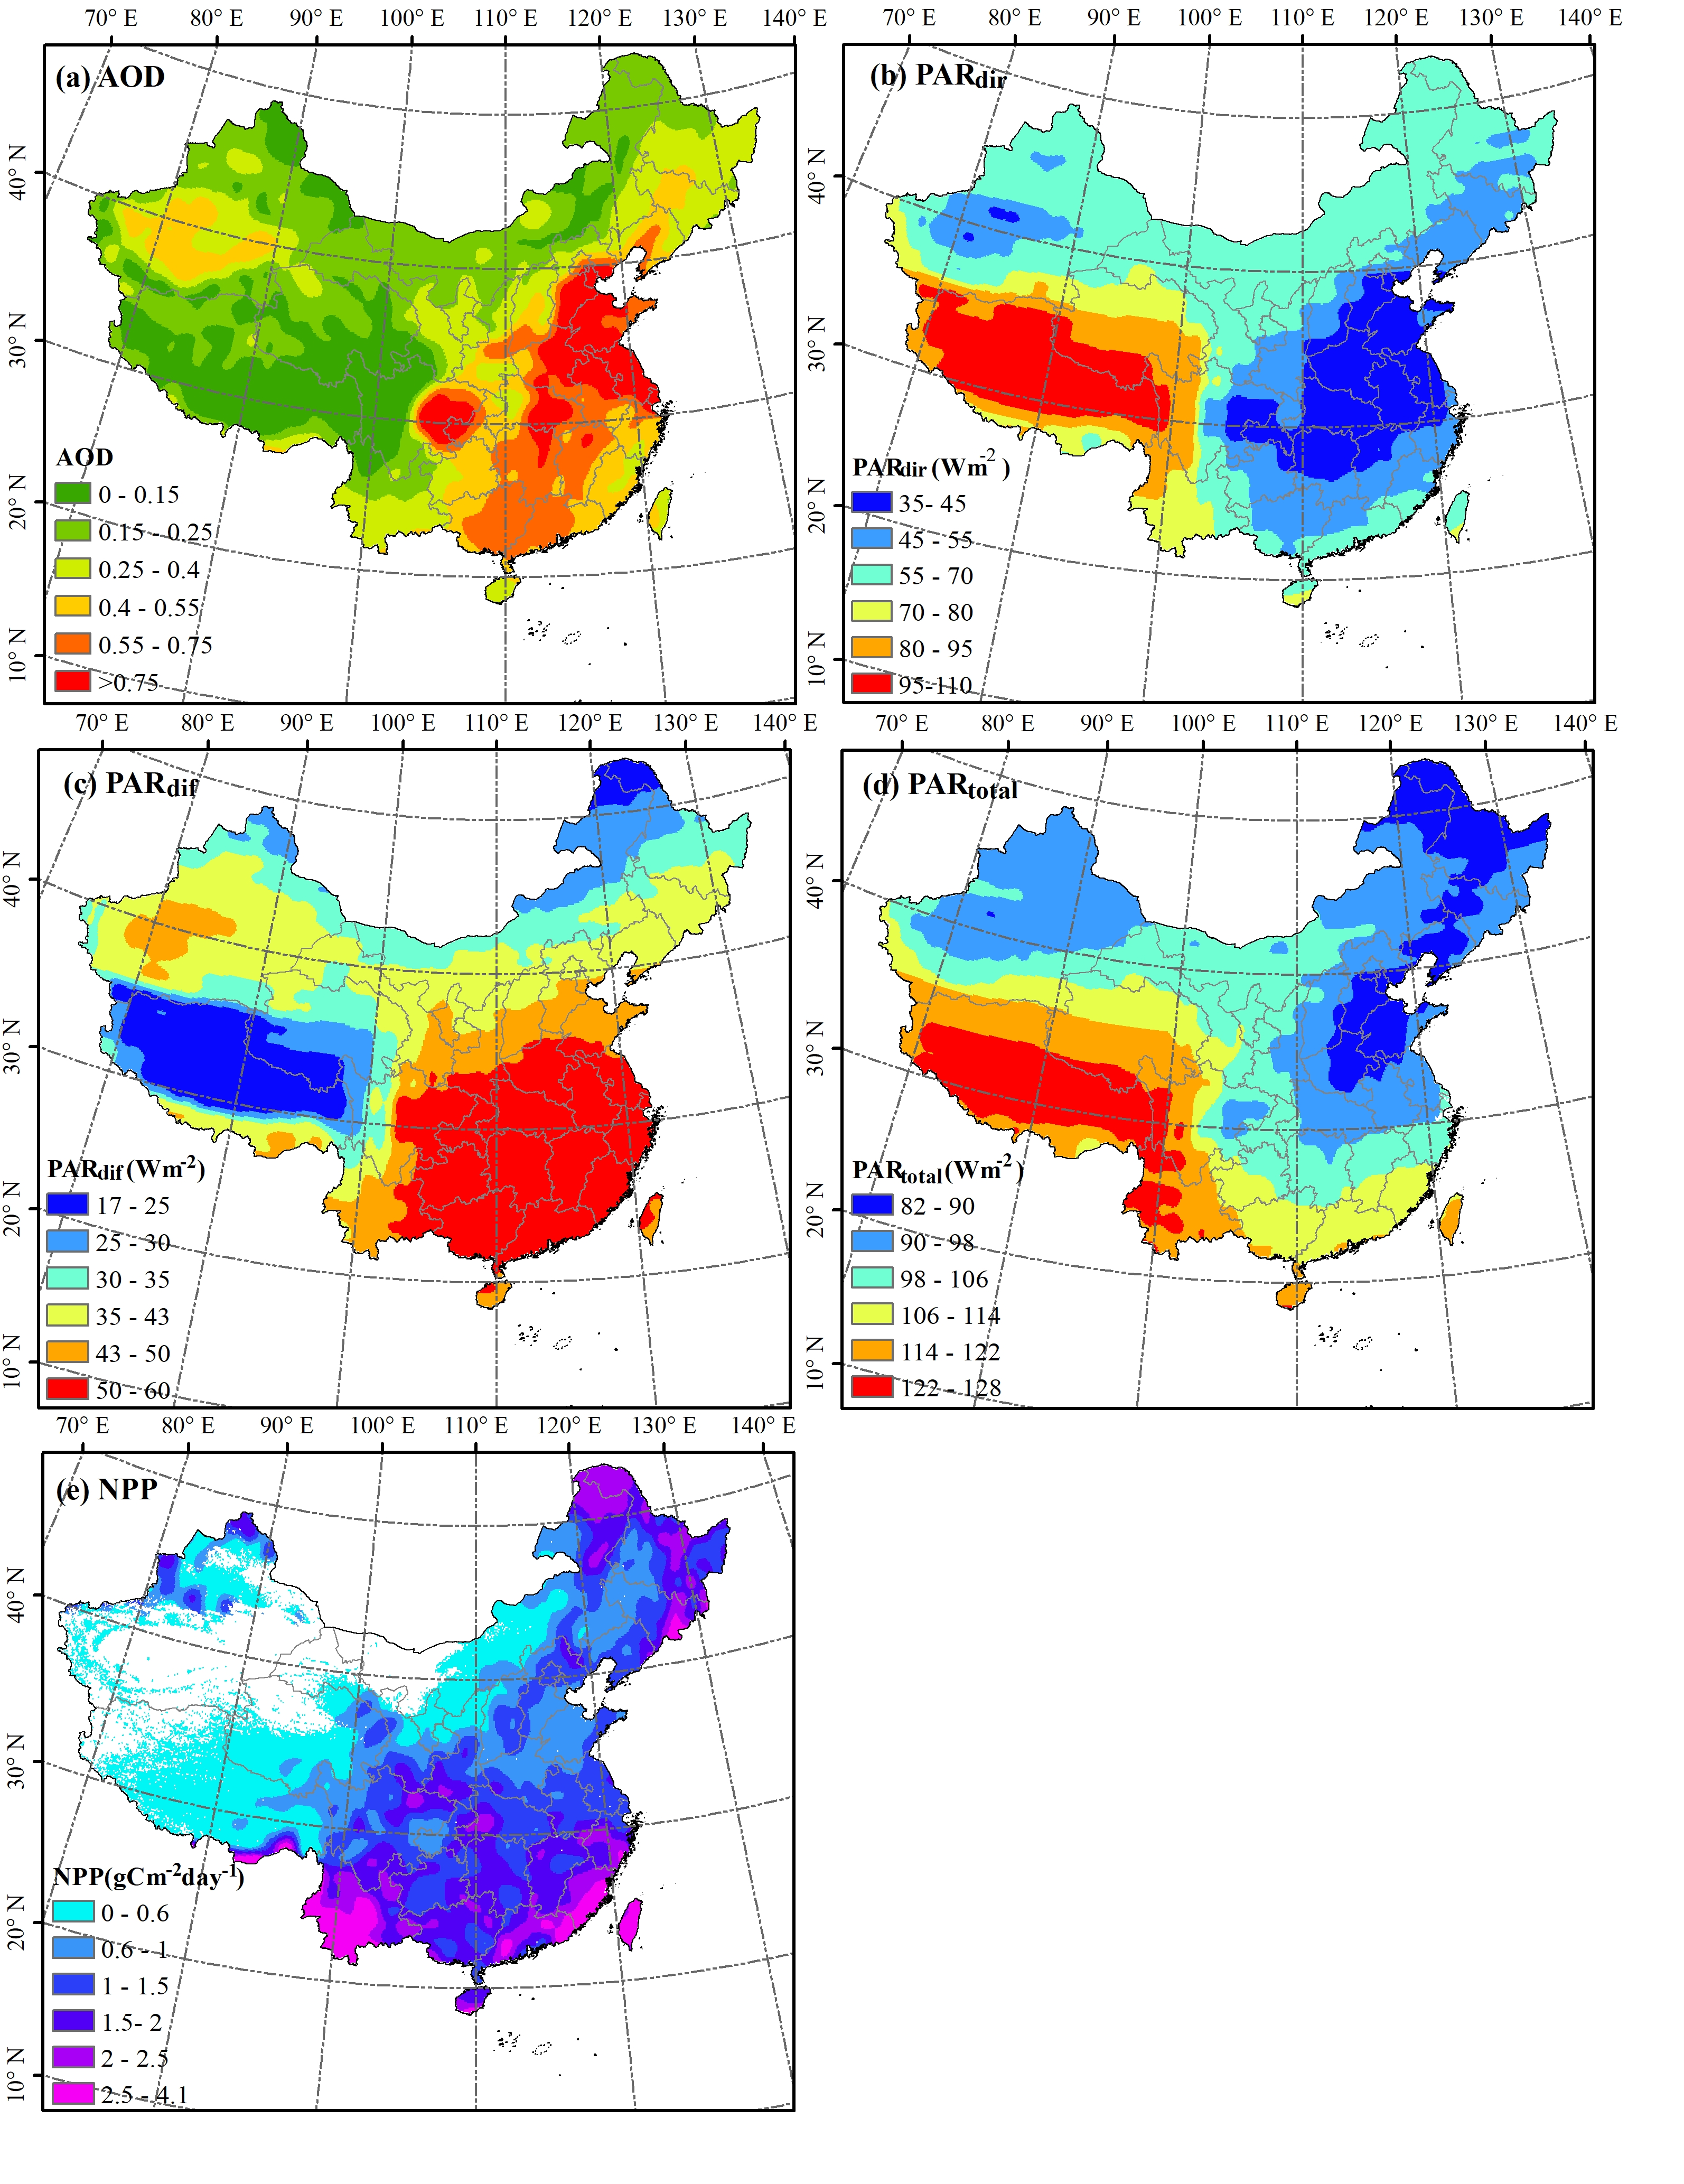
2.1. Study Area

The study was conducted in China, where the air pollution level exceeds the World Health Organization (WHO) standards in more than 90% of its cities [5]. The climate in China varies in space. Northwestern China often has dust storm events and is dominated by dust aerosol [6]. Southern China usually has more precipitation and higher temperature. The air pollution conditions in China vary with heterogeneous terrain and population. High elevation has fewer air pollutants while low terrain has high aerosol levels due to more anthropogenic discharges [5]. Five typical regions (Figure 1) are selected for regional analysis, including the North Plain (NP), Central China (CC), Yangtze River Delta (YRD), Sichuan Basin (SCB), and Guangdong Province. These regions suffer from the most serious aerosol pollution, and are the major grain-producing areas, which account for more than half of the total rice and wheat production in China [3].

2.2. Aerosol Data

The monthly combined Deep Blue and Dark Target (DB/DT) AOD dataset from 2001 to 2017 are derived from the MODIS C6 level-3 products (MOD08_M3). The MOD08_M3 product with 1° resolution were downloaded from NASA Level-1 and the Atmosphere Archive and Distribution System Distributed Active Archive Center (DAAC) (https://ladsweb.modaps.eosdis.nasa.gov/search/). The combined DB/DT dataset is available starting from the fall of 2014. This dataset is retrieved based on both DT and DB algorithms and has improvements in the Deep Blue algorithm for AOD retrieval over the bright surface [6,17]. The combined dataset preserves the quality of AOD retrievals and has a wider spatial coverage over land by improving the approaches of pixel selection, cloud mask and surface reflectance estimation [18]. The accuracy of DB/DT AOD is validated and has an RMSE (root-mean-square error) of 0.133–0.169 against Aerosol Robotic Network (AERONET) observations [18].

2.3. PAR Data

The monthly direct PAR (PARdir) and diffuse PAR (PARdif) data under a clear sky at a 1° × 1° grid are obtained from the SYN1deg edition 4.1 product of Clouds and the Earth’s Radiant Energy System (CERES). The total PAR (PARtotal) are calculated by the sum of PARdir and PARdif. The CERES PAR products are computed from the fluxes at the top of the atmosphere (TOA) and surface for the visible spectrum (400–700 nm) based on a radiation transfer model that takes clouds, temperature, water vapor from Aqua and Terra geostationary satellites and reanalysis databases as input data [19,20]. The CERES Ed4A products are available starting in 2017, and the downward fluxes are improved by updating the inputs (cloud properties, temperature and humidity profiles, surface albedo and aerosol) [21]. The monthly mean downward fluxes from the SYN1deg product were demonstrated to have good accuracy with a bias of 3 Wm−2 compared with the ground observations at 85 globally distributed sites [22]. The CERES PAR data are available on the website of https://ceres-tool.larc.nasa.gov/ord-tool/jsp/SYN1degEd41Selection.jsp. Because the AOD data are available only under cloudless conditions, the PARdir and PARdif of clear sky conditions are used in this study.

2.4. NPP Data

The NPP is the stored carbon after subtracting the maintenance and growth respiration from the total amount of organic matter fixed by plants [23,24]. It can be utilized as a measure of crop yield, grass biomass, and forest productivity [25]. The NPP data used in this study are obtained from the monthly and eight-day PSN (net photosynthesis) products (MOD17A2_M_PSN and MOD17A2H), which are level 4 MODIS products and are resampled to a spatial resolution of 1° × 1°. The NPP of MOD17 is calculated as carbon mass per unit area per day [25,26]. The algorithm of MOD17A2 NPP relies on the basic light-use efficiency (LUE) model. The MOD17A2 NPP data are computed from the PAR, fraction of absorbed photosynthetically active radiation (fAPAR) and leaf area index (LAI) obtained from another MODIS product (MOD15A2), meteorological data from the Data Assimilation Office (DAO) and biome-wise coefficients of biome properties lookup table (the BPLUT) [23].

2.5. Land Cover Data

The land cover data at a 500 m spatial resolution is achieved from the MODIS Land Cover Climate Modelling Grid Product (MCD12Q1, Collection 6). The dataset of the International Geosphere-Biosphere Programme (IGBP) classification is used to aggregate information into three broad vegetation classes in this study—forests, grasslands and croplands. The evergreen needleleaf forest, evergreen broadleaf forest, deciduous needleleaf forest, deciduous broadleaf forest and mixed forest are aggregated to Forests. Grasslands are grasslands dominated by herbaceous annuals. Croplands are composed of croplands and mosaics of croplands and cropland/natural vegetation [27]. Because the AOD, PAR and NPP data have a spatial resolution of 1° × 1° while the land cover data has a 500 m spatial resolution, the AOD, PAR and NPP data were oversampled from 1° × 1° to 500 m using spline interpolation to be consistent with the land cover data and to avoid the mixture of different vegetation classes.

2.6. Seasonal Kendall Trend Test

The Mann–Kendall method is a non-parametric statistical test method of trend detection for time series data [28,29]. This method can estimate the tendency regardless of whether data follow a normal distribution and is less influenced by outliers compared with linear regression [30,31]. The original hypothesis H0 states that the time series data have no trend, and the alternative hypothesis H1 is that a trend exists in the dataset. However, the test result may be influenced by the seasonality of the time series data [32]. As shown in the boxplots of Figure 2, the AOD, PARdir, PARdif, PARtotal and NPP exhibit evident seasonal characteristics, affecting the significance of long-term trend detection. Therefore, the Seasonal Kendall method is used in this study for the trend tests, and this method is insensitive to the seasonality of the data. The Seasonal Kendall method tests the trend in each season separately and then combines the results into one overall test [31]. As an adaption of the Seasonal Kendall test, although the Regional Kendall test considers the multiple locations across the entire area, the spatial clustering and autocorrelation could be challenging issues.
Assuming the time series sample X is made up of seasonal subsamples Xi (i = 1, 2, …12), the null hypothesis H0’ for the Seasonal Kendall is that the subsample Xi consists of independent and identically distributed random variables, while the alternative hypothesis H1’ is that an increasing or decreasing tendency exists in one or more season [32,33].
The test statistic for season i (i = 1, …,12) Si is defined as [32]:
S i = k = 1 n i 1 j = k + 1 n i s i g n ( x i j x i k ) ,
where n i is the number of samples in season i, x i j and x i k are the jth and kth sample in season i, sign ( x i j x i k ) is −1, 0 or 1 when x i j is smaller, equal or larger than x i k , respectively. The expectation of Si ( E ( S i ) ) is 0 and the variance V a r ( S i ) is calculated by Equation (2):
E ( S i ) = 0 V a r ( S i ) = n i ( n i 1 ) ( 2 n i + 5 ) t i t i ( t i 1 ) ( 2 t i + 5 ) 18 ,
where t i is the sample size of a given tie. The distribution of Si is normal under the limit as n i → ∞, then Seasonal Kendall statistic S is defined as the sum of Si ( i = 1 12 S i ). The total variance Var ( S ) is derived as
E ( S ) = 0 Var ( S ) = i = 1 12 V a r ( S i ) + i = 1 12 j = 1 , j i 12 c o v ( S i S l ) .
The data are assumed to be independent so that the covariance terms are equal to 0. The standardized test Z-statistic indicates the significance of the trend. When | z | > Z 1 α / 2 (α is the significance level and is 0.05 in this study), the time series data are considered to have an increasing or decreasing trend at the significance level of 0.05. The term Z 1 α / 2 is the percentile of the normal distribution of 1 − α/2.
z = { S 1 V a r ( S )   ( S > 0 )                 0             ( S = 0 ) S + 1 V a r ( S )   ( S < 0 )
The non-parametric robust estimate of the trend ( β i ) in season i can be calculated by the median value.
β i = M e d i a n [ x i j x i k j k ] .
The overall trend β is the median of the slope values ( β i ). The trend is increasing when β > 0 and decreasing when β < 0.

3. Results and Discussion

3.1. Spatio-temporal Variations in AOD, PAR and NPP

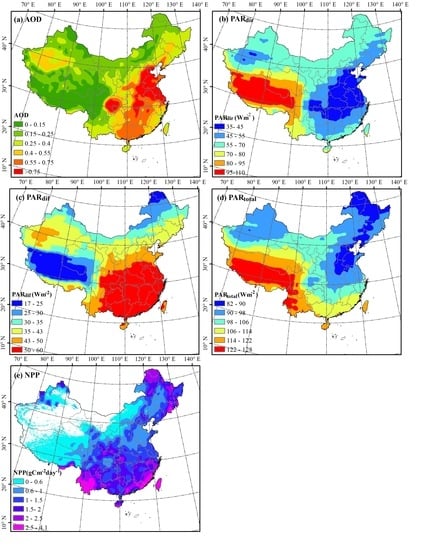
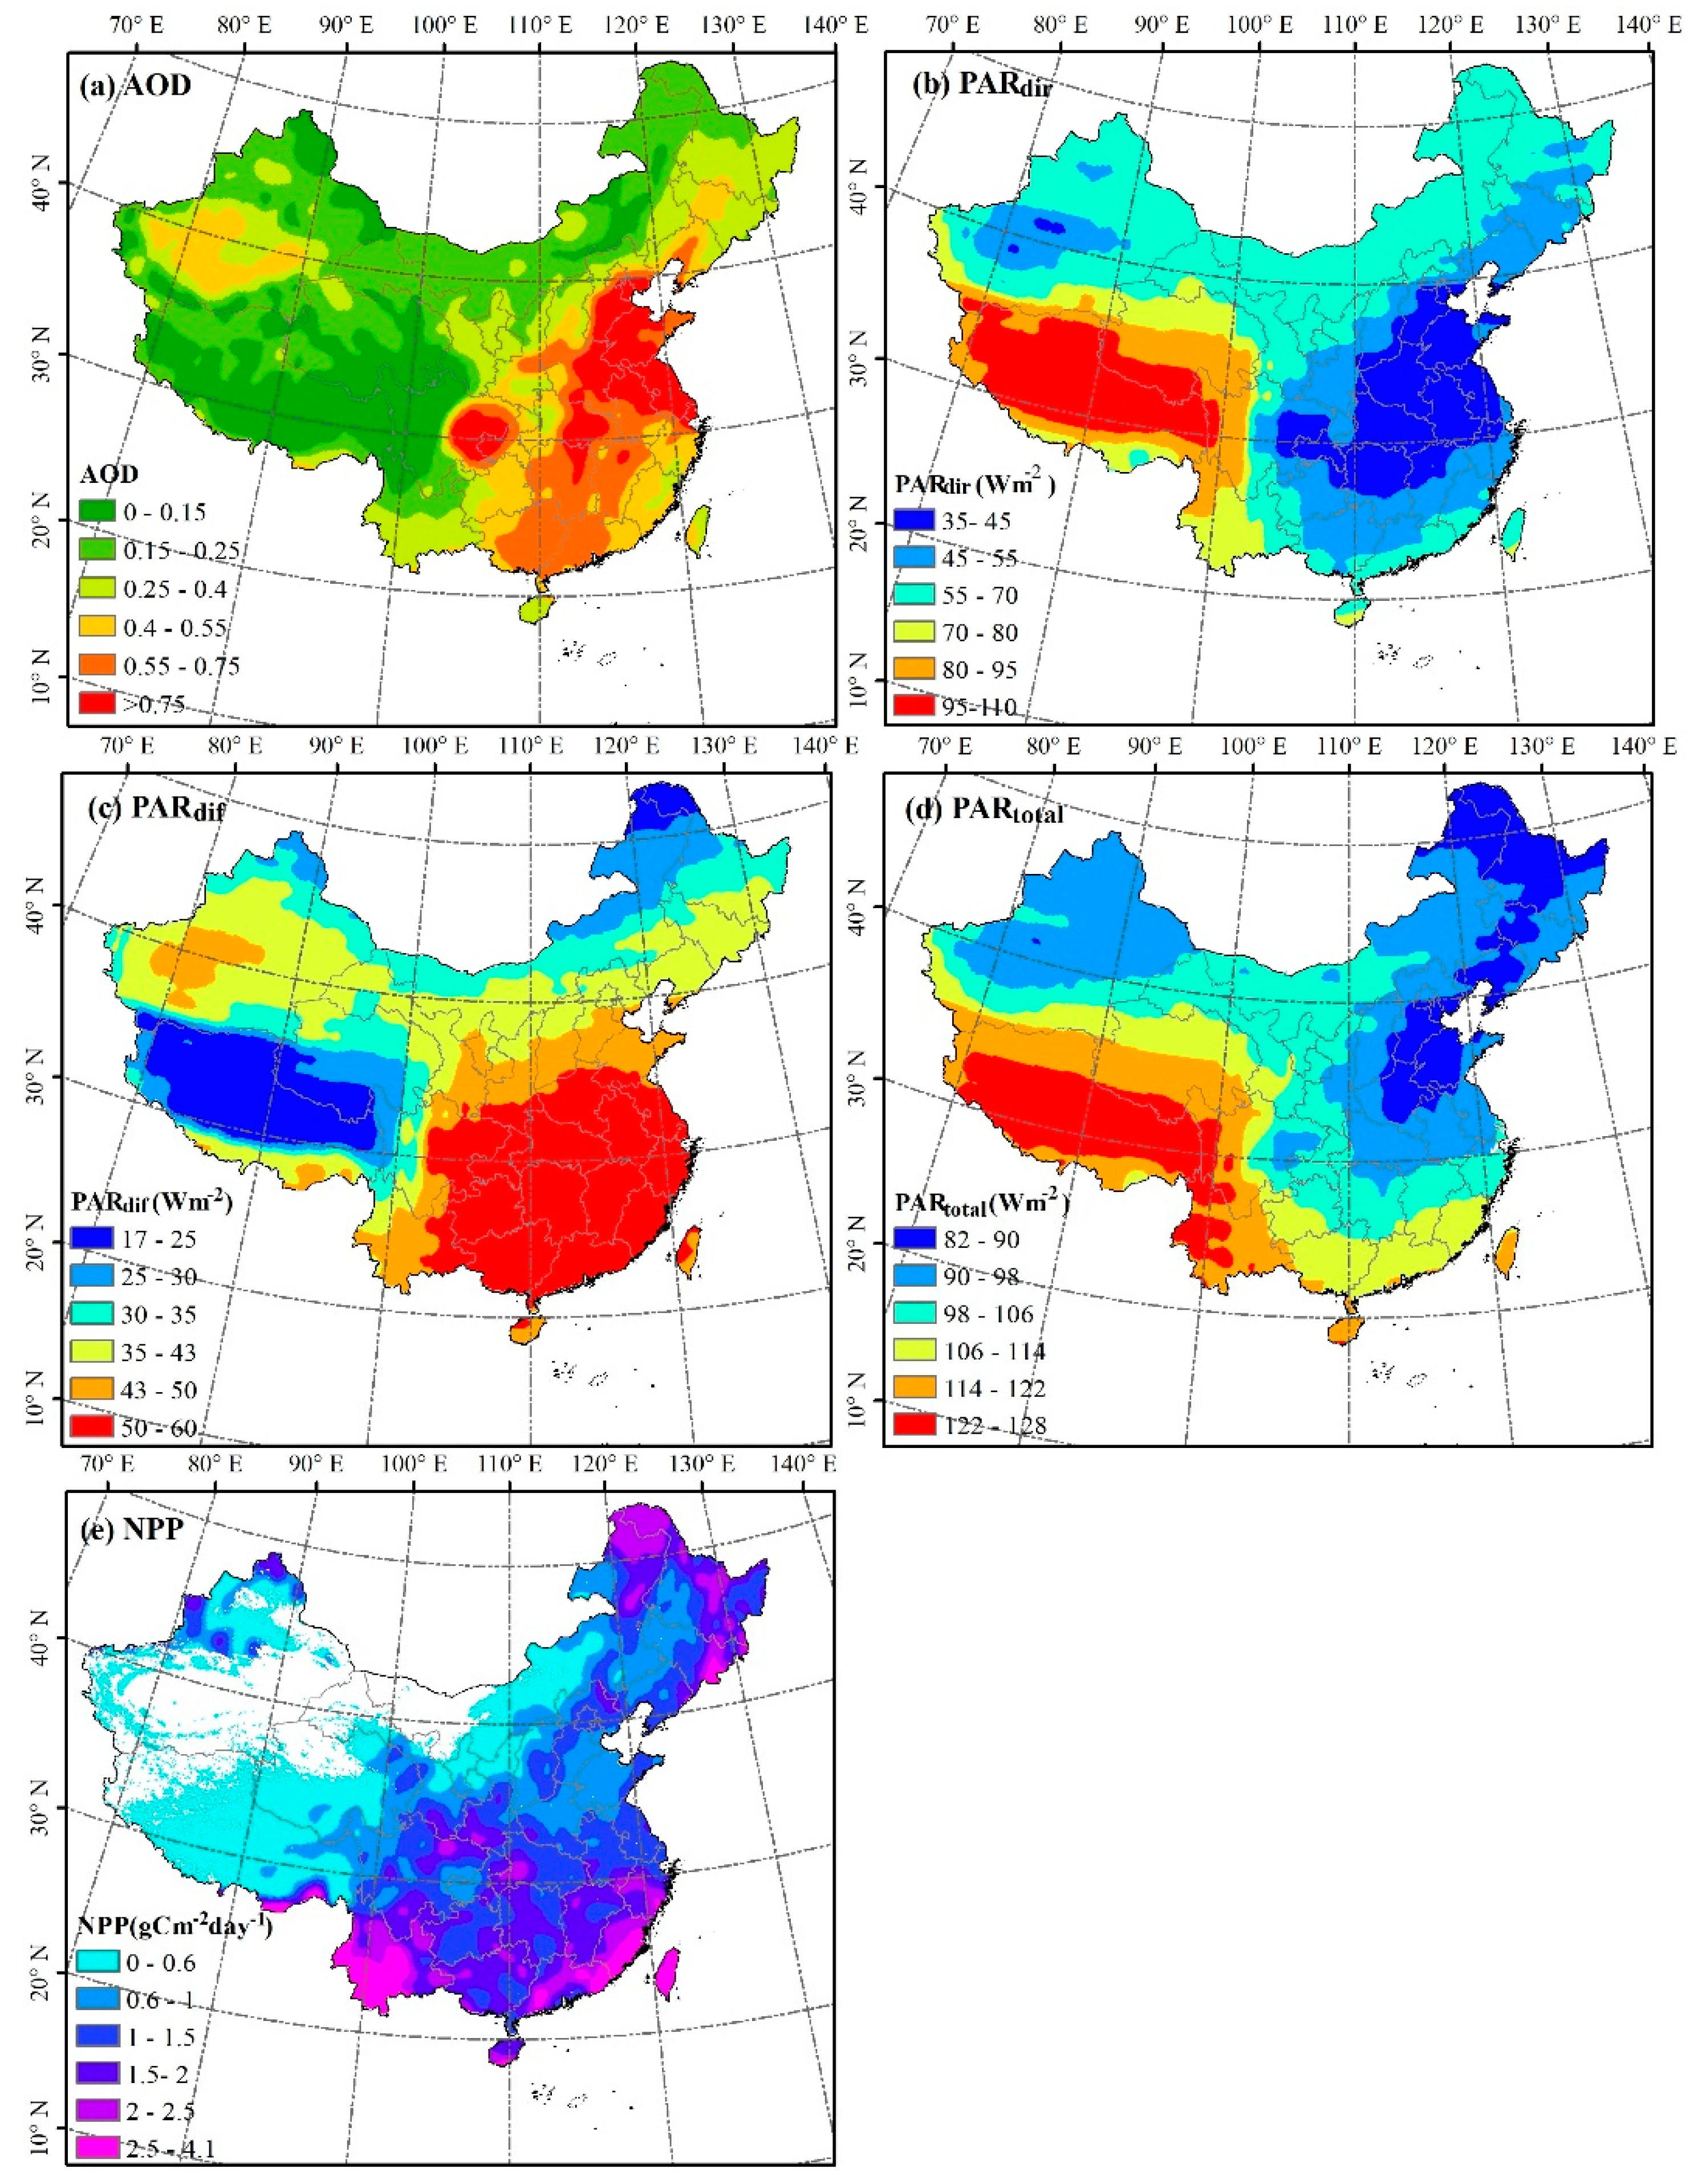
3.1.1. Annual Distribution

Figure 3 compares the 17-year annual mean distributions of AOD, PAR and NPP in China from 2001 to 2017. The annual mean AOD over China spatially varies in the range of 0–1.08. The AOD level in the southeastern coastal area is higher than that in the northwestern area, which is inversely correlated with the terrain variation. This is because lower terrain areas have more air pollutant emissions from anthropogenic activities, while areas with high elevation are sparsely populated and have high vegetation cover. The highest AOD level (>0.75) occurs in Beijing, Hebei, Henan, Shandong, Shanghai, Jiangsu, Sichuan Basin and Hubei provinces with a dense population and developed industry. The aerosols in these areas arise mainly from anthropogenic emissions. In addition, the mountains surrounding the Sichuan Basin inhibit the dispersion of aerosols [30]. The high AOD level in the west appears in the Taklimakan Desert of southern Xinjiang, and this high level may be caused by sand dust [5]. The regions with low aerosol loadings are distributed in the Tibetan Plateau, north of Xinjiang and Inner Mongolia, as these areas are underdeveloped and have a sparse population density.
The annually averaged PARdir and PARdif in Figure 3b,c show exactly opposite distributions. The PARdir across China ranges from 34 Wm−2 to 108 Wm−2, with higher values in the northwest and lower values in the southeast, which is generally opposite the observed trend of the AOD distribution. The PARdif (17–60 Wm−2) shows a similar spatial pattern as the AOD, which increases from northwest to southeast. The Tibetan Plateau has the highest PARdir and lowest PARdif due to the high altitude (over 4000 m), high sunlight ranges (1600–3400 h/year), low water vapor contents and thin air [34,35]. The reduction of PAR in Tibetan Plateau in the process of radiation transmission is smaller than that in another area because of a shorter pathway through the atmosphere. Moreover, the PAR is less influenced by the absorption and scattering of aerosols due to the thinner air in the Tibetan Plateau [30]. The lowest PARdir occurs in Heibei, Henan, Shandong, Jiangsu, Anhui, Hubei and Hunan provinces, which are also the regions with the most aerosol pollution, indicating that aerosols may inhibit PARdir. The highest PARdif is dominant in southern China, including Guangdong, Guangxi, Hunan, Guizhou, and Jiangxi, where the AOD is larger than 0.4 and the water vapor content is higher than that in northern China. The PARtotal decrease from southwest to northeast. The lowest level occurs in the southeast due to the lower PARdir and PARdif. The larger values of PARtotal in the south of China can be attributed to large PARdif. The largest PARdir in Tibetan Plateau determines the largest PARtotal there.
The averaged NPP in China ranges from 0–4 gCm−2day−1, with a mean value of 1.26 gCm−2day−1. The annual mean NPP (Figure 3d) shows higher values in the southeast than in the northwest. The highest NPP level above 2.5 gCm−2day−1, is mainly distributed in tropical humid regions, including Zhejiang, Fujian, Guangdong and western Yunnan. The white area represents no values, where there is essentially no vegetation cover. Eastern Inner Mongolia and Qinghai-Tibetan Plateau show the lowest NPP values under 0.6 gCm−2day−1, which may be due to the harsh climate and the grassland cover [12]. However, for individual provinces, the NPP does not show an obvious spatial pattern with AOD or PAR. For example, the North Plain and Sichuan Basin have the highest AOD, but the NPP values there are at the medium level. This discrepancy could be attributed to other factors, such as vegetation type, temperature, precipitation, and human irrigation. The regions with high NPP coincide with the forest distribution (Figure 3a), especially in summer. Yunnan has the highest NPP due to the higher cover of evergreen broad-leaved forests and tropical rainforests than that found in other regions in China.

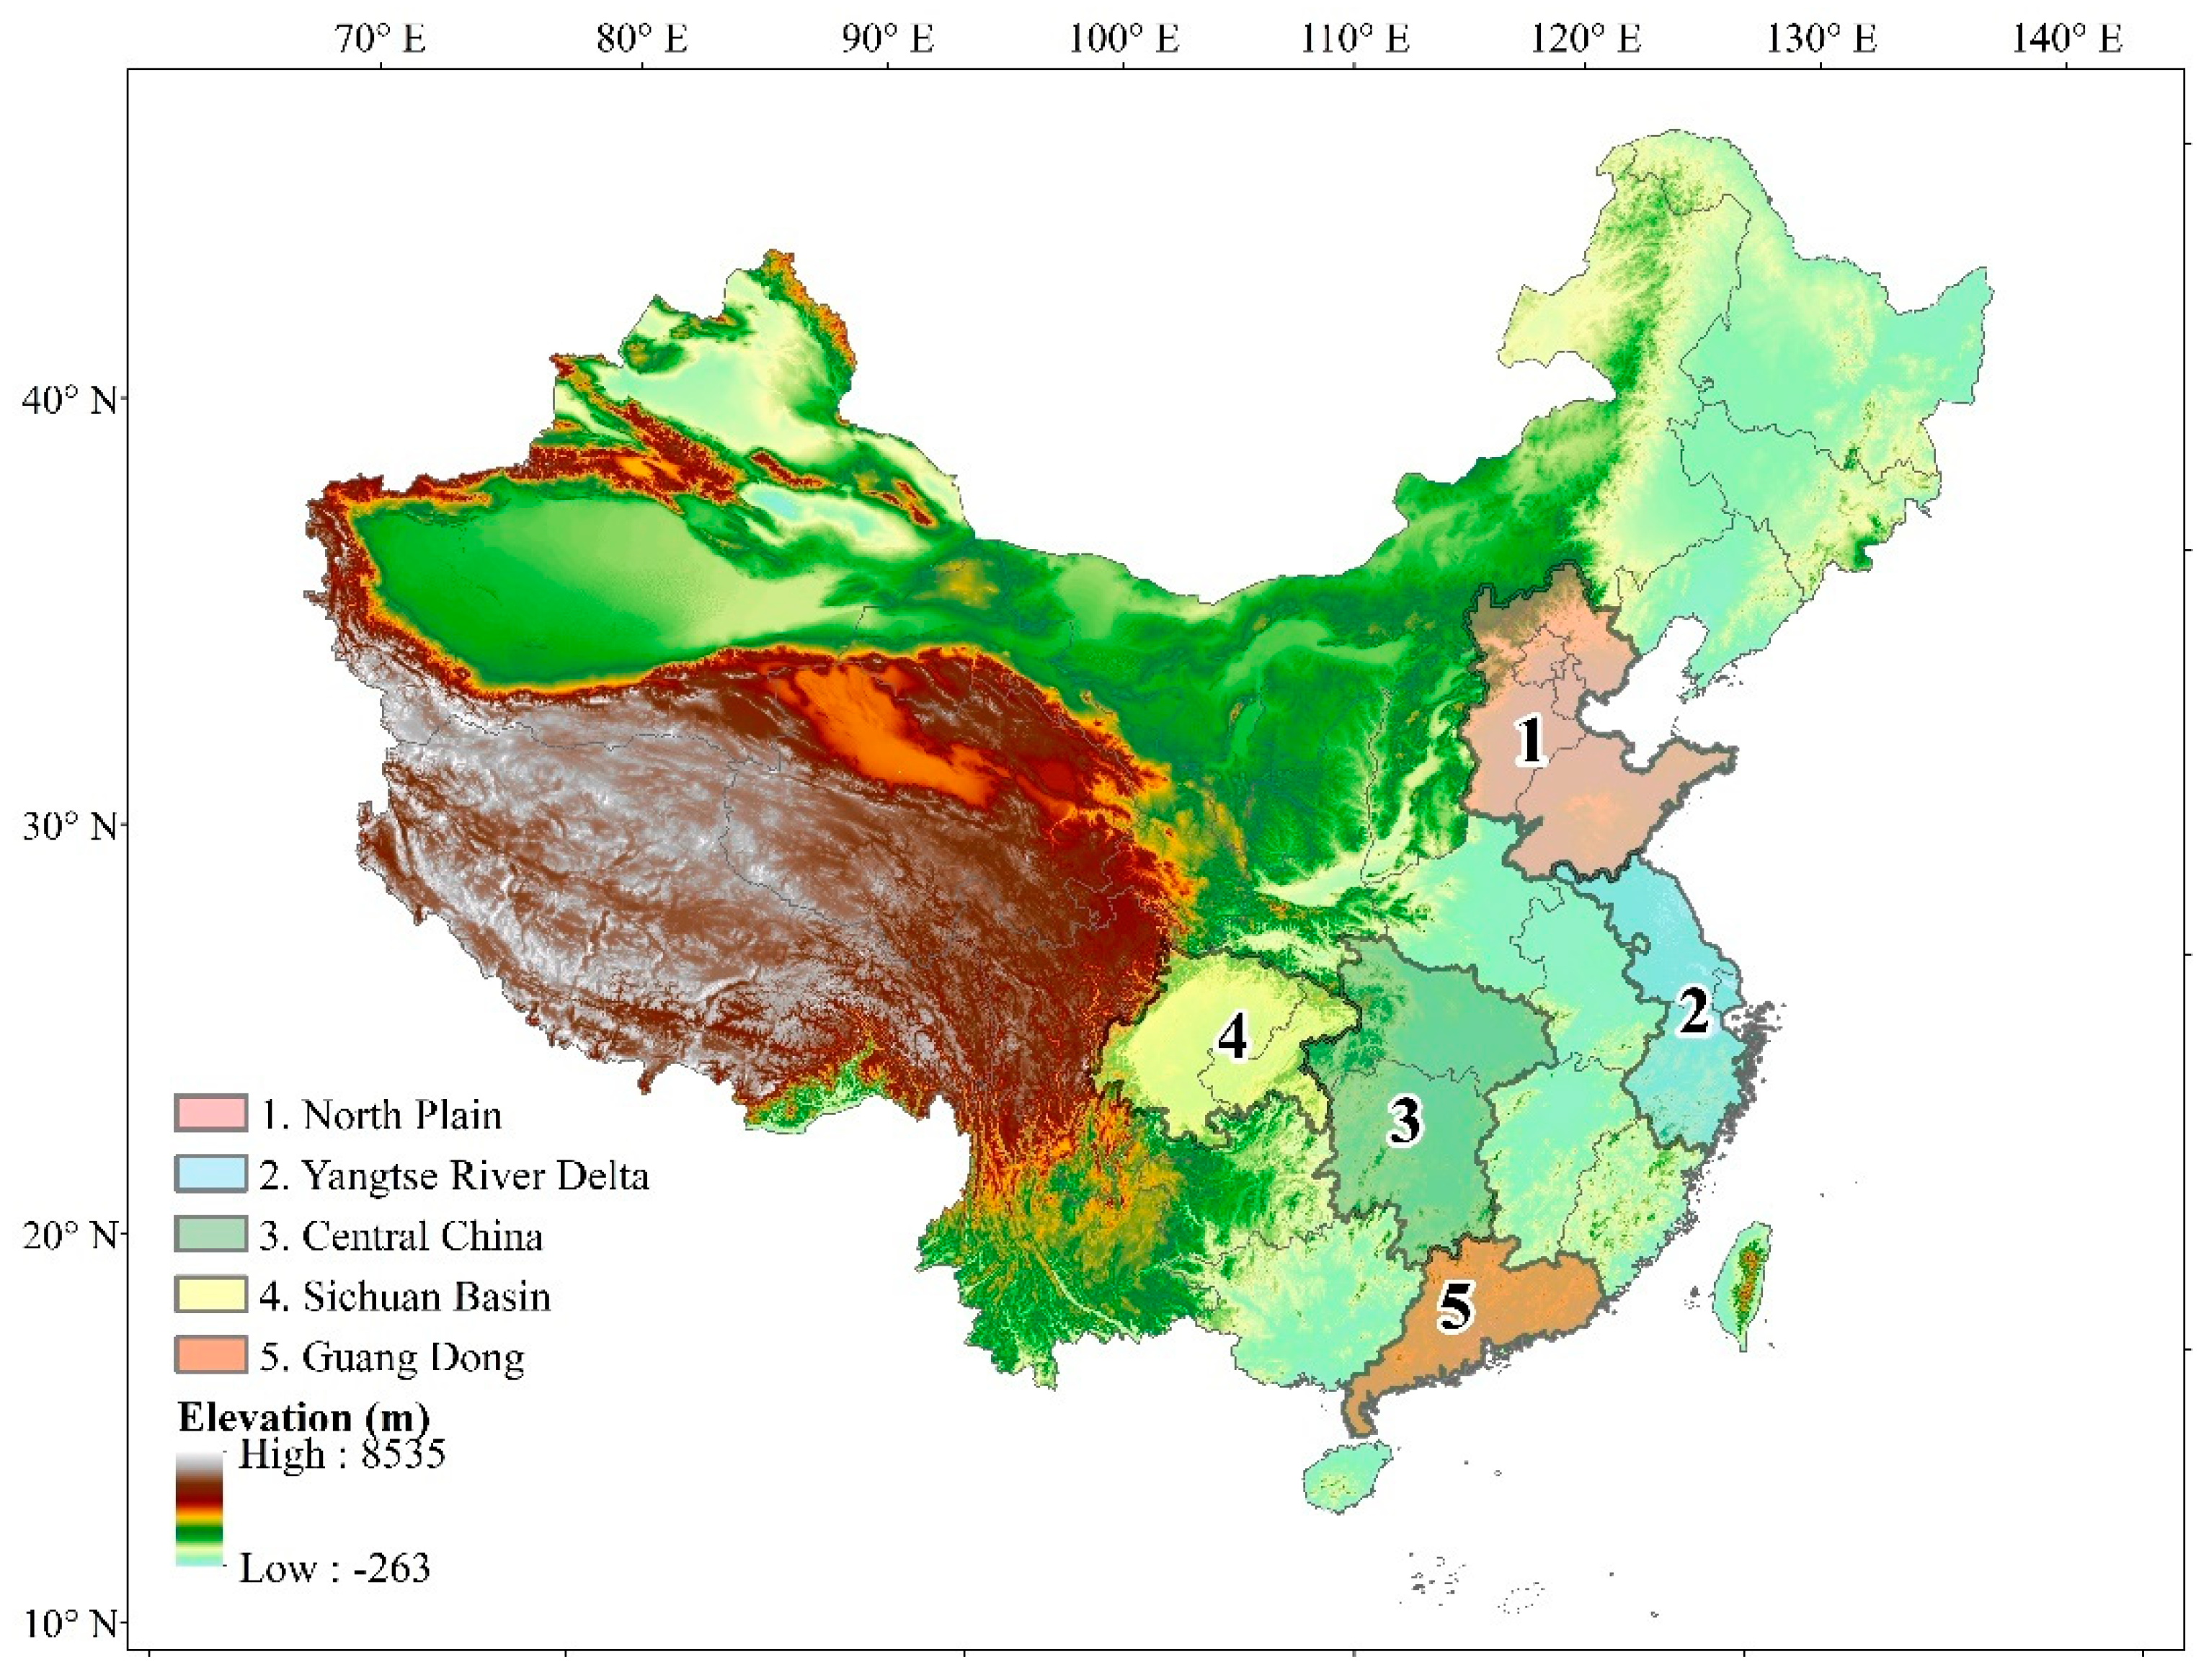
3.1.2. Seasonal Variation

The seasonal variation characteristics of AOD, PAR and NPP in China are shown in Figure 4. Although the magnitudes vary in different seasons, the spatial patterns of AOD, PAR and NPP in each season are generally consistent with their respective annual mean distributions. As shown in Figure 4a, greater aerosol loadings are observed during summer and spring than in autumn and winter. The maximum AOD occurring in spring might be caused by large amounts of dust and biomass burning. High water vapor content possibly contributes to the second-highest AOD in summer [5]. Therefore, the seasonal variations in AOD closely change with emission sources, climatic factors and anthropogenic activities.
The PAR are found to be largest in summer due to the smallest solar zenith, and the values are second-highest in spring and much lower in autumn and winter. The PARdir and PARdif generally show opposite and similar spatial patterns with AOD in each season, respectively, which is consistent with the comparison of annual average distribution.
Similar to the AOD seasonal variation characteristics, the NPP is highest in summer, followed by that in spring and autumn, and lowest in winter. The NPP in the southeast is higher than that in the northwest in all seasons. The highest NPP in each season, especially in spring and summer, appears in the area covered by forests.

3.1.3. Temporal Trend

The Seasonal Kendall trend analysis at the pixel and national scales is carried out for AOD, PAR and NPP in two periods (2001–2008 and 2009–2017) due to a transition in emission patterns in 2008. As shown in Figure 5a, the AOD has a significant upward trend (0.01–0.04) from 2001 to 2008 and downward trend (−0.04–−0.01) in the southeast during 2009–2017. Additionally, the curve of the annual AOD shows an overall increase of 0.004 year−1 before 2008 and decreases −0.007 year−1 after 2008. The declining AOD after 2008 is possibly a result of the government’s environmental policy on the reduction of coal use and industry in recent years [5]. In general, the PARdir and PARdif show similar and opposite tendencies, respectively, with AOD in two periods, indicating the positive impact of aerosols on PARdif and negative impact on PARdir. Moreover, when comparing the AOD and PAR annual variation, the averaged AOD reaches its peaks in 2003, 2006, 2008, 2011 and 2014, which coincide with the peaks of PARdif and the troughs of PARdir and PARtotal. Note that the trend magnitude of PARdir (−0.515 Wm−2 before 2008 and 0.238 Wm−2 after 2008) is almost two times as much as that of PARdif (0.249 Wm−2 before 2008 and −0.096 Wm−2 after 2008). The long-term trend and its spatial distribution of PARtotal are consistent with PARdir because the PARdir has a dominant impact on PARtotal due to higher value and larger variation magnitude than PARdif. From 2001 to 2008, the NPP does not show a significant trend in most areas. The NPP shows an increasing trend of 0.035 gCm−2 day−1 at the 95% confidence level in most of China during the second period. The trend of NPP in the east (0.05–0.15 gCm−2 day−1) is larger than that in the west. Note that NPP has a greater increase from 2012 to 2013 than in other years. This partially because the increase of both PARdif and PARdir causes a large rise of PARtotal.

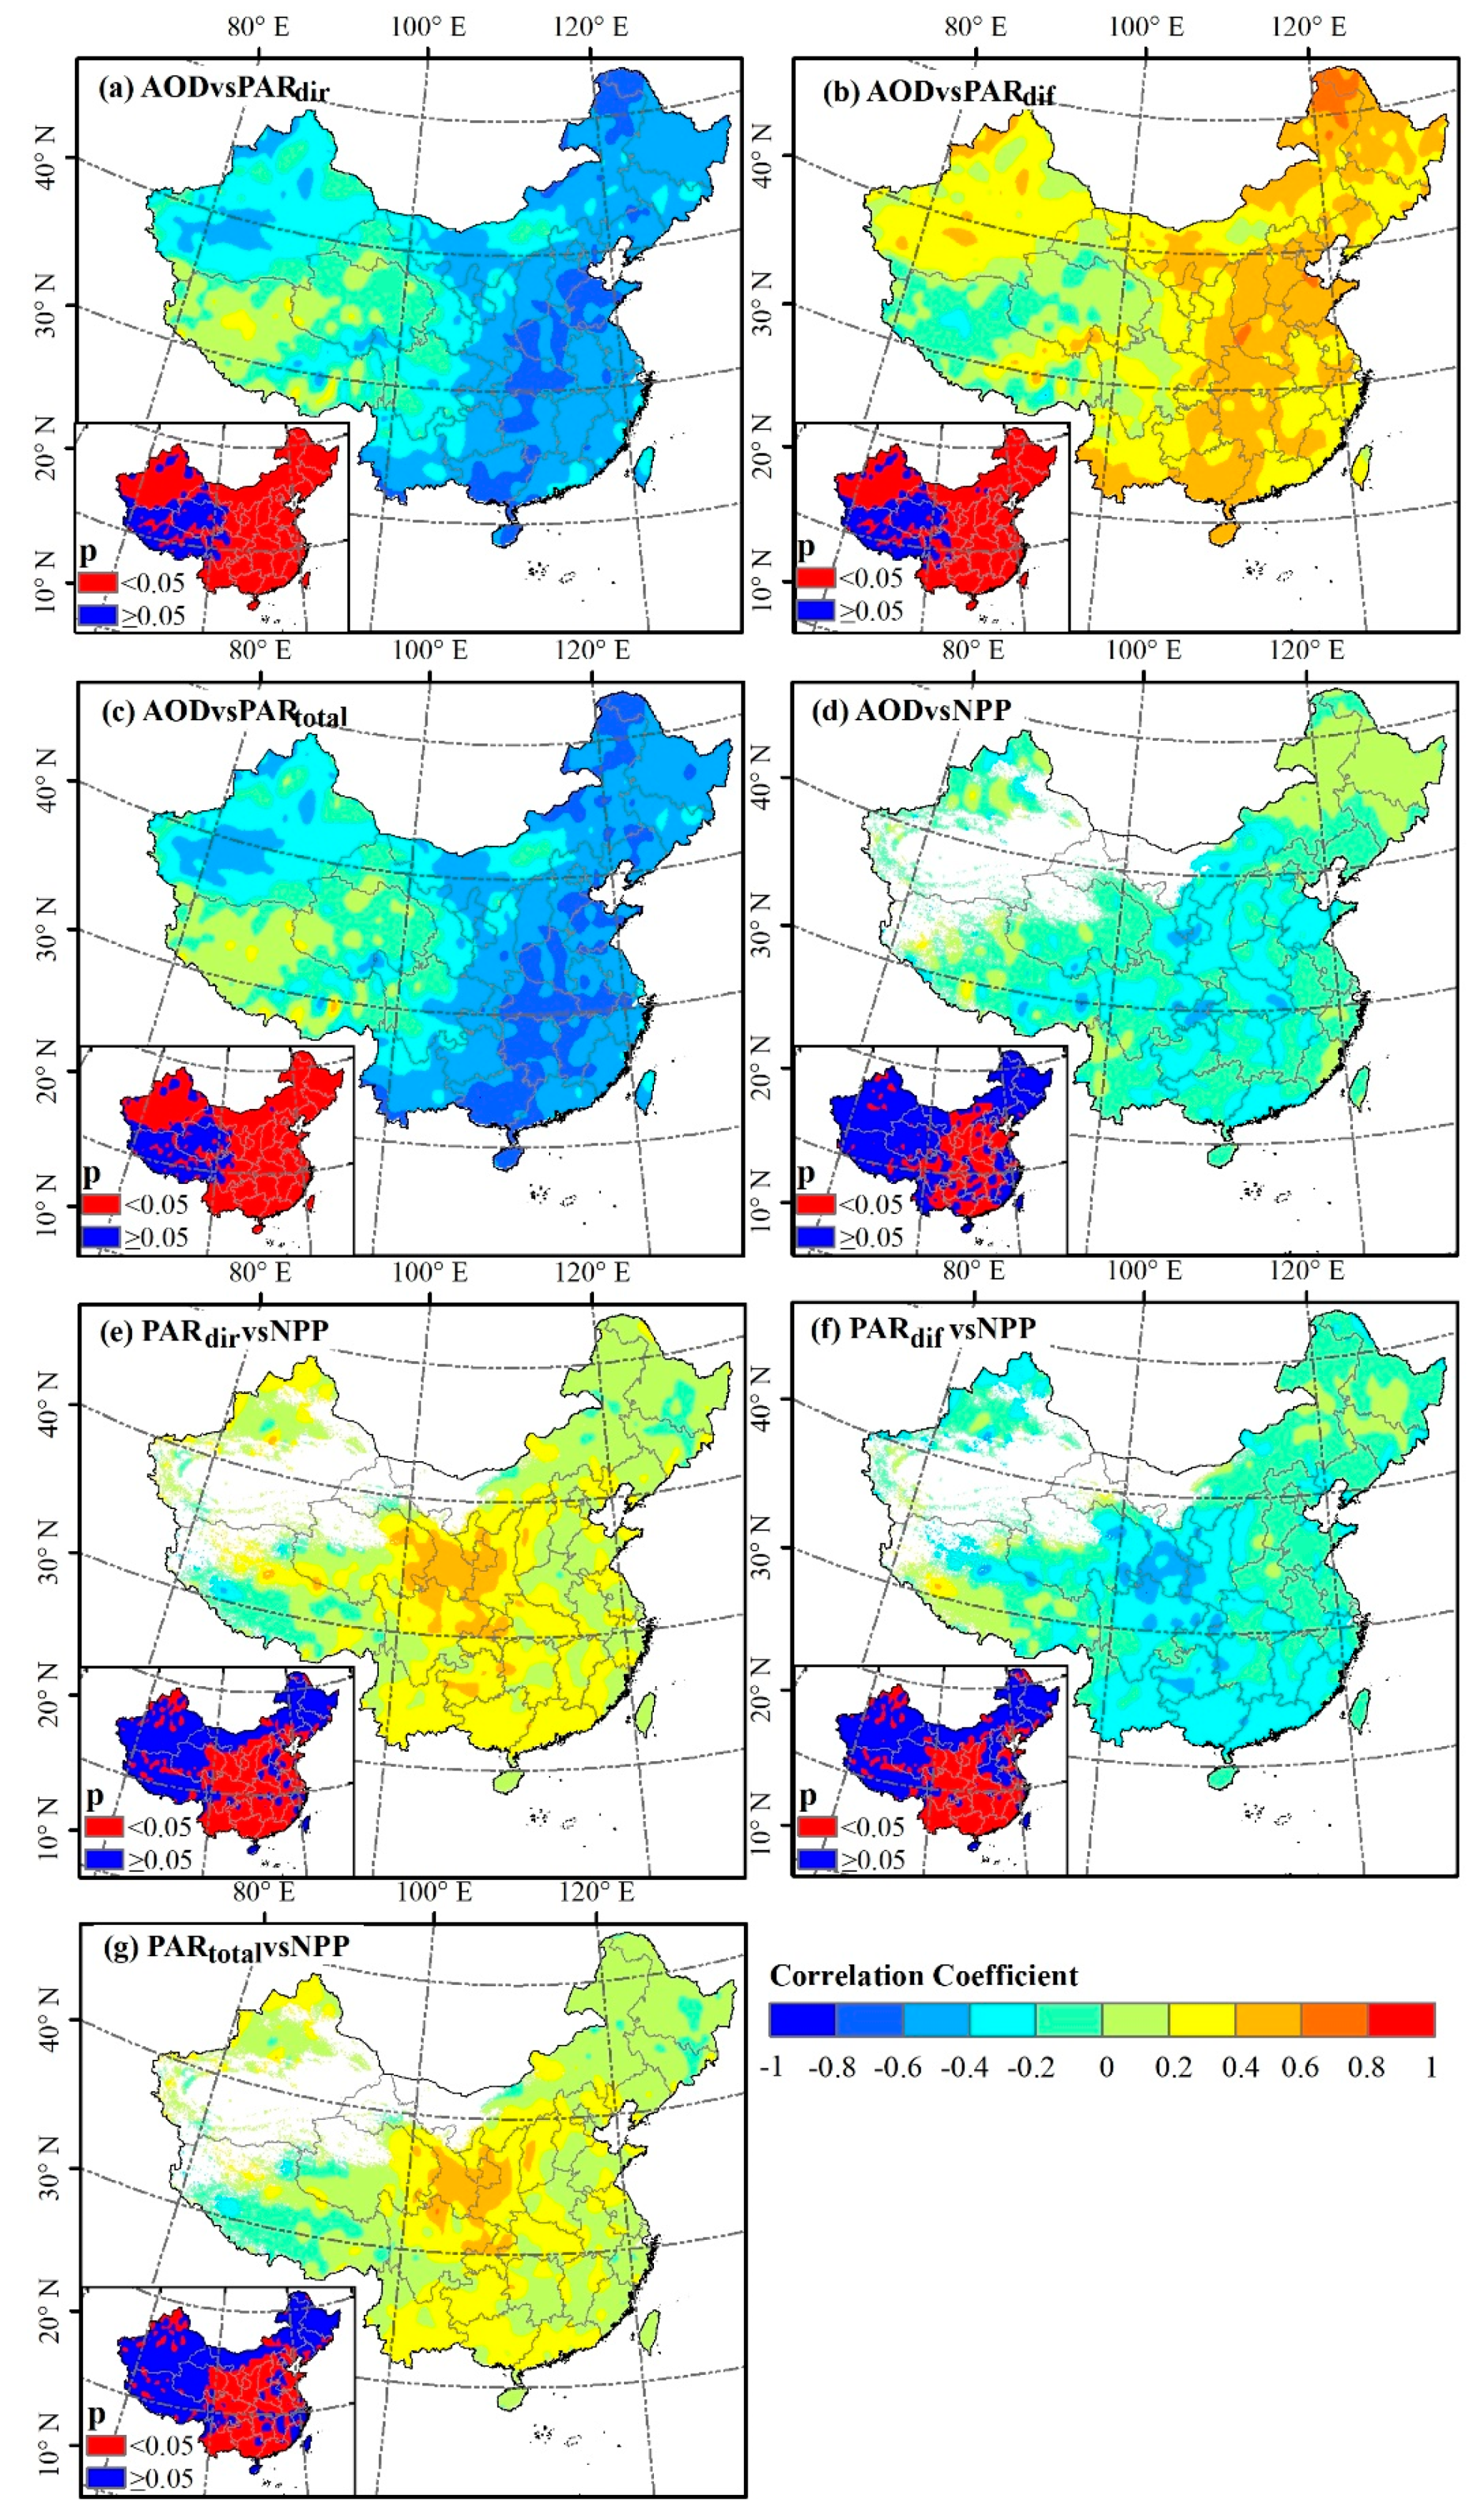
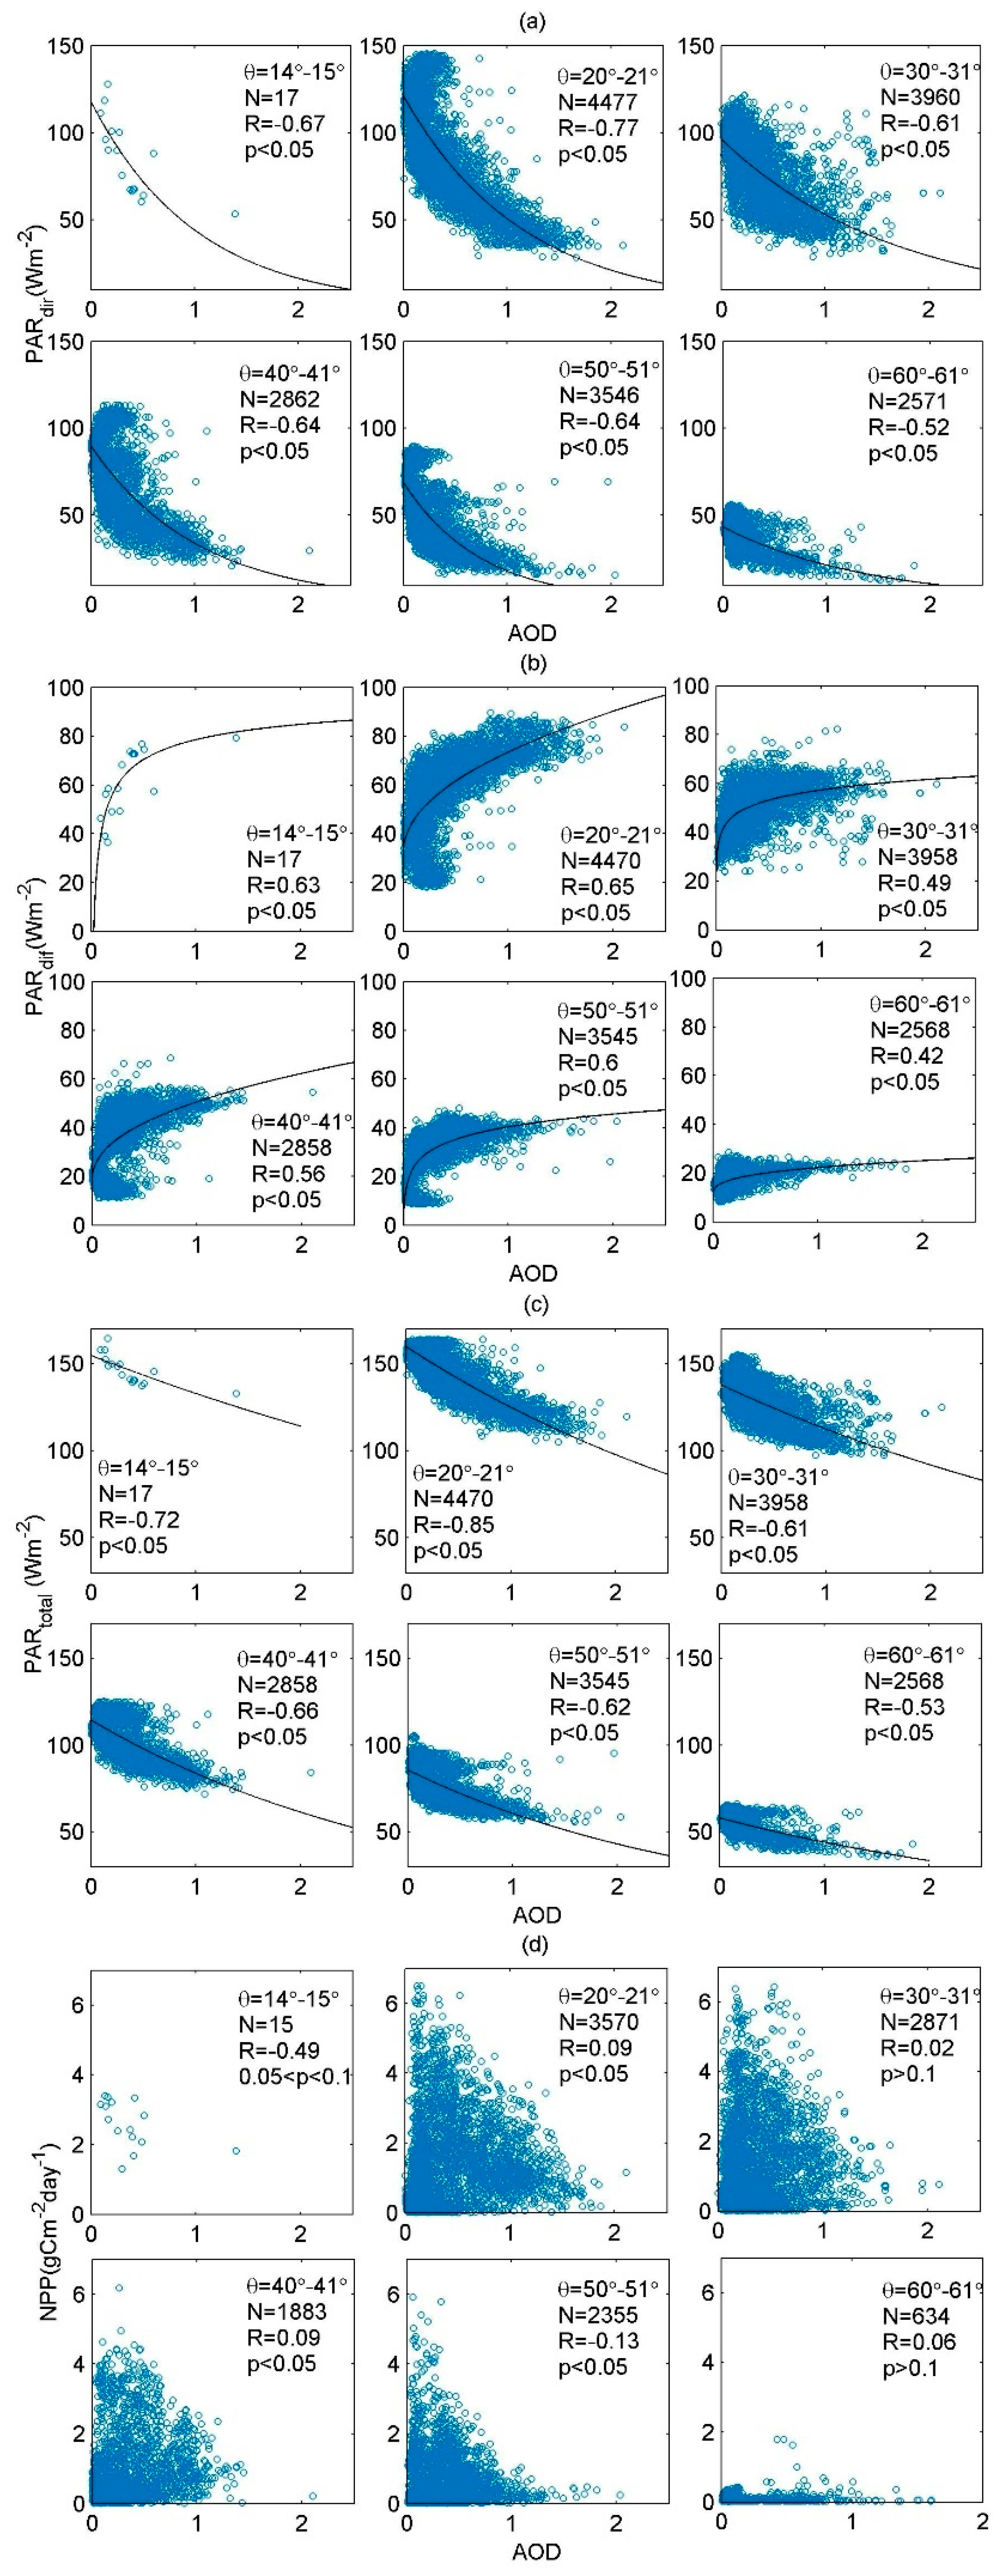
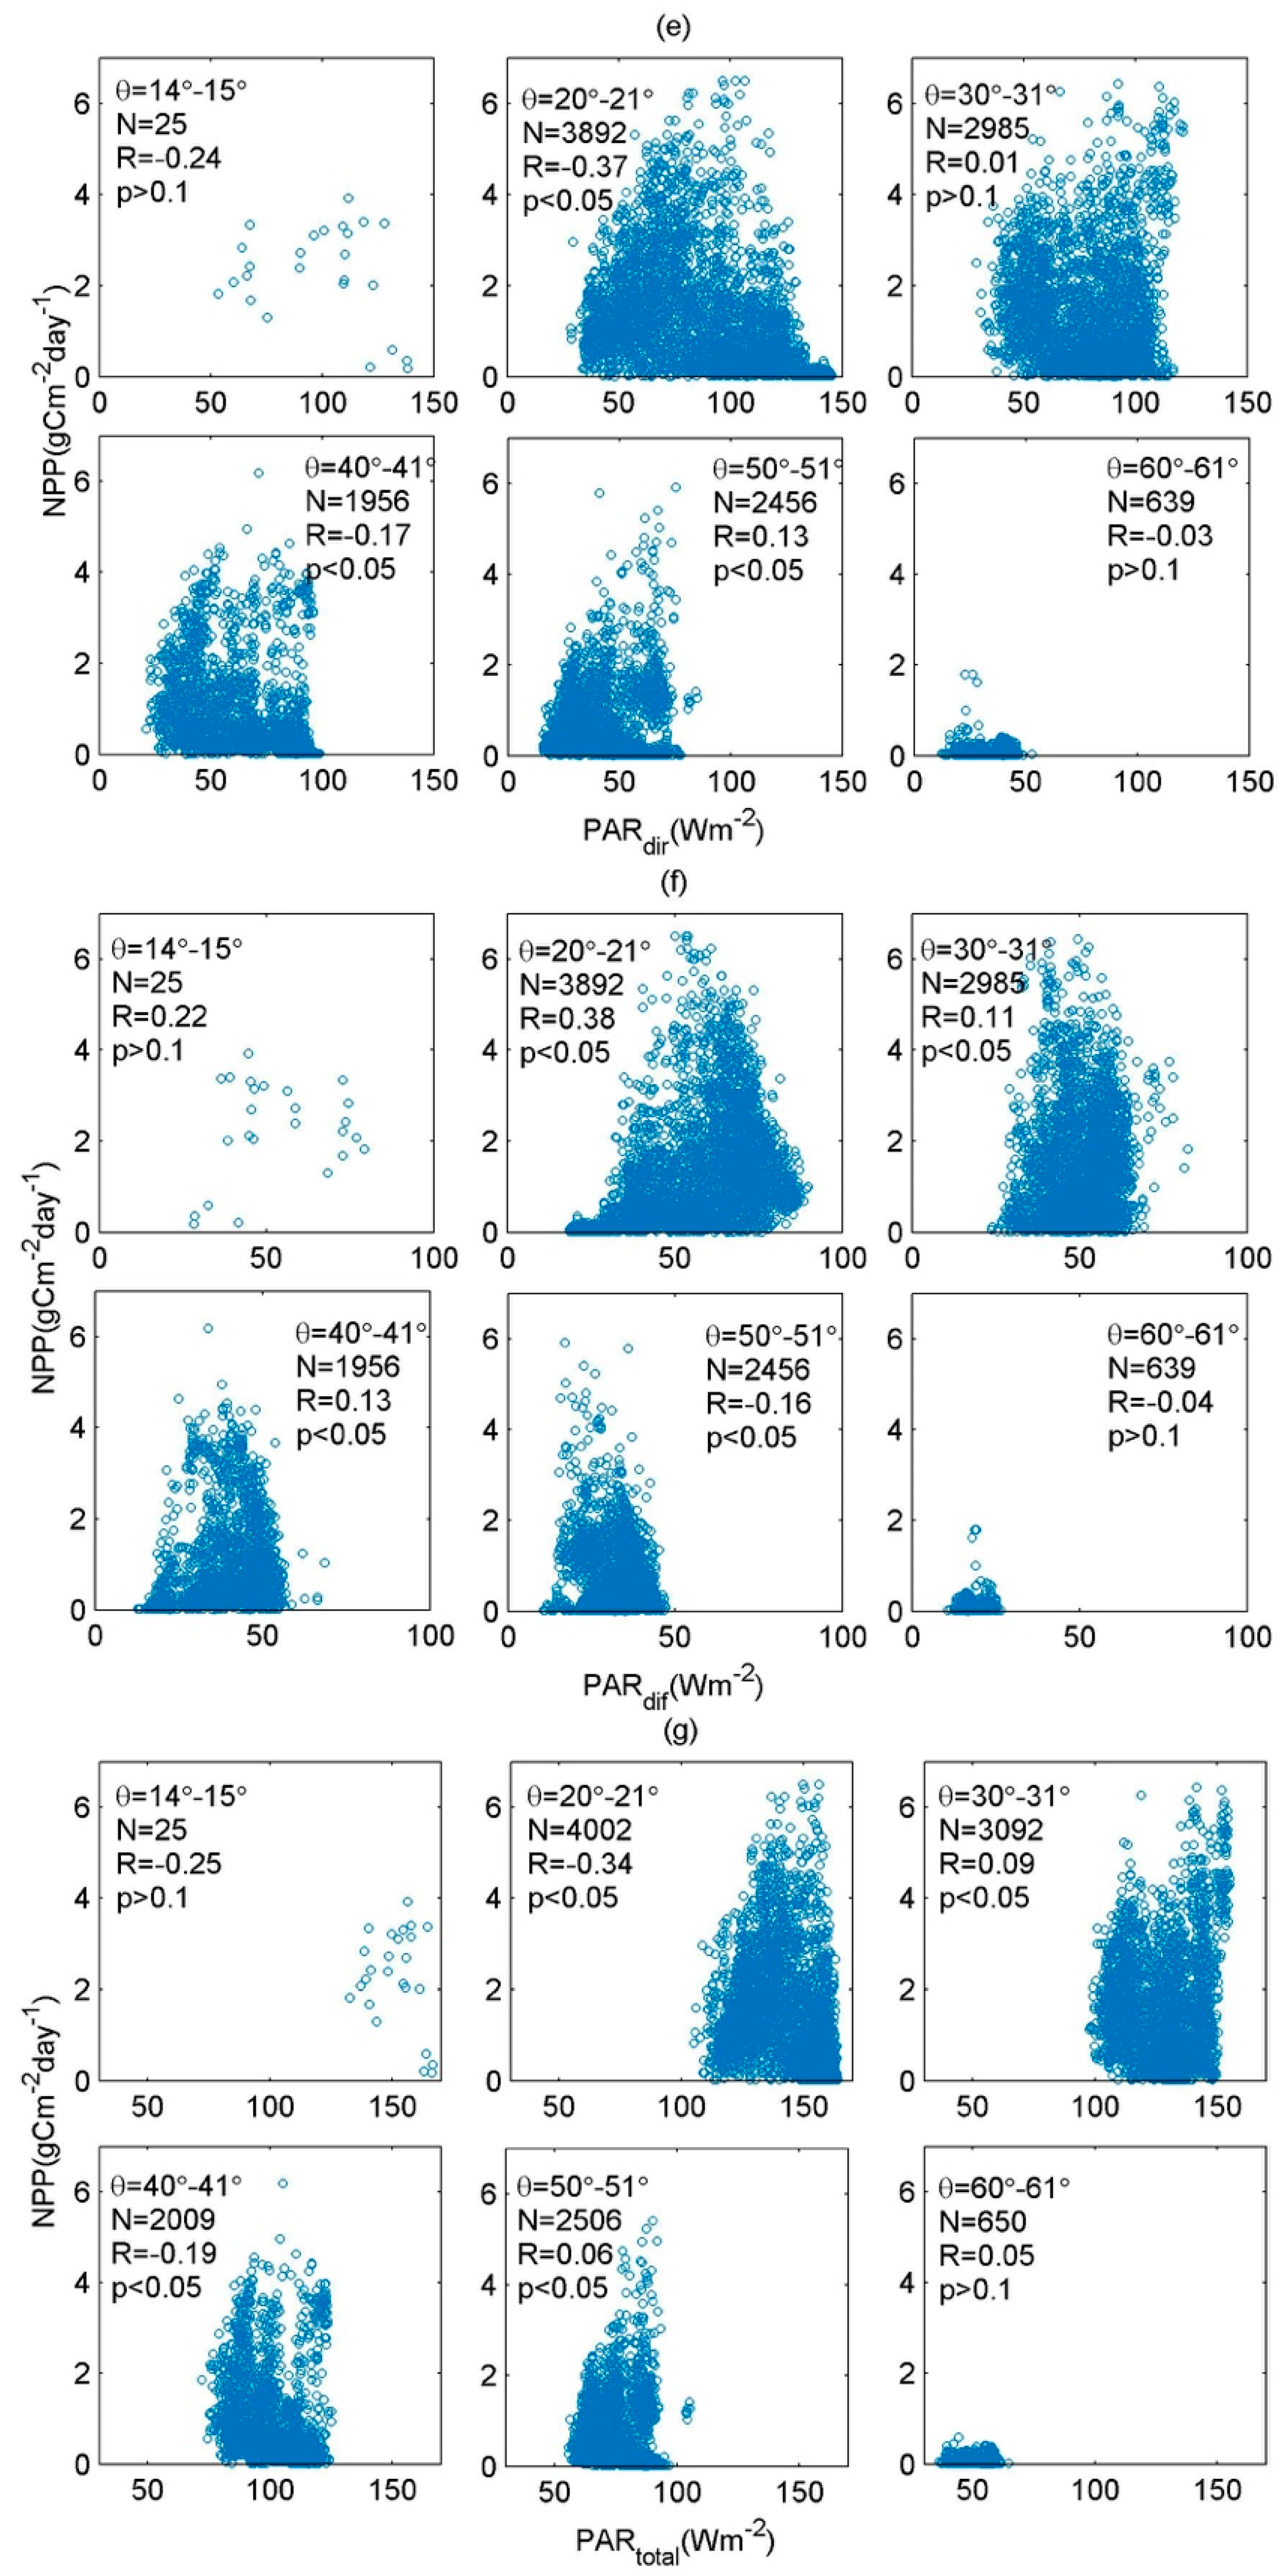
3.2. The Correlations between AOD, PAR and NPP

The pixel-wise correlations (R) between AOD, PAR and NPP are calculated using de-seasonalized data by removing the seasonal mean values. The correlation and significance maps are depicted in Figure 6. As shown in Figure 6a,b, the AOD has negative correlations with the PARdir and PARtotal and positive correlations with the PARdif (significant level p < 0.05) in all of China except the Tibetan Plateau. The AOD over eastern China was found to have stronger negative correlations with PAR (−0.8 < R < −0.4 for PARdir and PARtotal, and 0.4 < R < 0.8 for PARdif) than that in the western area (−0.4 < R < −0.2 for PARdir and PARtotal, and 0.2 < R < 0.4 for PARdif). This result implies that aerosols have more impacts on the PAR in eastern China than on the PAR in the west due to higher aerosol concentrations. The correlation between AOD and PAR over the Tibetan Plateau is insignificant. This result is because the aerosol loading there is low during the entire year (Figure 4) due to the high elevation and thin air; thus, the PAR changes in this area are more attributable to variation in the solar zenith angle rather than to that in aerosol [35]. The AOD and NPP show a significant negative correlation (−0.6 < R < −0.2) over the middle area of China. The PARdir and PARtotal PAR generally have positive correlations with NPP while the diffuse components are negatively correlated with NPP. Correlations with p < 0.05 between PAR and NPP (0 < RPARdir_NPP < 0.6, 0 < RPARtotal_NPP < 0.6 and −0.6 < RPARdir_NPP < 0) are observed in most of China except the northeast and Tibetan Plateau.
Because the surface irradiance and the spectral distribution depend significantly on the solar zenith (θ), the effects of aerosols on PAR and NPP are analyzed for narrow θ ranges. Figure 7 presents the scatterplots between the AOD, PAR and NPP for different solar zenith angles. As seen in Figure 7a, the correlation (R) between AOD and PARdir ranges from −0.77 and −0.52 when the solar zenith angle increases from 14° to 61°. The exponential model (PARdir = a × exp(b × AOD)) is used to describe the overall relationship between AOD and PARdir, which is consistent with other studies [36]. The PARtotal shows negative correlations with AOD (−0.85 ≤ R ≤ −0.53), which is consistent with PARdir. The correlation coefficient between PARdif and AOD ranges from 0.42 to 0.65, and their relationship can be fit by a power model (PARdif = a × AODb + c). As shown in Figure 7c, the AOD has a low correlation with the NPP. The NPP can be positively or negatively correlated with the PARdir, PARdif, PARtotal depending on the different solar zenith angles. The correlations of PARdir–NPP and PARdif–NPP are opposite for different solar zenith angles because when the PARdir increases, the PARdif decreases accordingly.

3.3. Regional Analysis

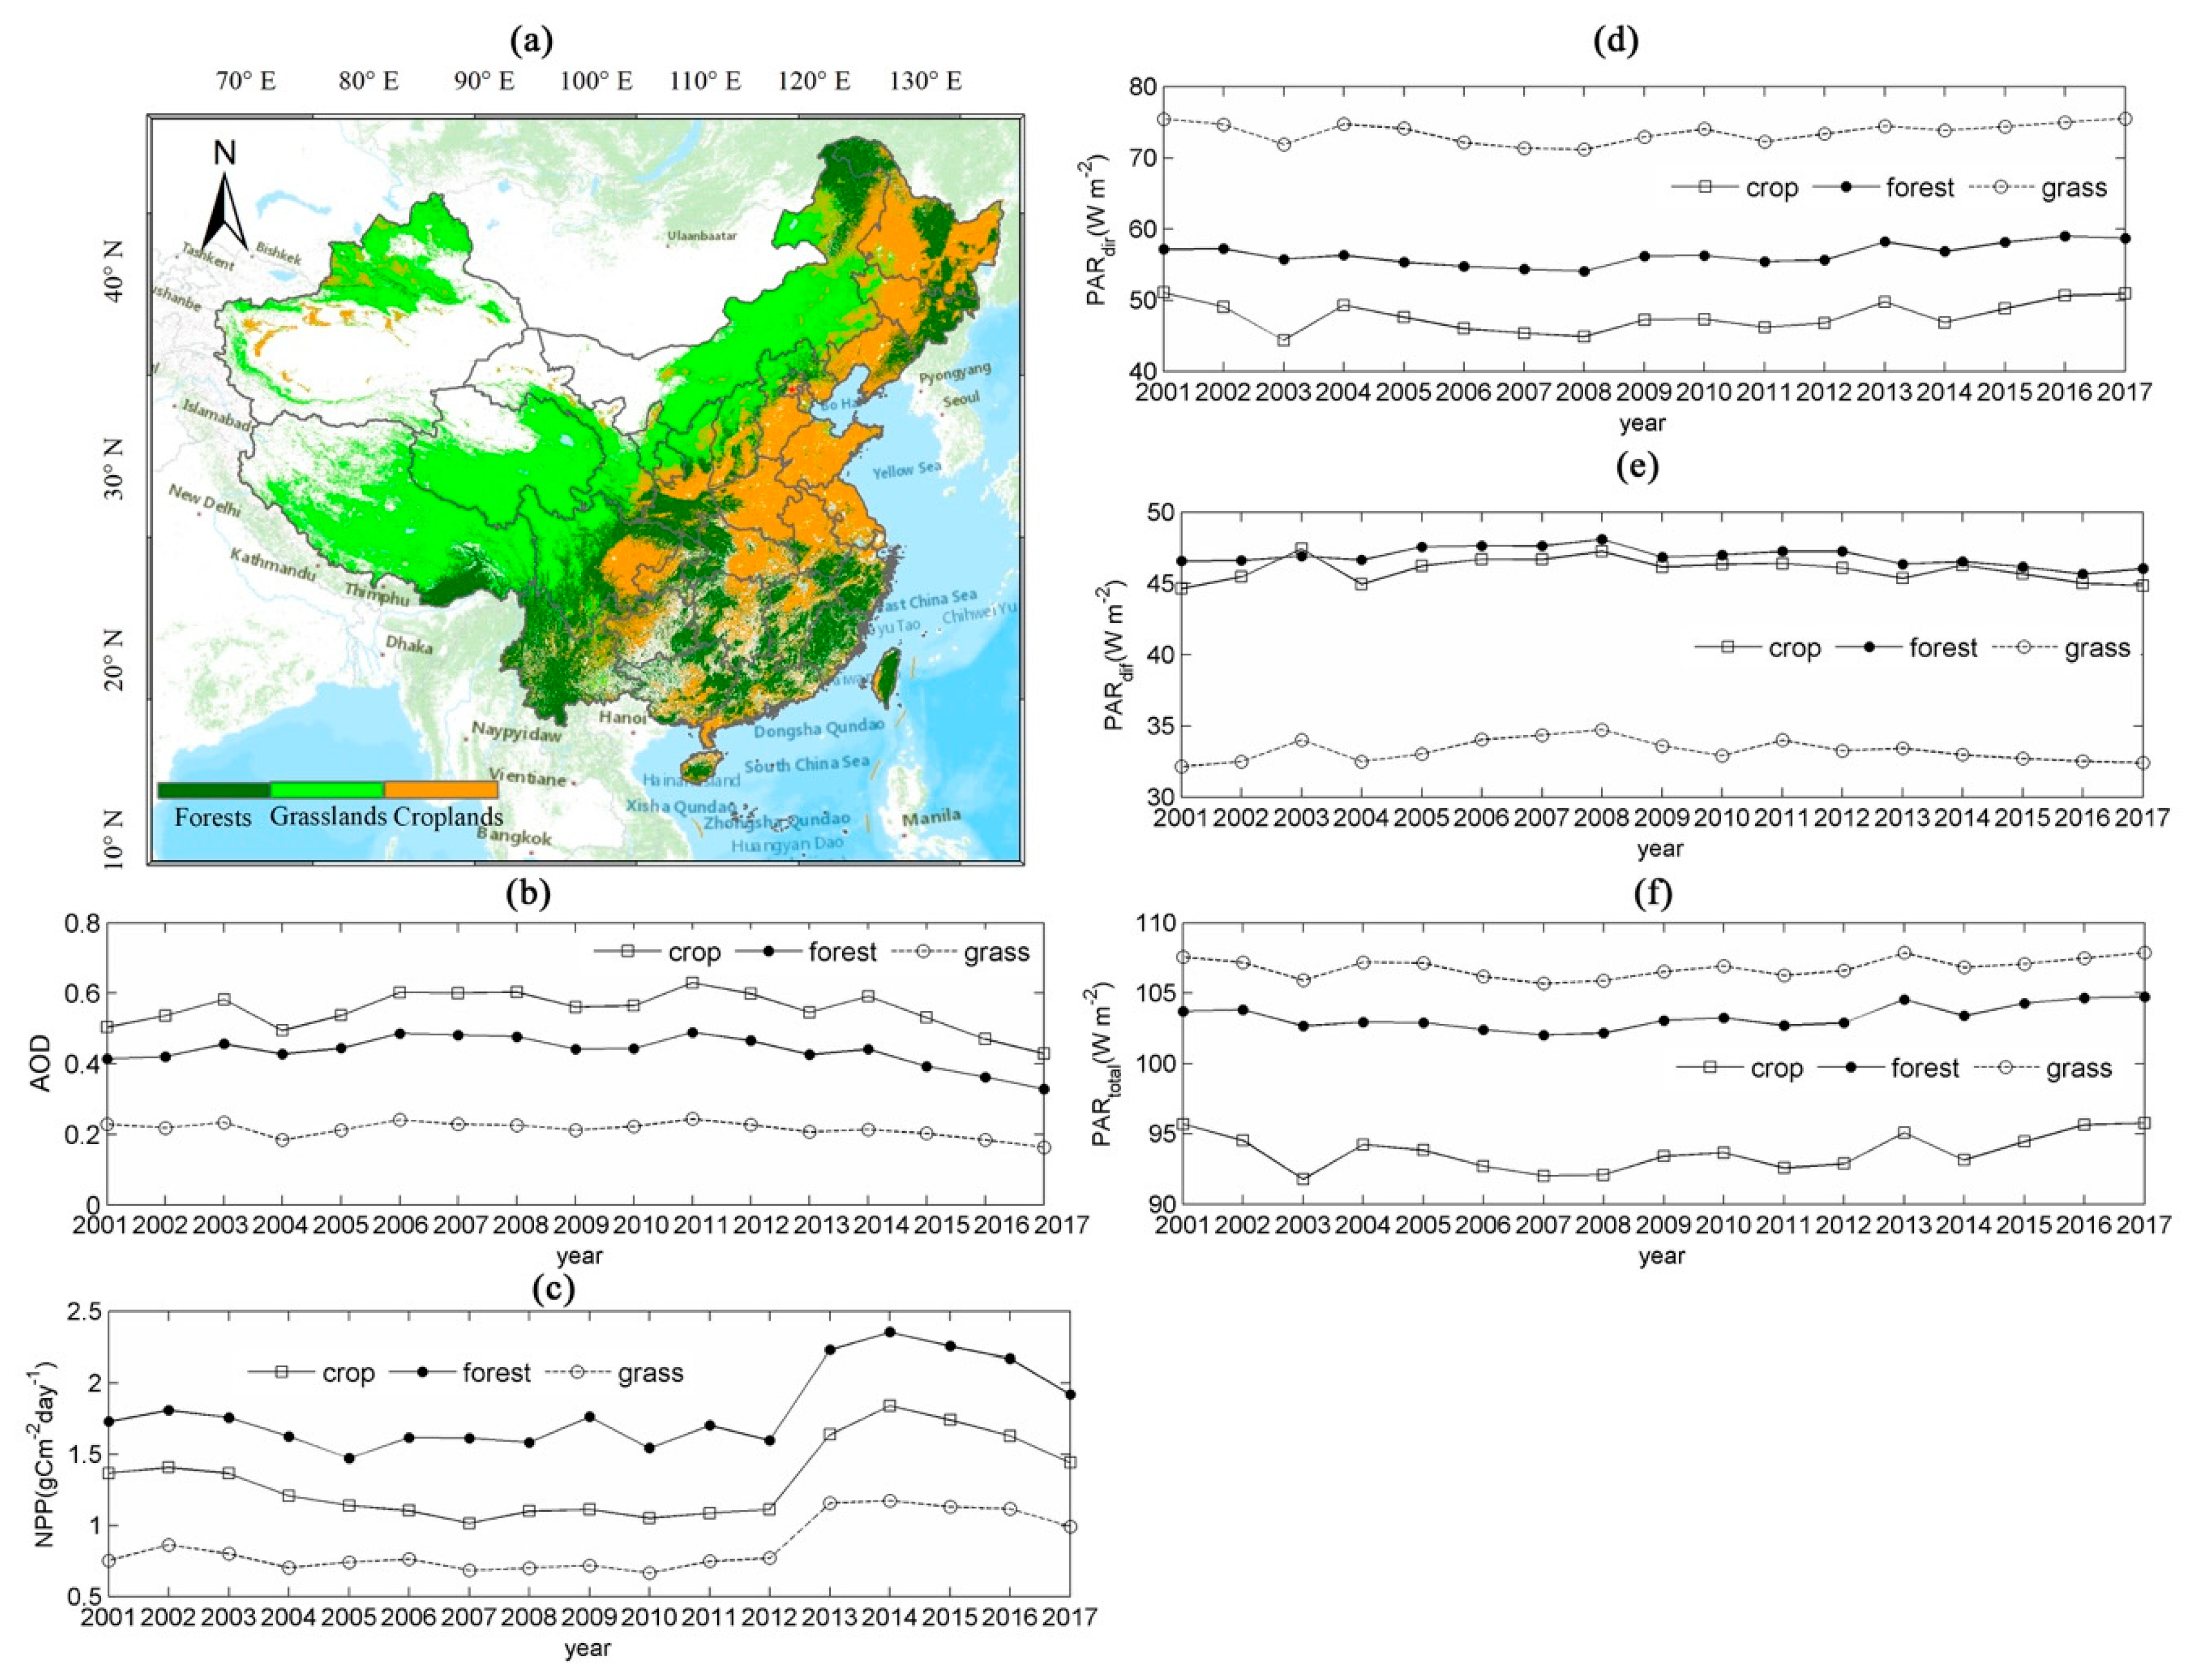
3.3.1. Vegetation Cover

The variation and correlation analysis were also conducted for AOD, PAR and NPP in different vegetation covers and regions. As shown in Figure 8a, the croplands are mainly located in eastern China, the grasslands dominate the western area and the forests exist in southern China. Remarkable differences in the AOD, PAR and NPP levels are found for different vegetation covers. The crop production area is heavily polluted with the highest annual AOD, followed by that of forests, and lowest for grasslands (Figure 8b). The PARdir and PARtotal is lowest in croplands, moderate in forests, and highest in grasslands (Figure 8c and Table 1). The PARdif in forests is highest, with a mean value of 46.867 Wm−2, which is slightly higher than that in croplands (45.964 Wm−2) (Figure 8d and Table 1). Grasslands have much lower PARdif values than those in other vegetation covers. The AOD in cropland has the largest increase before 2008 and the largest decrease after 2008. As shown in Table 1, the vegetation cover with a larger AOD increase has the larger descending trend of PARdir and ascending trend of PARdif during 2001–2008, and vice versa during the second period. Although the PARtotal follows a similar rule with PARdir, the trend magnitude is smaller than PARdir. This is because the PARdif offset the change of PARdir. The correlation coefficients of AOD–PARdir are larger than those of AOD-PARdif, indicating that aerosols have a stronger negative impact on PARdir than the positive impacts on PARdif. This result suggests that the aerosol declines will lead to a greater increase in PARdir than the decrease in PARdif, which is consistent with the larger trend of PARdir inTable 1, Table 2 and Figure 5. The correlations between the AOD and PAR are highest in croplands because the higher aerosol loadings in crop production areas can lead to greater change in PAR.
Figure 8c and Table 1 show that NPP has an insignificant trend in the first period but significantly increases after 2008 in three vegetation cover type areas. The forests have higher mean levels of NPP (1.808 gCm−2day−1) and larger increasing magnitudes (0.074 gCm−2day−1) than those of croplands and grasslands during 2009–2017. In contrast to PAR, NPP has no obvious relationship with AOD at the annual scale. The correlation between AOD and NPP(Table 3) is much lower than that between AOD and PAR for the three vegetation covers, indicating that AOD has a negative impact on NPP but that impact is not great. This may because, in addition to the PAR, the atmospheric CO2 concentration, atmospheric nitrogen deposition, ozone concentrations, land cover, and climate factors (temperature and precipitation) also drive the NPP change [12]. The PAR has stronger correlations (0.215, −0.218, 0.187 for PARdir, PARdif, and PARtotal) with NPP in forests than in croplands and grasslands (Table 3), implying that NPP is more sensitive to the change in PAR in forests than in other vegetation cover types. This result is because greater PAR tends to penetrate more light into deeper canopies of forests, to increase the photosynthesis in shaded leaves; thus, the NPP of forest increases more than that in croplands and grasslands [37,38].

3.3.2. Typical Regions

As shown in Table 2, the mean AOD in five typical regions from 2001 to 2017 is almost 2 times (0.599–0.684) higher than that in the entire country (0.337), which is attributed to the increased anthropogenic activities caused by the rapid urbanization and expansion of industries. The AOD in all typical regions has a larger increase and decrease than that at the nationwide level in the first and second periods, respectively. The decrease of AOD during 2009–2017 in five typical regions is partially caused by emission reduction including NO2 and SO2 due to the air quality policy in China [39]. The decreasing trend of carbonaceous aerosols (e.g., organic carbon, elemental carbon) after 2008 and dust aerosol after 2010 may also contribute to the decline of AOD [40,41]. In addition, AOD variation may be influenced by thin cloud contamination in the satellite retrievals of AOD, meteorological factors, climate change and economic recession [42,43]. The greatest increase of AOD occurs in NP, accompanied with a largest decrease in PARdir and PARtotal and a second largest increase in PARdif from 2001 to 2008. After 2008, the largest decreasing AOD trend in SCB corresponds with the largest PARdir increase and PARdif decrease. The correlation between the AOD and PAR is highest in CC and lowest in SCB (Table 4). The AOD shows stronger negative correlations (−0.569–−0.342) with PARdir than the positive correlations (0.237–0.429) with PARdif in all typical regions, indicating that PARdir is more sensitive to changes in AOD. This result is consistent with the larger change of PARdir than that of PARdif.
From 2001 to 2008, only CC has a significant decrease in NPP of −0.023 gCm−2day−1. In the second period, opposite to the downward tendency of AOD, the NPP presents a significant upward trend in all typical regions. GD is the most productive region with the highest mean NPP of 1.833 gCm−2day−1 and the largest trend of 0.114 gCm−2day−1 after 2008. The negative correlation of AOD-NPP ranges from −0.234 to −0.177 and is higher in CC, SCB and GD, which correspond to the regions with a high correlation between PAR and AOD.

4. Conclusions

In this paper, the spatio-temporal distribution, variation and trends of AOD was analyzed and compared with that of PAR and NPP from 2001 to 2017. We also investigated their correlations at the pixel, regional and national scales. Generally, the AOD varies from high in the southeast to low in the northwest depending on the different elevations and populations. The highest AOD levels are found in the North Plain, Yangtze River Delta, Central China and Sichuan Basin, which are areas with dense anthropogenic activities. Generally, the PARdif spatial distribution shows a similar pattern as that of AOD, while the PARdir and NPP have opposite distributions as that of AOD at the national scale. The PARdir in the Tibetan Plateau is highest, and the PARdif is lowest mainly because of the higher elevation. The NPP is higher in the southeast than in the northwest, with the highest values in the south area and the lowest values in the Tibetan Plateau.
The inter-annual trend investigation reveals that the AOD has an increasing trend from 2001 to 2008 and a decreasing trend during 2009–2017. The PARdir and PARdif have similar and opposite trends in two periods with AOD, respectively. The PARtotal has a consistent tendency with PARdir. The annual peaks of PARdif and troughs of PARdir and PARtotal match exactly the peaks of AOD during the study period. The sulfate and absorbing organic aerosols (e.g., soot) originating from human activities have a great impact on the fluctuation of the PAR [44,45]. The NPP decreases first and then increases significantly with an amplitude of 0.035 gCm−2day−1 after 2008, which is opposed to the temporal variation of AOD. The area covered by forest has the highest mean NPP and the largest increase rate during 2009–2017.
The correlations between AOD, PAR and NPP vary with solar zenith, location and vegetation cover. It is shown that the PARdir and PARdif have negative (−0.482) and positive correlations (0.408) with AOD across China except in the Tibetan Plateau. Overall, the correlation between AOD and PAR is higher in the east than in the west. The results of correlation analysis, together with the spatio-temporal variation comparison between AOD and PAR, demonstrate that the aerosol particles weaken the PARdir and enhance the PARdif. Furthermore, the PARdir has stronger correlations with AOD than does PARdif in most eastern areas of China and in different typical regions and vegetation covers, indicating that the aerosols have a stronger negative impact on PARdir than the positive impacts on PARdif for typical regions and main vegetation covers. The NPP is positively correlated with the PARdir and PARtotal and negatively correlated with the PARdif and AOD. The correlations of NPP-PAR and NPP-AOD are less considerate than those of PAR-AOD. The correlation between PAR and NPP is highest in forests, implying that the NPP of forests is more sensitive to PAR than is the NPP in grasslands and croplands. The forest has the greatest NPP increase after 2008 because the PARdif in forest can increase the level of penetration into the canopy, possibly resulting in increased radiation use efficiency.
This study provides a cohesive understanding of the spatio-temporal variation of aerosol loading and its relationships with solar radiation and plant production, which also provides a perspective of the interaction between aerosols and the ecological environment. The mechanism of aerosols affecting NPP is complicated and influenced by other climate factors, which is required for further study.

Author Contributions

Conceptualization, X.L.; methodology, X.L.; formal analysis, X.L. and H.L.; investigation, X.L. and H.L.; data curation, X.L.; writing—original draft preparation, X.L.; writing—review and editing, W.C. and H.L.; supervision, W.C.; funding acquisition, X.L. All authors have read and agreed to the published version of the manuscript.

Funding

This research was funded by the China Postdoctoral Science Foundation (2019M650830).

Acknowledgments

We acknowledge Jeff Burkey for providing the Seasonal Kendall Test program.

Conflicts of Interest

The authors declare no conflict of interest.

References

  1. Levy, R.C.; Mattoo, S.; Munchak, L.A.; Remer, L.A.; Sayer, A.M.; Patadia, F.; Hsu, N.C. The Collection 6 MODIS aerosol products over land and ocean. Atmos. Meas. Tech. 2013, 6, 2989–3034. [Google Scholar] [CrossRef] [Green Version]
  2. Malakar, N.K.; Lary, D.J.; Moore, A.; Gencaga, D.; Roscoe, B.; Albayrak, A.; Wei, J. Estimation and bias correction of aerosol abundance using data-driven machine learning and remote sensing. In Proceedings of the Intelligent Data Understanding (CIDU), Boulder, CO, USA, 24–26 October 2012. [Google Scholar]
  3. Tie, X.; Huang, R.J.; Dai, W.; Cao, J.; Long, X.; Su, X.; Zhao, S.; Wang, Q.; Li, G. Effect of heavy haze and aerosol pollution on rice and wheat productions in China. Sci. Rep. 2016, 6, 29612. [Google Scholar] [CrossRef] [Green Version]
  4. Chameides, W.L.; Yu, H.; Liu, S.C.; Bergin, M.H.; Zhou, X.; Mearms, L. Case study of the effects of atmospheric aerosols and regional haze on agriculture:an opportunity to enhance crop yields in China through emission controls. Proc. Natl. Acad. Sci. 1999, 96, 13626–13633. [Google Scholar] [CrossRef] [Green Version]
  5. He, Q.; Zhang, M.; Huang, B. Spatio-temporal variation and impact factors analysis of satellite-based aerosol optical depth over China from 2002 to 2015. Atmos. Environ. 2016, 129, 79–90. [Google Scholar] [CrossRef]
  6. Wang, P.; Ning, S.; Dai, J.; Sun, J.; Lv, M.; Song, Q.; Dai, X.; Zhao, J.; Yu, D. Trends and Variability in Aerosol Optical Depth over North China from MODIS C6 Aerosol Products during 2001–2016. Atmosphere-Basel 2017, 8, 223. [Google Scholar] [CrossRef] [Green Version]
  7. Qin, W.; Liu, Y.; Wang, L.; Lin, A.; Xia, X.; Che, H.; Bilal, M.; Zhang, M. Characteristic and Driving Factors of Aerosol Optical Depth over Mainland China during 1980–2017. Remote Sens. 2018, 10, 1064. [Google Scholar] [CrossRef] [Green Version]
  8. Alfaro-Contreras, R.; Zhang, J.; Reid, J.S.; Christopher, S. A study of 15-year aerosol optical thickness and direct shortwave aerosol radiative effect trends using MODIS, MISR, CALIOP and CERES. Atmos. Chem. Phys. 2017, 17, 13849–13868. [Google Scholar] [CrossRef] [Green Version]
  9. Yue, X.; Unger, N. Aerosol optical depth thresholds as a tool to assess diffuse radiation fertilization of the land carbon uptake in China. Atmos. Chem. Phys. 2017, 17, 1329–1342. [Google Scholar] [CrossRef] [Green Version]
  10. Cohan, D.S.; Xu, J.; Greenwald, R.; Bergin, M.H.; Chameides, W.L. Impact of atmospheric aerosol light scattering and absorption on terrestrial net primary productivity. Global. Biogeochem. Cy. 2002, 16, 37-1. [Google Scholar] [CrossRef]
  11. Kumar, S.; Kumar, S. Impact of aerosol on climate and productivity of rice and wheat crop in Bihar. J. Agrometeorol. 2017, 19, 23–28. [Google Scholar]
  12. Wang, J.; Dong, J.; Yi, Y.; Lu, G.; Oyler, J.; Smith, W.K.; Zhao, M.; Liu, J.; Running, S. Decreasing net primary production due to drought and slight decreases in solar radiation in China from 2000 to 2012. J. Geophys. Res. Biogeo. 2017, 122, 261–278. [Google Scholar] [CrossRef] [Green Version]
  13. Zhai, W.; Zhao, Y.; Wang, C.; Xia, X.; Xu, X. The Impacts of Radiation Effects of Atmospheric Aerosol on Rice Production in the Yangtze Delta Region. In Proceedings of the SPIE—The International Society for Optical Engineering, San Diego, CA, USA, 10 September 2008. [Google Scholar]
  14. Shang, E.; Xu, E.; Zhang, H.; Liu, F. Analysis of Spatiotemporal Dynamics of the Chinese Vegetation Net Primary Productivity from the 1960s to the 2000s. Remote Sens. 2018, 10, 860. [Google Scholar] [CrossRef] [Green Version]
  15. Zhang, X.; Pang, J. A comparison between atmospheric water vapour content retrieval methods using MSG2-SEVIRI thermal-IR data. Int. J. Remote Sens. 2015, 36, 5075–5086. [Google Scholar] [CrossRef]
  16. Chen, C.; Park, T.; Wang, X.; Piao, S.; Xu, B.; Chaturvedi, R.K.; Fuchs, R.; Brovkin, V.; Ciais, P.; Fensholt, R.; et al. China and India lead in greening of the world through land-use management. Nat. Sustain. 2019, 2, 122–129. [Google Scholar] [CrossRef]
  17. Hubanks, P.; Platnick, S.; King, M.; Ridgway, B. MODIS Algorithm Theoretical Basis Document No. ATBD-MOD-30 for Level-3 Global Gridded Atmosphere Products (08_D3, 08_E3, 08_M3) and Users Guide, Collection 006, Version 4.3; NASA-Goddard Space Flight Center: Greenbelt, MD, USA, 11 April 2018. [Google Scholar]
  18. Bilal, M.; Nazeer, M.; Qiu, Z.; Ding, X.; Wei, J. Global Validation of MODIS C6 and C6.1 Merged Aerosol Products over Diverse Vegetated Surfaces. Remote Sens. 2018, 10, 475. [Google Scholar] [CrossRef] [Green Version]
  19. Yu, Y.; Shi, J.; Wang, T.; Letu, H.; Yuan, P.; Zhou, W.; Hu, L. Evaluation of the Himawari-8 Shortwave Downward Radiation (SWDR) Product and its Comparison With the CERES-SYN, MERRA-2, and ERA-Interim Datasets. IEEE J-STARS 2019, 12, 519–532. [Google Scholar] [CrossRef]
  20. Wielicki, B.A.; Barkstrom, B.R.; Harrison, E.F.; Lee III, R.B.; Smith, G.L.; Cooper, J.E. Clouds and the Earth’s Radiant Energy System (CERES): An Earth Observing System Experiment. Bull. Amer. Meteor. Soc. 1996, 77, 853–868. [Google Scholar] [CrossRef] [Green Version]
  21. CERES Science Team. CERES_SYN1deg_Ed4A Data Quality Summary (10/3/2017); NASA Atmospheric Science Data Center (ASDC): Hampton, VA, USA, 2017. [Google Scholar]
  22. Rutan, D.A.; Kato, S.; Doelling, D.R.; Rose, F.G.; Nguyen, L.T.; Caldwell, T.E.; Loeb, N.G. CERES Synoptic Product: Methodology and Validation of Surface Radiant Flux. J. Atmos. Oceanic. Technol. 2015, 32, 1121–1143. [Google Scholar] [CrossRef]
  23. Zhao, F.; Xu, B.; Yang, X.; Jin, Y.; Li, J.; Xia, L.; Chen, S.; Ma, H. Remote Sensing Estimates of Grassland Aboveground Biomass Based on MODIS Net Primary Productivity (NPP) A Case Study in the Xilingol Grassland of Northern China. Remote Sens. 2014, 6, 5368–5386. [Google Scholar] [CrossRef] [Green Version]
  24. Gülbeyaz, O. Estimating Net Primary Productivity Of Forest Ecosystems Over Turkey Using Remote Sensing Approach. Ph.D. Thesis, Middle East Technical University, Ankara, Turkey, 2018. [Google Scholar]
  25. Running, S.W.; Nemani, R.; Glassy, J.M.; Thornton, P.E. MODIS Daily Photosynthesis (PSN) and Annual Net Primary Production (NPP) Product (MOD17), Algorithm Theoretical Basis Document; Version 3.0; University of Montana, SCF At-Launch Algorithm ATBD Documents. pp. 1–59. Available online: www.ntsg.umt.edu/modis/ATBD/ATBD_MOD17_v21.pdf (accessed on 29 April 1999).
  26. Running, S.; Mu, Q.; Zhao, M. MOD17A2H MODIS/Terra Gross Primary Productivity 8-Day L4 Global 500m SIN Grid V006. NASA EOSDIS Land Process. DAAC 2015. [Google Scholar] [CrossRef]
  27. Sulla-Menashe, D.; Friedl, M.A. User Guide to Collection 6 MODIS Land Cover (MCD12Q1 and MCD12C1) Product; USGS: Reston, VA, USA, 2018. [Google Scholar]
  28. Hamed, K.H.; Rao, A.R. A modified Mann-Kendall trend test for autocorrelated data. J. Hydrol 1998, 204, 182–196. [Google Scholar] [CrossRef]
  29. Yue, S.; Pilon, P.; Cavadias, G. Power of the Mann–Kendall and Spearman’s rho tests for detecting monotonic trends in hydrological series. J. Hydrol 2002, 259, 254–271. [Google Scholar] [CrossRef]
  30. Zhu, X.; He, H.; Liu, M.; Yu, G.; Sun, X.; Gao, Y. Spatio-temporal variation of photosynthetically active radiation in China in recent 50 years. J. Geogr. Sci. 2010, 20, 803–817. [Google Scholar] [CrossRef]
  31. Helsel, D.R.; Frans, L.M. Regional Kendall Test for Trend. Environ. Sci. Technol. 2006, 40, 4066–4073. [Google Scholar] [CrossRef] [PubMed]
  32. Hirsch, R.M.; Slack, J.R.; Smith, R.A. Techniques of trend analysis for monthly water quality data. Water Resour. Res. 1982, 18, 107–121. [Google Scholar] [CrossRef] [Green Version]
  33. Hess, A.; Iyer, H.; Malm, W. Linear trend analysis a comparison of methods. Atmos. Environ. 2001, 35, 5211–5222. [Google Scholar] [CrossRef]
  34. Luo, Z.; Wu, W.; Yu, X.; Song, Q.; Yang, J.; Wu, J.; Zhang, H. Variation of Net Primary Production and Its Correlation with Climate Change and Anthropogenic Activities over the Tibetan Plateau. Remote Sens. 2018, 10, 1352. [Google Scholar] [CrossRef]
  35. Wang, Q.; Qiu, H.-N. Situation and outlook of solar energy utilization in Tibet, China. Renew. Sust. Energ. Rev. 2009, 13, 2181–2186. [Google Scholar] [CrossRef]
  36. Xia, X.; Li, Z.; Holben, B.; Wang, P.; Eck, T.; Chen, H.; Cribb, M.; Zhao, Y. Aerosol optical properties and radiative effects in the Yangtze Delta region of China. J. Geophys. Res. 2007, 112. [Google Scholar] [CrossRef]
  37. Ryu, Y.; Jiang, C.; Kobayashi, H.; Detto, M. MODIS-derived global land products of shortwave radiation and diffuse and total photosynthetically active radiation at 5 km resolution from 2000. Remote Sens. Environ. 2018, 204, 812–825. [Google Scholar] [CrossRef]
  38. Xia, X.; Li, Z.; Wang, P.; Chen, H.; Cribb, M. Estimation of aerosol effects on surface irradiance based on measurements and radiative transfer model simulations in northern China. J. Geophys. Res. 2007, 112. [Google Scholar] [CrossRef]
  39. Lin, C.-A.; Chen, Y.-C.; Liu, C.-Y.; Chen, W.-T.; Seinfeld, J.H.; Chou, C.C.K. Satellite-Derived Correlation of SO2, NO2, and Aerosol Optical Depth with Meteorological Conditions over East Asia from 2005 to 2015. Remote Sens. 2019, 11, 1738. [Google Scholar] [CrossRef] [Green Version]
  40. Ji, D.; Zhang, J.; He, J.; Wang, X.; Pang, B.; Liu, Z.; Wang, L.; Wang, Y. Characteristics of atmospheric organic and elemental carbon aerosols in urban Beijing, China. Atmos. Environ. 2016, 125, 293–306. [Google Scholar] [CrossRef]
  41. Guo, J.; Xu, H.; Liu, L.; Chen, D.; Peng, Y.; Yim, S.H.L.; Yang, Y.; Li, J.; Zhao, C.; Zhai, P. The Trend Reversal of Dust Aerosol Over East Asia and the North Pacific Ocean Attributed to Large-Scale Meteorology, Deposition, and Soil Moisture. J. Geophys. Res. Atmos. 2019, 124, 10450–10466. [Google Scholar] [CrossRef] [Green Version]
  42. De Leeuw, G.; Sogacheva, L.; Rodriguez, E.; Kourtidis, K.; Georgoulias, A.K.; Alexandri, G.; Amiridis, V.; Proestakis, E.; Marinou, E.; Xue, Y.; et al. Two decades of satellite observations of AOD over mainland China using ATSR-2, AATSR and MODIS/Terra: Data set evaluation and large-scale patterns. Atmos. Chem. Phys. 2018, 18, 1573–1592. [Google Scholar] [CrossRef] [Green Version]
  43. Wei, J.; Sun, L. Comparison and Evaluation of Different MODIS Aerosol Optical Depth Products Over the Beijing-Tianjin-Hebei Region in China. IEEE J-STARS 2017, 10, 835–844. [Google Scholar] [CrossRef]
  44. Niemeier, U.; Schmidt, H. Changing transport processes in the stratosphere by radiative heating of sulfate aerosols. Atmos. Chem. Phys. 2017, 17, 14871–14886. [Google Scholar] [CrossRef] [Green Version]
  45. Myhre, G.; Berglen, T.F.; Myhre, C.E.L.; Isaksen, I.S.A. The radiative effect of the anthropogenic influence on the stratospheric sulfate aerosol layer. Tellus 2004, 56B, 294–299. [Google Scholar] [CrossRef]
Figure 1. The elevation of study area and location of five typical regions for variation analysis in aerosol optical depth (AOD) and relationships with photosynthetically active radiation (PAR) and net primary productivity (NPP). The five regions are 1. North Plain (NP, including Beijing, Tianjin, Hebei and Shandong Province), 2. Yangtze River Delta (YRD, including Shanghai, Jiangsu and Zhejiang Province), 3. Central China (CC, including Hubei and Hunan Province), 4. Sichuan Basin (SCB, including eastern of Sichuan Province and Chongqing), 5. Guangdong (GD, Guangdong Province).
Remotesensing 12 00976 g001
Figure 2. Boxplots of the average monthly AOD (a), PARdir(b), PARdif (c), PARtotal (d) and NPP (e) from 2001 to 2017.
Remotesensing 12 00976 g002
Figure 3. The mean spatial distribution of (a) AOD (b) PARdir (c) PARdif (d) PARtotal and (e) NPP over China during 2001–2017.
Remotesensing 12 00976 g003
Figure 4. Seasonal variations of (a) AOD, (b) PARdir, (c) PARdif, (d) PARtotal and (e) NPP in spring (March, April, May), summer (June, July, August), autumn (September, October, November) and winter (December, January, February) during 2001–2017.
Remotesensing 12 00976 g004
Figure 5. Spatial variation of trends for AOD (a), PARdir (b), PARdif (e), PARtotal (f) and NPP (i) during 2001–2008 and 2009–2017. Red area indicates trends with p-value < 0.05 and blue area indicates trends with p-value ≥ 0.05. The temporal variation of annual mean values over China are (c,d,g,h,j).
Remotesensing 12 00976 g005
Figure 6. The correlation coefficient (R) map between (a) AOD and PARdir (b) AOD and PARdif (c) AOD and PARtotal (d) AOD and NPP (e) PARdir and NPP (f) PARdif and NPP (g) PARtotal and NPP and their corresponding p-value maps.
Remotesensing 12 00976 g006
Figure 7. Scatterplots of (a) AOD and PARdir (b) AOD and PARdif (c) AOD and PARtotal (d) AOD and NPP (e) PARdir and NPP (f) PARdif and NPP (g) PARtotal and NPP for six solar zenith angles (14°–15°, 20°–21°, 30°–31°, 40°–41°, 50°–51°, 60°–61°).
Remotesensing 12 00976 g007aRemotesensing 12 00976 g007b
Figure 8. The distribution of croplands, grasslands and forests in 2013 (a) and yearly mean AOD (b), NPP (c), PARdir (d), PARdif (e) and PARtotal (f) for three vegetation covers.
Remotesensing 12 00976 g008
Table 1. Multi-year mean value and trends of yearly mean AOD, PAR and NPP for croplands, forests and grasslands during 2001–2018 and 2009–2017.
Vegetation CoverAODPARdir (Wm−2)PARdif (Wm−2)PARtotal (Wm−2)NPP (gCm−2day−1)
MeanTrendMeanTrendMeanTrendMeanTrendMeanTrend
2001–20082009–2017 2001–20082009–2017 2001–20082009–2017 2001–20082009–2017 2001–20082009–2017
China0.3370.004 **−0.007 **64.145−0.515 **0.238 **39.0840.249 **−0.096 **103.234−0.248 **0.143 **1.265−0.0160.035 **
Croplands0.5520.013 **−0.016 **47.778−0.723 **0.384 **45.9640.267 **−0.112 **93.741−0.467 **0.326 **1.316−0.0150.062 **
Forests0.4350.011 **−0.015 **56.432−0.508 **0.368 **46.8670.246 **−0.139 **103.299−0.252 **0.254 **1.808−0.0030.074 **
Grasslands0.2130.002−0.007 **73.598−0.495 **0.223 **33.2330.267 **−0.117 **106.831−0.193 **0.119 **0.846−0.0020.015 **
** Trends are significant at the 95% confidence level. This is also suitable for the other tables in this paper.
Table 2. Multi-year mean value and trends of yearly mean AOD, PAR and NPP for typical regions during 2001–2018 and 2009–2017.
RegionAODPARdir (Wm−2)PARdif (Wm−2)PARtotal (Wm−2)NPP (gCm−2day−1)
MeanTrendMeanTrendMeanTrendMeanTrendMeanTrend
2001–20082009–2017 2001–20082009–2017 2001–20082009–2017 2001–20082009–2017 2001–20082009–2017
NP0.6840.025 **−0.020 **44.757−1.124 **0.569 **44.1340.301 **−0.151 **88.891−0.760 **0.358 **0.972−0.0150.054 **
YRD0.6080.015 **−0.019 **44.665−0.598 **0.430 **54.0100.200 **−0.059 **98.593−0.326 **0.378 **1.701−0.0210.073 **
CC0.6490.020 **−0.028 **40.438−0.560 **0.745 **57.0700.114−0.169 **98.176−0.382 **0.572 **1.520−0.023 **0.062 **
SCB0.6730.015 **−0.038 **46.637−0.741 **0.793 **54.1120.422 **−0.240 **100.749−0.361 **0.541 **1.3220.0060.073 **
GD0.599 0.011−0.020 **57.595 −0.3240.17053.7820.102−0.027111.378−0.2290.139 **1.833−0.0090.114 **
** Trends are significant at the 95% confidence level.
Table 3. Correlation coefficients among AOD, PAR and NPP for croplands, forests, and grasslands.
Vegetation CoverRAOD_PARdirRAOD_PARdifRAOD_PARtotalRAOD_NPPRPARdir_NPPRPARdif_NPPRPARtotal_NPP
China−0.482 **0.408 **−0.516 **−0.066 **0.131 **−0.130 **0.114 **
Croplands−0.503 **0.388 **−0.536 **−0.138 **0.164 **−0.140 **0.162**
Forests−0.478 **0.381 **−0.531 **−0.119 **0.215 **−0.218 **0.187 **
Grasslands−0.326 **0.268 **−0.357 **−0.0840.182 **−0.159 **0.186 **
** Trends are significant at the 95% confidence level.
Table 4. The correlation coefficients between AOD, PAR and NPP for typical regions.
RegionRAOD_PARdirRAOD_PARdifRAOD_PARtotalRAOD_NPPRPARdir_NPPRPARdif_NPPRPARtotal_NPP
NP−0.516 **0.429 **−0.520 **−0.177 **0.171 **−0.1330.236 **
YRD−0.506 **0.389 **−0.542 **−0.0760.186 **−0.205 **0.181 **
CC−0.569 **0.417 **−0.609−0.226 **0.244 **−0.219 **0.220 **
SCB−0.342 **0.237 **−0.414−0.234 **0.338 **−0.313 **0.310 **
GD−0.489 **0.379 **−0.557 **−0.223 **0.300 **−0.313 **0.219 **
** Trends are significant at the 95% confidence level.

