Article

Earth Observation for the Implementation of Sustainable Development Goal 11 Indicators at Local Scale: Monitoring of the Migrant Population Distribution

1
Institute of Atmospheric Pollution Research (IIA), National Research Council (CNR), c/o Interateneo Physics Department, Via Amendola 173, 70126 Bari, Italy
2
Department of Civil, Environmental, Land, Building Engineering and Chemistry (DICATECh), Polytechnic University of Bari, Via Orabona 4, 70125 Bari, Italy
*
Author to whom correspondence should be addressed.
Remote Sens. 2020, 12(6), 950; https://doi.org/10.3390/rs12060950
Submission received: 21 January 2020 / Revised: 21 February 2020 / Accepted: 12 March 2020 / Published: 15 March 2020
(This article belongs to the Special Issue EO Solutions to Support Countries Implementing the SDGs)

Abstract

:
This study focused on implementation of the Sustainable Development Goal (SDG) 11 indicators, at local scale, useful in monitoring urban social resilience. For this purpose, the study focused on updating the distribution map of the migrant population regularly residing in Bari and a neighboring town in Southern Italy. The area is exposed to increasing migration fluxes. The method implemented was based on the integration of Sentinel-2 imagery and updated census information dated 1 January 2019. The study explored a vector-based variant of the dasymetric mapping approach previously used by the Joint Research Center (JRC) within the Data for Integration initiative (D4I). The dasymetric variant implemented can disaggregate data from census areas into a uniform spatial grid by preserving the information complexity of each output grid cell and ensure lower computational costs. The spatial distribution map of regular migrant population obtained, along with other updated ancillary data, were used to quantify, at local level, SDG 11 indicators. In particular, the map of regular migrant population living in inadequate housing (SDG 11.1.1) and the ratio of land consumption rate to regular migrant population growth rate (SDG 11.3.1) were implemented as specific categories of SDG 11 in 2018. At the local level, the regular migrant population density map and the SDG 11 indicator values were provided for each 100 × 100 m cell of an output grid. Obtained for 2018, the spatial distribution map revealed in Bari a high increase of regular migrant population in the same two zones of the city already evidenced in 2011. These zones are located in central parts of the city characterized by urban decay and abandoned buildings. In all remaining city zones, only a slight generalized increase was evidenced. Thus, these findings stress the need for adequate policies to reduce the ongoing process of residential urban segregation. The total of disaggregated values of migrant population evidenced an increase of 44.5% in regular migrant population. The indicators obtained could support urban planners and decision makers not only in the increasing migration pressure management, but also in the local level monitoring of Agenda 2030 progress related to SDG 11.

1. Introduction

Migration fluxes will continue to increase due to both ongoing economic–political crises and climate change [1,2,3,4]. As a result, both urban resilience and environmental and socioeconomic factors will be affected, inducing ever-growing areas of poverty. Cities facing the southern Mediterranean borders, especially, will be most exposed to such phenomena.
The purpose of this study is to implement Sustainable Development Goal (SDG) 11 [5] indicators in support of local decision makers and urban planners to develop facilities which may improve living conditions of both resident and migrant populations, and increase social resilience [4]. The spatial distribution of resident population and the settlement layer, i.e., only buildings, were recently considered essential societal variables requested for quantifying SDG 11 indicators [6,7]. To this aim, the study provides the updated settlement map and the spatial distribution (density) of the regular migrant population living in the city of Bari and the neighboring town of Modugno, which are among the areas in Southern Italy that are exposed to such processes.
Bari was included in a map produced by the European Joint Research Center (JRC), within the Data for Integration initiative (D4I) [8]. The map describes the migrant population density obtained for reference year 2011 in 100 × 100 m cells for all cities of eight European Community Member States: Italy, Germany, France, Spain, Portugal, UK, Ireland and the Netherlands. To obtain such a map, JRC adopted the dasymetric approach as a tool to disaggregate census data at the landscape level [9,10].
In the literature, the basic principle of dasymetric mapping is to subdivide source zones into smaller spatial units that possess greater internal consistency of the variable being mapped [11]. Boundaries represented on dasymetric maps reflect spatial distribution data of actual population distribution rather than artificially imposed limits (e.g., administrative boundaries) of areal units [12]. Even though dasymetric mapping has been adopted for many decades, the open source Geographical Information System (GIS) tools to explore dasymetric mapping outputs are scarce. JRC developed its own procedure by using the raster library of Geographic Resources Analysis Support System (GRASS) [13] in the Quantum GIS (QGIS) environment, a Free and Open Source Software (FOSS) under GNU GPLv2 General Public Licence. But the code, differently from dataset D4I, is not yet available for researchers and end-users.
The migrant population density was obtained by JRC by using 2011 census data provided by the National Statistics Institutes, the European Settlement Map (ESM) [14] and the Corine Land Cover (CLC) [15] products of the Copernicus Land Monitoring Service [16]. The CLC map was used to extract building use information. In particular, the JRC selected four macroclasses of building use: residential, rural, industrial and others. A constant correction factor was used per each class to adapt the same JRC procedure to 45,000 administrative units of eight European Member States [9].
The data of 2011 generated by JRC are available for visualization on the D4I web portal, but they cannot be downloaded, even though the concentration of the migrant population has dramatically changed.
The spatial distribution of resident population and the settlement layer (only buildings), were recently used to implement SDG 11.3.1, i.e., Land Use Efficiency (LUE), within the Global Human Settlement Layer (GHSL) in [6]. These variables can be used to provide additional SDG 11 indicators at both the global and local level through the integration of updated satellite, census and other domain-specific information, e.g., health and natural hazard maps. When observed over time and per unit area, the indicators obtained can provide trends useful for the implementation of the 2030 Agenda [17].
In this framework, the main objective of this study is to implement SDG 11 indicators for regular migrant population, i.e., 11.3.1—Ratio of land consumption rate to population growth rate and 11.1.1—Proportion of urban population living in slums, informal settlements or inadequate housing. Specifically, for indicator 11.1.1 two subindicators are evaluated for inadequate housing, interpreted for both their structural features and hazardous location. To this purpose, we update the built-up layer and the population density of regular migrants in the two municipalities and compare the JRC 2011 maps with 2018 results, in support of local decision makers.
In particular, this study applies the dasymetric methodology exploited by JRC, but enriches the same through the development of a vector-based approach in a QGIS environment, as an additional novel contribution. The vector approach may preserve the information complexity of each output grid cell identified and ensure lower computation costs, with respect to the raster approach. The processing chain is implemented in the QGIS environment (3.4 version) with open source Python language and made available from a free-access repository.
The procedure allows for the detection of trends in regular migration settlements and, thus the quantification of SDG 11 indicators at intraurban scale within a 100 × 100 m cell-size output grid. The indicators are implemented based on the disaggregation criteria of population information found in the SDG metadata files [18,19]. The indicators considered are well-related to urban resilience and could be relevant factors to guide urban planners and policy makers in devising sustainable, livable and resilient trajectories [20,21].
The paper is organized as follows: Section 2 describes material and methods; in this section the vector-based dasymetric approach is illustrated. Section 3 discusses the results. Section 4 includes a comparative discussion of the data obtained and Section 5 draws conclusions.

2. Materials and Methods

2.1. Study Area

The study area (Figure 1) covers about 260 km2 including the city of Bari and the town of Modugno, in the Apulia region, Southern Italy. Other nearby municipalities were not included due to the lack of both open data and common formats useful for our purpose.
According to a recent report on Italian Metropolitan Cities [22], due to migration processes, between 2001 and 2010 the rate of growth of the migrant population residing in the Bari area exceeded (+247.5%) the average national rate (+242.4%) [22]. The total Bari population, instead, increased of only 1.32% and remained quite stable up to 2018, with only an additional total increase of 0.12%, whereas the migrant population increased of +44.2% since 2010. Thus, there is an urgent need to have updated information about the local spatial distribution of the migrant population for the development of new services in support of local policy makers, urban planners and humanitarian bodies, as well as national, European and global players.

2.2. Satellite Derived Products

For the area under study, the ESM dated 2012, downloaded from the European Copernicus Services, includes only buildings at 10 meter spatial resolution [14]. Such a map represents the percentage of built-up area coverage per spatial unit. It was used by JRC to produce the spatial distribution of regular migrant population with the 2011 census data.
The present study first updated the settlement map of the area under study up to 2018 by using Sentinel-2 imagery. The data selected were multiseasonal and cloudfree Sentinel-2 images, downloaded freely from the European Space Agency (ESA) portal [23]. The dataset selected consisted of four images acquired on 30 January, 25 May, 29 July and 17 October 2018. All 10 image spectral bands were considered at 10 m spatial resolution.
Depending on in situ reference data availability, two different automatic classification procedures, data-driven pixel-based or, alternatively, knowledge-driven object-based, can be exploited to update the settlement map. Both approaches were implemented in this work. The Food and Agriculture Organization Land Cover Classification System (FAO–LCCS) taxonomy was considered for class discrimination [24].
More details about the two different classification approaches are provided hereafter:
  • Data-driven pixel-based approach. A pixel-based Support Vector Machine (SVM) classifier [25] was applied as a data-driven classifier, with a Radial Basis Function (RBF) kernel. The 10 image spectral bands were fed as input to the classifier along with the slope measurement from a Digital Elevation Model (DEM) available at 8 m. The latter input was added as input for discriminating built-up objects from extraction sites. The final following classes were considered: B15/A1 (Artificial Structures/Built Up); B15/A2A6 (Artificial Structures/Extraction sites); (B27 or B28)/A1 (Artificial or Natural Waterbodies/Water); A11/(A1 or A2)A9 or A12/(A3 or A4)E1 (Cultivated Lands or Natural Vegetation/(Trees or Shrubs) Evergreen); A11/(A1 or A2)A10 or A12/(A3 or A4) E2 (Cultivated Lands or Natural Vegetation/(Trees or Shrubs)Deciduous); A12/A2 (Natural Vegetation/Herbaceous); A11/A3 (Cultivated Lands/Herbaceous. The output LC map was produced by training the SVM classifier with 11,965 reference pixels. Next, the freely available [26], 5 m-buffered road map, dated 2018, was used in order to discriminate buildings from roads within the B15/A1 output map layer (built-up).
  • Knowledge-driven object-based approach includes two different steps: a preliminary segmentation and a successive classification [27]. The hierarchical scheme adopted by the FAO–LCCS taxonomy was implemented for class discrimination. First, Vegetated or Not-Vegetated objects (LCCS Level 1) and then, for each one, Terrestrial or Aquatic areas, were recognized (LCCS Level 2). Finally, within the Artificial Structures layer, buildings were discriminated from roads using the Length/Width morphological feature. The latter exploits the elongated dominant shape that characterizes roads but not buildings.
The final output binary settlement maps for year 2018, at 10 m spatial resolution, obtained by the two approaches were validated through the same set of reference samples (3659 pixels). To obtain a sample population that could best represent the entire population under study, both training and validation reference pixels were selected through a stratified random sampling. This sampling technique was used to ensure that the actual population class segments were neither over-represented nor under-represented [28].

2.3. Updated Statistical Census Data: Collection and Harmonization

The Italian National Institute of Statistics (ISTAT) publishes data about resident migrant population regularly in order to contribute to Eurostat International Migration statistics. Every year, the publication concerns the total number of regular migrant residents in each municipality classified by sex, nationality and age; every 10 years the publication provides data on the number of regular migrants residing in each municipality specified per census area. The latest updated census data relate to the 2011 National Census Collection.
However, at local level, the Demographic Service Office of each municipality is in charge of collecting the distribution of regular migrants every year. Since the present study uses the dasymetric method to establish the distribution of regular migrant population within Bari metropolitan area, the acquisition of relative relevant data could only be obtained through the interaction and collaboration with the Demographic Service Office municipalities. However, for only Modugno municipality, neighboring with Bari, was it possible to find ancillary data for the year 2018.
The data obtained from the Bari and Modugno offices were highly fragmented and without a common standardization template. In fact, the Bari office contributed data aggregated per census area, while the Modugno office provided data according to the address. Hence, efforts were needed in order to harmonize the information available for both municipalities and group them for census area. The tabular data were transposed on maps represented in Universal Transverse Mercator Coordinate System (European Terrestrial Reference System 1989) and ingested in the open source QGIS environment (Figure 2).

2.4. Building Use Information

The dasymetric method proposed by JRC extracted the following classes of building use from the Corine Land Cover (CLC) 2012 [15] map: residential, industrial, rural and others. In this study, building use was extracted from the updated CLC 2018 [29] provided by Copernicus Land Monitoring Services (Figure 3), and adopted as weighting factors for the population density estimation (Section 2.6).

2.5. Ancillary Data for the Implementation of SDG 11 Subindicators

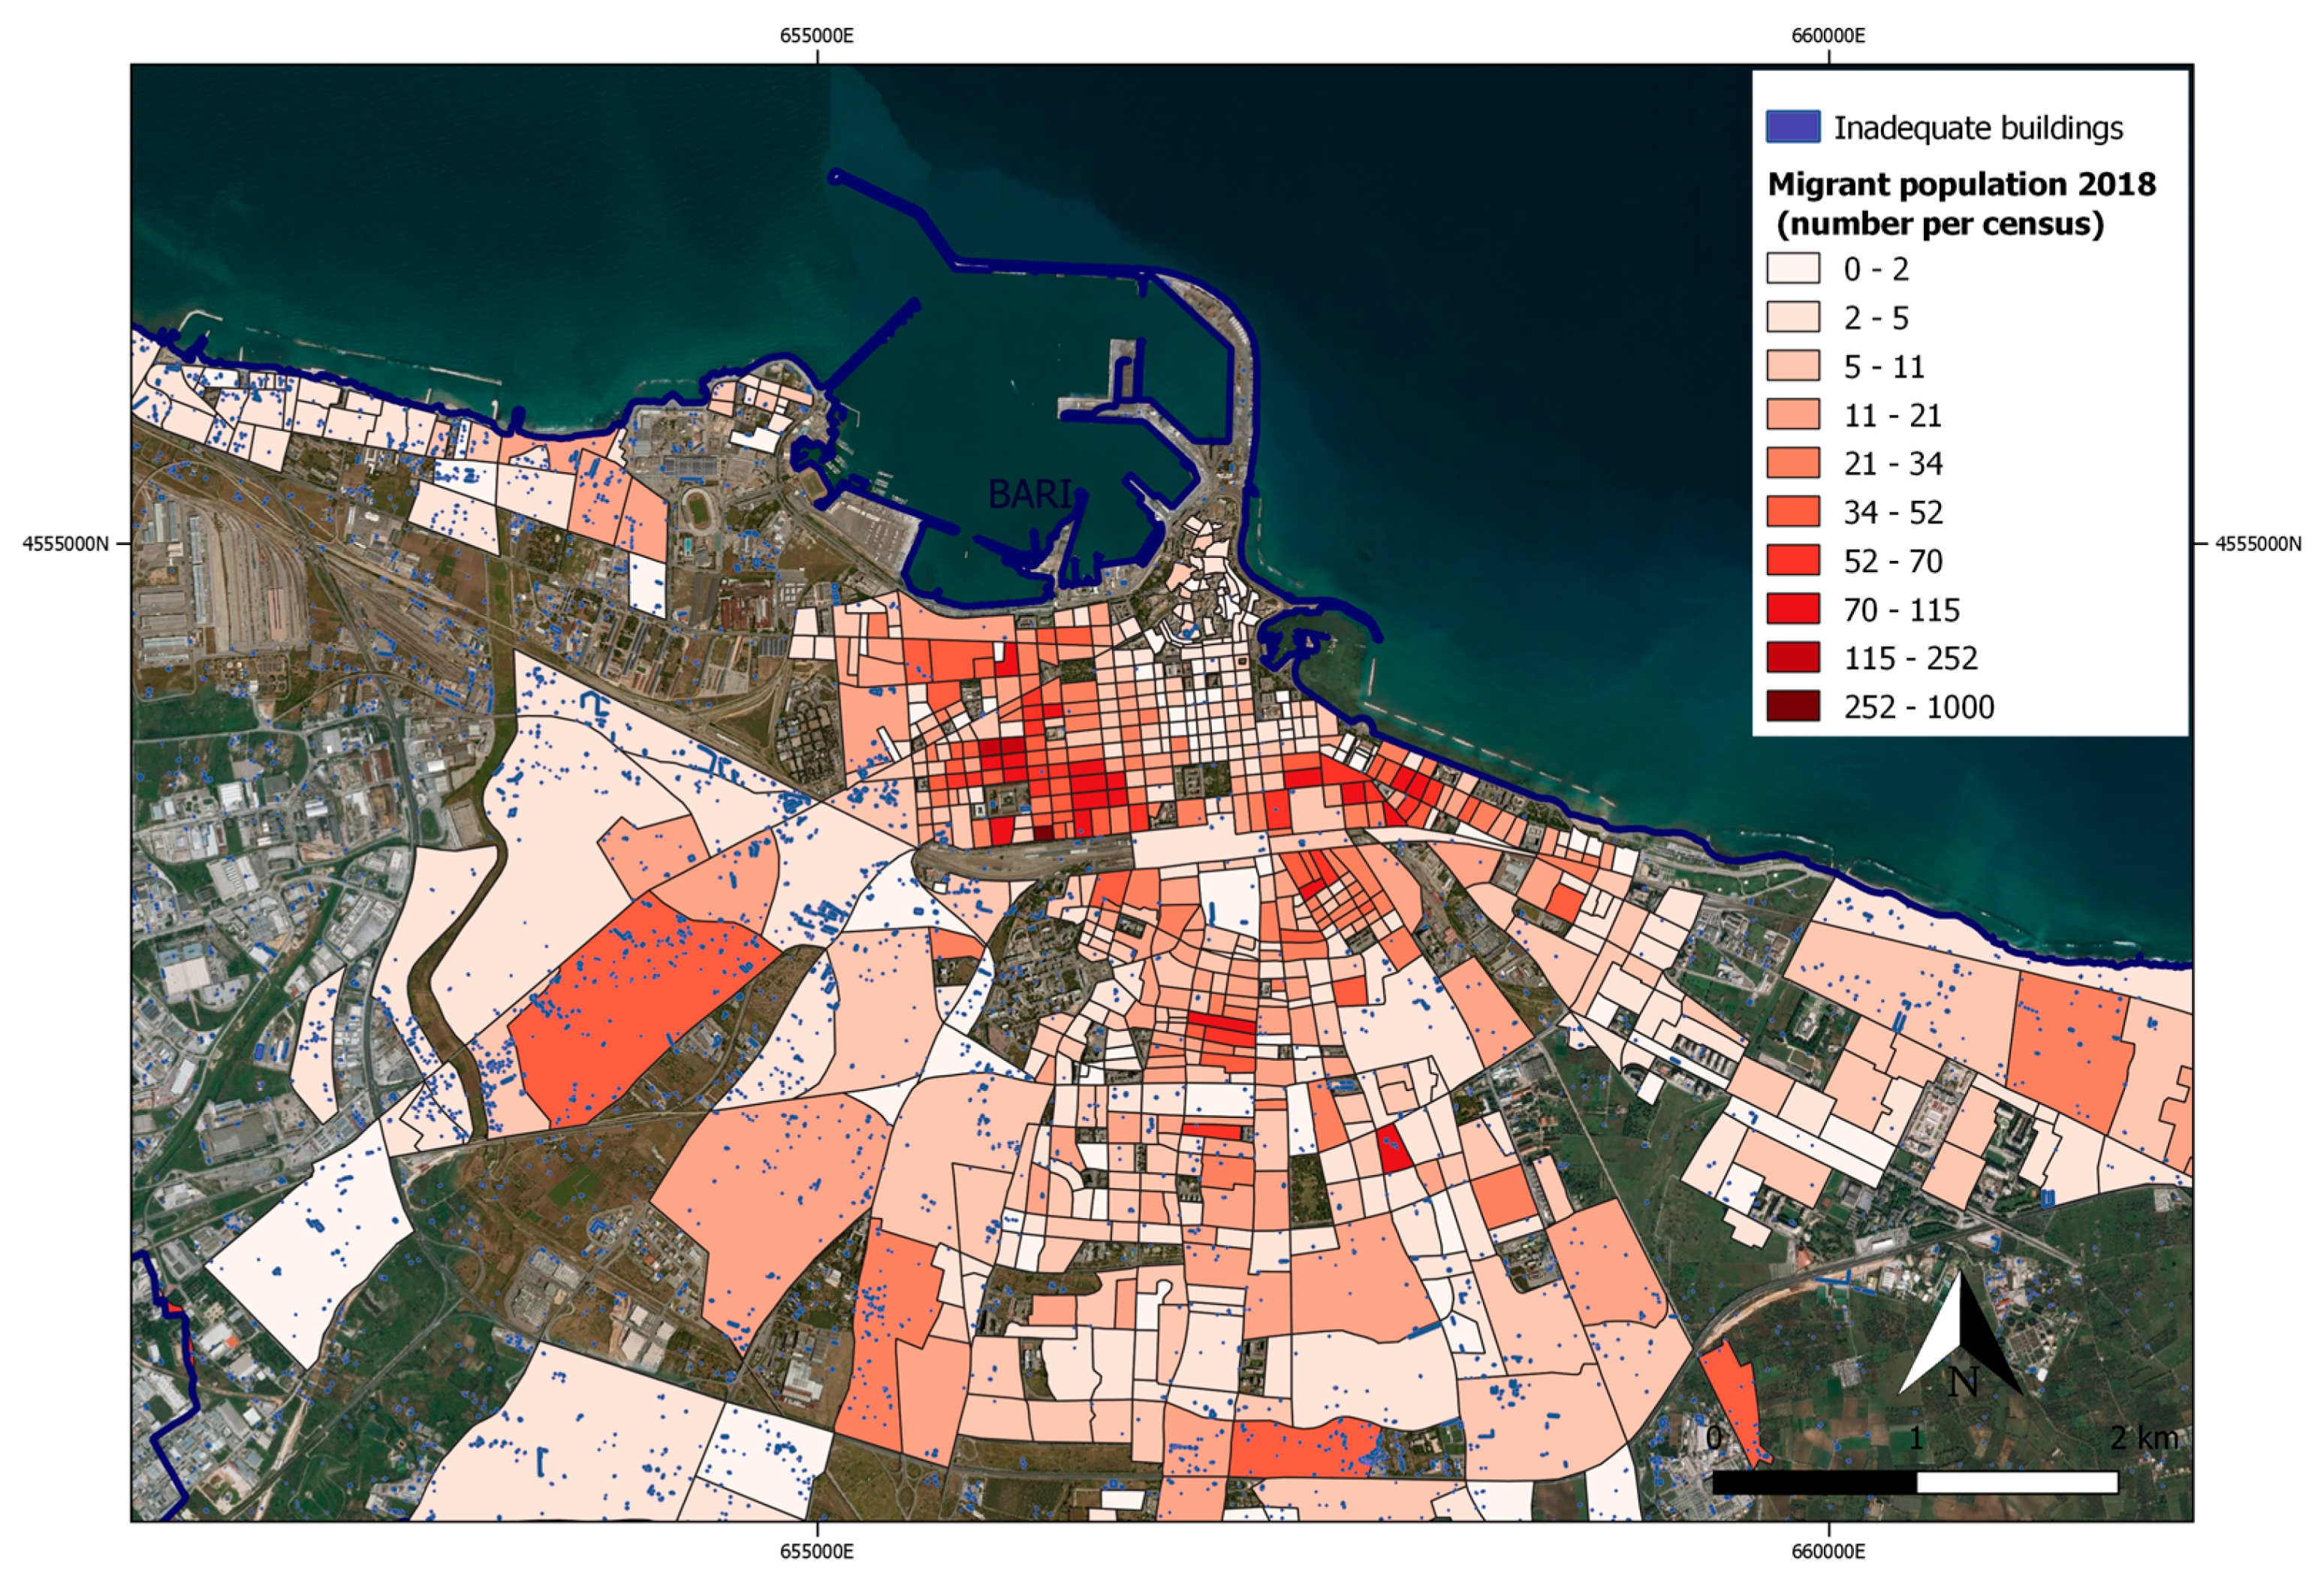
A finest local layer of building use information, updated to 2017, was available only for Bari. This layer provided useful information on number and position of inadequate housing (Figure 4). It was used as input for the evaluation of the SDG11.1.1 indicator related to buildings that can be considered inadequate for structural quality and durability criteria.
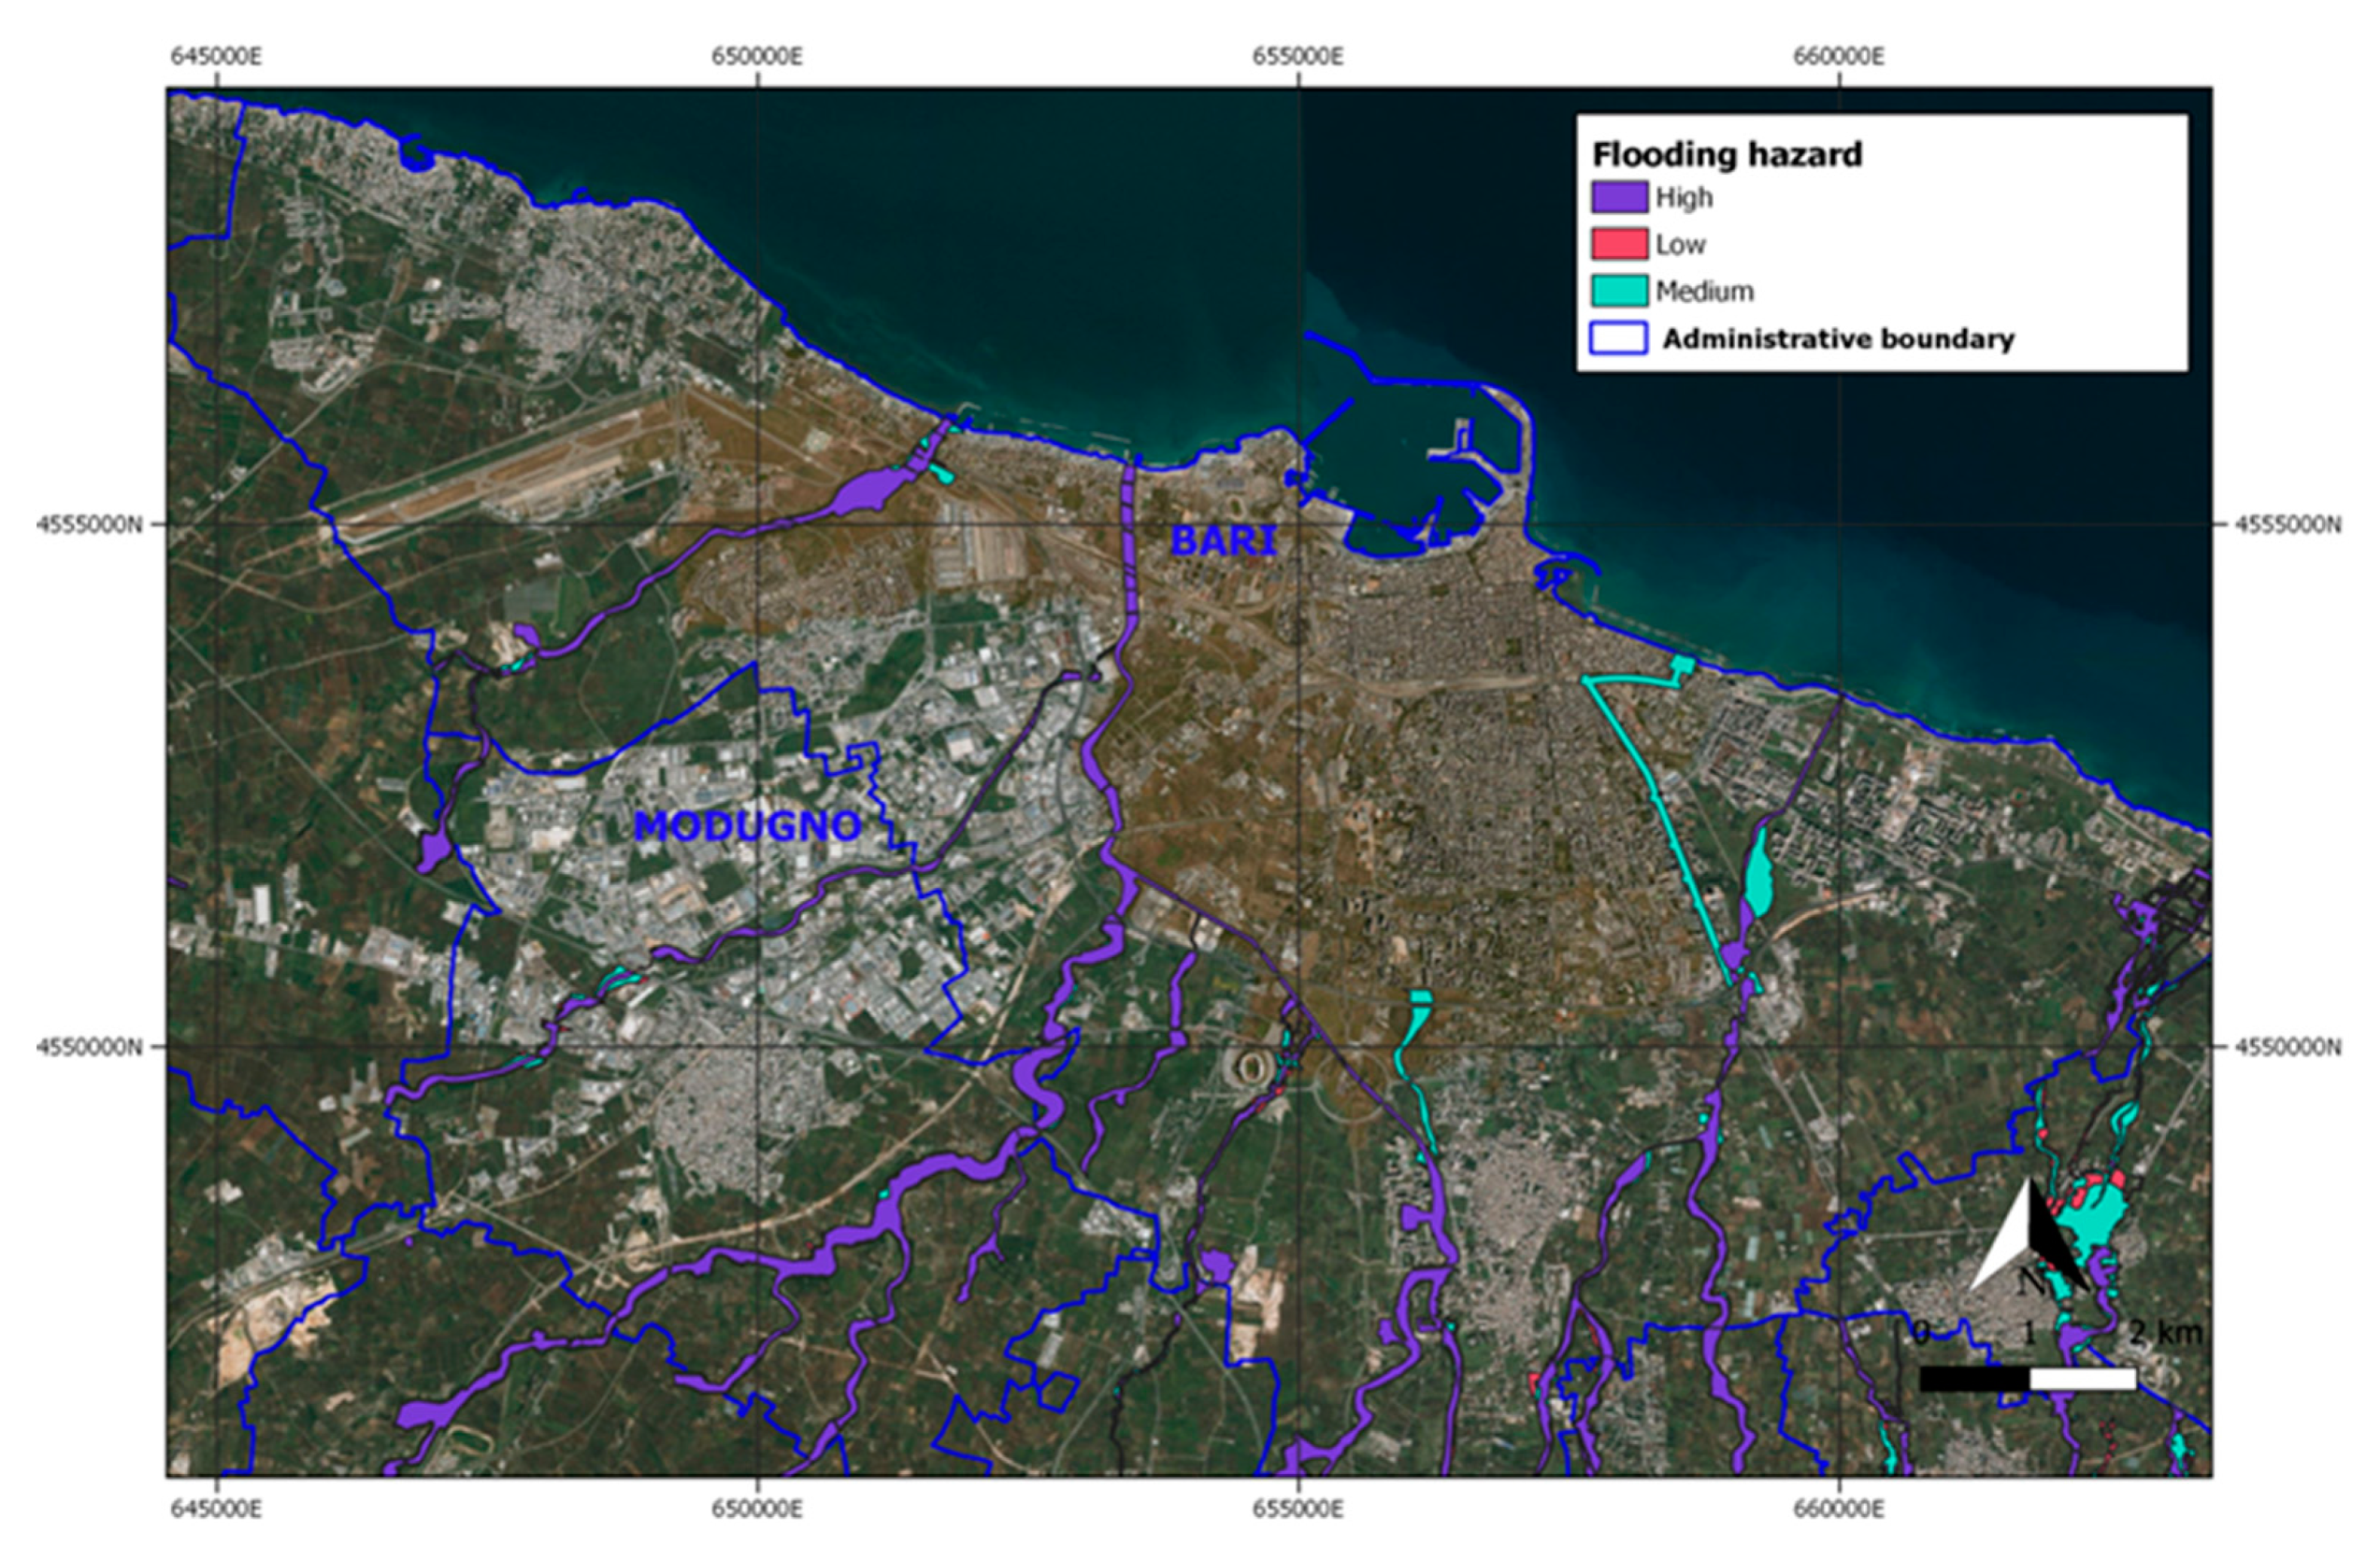
Flooding is one of the major hazards that can affect the Bari area. It is due to heavy rain events and the increased soil sealing occurring in the last few decades. An updated flooding hazard map (2018) was obtained from the Apulia Basin Authority [30] and used as input for the evaluation of the SDG11.1.1 indicator related to buildings that can be considered inadequate because they are close to or inside an hazardous area. The available flooding map is shown in Figure 5.

2.6. Updating Spatial Distribution of Resident Migrant Population: the Dasymetric Mapping Method

Demographic data are usually represented by a choropleth map [31], where the statistical data are aggregated with census area. This type of representation is reported to have several limitations with respect to spatial analysis and population distribution [32]. On the other hand, dasymetric maps have the advantage of “representing population density, irrespective of any administrative boundary, as distributed in reality, i.e., by natural spots of concentration and rarefaction” [10].
JRC dasymetric mapping of resident migrants population was implemented by applying Equation (1) to each element of a uniform output 100 × 100 m cell-size grid:
P g r i d = P c e n s u s B F g r i d B F c e n s u s
where:
P g r i d is the population density assigned to each output cell;
P c e n s u s is the population density of resident migrants in the relevant input census section;
B F g r i d is the weighted, for the building use, built-up footprint area occupied in the output cell;
B F c e n s u s is the weighted, for the building use, built-up footprint area occupied in the input census zone.
It seems worth remembering that in order to be reliable, this formula requires information on the location and the spatial size of buildings included in the output cell. The minimum structure or object to be identified is defined as the building footprint area [33].
As input for the dasymetric map, JRC adopted the ESM 2012 map (10 m) to extract built-up areas [9]. In our study, the extraction of built-up areas for 2018 was based on a LC map from high resolution Sentinel-2 satellite data (10 m). Once extracted, built-up elements were weighted, for the building use, through the same weight values as the ones adopted by JRC (Table 1). The rationale behind this weighting procedure is to account for the fact that, due to multifloor buildings, population density values are generally higher in urban areas than in rural contexts.
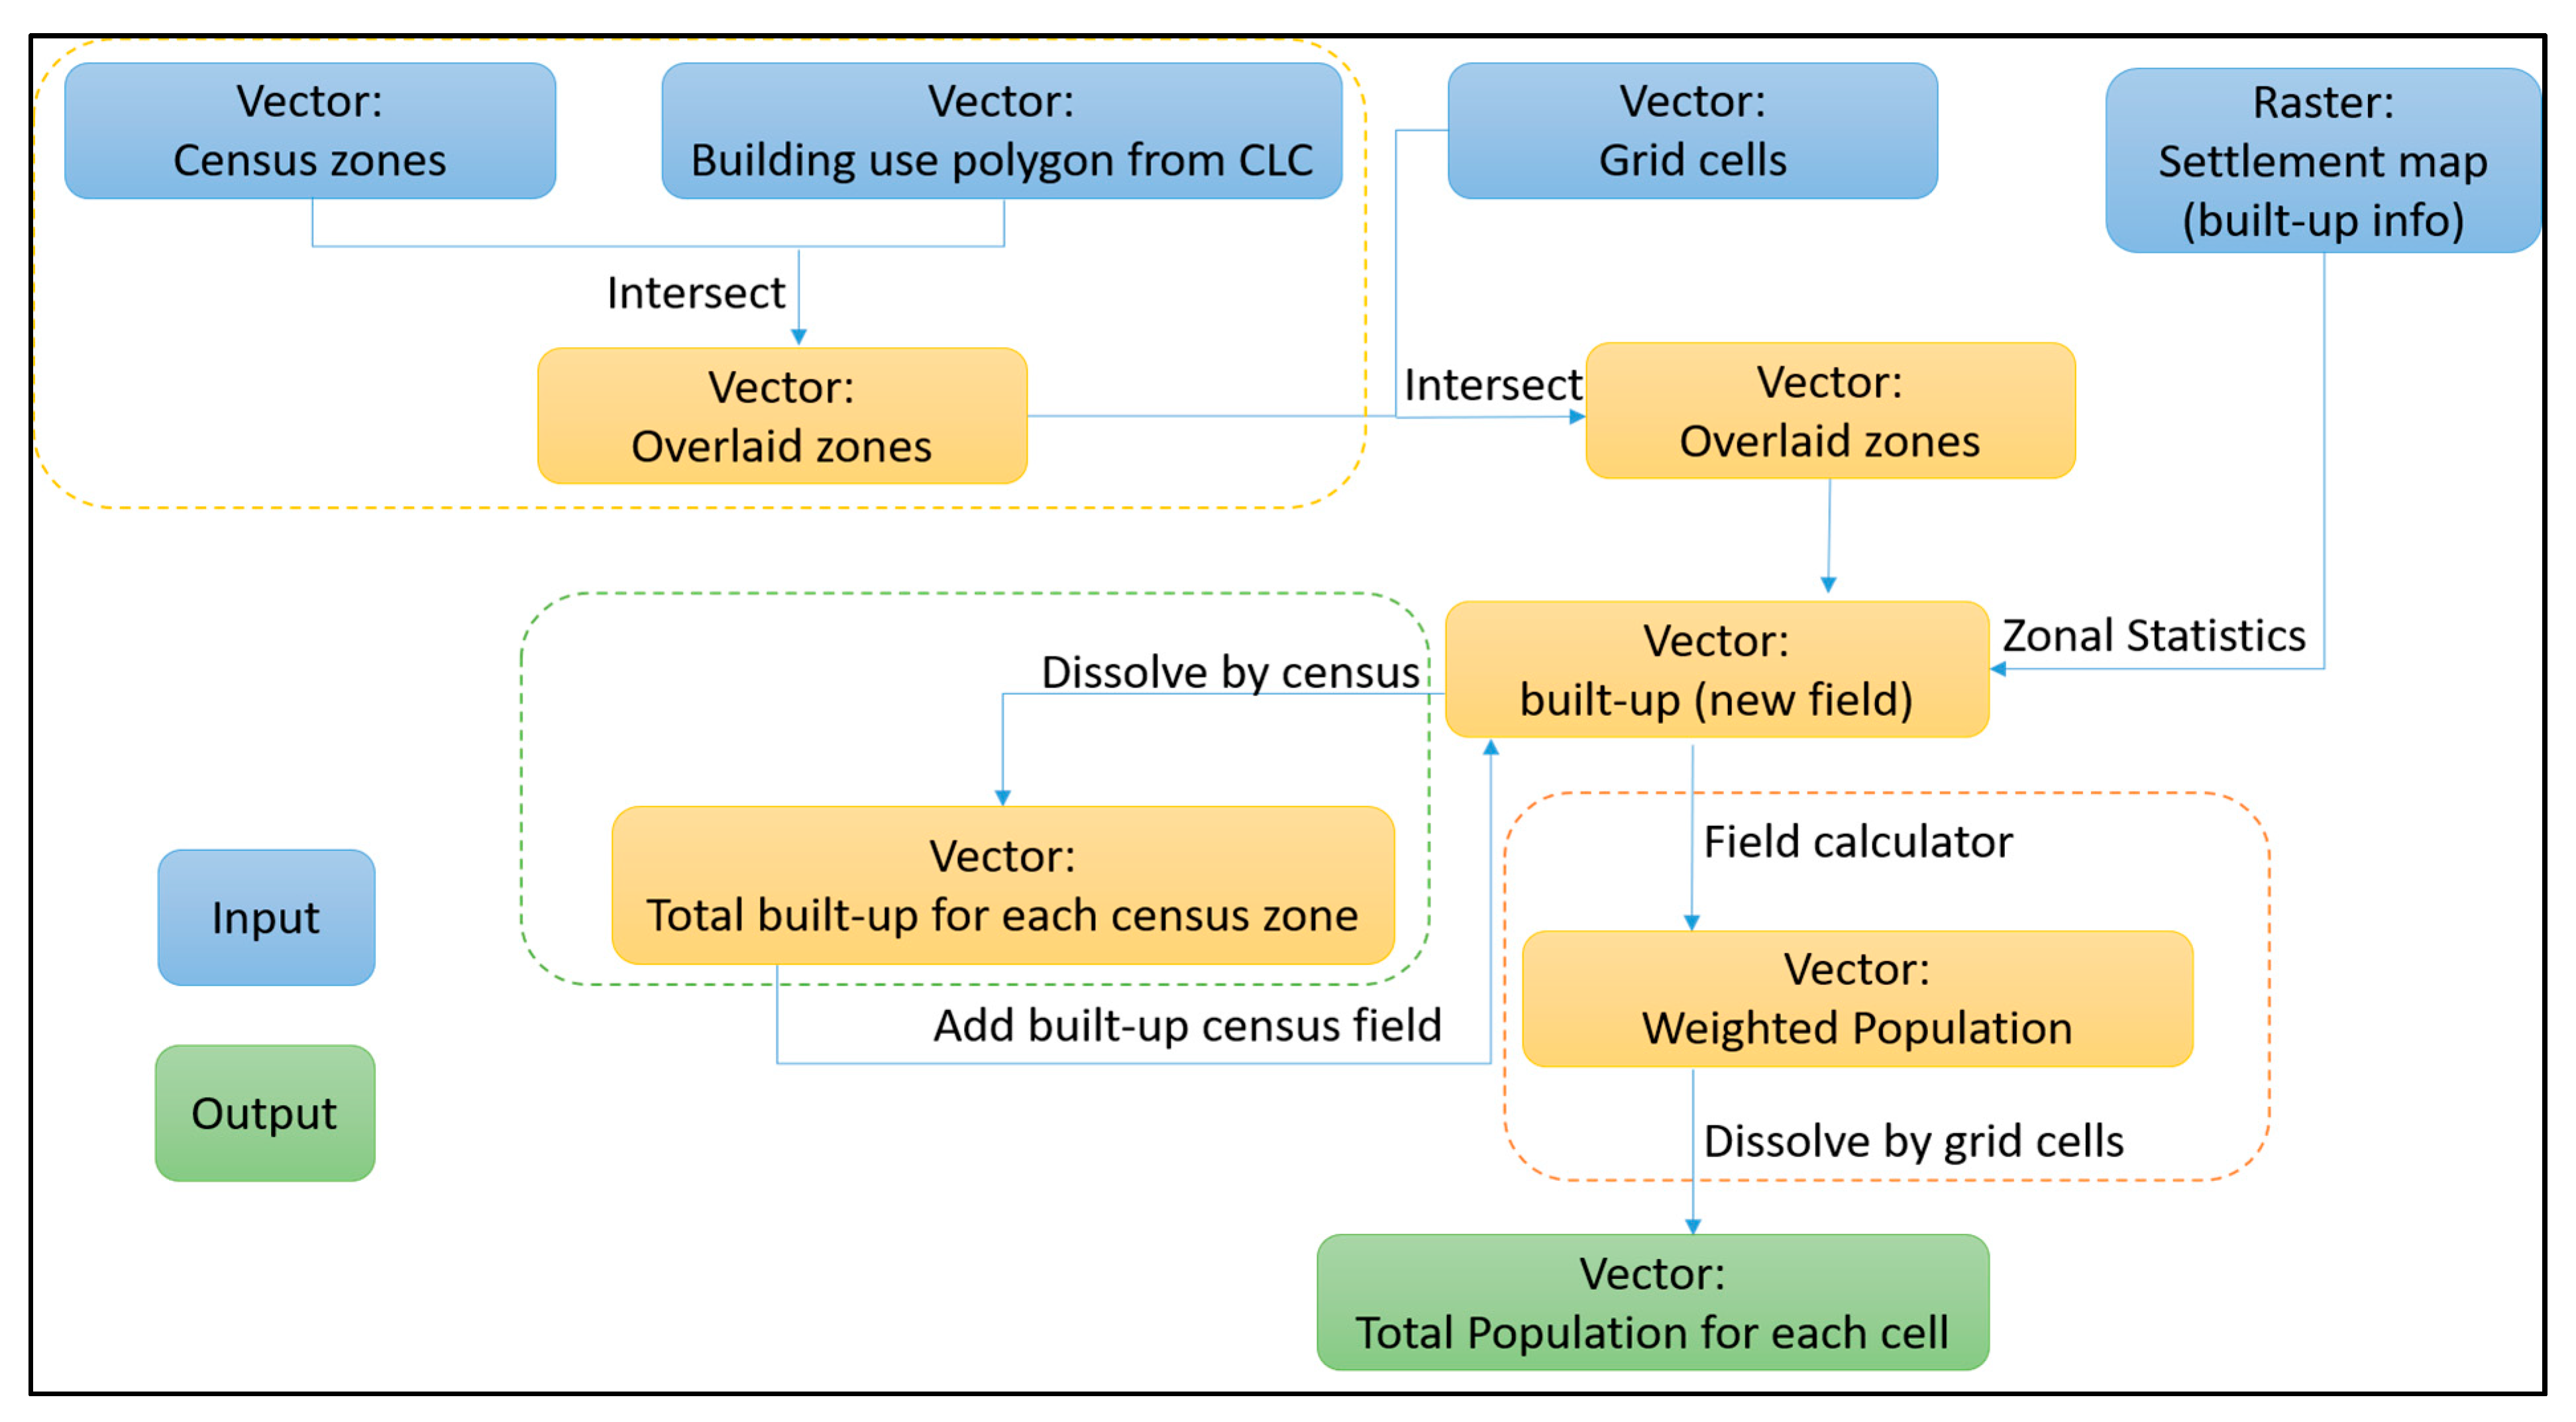
Figure 6 presents the vector approach used in our study to update the spatial distribution of resident migrants in the Bari and Modugno area during 2018.
The specific formula (Equation (2)) implemented in Python within the QGIS environment is:
P g r i d = j = 1 m P j ,   c e n s u s i = 1 n B F s u b _ e l e m G R I D i C o r r f a c t o r l = 1 k B F s u b _ e l e m C E N S U S l C o r r f a c t o r
where:
B F s u b _ e l e m G R I D i is the built-up footprint area in a generic subelement i of a census zone, with different building use, included in the output cell considered;
B F s u b _ e l e m C E N S U S l is the built-up footprint area in a generic subelement l of a census zone having different building use;
m is the number of the census zones in a cell;
n is the number of census zone subelements, with different building use, within a grid cell;
k is the number of census zone subelements with different building use.
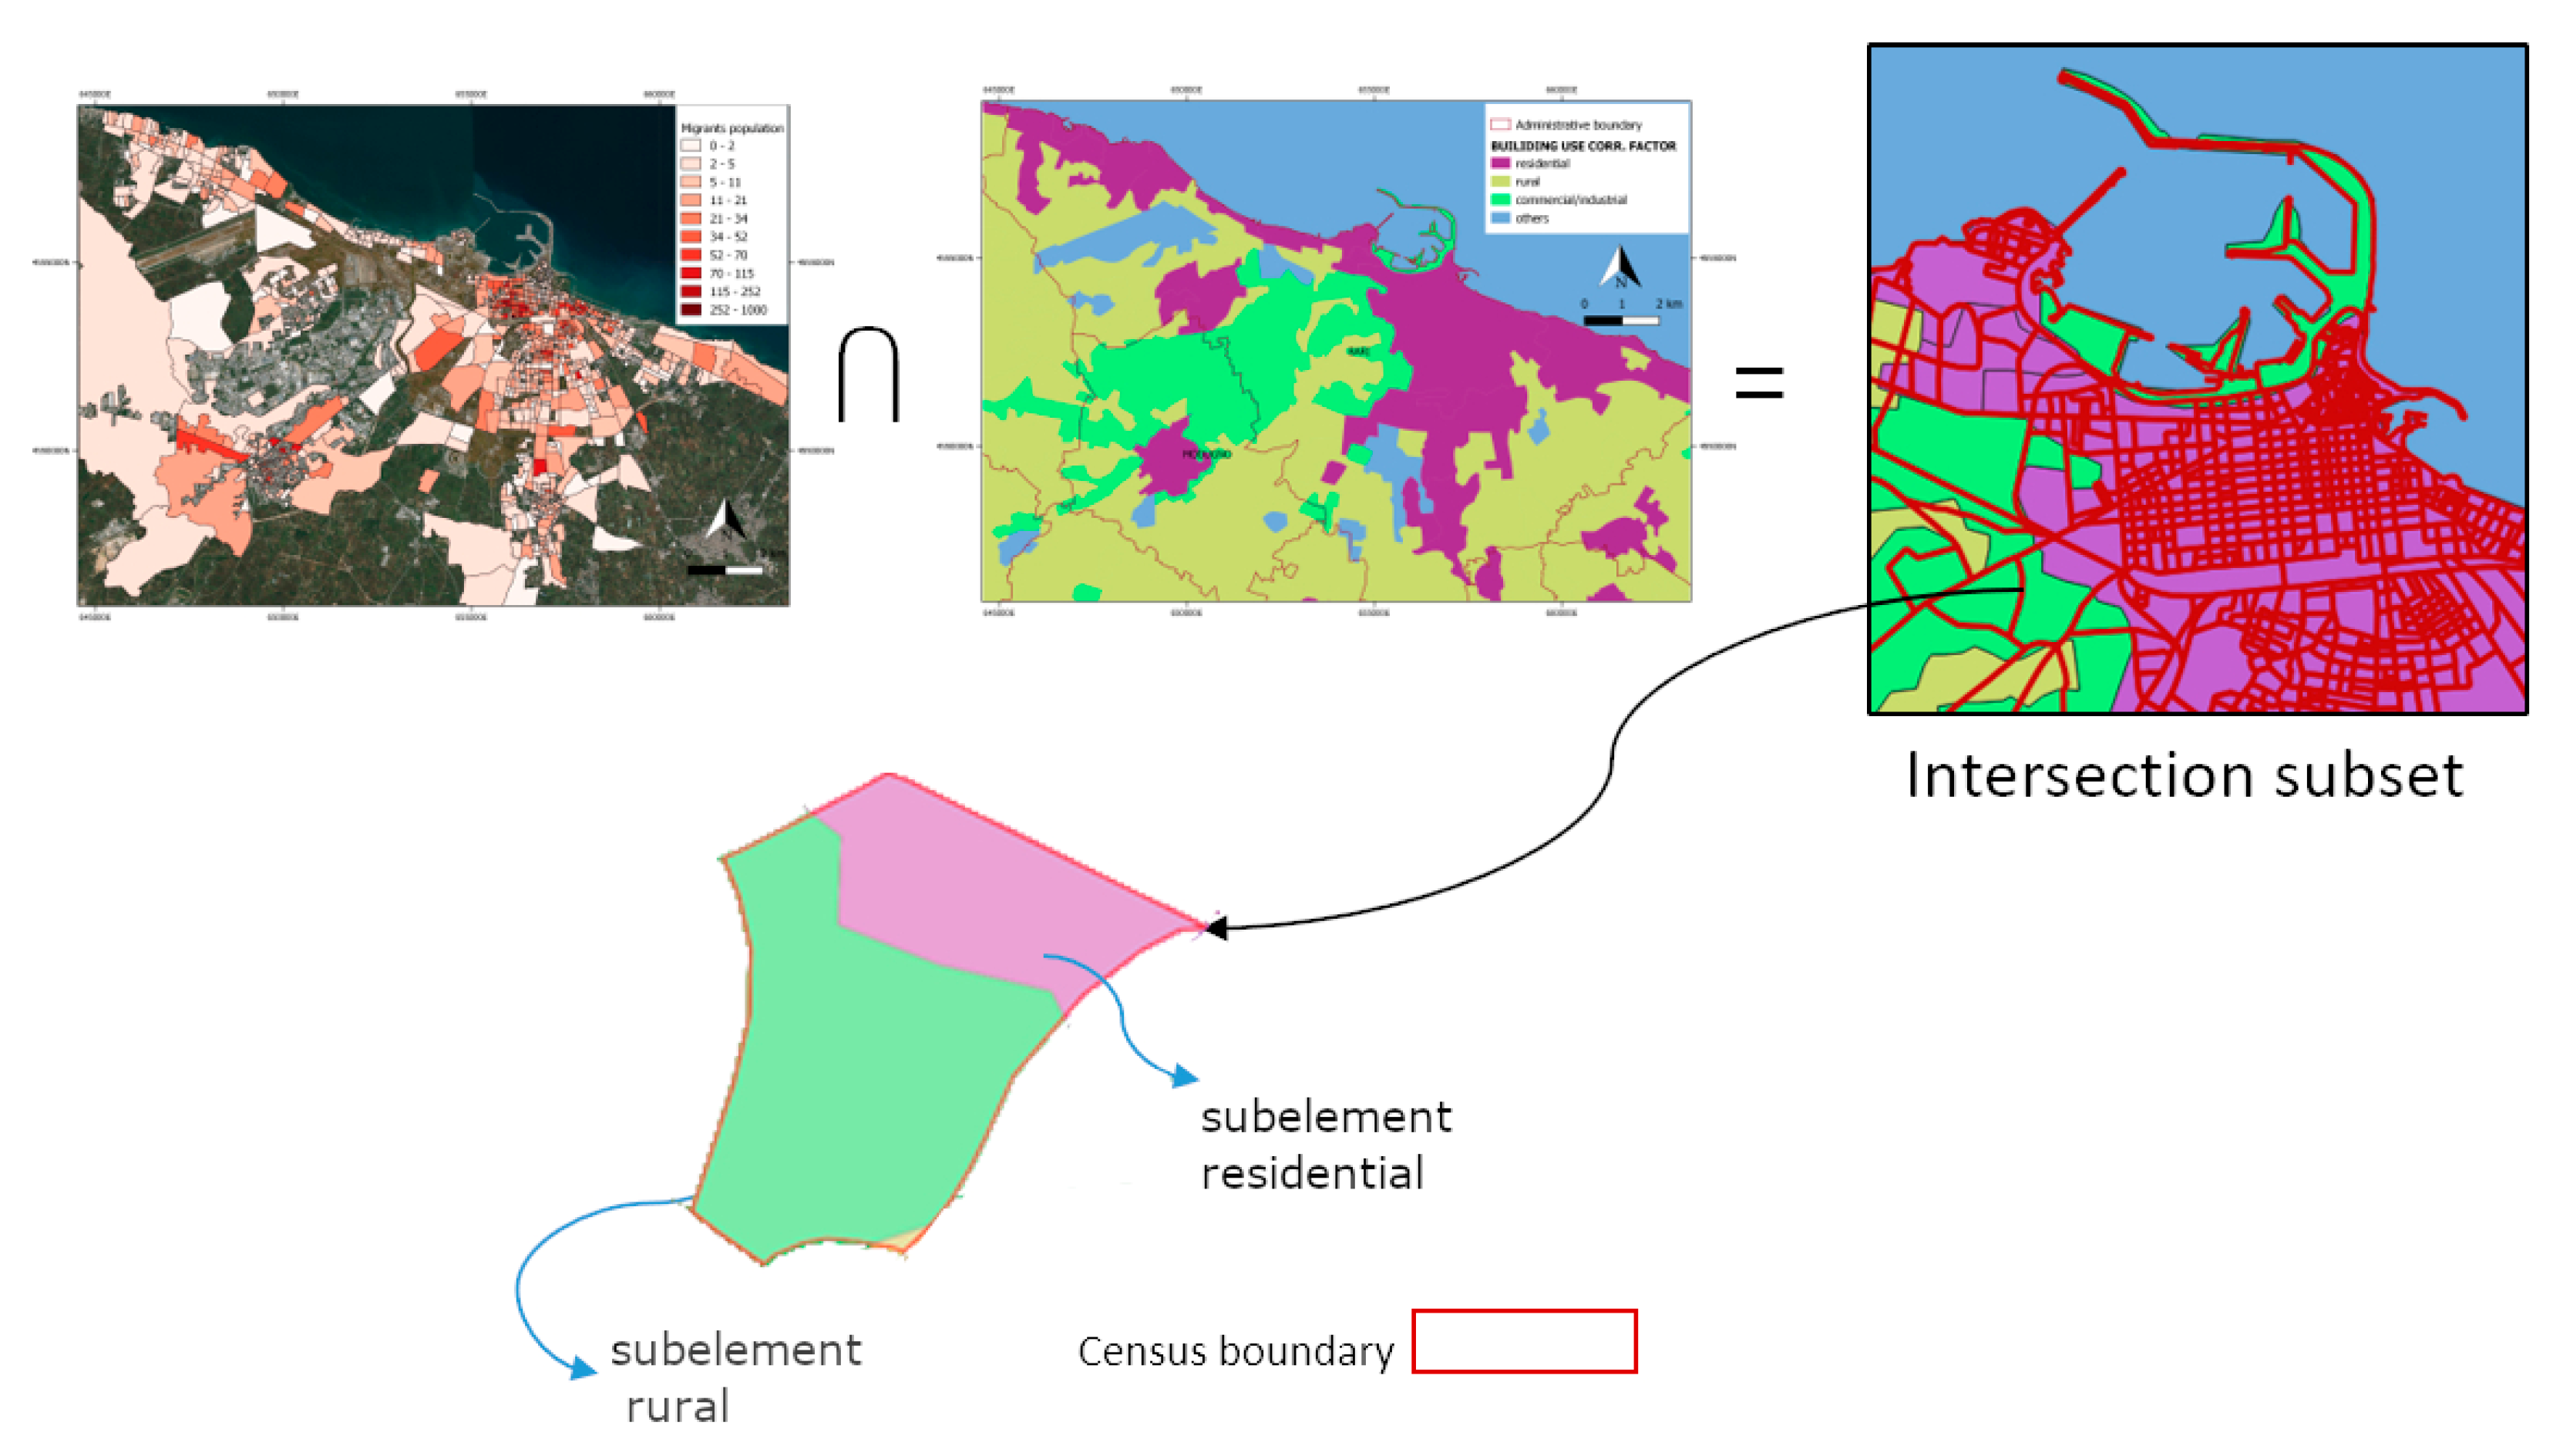
The term l = 1 k B F s u b _ e l e m C E N S U S l × C o r r f a c t o r is equivalent to B F c e n s u s found in Equation (1) used by JRC. Such a term corresponds to the sum of the areas occupied by built-up structures in any subelement, within the specific census zone, multiplied by the correction factor reflecting building use (see Table 1). In order to compute this term, an intersection between the choropleth map of regular migrant population distribution in census zones and building use information was needed. Figure 7 shows a graphical example of the computation steps performed.
The map thus obtained was then overlaid with an output grid (100 × 100 m). As a result, each cell in the grid could be associated to more than one census zone and be divided into elements indicating different building use (Figure 8). When the cell belonged to a single census zone, the term i n B F s u b _ e l e m G R I D i C o r r f a c t o r was equal to B F g r i d (Equation (1)), otherwise a separate computation was required for each census zone part within the cell.
The resident migrant population of each census zone in the cell P j , c e n s u s was thus weighted by the factor:
i = 1 n B F s u b _ e l e m G R I D i C o r r f a c t o r l = 1 k B F s u b _ e l e m C E N S U S l C o r r f a c t o r
The sum of the products between the populations P j , c e n s u s and the respective weighting factors in Equation (3) allowed computation of total resident migrant population to be assigned to each cell of the output map.
The processing chain was implemented in the QGIS environment (3.4 version) and were compatible with all versions supported by Python 3.7.
In order to handle the dasymetric modeling uncertainty related to the output map, two indicators were used, i.e., the Mean Absolute Error (MAE) and the Total Absolute Error (TAE), as described elsewhere [10,34]. These indicators were computed by comparing the input population value provided for each census zone ( P j , c e n s u s ) with the sum of all pixels population output values included in each census zone ( P j ).
TAE and MAE were computed using Equations (4) and (5):
T A E = j | P j , c e n s u s P j |
M A E = 1 N j | P j , c e n s u s P j |
where N is the total number of cells considered.
Validation strategy based on in situ reference data was not applied due to the confidentiality of information involved at the local scale (intraurban).

2.7. SDG Indicators Implementation

The updated settlements (built-up) map and the updated spatial distribution of resident migrant population thus obtained were used to implement: (a) SDG 11.1.1 indicator, i.e., proportion of urban population living in slums, informal settlements or inadequate housing [18]; (b) SDG 11.3.1. indicator, i.e., ratio of Land Consumption Rate to Population Growth Rate (LCRPGR) [19]. For both indicators, vector maps, in shapefile format, were produced.
Specifically, based on data availability, indicator SDG 11.1.1 was split into two components related to structural and quality criteria (a.1) or location criteria (a.2), respectively:
(a.1) Proportion of urban population living in inadequate housing households (IHH_1);
(a.2) Proportion of urban population living in households considered inadequate due to their residing on or close to hazardous areas (IHH_2).
Inadequate housing is defined with respect to structural conditions, location and durability of the building. A house is considered as “durable” if it is built in a nonhazardous location and has a permanent and adequate structure able to protect its inhabitants from climatic extremes such as heavy rain, heat, cold and humidity [18].
For component (a.1) of SDG 11.1.1, related to structural quality criteria, under the hypothesis that people are equally distributed in all the cell settlements, the indicator, according to [18], was computed as:
IHH _ 1 = 100 [ N u m b e r   o f   p e o p l e   l i v i n g   i n   i n a d e q u a t e   h o u s i n g   h o u s e h o l d s   C i t y   p o p u l a t i o n ]
where the number of people leaving in inadequate housing households ( N _ IHH _ 1 c e l l ) per each output cell was provided as:
N _ IHH _ 1 cell = P g r i d   [ F o o t p r i n t   a r e a   o f   i n a d e q u a t e   h o u s i n g   h o u s e h o l d s   F o o t p r i n f   a r e a   o f   s e t t l e m e n t   m a p   2018 ]
with P g r i d representing the total regular migrant population in the output cell considered.
Information about the position of inadequate housing introduced in Section 2.5 (Figure 4) was used.
For component (a.2) of SDG 11.1.1 related to location criteria, the indicator formula was computed as:
IHH _ 2 = 100 [ N u m b e r   o f   p e o p l e   l i v i n g   i n     h o u s i n g   h o u s e h o l d s   o n   o r   c l o s e   t o   h a z a r d o u s   a r e a s   C i t y   p o p u l a t i o n ]
where the number of people leaving in housing households on or close to hazardous areas ( N _ IHH _ 2 c e l l ) per each output cell was provided as:
N _ IHH _ 2 c e l l = P g r i d   [ F o o t p r i n t   a r e a   o f   h o u s i n g   h o u s e h o l d s   o n   o r   c l o s e   t o   h a z a r d o u s   a r e a s F o o t p r i n f   a r e a   o f   s e t t l e m e n t   m a p   2018 ]
Information about hazardous areas introduced in Section 2.5 (Figure 5) was used.
Concerning the SDG 11.3.1 indicator, the formula applied for computing is described in [19]. Such formula, already applied by [6] at the global scale, is based on the ratio between the Rate of Land Consumption (LCR) and the Population Growth rate (PGR) as follows:
LCRPGR = [ L a n d   C o n s u m p t i o n   R a t e P o p u l a t i o n   G r o w t h   R a t e ]
with:
Land   Consumption   Rate = ln ( U r b g r i d ,   t + n / U r b g r i d , t ) n
and:
Population   Growth   Rate = ln ( P g r i d , t + n / P g r i d , t ) n
where:
U r b g r i d , t + n is the surface occupied by urban areas, in the output cell considered, at the final year (t+n);
U r b g r i d , t is the surface occupied by urban areas, in the output cell considered, at the initial reference year (t);
P g r i d ,     t + n is the regular migrant population living in urban areas, in the output cell considered, at the final year (t+n);
P g r i d , t is the regular migrant population living in urban areas, in the output cell considered, at the initial reference year (t);
n = number of years between initial and final dates considered.
In this study, starting year (t) was 2011 and final year (t+n) was 2018, according to census data availability. Thus, at the two study dates, the available settlement map obtained from Copernicus ESM and the one obtained from classification of 2018 Sentinel-2 images, were considered as Urb measures with a n = 7 years.

3. Results

The results of the analysis concern the classification of a multitemporal Sentinel-2 data set (Section 3.1), the updating of the regular migrant population distribution map in 2018 compared with the existing map produced by JRC in 2011 (Section 3.2) and the extraction of SDG11.1.1. and SDG 11.3.1 (Section 3.3).

3.1. Classification of Sentinel-2 Imagery

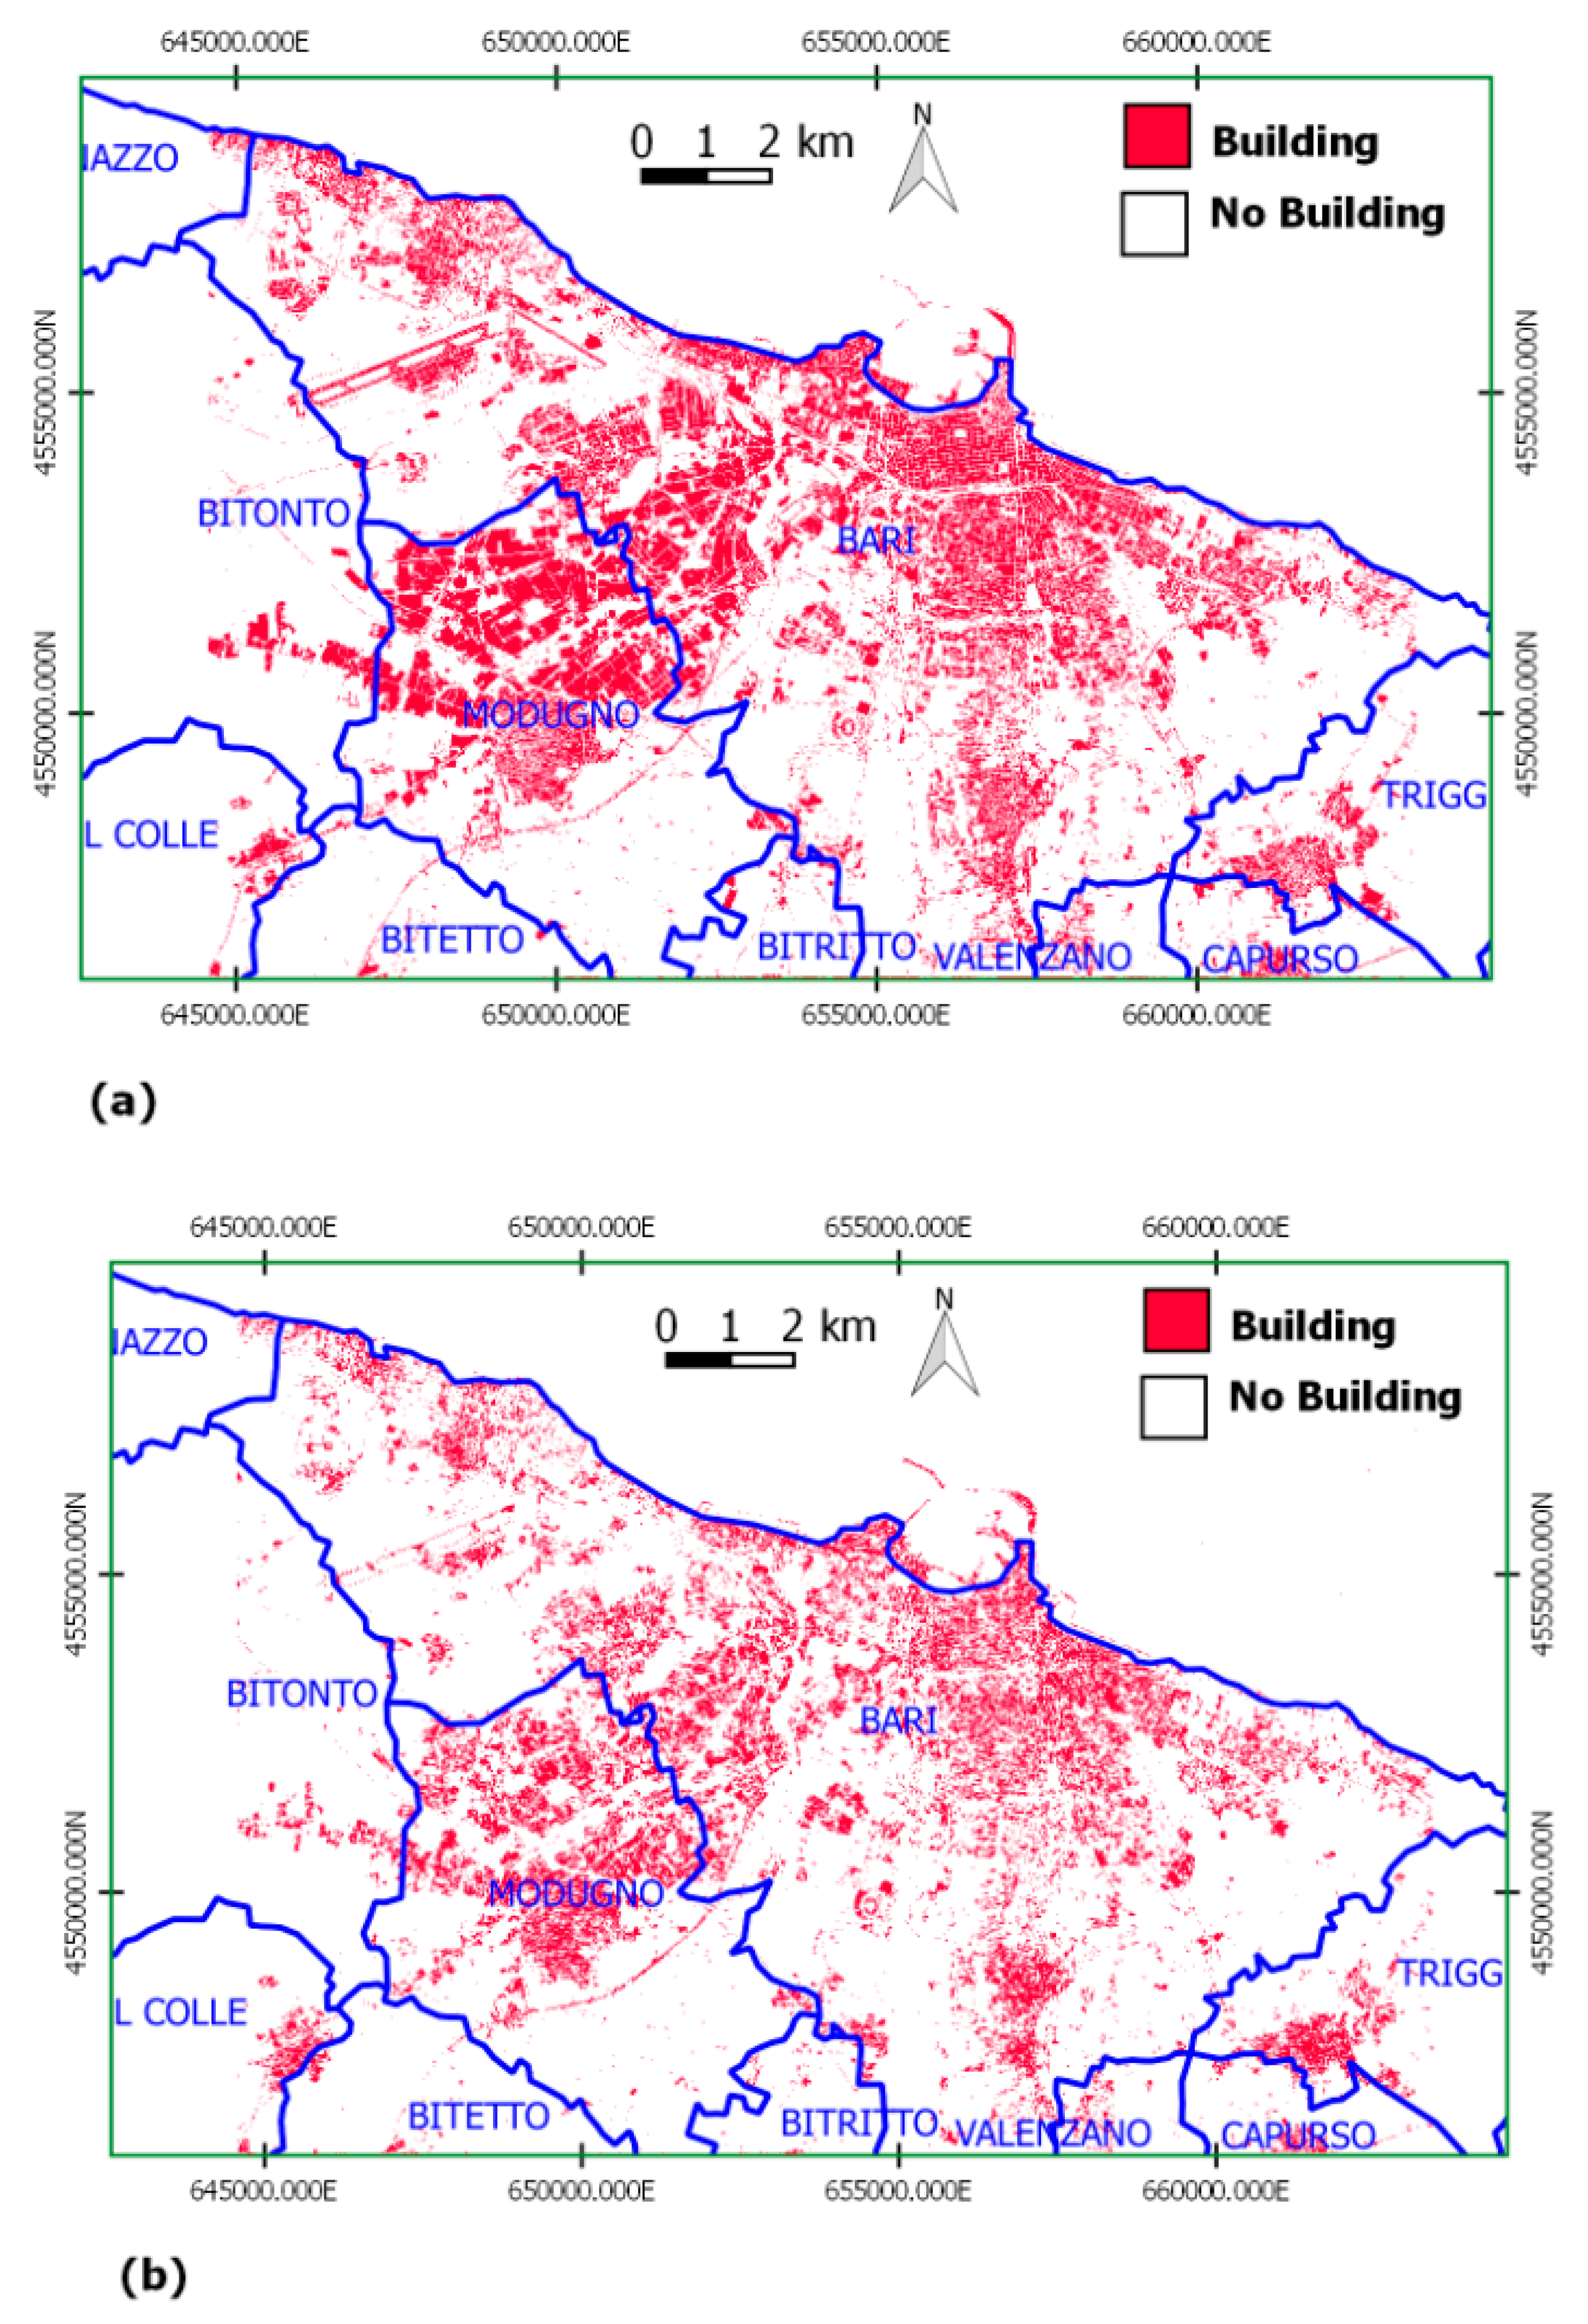
The Overall Accuracy (OA) of the settlement map (Figure 9) produced for year 2018, at 10 m, was 99.13% ± 0.30% from the data-driven classifier (SVM) and 95.52% ± 0.30% from the knowledge-driven approach, respectively. The better performance of the SVM classifier along with the use of street map data can explain the difference in the OA of the output map (Figure 9a) with respect to the one obtained from the knowledge-driven approach (Figure 9b). The latter directly provided only buildings without the need for any additional ancillary information.
In this study, the SVM output map was used for subsequent analysis, but the output from the knowledge-driven classifier could be very useful when the collection of reference data is difficult.

3.2. Regular Migrant Population Map Updating

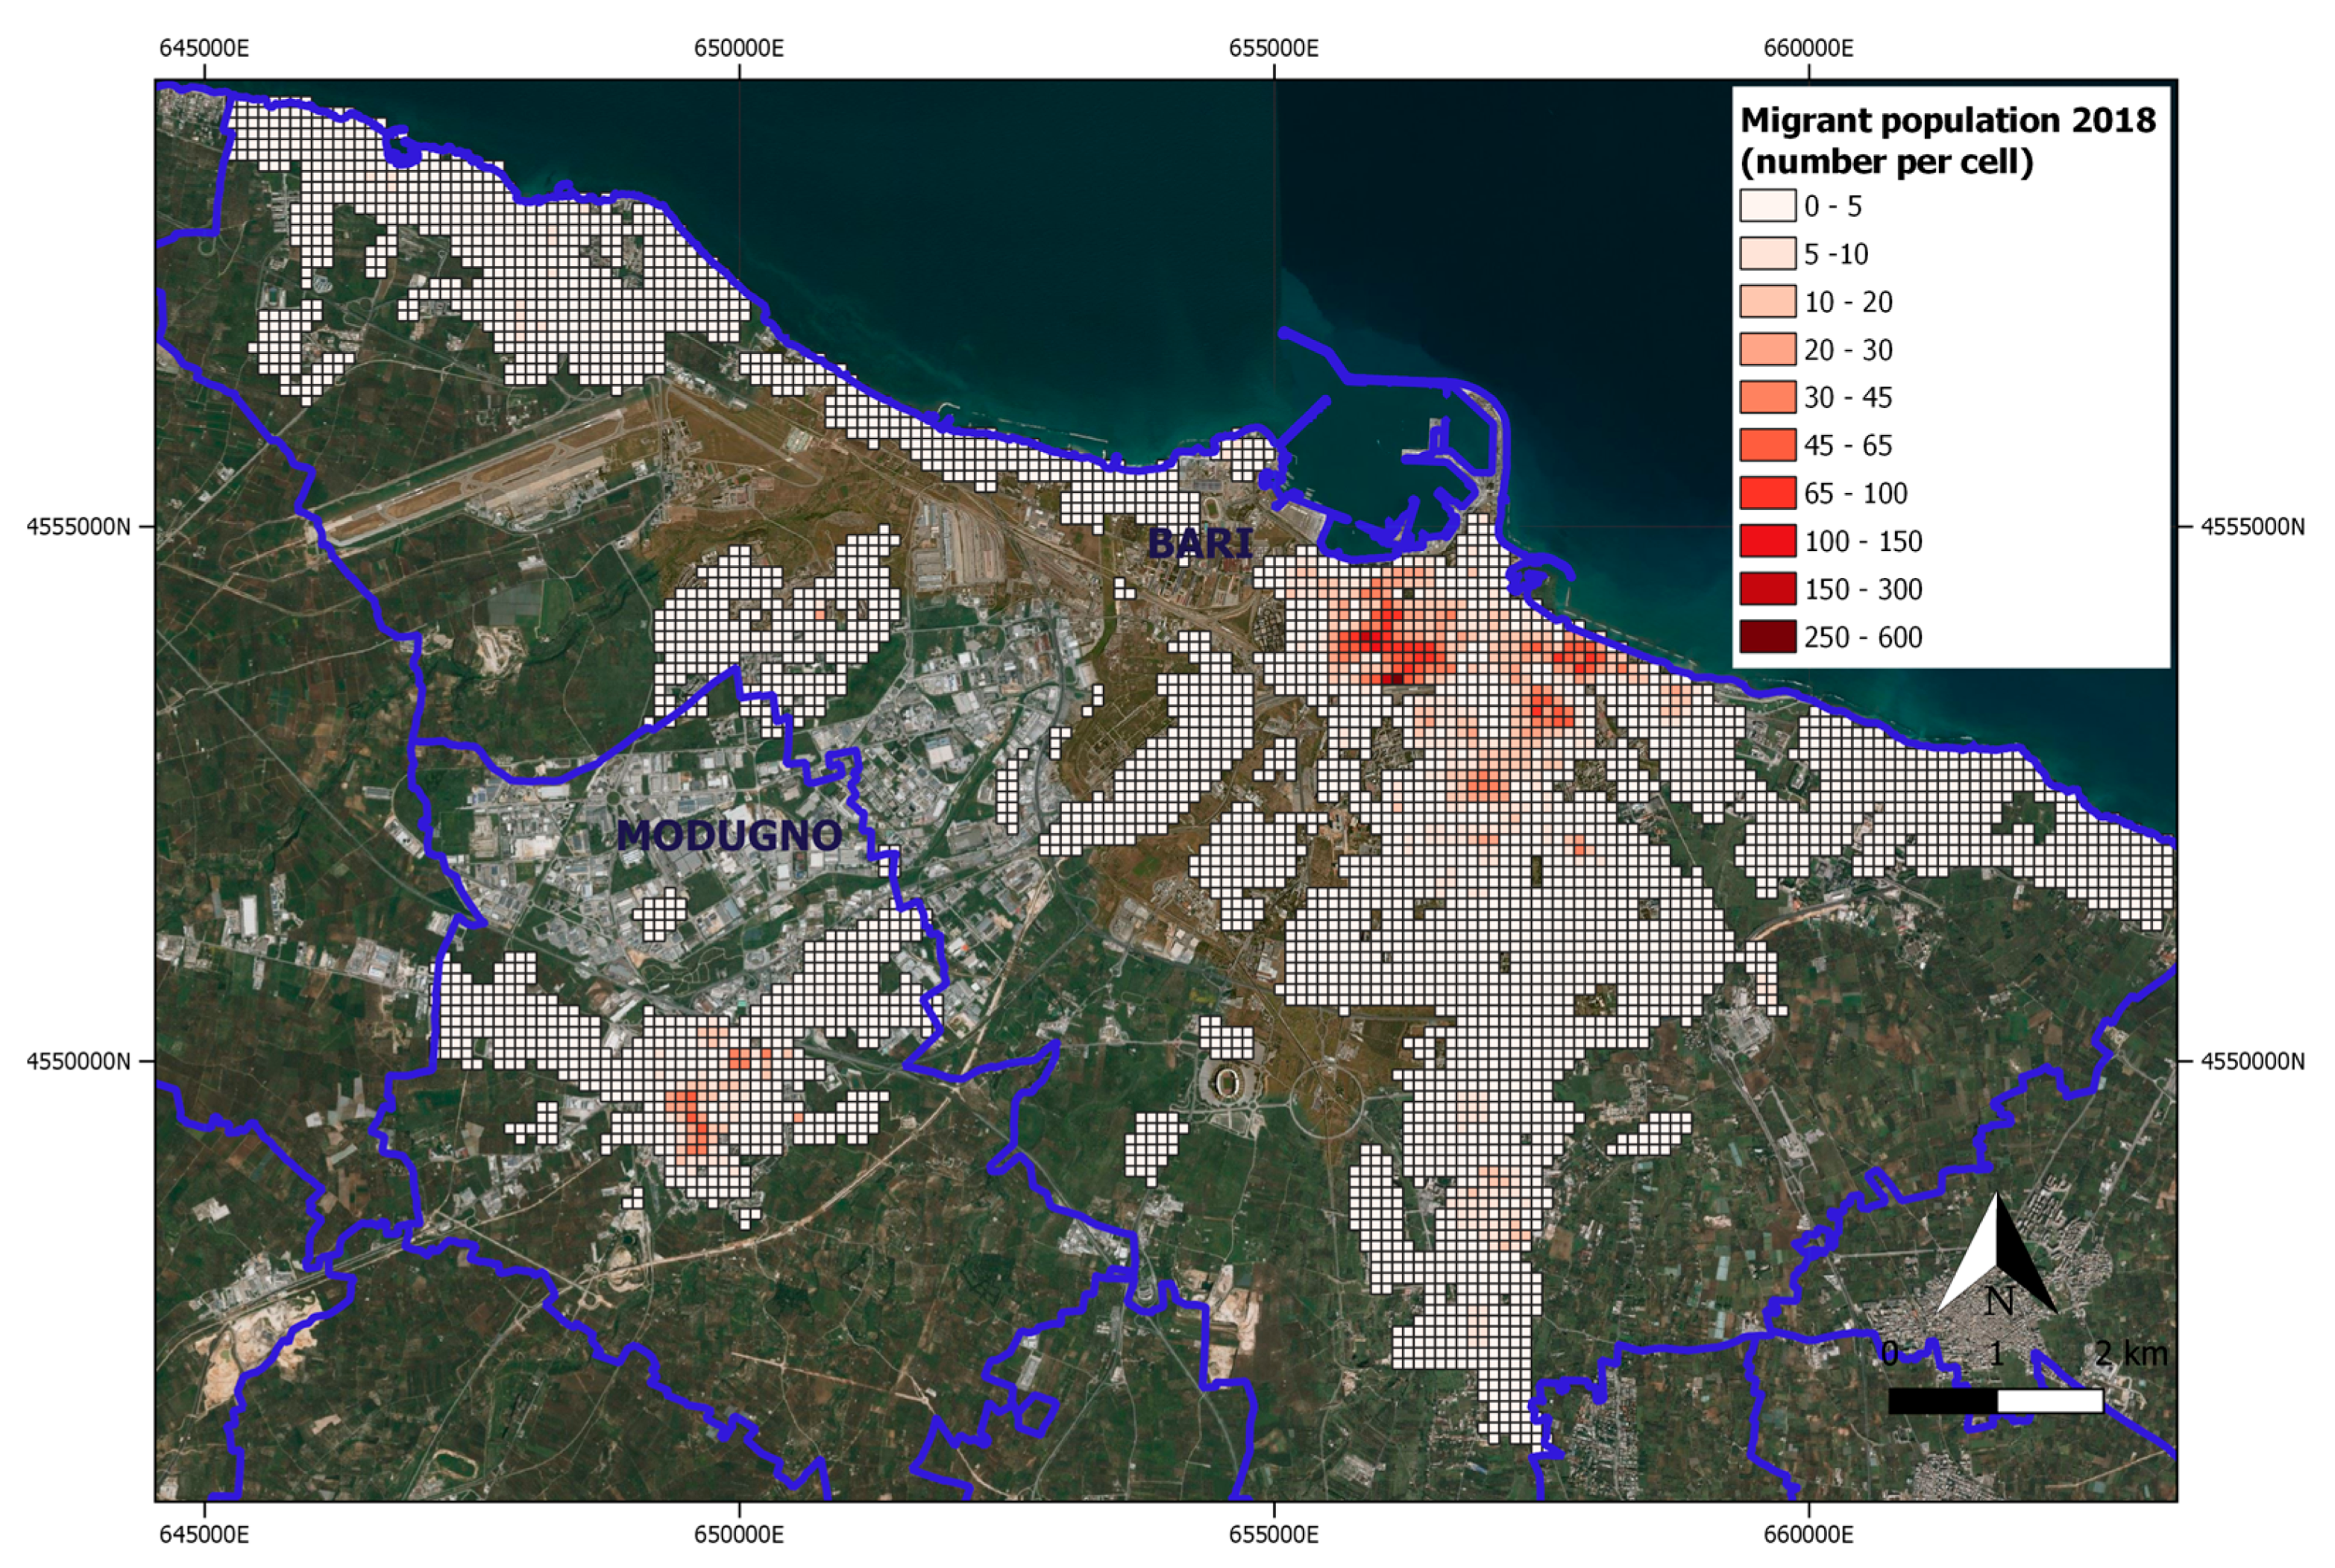
The updated settlement map was used as input for the dasymetric approach along with census data (Section 2.6). The output spatial distribution of resident migrants population obtained for 2018 is shown in Figure 10.
The MAE and TAE values obtained were 0.03 and 40.81, respectively. The latter value is referred to a total population of 14,470 migrants in both Bari and Modugno, and reports a small difference compared to the reference total migrant population.
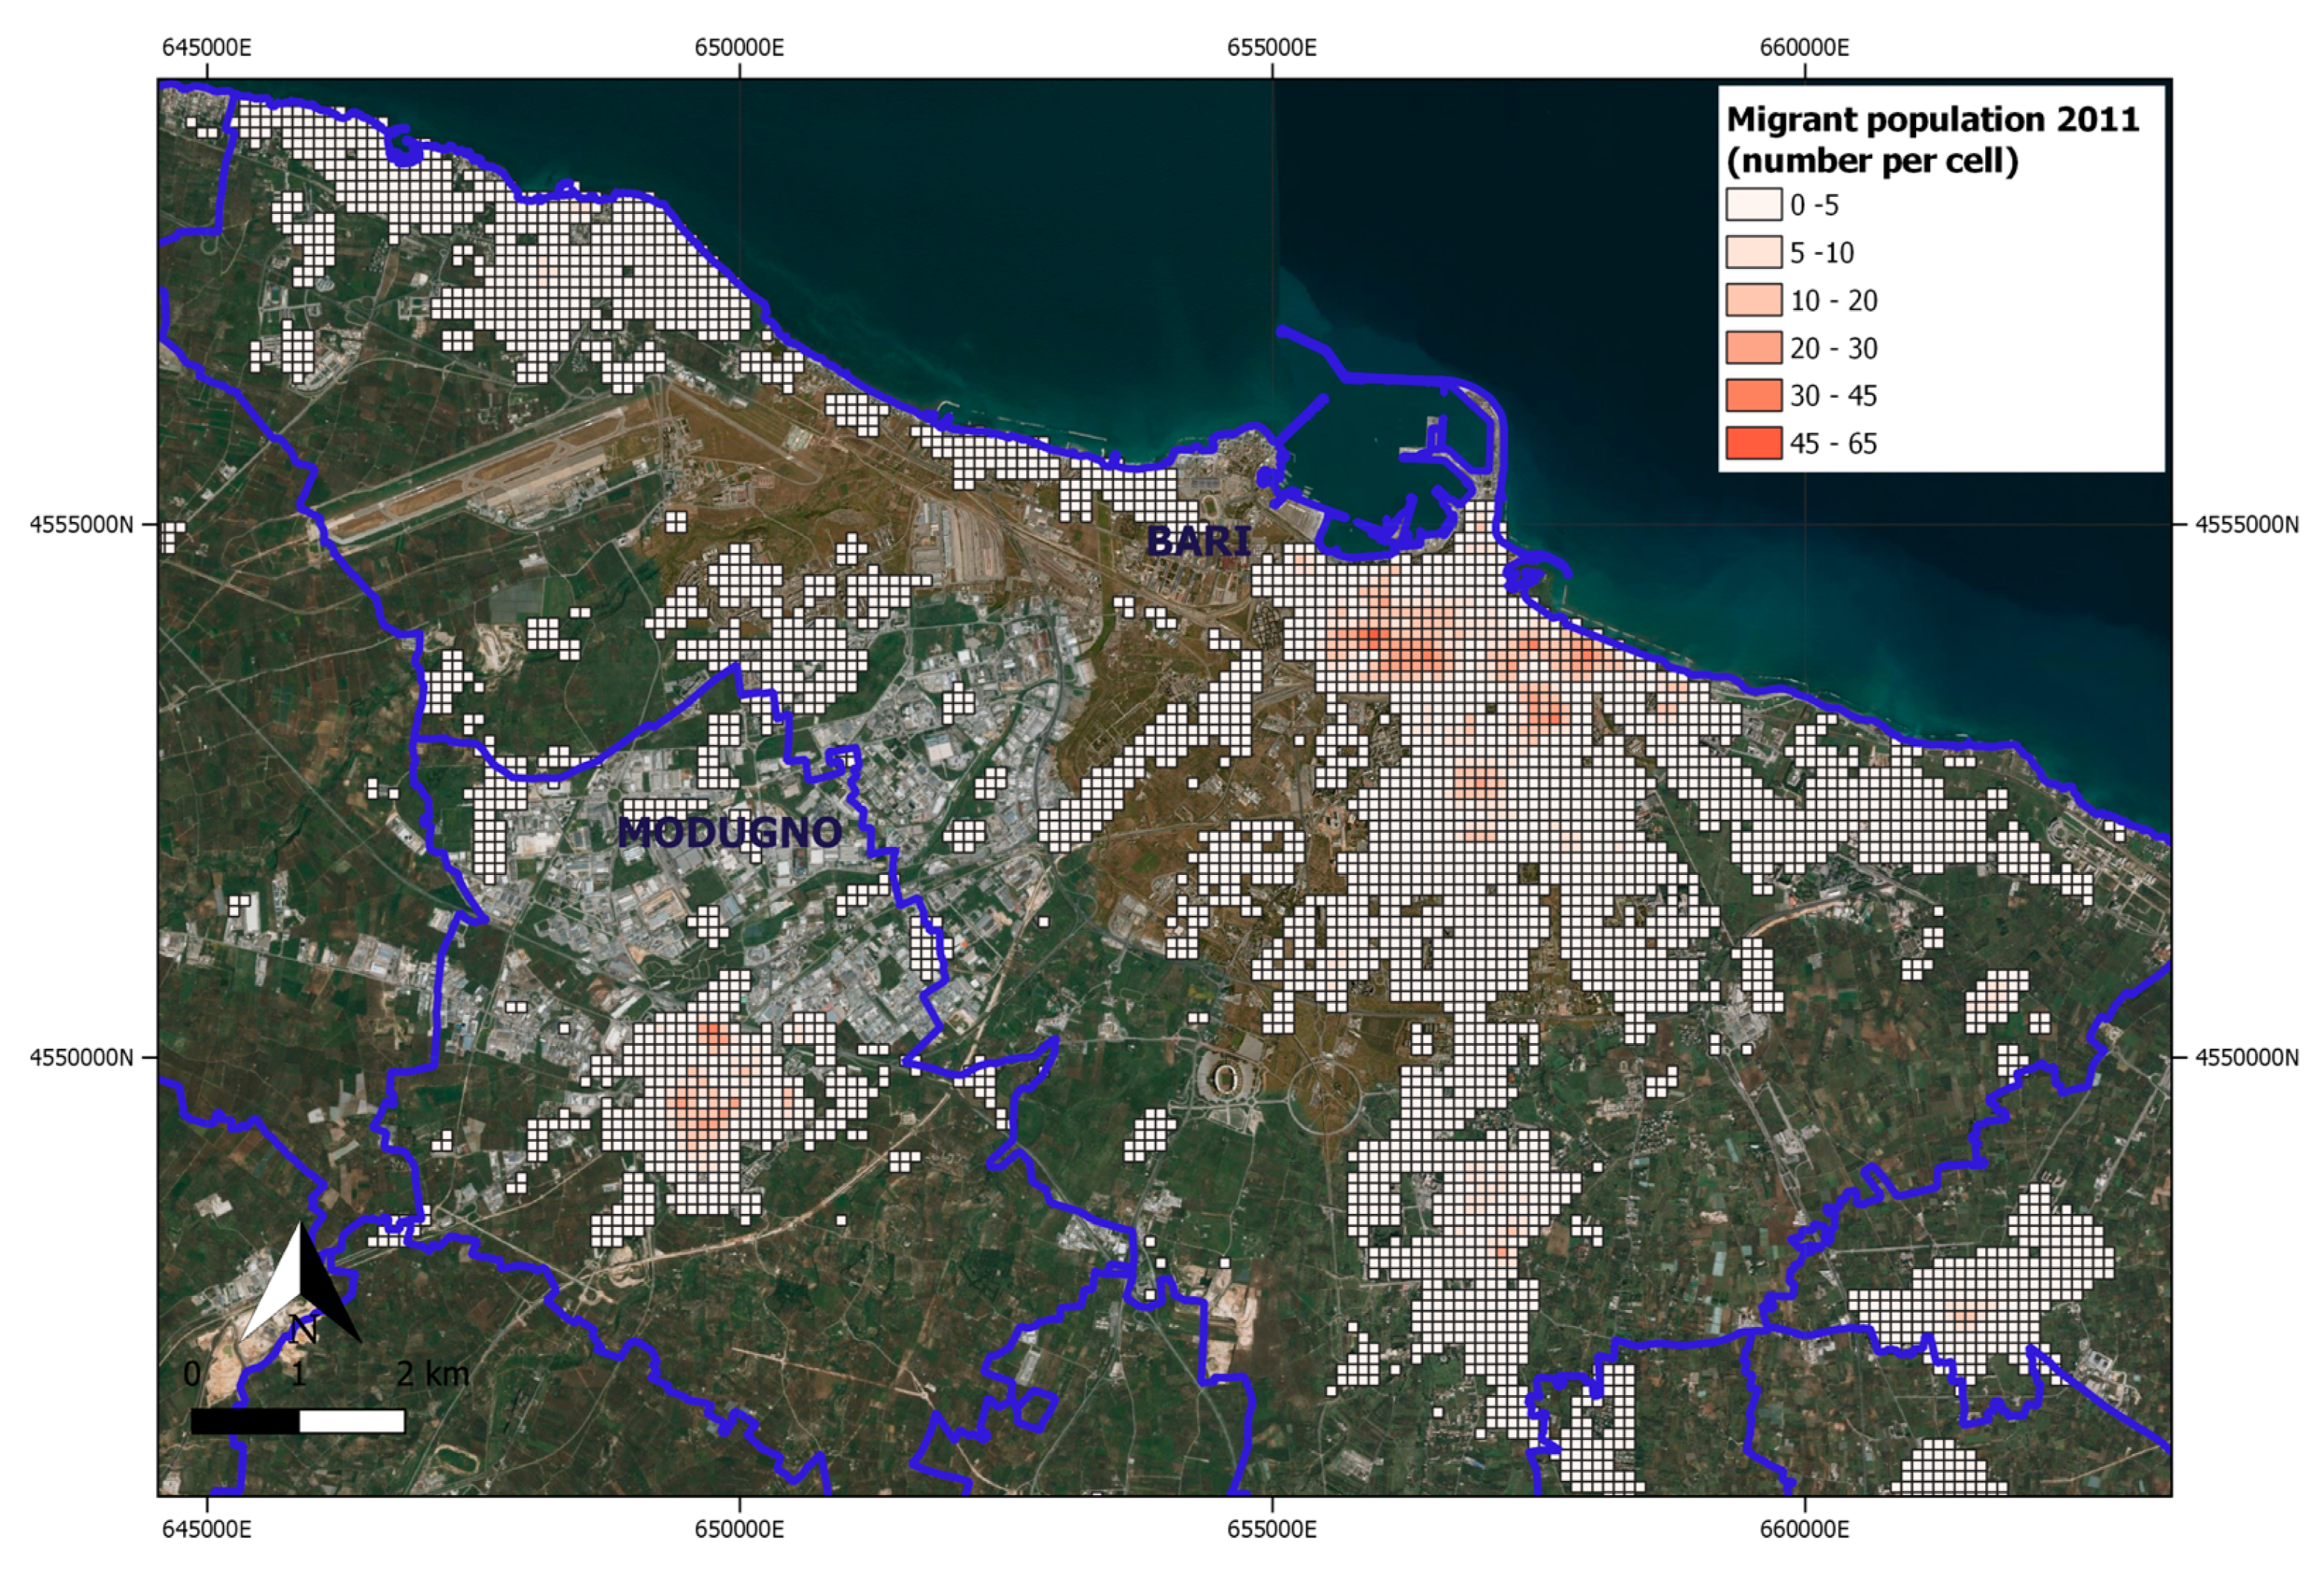
When comparing the 2011 (Figure 11) and 2018 maps, a total increase of 44.5% was found in the regular migrant population. This value is in agreement with the national ISTAT value (44.2%) provided for the period 2010–2018 [22]. The 2018 map obtained shows the spatial distribution of such a population increase in the different zones of the two urban areas (Figure 10).
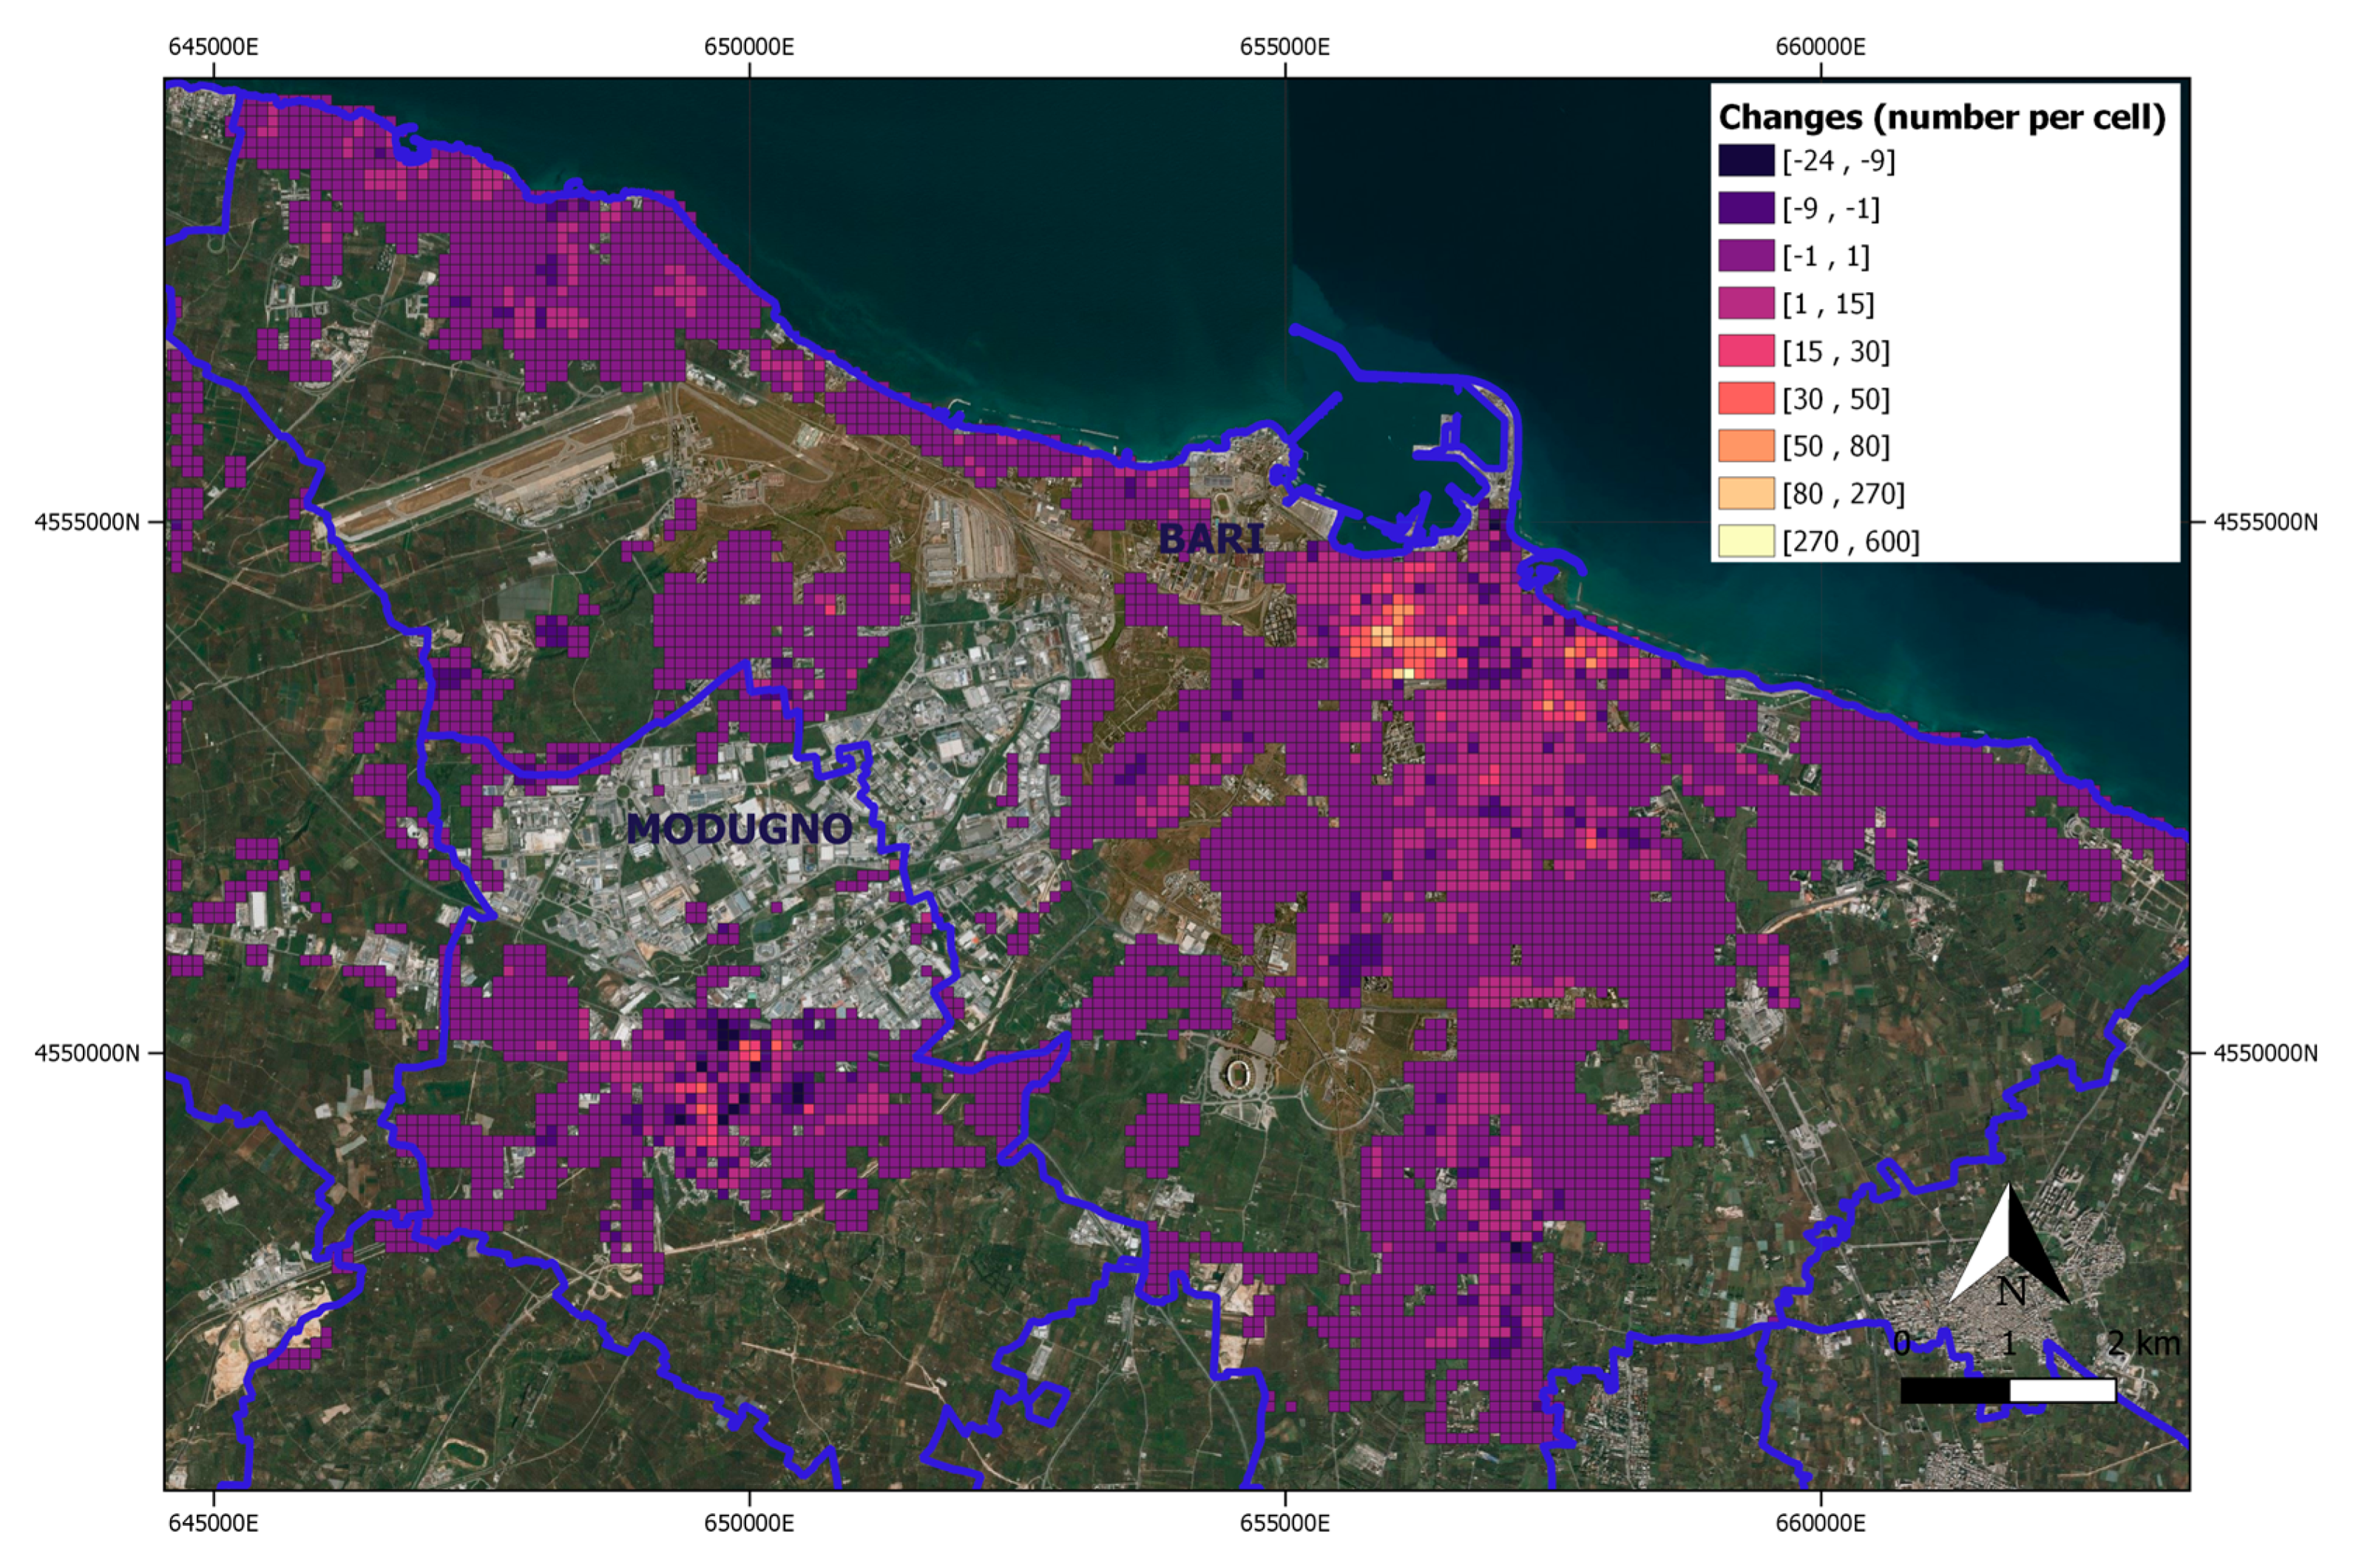
The changes between 2011 and 2018, in the spatial distribution of resident migrant population, are shown in Figure 12.
Figure 12 reveals a tendency for resident migrant population to concentrate in the central area of both the Bari and Modugno study sites. However, these areas are characterized by historical districts with marked conditions of urban and building degradation, but quite close to the main transport infrastructures, i.e., central train station. Negative-change values evidence population fluxes from some areas of the city to other areas. These fluxes may be due to an economic factor, such as changes in the cost of apartments as well as to new religious facilities developed after 2011, such as a new mosque.

3.3. SDG 11.1.1. and SDG 11.3.1 Evaluation

The settlement map and the population spatial distribution map of regular migrant population updated up to 2018 were used to provide both SDG 11.1.1 and SDG 11.3.1 indicators.
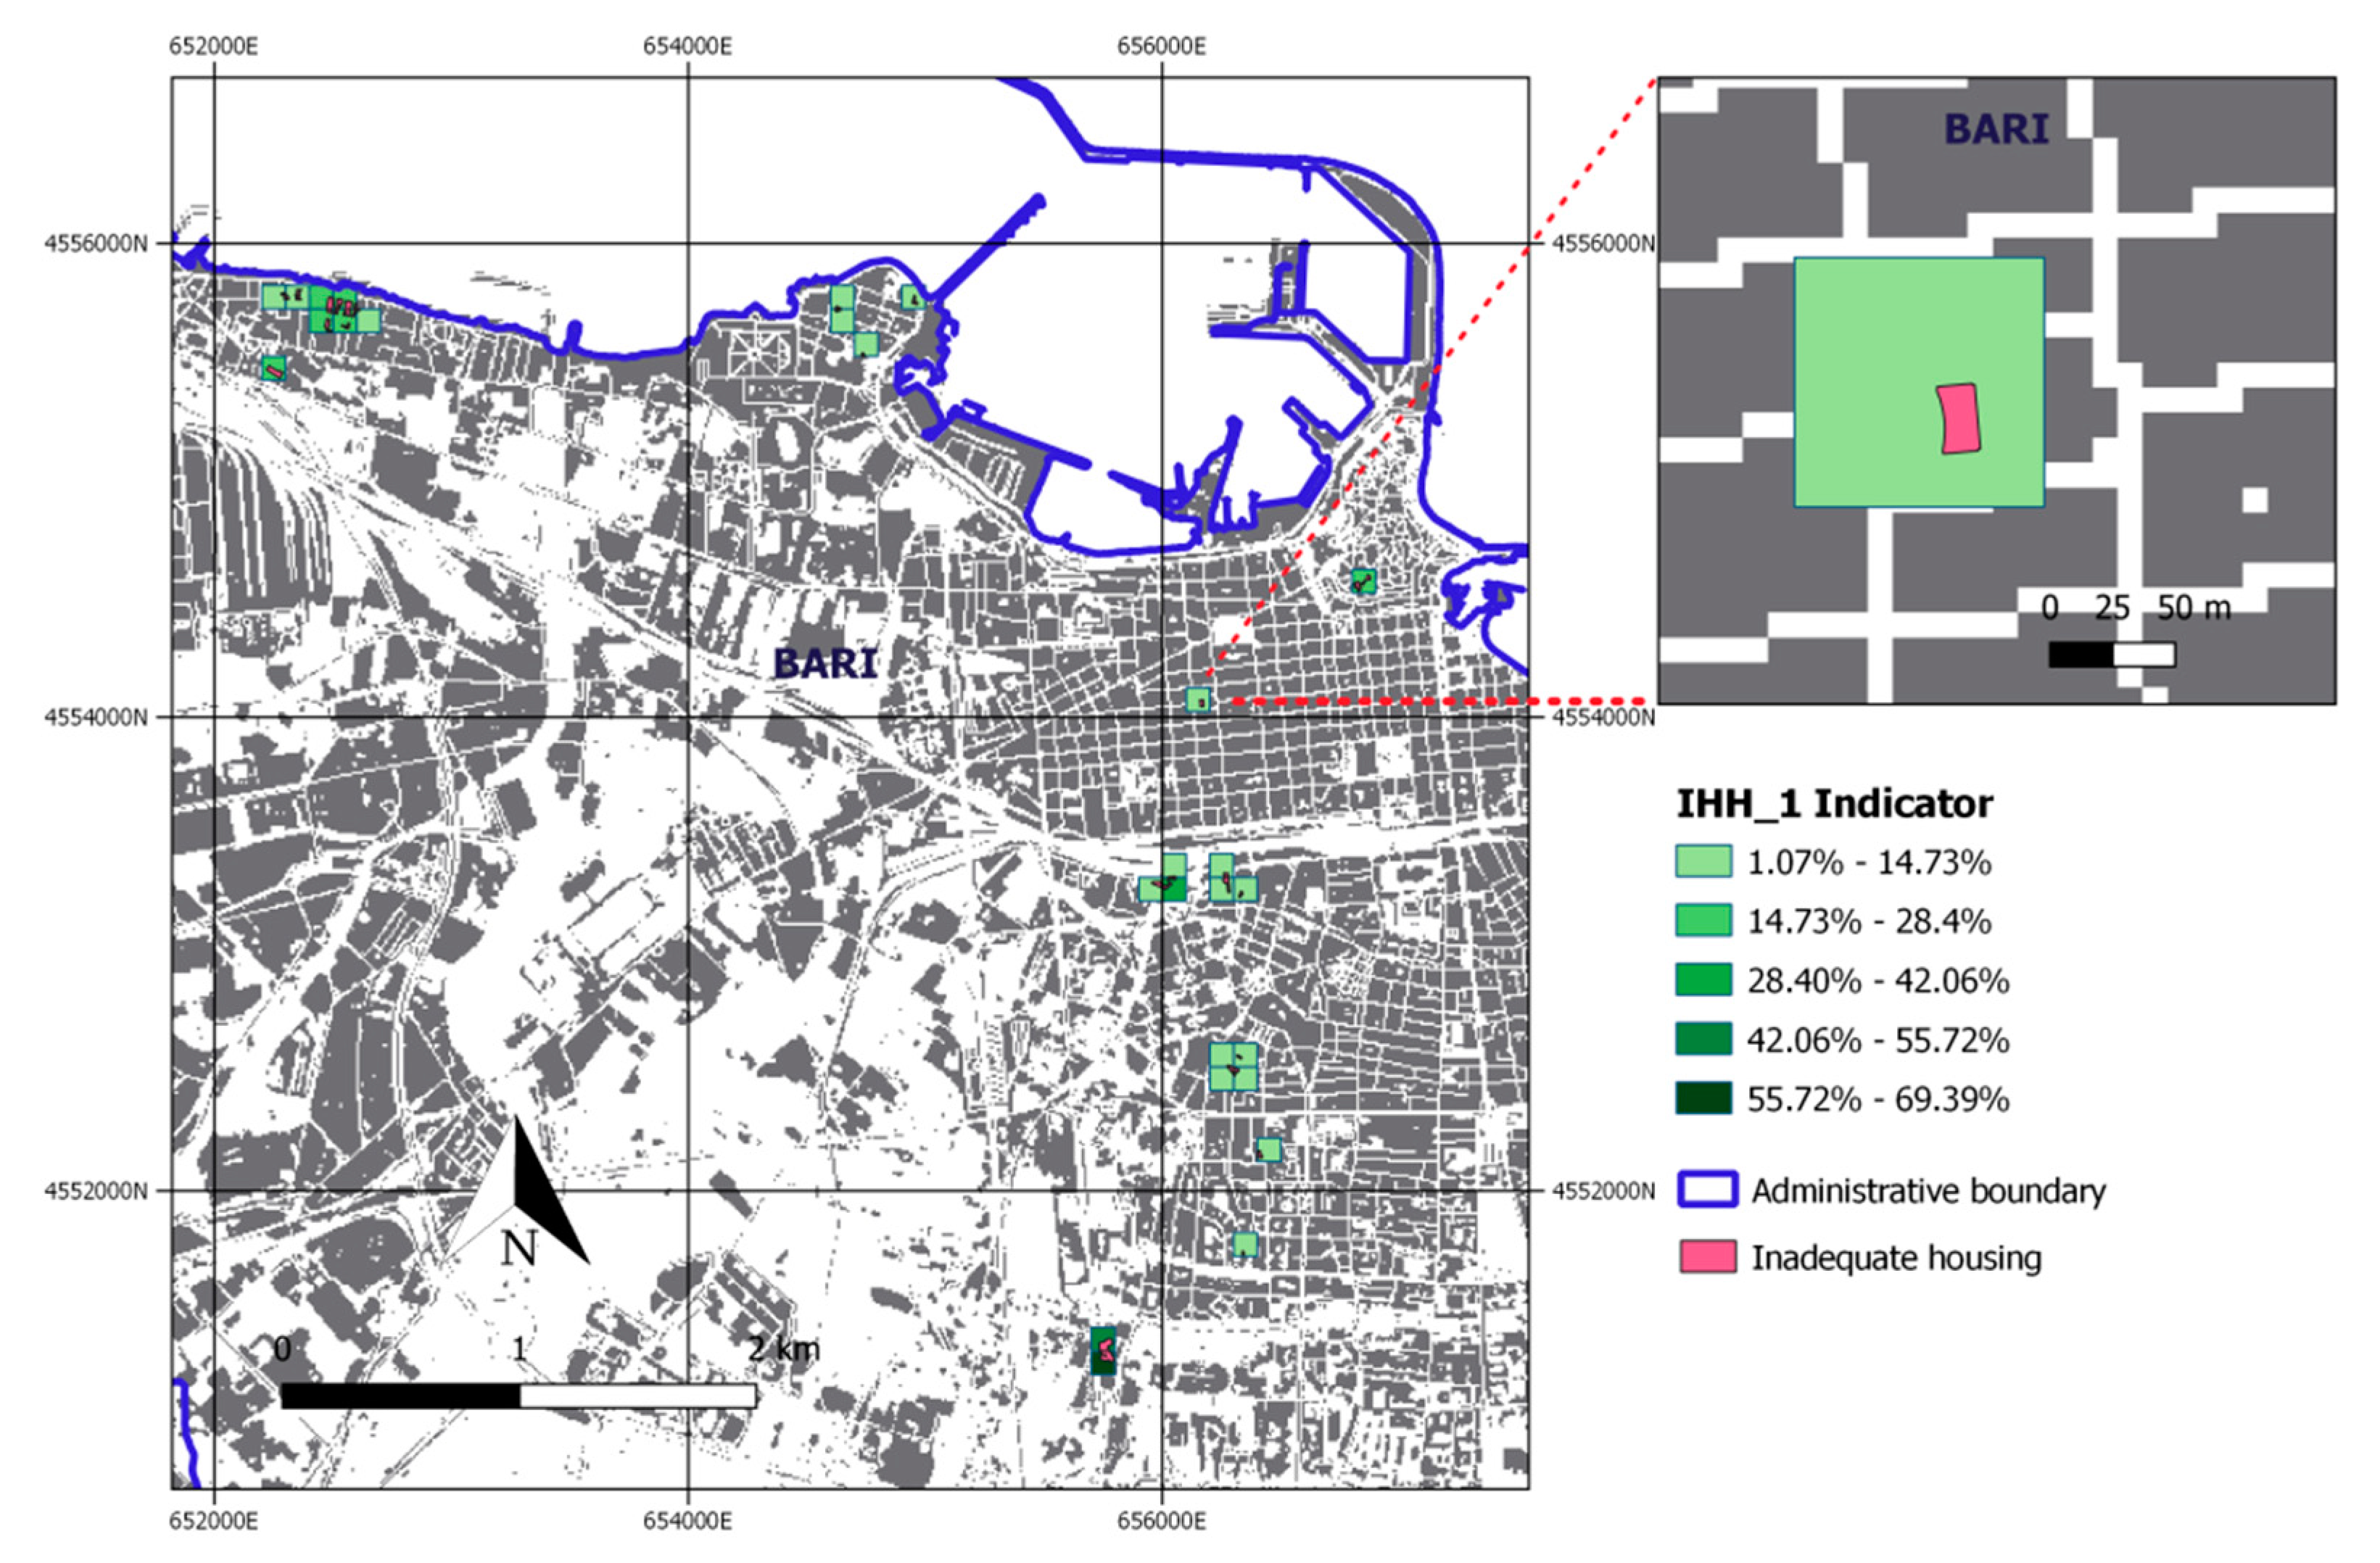
Specifically, for SDG 11.1.1, the output inadequate housing households indicator, related to inadequate housing for structural quality and durability criteria (IHH_1), is provided in Figure 13.
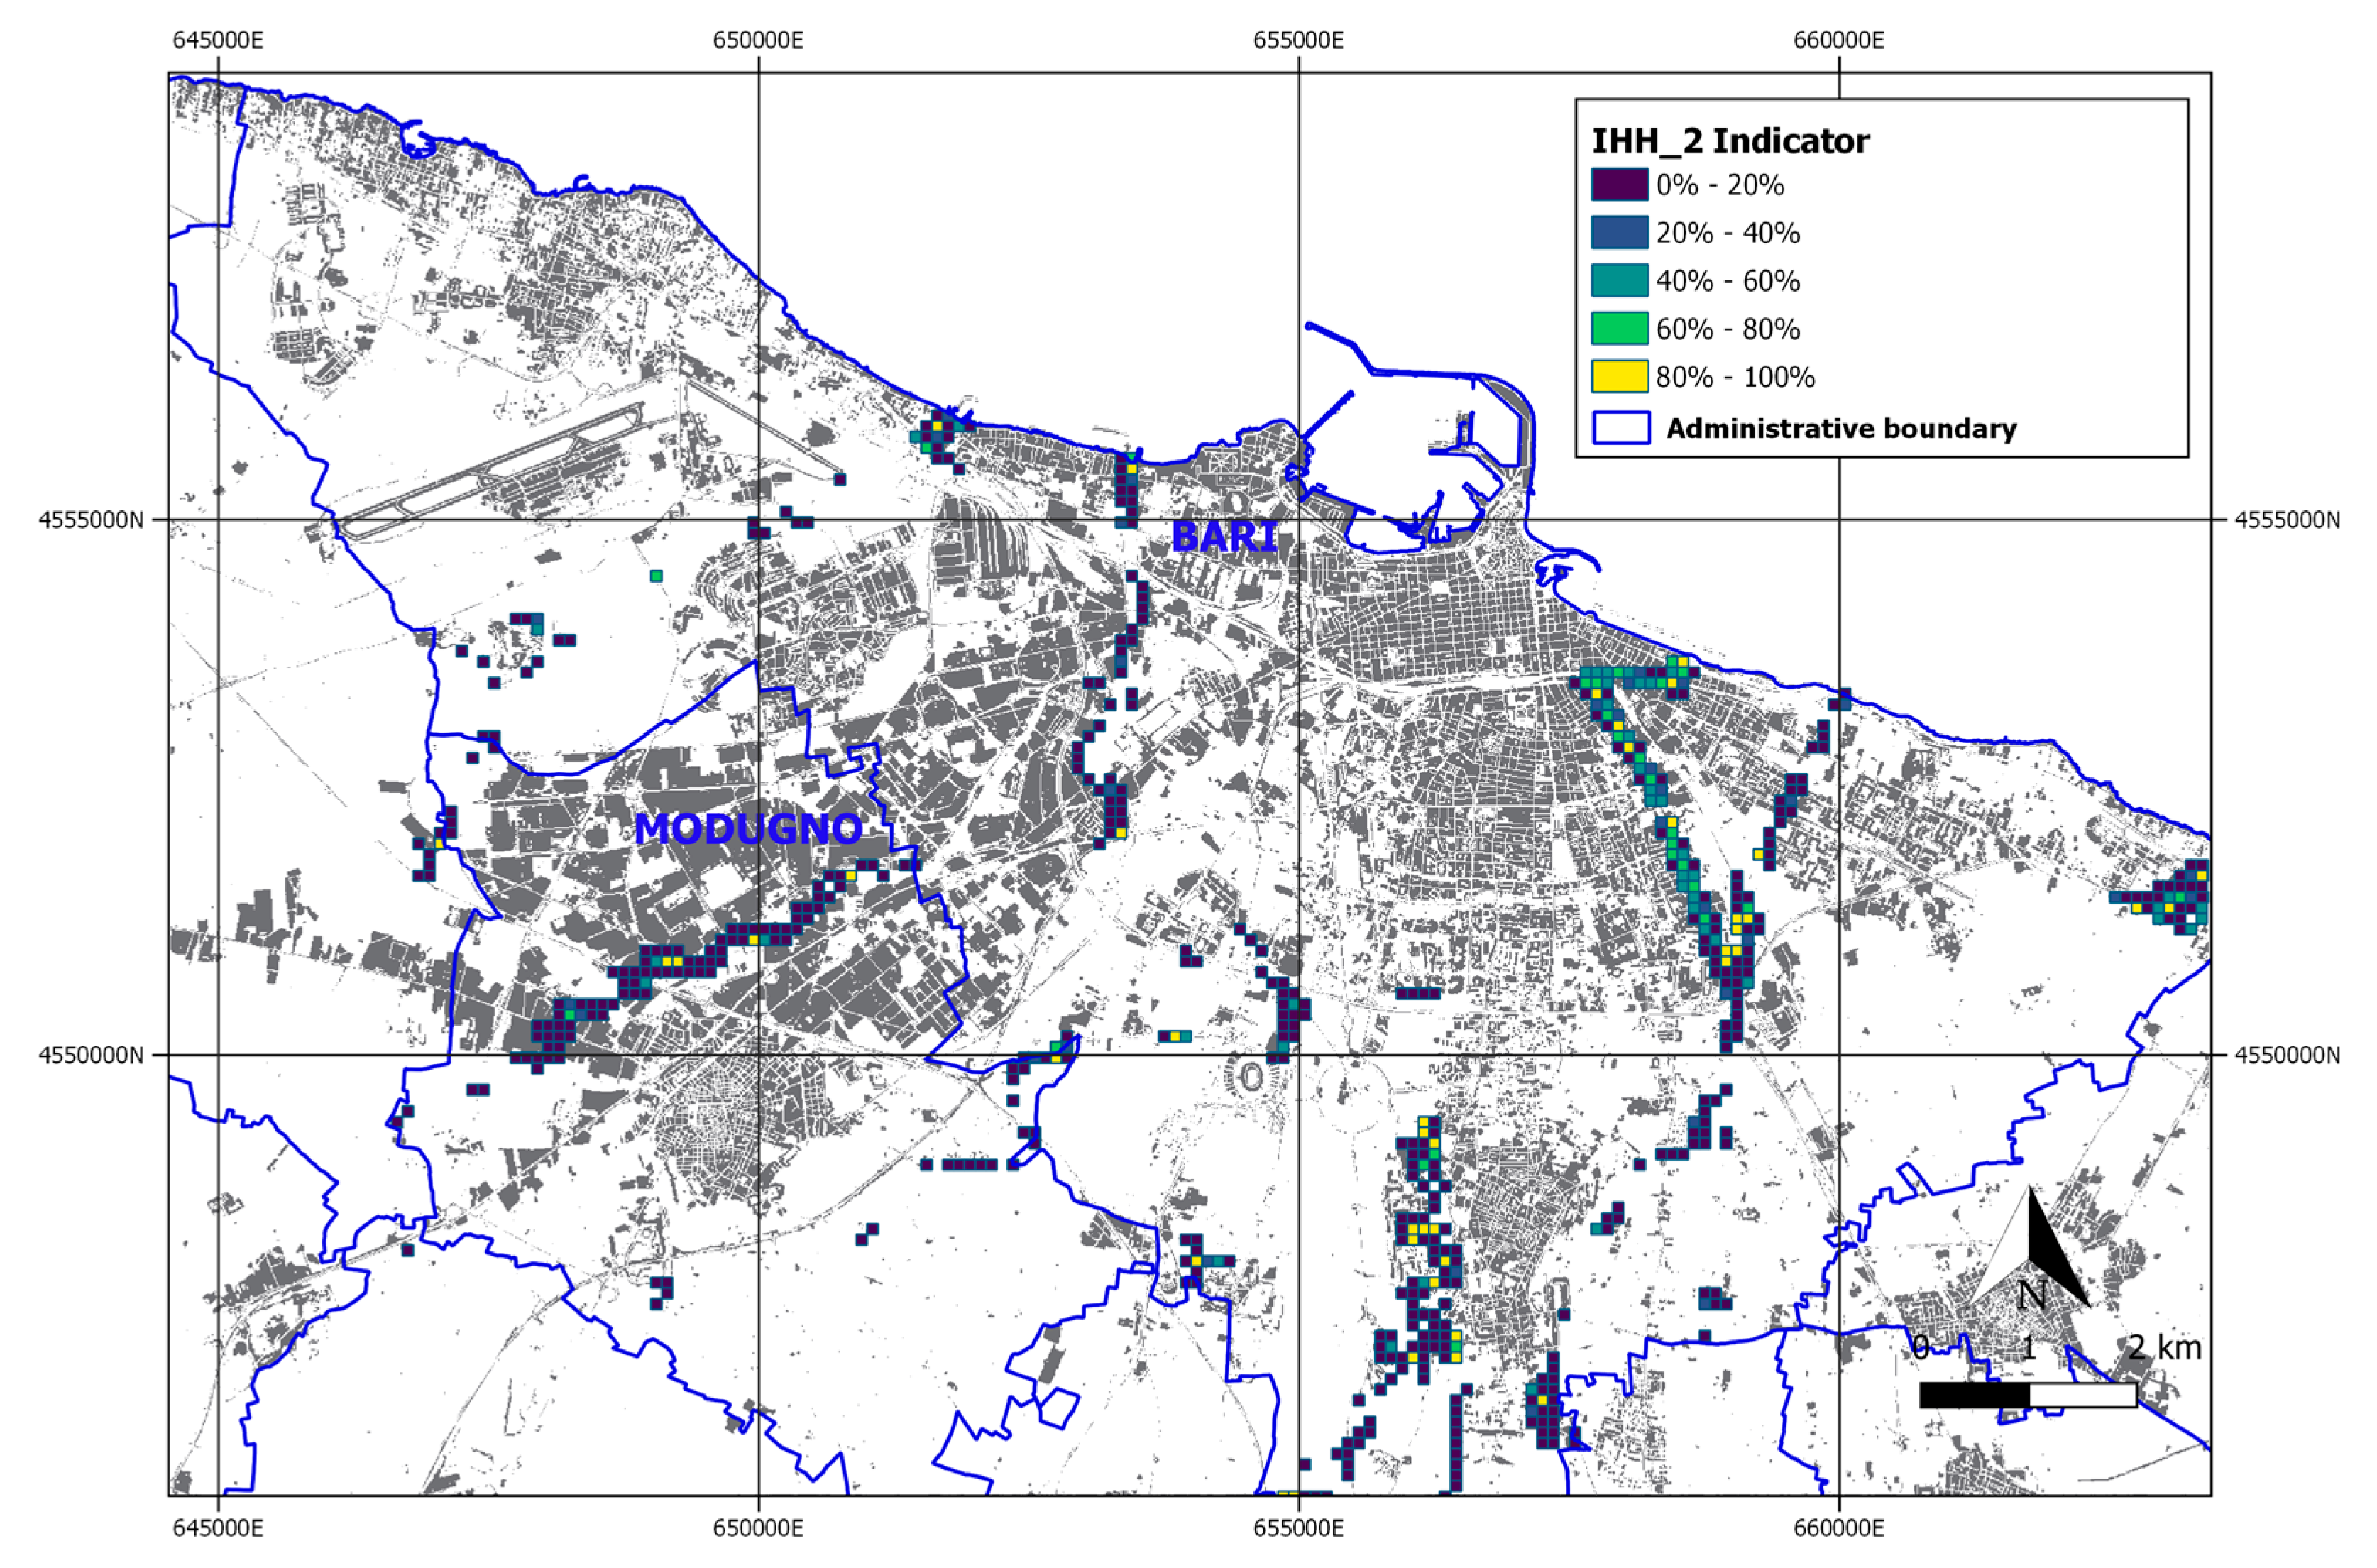
The same indicator related to housing in areas exposed to geologically hazardous zones (IHH_2) is shown in Figure 14. The latter was obtained after intersecting the flood hazard data with the regular migrant population distribution obtained in the previous section.
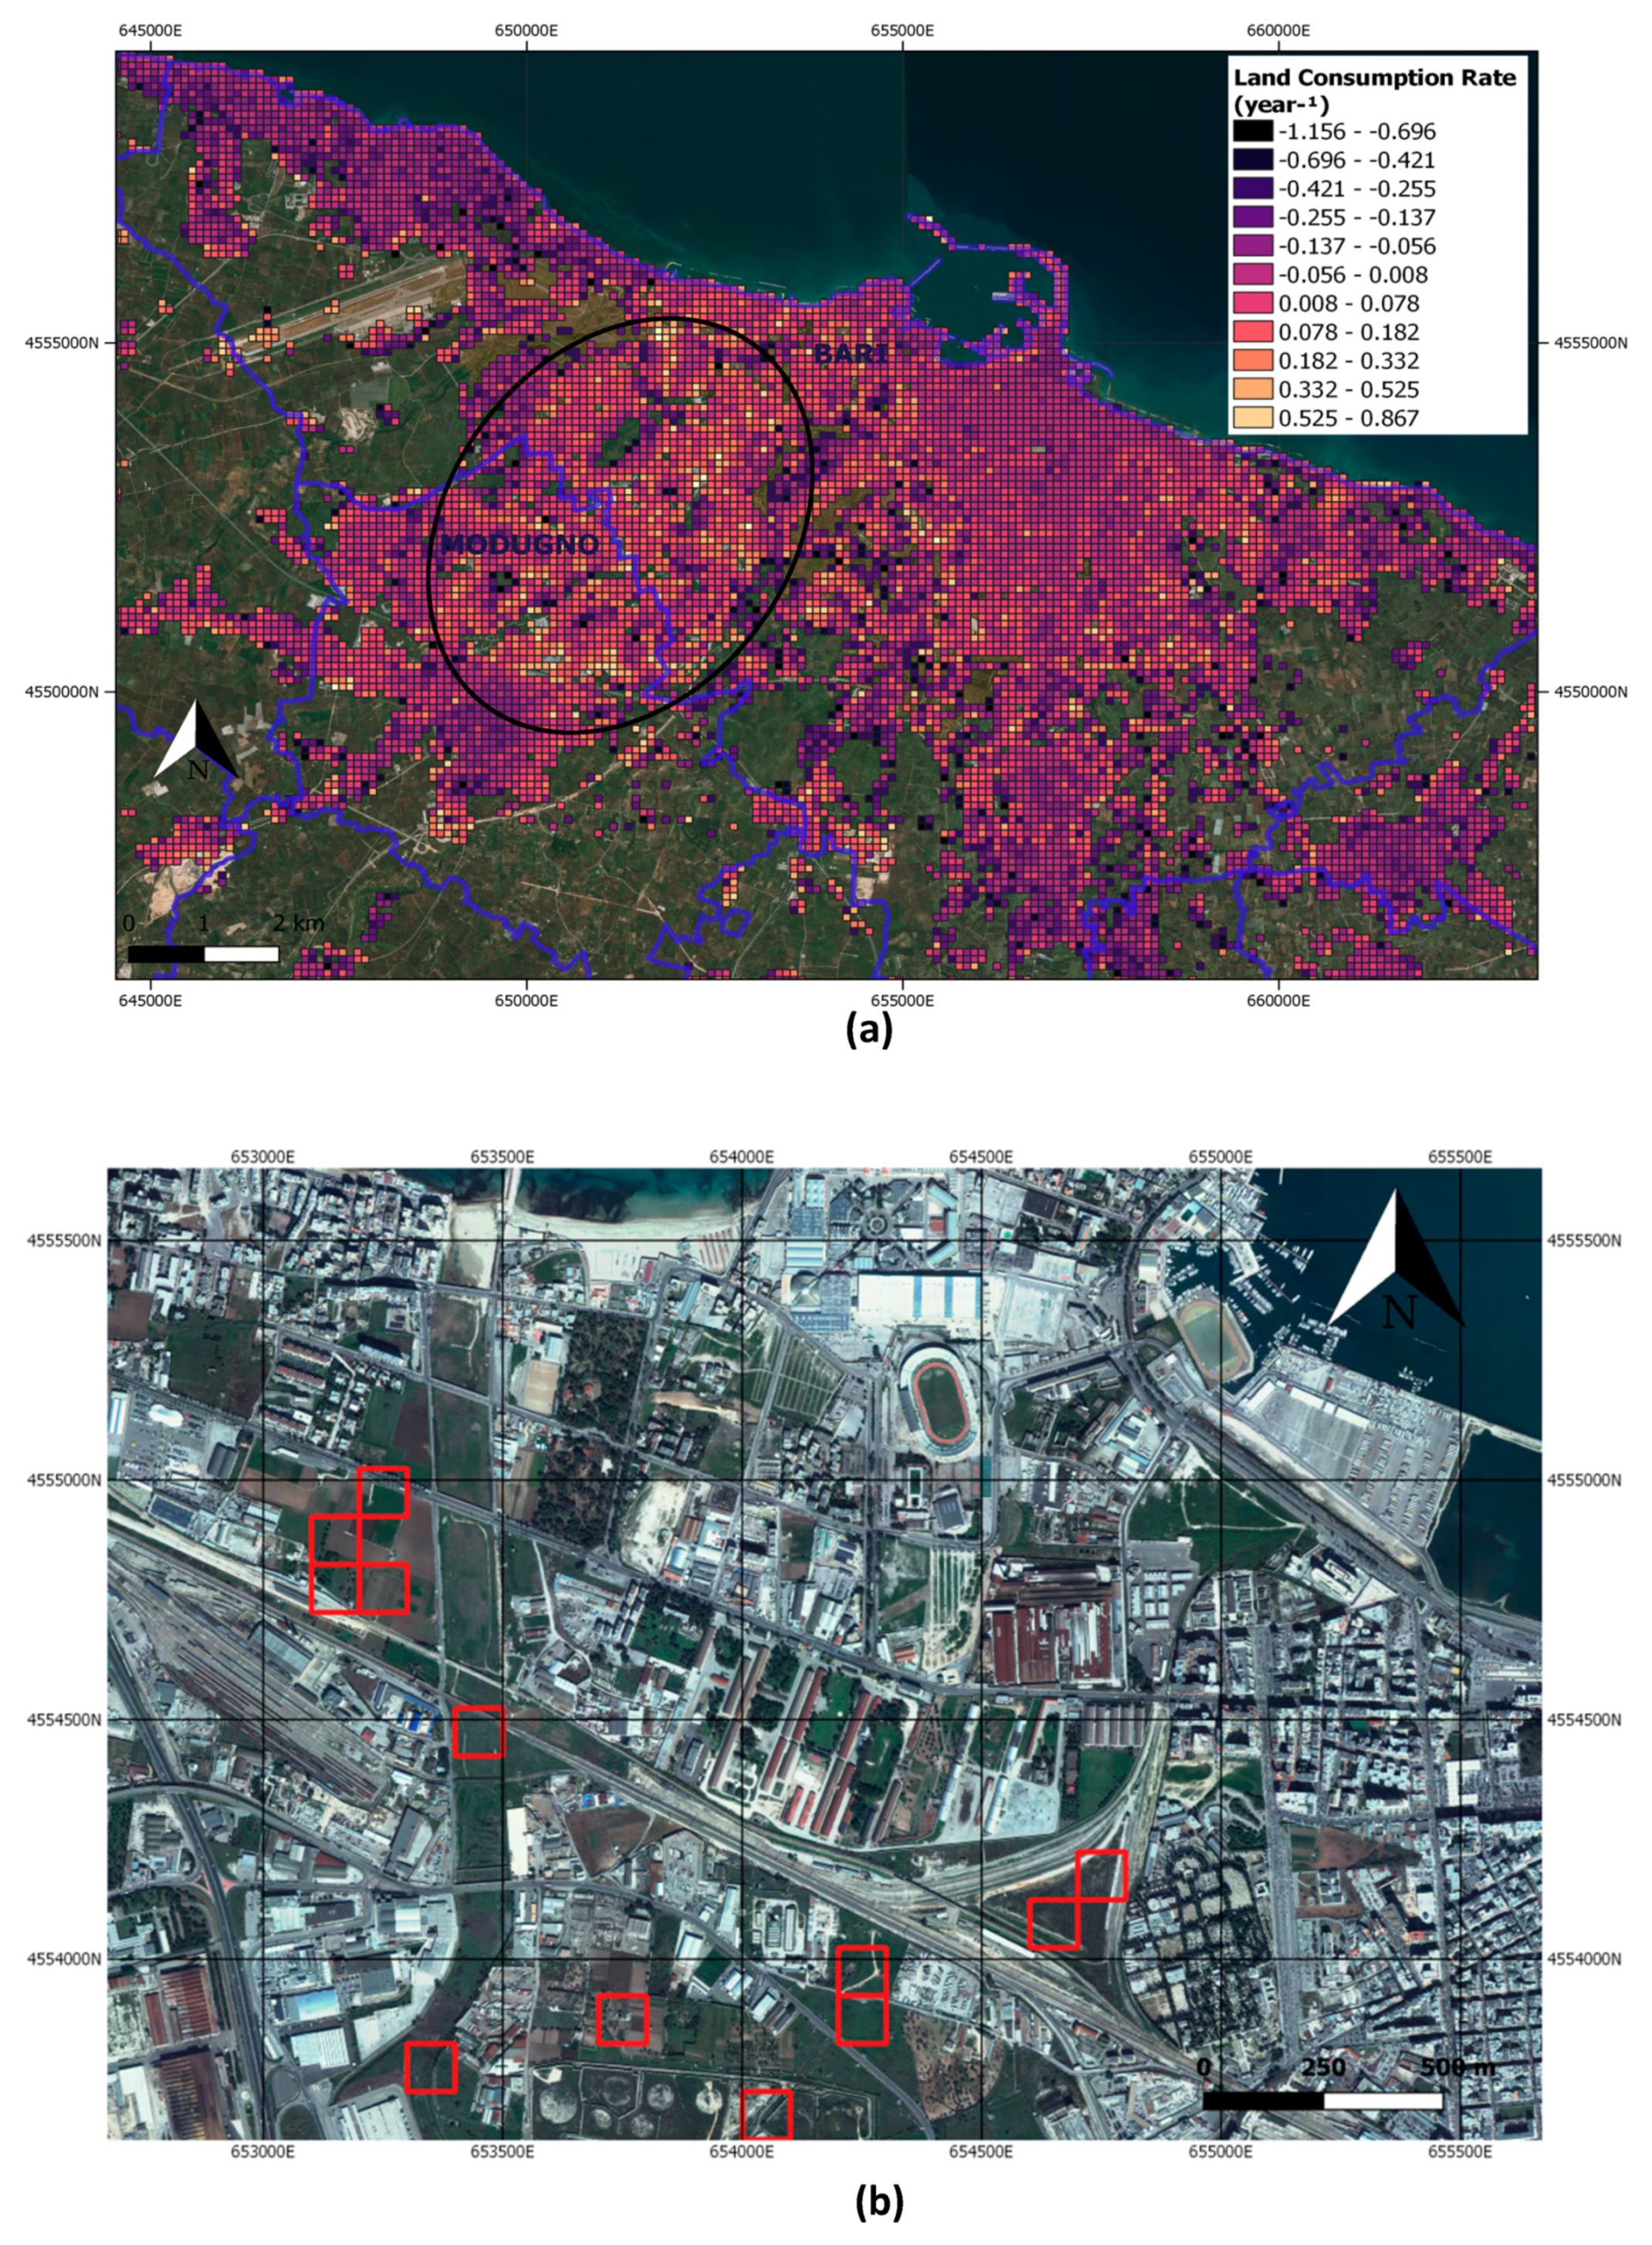
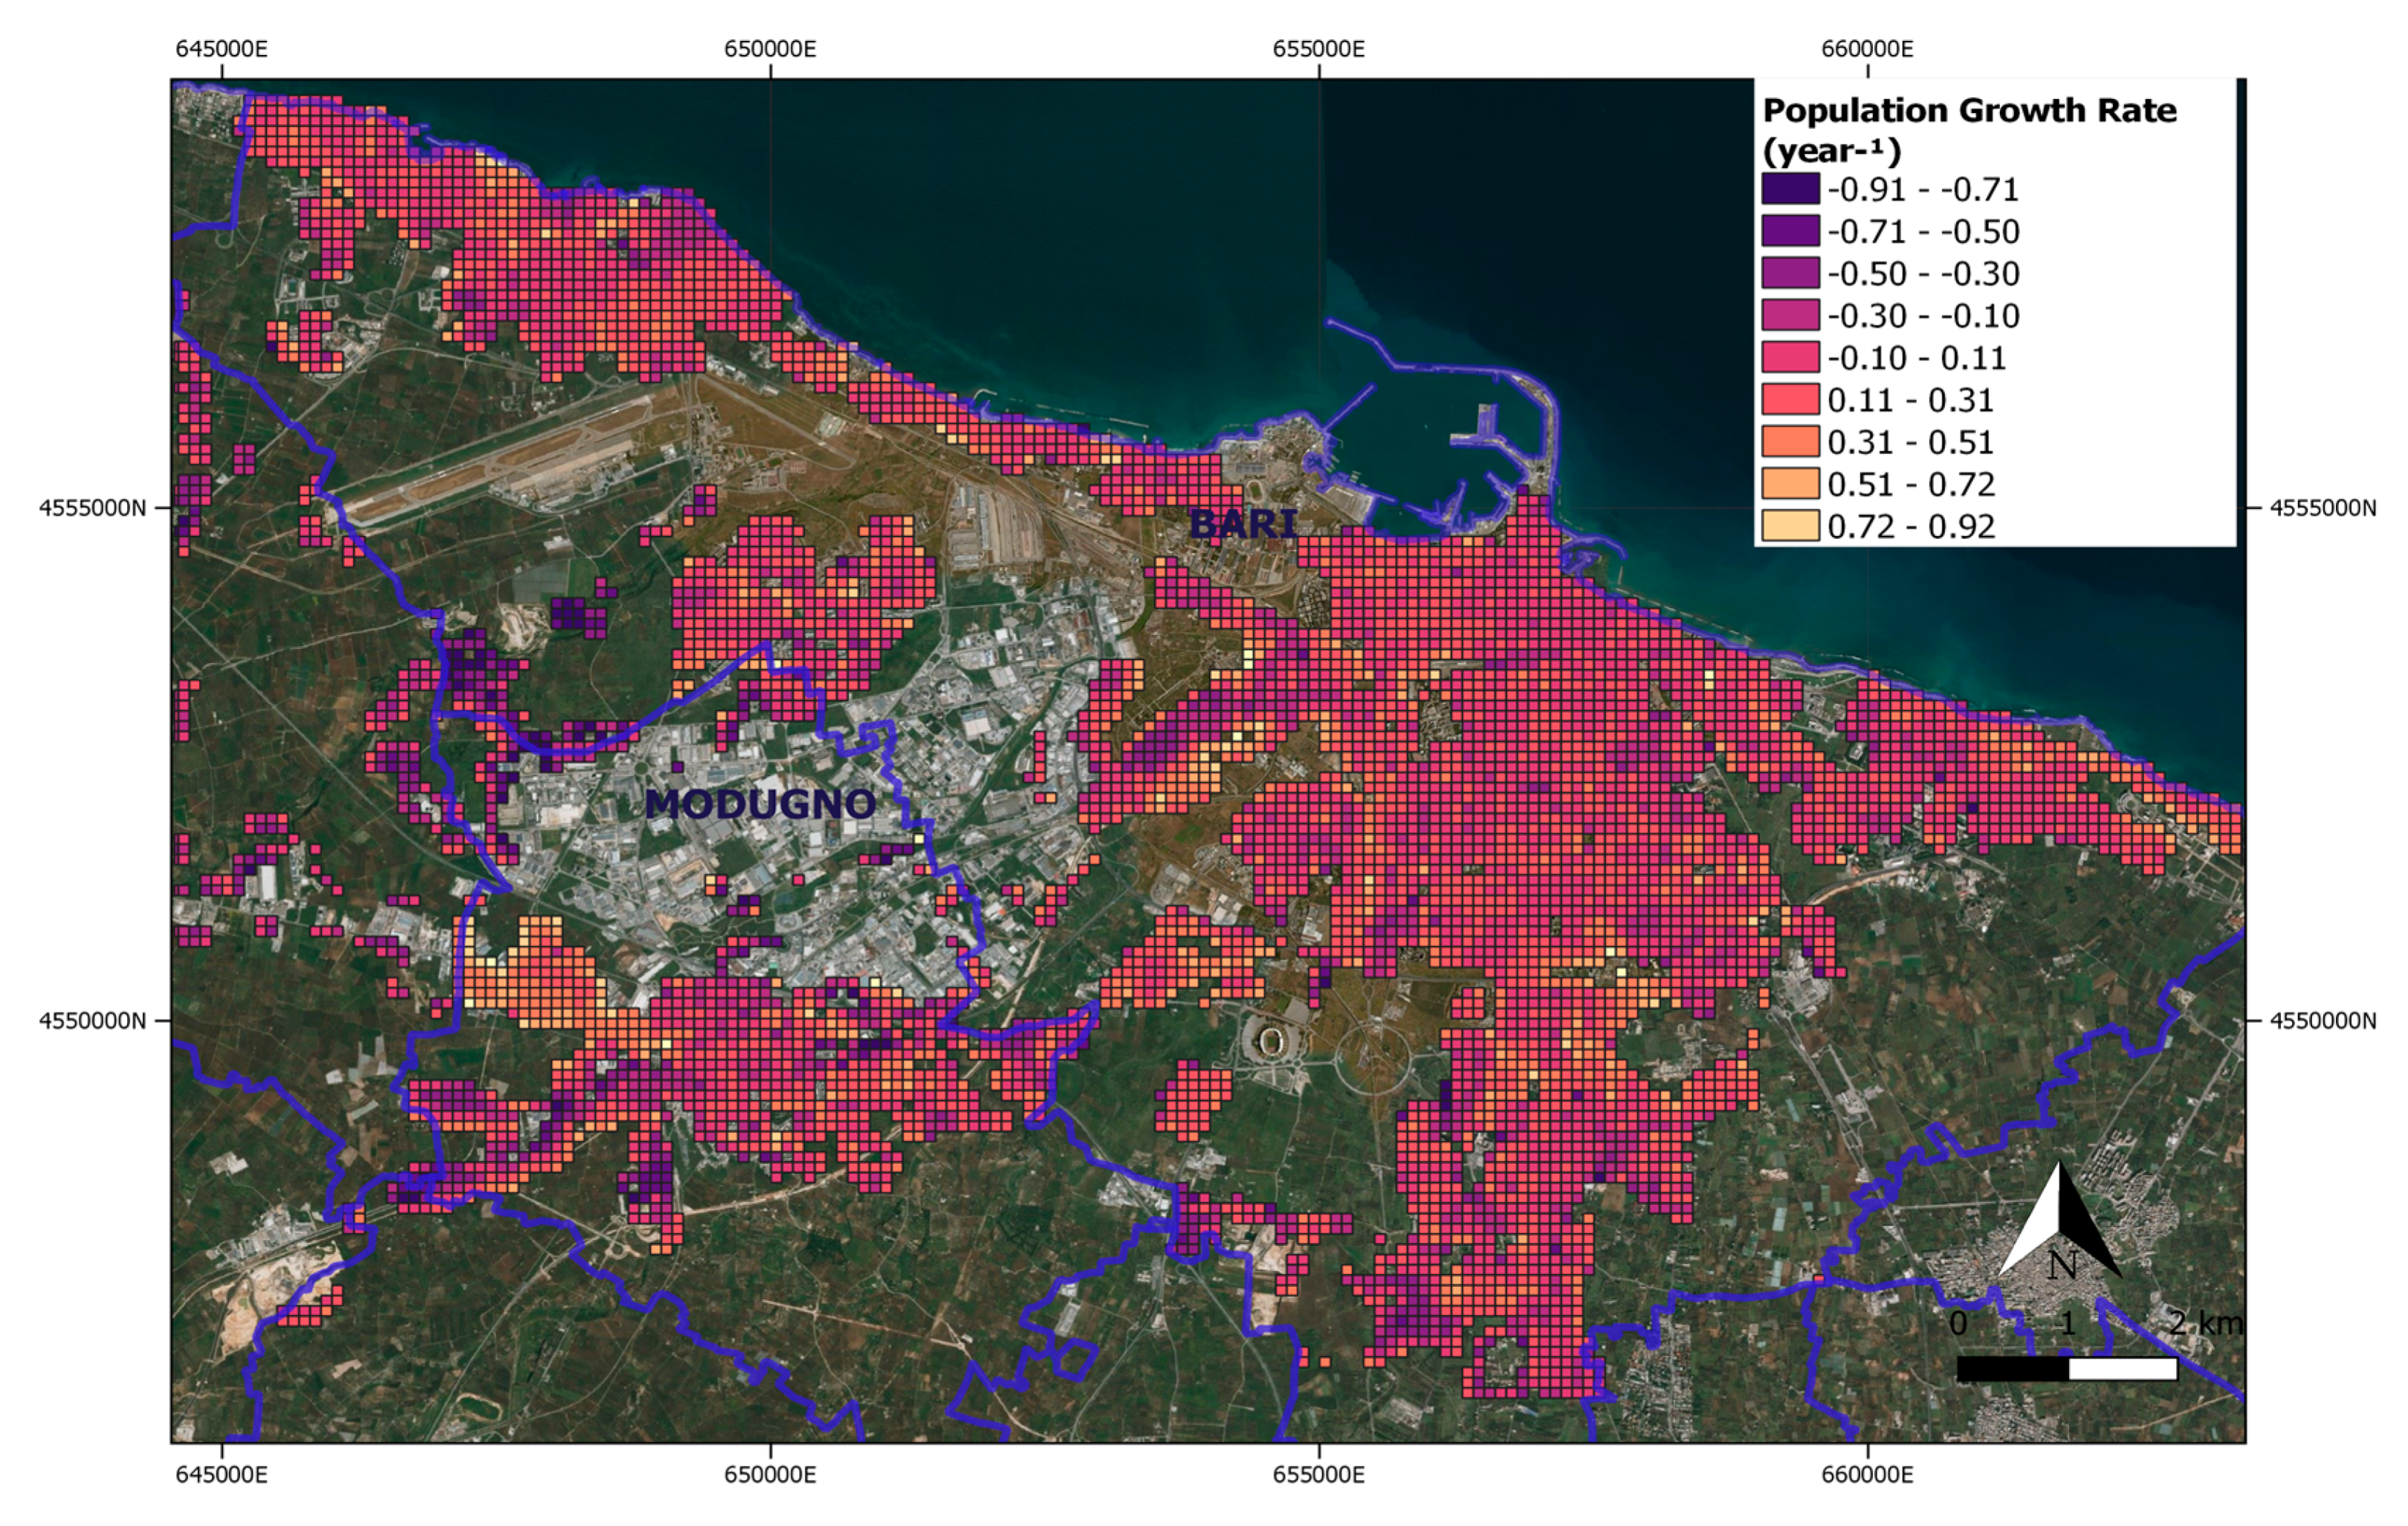
For SDG 11.3.1, Figure 15 and Figure 16 show the LCR and the PGR components used to evaluate the Ratio of Land Consumption Rate to Population Growth Rate (LCRPGR) map in the period 2011–2018, respectively. The largest land consumption resulted in industrial areas located in the southwest region of the analyzed scene.
Figure 15a shows evidence for the presence of negative changes that may be due to errors in either the initial (2011) or the final (2018) settlement maps. When cells with negative LCR values are superimposed on the orthophoto, errors in the 2011 settlement map were found as nonbuilt areas that were erroneously labeled as buildings (Figure 15b).
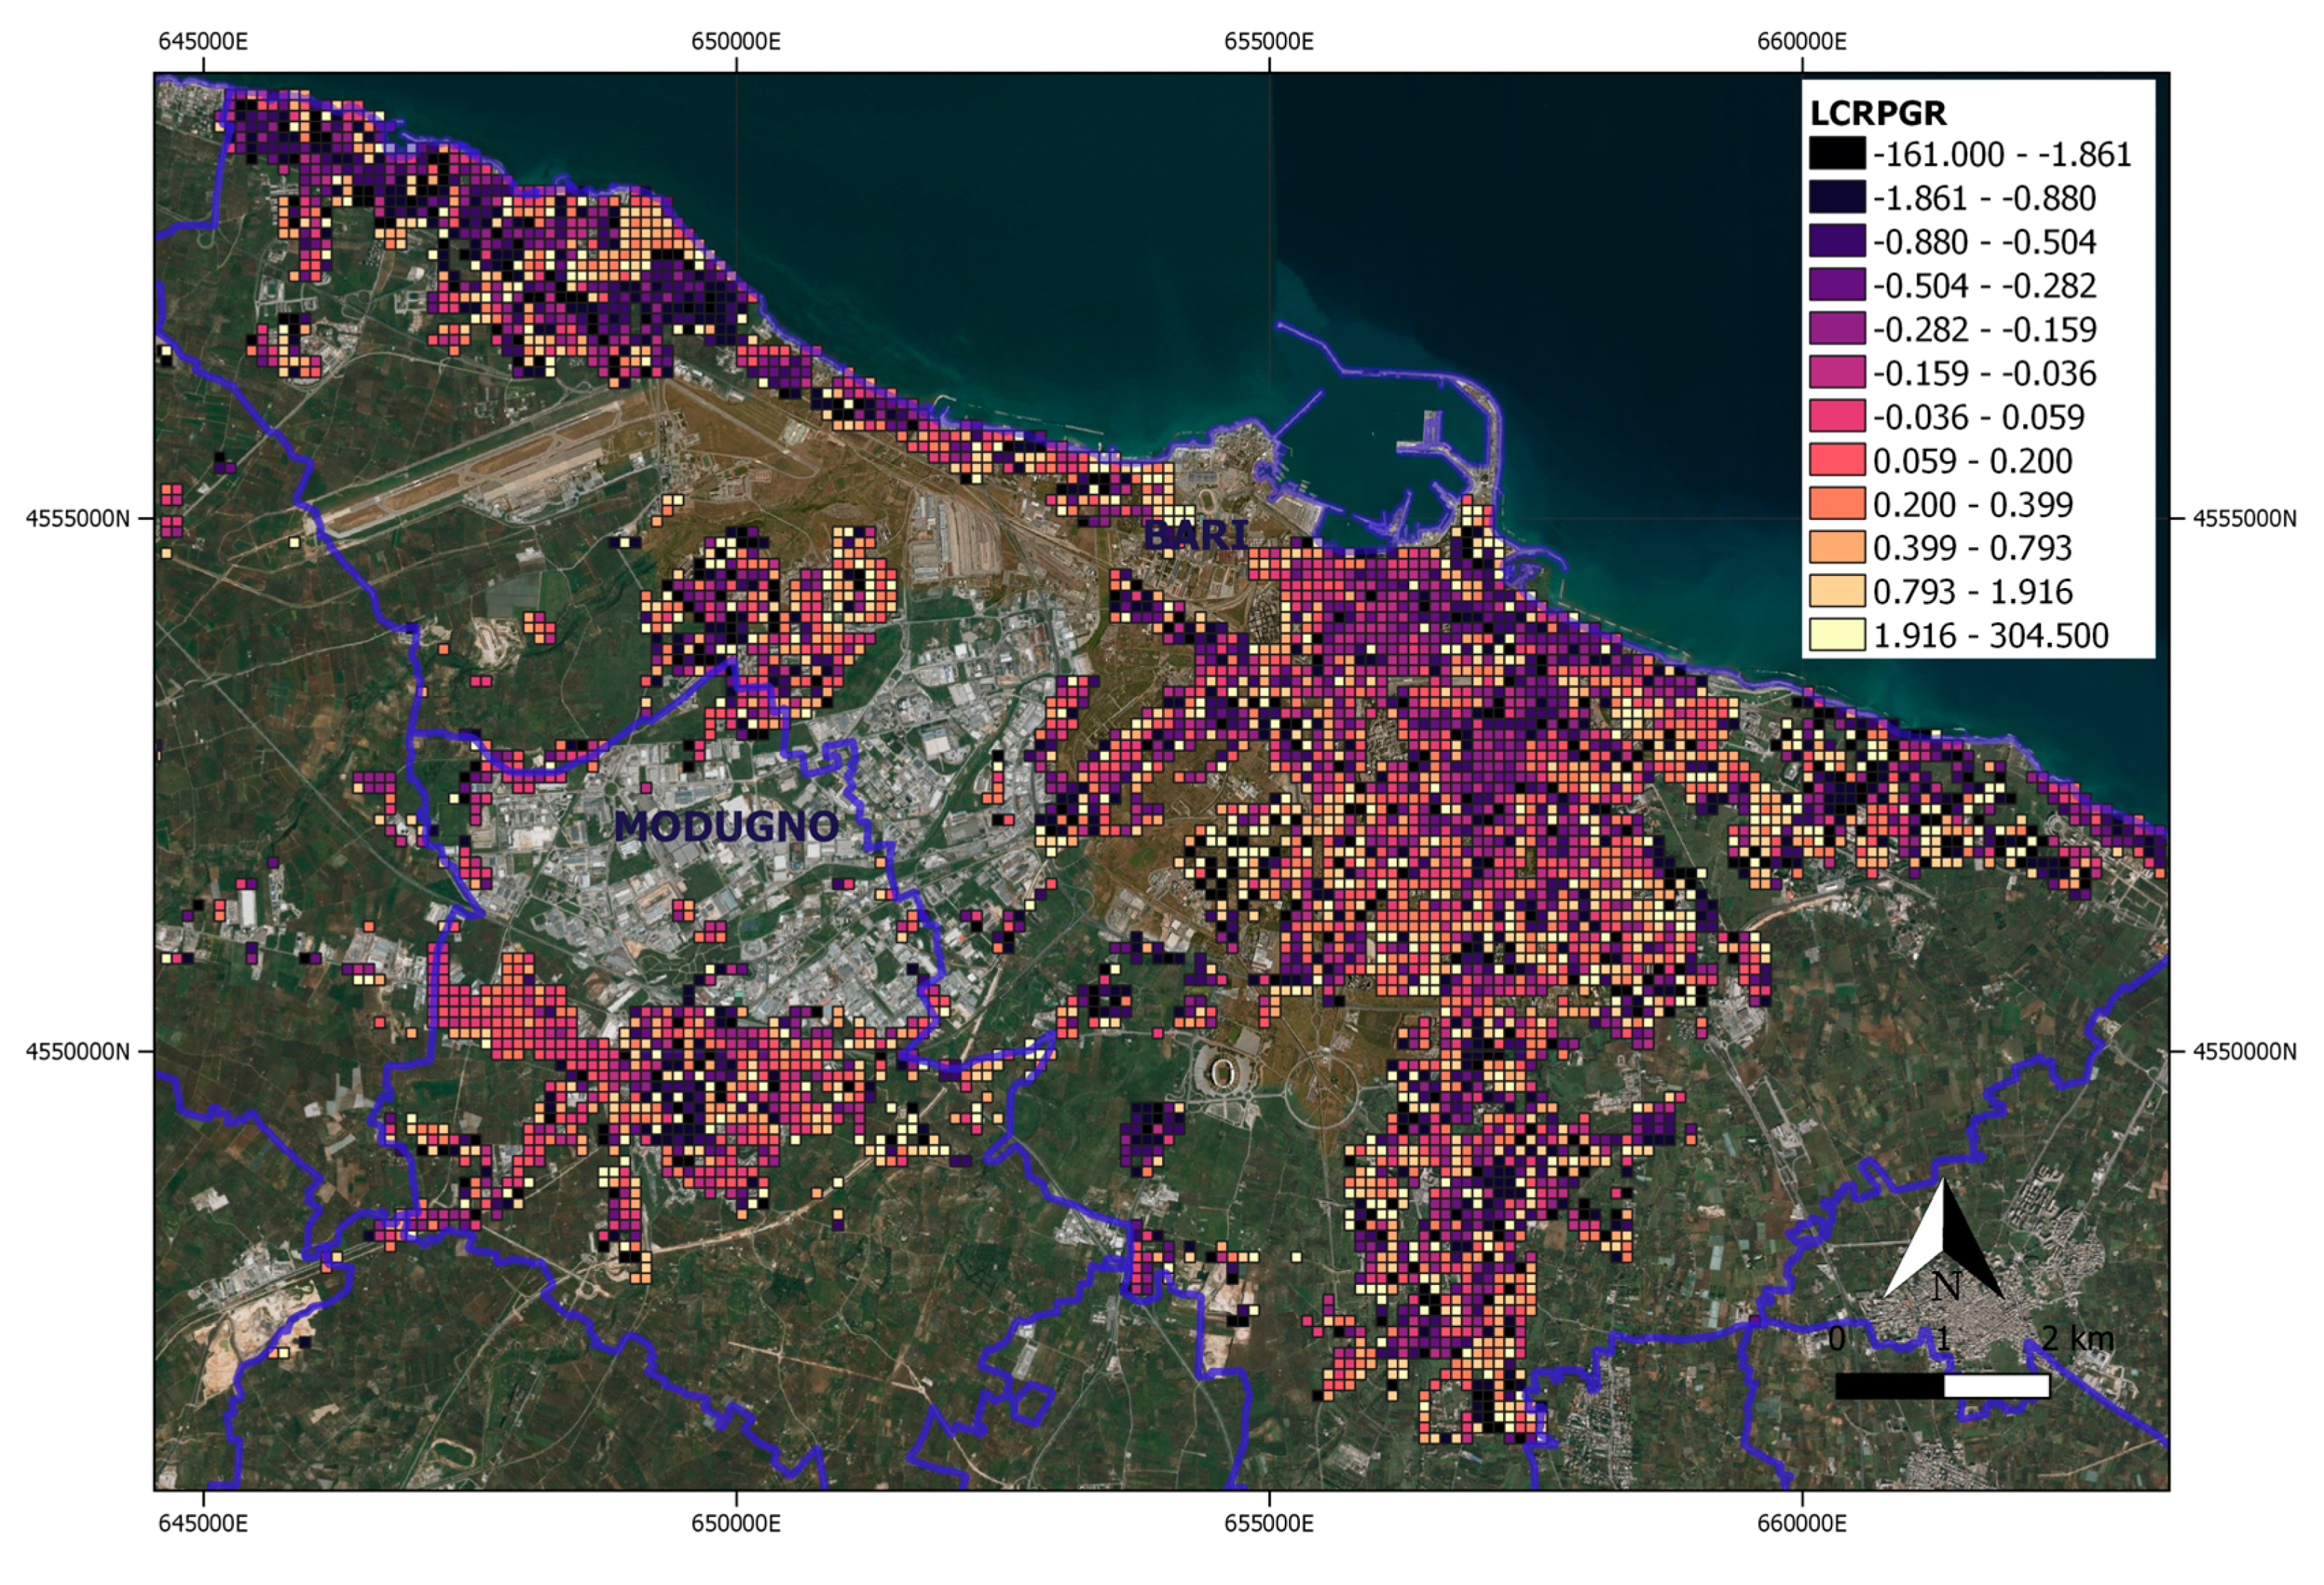
The LCRPGR map is reported in Figure 17.
For LCRPGR, the highest values were observed in sub-urb areas where the land consumption rate, with respect to a generalized growth of the population, is higher.

4. Discussion

In this study, SDG 11.1.1 and SDG 11.3.1 were implemented to monitor the regular migrant component of the urban population in Bari and Modugno at intraurban scale. Main input layers required for such implementation were census data and the map of regular migrant population density. In turn, the latter required the updated urban settlement map or built-up area and building use information. Specifically, our work used a vector-based approach for updating the spatial distribution of regular migrant population at local level. With respect to the raster approach developed by JRC [7], our vector-based formulation ensured a faster calculation speed. For density map evaluation, such formulation also allowed us to consider all the subelements disaggregated in each census area. To our knowledge, the vector-based formulation offered a completely new QGIS plug-in for the dasymetric method. Thus, compared to the JRC raster-based approach [7,8] our implementation is a novel for this field of investigation.
Previous authors worked at European [6,7,8], or global scale [15,33], thus they used the Copernicus validated services (i.e., the European Settlement Map and CLC), which are not yet provided yearly. The chain we used, instead, updates the distribution of regular migrant population and related SDG 11 indicators [16] according to the periodicity required by stakeholders. The local scale analysis was based on the combined use of census data, high temporal frequency Sentinel-2 images and automatic classification techniques. Specifically, a data-driven pixel-based SVM classifier was used to provide the settlement map at 10 × 10 m spatial resolution. When reference training data are not available or difficult to collect, a knowledge-driven object-based classifier can also be used. In our study areas, similar overall accuracy of output values was obtained with respect to the SVM classifier. The output settlement map from Sentinel-2 data includes only buildings defined in agreement with the INfrastructure for SPatial InfoRmation in Europe (INSPIRE) directive [35] and the definition adopted for the ESM in [36].
Our aim was to reproduce the JRC dasymetric approach for comparing the 2011 map from JRC with the 2018 one, and to detect changes. Thus, once extracted, the built-up elements were weighted by the same values as the ones adopted by JRC (Table 1). Even though other weight-selection approaches should be analyzed for local scale analysis, at the present such selection was beyond the scope of our investigation. However, this selection will be considered in future developments.
For the same aim of 2011 map with the 2018 map comparison, a 100 × 100 m output grid was adopted. But a higher spatial-resolution output grid could be used using as input either high resolution Sentinel-2 imagery or very high spatial resolution data, e.g., Worldview3, depending on user requirements.
The lack of training sets covering large areas may limit the accuracy of the output settlement map. In our work, we demonstrated that a knowledge-driven approach can overcome this issue. In our study, comparable overall accuracy results were obtained with data-driven (SVM) and knowledge-driven approaches, i.e., 99.13% ± 0.30% and 95.52% ± 0.30%, respectively.
In our study, the additional building-use information needed for the dasymetric approach was extracted from the 2018 CLC map. Such information can also be extracted from local urban plans, cadastral databases and field surveys. However, the lack of systematic updating of such data may hamper the output service production, as evidenced also in [7].
Building height information was not considered in our analysis. Thus, the distribution map of regular migrant population obtained may have underestimated population counts, as explained in [7]. In fact, cells occupied by tall buildings may host more people than the ones occupied by lower buildings [7,34]. Information height could be obtained from available Laser Imaging Detection and Ranging (LIDAR) data, which are costly, or from the new Copernicus building-heights dataset. However, such dataset is currently available only for capital cities [37]. Thus, Copernicus data cannot be considered in our study areas.
Uncertainty of the output maps is especially important for decision making and was discussed previously in many papers [10,32,34]. MAE and TAE values were used in our paper to verify that the aggregation of output cell data reproduced the totals for the original census areas [7]. The results obtained, i.e., 0.03 and 40.81, respectively, were in agreement with the input cell values. As discussed in [10], MAE was favored as the main indicator of model performance, as opposed to the root mean square error (RMSE) because it appears more robust for a skewed distribution, as in the case of population density.
With respect to the global-scale work described in [6], we implemented SDG 11.3.1 at intraurban local scale for only the regular migrant population component, to support local decision makers. In recent literature, not many authors have tried to implement SDG11 indicators at local level.
In agreement with [7], when computed at such scale, the essential variables implemented, namely the migrant population distribution and the urban settlement, can contribute to the development of additional environmental and social resilience indicators with respect to the size, forms and directions of migration processes [18]. In addition, they can support local policy makers in the design of both new services for specific urban areas and new integration/inclusion policies.

5. Conclusions

This study provided a novel contribution in the implementation of SDG 11.3.1 and SDG 11.1.1 indicators at intraurban scale, focusing on the regular migrant population component. The main aim was to support local decision makers in devising sustainable, livable trajectories to increase urban resilience, reduce urban segregation and foster citizen inclusion. The findings provided insights into the spatial distribution of increased regular migrant population per zone within the study area. In 2018, such a distribution map indicated the strengthening of the urban social segregation process evidenced in 2011. In addition, the areas where migrant population expanded are exposed to flooding hazard.
Both SDG 11.3.1 and SDG11.1.1 indicators required the updating of both the spatial distribution of regular migrant population and city settlement variables. As an additional novelty of the work, a modified vector-based dasymetric approach was proposed for modeling migrants distribution. When analyzed through artificial intelligence techniques, the combined use of high-frequency free satellite data, census and ancillary data, can ensure regular updating of the two variables and implement SDG indicators, at the local scale, according to temporal and spatial requirements of end users.
The approach developed in this study for local scale (100 × 100 m), the updating of the two essential variables and the indicators implementation could be generalized to other cities as well as to other SDG 11 indicator components. Specifically, SDG 11.1.1. and SDG 11.3.1 could be disaggregated for migrant population nationality and religion. Moreover, the native population component could collaborate to monitor fluxes of these population components within the study area and its surroundings.
The indicators implemented can be also useful not only for urban planning, but also for applications in the field of real estate, insurance and risk management.
However, local ancillary data fragmentation may hamper the raising of SDG indicators, including SDG 11.3.1 and SDG 11.1.1 components of this study, from a Tier II classification to Tier I classification [38]. In other words, Tier II classification means that indicators are well defined, but data are not regularly produced by countries. On the contrary, Tier I classification means that indicators are conceptually clear, have an internationally established methodology and standards are available, and data are regularly produced by countries [38].
The lack of standardization in the aggregation levels, geometries, definitions as well as confidentiality requirements is generalized in Italy, as well as in other European Countries [7]. For Italy, a centralized national database “Anagrafe Nazionale della Popolazione Residente” (ANPR), in which all municipality will progressively converge, is actually under construction in support to future studies.

Author Contributions

Conceptualization, M.A., P.B. and A.B.; Methodology, M.A. and P.B.; Software, M.A.; Validation, M.A. and C.T.; Formal Analysis, M.A., P.B. and M.A.; Investigation, M.A. and P.B.; Resources, M.A., C.T. and A.B.; Data Curation, M.A. and C.T.; Writing—Original Draft Preparation, M.A. and C.T.; Writing—Review and Editing, M.A., P.B., M.A. and C.T.; Visualization, M.A. and C.T.; Supervision, P.B., M.A. and A.B.; Project Administration, P.B.; Funding Acquisition, P.B. All authors have read and agreed to the published version of the manuscript.

Funding

This research was funded by the project SMURBS—SMart URBan Solutions for air quality, disasters and city growth (www.smurbs.eu) funded by the European Commission in the framework of program “The European network for observing our changing planet (ERA–PLANET),” Grant Agreement: 689443 and by the OT4CLIMA project funded by the Italian Ministry of Education, University and Research (D.D. 2261 del 6.9.2018, PON R&I 2014–2020).

Acknowledgments

The authors are grateful to the Demographic Services of Bari and Modugno municipalities and to JRC for their valuable support.

Conflicts of Interest

The authors declare no conflict of interest. The funders had no role in the design of the study; in the collection, analyses, or interpretation of data; in the writing of the manuscript, or in the decision to publish the results.

References

  1. United Nations, Department of Economic and Social Affairs, Population Division. International Migration Report 2017: Highlights; UN: New York, NY, USA, 2017; Available online: https://www.un.org/en/development/desa/population/migration/publications/migrationreport/docs/MigrationReport2017_Highlights (accessed on 11 December 2018).
  2. United Nations. The Sustainable Development Goals Report 2017; UN: New York, NY, USA, 2017; Available online: https://unstats.un.org/sdgs/files/report/2017/thesustainabledevelopmentgoalsreport2017.pdf (accessed on 17 July 2017).
  3. United Nations, Department of Economic and Social Affairs, Population Division. International Migrant Stock 2019; UN: New York, NY, USA, 2019; Available online: https://www.un.org/en/development/desa/population/migration/publications/migrationreport/docs/MigrationStock2019_TenKeyFindings.pdf (accessed on 17 September 2019).
  4. Organization for Economic Cooperation and Development (OECD). International Migration Outlook 2019; OECD Publishing: Paris, France, 2019. [Google Scholar]
  5. SDG. Available online: https://www.un.org/sustainabledevelopment/sustainable-development-goals/ (accessed on 20 November 2015).
  6. Melchiorri, M.; Pesaresi, M.; Florczyk, A.J.; Corbane, C.; Kemper, T. Principles and Applications of the Global Human Settlement Layer as Baseline for the Land Use Efficiency Indicator—SDG 11.3.1. ISPRS Int. J. Geo-Inf. 2019, 8, 96. [Google Scholar] [CrossRef] [Green Version]
  7. Ehrlich, G.; Kemper, T.; Pesaresi, M.; Corbane, C. Built-up area and population density: Two Essential Societal Variables to address climate hazard impact. Environ. Sci. Policy 2018, 90, 73–82. [Google Scholar] [CrossRef]
  8. D4I. 2017. Available online: https://ec.europa.eu/knowledge4policy/migration-demography/data-integration-d4i_en. (accessed on 17 July 2017).
  9. Alessandrini, A.; Natale, F.; Sermi, F.; Vespe, M. High Resolution Map of Migrants in the EU; JRC Techical Report EUR 28770 EN; Publications Office of the European Union: Luxembourg, Belgium, 2017. [Google Scholar] [CrossRef]
  10. Batista e Silva, F.; Gallego, J.; Lavalle, C. A high-resolution population grid map for Europe. J. Maps 2013, 9, 16–28. [Google Scholar] [CrossRef]
  11. Langford, M. Refining methods for dasymetric mapping using satellite remote sensing. In Remotely Sensed Cities; Mesev, V., Ed.; Taylor & Francis: London, UK, 2003. [Google Scholar]
  12. Petrov, A. One hundred years of dasymetric mapping: Back to the origin. Cartogr. J. World Mapp. 2012, 49, 256–264. [Google Scholar] [CrossRef]
  13. GRASS. Available online: https://grass.osgeo.org/ (accessed on 20 September 2017).
  14. ESM. 2012. Available online: https://land.copernicus.eu/pan-european/GHSL/european-settlement-map (accessed on 15 March 2020).
  15. CLC. 2012. Available online: https://land.copernicus.eu/pan-european/corine-land-cover (accessed on 14 June 2019).
  16. Copernicus Land Monitoring Service. 2016. Available online: www.copernicus.eu (accessed on 9 July 2013).
  17. United Nations, General Assembly. Transforming Our World: The 2030 Agenda for Sustainable Development; UN: New York, NY, USA, 2015; Available online: https://sustainabledevelopment.un.org/post2015/transformingourworld (accessed on 25 September 2015).
  18. SDG 11.1.1. 2018. Available online: https://unstats.un.org/sdgs/metadata/files/Metadata-11-01-01.pdf (accessed on 14 February 2018).
  19. SDG 11.3.1. 2016. Available online: https://unstats.un.org/sdgs/metadata/files/Metadata-11-03-01.pdf (accessed on 19 July 2016).
  20. Figueiredo, L.; Honiden, T.; Schumann, A. Indicators for Resilient Cities. In OECD Regional Development Working Papers; OECD Publishing: Paris, France, 2018. [Google Scholar]
  21. Remote Sensing of Environment Journal–Special Issue “Earth Observation for the Sustainable Development Goals”. 2020. Available online: https://www.sciencedirect.com/journal/remote-sensing-of-environment/special-issue/10RFDS7BFNH (accessed on 17 January 2020).
  22. ANCI. Italian National Municipalities Association. Rapporto Cittalia 2013. Le Città Metropolitan; Digitalia Lab s.r.l.: Roma, Italy, 2013. [Google Scholar]
  23. ESA. 2014. Available online: https://sentinel.esa.int/web/sentinel/missions/sentinel-2 (accessed on 23 June 2015).
  24. Di Gregorio, A.; Jansen, L.J.M. Land Cover Classification System (LCCS): Classification Concepts and User Manual; Food and Agriculture Organization of the United Nations: Rome, Italy, 2005. [Google Scholar]
  25. Mountrakis, G.; Im, J.; Ogole, C. Support vector machines in remote sensing: A review. ISPRS J. Photogramm. Remote. Sens. 2011, 66, 247–259. [Google Scholar] [CrossRef]
  26. Open Street Map. Available online: https://www.openstreetmap.org (accessed on 15 March 2020).
  27. Adamo, M.; Tarantino, C.; Lucas, R.M.; Tomaselli, V.; Sigismondi, A.; Mairota, P.; Blonda, P. Combined use of Expert Knowledge and Earth Observation data for the Land Cover mapping of an Italian grassland area: An EODHAM system application. In Proceedings of the IEEE Geoscience and Remote Sensing Symposium, Milan, Italy, 26–25 July 2015; pp. 3065–3068. [Google Scholar]
  28. Congalton, R.G.; Kass, G. Assessing the Accuracy of Remotely Sensed Data: Principle and Practices, 2nd ed.; Taylor & Francis Group: Abingdon, UK, 2009. [Google Scholar]
  29. CLC. 2018. Available online: https://land.copernicus.eu/pan-european/corine-land-cover (accessed on 14 June 2019).
  30. Apulia Basin Authority. 2016. Available online: http://www.adb.puglia.it/public/news.php (accessed on 19 January 2016).
  31. DeLorenzo, N.; Dugger, A. Choroplet Map Esri; Census Bureau: Sutland, MD, USA, 2012. Available online: https://www.arcgis.com/apps/MapJournal/index.html?appid=75eff041036d40cf8e70df99641004ca (accessed on 15 March 2012).
  32. Mennis, J. Generating surface models of population using dasymetric mapping. Prof. Geogr. 2003, 55, 31–42. [Google Scholar]
  33. Pesaresi, M.; Huadong, G.; Blaes, X.; Ehrlich, D.; Ferri, S.; Gueguen, L.; Halkia, M.; Kauffmann, M.; Kemper, T.; Lu, L.; et al. A global human settlement layer from optical HR/VHR RS data: Concept and first results. IEEE J. Sel. Top. Appl. Earth Obs. Remote Sens. 2013, 6, 2102–2131. [Google Scholar] [CrossRef]
  34. Calka, B.; Bielecka, E. Reliability Analysis of LandScan Gridded Population Data. The Case Study of Poland. ISPRS Int. J. Geo-Inf. 2019, 8, 222. [Google Scholar] [CrossRef] [Green Version]
  35. INSPIRE, Data Specification on Buildings—Draft Technical Guidelines. Available online: https://inspire.ec.europa.eu/documents/Data_Specifications/INSPIRE_DataSpecification_BU_v3.0rc3.pdf (accessed on 4 February 2013).
  36. ESM Validation Report. 2016. Available online: https://land.copernicus.eu/user-corner/technical-library/the-european-settlement-map-validation-report/view (accessed on 9 July 2017).
  37. Lu, Z.; Im, J.; Quackenbush, L.J.; Halligan, K. Population estimation based on multi-sensor data fusion. Int. J. Remote. Sens. 2010, 31, 5587–5604. [Google Scholar] [CrossRef]
  38. Tier Classifications for Global SDG Indicators. 2019. Available online: https://unstats.un.org/sdgs/iaeg-sdgs/tier-classification/ (accessed on 15 October 2018).
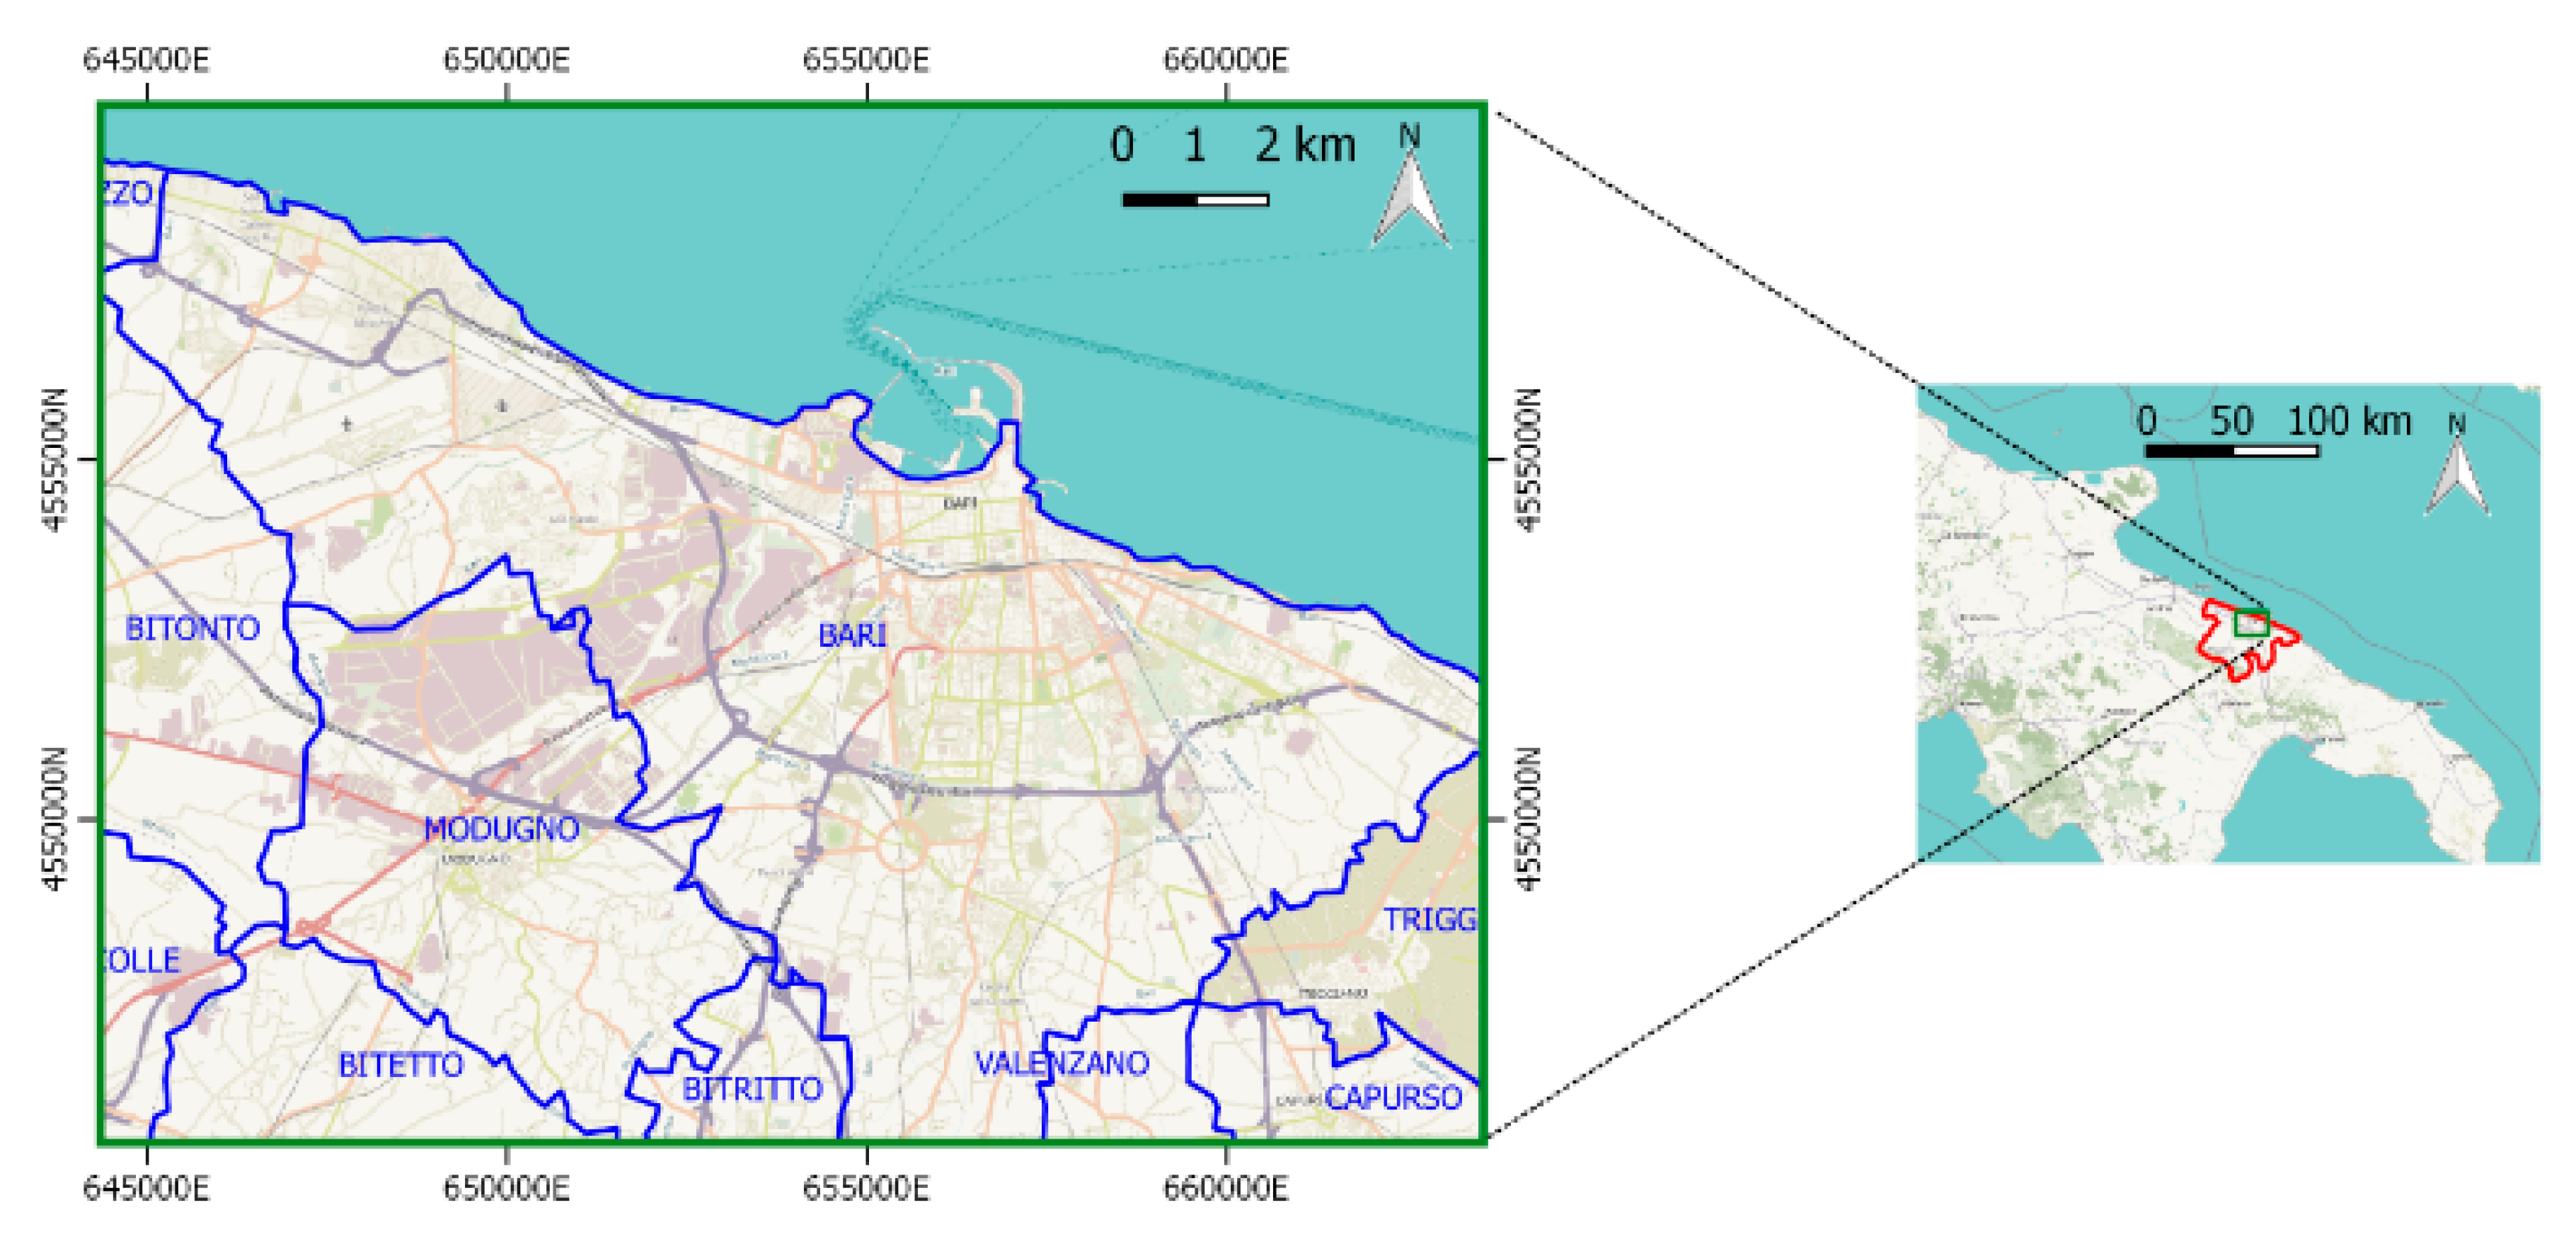
Figure 1. Study area in the green frame. Bari metropolitan area in red, municipality boundaries indicated in blue. Source: OpenStreetMap.
Remotesensing 12 00950 g001
Figure 2. Resident migrant population for each census zone updated to 1 January 2019. Many census zones were missing inside of the town of Modugno due to the lack of migrant population and the presence of a large industrial area.
Remotesensing 12 00950 g002
Figure 3. Building use information extracted from Corine Land Cover CLC 2018 data. Source: Copernicus Land Monitoring Services.
Remotesensing 12 00950 g003
Figure 4. Map showing the number of inadequate buildings in Bari.
Remotesensing 12 00950 g004
Figure 5. Flooding hazard map (2018) of the study area (provided by the Regional Apulia Basin Authority).
Remotesensing 12 00950 g005
Figure 6. Processing chain implemented in the QGIS environment.
Remotesensing 12 00950 g006
Figure 7. Spatial intersection between census data and building use maps.
Remotesensing 12 00950 g007
Figure 8. Spatial intersection between the output grid and the map in Figure 7.
Remotesensing 12 00950 g008
Figure 9. Settlement map, 10 m spatial resolution, for 2018, obtained by: (a) data-driven pixel-based approach; (b) knowledge-driven object-based approach.
Remotesensing 12 00950 g009
Figure 10. Spatial distribution of resident migrant population for 2018.
Remotesensing 12 00950 g010
Figure 11. Spatial distribution of resident migrant population for 2011.
Remotesensing 12 00950 g011
Figure 12. Map of changes in the spatial distribution of resident migrant population between 2011 and 2018.
Remotesensing 12 00950 g012
Figure 13. Sustainable Development Goal (SDG) 11.1.1 indicator related to structural quality and durability criteria (IHH_1) for 2018. Close-up view of the Bari municipality.
Remotesensing 12 00950 g013
Figure 14. SDG 11.1.1 indicator related to flood hazard areas (location) criteria (IHH_2) for 2018.
Remotesensing 12 00950 g014
Figure 15. (a) Land consumption rate (LCR) for the period 2011–2018. Black polygon: industrial area. (b) In red, cells with negative LCR values overlay the 2011 orthophoto. Note that these cells do not correspond to buildings.
Remotesensing 12 00950 g015
Figure 16. Regular migrant population growth rate for the period 2011–2018.
Remotesensing 12 00950 g016
Figure 17. Ratio of Land Consumption Rate to Population Growth Rate (LCRPGR) for the period 2011–2018.
Remotesensing 12 00950 g017
Table 1. Correction factors for building use.
Building useCLC classesCorrfactor
Residential1.1.1; 1.1.21
Rural2.1.1; 2.1.2; 2.1.3; 2.2.1; 2.2.2; 2.2.3; 2.3.1; 2.4.1; 2.4.2; 2.4.3; 2.4.40.5
Commercial/Industrial1.2.1, 1.2.3, 1.4.20.05
Otherall remaining classes0.01