Article

Mapping Forest Canopy Fuels in the Western United States with LiDAR–Landsat Covariance

by
Christopher J. Moran
1,*,
Van R. Kane
2 and
Carl A. Seielstad
1
1
National Center for Landscape Fire Analysis, University of Montana, Missoula, MT 59812, USA
2
School of Environmental and Forest Resources, University of Washington, Seattle, WA 98195, USA
*
Author to whom correspondence should be addressed.
Remote Sens. 2020, 12(6), 1000; https://doi.org/10.3390/rs12061000
Submission received: 10 January 2020 / Revised: 8 March 2020 / Accepted: 16 March 2020 / Published: 20 March 2020
(This article belongs to the Special Issue LiDAR Measurements for Wildfire Applications)

Abstract

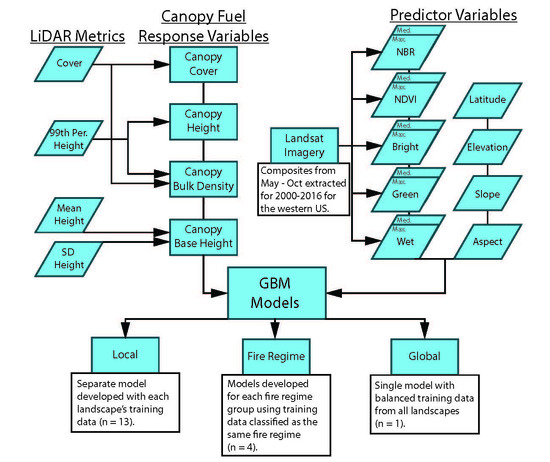
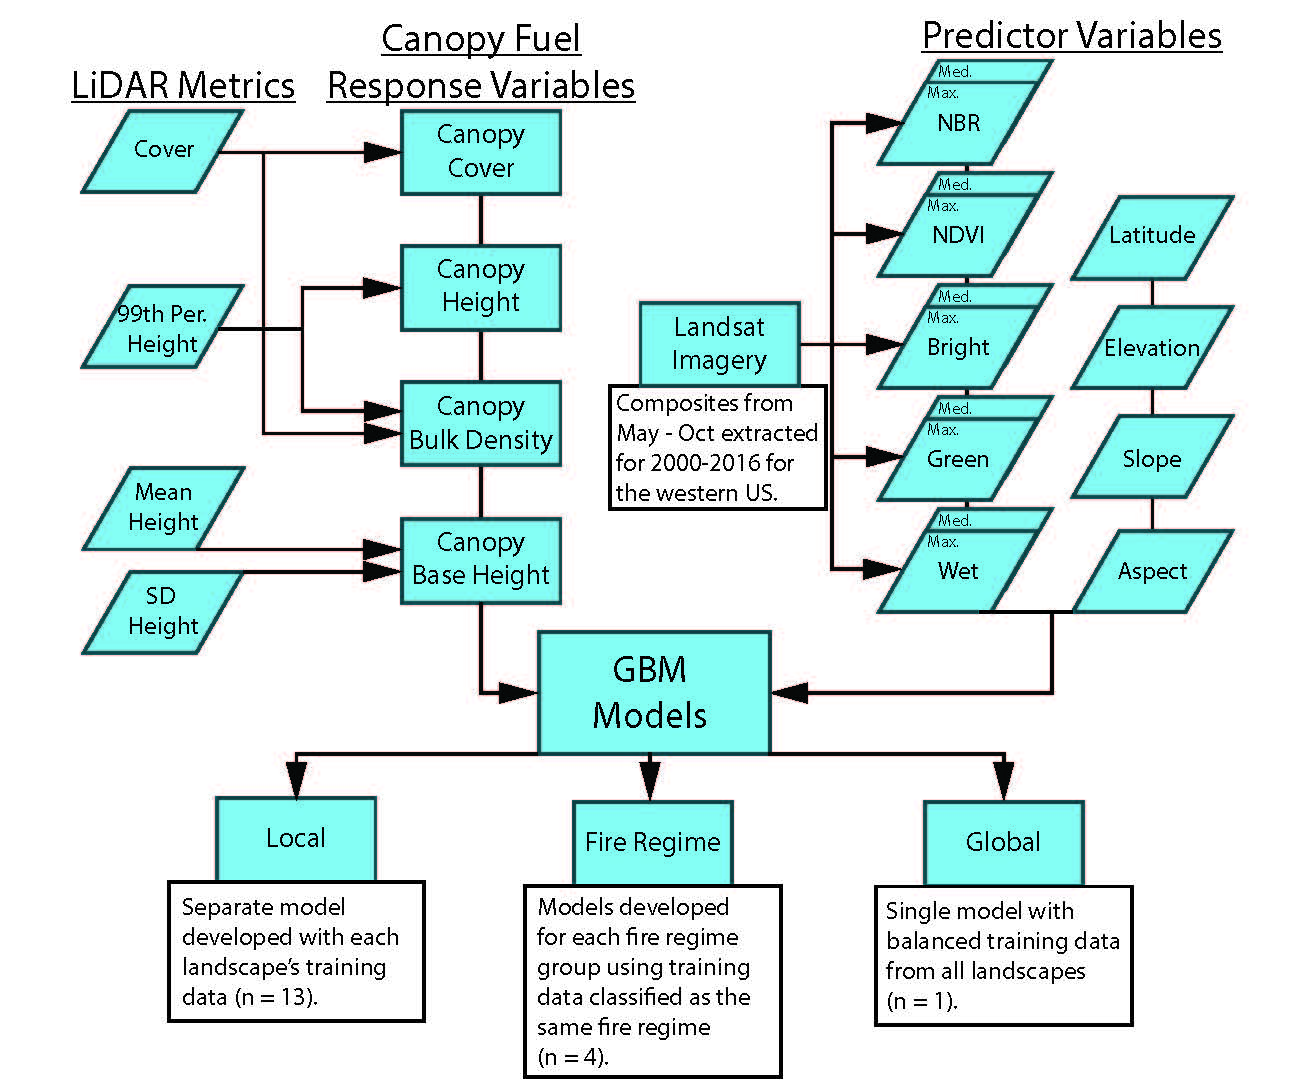
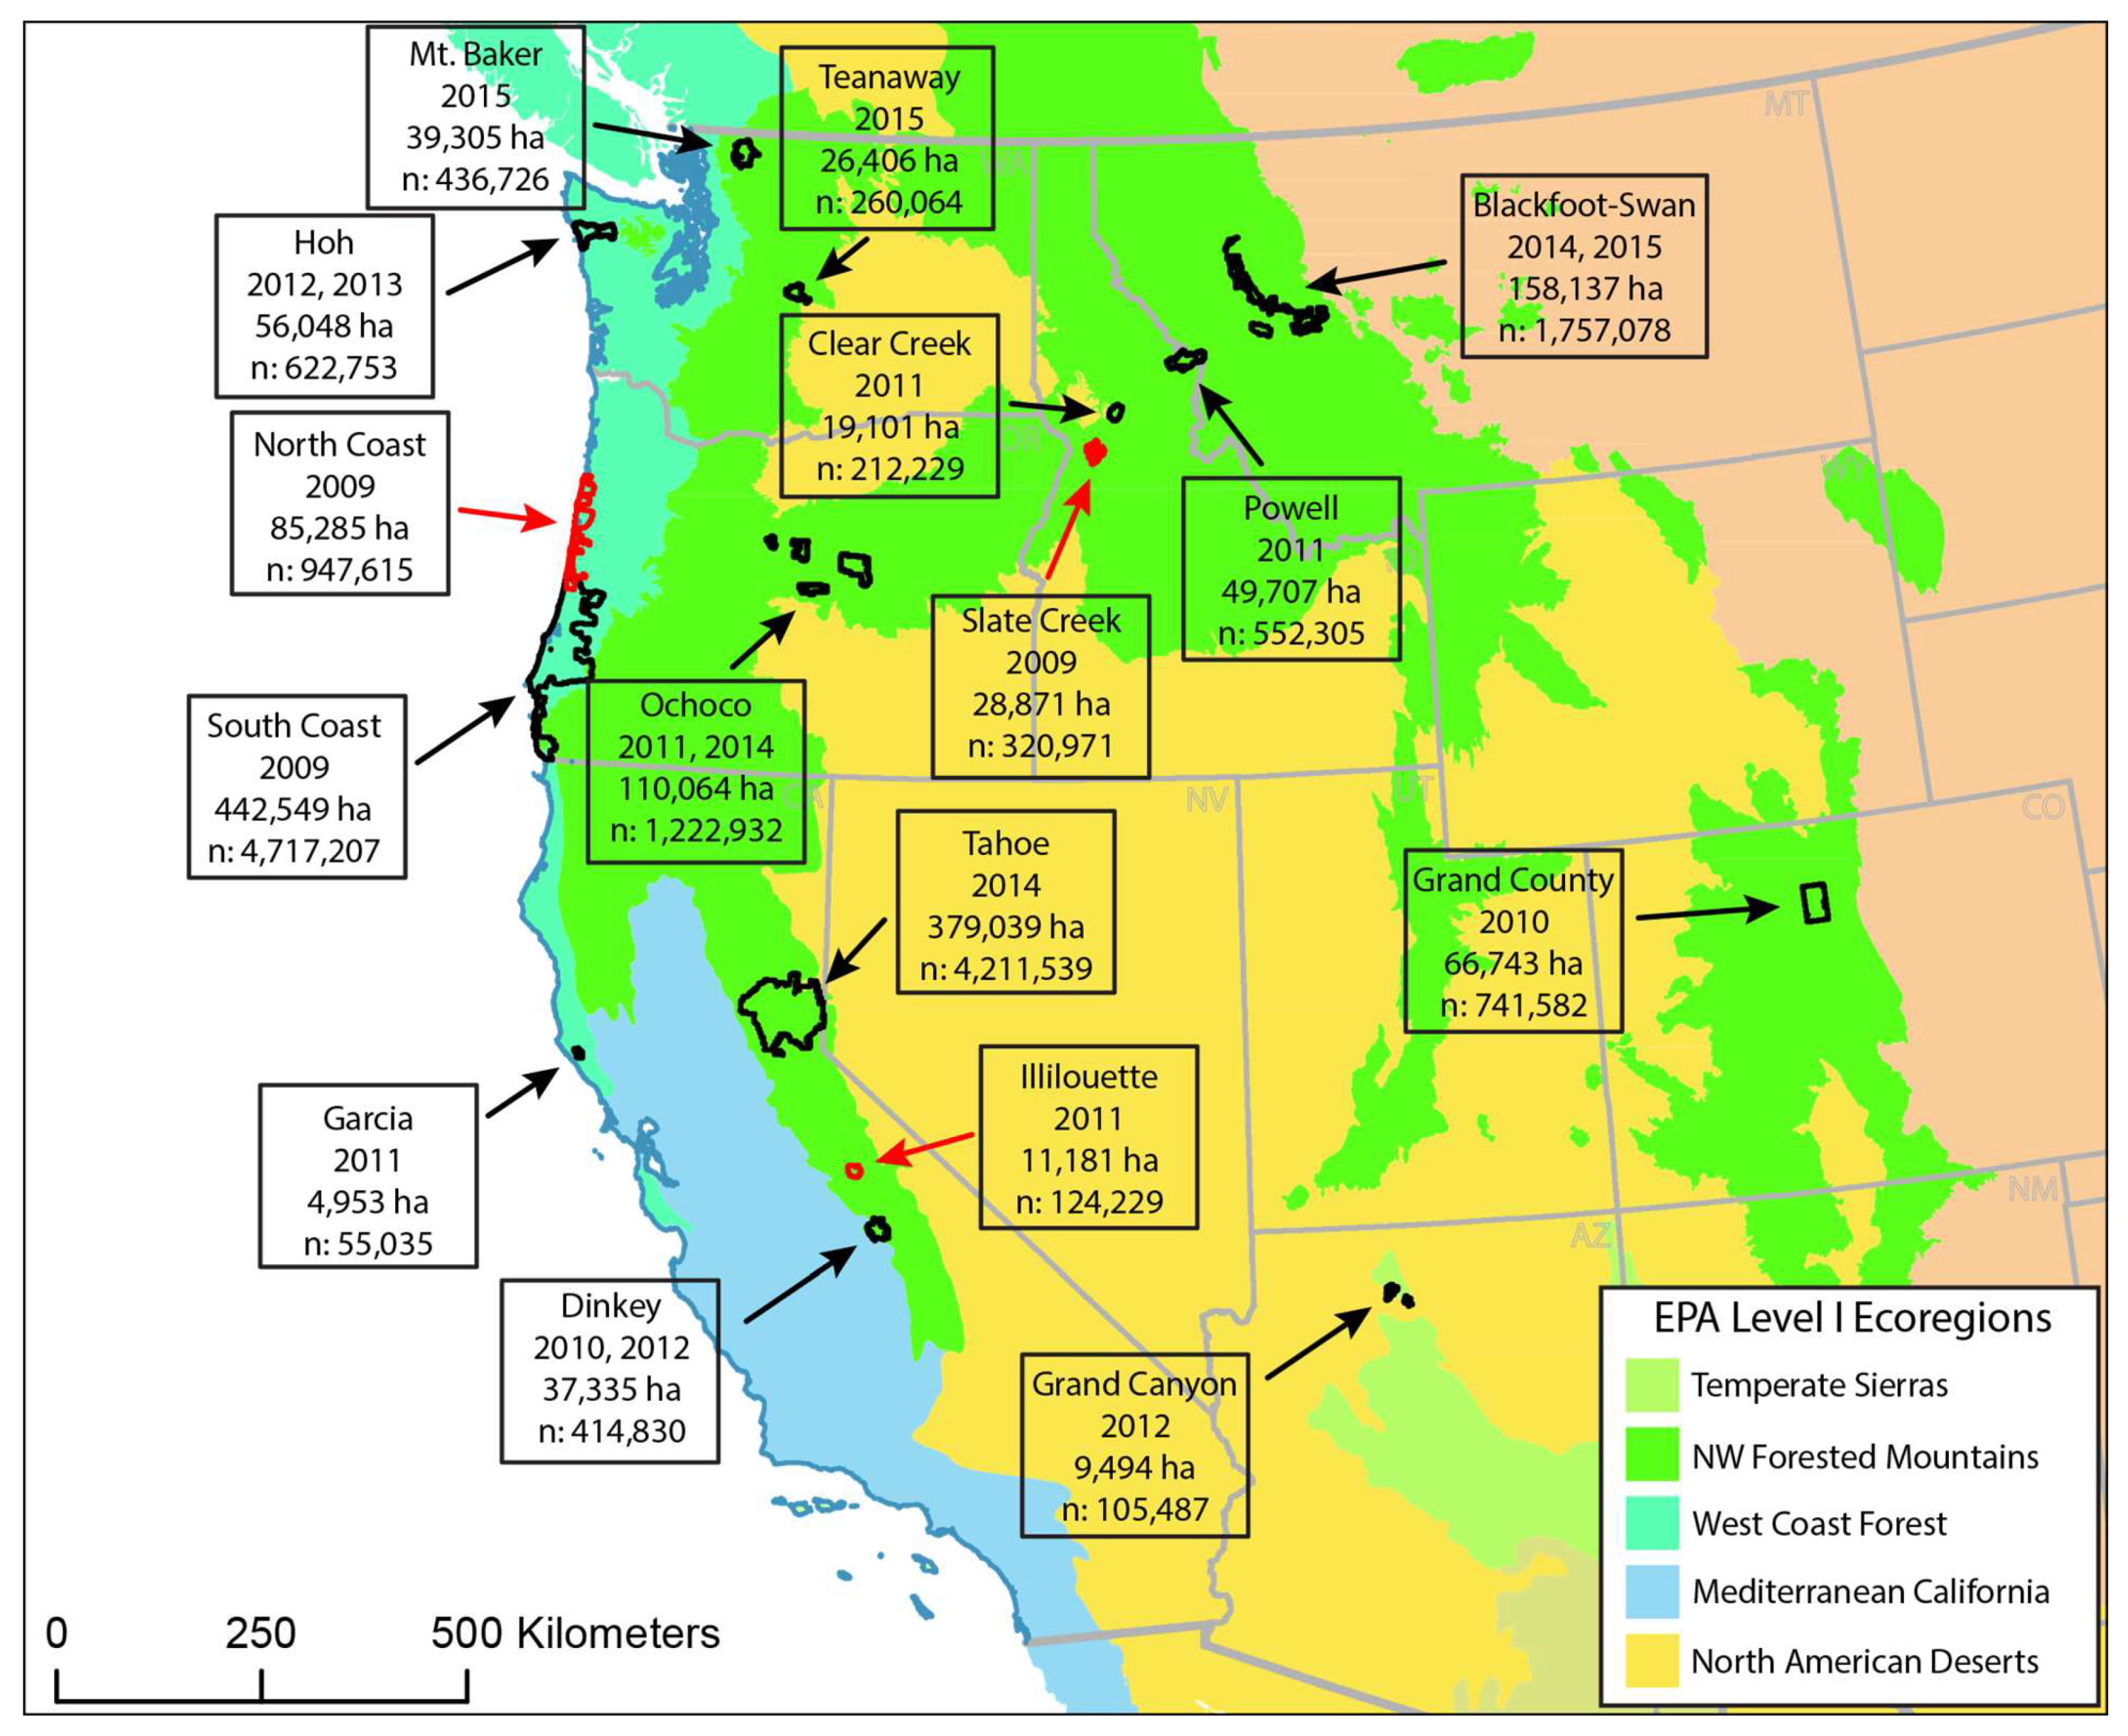
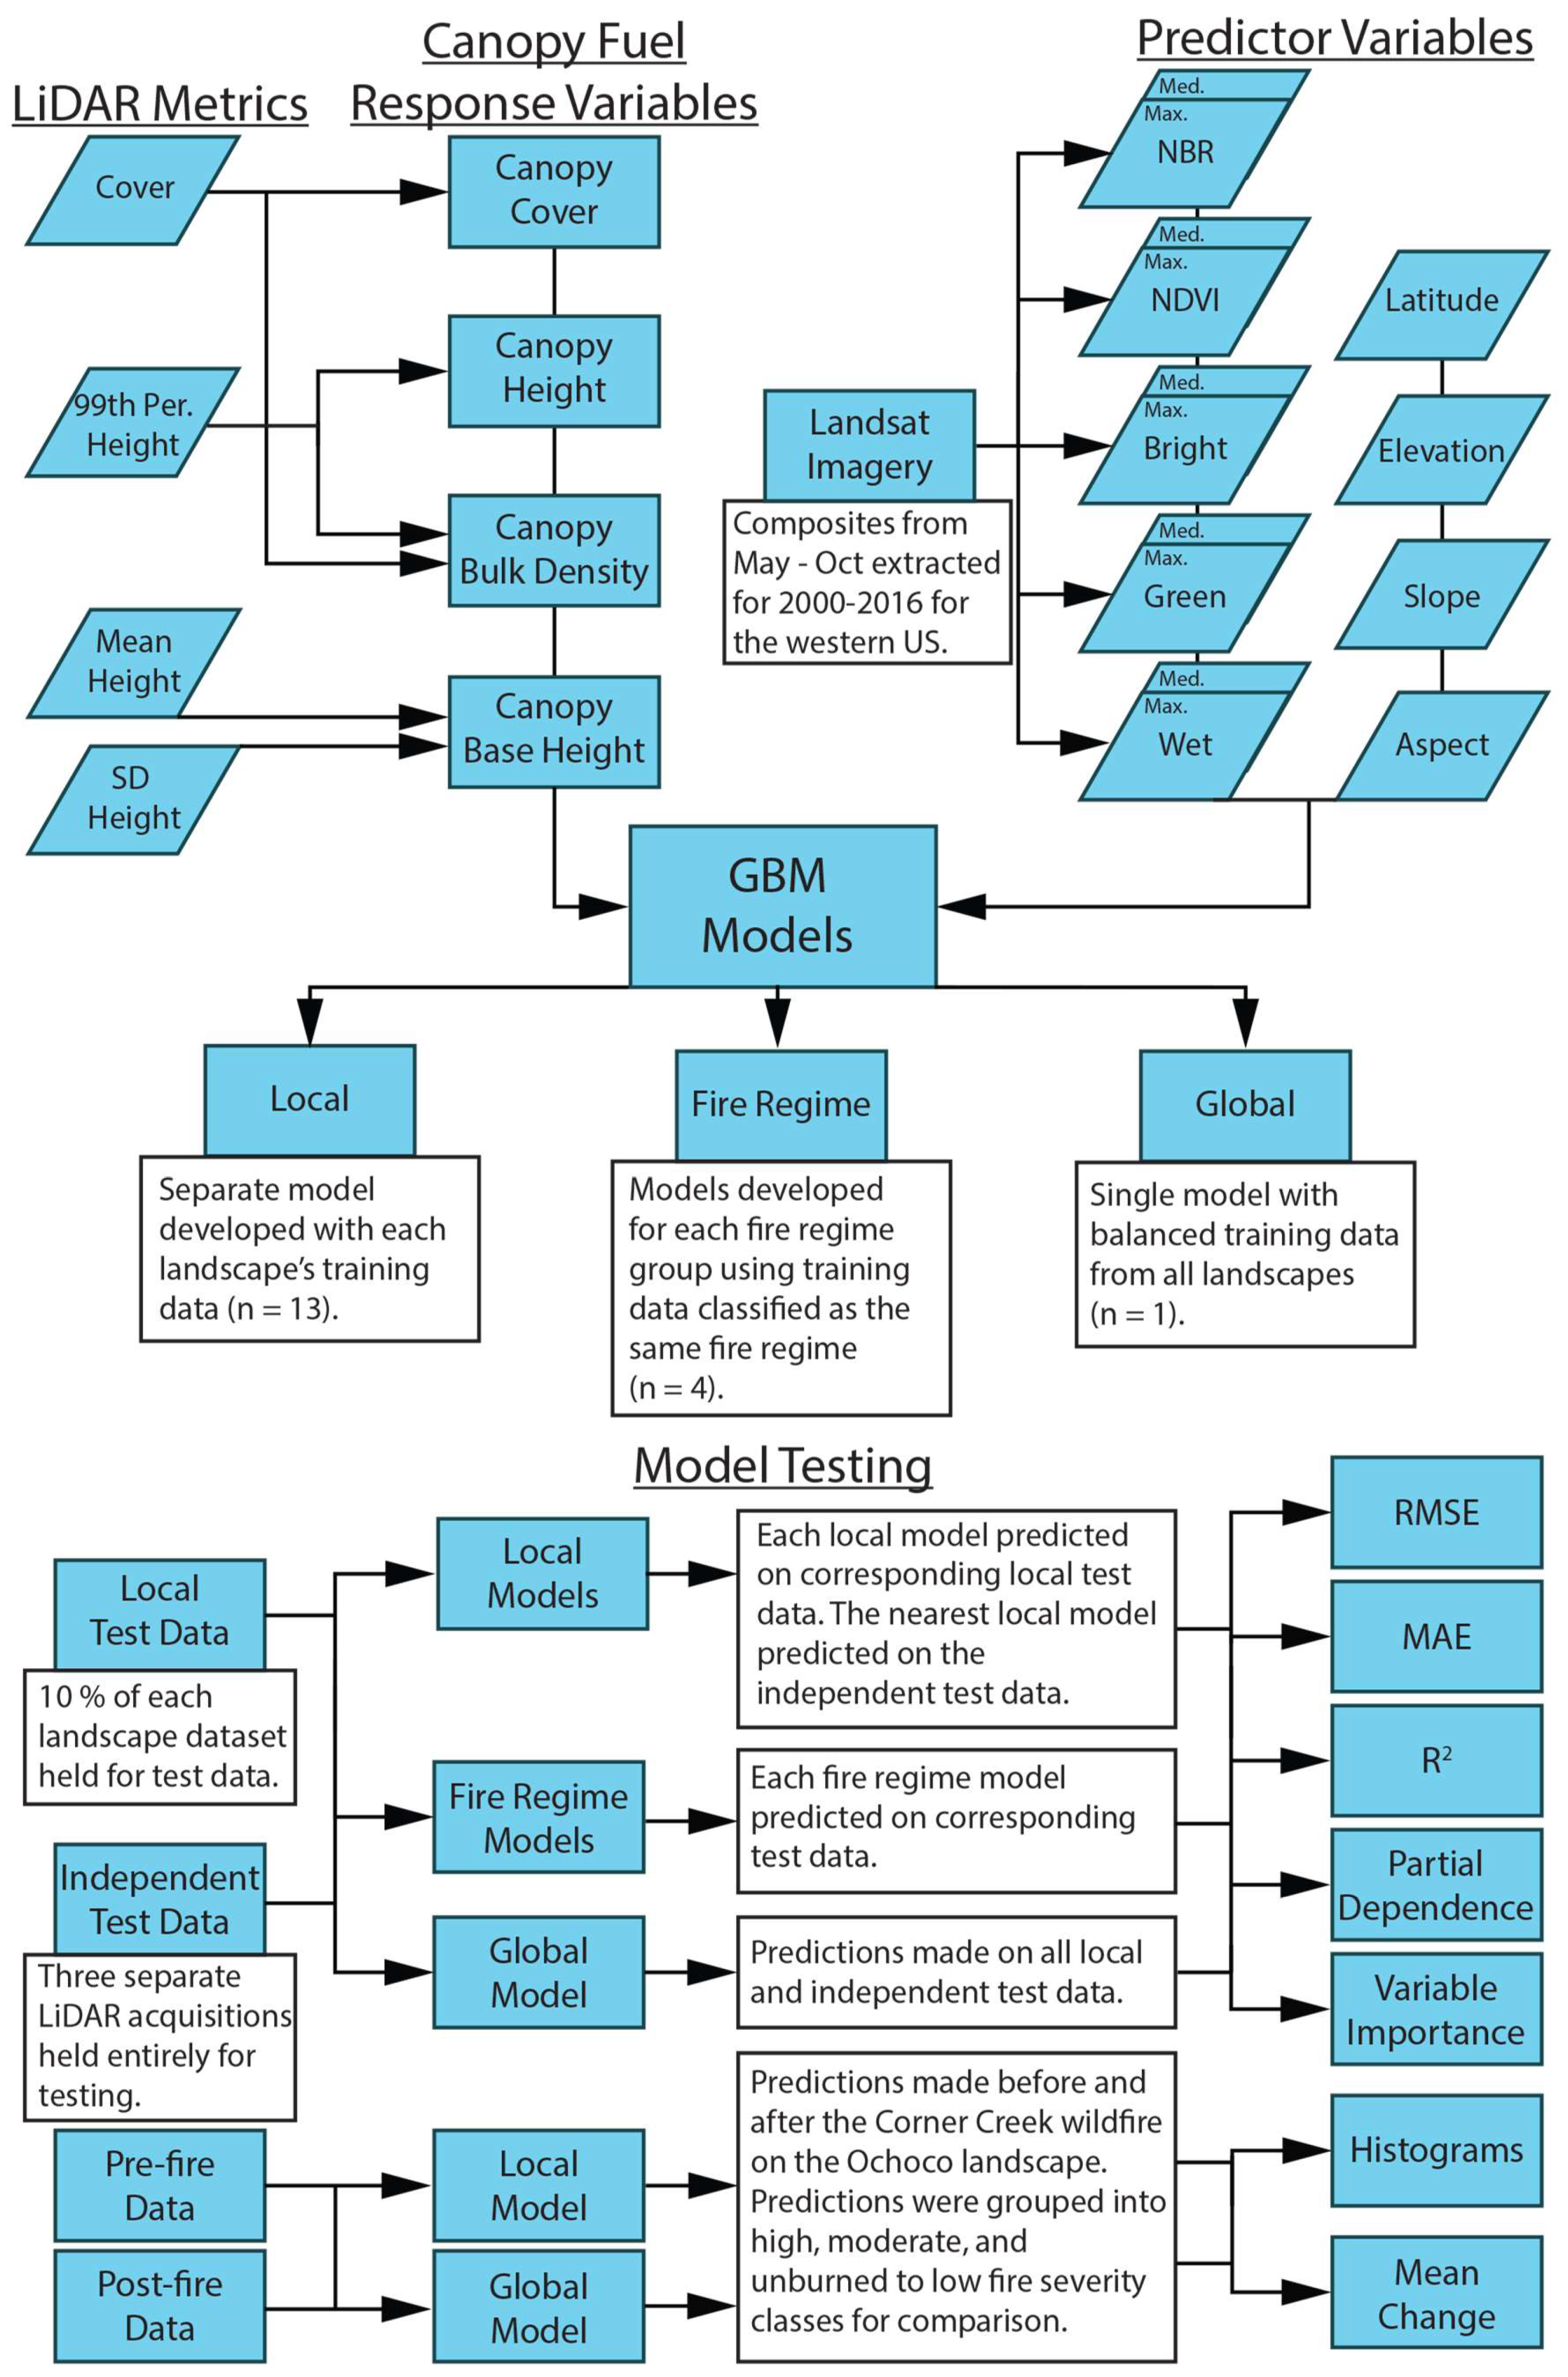
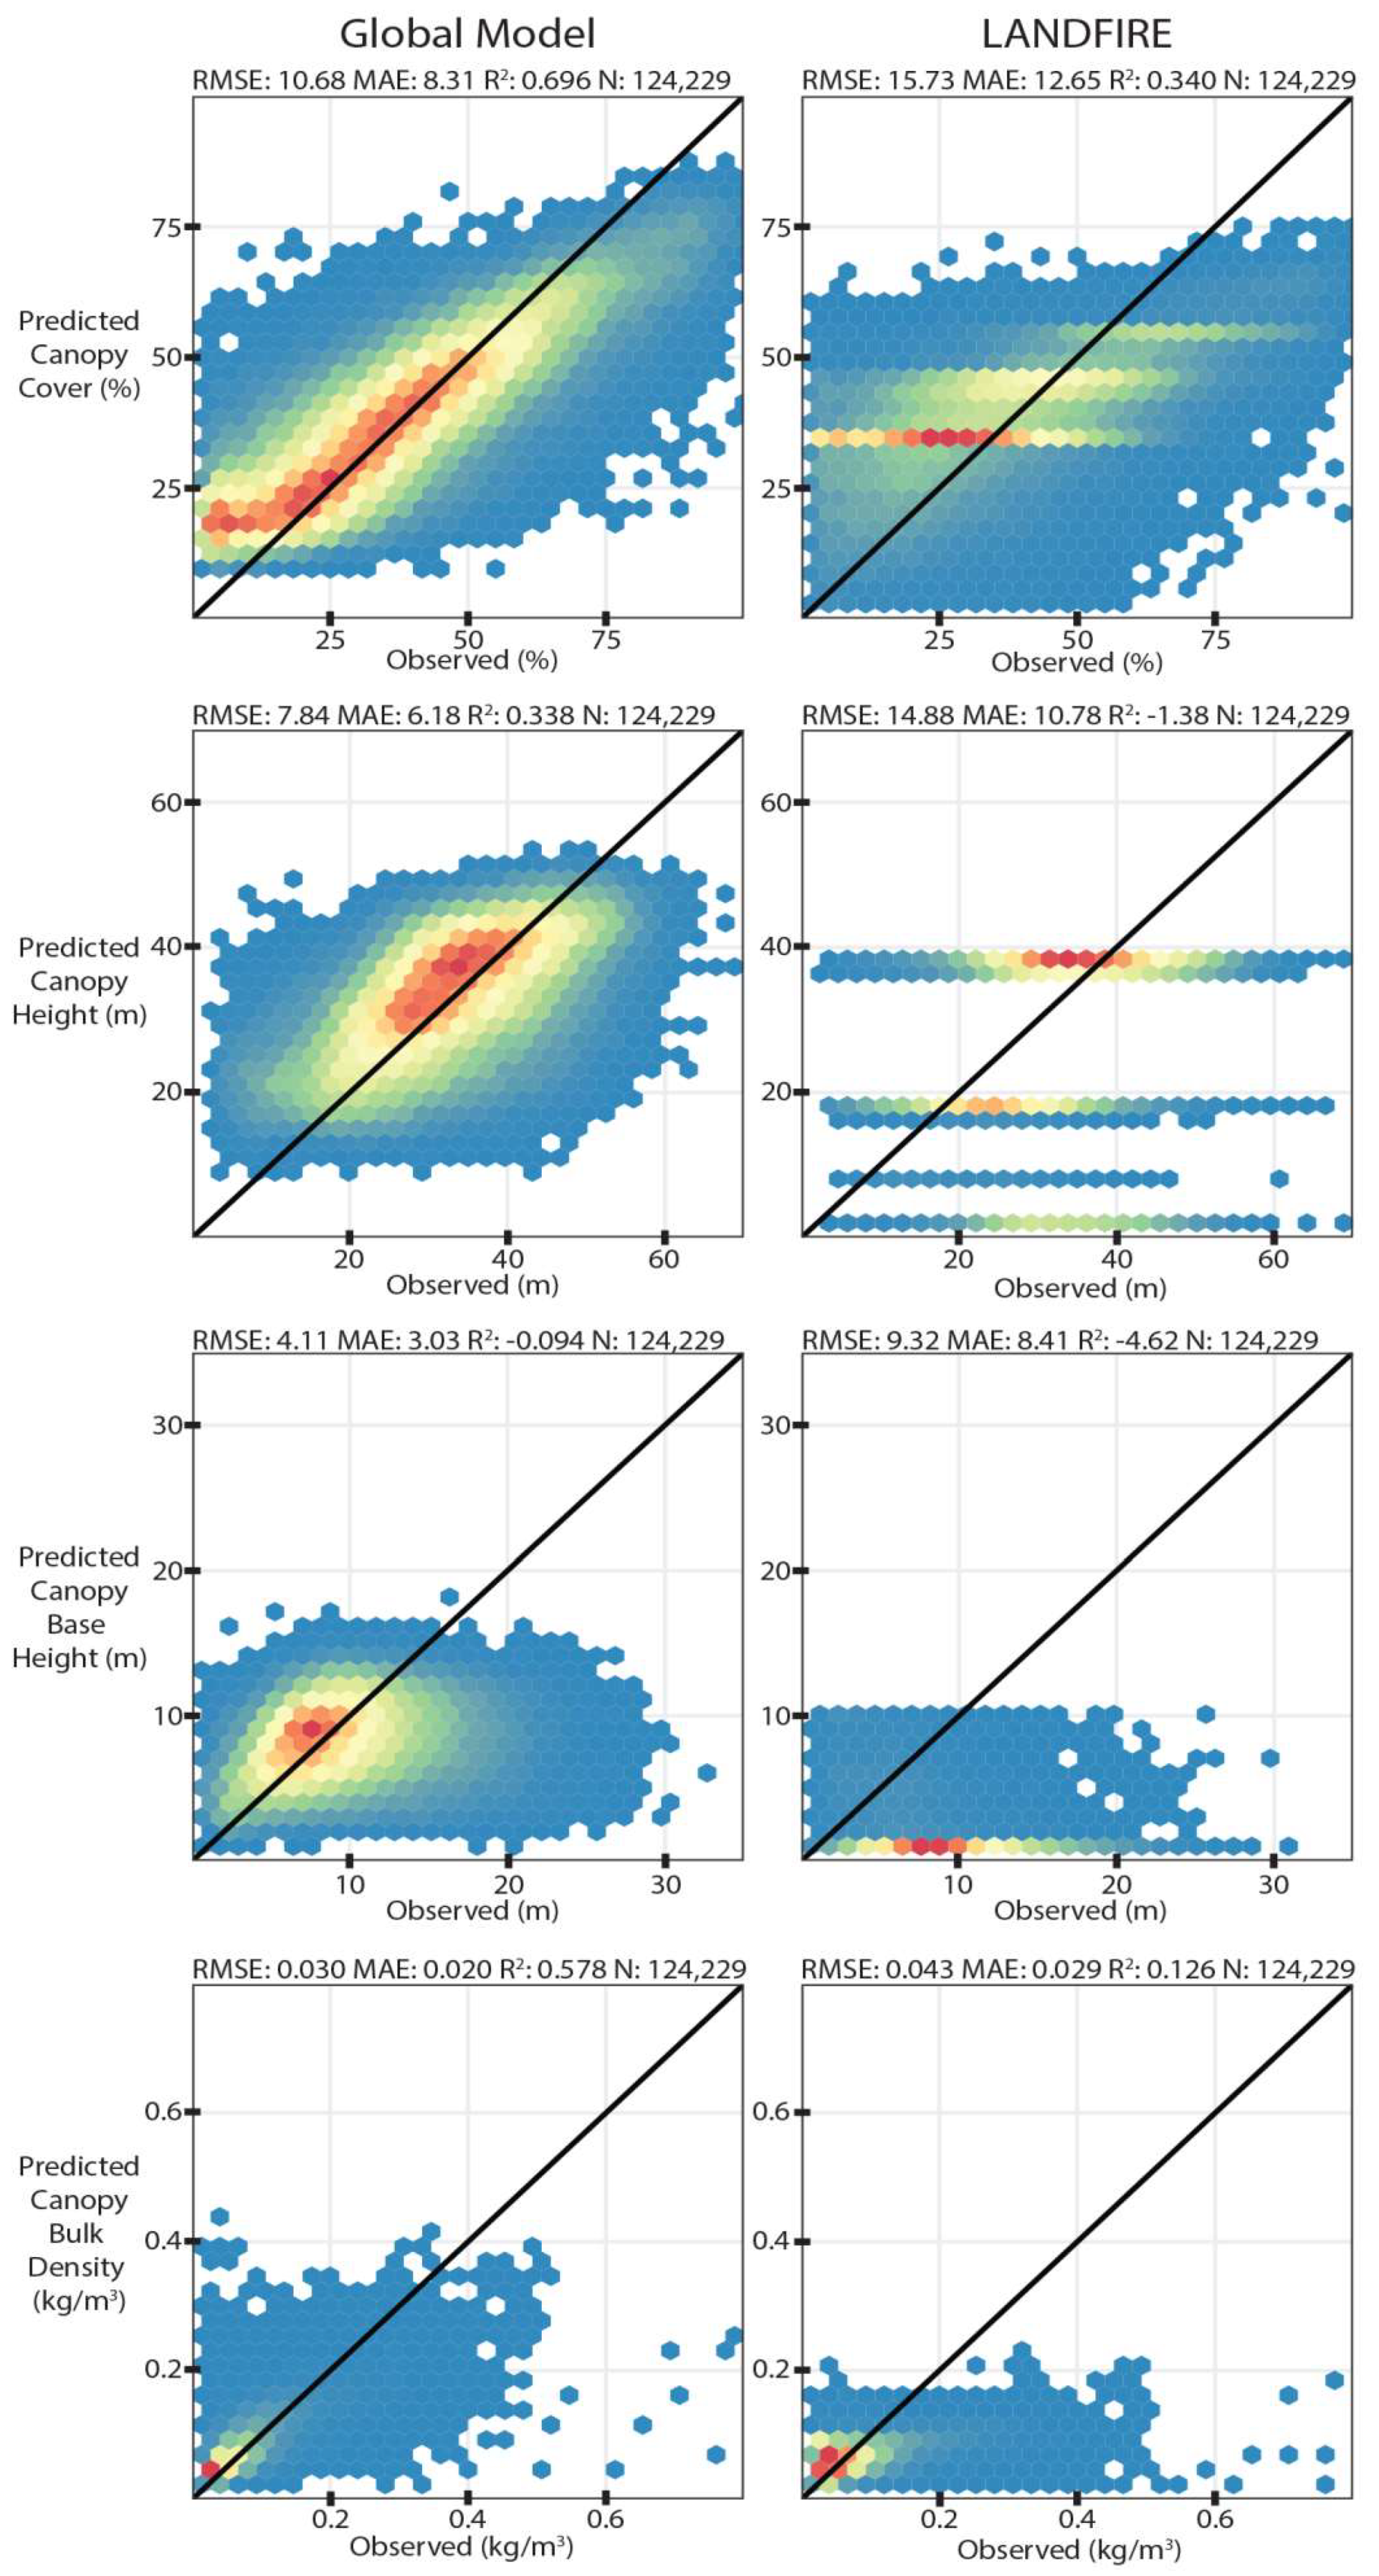
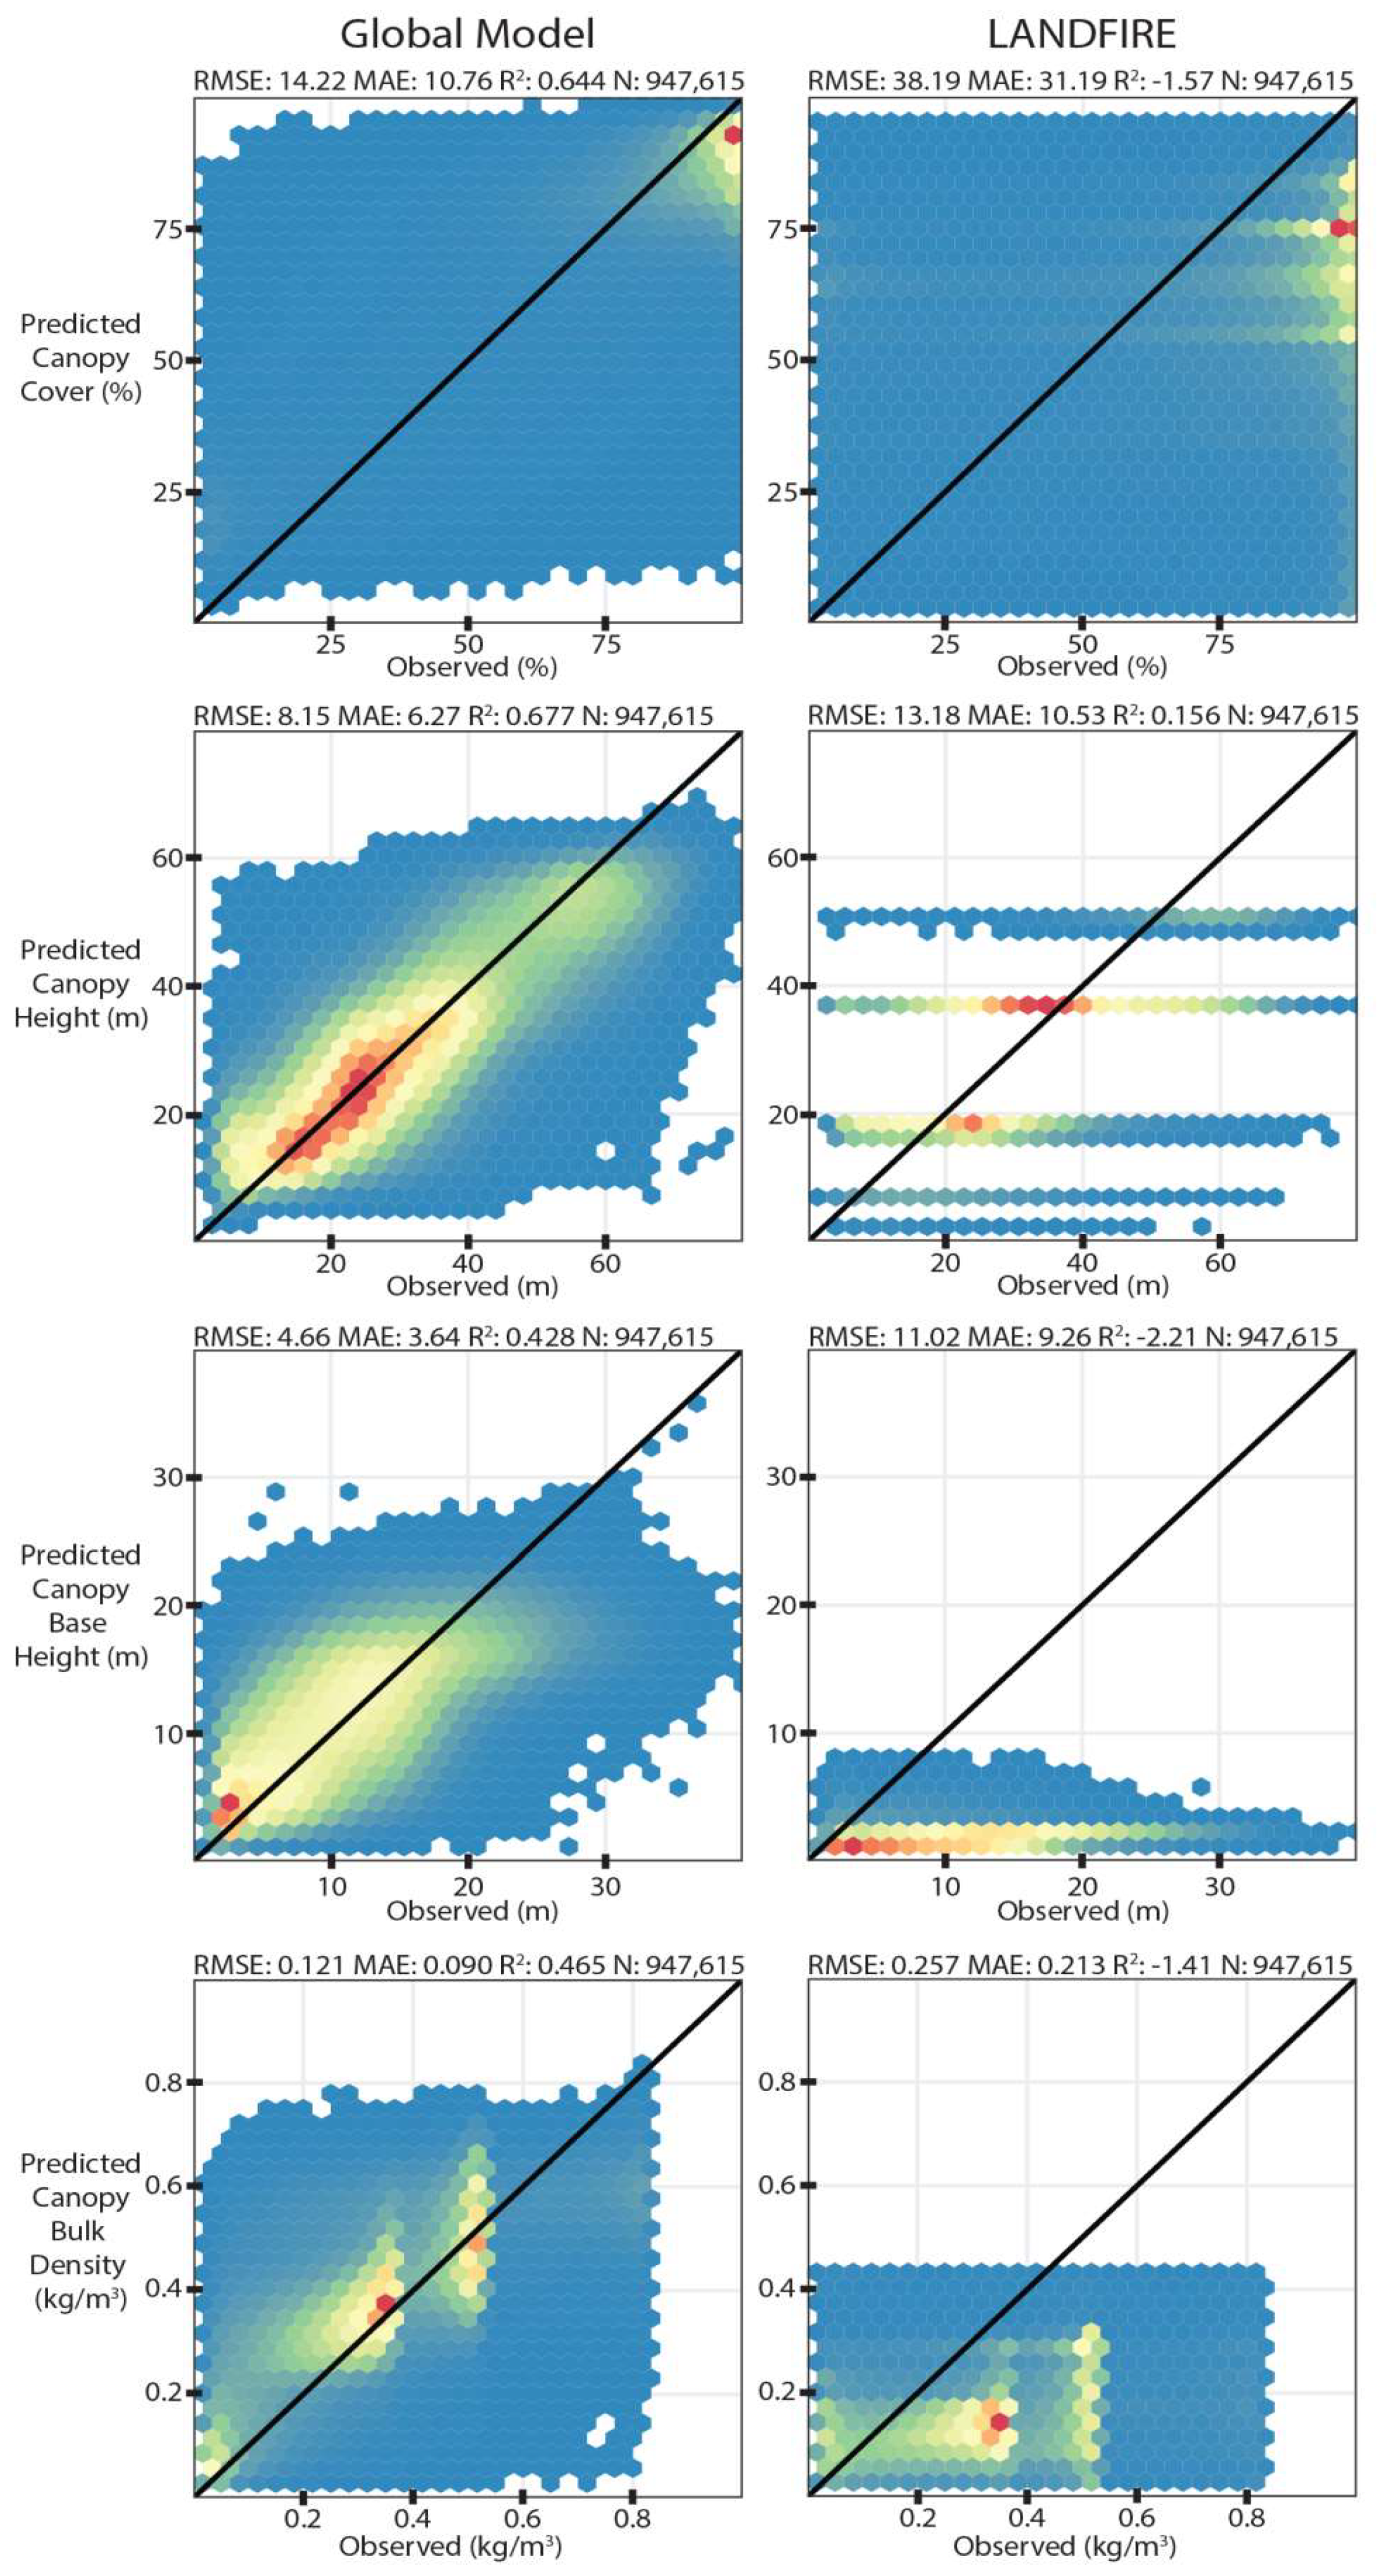
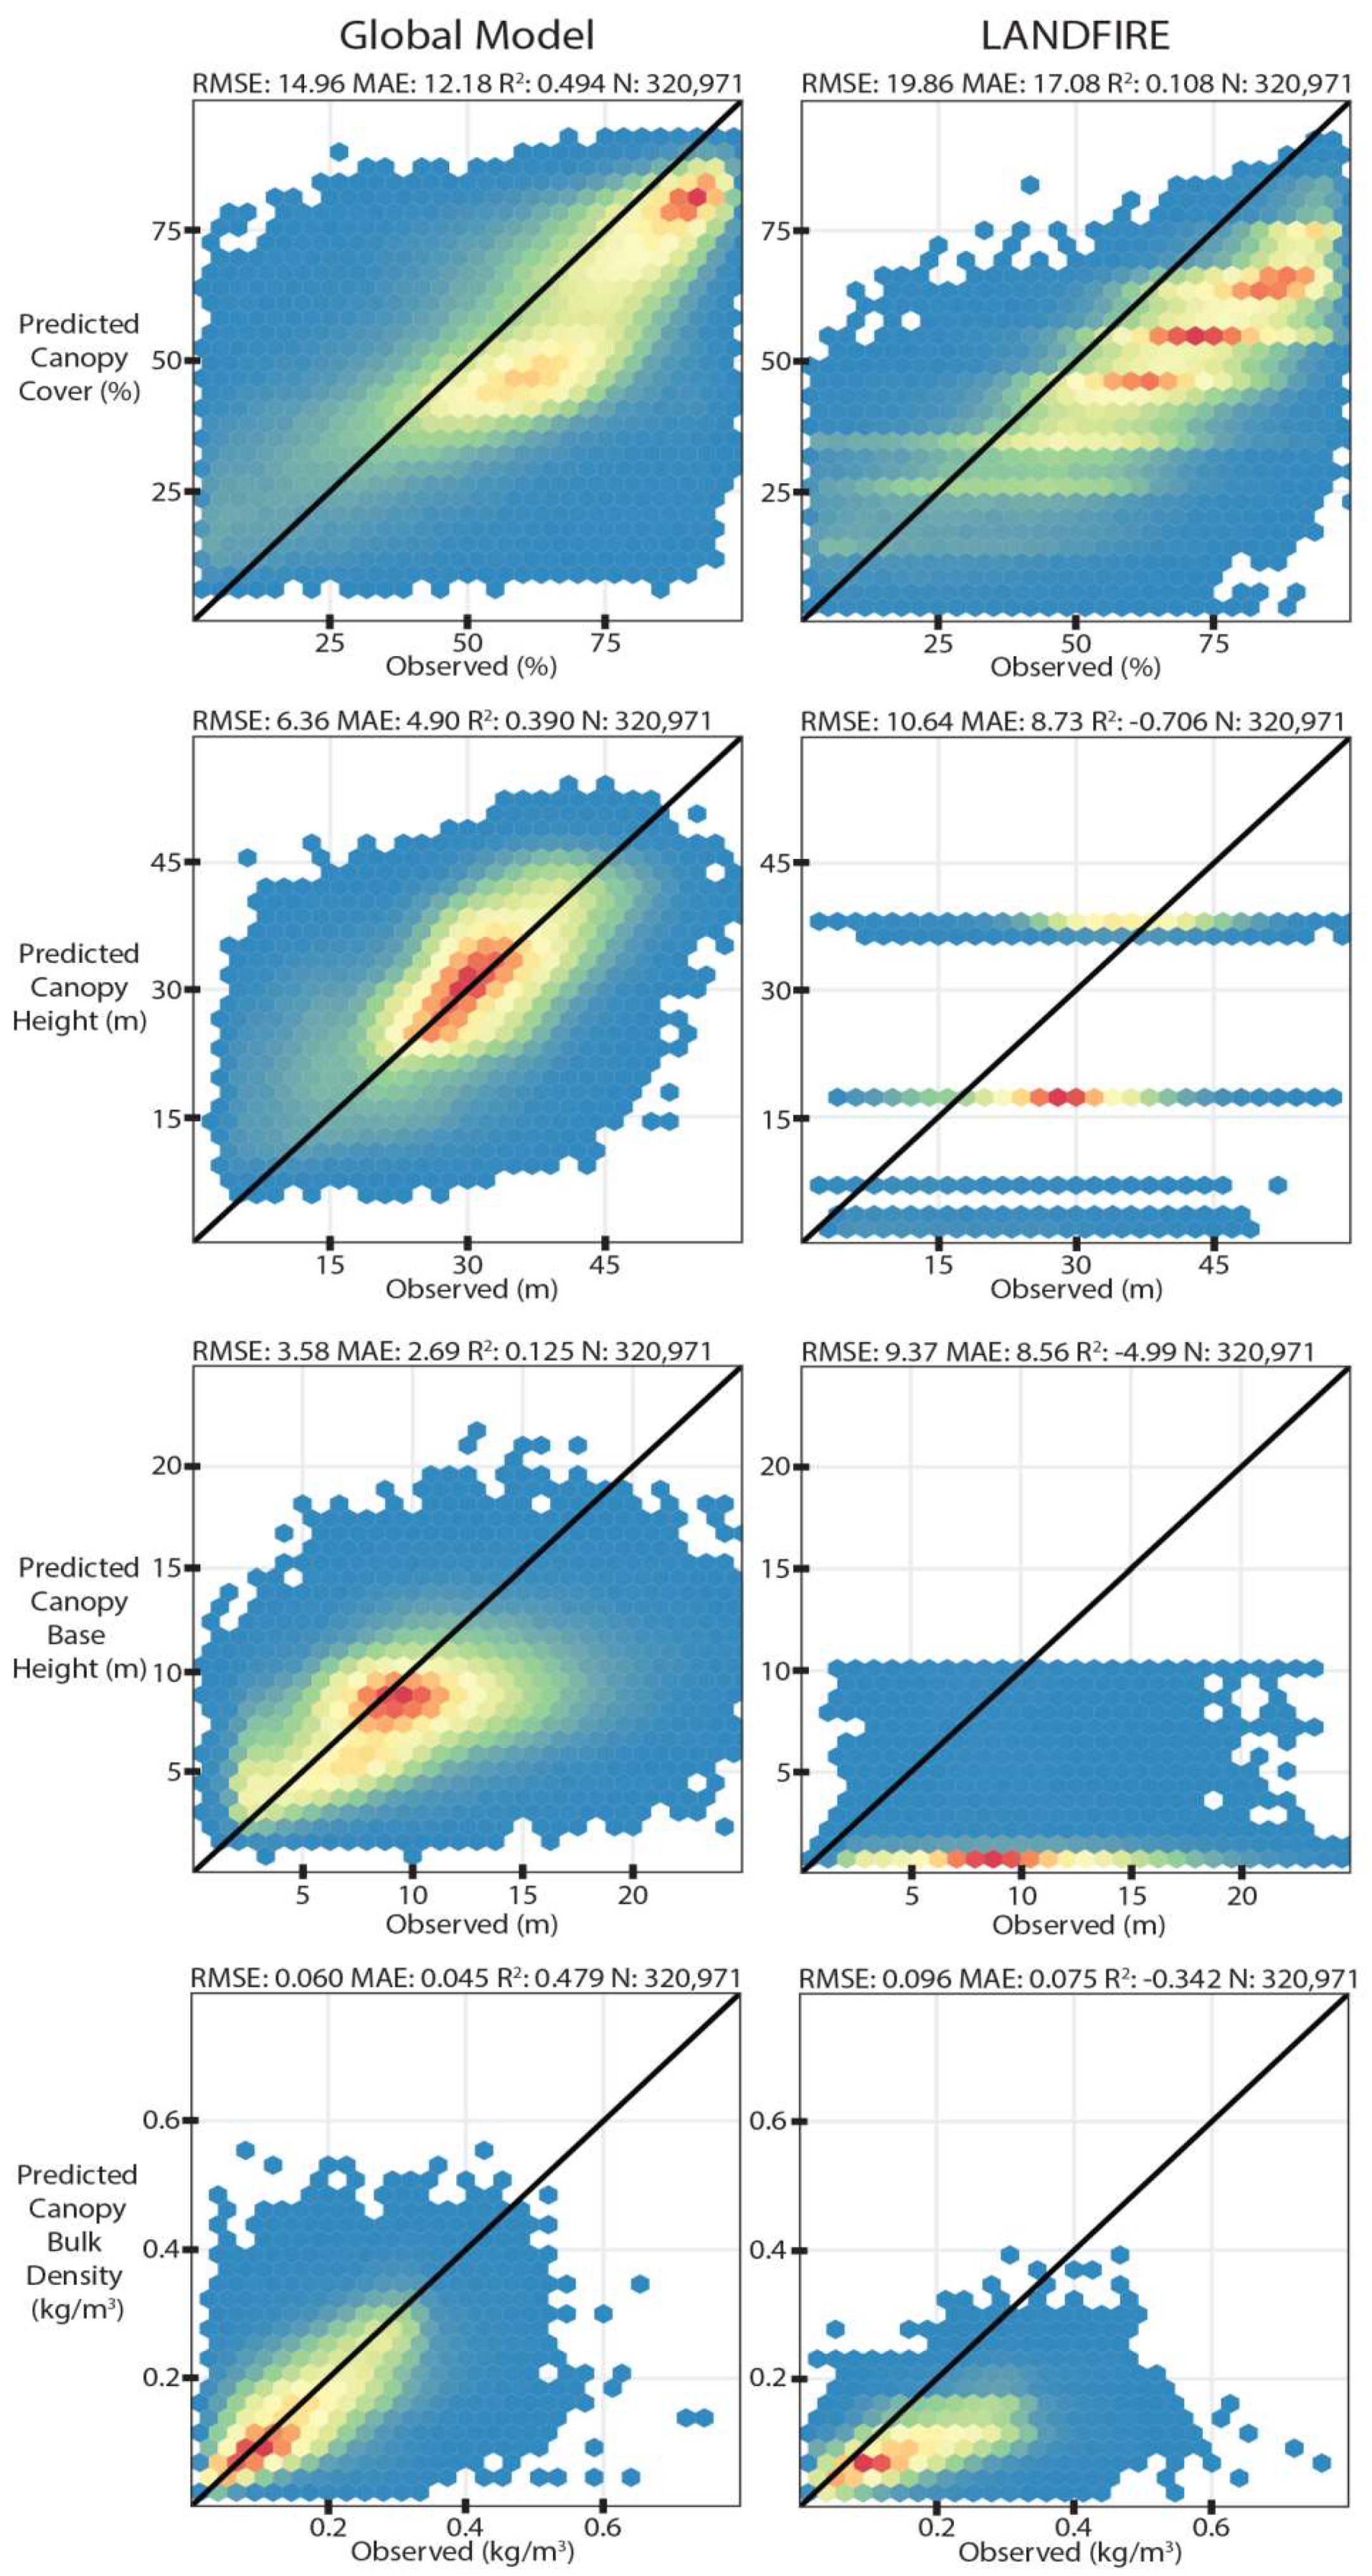
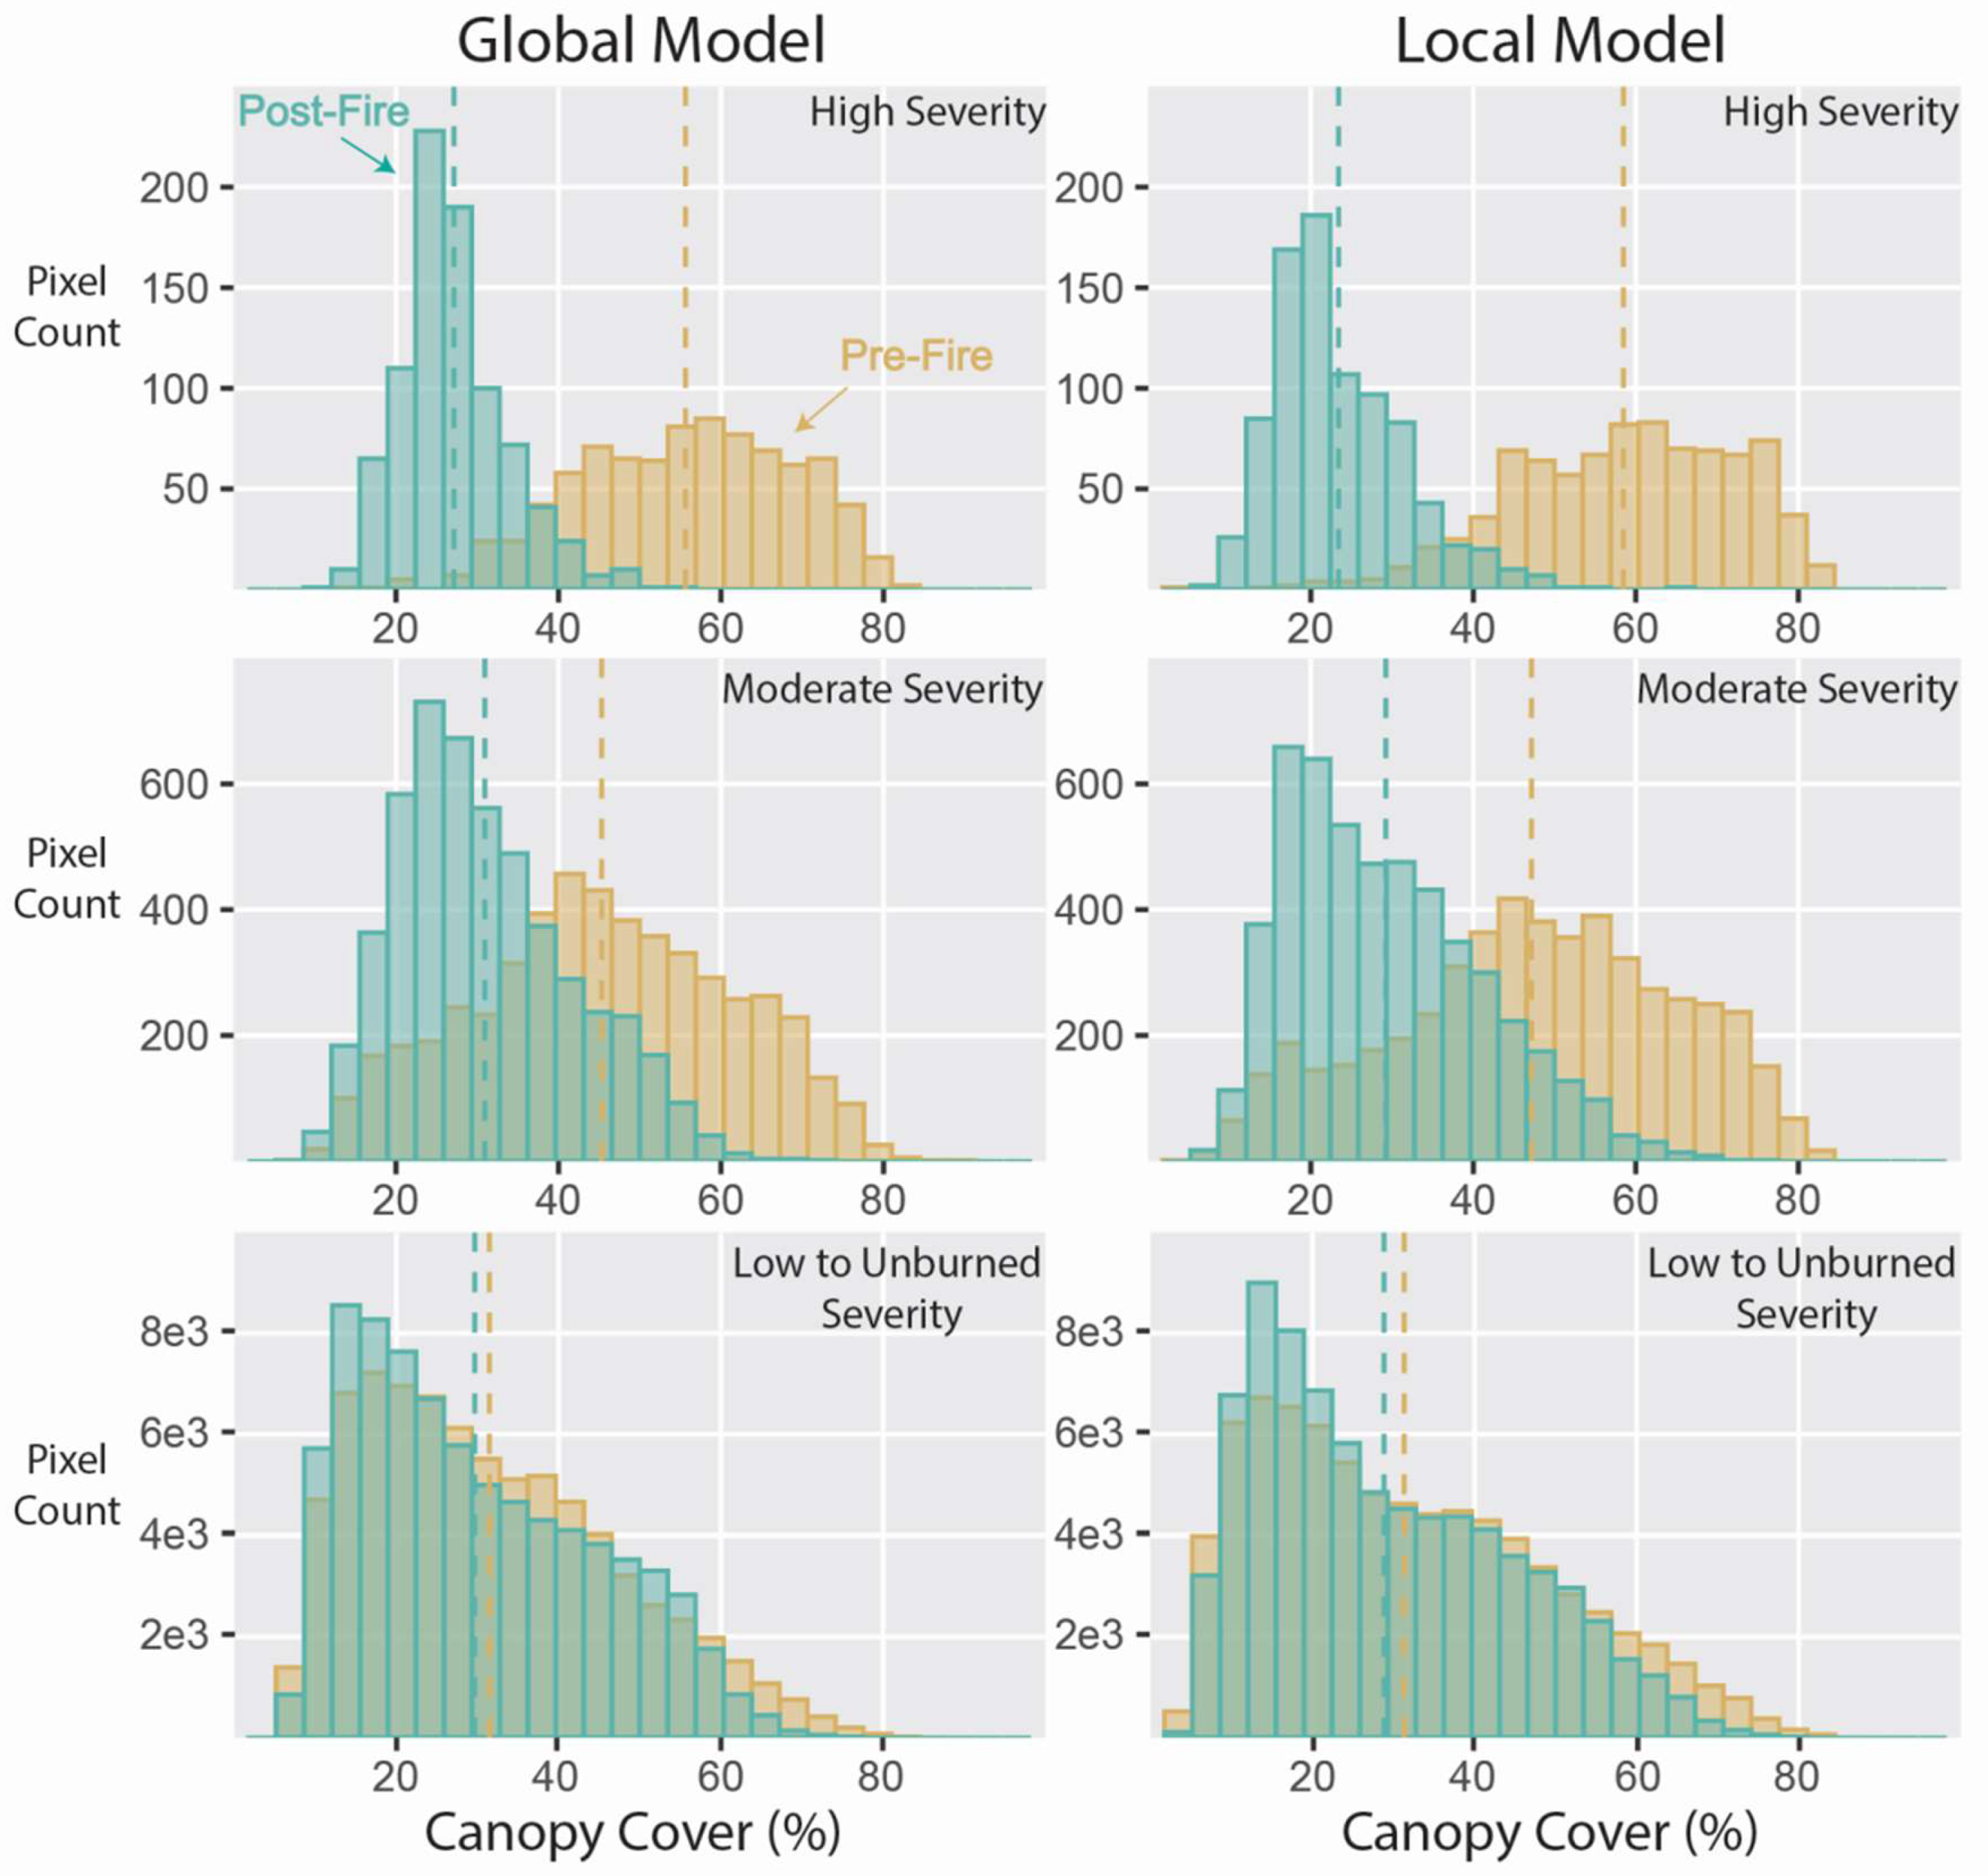
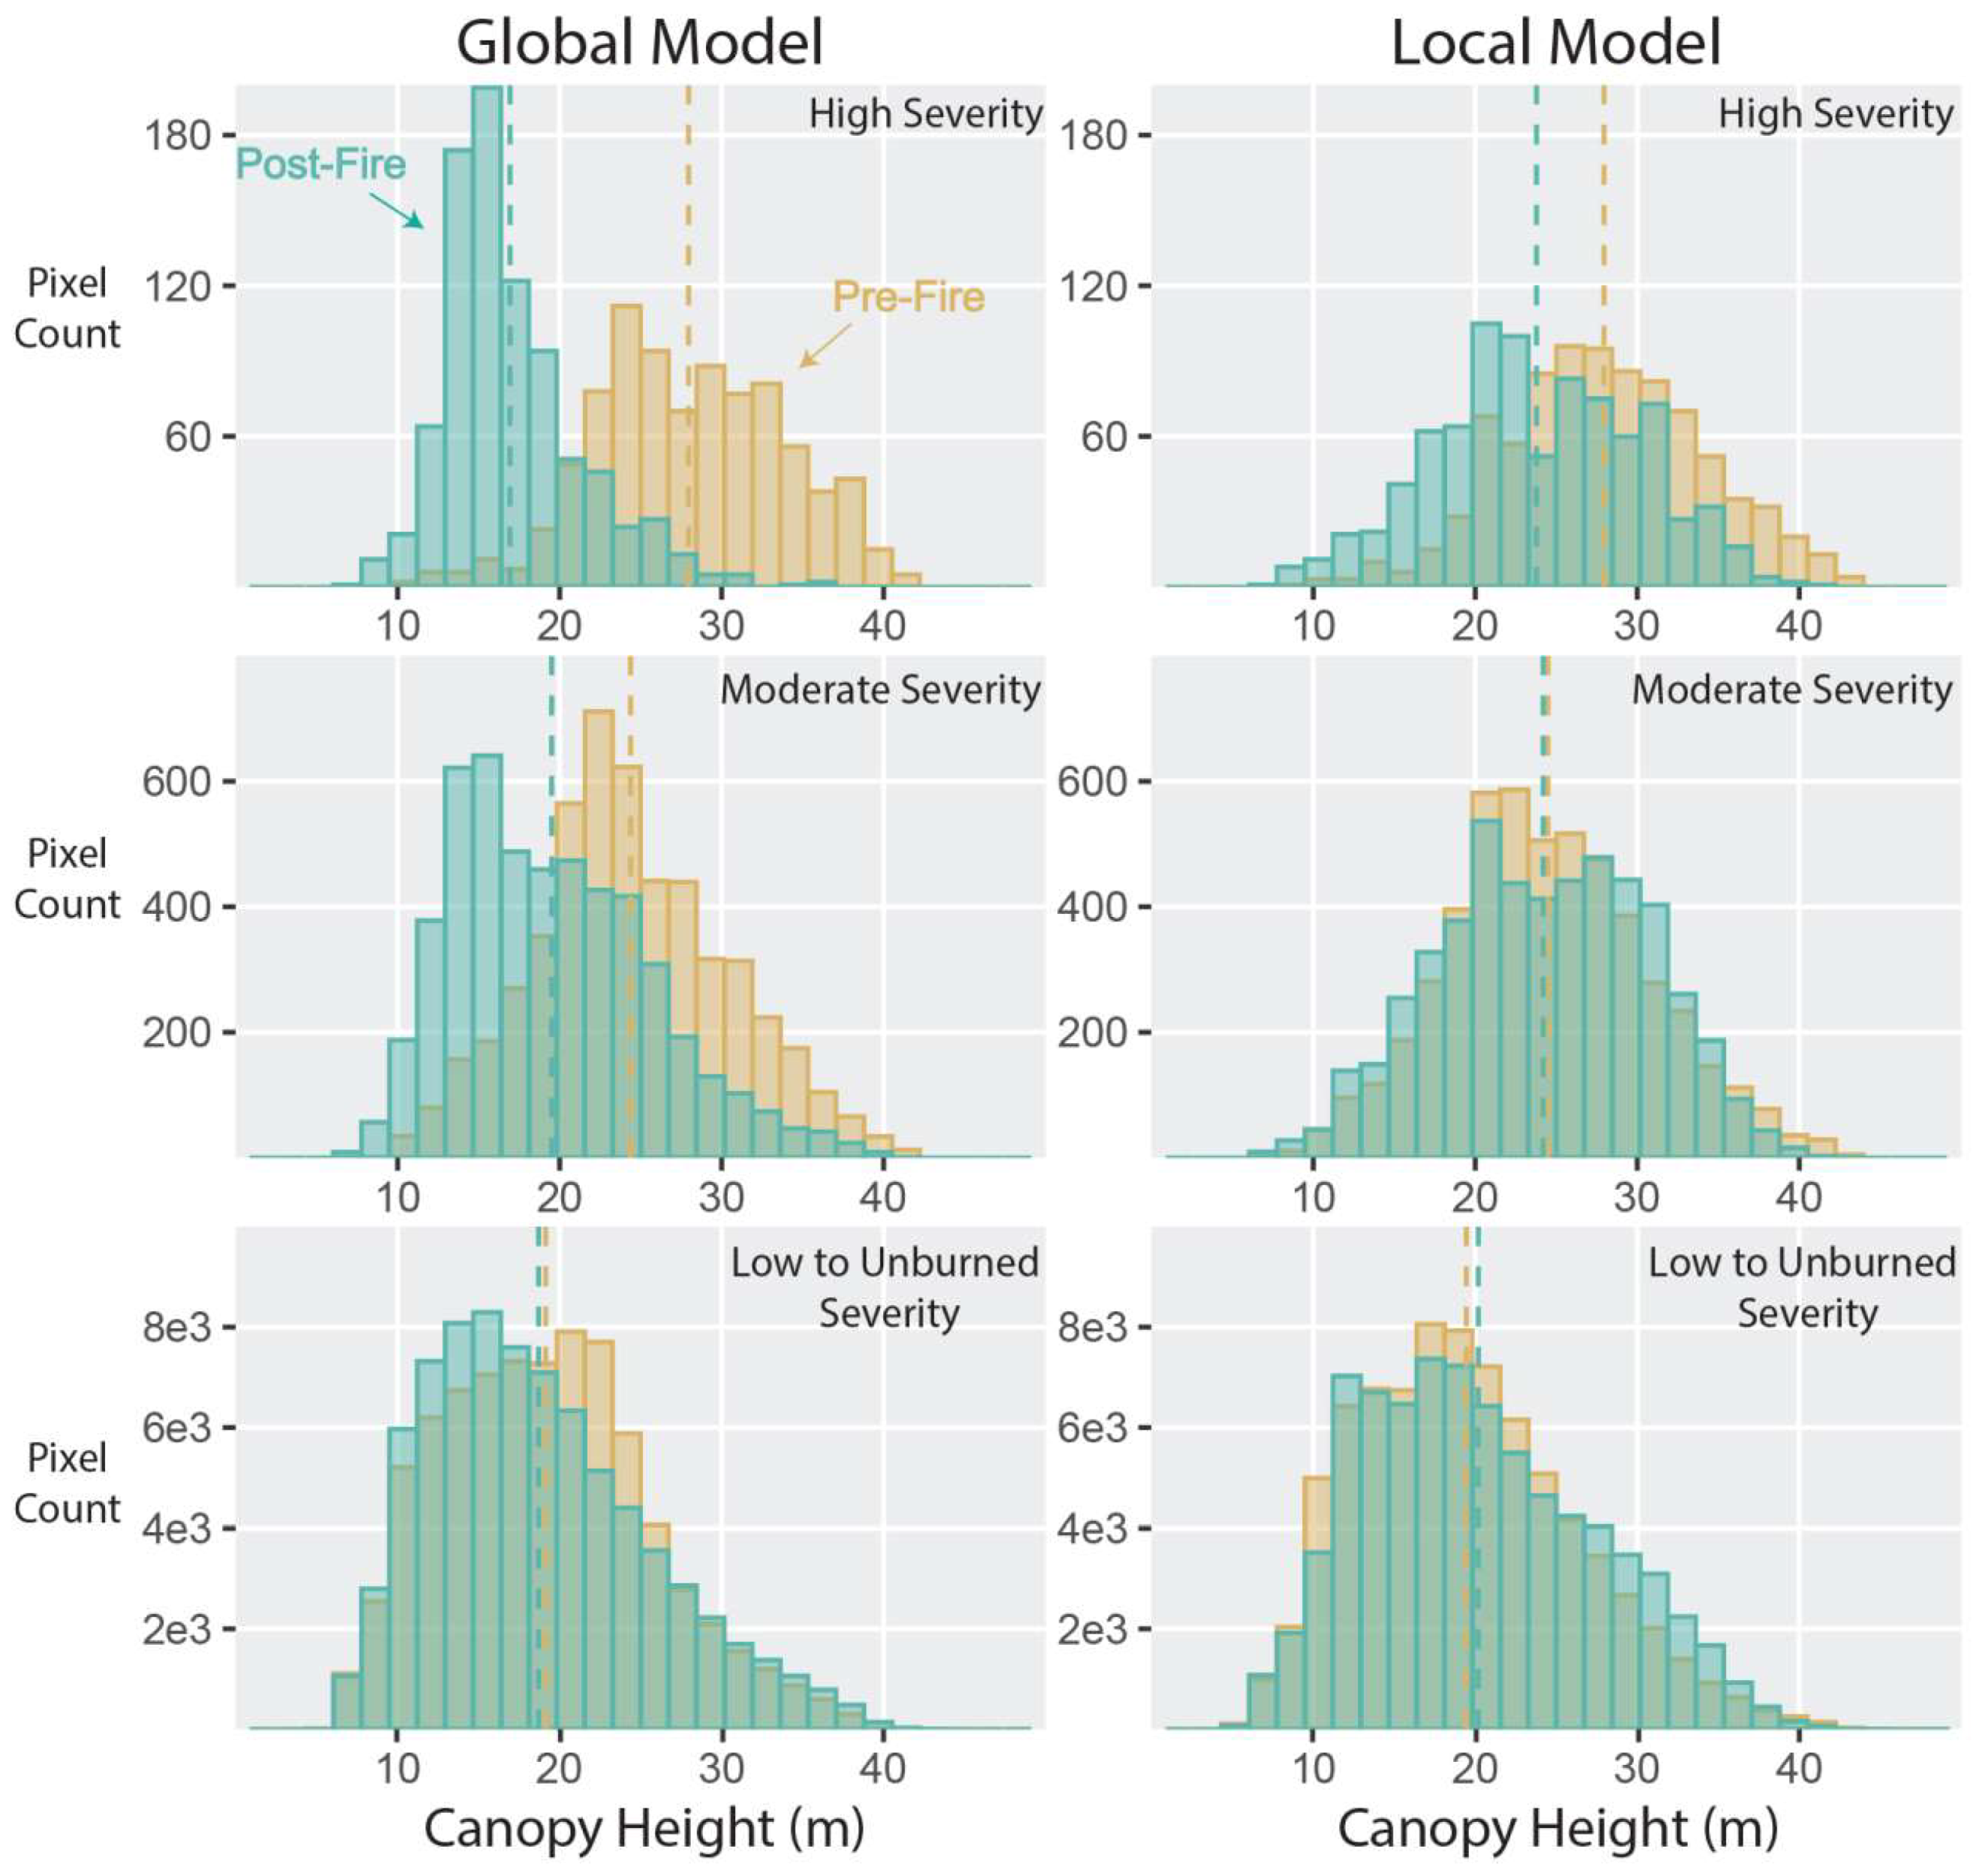
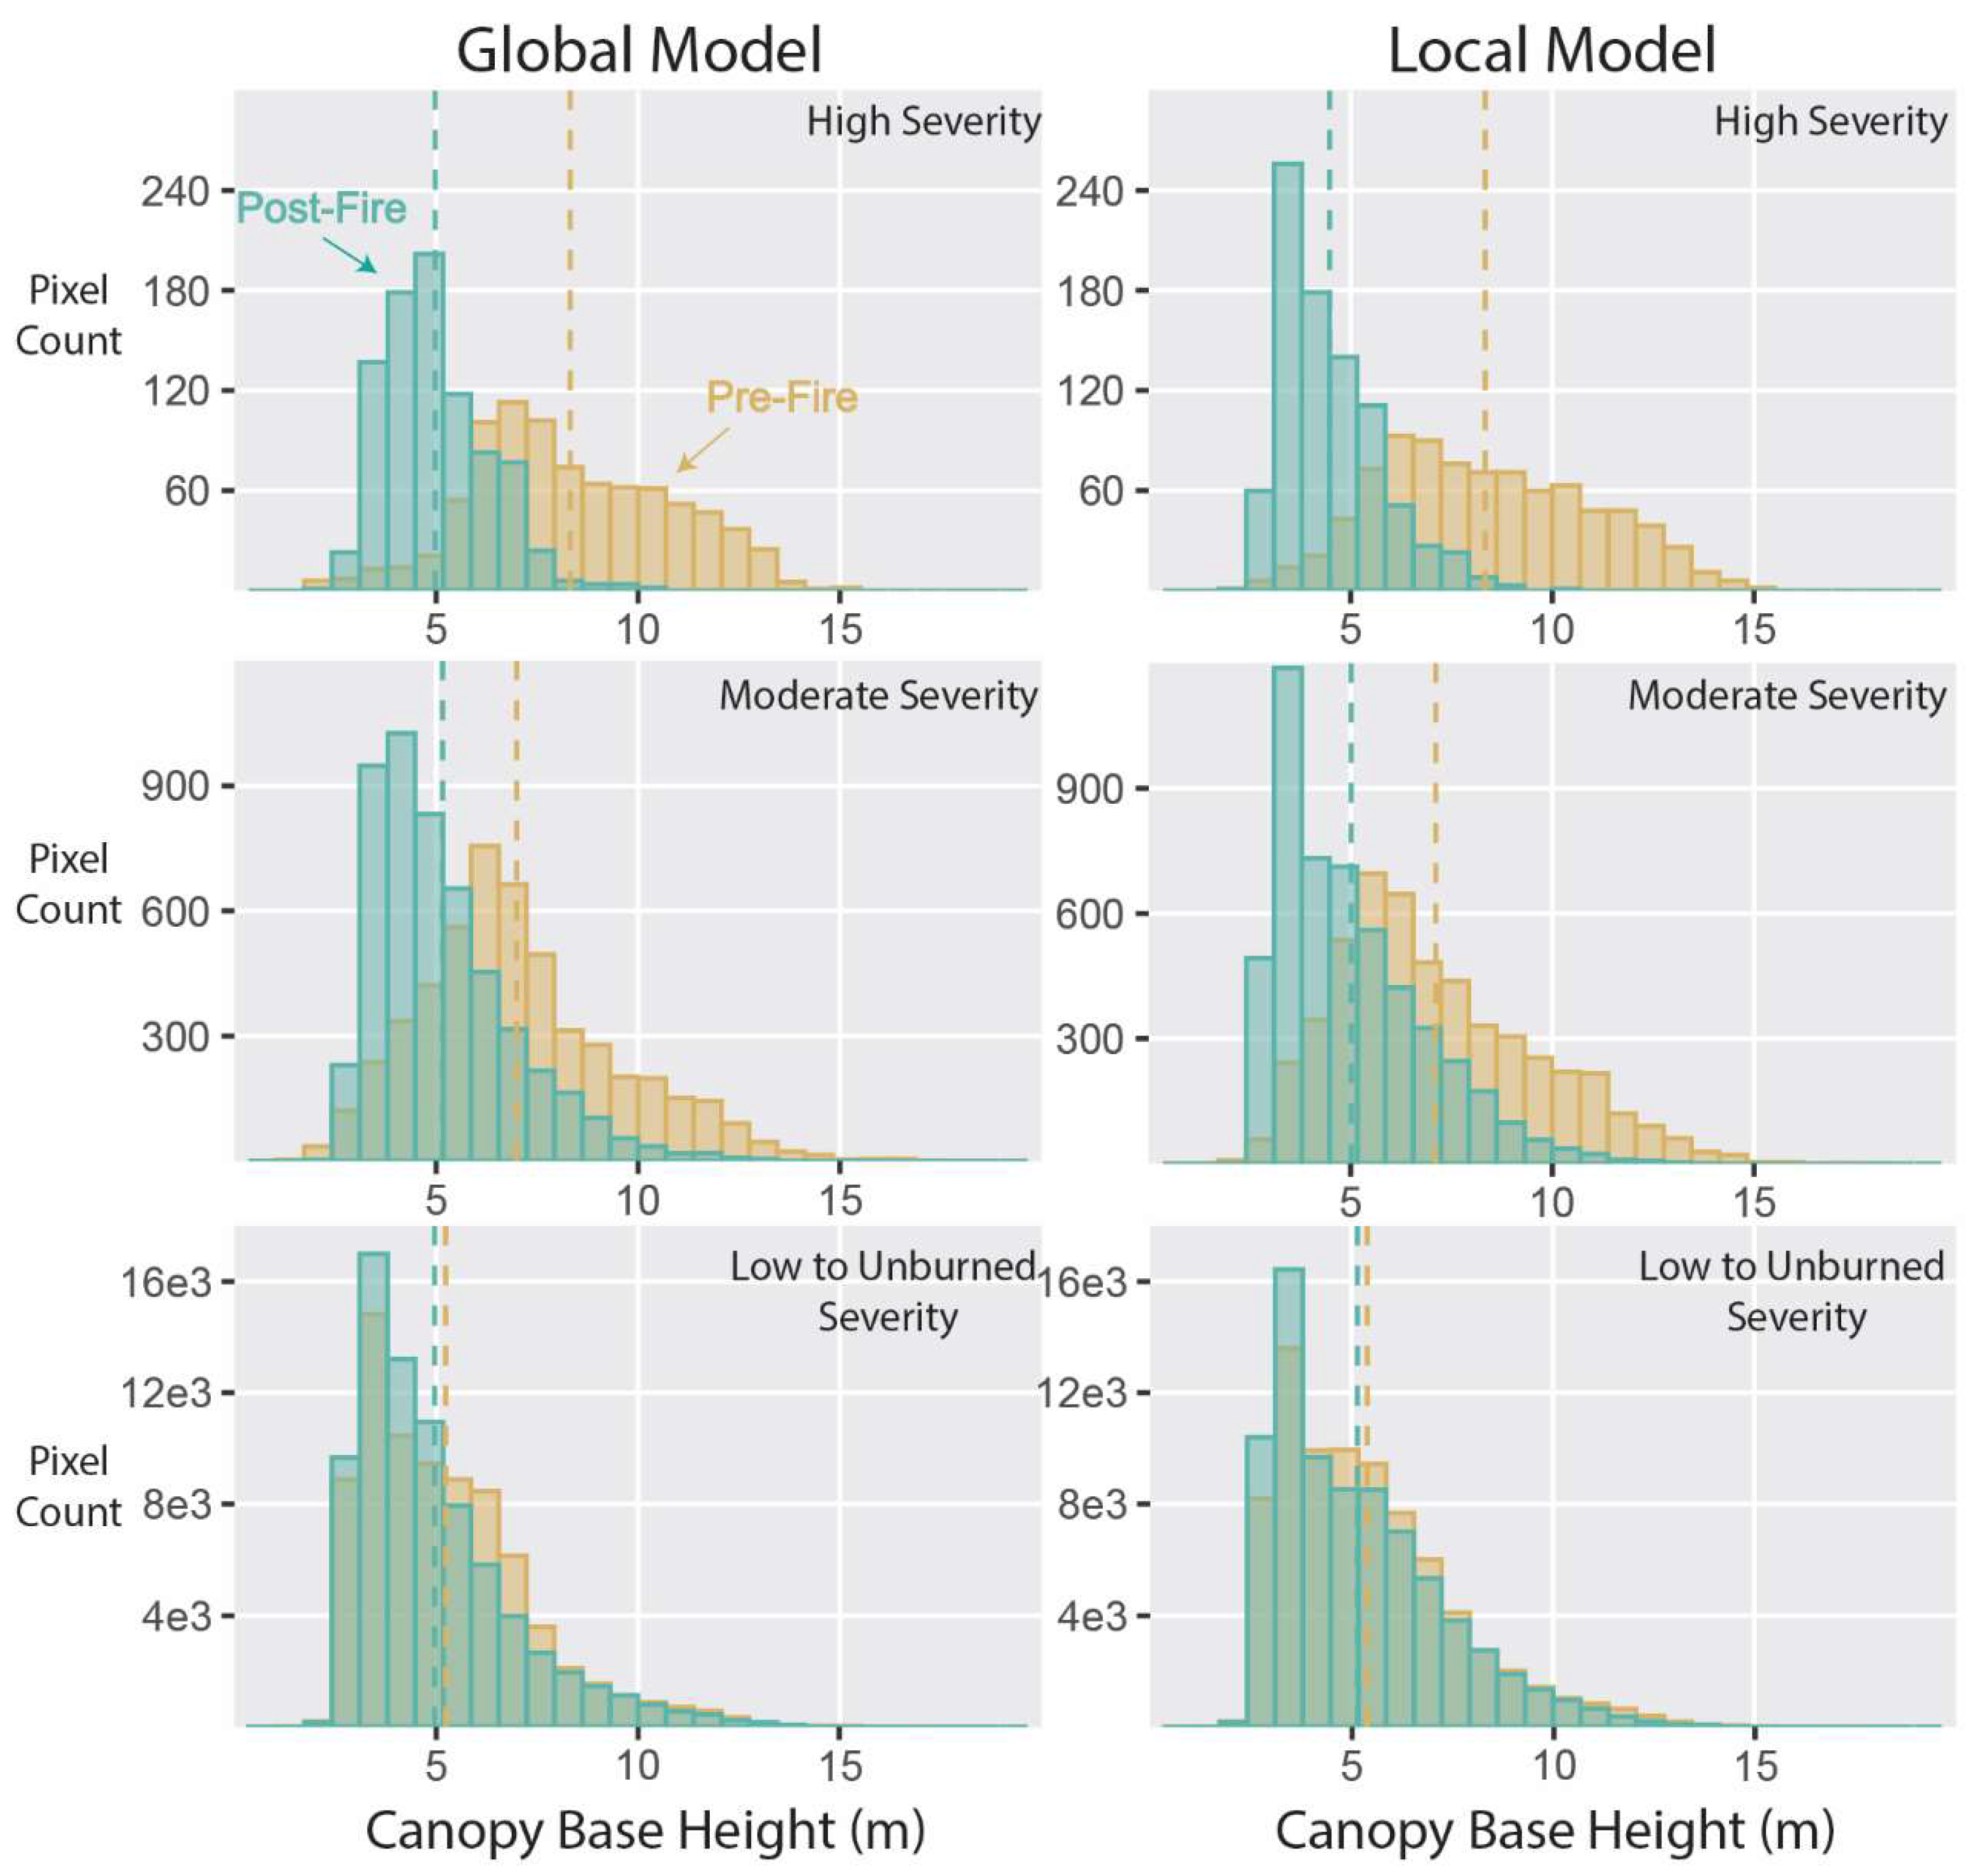
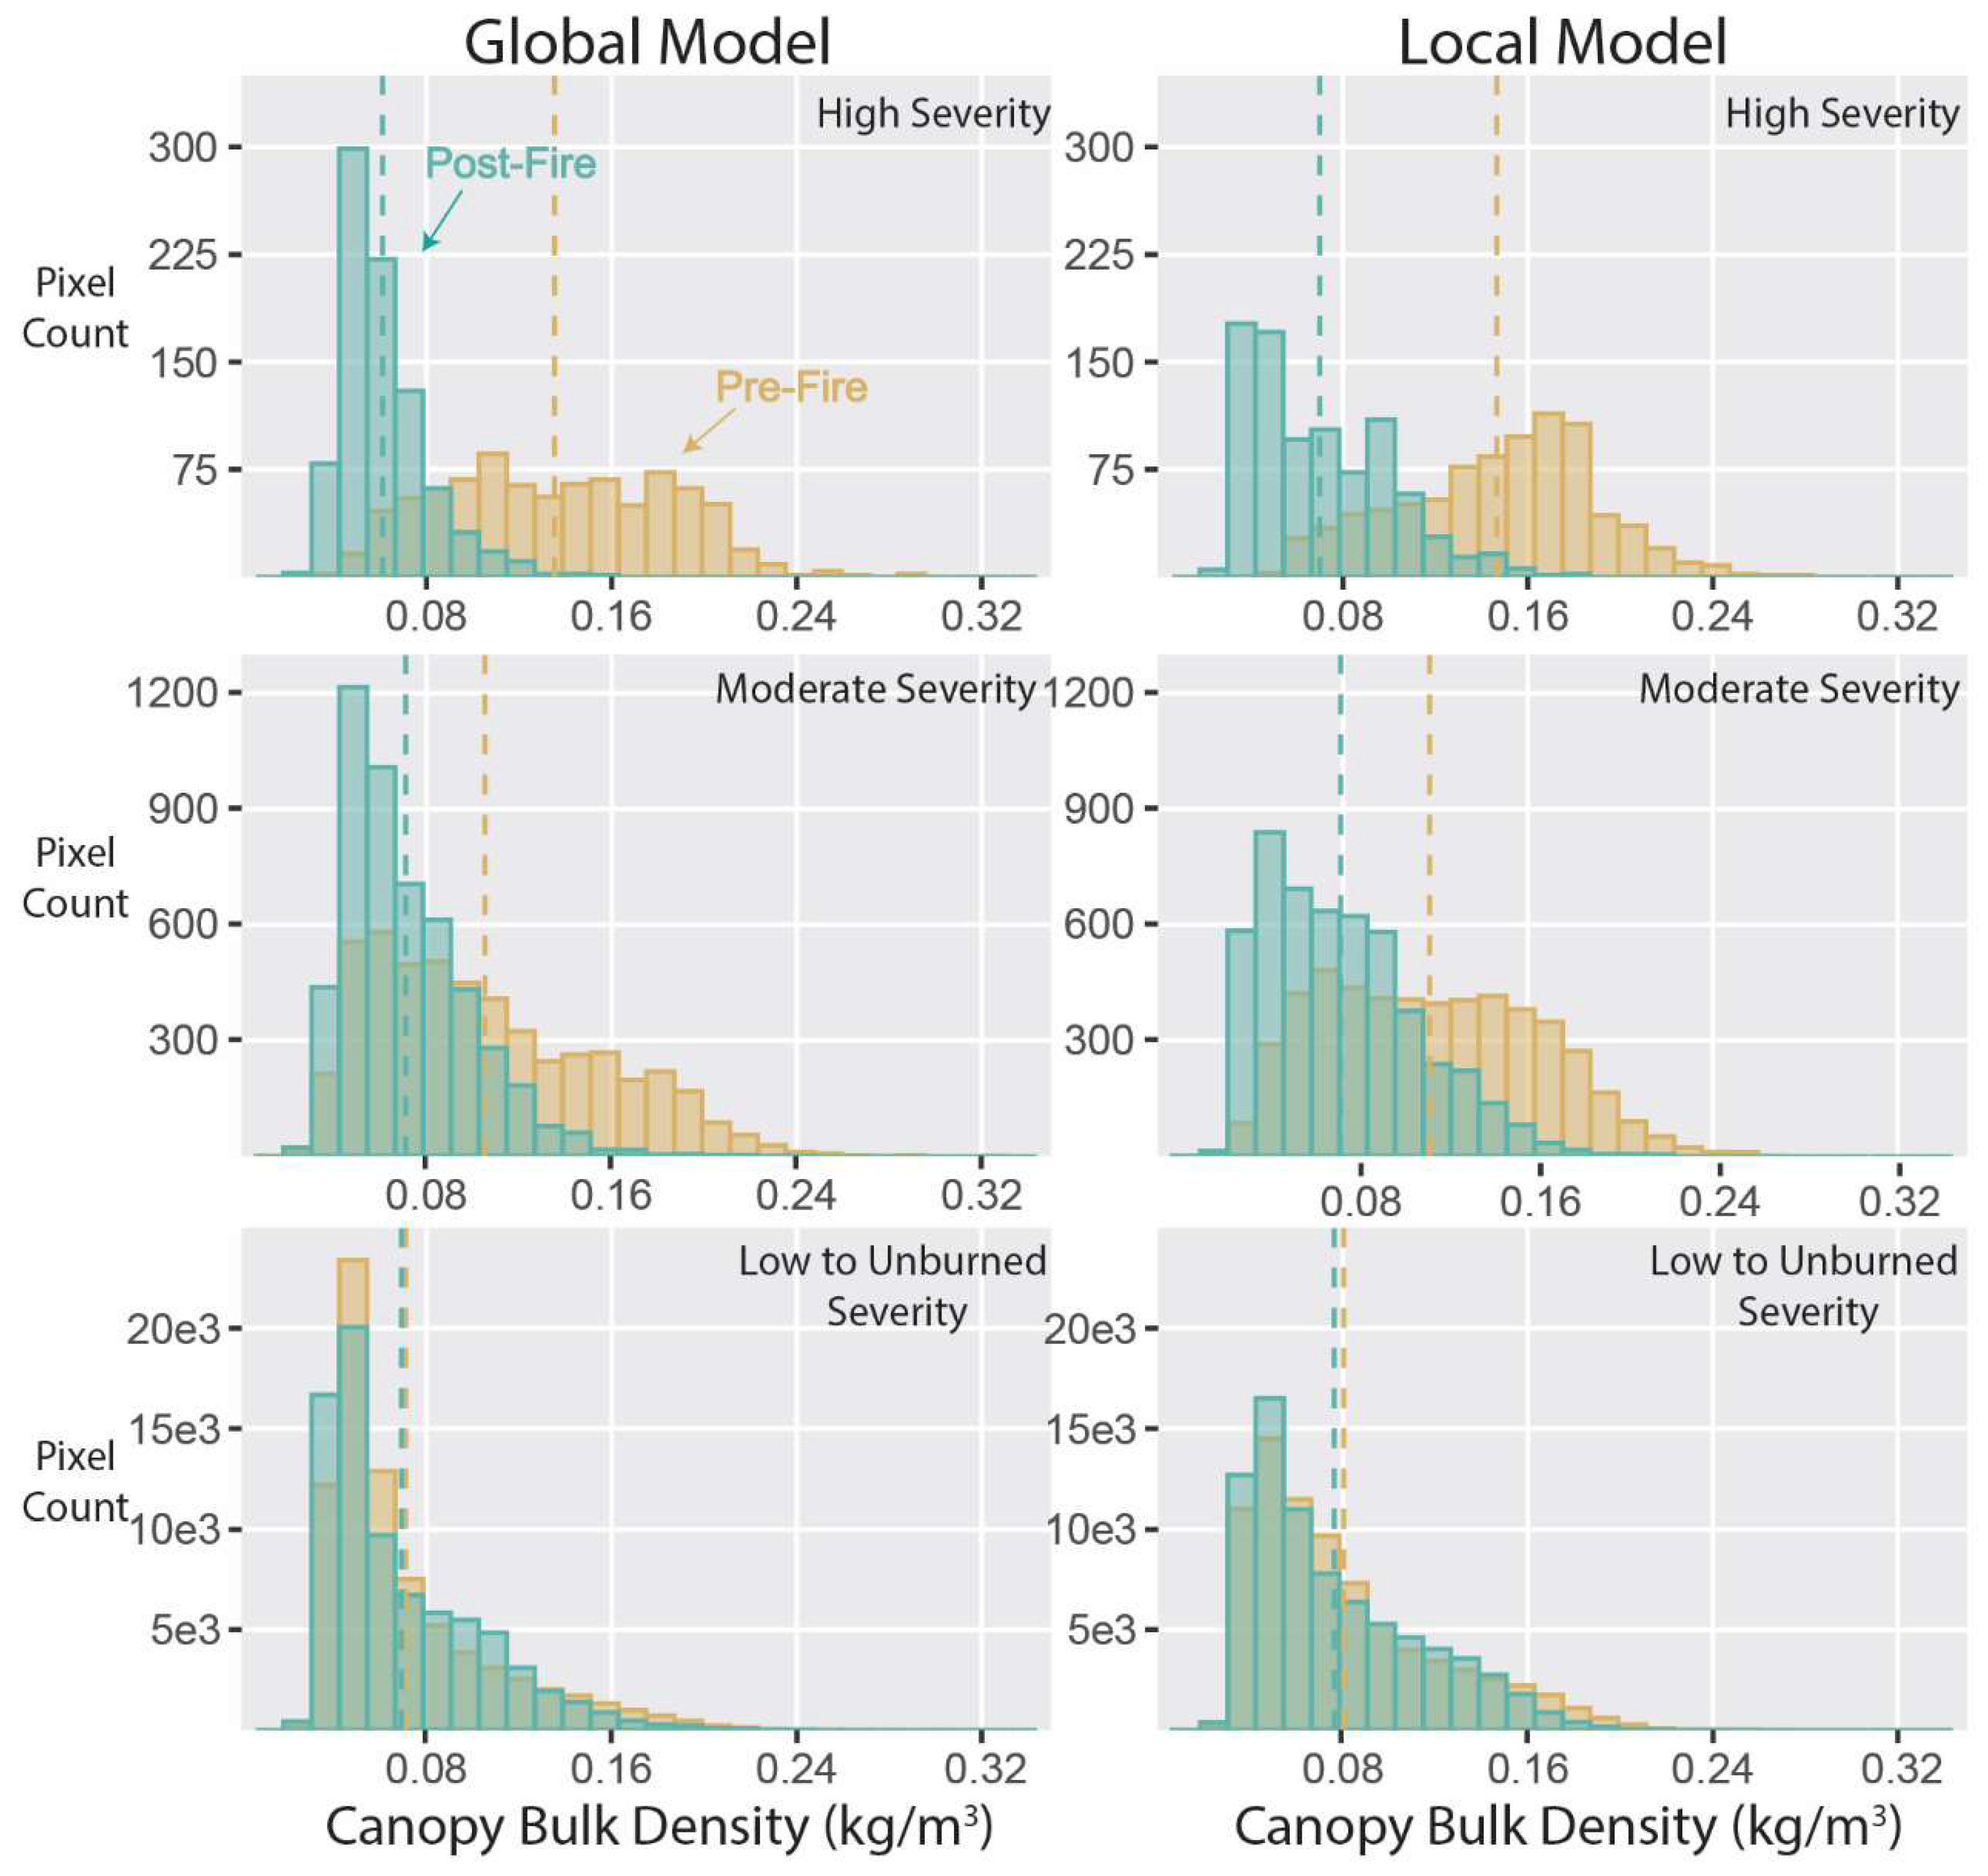
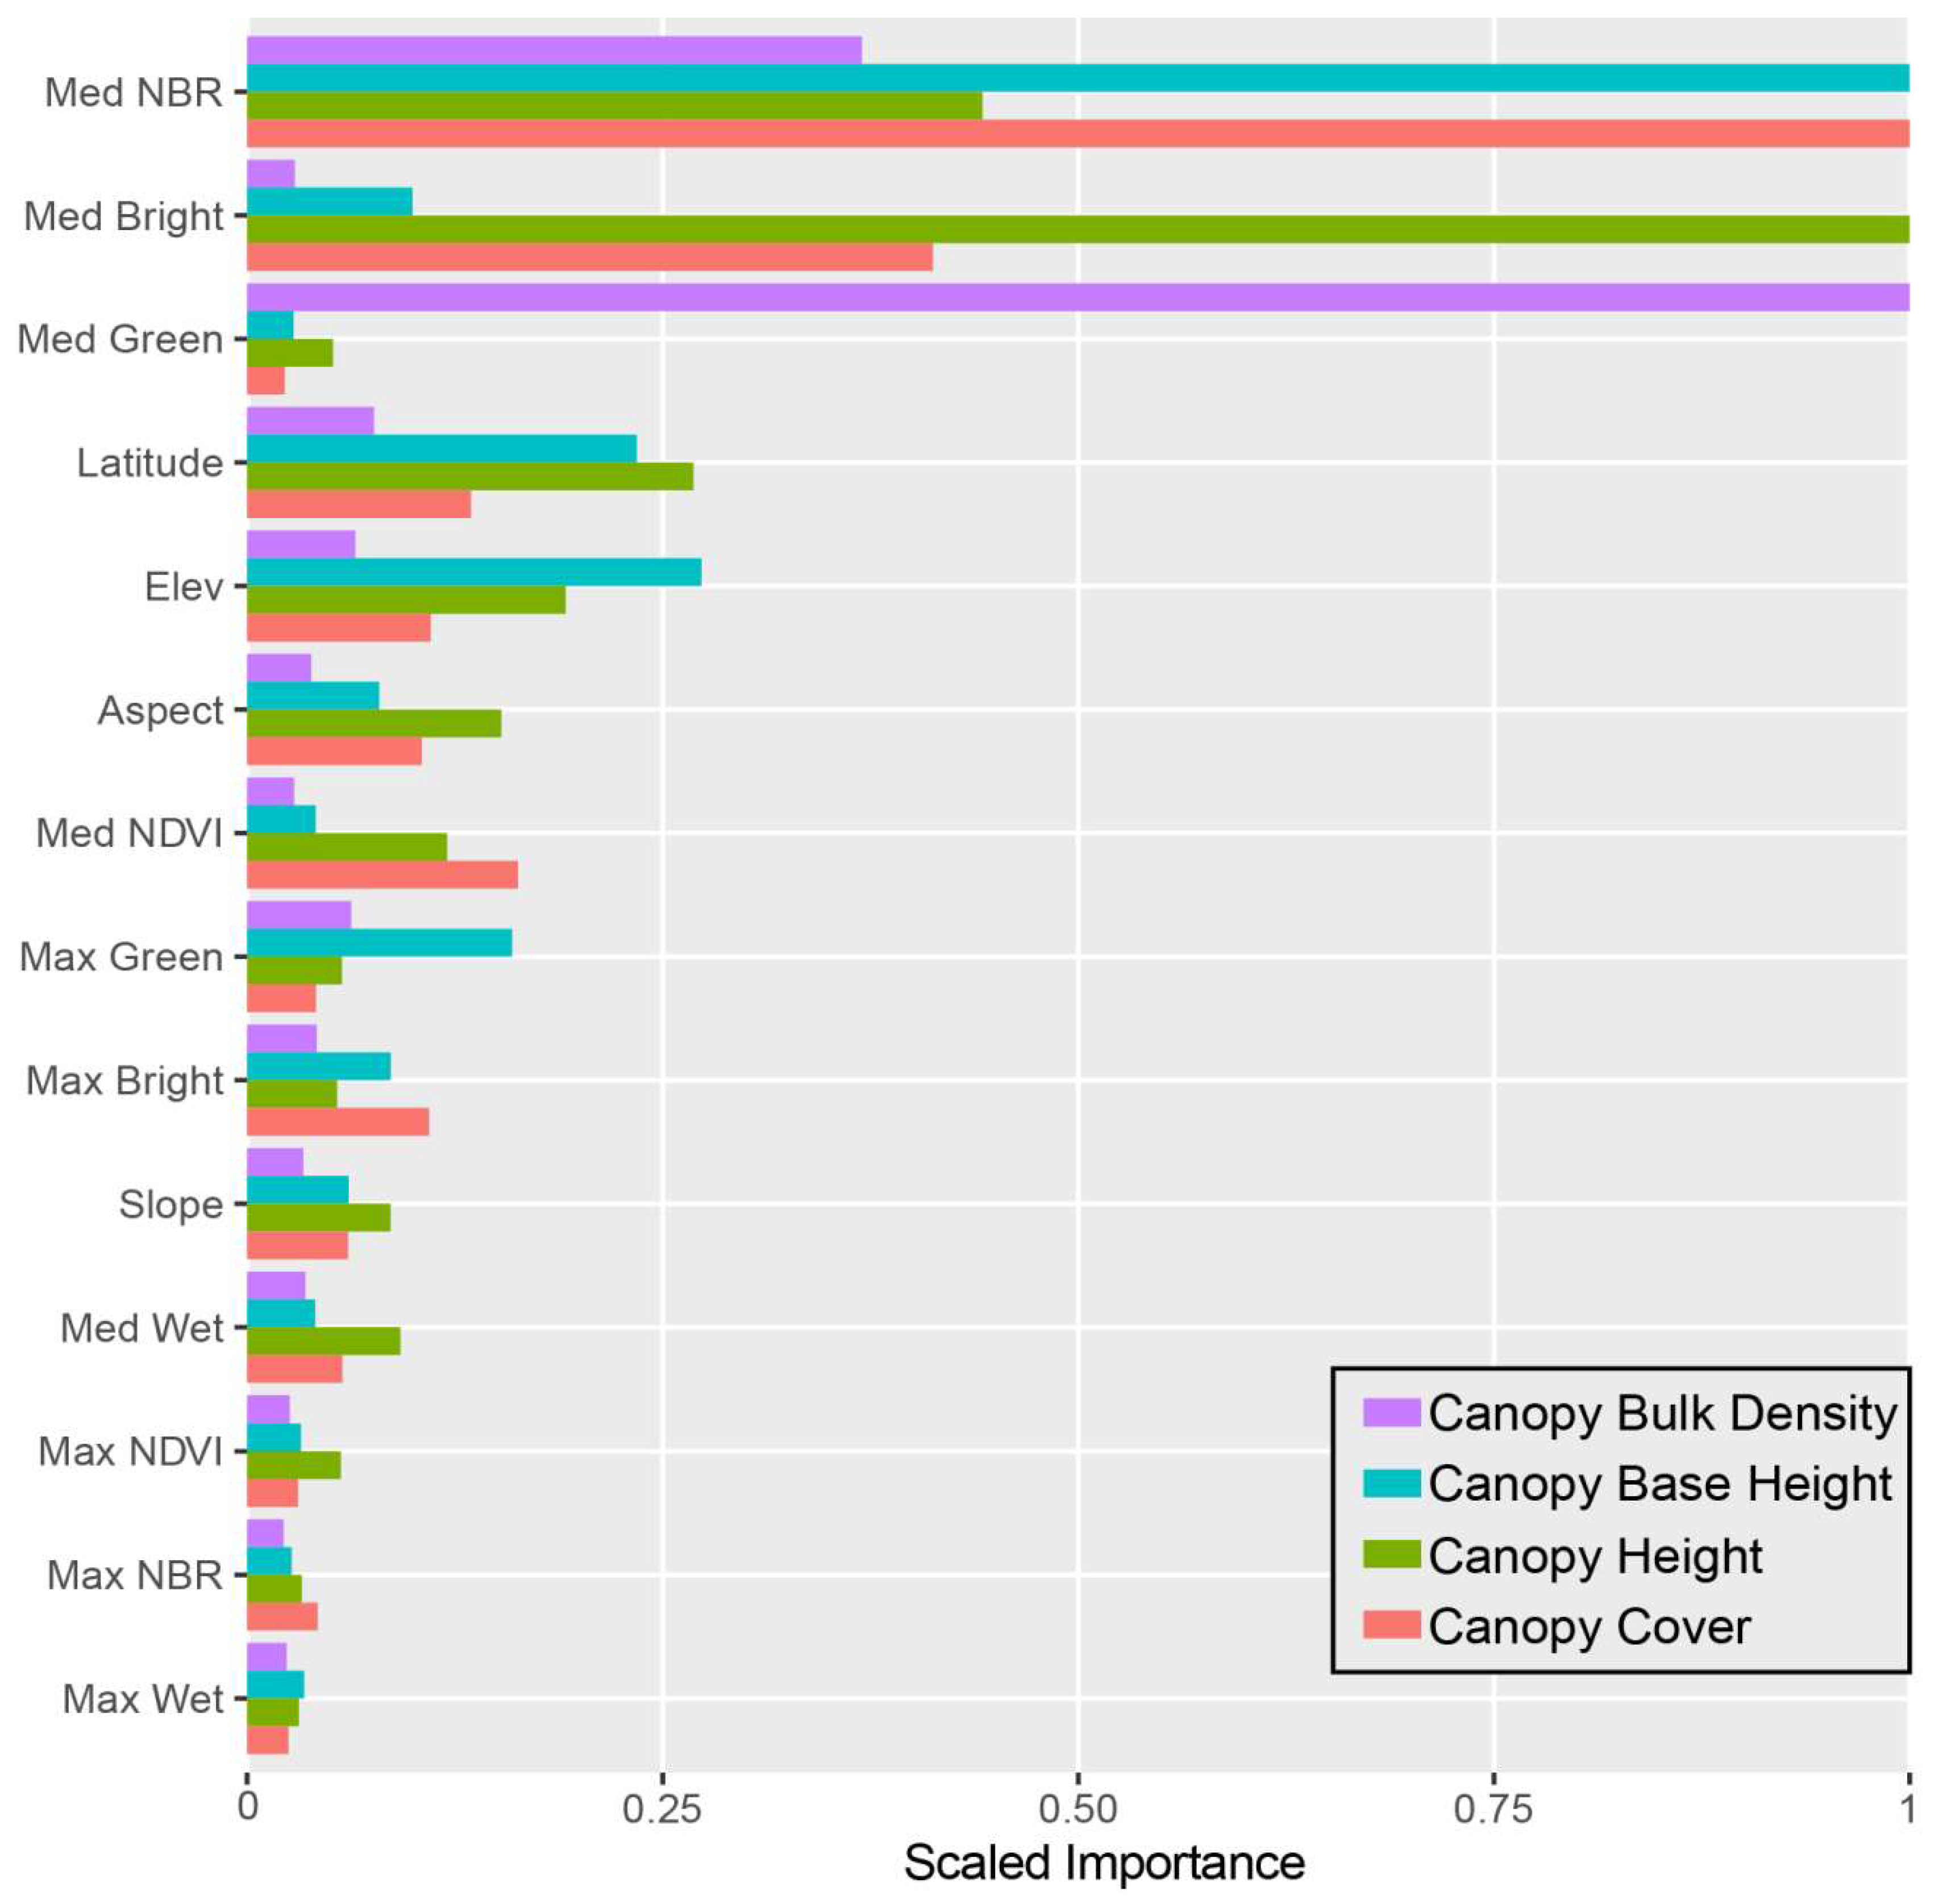
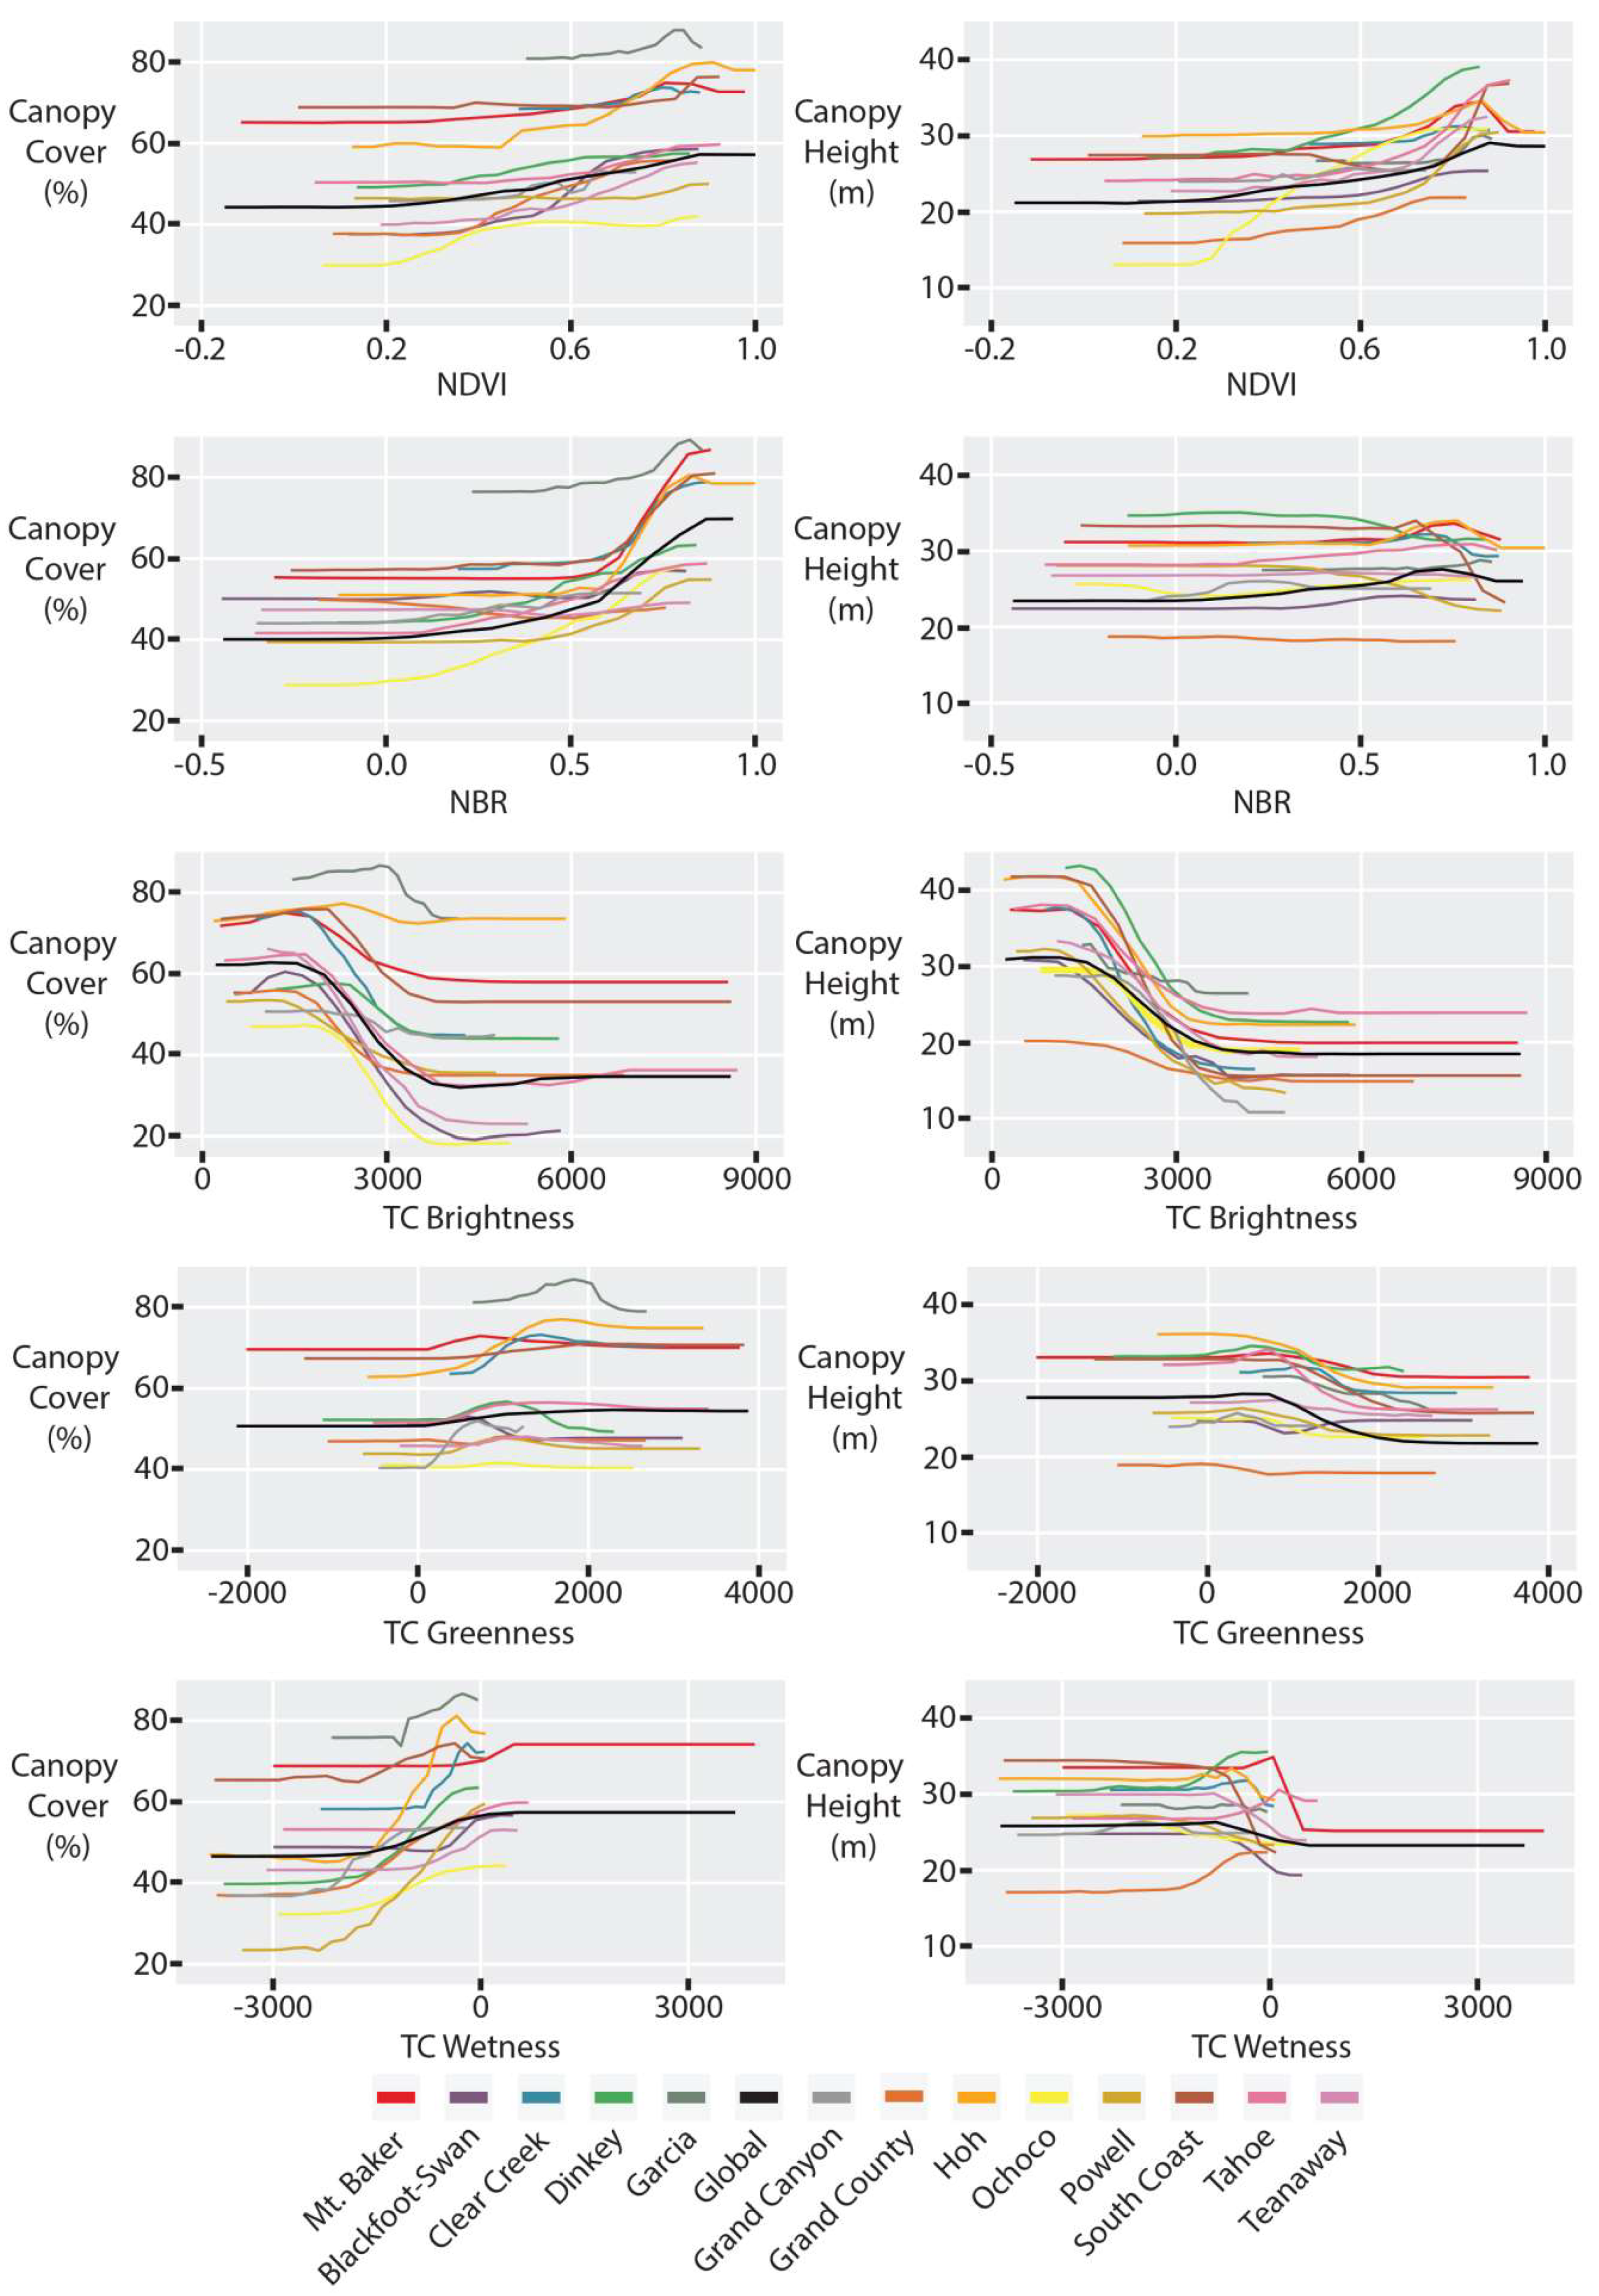
Comprehensive spatial coverage of forest canopy fuels is relied upon by fire management in the US to predict fire behavior, assess risk, and plan forest treatments. Here, a collection of light detection and ranging (LiDAR) datasets from the western US are fused with Landsat-derived spectral indices to map the canopy fuel attributes needed for wildfire predictions: canopy cover (CC), canopy height (CH), canopy base height (CBH), and canopy bulk density (CBD). A single, gradient boosting machine (GBM) model using data from all landscapes is able to characterize these relationships with only small reductions in model performance (mean 0.04 reduction in R²) compared to local GBM models trained on individual landscapes. Model evaluations on independent LiDAR datasets show the single global model outperforming local models (mean 0.24 increase in R²), indicating improved model generality. The global GBM model significantly improves performance over existing LANDFIRE canopy fuels data products (R² ranging from 0.15 to 0.61 vs. −3.94 to −0.374). The ability to automatically update canopy fuels following wildfire disturbance is also evaluated, and results show intuitive reductions in canopy fuels for high and moderate fire severity classes and little to no change for unburned to low fire severity classes. Improved canopy fuel mapping and the ability to apply the same predictive model on an annual basis enhances forest, fuel, and fire management.
Keywords: LiDAR; ALS; Landsat; canopy fuel mapping; canopy cover; canopy height; canopy bulk density; canopy base height; gradient boosting machine LiDAR; ALS; Landsat; canopy fuel mapping; canopy cover; canopy height; canopy bulk density; canopy base height; gradient boosting machine
Graphical Abstract