Abstract
Citrus greening is a severe disease significantly affecting citrus production in the United States because the disease is not curable with currently available technologies. For this reason, monitoring citrus disease in orchards is critical to eradicate and replace infected trees before the spread of the disease. In this study, the canopy shape and vegetation indices of infected and healthy orange trees were compared to better understand their significant characteristics using unmanned aerial vehicle (UAV)-based multispectral images. Individual citrus trees were identified using thresholding and morphological filtering. The UAV-based phenotypes of each tree, such as tree height, crown diameter, and canopy volume, were calculated and evaluated with the corresponding ground measurements. The vegetation indices of infected and healthy trees were also compared to investigate their spectral differences. The results showed that correlation coefficients of tree height and crown diameter between the UAV-based and ground measurements were 0.7 and 0.8, respectively. The UAV-based canopy volume was also highly correlated with the ground measurements (R2 > 0.9). Four vegetation indices—normalized difference vegetation index (NDVI), normalized difference RedEdge index (NDRE), modified soil adjusted vegetation index (MSAVI), and chlorophyll index (CI)—were significantly higher in healthy trees than diseased trees. The RedEdge-related vegetation indices showed more capability for citrus disease monitoring. Additionally, the experimental results showed that the UAV-based flush ratio and canopy volume can be valuable indicators to differentiate trees with citrus greening disease.
1. Introduction
Citrus production, including of oranges, tangerines/mandarins, grapefruits, and lemons/limes, fell during 2019/2020 due to unfavorable weather, water stress, and global disease [1]. In particular, orange production in the United States is estimated to fall by five percent from the previous year. In Florida, orange production has been trending down for a number of years due to citrus greening disease; production is less than one-third of its level 20 years ago [1]. Citrus greening disease, also known as Huanglongbing (HLB), is one of the most destructive and severe diseases in citrus trees globally. Citrus greening disease is caused by the bacterium Candidatus liberibacter, which is transmitted by insect vectors known as psyllids in various climates [2,3].
Citrus greening disease affects tree health, fruit development, and the ripening and quality of products such as citrus fruits and juice [4]. To avoid this potential threat, various management strategies, such as chemical/biological vector population control, increasing plant resistance, thermotherapy for graft wood, antibiotics, nutrient enhancement, and genetic manipulation for resistance, have been required [5]. Because there is currently no cure for citrus greening disease, it is critical to rapidly remove infected trees to prevent further spread of the disease. In particular, young trees showing symptoms should be eradicated and replaced [6]. For infected citrus-producing areas, early and accurate diagnosis of the disease is crucial [7].
In previous studies, remote sensing images with high spatial resolution from high altitude airborne and spaceborne platforms have been used to delineate individual trees and extract information at the individual tree level. A plot-based approach was proposed to detect individual citrus trees from high spatial resolution aerial images and estimate the canopy cover, number of trees, and planting patterns [8]. Ozdarici-Ok [9] adopted an object-based hierarchical operation and spectral information to delineate citrus trees from GeoEye-1 satellite images, and Vahidi et al. [10] used a template matching-based approach in urban orchards. Airborne light detection and ranging (LiDAR) data were also employed to obtain three-dimensional information to estimate tree parameters in orchards. Individual trees were delineated from the canopy structure and their attributes were estimated, including height, crown diameter, and volume [11,12]. In addition, it was shown that terrestrial LiDAR can be used to quantify the structural complexity of orchard trees for informing orchard management [13].
Although conventional remote sensing data have shown good performance in orchards, state-of-the-art sensors and unmanned aerial vehicle (UAV) technologies, also known as unmanned aircraft systems (UASs) or drones, can provide finer spatiotemporal resolution data. UAV cameras adopting solar or illumination sensors can be radiometrically calibrated without additional equipment and field surveying. Therefore, UAV data make it possible to delineate individual trees and estimate tree attributes more accurately and effectively. The ability of a helicopter-based UAV equipped with thermal and multispectral sensors was demonstrated to generate quantitative remote sensing products in peach orchards [14,15]. Tree structural properties and conditions, such as tree crown, height, and vegetation indices (VIs), were measured using UAV-based multispectral images [16,17]. Sarron et al. [18] also adopted UAV images to extract the tree structure and generate a yield map for a mango orchard. For a citrus orchard, individual trees were detected using a morphology-based approach from a UAV-based digital surface model (DSM) [19], and an artificial intelligence (AI) algorithm was adopted for UAV-based high-throughput phenotyping [20]. UAV-based RGB images and hyperspectral data were also used to quantify citrus tree health affected by disease [21,22].
To address the challenge of citrus disease monitoring and develop an advanced method, the traits that allow discrimination between healthy and diseased trees must be examined. Therefore, the main objective of this study was to: (1) utilize UAV-based aerial mapping platforms to collect fine-resolution remote sensing imagery; (2) extract phenotypic data of individual citrus trees from UAV data; and (3) better understand the structural and spectral characteristics of citrus disease with higher accuracy and efficiency for citrus greening disease monitoring. Figure 1 shows the overall workflow employed to estimate and compare tree phenotypes from UAV imagery. High-quality multispectral imagery using a UAV platform was collected and processed to generate radiometrically calibrated orthomosaic images and an elevation model. After detecting individual trees, the canopy shapes and VIs of healthy and infested groups were compared.
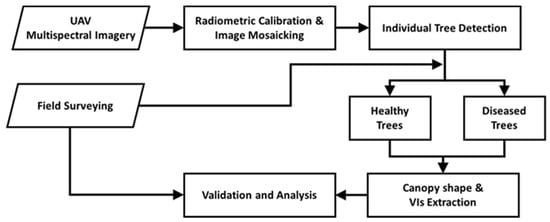
Figure 1.
Citrus tree characterization procedure from unmanned aerial vehicle (UAV)-based multispectral imagery.
2. Materials and Methods
2.1. Study Area and Field Measurements
The study area is located in Hendry County, Florida, USA. The orchard contains 1440 Hamlin citrus trees planted in 2016 and surrounded by sentinel trees. There are 10 rows (reps), and each row consists of 9 blocks of 16 trees. This site has been managed by a citrus company with a well-distributed irrigation system. Because the study site was under an experiment related to citrus greening disease, 9 treatments were randomly distributed throughout the blocks to find the most effective option.
Six trees in the middle of each block (for a total of 538 trees and 2 missing trees) were selected to be measured and used for validation of the UAV-based measurements. Tree structure information, such as tree height, diameter at breast height (DBH), crown diameter, and canopy volume, was measured on May 4th and September 6th, 2018, on the ground. Citrus greening infection was also investigated in the field on April 24th, 2018. Although there was a week-long time gap between the ground measurements and UAV data collection, the conditions of trees are not expected to change dramatically in a week, so a correspondence was established between the ground and UAV measurements. Sixty trees in each block were divided into two groups, citrus greening positive and negative groups, based on the field survey (Table 1). In the study area, the first infected tree was discovered in 2017, and two-thirds of the trees were infected within one year.

Table 1.
Numbers of trees in the citrus greening positive and negative groups in all blocks.
2.2. UAV Data Collection and Preprocessing
A multirotor platform, DJI Matrice 100 (DJI, Shenzhen, China), was used to collect multispectral images on April 18th and August 23rd, 2018. A SlantRange 3P multispectral camera (SlantRange, San Diego, CA, USA) was mounted on the UAV. The SlantRange 3P is equipped with sensors with a resolution of 1280 × 1024, 0.0048 mm pixel size, 12 mm focal length, and 28° field of view (FOV). The multispectral sensor captures 4 bands with an ambient illumination sensor (AIS) for radiometric calibration (Table 2). UAV data were collected at 50 m altitude above the ground with 70% overlap.

Table 2.
Center wavelength and full width at half maximum (FWHM) of the SlantRange 3P camera.
The software developed by the camera company was used to perform the radiometric calibration for converting the pixel values of raw images to reflectance values without reflectance panels [23]. The range of pixel values in the converted images was 0 to 1. The calibrated UAV images were then processed using Agisoft Photoscan Pro (Agisoft LLC, St. Petersburg, Russia), which is a structure from motion (SfM) software package, to generate a DSM and orthomosaic images. When the UAV was flown at 50 m altitude, the spatial resolution of the orthomosaic and elevation models were 2 and 4 cm, respectively. A canopy height model (CHM) was generated by subtracting the digital terrain model (DTM) from the DSM to eliminate the ground elevation for estimating tree height and canopy volume. The DTM was created by manually digitizing ground points on the orthomosaic images. The elevation of the digitized ground points was obtained from the DSM. A triangular irregular network (TIN) algorithm was applied to the ground point for interpolating and generating the DTM interpolation.
2.3. Individual Tree Detection
Because the objective of this study was to examine the characteristics of citrus greening disease at the individual tree level, an algorithm was proposed to delineate an individual tree using the normalized difference vegetation index (NDVI) and CHM. A threshold value of 0.6 for NDVI was used to classify pixels to vegetation cover or non-vegetation. In vegetation class, tree canopy, grass, and weeds could be included. Because potential canopy pixels can include objects other than trees, we adopted a second layer of filtering based on the CHM. Non-tree pixels were eliminated with the height using a threshold of 30 cm, which was determined by field conditions when the UAV data was collected, and any pixel whose CHM value was smaller than the threshold value was filtered out. In addition to the two-stage morphological filtering, opening and closing operations were also applied to remove speckle noise and to fill holes. Each segment, namely, each connected component of the tree canopy map, was considered an individual tree. The centroid of the segment was used as a center of a 2 × 2 m rectangle to draw individual tree boundaries (Figure 2). The 2 m was converted to 100 pixels in orthomosaic images because the spatial resolution was 2 cm. The rectangle size was determined by the field layout, such as the distance between trees, and visual assessment. All tree attributes, including the canopy shape and vegetation indices, were calculated within the polygon boundary.
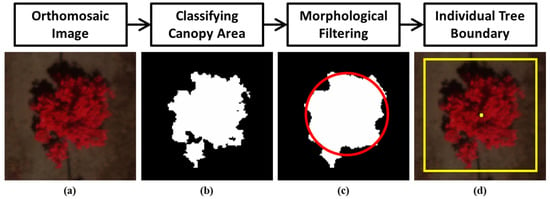
Figure 2.
Example of individual tree detection: (a) a tree in a color-infrared (CIR) image, (b) canopy cover from the normalized difference vegetation index (NDVI) and the canopy height model (CHM), (c) individual tree segment after morphological filtering with the equivalent diameter (red circle), and (d) centroid of the individual tree (yellow dot) and individual tree boundary (yellow square).
2.4. Canopy Shape and Vegetation Indices
Traits of the canopy shape, including tree height canopy volume, were calculated from the CHM using the delineated individual tree boundaries. The maximum CHM value within the boundary was considered the tree height, and the equivalent diameter of an individual tree segment was computed as the crown diameter (Figure 2c). Canopy volume was calculated in two different ways: (1) the sum of individual canopy pixels’ volume within the tree boundary, where volume of the canopy pixel can be calculated by multiplying pixel area and height of the pixel, and (2) using an allometric equation (Equation (1)) for tree volume with tree height and crown diameter derived from the UAV imagery as inputs to the equation [24].
It was demonstrated that the RedEdge and near-infrared (NIR)-based VIs show better performance than RGB-based VIs [25]. In particular, the modified soil adjusted vegetation index (MSAVI) was outperformed to quantify the crop status. In the spectral response, the RedEdge wavelength is known to be more sensitive to young leaves (leaf flushing) than are NIR wavelengths [26,27]. Li et al. [28] also analyzed the spectral signature of citrus greening infected trees using multispectral and hyperspectral airborne images. As a result, a significant difference in the RedEdge spectral range between healthy and infected trees was reported. Therefore, four VIs—NDVI, MSAVI, normalized difference RedEdge index (NDRE), and chlorophyll index (CI)—were employed to compare the differences between healthy and citrus greening-infected trees (Table 3). NDVI and MSAVI were selected because they are widely and frequently used in crop research, whereas two RedEdge-based vegetation indices, NDRE and CI, were calculated using red and RedEdge bands. Figure 3 shows an example of VIs of the same tree. The average VI values within the individual tree canopies were calculated as the representative VIs of each tree.

Table 3.
Equations of vegetation indices (VIs).

Figure 3.
Examples of the VIs for individual trees: (a) NDVI (b) normalized difference RedEdge index (NDRE), (c) modified soil adjusted vegetation index (MSAVI), and (d) chlorophyll index (CI).
2.5. Flush Ratio of Orange Tree
The main symptoms of citrus greening infected trees are yellow shoots, leaves with blotchy mottle, and small lopsided fruits [33]. Vector insects lay eggs on young flush and nymphs develop exclusively on tender flush [34]. Flush is a newly developing cluster of very young leaves on the expanding terminal end of a shoot [35]. Ultimately, infected branches die, and then the tree dies. Because a young tree with sustained growth has new leaves at the branch tip [36], we can assume that flushing on the tree canopy surface can be detected using UAV images. Based on our visual observations and the study of Li et al. [28], the flush ratio could be a useful indicator to detect citrus greening infection in citrus groves. Because citrus greening disease affects flushing, heathy trees should show more flushing than infected trees. In this study, A method of quantifying the flush ratio in individual trees was proposed. Figure 4a,b shows false color composite images with different band combinations. These examples demonstrate that the RedEdge band is more sensitive to flushing, which is not easily visible from a conventional color infrared (CIR) image. Therefore, in this study, CI calculated from the RedEdge and NIR bands was employed to quantify the flush ratio at the individual tree level. We determined the range of CI values from a CI map inductively, and the lower and upper threshold values were empirically determined. Because the reflectance for young leaves at NIR wavelengths is less than that for older leaves [37], we extracted the pixels in the CI range from 0.85 to 2 in the canopy area (Figure 4c,d). The percentage of flush pixels over the canopy area was then calculated as the flush ratio of the individual tree.

Figure 4.
An individual tree in a multispectral orthomosaic image with different RGB color compositions: (a) conventional CIR (B: green, G: red and R: near-infrared (NIR)) and (b) RedEdge CIR (B: red, G: RedEdge and R: NIR). Flush cluster pixels show different colors from older leaves (yellow circles). Based on the threshold ranges, (d) flush cluster pixels were extracted from the (c) CI map.
3. Results and Discussion
3.1. Evaluation of Canopy Shape Traits
The crown diameter, tree height, and canopy volume data derived from the UAV imagery captured on 23 August 2020 were compared with the ground measurements collected on 6 September 2020. The ground-measured DBH collected on 5 May was also correlated with the crown diameter estimated from the UAV data captured on 18 April. Tree structural parameters, such as tree height and crown diameter, showed strong correlations between the ground measurement and UAV-derived parameters (Figure 5). Because previous studies have shown crown diameter is strongly correlated to DBH [38,39], the ground-measured DBH and UAV-derived crown diameter also produced a strong correlation with an R2 value of 0.75 (Figure 5a). Although the UAV-derived crown diameter was slightly underestimated relative to the ground measurements, the slope of the linear regression line was 0.9 with an R2 value of 0.72 (Figure 5b). When calculating the correlation coefficient between the ground-measured and UAV-derived tree height, the experimental results yielded an R2 value of 0.83 and the slope of the linear regression line was 0.88 (Figure 5c).
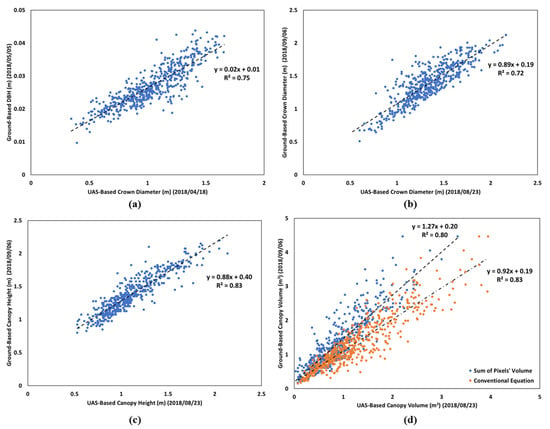
Figure 5.
Relationship between the (a) ground diameter at breast height (DBH) vs. UAV crown diameter, (b) ground crown diameter vs. UAV crown diameter, (c) ground tree height vs. UAV tree height, and (d) ground canopy volume vs. UAV canopy volume.
Canopy volume was estimated by accumulating canopy pixels’ volume and multiplying the tree height by the crown diameter to compare them with ground-measured canopy volume. In Figure 4d, the estimated canopy volume by both UAV-based methods resulted in high R2 values of over 0.8 with the ground measurements. In particular, the regression line of the canopy volume based on the allometric equation using tree height and crown diameter was close to the 1-on-1 line. These experimental results demonstrate that UAV-based measurements can be used to extract tree structural parameters, such as tree height, DBH, crown diameter, and canopy volume, with reasonable accuracy. All UAV-based measurements explained over 70% of the variation in the ground measurements.
3.2. Differences in VIs
The average of the representative VIs in each treatment was compared to examine the spectral differences between the citrus greening positive and negative trees. Healthy groups should show higher VIs. In Figure 6, non-infected trees in all blocks always have higher NDVI, NDRE, MSAVI, and CI values. The differences in the NDRE and CI values calculated using the RedEdge and NIR bands were relatively larger than those in the NDVI and MSAVI values.
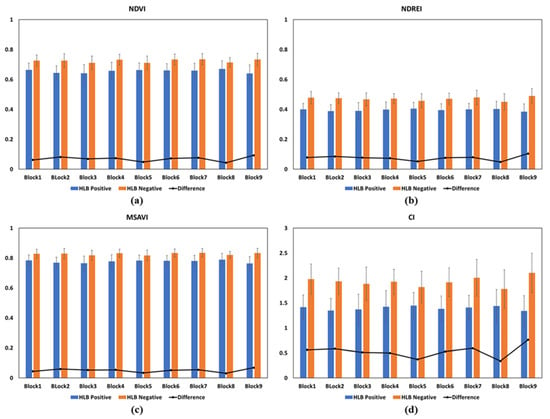
Figure 6.
Average of and differences in VI values between the citrus greening positive and negative trees for (a) NDVI, (b) NDRE, (c) MSAVI, and (d) CI. Error bars show (±) one standard deviation of the observations.
The error bars in Figure 6 indicate one standard deviation (SD) in the positive and negative directions, showing the variability of the observations. Although all VIs were able to distinguish healthy and infected trees, the RedEdge-related VIs were more successful in showing the difference in the citrus greening disease effect. Based on a two-sample t-test with a 5% significance level, the NDVI, NDRE, MSAVI, and CI values over all blocks were significantly different between the citrus greening positive and negative groups. Among the VIs adopted in this study, CI was the most efficient feature for monitoring citrus greening infection in the citrus orchard.
Although recently developed multispectral sensors provide the RedEdge band in addition to the NIR band, the multispectral cameras typically equipped on satellites, airplanes, and UAVs capture only the NIR band in an invisible wavelength range. Our study demonstrates that the typical NDVI and MSAVI, which are the most frequently used VIs in remote sensing, can also be useful for monitoring the difference due to disease. As mentioned in Section 2, the RedEdge wavelength is more sensitive to flushing and thus is more effective for the detection of flushing related to tree health. Healthy trees, which are not infected and display leaf flushing, result in higher NDRE and CI values than infected trees.
3.3. Flush Ratio and Canopy Volume Difference from Citrus Greening
In this study, a thresholding method was proposed to extract flush clusters using CI for calculating the flush ratio for individual citrus trees. Healthy trees show a higher percentage of trees with flushing (Figure 7a). In the healthy group, 10–40% more trees contain flush clusters indicating young leaves than diseased trees. Figure 7b shows that healthy trees include larger flushing area than infected trees. Different patterns in blocks 5 and 8 could be caused by the effective treatments for citrus greening disease. In general, a larger flushing area was detected for non-infected trees. This experiment demonstrated that citrus greening disease prevents flushing on trees and affects tree growth. In addition, when the disease affects tree growth, the canopy volume should be different between citrus greening positive and negative trees. Figure 8 shows the average canopy volumes throughout all blocks. The canopy volume of the healthy trees was more than twice that of the citrus greening infected trees. This result implies that it is possible to monitor the disease in orange groves via the canopy volume. If a CHM can be successfully generated to estimate canopy volumes, UAV images from any type of sensor (including not only multispectral but also RGB sensors) could be used to monitor citrus greening disease.
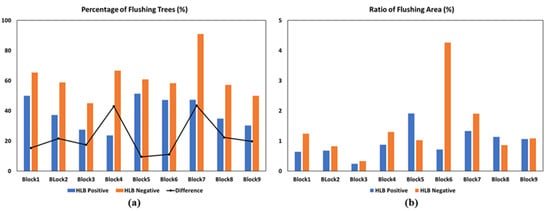
Figure 7.
Ratio of (a) the number of trees containing leaf flushing and (b) the flushing area over canopy cover area between the citrus greening positive and negative trees over all blocks.
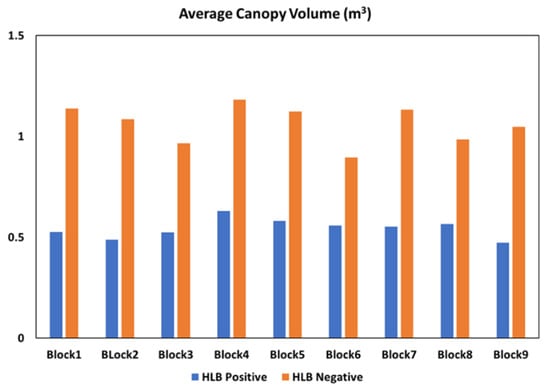
Figure 8.
Average canopy volume between the citrus greening positive and negative trees over all blocks.
4. Conclusions
In this study, we used UAV-based multispectral images to compare the canopy shape and VIs of citrus trees in an orange grove. The UAV raw images were collected over the experiment site of treatments for citrus greening disease. Geo-rectification and radiometric calibration were conducted in pre-processing. In the orthomosaic images, individual trees were detected, and tree boundaries were delineated to extract the representative tree characteristics from CHM and VI maps. The UAV-based canopy shape characteristics, such as tree height, crown diameter, and canopy volume, were compared with the ground measurements. The estimated tree structural attributes were highly correlated with the actual measurements on the ground. The NDVI, NDRE, MSAVI, and CI values of individual trees were compared between the citrus greening positive and negative trees throughout all blocks. All VIs were higher in healthy trees, and their differences were statistically significant. Our experiment shows that NDRE and CI are more capable of monitoring citrus greening disease. Based on the detection of flushing on the trees, the leaf flushing ratio strongly reflects the difference in infection. In addition, the canopy volume estimated from UAV data was valuable for distinguishing the presence of citrus greening disease.
The proposed methodology demonstrated that the UAV-based canopy shape and VIs can be used to monitor citrus greening infection in citrus orchards. Both spectral characteristics and canopy volume are significantly capable of citrus orchard monitoring. Although the VIs from multispectral images were adopted in this study, RGB images can also be an alternative to estimate canopy structural attributes, such as canopy volume, for citrus disease monitoring. In the future, multi-temporal UAV datasets and machine learning techniques will be used to develop an advanced citrus disease monitoring method.
Author Contributions
Conceptualization, A.C., J.J., and J.L.; methodology, A.C., J.Y., and J.J.; software, A.C. and J.Y.; validation, A.C. and J.Y.; formal analysis, A.C. and J.Y.; investigation, A.C. and J.Y.; resources, A.C., J.Y., and J.J.; data curation, A.C. and J.Y.; writing—original draft preparation, A.C., J.Y., J.J., and J.L.; writing—review and editing, J.Y., J.J., and J.L.; visualization, A.C. and J.Y.; supervision, J.J. and J.L.; project administration, J.J. and J.L.; funding acquisition, J.J. and J.L. All authors have read and agreed to the published version of the manuscript.
Funding
This work was supported by the National Research Foundation of Korea (NRF) grant funded by the Korea government (MSIT) (No.2020R1C1C1010905).
Acknowledgments
This work was supported by Texas A&M AgriLife Research.
Conflicts of Interest
The authors declare no conflict of interest.
References
- USDA. Citrus: World Markets and Trade; USDA Foreign Agricultural Service: Washington, DC, USA, 2020.
- Spann, T.M.; Atwood, R.A.; Yates, J.D.; Rogers, M.E.; Brlansky, R.H. Dooryard Citrus Production: Citrus Greening Disease; EDIS HS1131; University of Florida, Institute of Food and Agricultural Sciences: Gainesville, FL, USA, 2010. [Google Scholar]
- Berk, Z. Diseases and pests. In Citrus Fruit Processing, 1st ed.; Academic Press: London, UK, 2016; pp. 83–93. [Google Scholar]
- Dala-Paula, B.M.; Plotto, A.; Bai, J.; Manthey, J.A.; Baldwin, E.A.; Ferrarezi, R.S.; Gloria, M.B.A. Effect of Huanglongbing or Greening Disease on Orange Juice Quality, a Review. Front. Plant Sci. 2019, 9, 1976. [Google Scholar] [CrossRef] [PubMed]
- Ghosh, D.K.; Motghare, M.; Gowda, S. Citrus Greening: Overview of the Most Severe Disease of Citrus. Adv. Agric. Res. Tech. J. 2018, 2, 83–100. [Google Scholar]
- Batool, A.; Iftikhar, Y.; Mughal, S.M.; Khan, M.M.; Jaskani, M.J.; Abbas, J.; Khan, I.A. Citrus Greening Disease—A major cause of citrus decline in the world—A Review. Hortic. Sci. 2007, 34, 159–166. [Google Scholar] [CrossRef]
- Matos, L.A.; Hilf, M.E.; Cayetano, X.A.; Feliz, A.O.; Harper, S.J.; Folimonova, S.Y. Dynamics of Citrus tristeza virus populations in the Dominican Republic. Plant Dis. 2013, 97, 339–345. [Google Scholar] [CrossRef] [PubMed][Green Version]
- Recio, J.A.; Hermosilla, T.; Ruiz, L.A.; Palomar, J. Automated extraction of tree and plot-based parameters in citrus orchards from aerial images. Comput. Electron. Agric. 2013, 90, 24–34. [Google Scholar] [CrossRef]
- Ozdarici-Ok, A. Automatic detection and delineation of citrus trees from VHR satellite imagery. Int. J. Remote Sens. 2015, 36, 4275–4296. [Google Scholar] [CrossRef]
- Vahidi, H.; Klinkenberg, B.; Johnson, B.A.; Moskal, L.M.; Yan, W. Mapping the Individual Trees in Urban Orchards by Incorporating Volunteered Geographic Information and Very High Resolution Optical Remotely Sensed Data: A Template Matching-Based Approach. Remote Sens. 2018, 10, 1134. [Google Scholar] [CrossRef]
- Jang, J.D.; Payan, V.; Viau, A.A.; Devost, A. The use of airborne lidar for orchard tree inventory. Int. J. Remote Sens. 2008, 29, 1767–1780. [Google Scholar] [CrossRef]
- Estornell, J.; Velázquez-Martí, B.; López-Cortés, I.; Salazar, D.; Fernández-Sarría, A. Estimation of wood volume and height of olive tree plantations using airborne discrete-return LiDAR data. GISci. Remote Sens. 2014, 51, 17–29. [Google Scholar] [CrossRef]
- Murray, J.; Fennell, J.T.; Blackburn, G.A.; Whyatt, J.D.; Li, B. The novel use of proximal photogrammetry and terrestrial LiDAR to quantify the structural complexity of orchard trees. Precis. Agric. 2020, 21, 473–483. [Google Scholar] [CrossRef]
- Berni, J.A.J.; Zarco-Tejada, P.J.; Suárez, L.; Fereres, E. Thermal and Narrowband Multispectral Remote Sensing for Vegetation Monitoring From an Unmanned Aerial Vehicle. IEEE Trans. Geosci. Remote Sens. 2009, 49, 722–738. [Google Scholar] [CrossRef]
- Ortega-Farías, S.; Ortega-Salazar, S.; Poblete, T.; Kilic, A.; Allen, R.; Poblete-Echeverría, C.; Ahumada-Orellana, L.; Zuñiga, M.; Sepúlveda, D. Estimation of Energy Balance Components over a Drip-Irrigated Olive Orchard Using Thermal and Multispectral Cameras Placed on a Helicopter-Based Unmanned Aerial Vehicle (UAV). Remote Sens. 2016, 8, 638. [Google Scholar] [CrossRef]
- Johansen, K.; Raharjo, T.; McCabe, M.F. Using Multi-Spectral UAV Imagery to Extract Tree Crop Structural Properties and Assess Pruning Effects. Remote Sens. 2018, 10, 854. [Google Scholar] [CrossRef]
- Tu, Y.-H.; Johansen, K.; Phinn, S.; Robson, A. Measuring Canopy Structure and Condition Using Multi-Spectral UAS Imagery in a Horticultural Environment. Remote Sens. 2019, 11, 269. [Google Scholar] [CrossRef]
- Sarron, J.; Malézieux, É.; Sané, C.A.B.; Faye, É. Mango Yield Mapping at the Orchard Scale Based on Tree Structure and Land Cover Assessed by UAV. Remote Sens. 2018, 10, 1900. [Google Scholar] [CrossRef]
- García-Murillo, D.G.; Caicedo-Acosta, J.; Castellanos-Dominguez, G. Individual Detection of Citrus and Avocado Trees Using Extended Maxima Transform Summation on Digital Surface Models. Remote Sens. 2020, 12, 1633. [Google Scholar] [CrossRef]
- Ampatzidis, Y.; Partel, V. UAV-Based High Throughput Phenotyping in Citrus Utilizing Multispectral Imaging and Artificial Intelligence. Remote Sens. 2019, 11, 410. [Google Scholar] [CrossRef]
- Garza, B.N.; Ancona, V.; Enciso, J.; Perotto-Baldivieso, H.L.; Kunta, M.; Simpson, C. Quantifying Citrus Tree Health Using True Color UAV Images. Remote Sens. 2020, 12, 170. [Google Scholar] [CrossRef]
- Abdulridha, J.; Batuman, O.; Ampatzidis, Y. UAV-Based Remote Sensing Technique to Detect Citrus Canker Disease Utilizing Hyperspectral Imaging and Machine Learning. Remote Sens. 2019, 11, 1373. [Google Scholar] [CrossRef]
- Ashapure, A.; Jung, J.; Yeom, J.; Chang, A.; Maeda, M.; Maeda, A.; Landivar, J. A novel framework to detect conventional tillage and no-tillage cropping system effect on cotton growth and development using multi-temporal UAS data. ISPRS J. Photogramm. Remote Sens. 2019, 152, 49–64. [Google Scholar] [CrossRef]
- Thorne, M.S.; Skinner, Q.D.; Smith, M.A.; Rodgers, J.D.; Laycock, W.A.; Cerekci, S.A. Evaluation of a technique for measuring canopy volume of shrubs. J. Range Manage. 2002, 55, 235–241. [Google Scholar] [CrossRef]
- Yeom, J.; Jung, J.; Chang, A.; Ashapure, A.; Maeda, M.; Maeda, A.; Landivar, J. Comparison of Vegetation Indices Derived from UAV Data for Differentiation of Tillage Effects in Agriculture. Remote Sens. 2019, 11, 1548. [Google Scholar] [CrossRef]
- Stone, C.; Chisholm, L.; Coops, N. Spectral reflectance characteristics of eucalypt foliage damaged by insects. Aust. J. Bot. 2001, 49, 687–698. [Google Scholar] [CrossRef]
- Moura, Y.M.D.; Galvão, L.S.; Hilker, T.; Wu, J.; Saleska, S.; Amaral, C.H.D.; Nelson, B.W.; Lopes, A.P.; Wiedeman, K.K.; Prohaska, N.; et al. Spectral analysis of amazon canopy phenology during the dry season using a tower hyperspectral camera and modis observations. ISPRS J. Photogramm. Remote Sens. 2017, 131, 52–64. [Google Scholar] [CrossRef]
- Li, X.; Lee, W.S.; Li, M.; Ehsani, R.; Mishra, A.R.; Yang, C.; Mangan, R.L. Spectral difference analysis and airborne imaging classification for citrus greening infected trees. Comput. Electron. Agric. 2012, 83, 32–46. [Google Scholar] [CrossRef]
- Rouse, J.W.J.; Haas, R.H.; Schell, J.A.; Deering, D.W. Monitoring vegetation systems in the great plains with erts. NASA Spec. Publ. 1974, 351, 309. [Google Scholar]
- Barnes, E.M.; Clarke, T.R.; Richards, S.E.; Colaizzi, P.D.; Haberland, J.; Kostrzewski, M.; Waller, P.; Choi, C.; Riley, E.; Thompson, T.; et al. Coincident detection of crop water stress, nitrogen status and canopy density using ground based multispectral data. In Proceedings of the Fifth International Conference on Precision Agriculture, Bloomington, MN, USA, 16–19 July 2000; Volume 1619. [Google Scholar]
- Qi, J.; Chehbouni, A.; Huete, A.R.; Kerr, Y.H.; Sorooshian, S. A modified soil adjusted vegetation index. Remote Sens. Environ. 1994, 48, 119–126. [Google Scholar] [CrossRef]
- Gitelson, A.A.; Gritz, Y.; Merzlyak, M.N. Relationships between leaf chlorophyll content and spectral reflectance and algorithms for non-destructive chlorophyll assessment in higher plant leaves. J. Plant Physiol. 2003, 160, 271–282. [Google Scholar] [CrossRef]
- Bové, J.M. Huanglongbing: A Destructive Newly-Emerging Century-Old Disease of Citrus. J. Plant Pathol. 2006, 88, 7–37. [Google Scholar]
- Pluke, R.W.H.; Qureshi, J.A.; Stansly, P.A. Citrus flushing patterns, Diaphorina citri (Hemiptera: Psyllidae) populations and parasitism by Tamarixia radiata (Hymenoptera: Eulophidae) in Puerto Rico. Fla. Entomol. 2008, 91, 36–42. [Google Scholar] [CrossRef]
- Chiyaka, C.; Singer, B.H.; Halbert, S.E.; Morris, J.G.; van Bruggen, A.H.C. Modeling within tree huanglongbing transmission. Proc. Natl. Acad. Sci. USA 2012, 109, 12213–12218. [Google Scholar] [CrossRef] [PubMed]
- Franklin, J.; Mercher, D. Tree Growth Characteristics; The University of Tennessee Agricultural Extension Service: Union City, TN, USA, 2009. [Google Scholar]
- Carter, G.A.; Paliwal, K.; Pathre, U.; Green, T.H.; Mitchell, R.J.; Gjerstad, D.H. Effect of competition and leaf age on visible and infrared reflectance in pine foliage. Plant Cell Environ. 1989, 12, 309–315. [Google Scholar] [CrossRef]
- Lamson, N.I. D.b.h./Crown Diameter Relationships in Mixed Appalachian Hardwood Stands; U.S. Department of Agriculture, Forest Service, Northeastern Forest Experiment Station: Broomall, PA, USA, 1987.
- Lockhart, B.R.; Weih, R.C., Jr.; Smith, K.M. Crown Radius and Diameter at Breast Height Relationships for Six Bottomland Hardwood Species. J. Ark. Acad. Sci. Agric. 2005, 59, 16. [Google Scholar]
Publisher’s Note: MDPI stays neutral with regard to jurisdictional claims in published maps and institutional affiliations. |
© 2020 by the authors. Licensee MDPI, Basel, Switzerland. This article is an open access article distributed under the terms and conditions of the Creative Commons Attribution (CC BY) license (http://creativecommons.org/licenses/by/4.0/).