Study of the Effect of Aerosol Vertical Profile on Microphysical Properties Using GRASP Code with Sun/Sky Photometer and Multiwavelength Lidar Measurements


Abstract
1. Introduction
2. Instrumentation and Methods
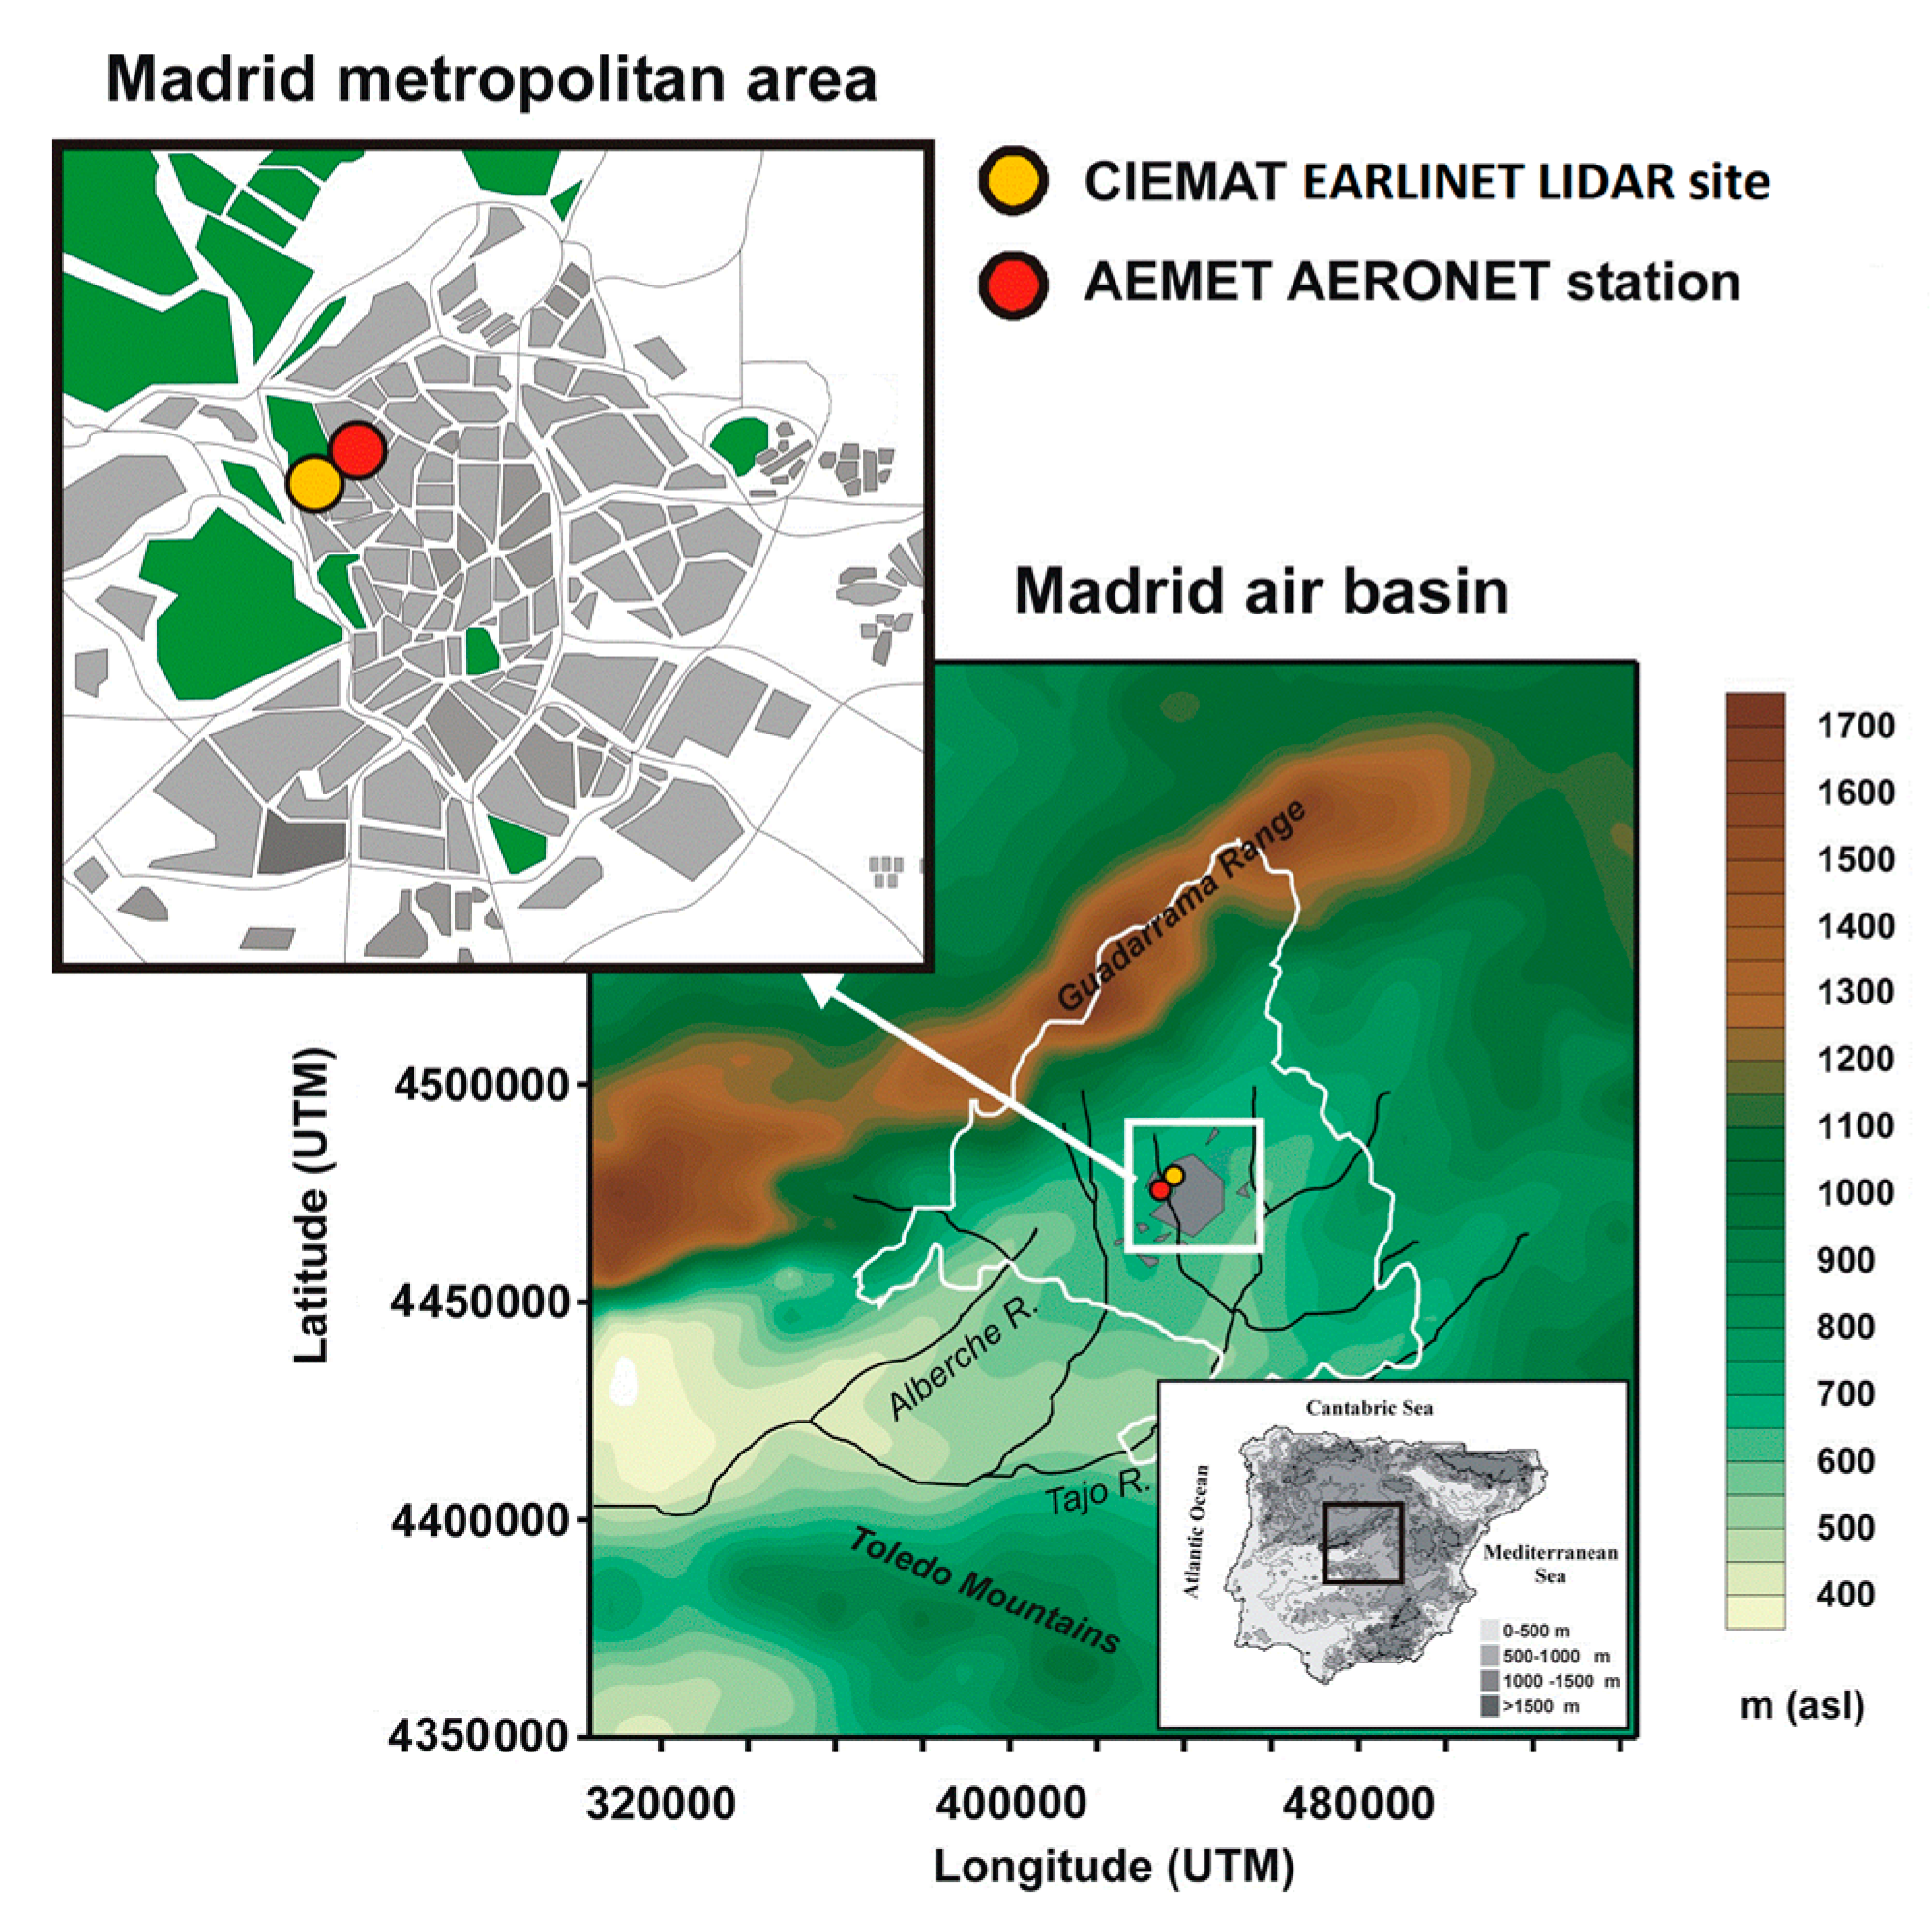
2.1. Experimental Site
2.2. Instrumentation
2.2.1. Lidar Measurements
2.2.2. Sun/Sky Photometer Data
2.3. GRASP Inversion Code
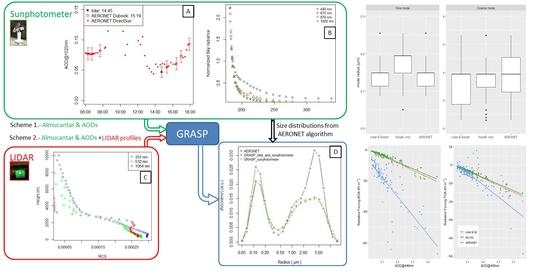
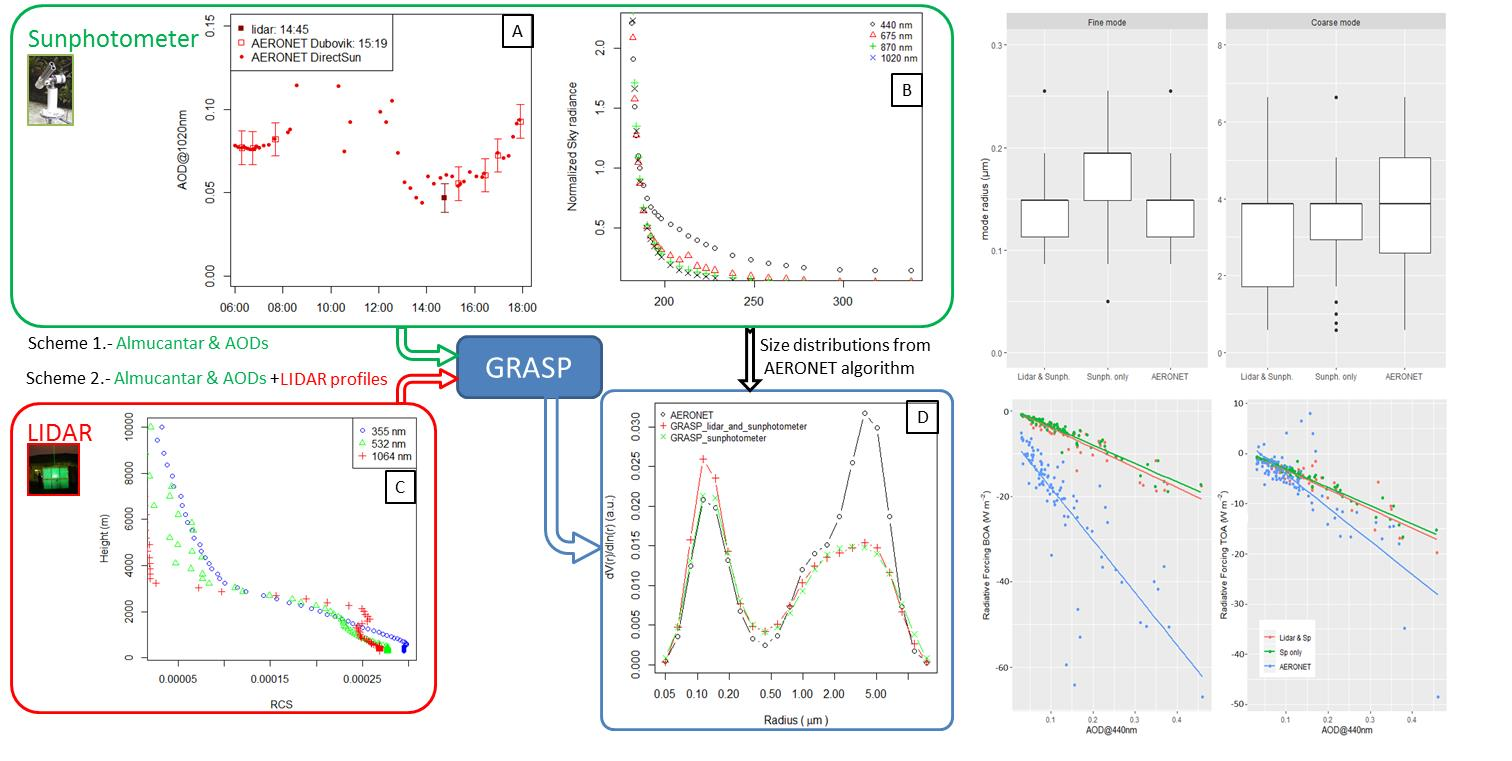
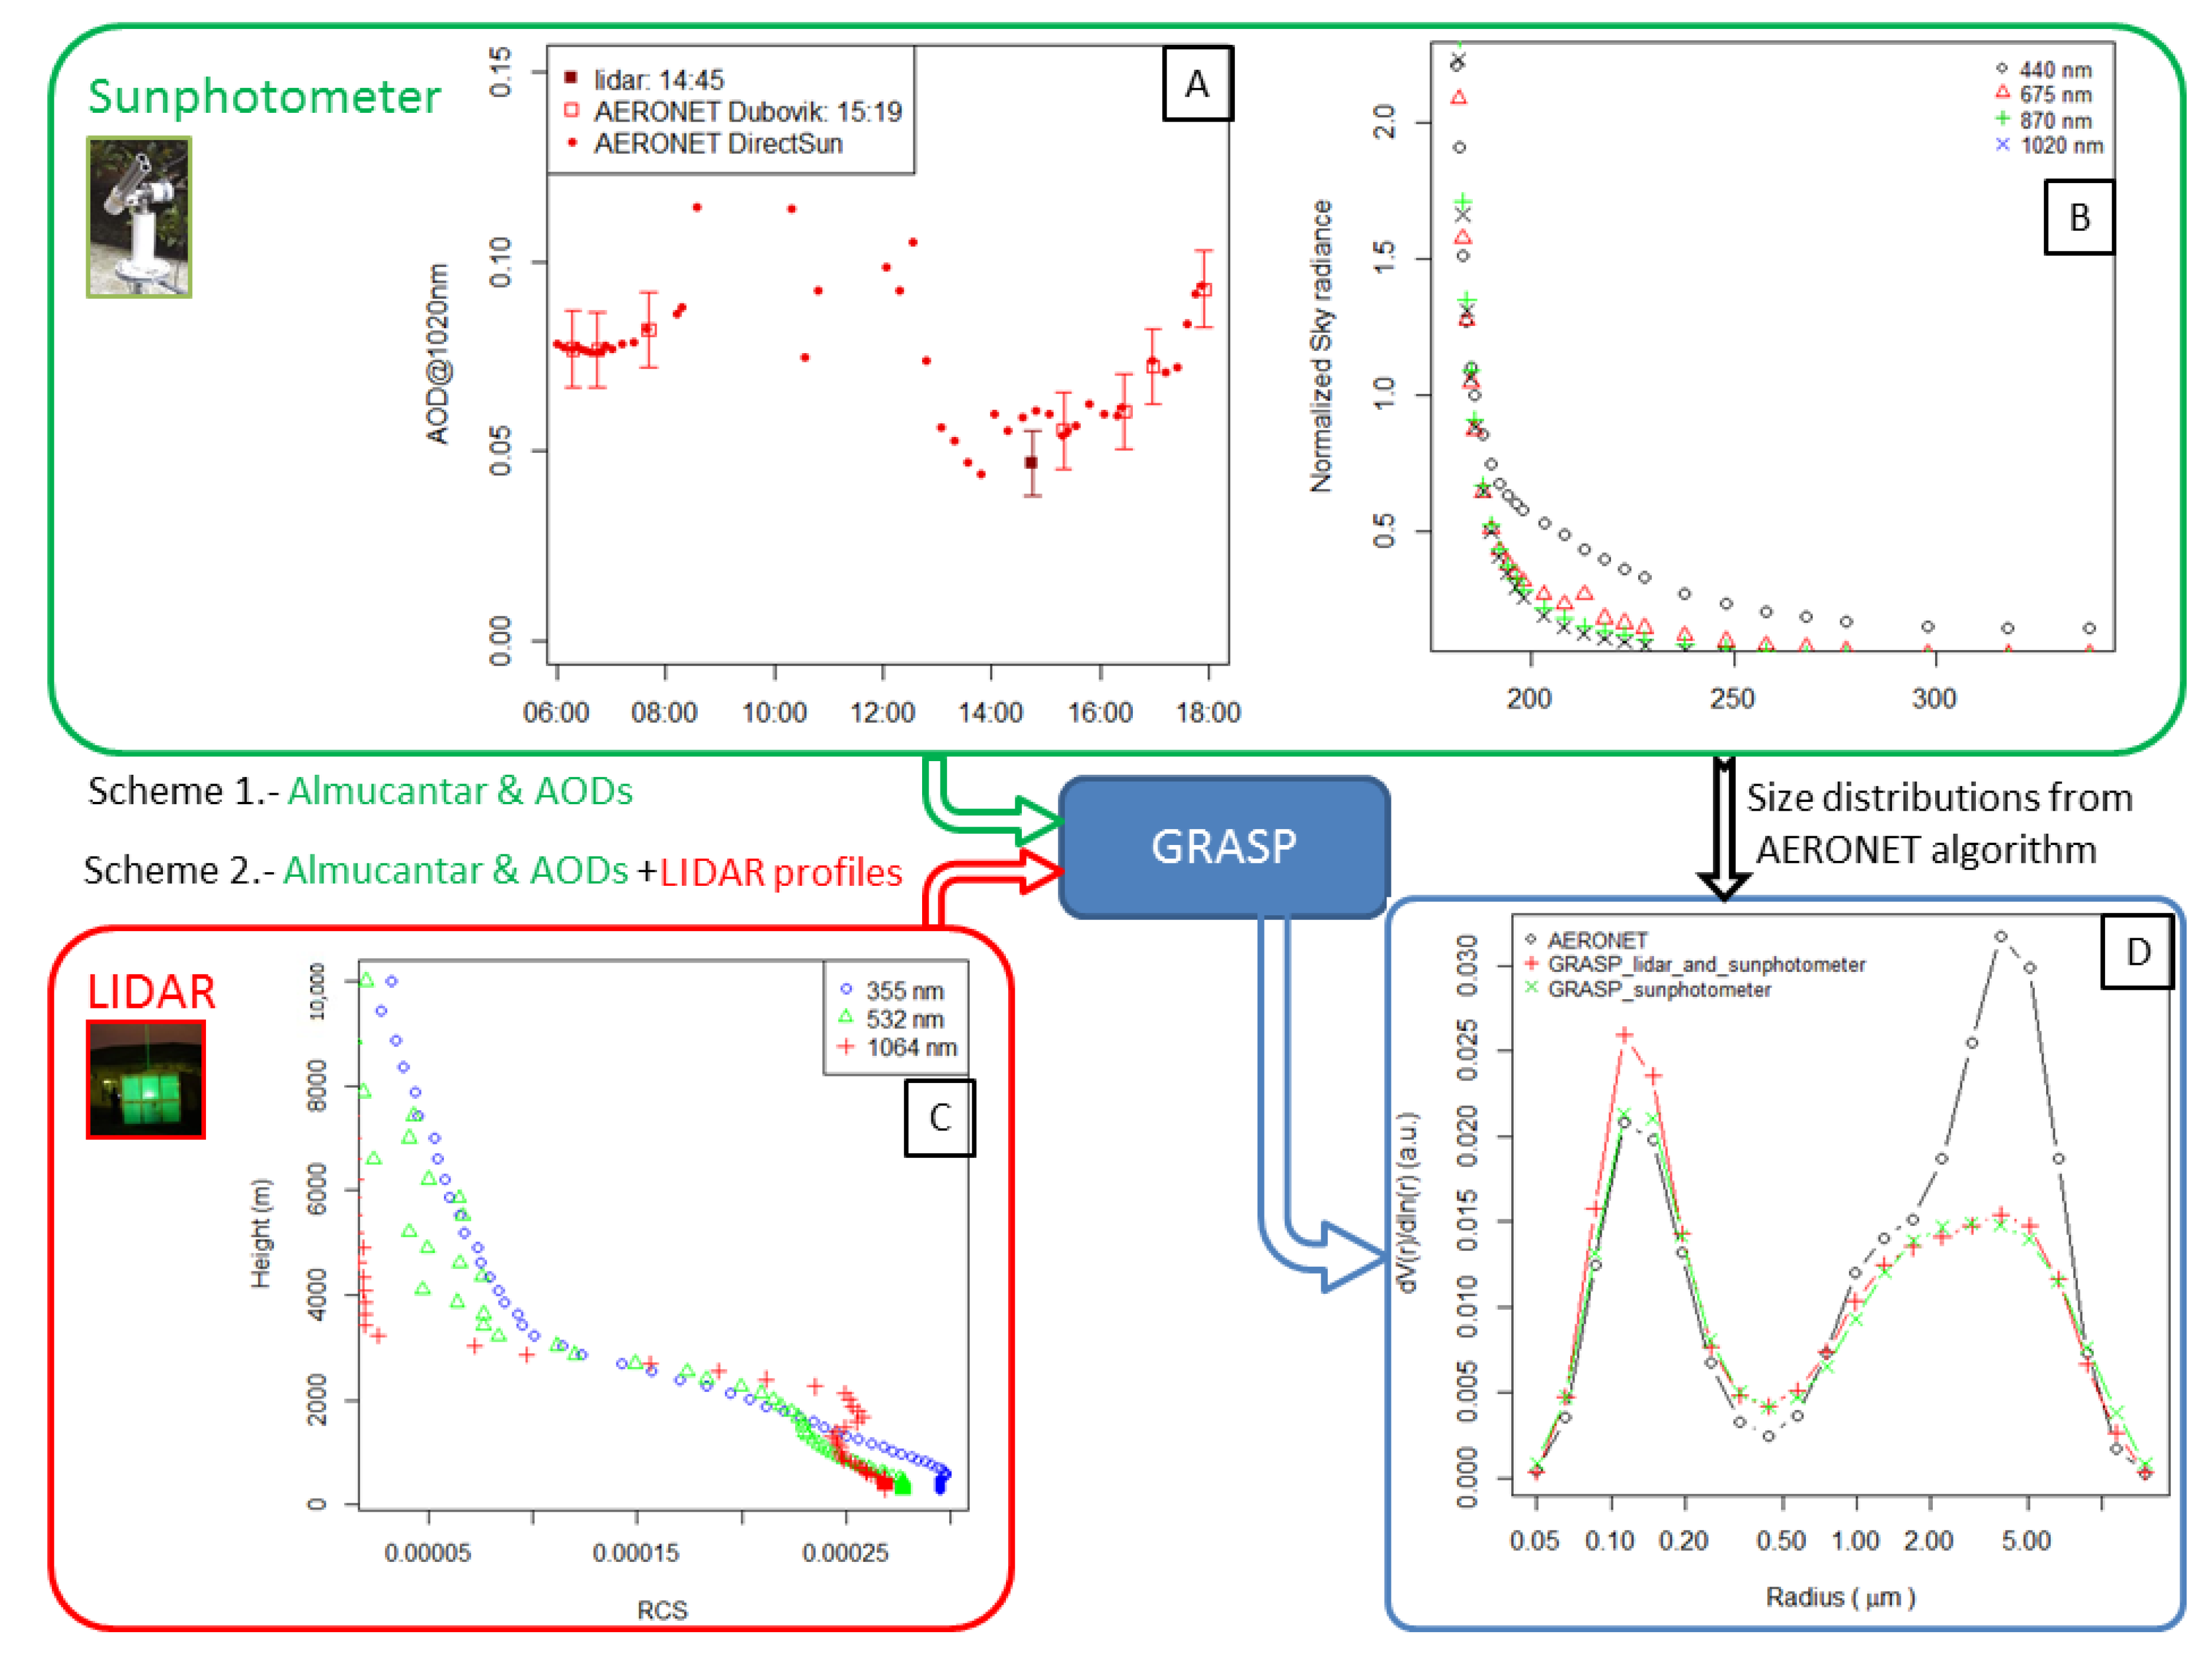
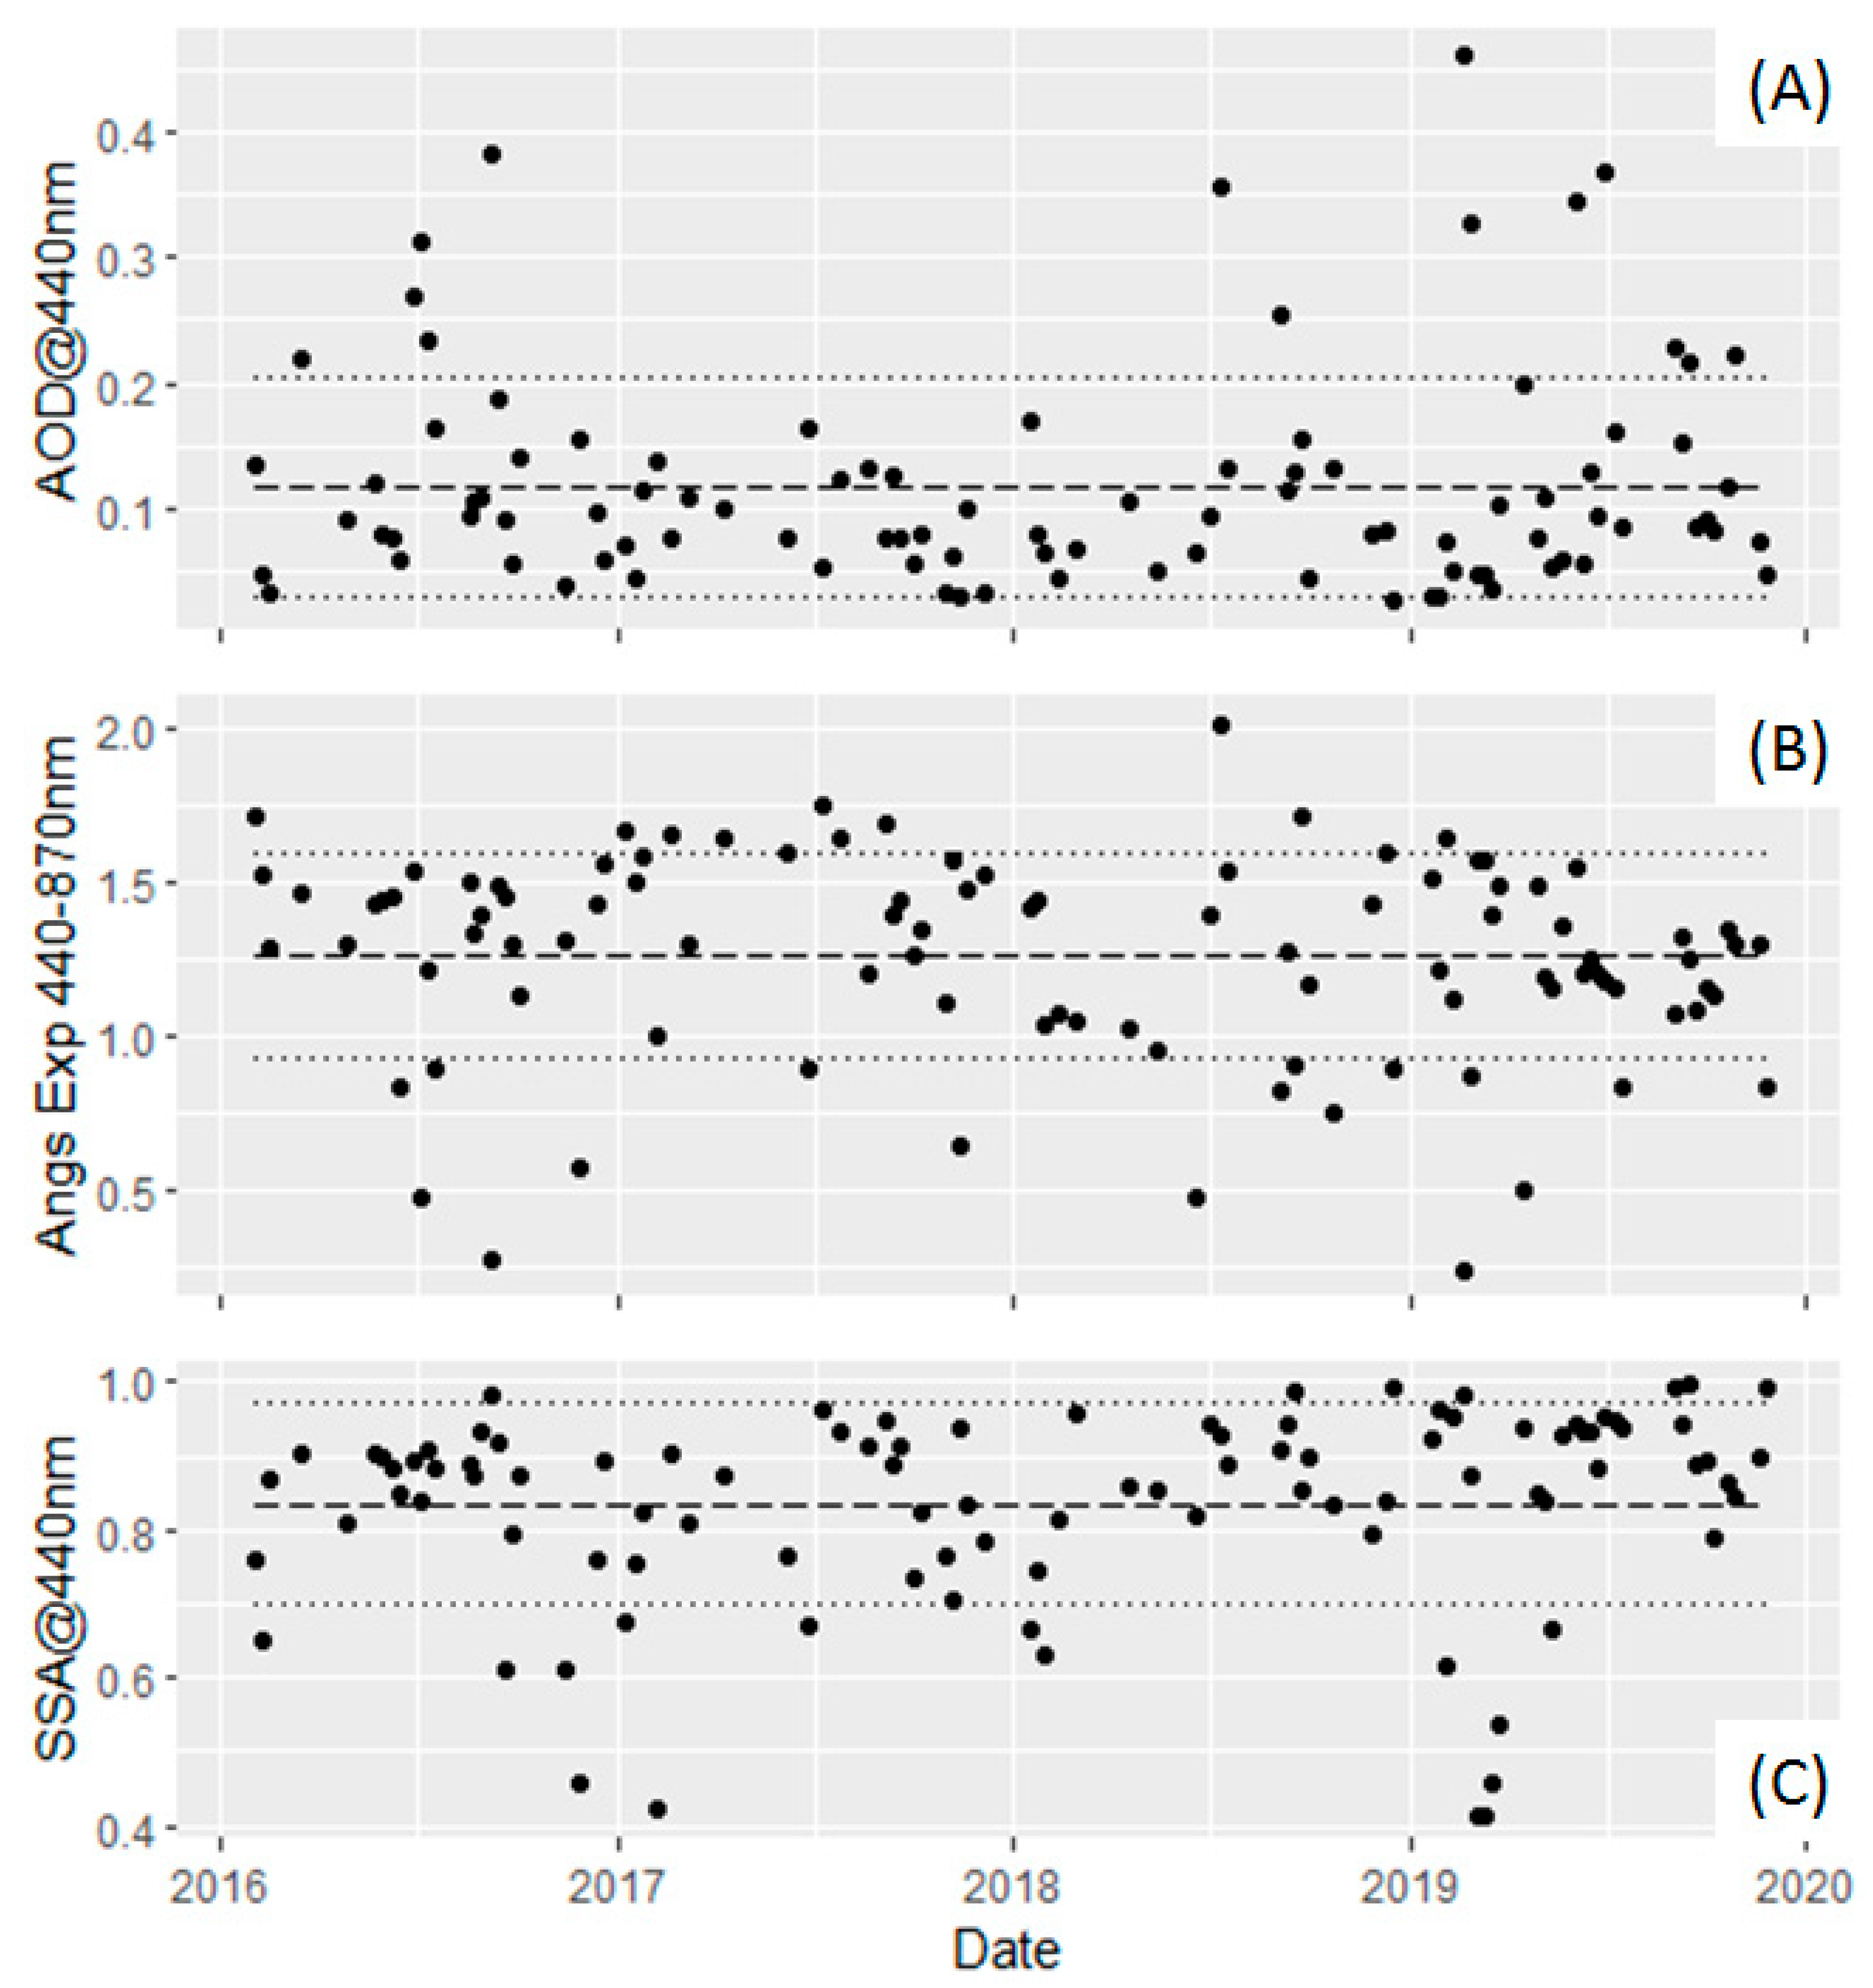
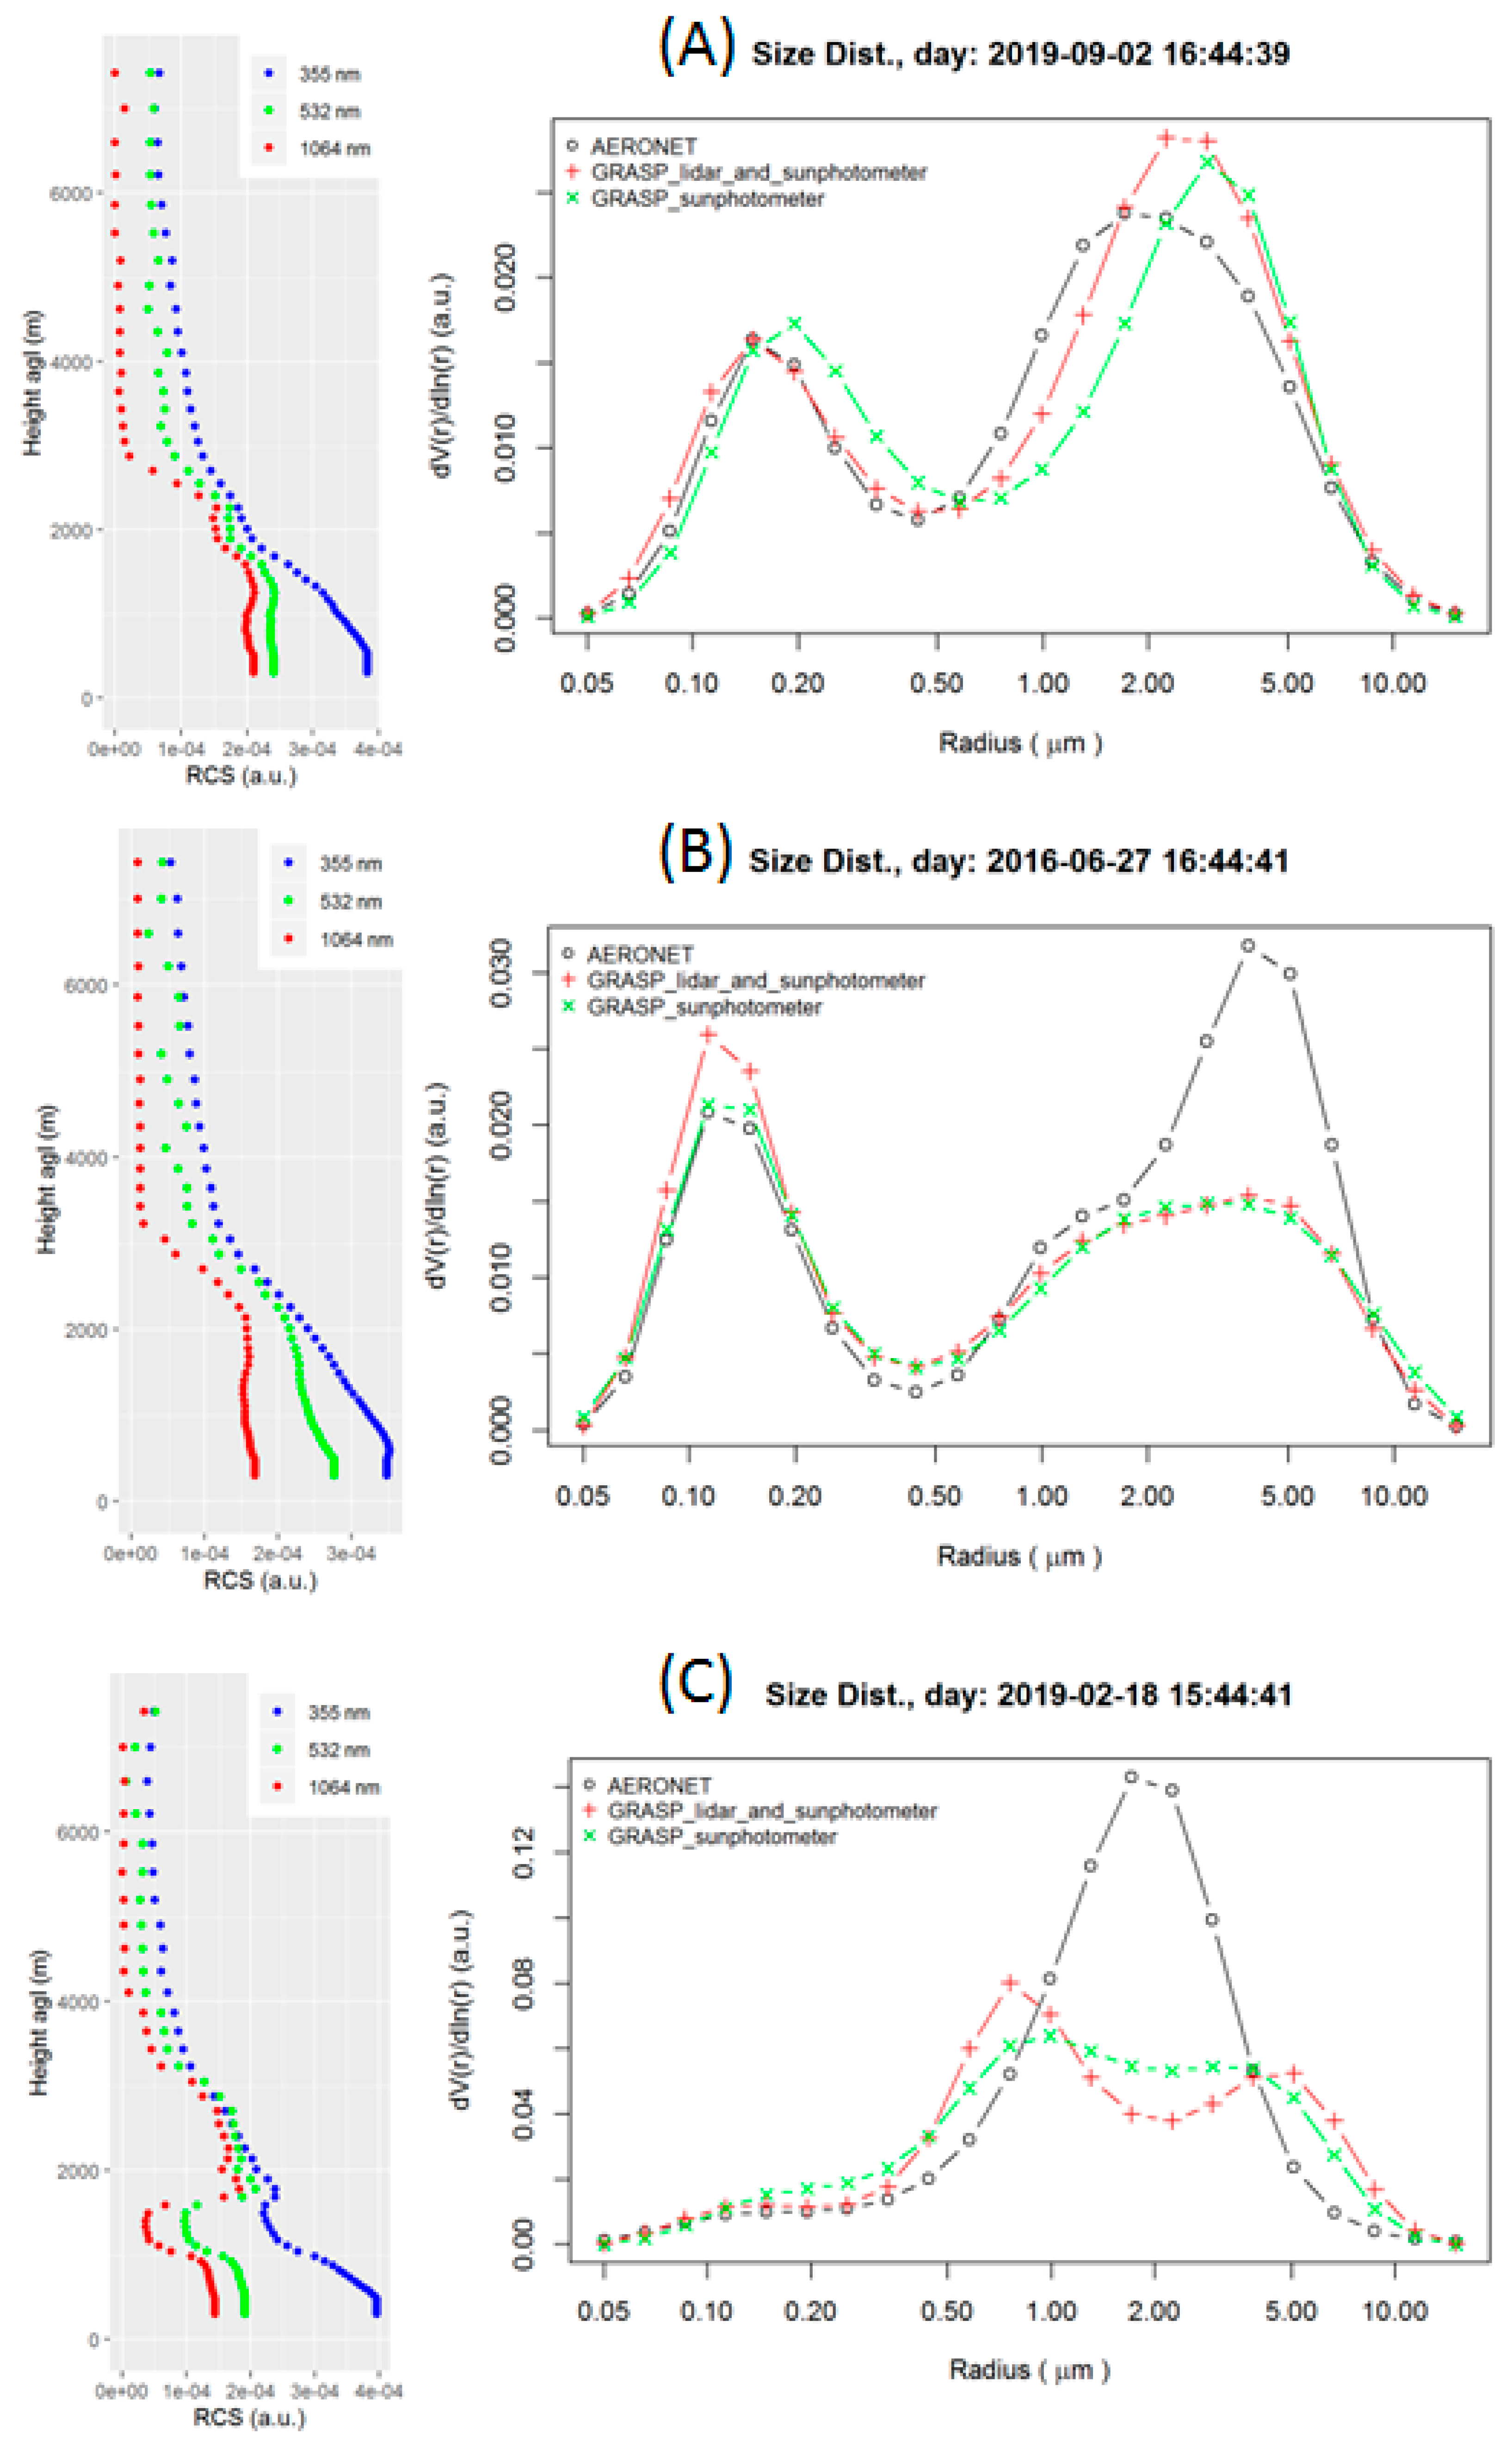
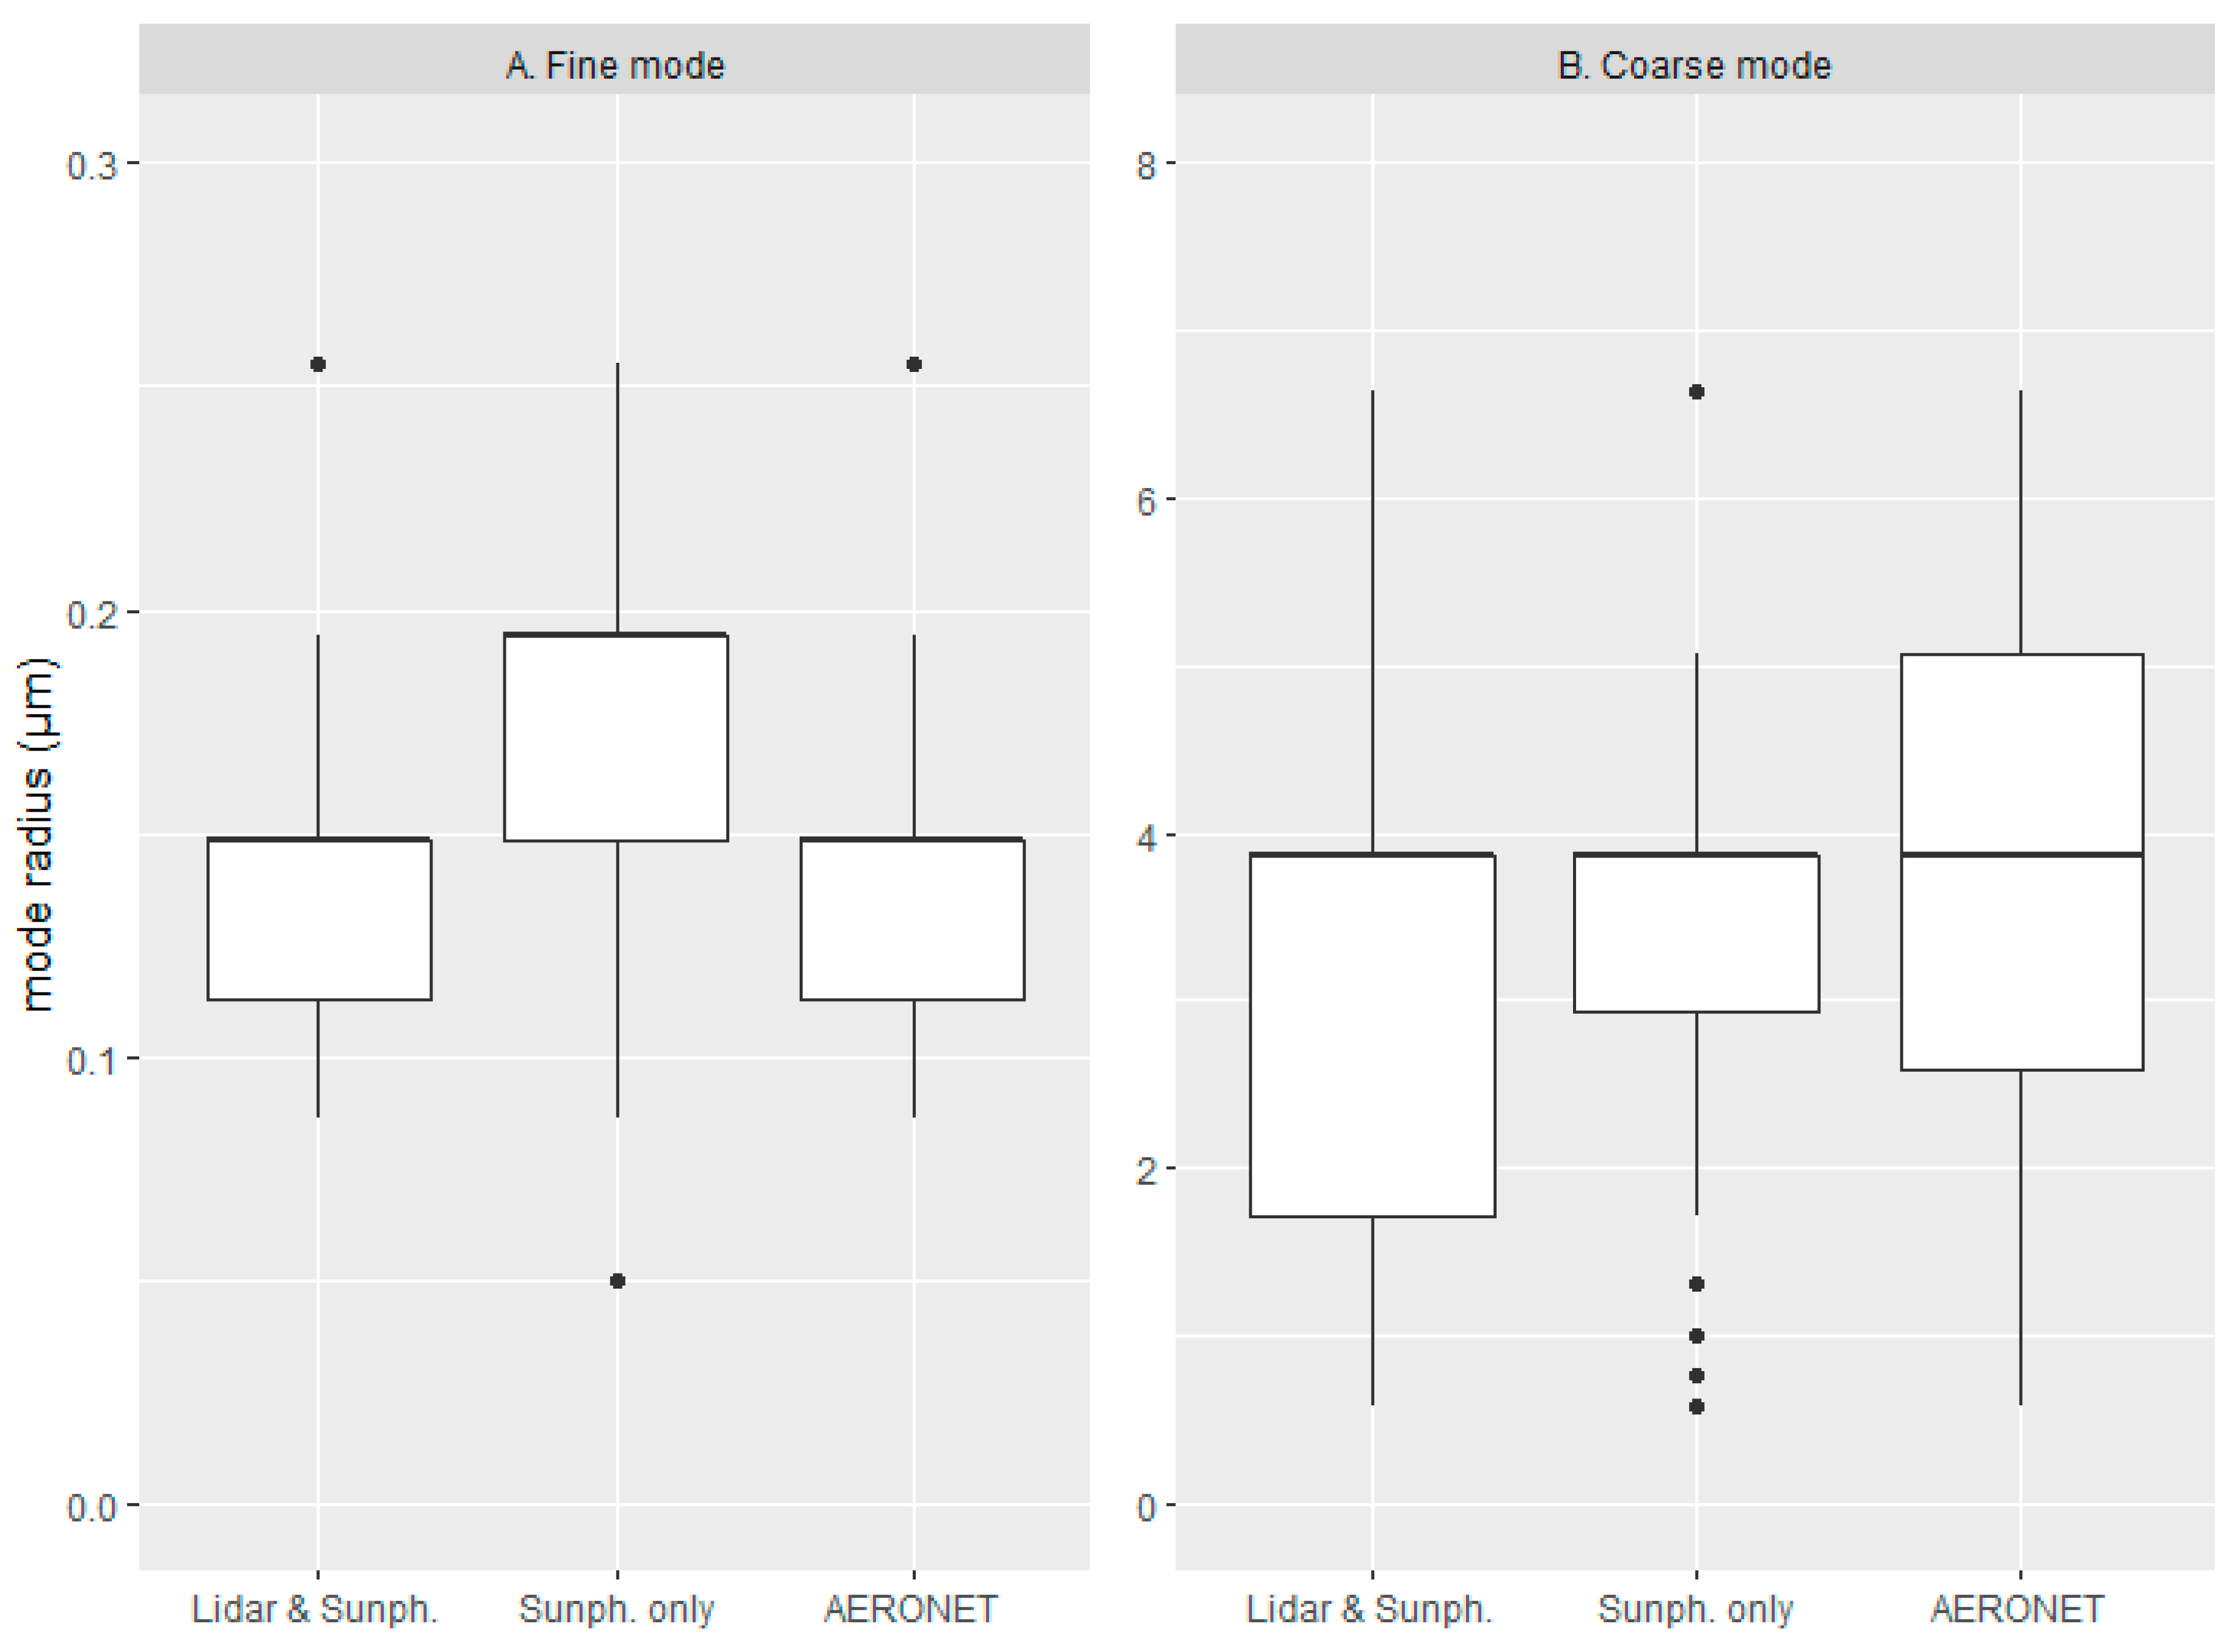
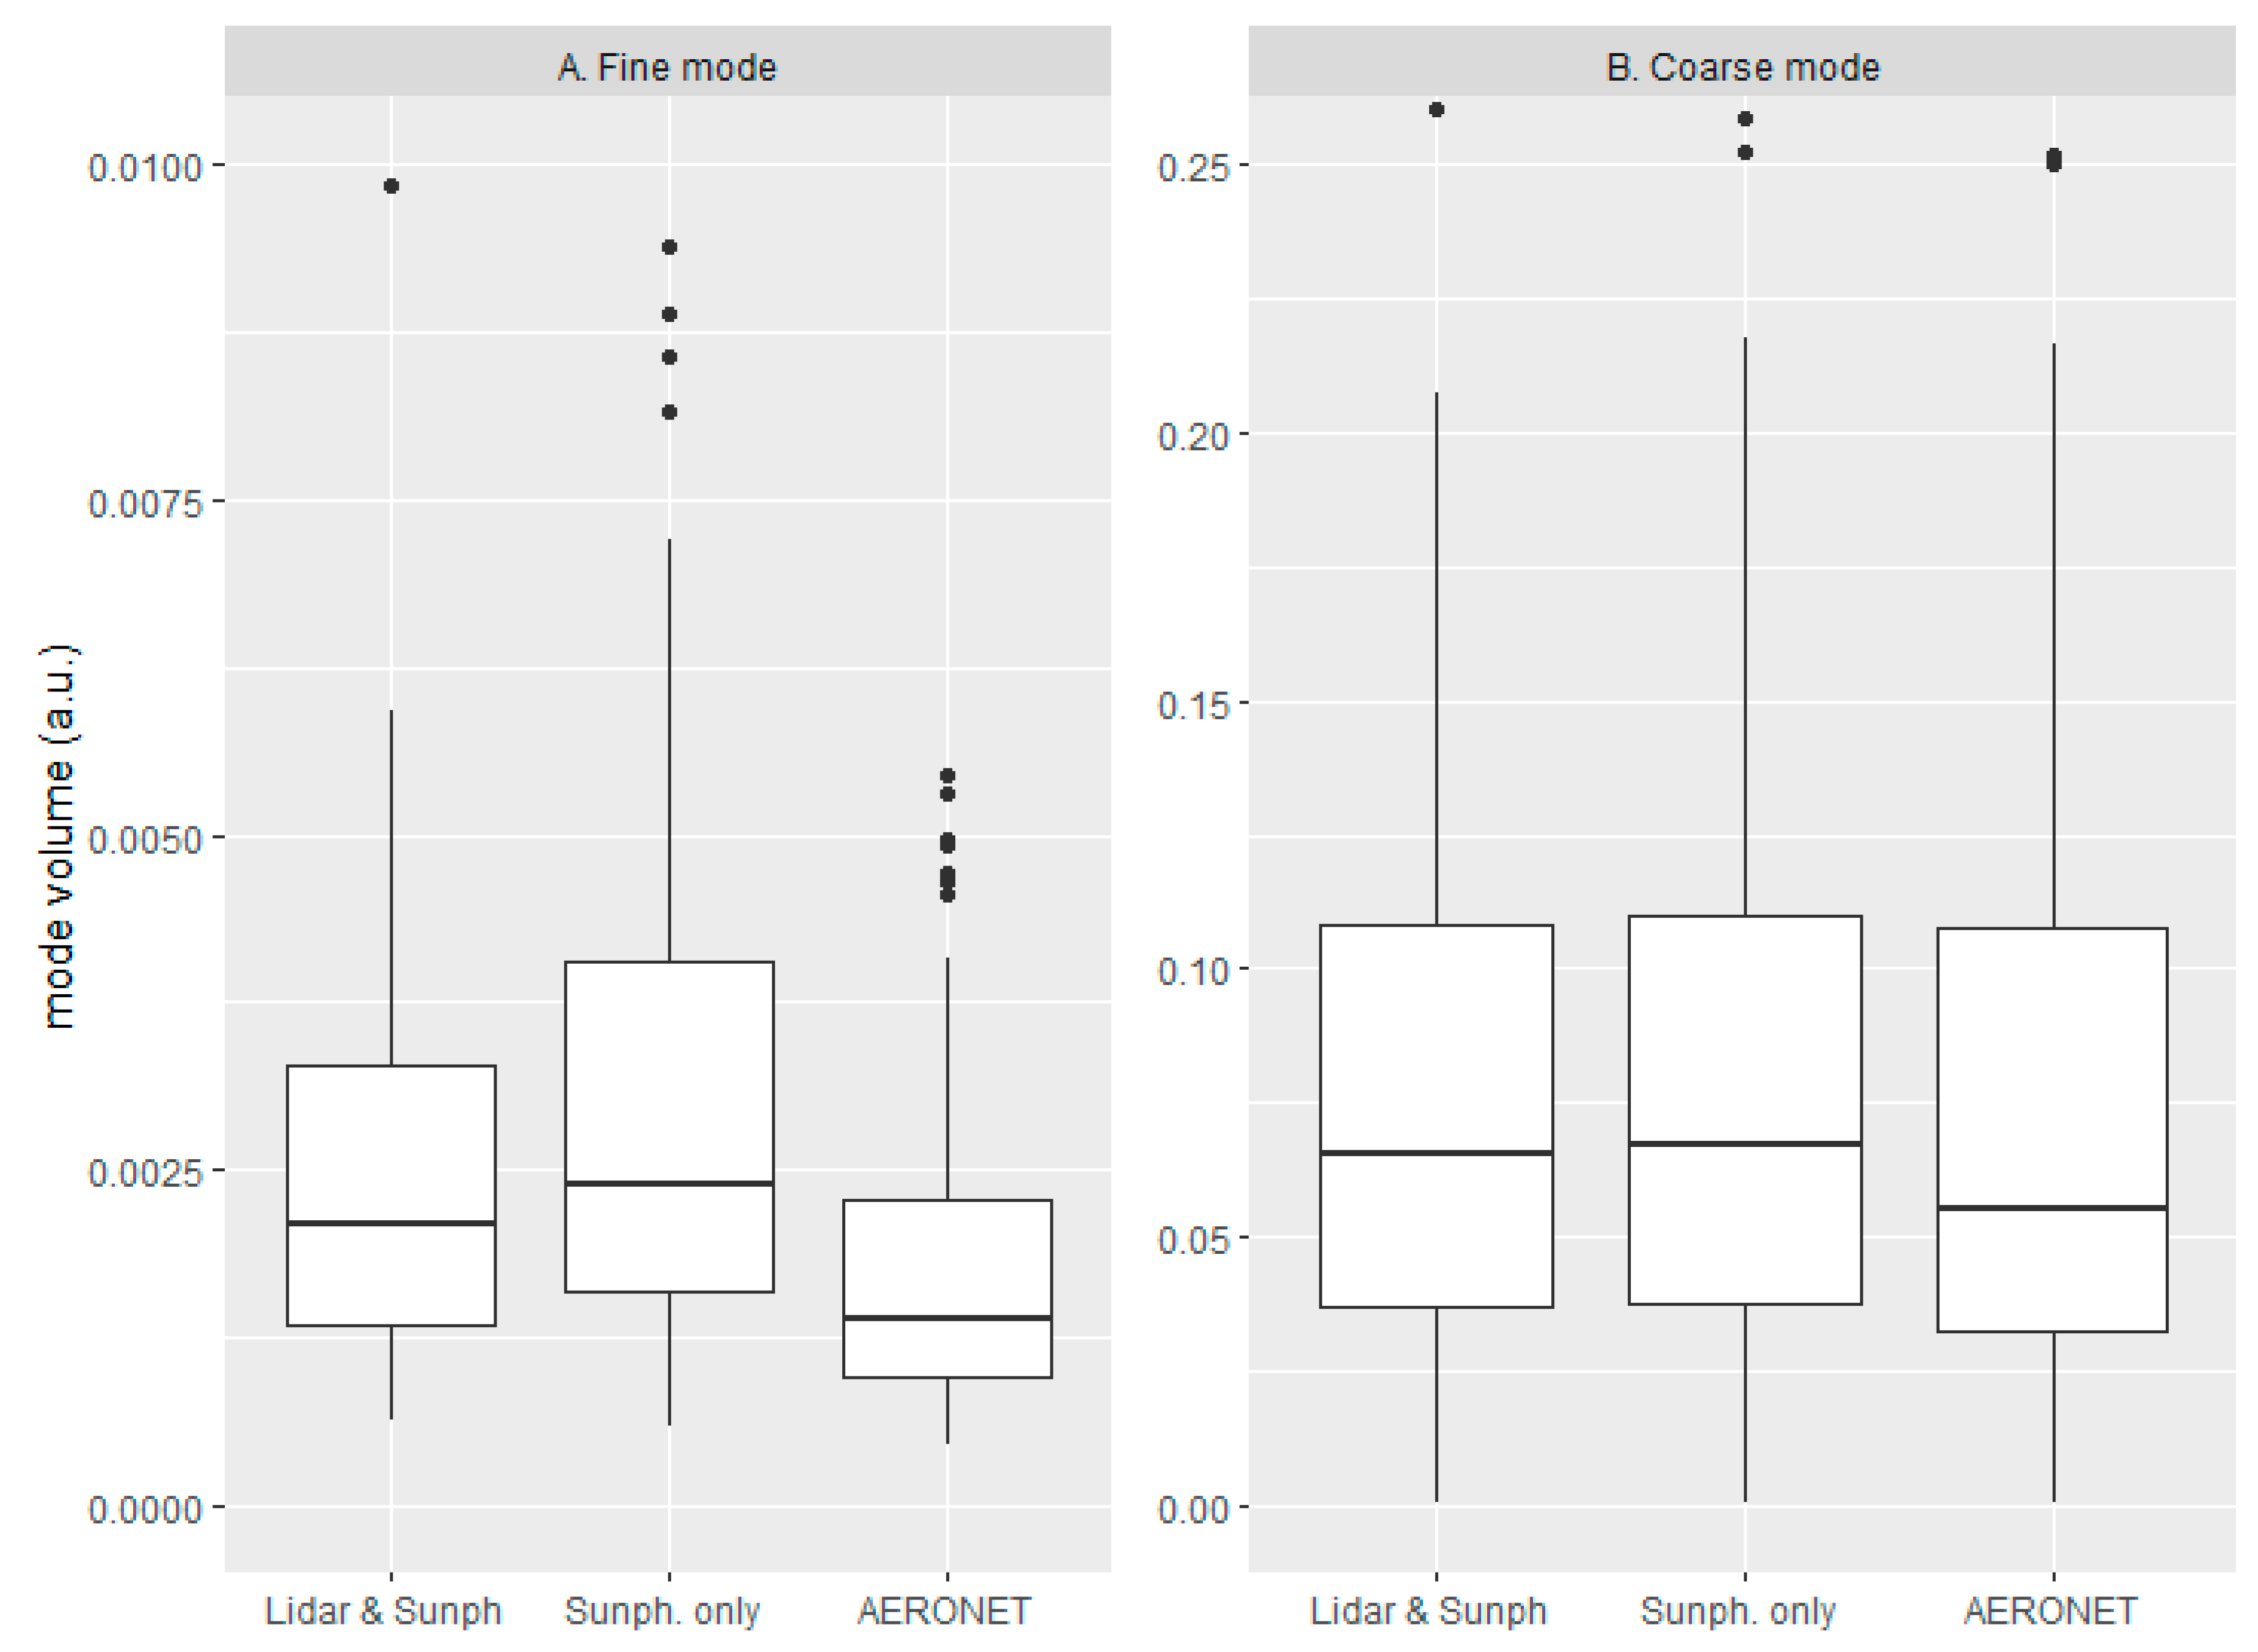
3. Results and Discussion
4. Conclusions
Author Contributions
Funding
Acknowledgments
Conflicts of Interest
References
- Boucher, O.; Randall, D.; Artaxo, P.; Bretherton, C.; Feingold, G.; Forster, P.; Kerminen, V.; Kondo, Y.; Liao, H.; Lohmann, U.; et al. Clouds and Aerosols. In Contribution of Working Group I to the Fifth Assessment Report of the Intergovernmental Panel on Climate Change; Cambridge University Press: Cambridge, UK, 2013. [Google Scholar]
- Myhre, G.; Shindell, D.; Bréon, F.-M.; Collins, W.D.; Fuglestvedt, J.; Huang, J.; Koch, D.; Lamarque, J.-F.; Lee, D.; Mendoza, B.; et al. IPCC AR5 (2013) Chapter 8: Anthropogenic and Natural Radiative Forcing. In Climate Change 2013: The Physical Science Basis. Contribution of Working Group I to the Fifth Assessment Report of the Intergovernmental Panel on Climate Change; Cambridge University Press: Cambridge, UK, 2013. [Google Scholar]
- King, M.D.; Kaufman, Y.J.; Tanré, D.; Nakajima, T. Remote Sensing of Tropospheric Aerosols from Space: Past, Present, and Future. Bull. Am. Meteorol. Soc. 1999, 80. [Google Scholar] [CrossRef]
- Nakajima, T.; Tonna, G.; Rao, R.; Boi, P.; Kaufman, Y.; Holben, B. Use of sky brightness measurements from ground for remote sensing of particulate polydispersions. Appl. Opt. 1996, 35. [Google Scholar] [CrossRef] [PubMed]
- Dubovik, O.; King, M.D. A flexible inversion algorithm for retrieval of aerosol optical properties from Sun and sky radiance measurements. J. Geophys. Res. Atmos. 2000, 105. [Google Scholar] [CrossRef]
- Holben, B.N.; Eck, T.F.; Slutsker, I.; Tanré, D.; Buis, J.P.; Setzer, A.; Vermote, E.; Reagan, J.A.; Kaufman, Y.J.; Nakajima, T.; et al. AERONET—A federated instrument network and data archive for aerosol characterization. Remote Sens. Environ. 1998, 66. [Google Scholar] [CrossRef]
- Dubovik, O. Optimization of Numerical Inversion in Photopolarimetric Remote Sensing. In Photopolarimetry in Remote Sensing; Springer: Berlin/Heidelberg, Germany, 2006. [Google Scholar]
- Schuster, G.L.; Vaughan, M.; MacDonnell, D.; Su, W.; Winker, D.; Dubovik, O.; Lapyonok, T.; Trepte, C. Comparison of CALIPSO aerosol optical depth retrievals to AERONET measurements, and a climatology for the lidar ratio of dust. Atmos. Chem. Phys. 2012, 12. [Google Scholar] [CrossRef]
- Kahn, R.A.; Gaitley, B.J.; Garay, M.J.; Diner, D.J.; Eck, T.F.; Smirnov, A.; Holben, B.N. Multiangle Imaging SpectroRadiometer global aerosol product assessment by comparison with the Aerosol Robotic Network. J. Geophys. Res. Atmos. 2010, 115. [Google Scholar] [CrossRef]
- Kinne, S.; Lohmann, U.; Feichter, J.; Schulz, M.; Timmreck, C.; Ghan, S.; Easter, R.; Chin, M.; Ginoux, P.; Takemura, T.; et al. Monthly averages of aerosol properties: A global comparison among models, satellite data, and AERONET ground data. J. Geophys. Res. Atmos. 2003, 108. [Google Scholar] [CrossRef]
- Derimian, Y.; Dubovik, O.; Huang, X.; Lapyonok, T.; Litvinov, P.; Kostinski, A.B.; Dubuisson, P.; Ducos, F. Comprehensive tool for calculation of radiative fluxes: Illustration of shortwave aerosol radiative effect sensitivities to the details in aerosol and underlying surface characteristics. Atmos. Chem. Phys. 2016, 16. [Google Scholar] [CrossRef]
- Müller, D.; Wandinger, U.; Ansmann, A. Microphysical particle parameters from extinction and backscatter lidar data by inversion with regularization: Theory. Appl. Opt. 1999, 38. [Google Scholar] [CrossRef]
- Molero, F.; Jaque, F. Laser as a tool in environmental problems. Opt. Mater. 1999, 13. [Google Scholar] [CrossRef]
- Campbell, J.R.; Hlavka, D.L.; Welton, E.J.; Flynn, C.J.; Turner, D.D.; Spinhirne, J.D.; Stanley, S.; Hwang, I.H. Full-time, eye-safe cloud and aerosol lidar observation at atmospheric radiation measurement program sites: Instruments and data processing. J. Atmos. Ocean. Technol. 2002, 19. [Google Scholar] [CrossRef]
- Pappalardo, G.; Amodeo, A.; Apituley, A.; Comeron, A.; Freudenthaler, V.; Linné, H.; Ansmann, A.; Bösenberg, J.; D’Amico, G.; Mattis, I.; et al. EARLINET: Towards an advanced sustainable European aerosol lidar network. Atmos. Meas. Tech. 2014, 7. [Google Scholar] [CrossRef]
- Chaikovsky, A.; Dubovik, O.; Holben, B.; Bril, A.; Goloub, P.; Tanré, D.; Pappalardo, G.; Wandinger, U.; Chaikovskaya, L.; Denisov, S.; et al. Lidar-Radiometer Inversion Code (LIRIC) for the retrieval of vertical aerosol properties from combined lidar/radiometer data: Development and distribution in EARLINET. Atmos. Meas. Tech. 2016, 9. [Google Scholar] [CrossRef]
- Lopatin, A.; Dubovik, O.; Chaikovsky, A.; Goloub, P.; Lapyonok, T.; Tanré, D.; Litvinov, P. Enhancement of aerosol characterization using synergy of lidar and sun-photometer coincident observations: The GARRLiC algorithm. Atmos. Meas. Tech. 2013, 6. [Google Scholar] [CrossRef]
- Dubovik, O.; Lapyonok, T.; Litvinov, P.; Herman, M.; Fuertes, D.; Ducos, F.; Torres, B.; Derimian, Y.; Huang, X.; Lopatin, A.; et al. GRASP: A versatile algorithm for characterizing the atmosphere. SPIE Newsroom 2014. [Google Scholar] [CrossRef]
- Kokhanovsky, A.A.; Davis, A.B.; Cairns, B.; Dubovik, O.; Hasekamp, O.P.; Sano, I.; Mukai, S.; Rozanov, V.V.; Litvinov, P.; Lapyonok, T.; et al. Space-based remote sensing of atmospheric aerosols: The multi-angle spectro-polarimetric frontier. Earth Sci. Rev. 2015, 145, 85–116. [Google Scholar] [CrossRef]
- Espinosa, W.R.; Remer, L.A.; Dubovik, O.; Ziemba, L.; Beyersdorf, A.; Orozco, D.; Schuster, G.; Lapyonok, T.; Fuertes, D.; Vanderlei Martins, J. Retrievals of aerosol optical and microphysical properties from Imaging Polar Nephelometer scattering measurements. Atmos. Meas. Tech. 2017, 10. [Google Scholar] [CrossRef]
- Torres, B.; Dubovik, O.; Fuertes, D.; Schuster, G.; Cachorro, V.E.; Lapionak, T.; Goloub, P.; Blarel, L.; Barreto, A.; Mallet, M.; et al. Advanced characterization of aerosol properties from measurements of spectral optical depth using the GRASP algorithm. Atmos. Meas. Tech. Discuss. 2016. [Google Scholar] [CrossRef]
- Granados-Muñoz, M.J.; Sicard, M.; Román, R.; Antonio Benavent-Oltra, J.; Barragán, R.; Brogniez, G.; Denjean, C.; Mallet, M.; Formenti, P.; Torres, B.; et al. Impact of mineral dust on shortwave and longwave radiation: Evaluation of different vertically resolved parameterizations in 1-D radiative transfer computations. Atmos. Chem. Phys. 2019, 19. [Google Scholar] [CrossRef]
- Herreras, M.; Román, R.; Cazorla, A.; Toledano, C.; Lyamani, H.; Torres, B.; Cachorro, V.E.; Olmo, F.J.; Alados-Arboledas, L.; de Frutos, A.M. Evaluation of retrieved aerosol extinction profiles using as reference the aerosol optical depth differences between various heights. Atmos. Res. 2019, 230. [Google Scholar] [CrossRef]
- Fedarenka, A.; Dubovik, O.; Goloub, P.; Li, Z.; Lapyonok, T.; Litvinov, P.; Barel, L.; Gonzalez, L.; Podvin, T.; Crozel, D. Utilization of AERONET polarimetric measurements for improving retrieval of aerosol microphysics: GSFC, Beijing and Dakar data analysis. J. Quant. Spectrosc. Radiat. Transf. 2016, 179. [Google Scholar] [CrossRef]
- Román, R.; Benavent-Oltra, J.A.; Casquero-Vera, J.A.; Lopatin, A.; Cazorla, A.; Lyamani, H.; Denjean, C.; Fuertes, D.; Pérez-Ramírez, D.; Torres, B.; et al. Retrieval of aerosol profiles combining sunphotometer and ceilometer measurements in GRASP code. Atmos. Res. 2018, 204. [Google Scholar] [CrossRef]
- Benavent-Oltra, J.A.; Román, R.; Casquero-Vera, J.A.; Pérez-Ramírez, D.; Lyamani, H.; Ortiz-Amezcua, P.; Bedoya-Velásquez, A.E.; de Arruda Moreira, G.; Barreto, Á.; Lopatin, A.; et al. Different strategies to retrieve aerosol properties at night-time with the GRASP algorithm. Atmos. Chem. Phys. 2019, 19, 14149–14171. [Google Scholar] [CrossRef]
- Salvador, P.; Alonso-Pérez, S.; Pey, J.; Artíñano, B.; de Bustos, J.J.; Alastuey, A.; Querol, X. African dust outbreaks over the western Mediterranean Basin: 11-year characterization of atmospheric circulation patterns and dust source areas. Atmos. Chem. Phys. 2014, 14. [Google Scholar] [CrossRef]
- Salvador, P.; Artíñano, B.; Viana, M.; Alastuey, A.; Querol, X. Evaluation of the changes in the Madrid metropolitan area influencing air quality: Analysis of 1999–2008 temporal trend of particulate matter. Atmos. Environ. 2012, 57. [Google Scholar] [CrossRef]
- Molero, F.; Andrey, F.J.; Fernandez, A.J.; Parrondo, M.C.; Pujadas, M.; Córdoba-Jabonero, C.; Revuelta, M.A.; Gomez-Moreno, F.J. Study of vertically resolved aerosol properties over an urban background site in Madrid (Spain). Int. J. Remote Sens. 2014, 35, 2311–2326. [Google Scholar] [CrossRef]
- Dutton, E.G.; Reddy, P.; Ryan, S.; Deluisi, J.J. Features and effects of aerosol optical depth observed at Mauna Loa, Hawaii: 1982–1992. J. Geophys. Res. 1994, 99. [Google Scholar] [CrossRef]
- Holben, B.N.; Eck, T.F.; Slutsker, I.; Smirnov, A.; Sinyuk, A.; Schafer, J.; Giles, D.; Dubovik, O. Aeronet’s Version 2.0 quality assurance criteria. In Proceedings of the Remote Sensing of the Atmosphere and Clouds; Society of Photo Optical: Washington, DC, USA, 2006; Volume 6408. [Google Scholar]
- Valenzuela, A.; Olmo, F.J.; Lyamani, H.; Antón, M.; Titos, G.; Cazorla, A.; Alados-Arboledas, L. Aerosol scattering and absorption Angström exponents as indicators of dust and dust-free days over Granada (Spain). Atmos. Res. 2015, 154. [Google Scholar] [CrossRef]
- Bond, T.C.; Doherty, S.J.; Fahey, D.W.; Forster, P.M.; Berntsen, T.; Deangelo, B.J.; Flanner, M.G.; Ghan, S.; Kärcher, B.; Koch, D.; et al. Bounding the role of black carbon in the climate system: A scientific assessment. J. Geophys. Res. Atmos. 2013, 118. [Google Scholar] [CrossRef]
- King, M.D.; Dubovik, O. Determination of aerosol optical properties from inverse methods. In Aerosol Remote Sensing; Springer: Berlin/Heidelberg, Germany, 2013; Volume 9783642177255. [Google Scholar]
- Eck, T.F.; Holben, B.N.; Sinyuk, A.; Pinker, R.T.; Goloub, P.; Chen, H.; Chatenet, B.; Li, Z.; Singh, R.P.; Tripathi, S.N.; et al. Climatological aspects of the optical properties of fine/coarse mode aerosol mixtures. J. Geophys. Res. Atmos. 2010, 115. [Google Scholar] [CrossRef]
- Mishchenko, M.I.; Geogdzhayev, I.V.; Rossow, W.B.; Cairns, B.; Carlson, B.E.; Lacis, A.A.; Liu, L.; Travis, L.D. Long-term satellite record reveals likely recent aerosol trend. Science 2007, 315. [Google Scholar] [CrossRef] [PubMed]
- Ross, J. The Radiation Regime and Architecture of Plant Stands; Springer: Berlin/Heidelberg, Germany, 1981. [Google Scholar]
- Li, X.; Strahler, A.H. Geometric-Optical Bidirectional Reflectance Modeling of the Discrete Crown Vegetation Canopy: Effect of Crown Shape and Mutual Shadowing. IEEE Trans. Geosci. Remote Sens. 1992, 30. [Google Scholar] [CrossRef]


| Mode | Scheme | Min | 1st Q | Median | Mean | 3rd Q | Max |
|---|---|---|---|---|---|---|---|
| Fine | Lidar and sunph. | 0.086 | 0.113 | 0.148 | 0.146 | 0.148 | 0.439 |
| Sunphotometer only | 0.05 | 0.148 | 0.194 | 0.189 | 0.194 | 0.439 | |
| AERONET | 0.086 | 0.113 | 0.148 | 0.154 | 0.148 | 0.439 | |
| Coarse | Lidar and sunph. | 0.576 | 1.708 | 3.857 | 3.189 | 3.857 | 6.64 |
| Sunphotometer only | 0.576 | 2.94 | 3.857 | 3.532 | 3.857 | 15.0 | |
| AERONET | 0.572 | 2.59 | 3.857 | 3.732 | 5.061 | 6.64 |
| Mode | Scheme | Min | 1st Q | Median | Mean | 3rd Q | Max |
|---|---|---|---|---|---|---|---|
| Fine | Lidar and sunph. | 6.21 × 10⁻⁴ | 1.35 × 10⁻³ | 2.09 × 10⁻³ | 6.66 × 10⁻² | 3.28 × 10⁻³ | 5.06 |
| Sunphotometer only | 5.76 × 10⁻⁴ | 1.6 × 10⁻³ | 2.39 × 10⁻³ | 3.69 × 10⁻³ | 4.06 × 10⁻³ | 4.06 × 10⁻³ | |
| AERONET | 4.58 × 10⁻⁴ | 9.53 × 10⁻⁴ | 1.39 × 10⁻³ | 2.63 × 10⁻³ | 2.27 × 10⁻³ | 2.63 × 10⁻³ | |
| Coarse | Lidar and sunph. | 5.44 × 10⁻⁴ | 3.71 × 10⁻² | 6.52 × 10⁻² | 8.98 × 10⁻² | 1.08 × 10⁻¹ | 4.39 × 10⁻¹ |
| Sunphotometer only | 4.62 × 10⁻⁴ | 3.77 × 10⁻² | 6.69 × 10⁻² | 8.62 × 10⁻² | 1.1 × 10⁻¹ | 4.65 × 10⁻¹ | |
| AERONET | 3.56 × 10⁻⁴ | 3.22 × 10⁻² | 5.49 × 10⁻² | 8.57 × 10⁻² | 1.07 × 10⁻¹ | 4.72 × 10⁻¹ |
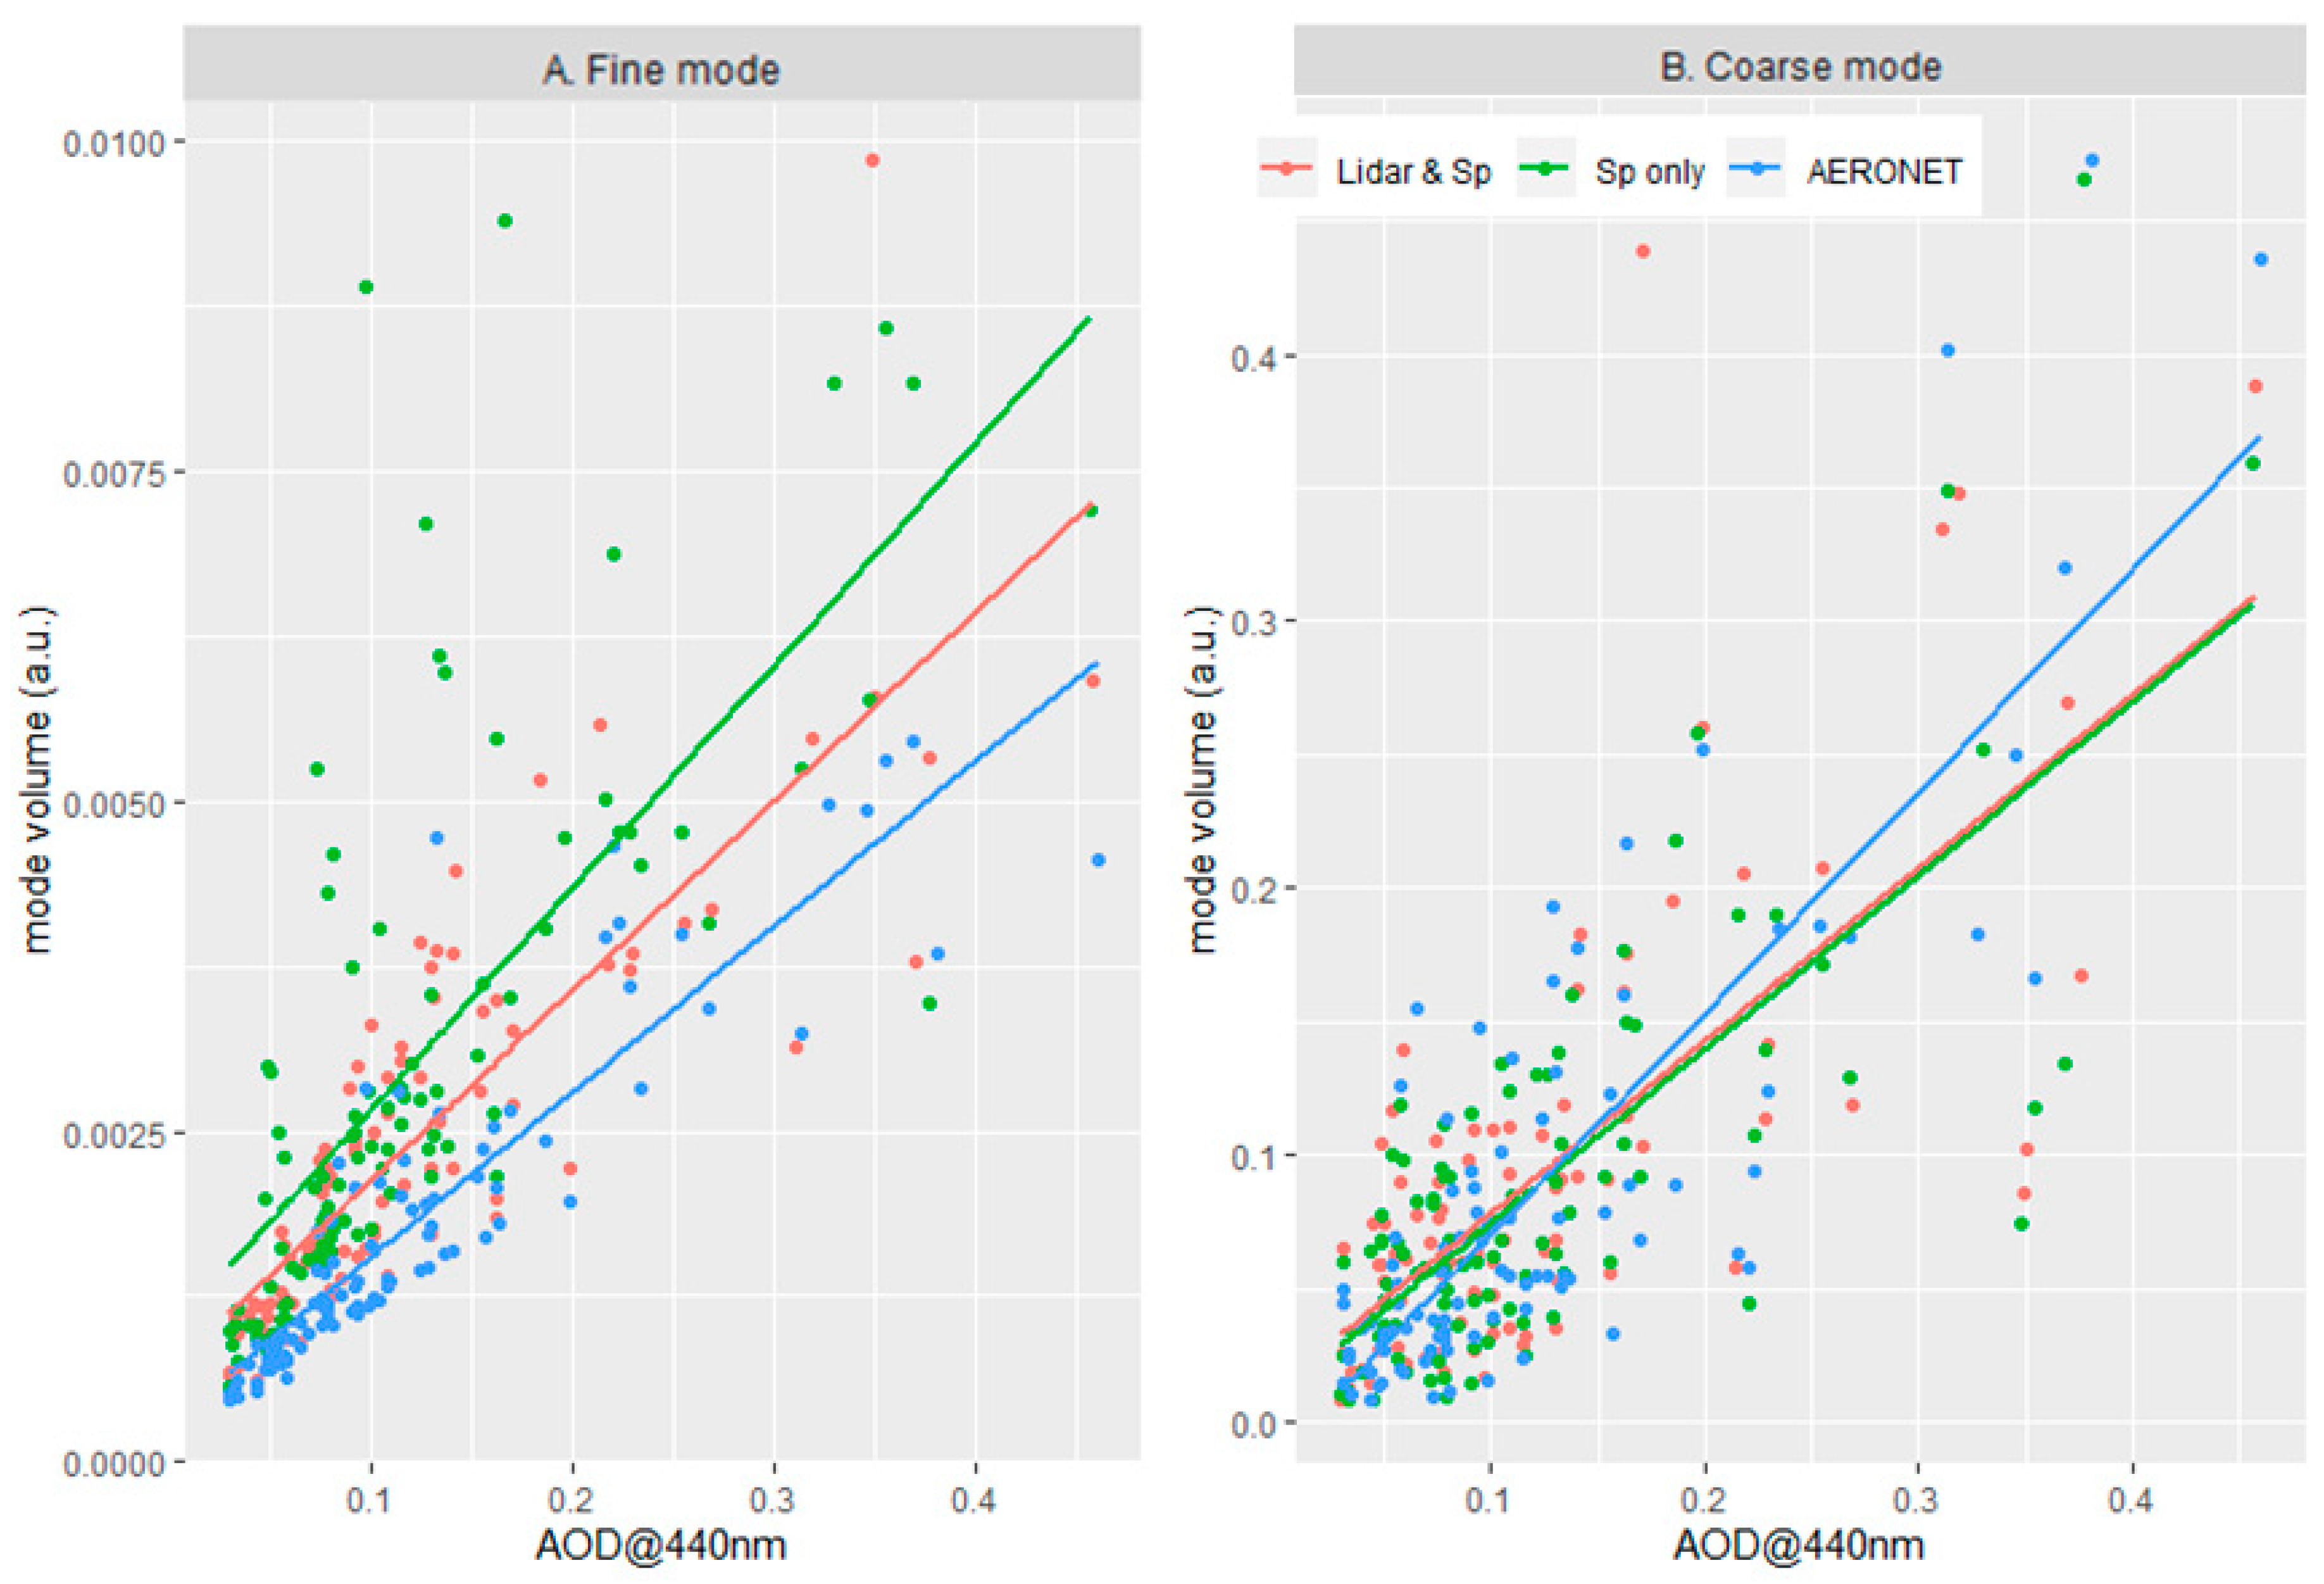
| Mode | Scheme | a | b | R2 |
|---|---|---|---|---|
| Fine | Lidar and sunphotometer | 6.95 × 10⁻⁴ | 0.014 | 0.693 |
| Sunphotometer only | 9.78 × 10⁻⁴ | 0.017 | 0.519 | |
| AERONET | 2.93 × 10⁻⁴ | 0.013 | 0.798 | |
| Coarse | Lidar and sunphotometer | 1.39 × 10⁻² | 0.646 | 0.486 |
| Sunphotometer only | 9.88 × 10⁻³ | 0.650 | 0.549 | |
| AERONET | −1.20 × 10⁻² | 0.827 | 0.672 |
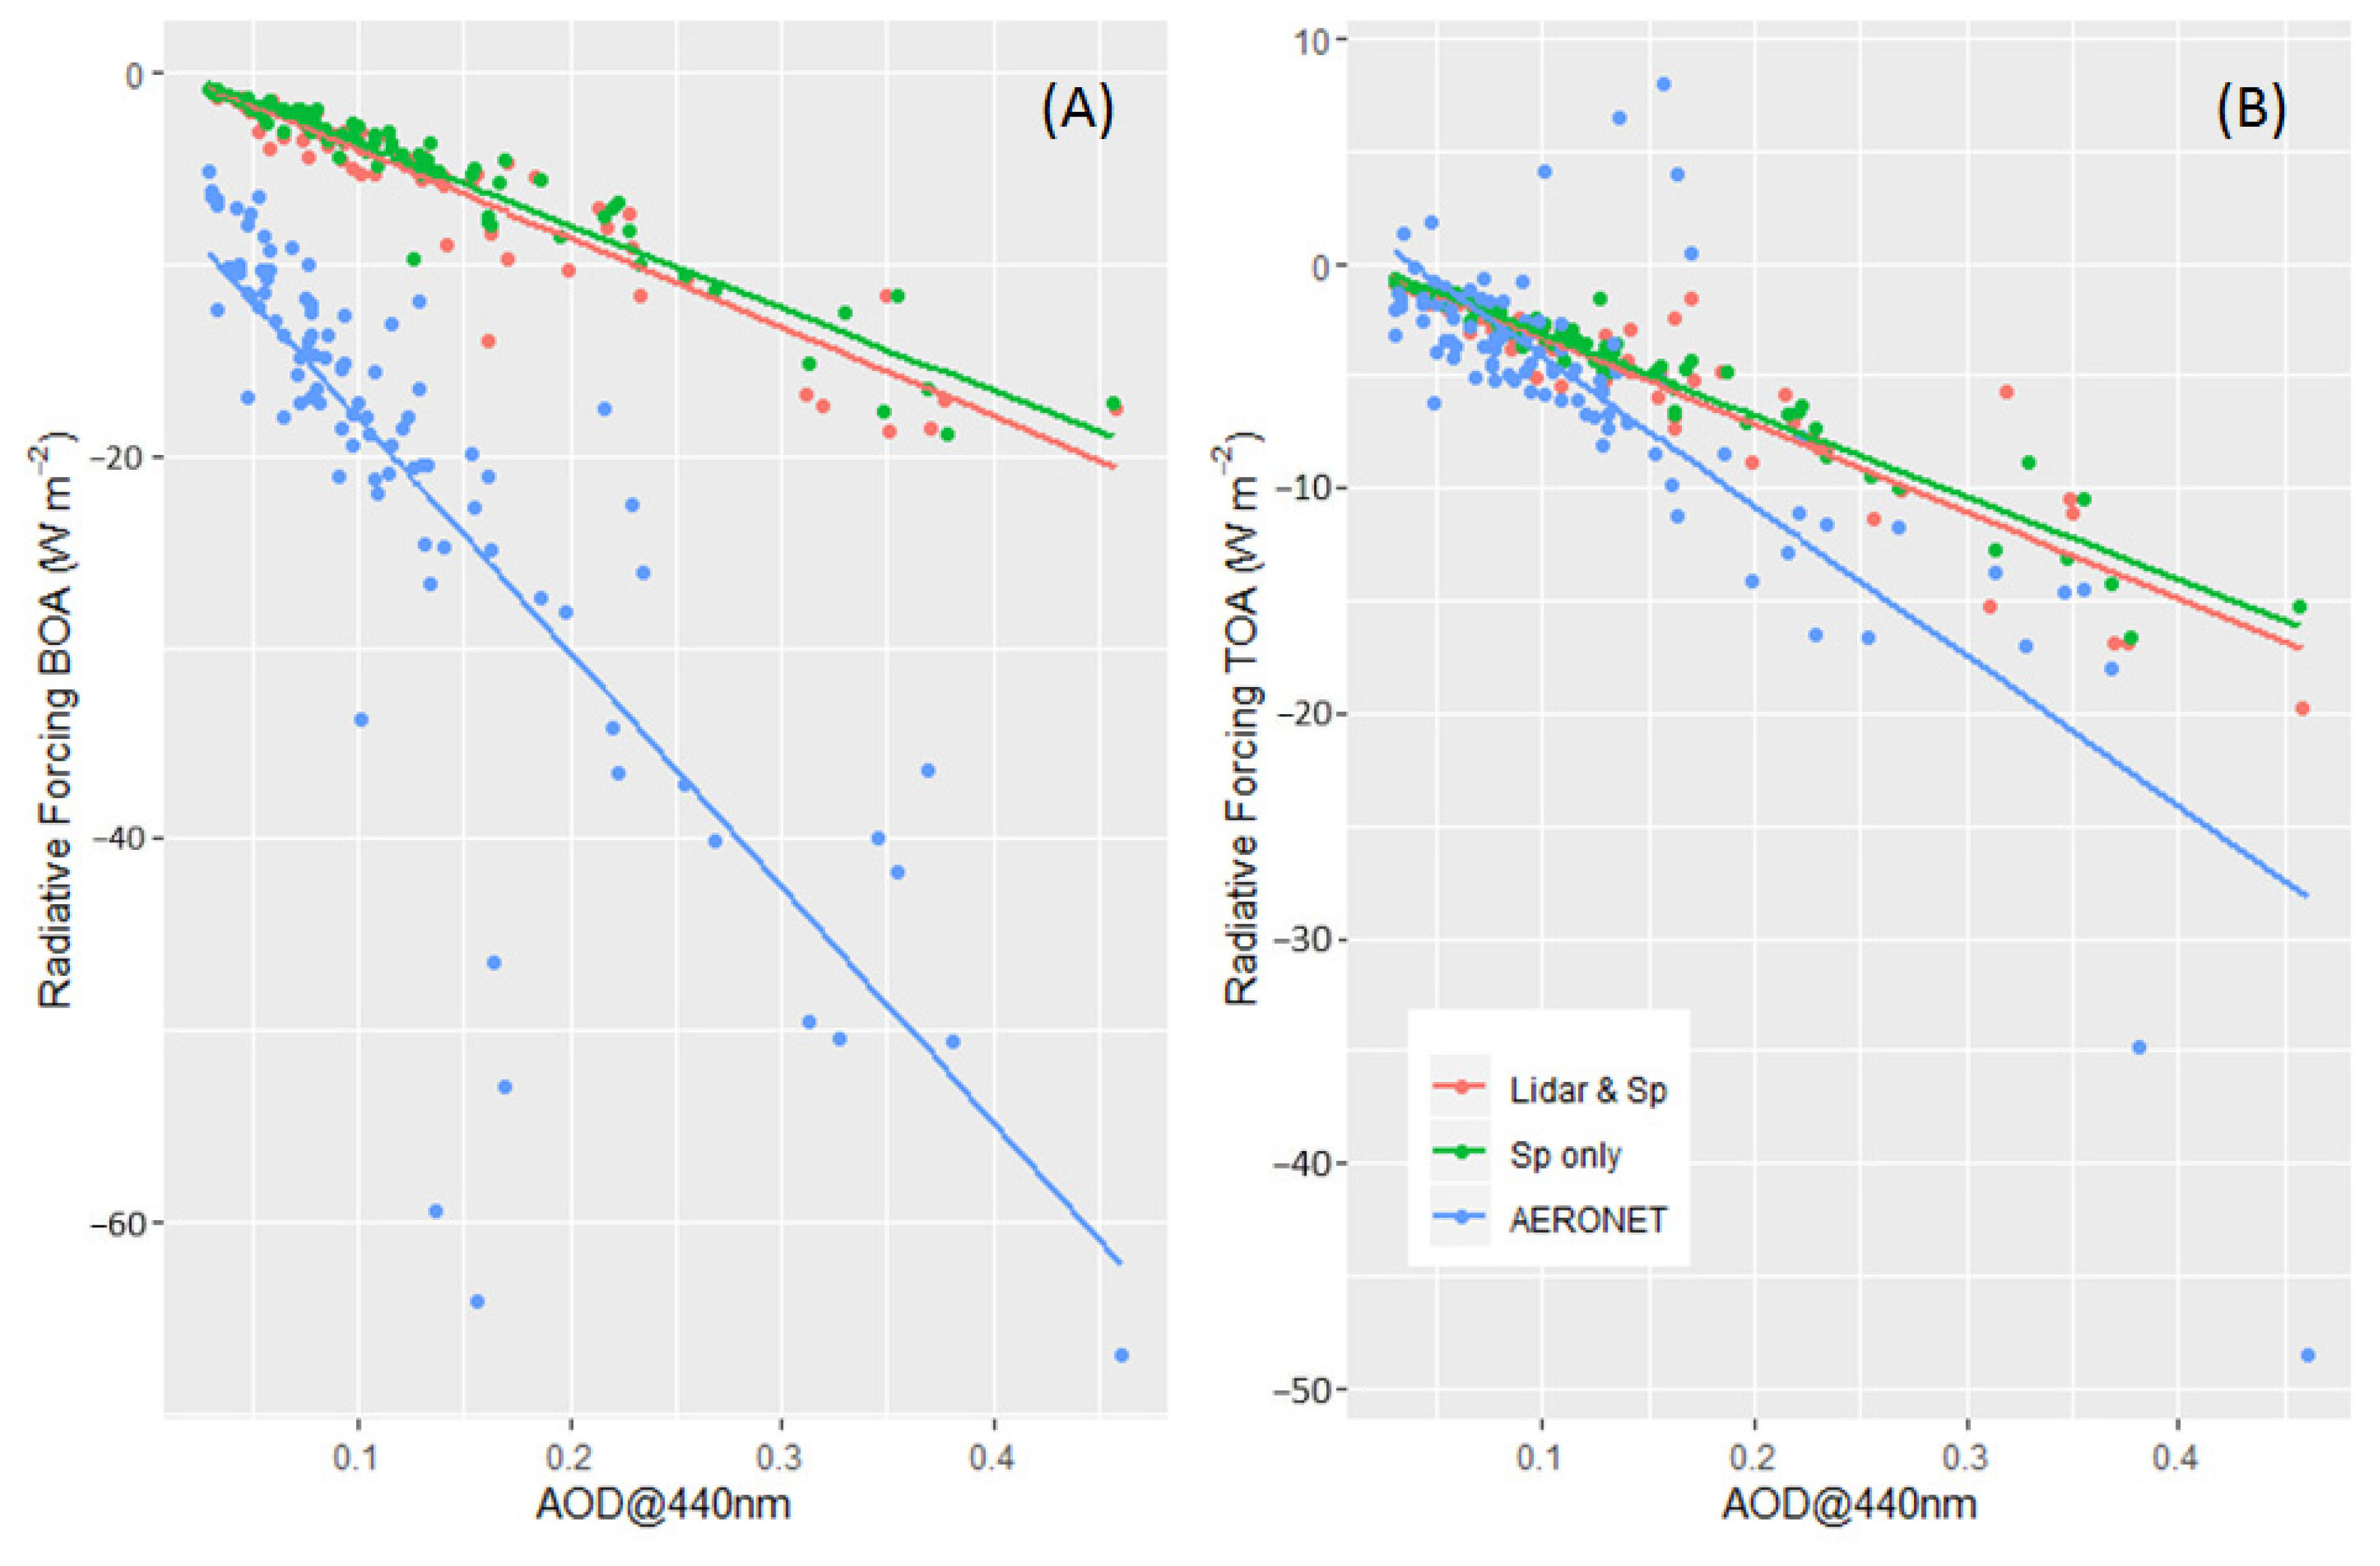
| Level | Scheme | a | b | R2 |
|---|---|---|---|---|
| BOA | Lidar and sunphotometer | 0.6525 | −46.4 | 0.889 |
| Sunphotometer only | 0.688 | −43.2 | 0.926 | |
| AERONET | −5.768 | −122.5 | 0.651 | |
| TOA | Lidar and sunphotometer | 0.556 | −38.6 | 0.872 |
| Sunphotometer only | 0.511 | −36.4 | 0.943 | |
| AERONET | 2.509 | −66.5 | 0.652 |
Publisher’s Note: MDPI stays neutral with regard to jurisdictional claims in published maps and institutional affiliations. |
© 2020 by the authors. Licensee MDPI, Basel, Switzerland. This article is an open access article distributed under the terms and conditions of the Creative Commons Attribution (CC BY) license (http://creativecommons.org/licenses/by/4.0/).
Share and Cite
Molero, F.; Pujadas, M.; Artíñano, B. Study of the Effect of Aerosol Vertical Profile on Microphysical Properties Using GRASP Code with Sun/Sky Photometer and Multiwavelength Lidar Measurements. Remote Sens. 2020, 12, 4072. https://doi.org/10.3390/rs12244072
Molero F, Pujadas M, Artíñano B. Study of the Effect of Aerosol Vertical Profile on Microphysical Properties Using GRASP Code with Sun/Sky Photometer and Multiwavelength Lidar Measurements. Remote Sensing. 2020; 12(24):4072. https://doi.org/10.3390/rs12244072
Chicago/Turabian StyleMolero, Francisco, Manuel Pujadas, and Begoña Artíñano. 2020. "Study of the Effect of Aerosol Vertical Profile on Microphysical Properties Using GRASP Code with Sun/Sky Photometer and Multiwavelength Lidar Measurements" Remote Sensing 12, no. 24: 4072. https://doi.org/10.3390/rs12244072
APA StyleMolero, F., Pujadas, M., & Artíñano, B. (2020). Study of the Effect of Aerosol Vertical Profile on Microphysical Properties Using GRASP Code with Sun/Sky Photometer and Multiwavelength Lidar Measurements. Remote Sensing, 12(24), 4072. https://doi.org/10.3390/rs12244072