Article

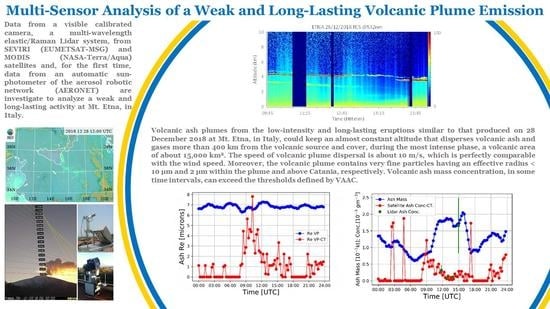
Multi-Sensor Analysis of a Weak and Long-Lasting Volcanic Plume Emission

1
Istituto Nazionale di Geofisica e Vulcanologia, Osservatorio Etneo, Piazza Roma 2, 95125 Catania, Italy
2
Consiglio Nazionale delle Ricerche, Istituto di Metodologie per l’Analisi Ambientale, CNR-IMAA, 85050 Tito Scalo, Italy
3
Istituto Nazionale di Geofisica e Vulcanologia, Osservatorio Nazionale Terremoti, via di Vigna Murata 605, 00143 Rome, Italy
4
Istituto Nazionale di Astrofisica—Osservatorio Astrofisico di Catania, 95123 Catania, Italy
5
Dipartimento di Fisica—Università degli studi Napoli “Federico II”, 80126 Naples, Italy
*
Author to whom correspondence should be addressed.
Remote Sens. 2020, 12(23), 3866; https://doi.org/10.3390/rs12233866
Submission received: 20 September 2020 / Revised: 17 November 2020 / Accepted: 20 November 2020 / Published: 25 November 2020
(This article belongs to the Special Issue Ground Based Imaging of Active Volcanic Phenomena)

Abstract

:
Volcanic emissions are a well-known hazard that can have serious impacts on local populations and aviation operations. Whereas several remote sensing observations detect high-intensity explosive eruptions, few studies focus on low intensity and long-lasting volcanic emissions. In this work, we have managed to fully characterize those events by analyzing the volcanic plume produced on the last day of the 2018 Christmas eruption at Mt. Etna, in Italy. We combined data from a visible calibrated camera, a multi-wavelength elastic/Raman Lidar system, from SEVIRI (EUMETSAT-MSG) and MODIS (NASA-Terra/Aqua) satellites and, for the first time, data from an automatic sun-photometer of the aerosol robotic network (AERONET). Results show that the volcanic plume height, ranging between 4.5 and 6 km at the source, decreased by about 0.5 km after 25 km. Moreover, the volcanic plume was detectable by the satellites up to a distance of about 400 km and contained very fine particles with a mean effective radius of about 7 µm. In some time intervals, volcanic ash mass concentration values were around the aviation safety thresholds of 2 × 10⁻³ g m−3. Of note, Lidar observations show two main stratifications of about 0.25 km, which were not observed at the volcanic source. The presence of the double stratification could have important implications on satellite retrievals, which usually consider only one plume layer. This work gives new details on the main features of volcanic plumes produced during low intensity and long-lasting volcanic plume emissions.

Graphical Abstract

1. Introduction

Etna is one of the most active volcanoes in the world, characterized by frequent eruptive activity from summit craters (NEC = Northeast crater, VOR = Voragine, BN = Bocca Nuova, SEC = Southeast Crater, NSEC = New Southeast Crater (Figure 1)) and from fractures opened on volcano flanks [1]. Those fissures are related to the emplacement of dikes diverging from the central conduit or, more rarely, directly from the main magma chamber [2]. When this happens, the eruption is known as eccentric (or peripheral) [2]. On the morning of 24 December 2018, an eruptive fracture opened at the base of the NSEC and propagated southeastward from 11:11 to ∼11:35 GMT (all times in GMT), reaching 2400 m above sea level (all heights refer to above sea level) [3]. Several vents opened from this fracture and produced violent Strombolian and lava fountain activity. The eruptive activity formed a volcanic plume of 8 km that was dispersed toward the southeast and lava flows that ran toward the western wall of the Valle del Bove [4,5]. At 11:42, a north–south fissure opened on the north of the NSEC at 3000 m, which showed weak Strombolian activity for only a few minutes [5]. Moreover, Strombolian activity from the NEC and BN craters occurred at the same time. The explosive activity markedly decreased at about 13:30, together with the decrease of volcanic tremor [3]. On 26 December, after a seismic swarm of more than 130 earthquakes in 3 h [6], there was a powerful earthquake (Ml = 4.8 at 02:19) due to a movement of the Fiandaca Fault that injured 28 people and caused some damages to the buildings of six villages [7]. The lava flow stopped on 27 December [4]. Strombolian activity from the BN crater had variable intensity up to 28 December when it stopped late in the afternoon.
The analysis of the geometrical structure, composition and dispersal of volcanic plumes has several objectives. Measurements of column height versus time are very useful to estimate the mass eruption rate [8] that subsequently may be used by models to forecast volcanic ash dispersal in the atmosphere [9,10] as well as to estimate the total mass of ash ejected during an eruption. The analysis of plume dispersal and composition gives new insights into some physical processes that may happen during the movement of volcanic clouds in the atmosphere, for example, the interaction among different volcanic particles that can promote aggregation processes [11]. Moreover, volcanic emissions may have a relevant impact on aerosol properties in the atmosphere [12] and can contribute regionally and globally to climate changes [13]. Furthermore, the full characterization and monitoring of volcanic emissions during an eruption is essential to provide an assessment of the impact and prevent associated risks [14].
In literature, there are only a few studies that focus on explosive volcanism from mafic magma, although it is widely recognized that significant hazards can also occur during basaltic eruptions [15,16]. Although geophysical instruments can highlight some constraints on the eruptive dynamics [17], observations of low intensity and long-lasting volcanic plumes carried out by remote sensing systems are instead rare [18,19]. Consequently, it is very important to investigate these types of events in order to better improve our knowledge of the total erupted mass, column height, plume thickness and particle radius, as well as investigate some processes that characterize the volcanic ash dispersal and fallout.
On 28 December 2018, we collected and analyzed remote sensing data from different ground-based (visible camera, Lidar and photometer) and satellite (SEVIRI and MODIS) sensors. Those measurements, analyzed and compared for the first time at Etna volcano, have allowed a full characterization of volcanic emission from the source up to several kilometers. The paper is organized as follows: In Section 2, we briefly describe the materials and methods; in Section 3, we estimate, compare and combine results retrieved by the different remote sensing systems. Finally, in Section 4, we discuss our findings in detail.

2. Materials and Methods

2.1. Visible Calibrated Images

We used visible calibrated images from a new camera recently installed on the west flank of Etna near the town of Bronte named EBVH (14.8568°; 37.8096°; Figure 1a). The camera was a VIVOTEK IP8172P, with a 1/2.5” progressive CMOS (complementary metal-oxide semiconductor) image sensor and a maximum resolution of 2560 × 1920. The focal length is 3.3–10.5 mm, and the aperture was F 1.6 (wide)–F 2.7 (tele). The field-of-view was 33°–93° (vertical), 24°–68° (horizontal) and 40°–119° (diagonal). The EBVH camera was calibrated, as described in [20], and the same technique was used in [21,22,23,24]. In order to estimate the plume height, our algorithm uses: (1) the position of the camera (obtained using global positioning system); (2) orientation of the camera (obtained using a 3D tool aimed to simulate the camera and performed by aligning the skyline with the digital elevation model (DEM) of Etna volcano); (3) a geometric model of the plume. We assumed that the volcanic plume has a negligible depth and that it was locally confined to a vertical plane that rotates according to the wind direction at different heights. The uncertainty of the column height was +/− 0.5 km, equal to the distance among the horizontal lines drawn in the calibrated visible images [23]. Th column height with respect to time was evaluated manually by an operator with an uncertainty of less than 2% [23].

2.2. Lidar Measurements

We used a compact multi-wavelength elastic/Raman Lidar system with scanning capability named AMPLE operated at the Istituto Nazionale di Astrofisica, Catania (INAF-OACT, 37.53°N, 15.07°E, at 173 a.s.l.), at about 25 km from Etna’s summit craters (Figure 1a). The Lidar system is part of the EARLINET network (https://www.earlinet.org), and is mainly used to monitor explosive activity at Etna. It is a prototype developed in the frame of the VAMOS SEGURO project (www.vamosseguro.eu), in cooperation with the National Interuniversity Consortium for the Physical Sciences of Matter (CNISM) [25]. AMPLE uses a doubled and tripled Nd:YAG diode-pumped laser with a repetition rate of 1 kHz and average optical power of 0.6 W at 355 nm, 1.5 W at 532 nm and a receiving system based on a 25 cm modified Cassegrain telescope [25]. The system was designed to collect elastic Lidar returns at 355 and 532 nm (parallel and cross-polarized signals) and the N2 Raman echos at 386 nm and 607 nm. The raw spatial resolution is 15 m. aerosol optical properties estimated by Lidar, along the laser line of sight, are the particle backscattering, extinction coefficients [26], the corresponding extinction-to-backscatter ratio (Lidar ratio (LR)) and particle linear depolarization ratio at both 355 nm and 532 nm. During nighttime observations, the aerosol extinction coefficient was estimated using the method proposed by [27]. The LR can be directly measured using the elastic/Raman technique that is able to give independent measurements of backscattering and extension coefficient profiles collected in the afternoon. In the daytime, the Klett–Fernald algorithm [28,29] provides the particle backscattering coefficients. Following the approach proposed in [25], during daytime observations, we fixed the LR values equal to the LR values estimated in the afternoon when Raman measurements were performed. The depolarization values were obtained from the elastic Lidar profiles measured in the parallel and cross-polarized channels at 355 and 532 nm according to inversion procedures reported in [30,31]. Details on uncertainty in Lidar measurements can be found in [25]. Volcanic ash mass concentration was estimated following the approach described in [32,33] and applied by [9,19,25,34]. It is obtained using this formulation:
c   =   k   ×   LR   ×   β a   ×   ρ
where k is the ash conversion factor, which is a function of the effective particle radius Re (k = 2/3 Re), LR is the Lidar ratio, and ρ is the particle density equal to 2450 kg/m3. The aerosol backscattering was derived from the Lidar measurements:
β a = β a e r δ a e r δ n a 1 + δ a δ a δ n a 1 + δ a e r
where β a e r and δ a e r values are obtained by Lidar measurements, δ n a and δ a are set to 0.01 and 0.5.

2.3. Satellite Measurements

We used data from the spinning enhanced visible and infrared imager (SEVIRI) instrument onboard the Meteosat second generation (MSG) geostationary satellite acquired in near real time from the INGV satellite-receiving station located in Rome. The SEVIRI ground pixel size is 3 × 3 km2, and the time step varies from 5 to 15 min. The volcanic cloud detection was realized through an RGB composite obtained by combining the brightness temperature (Tb) of the three SEVIRI thermal infrared channels centered at 8.7, 10.8 and 12 µm (R: Tb,8.7–Tb,10.8; G: Tb,12–Tb,10.8; B: Tb,10.8). The ash and SO2 parameters were obtained using the “volcanic plume retrieval (VPR)” procedure [35,36,37]. VPR requires only the volcanic plume top height (VPTH). It is based on the computation of a new satellite image by replacing the radiance values in the region occupied by the plume with those obtained from a simple linear regression of the radiance outside the edges of the plume itself. Through the application of a simplified atmospheric model, VPTH, the original and new images allow estimating the volcanic plume transmittances in the TIR channels centered at 8.7, 10.8 and 12 μm. From these values, the ash parameters aerosol optical depth (AOD), effective radius (Re), mass (Ma) and SO2 (Ms) mass were computed. In accordance with [38,39,40], the uncertainties were set to 40% for all the different retrievals parameters. In this work, with the volcanic plume being too diluted to allow for a satellite-based cloud top height estimation, the VPTH used to run the VPR procedure was derived from the calibrated images collected by the ground-based visible cameras installed on Etna’s flanks (see Section 2.1) [24]. When possible, the retrievals were compared using the same procedures, with results obtained by the moderate resolution imaging spectroradiometer (MODIS). This is a multispectral instrument onboard the NASA-Terra and NASA-Aqua satellites. It has 36 channels from visible to thermal infrared, a nadir spatial resolution of 1 km2 and a revisit time of 1–2 days (https://modis.gsfc.nasa.gov/).

2.4. Photometer Data

We used data from the automatic CIMEL CE-318 sun-photometer measurements of the aerosol robotic network (AERONET), which is a well-known and established network dedicated to real-time characterization and monitoring of columnar aerosol properties [41,42]. Data are freely available at http://aeronet.gsfc.nasa.gov. The sun-photometer is operating at Vena, a small town located on the northeast flank of the volcano (ETNA_VENA, 37.79° N, 15.14° E and altitude of 735 m). It has been making routine observations automatically since July 2018 (Figure 1). The AERONET retrieval products used in this study come from the AERONET web site Level 1.0 (Raw) unscreened data. Measurements of the solar spectral irradiance are used to derive columnar aerosol optical depth AOD (±0.01) within the range 340 to 1640 nm and the Ångström exponent (AE). Smaller AE (less than 1.0) was indicative of larger particles such as sea salt aerosols and soil dusts, while larger AE (between 1.0 and 2.5) is indicative of smaller particles such as sulfates or particles from biomass burning [43]. The AE was obtained from the spectral AOD(λ) using the following formulation [44]:
A E = l n ( A O T λ 2 / A O T λ 1 / l n λ 2 / λ 1 .

3. Results and Discussion

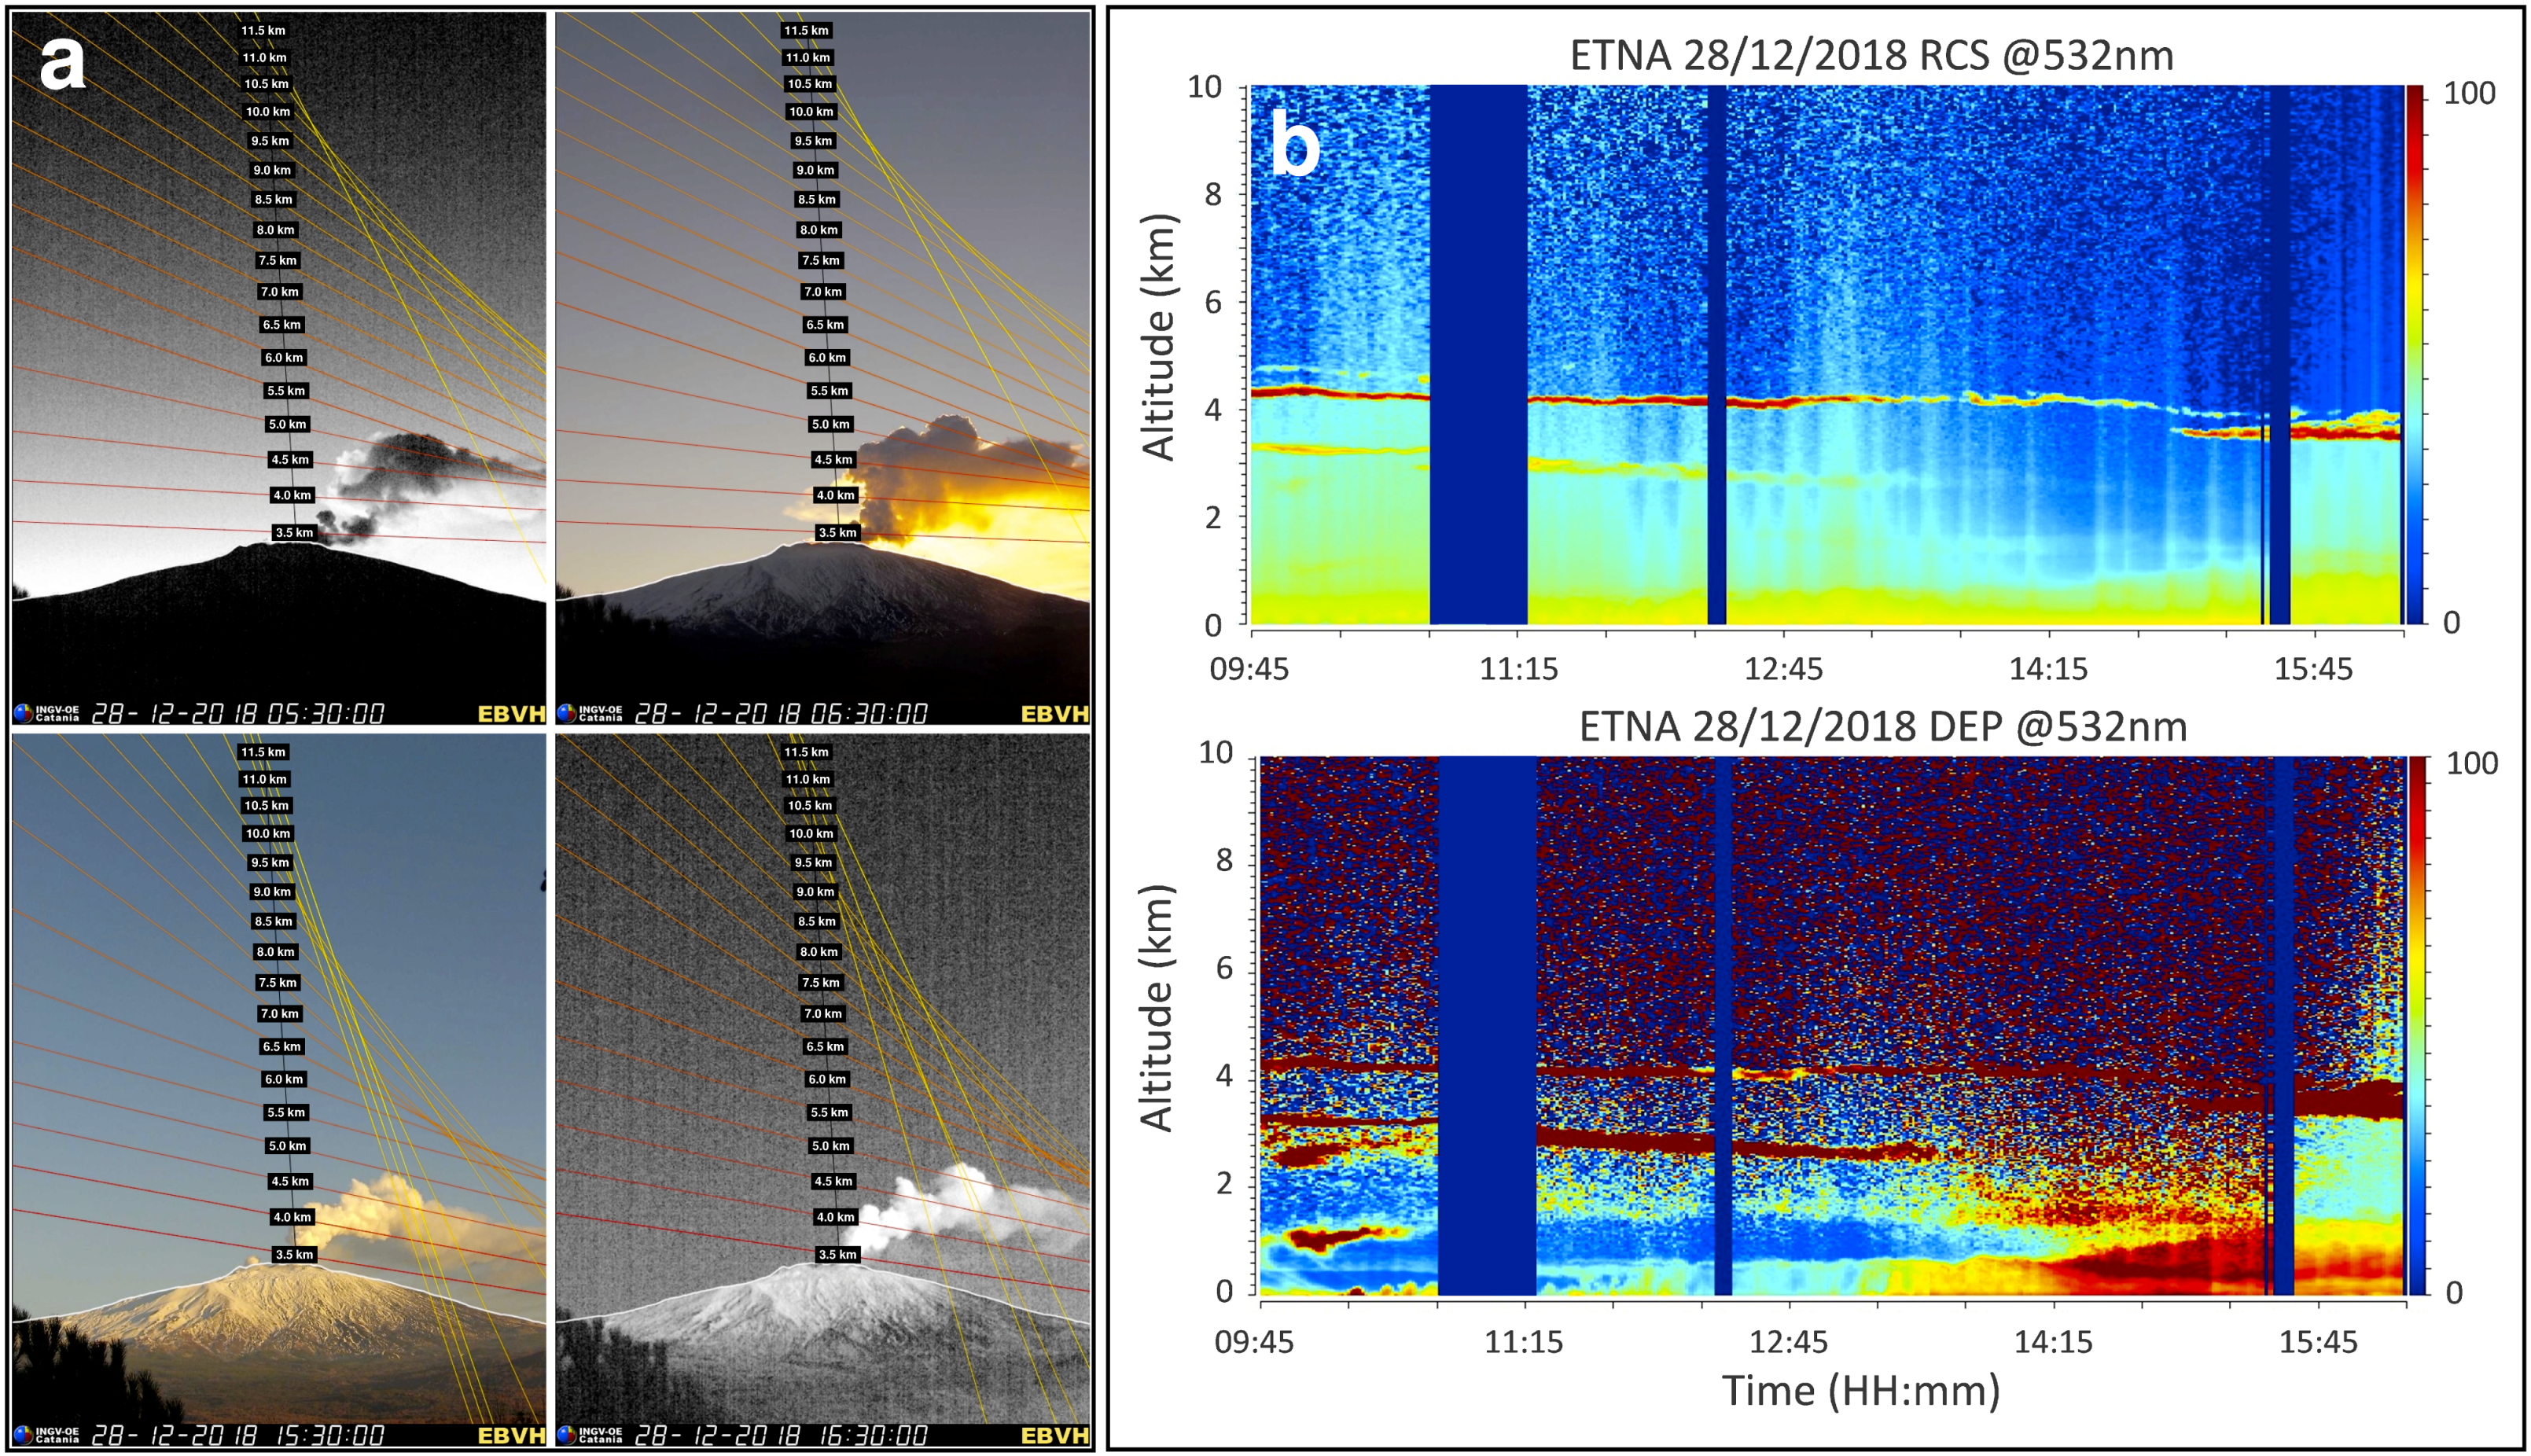
3.1. Volcanic Plume Height

Figure 2 shows the column height variation observed by the EBVH camera superimposed with the highest layer retrieved by the Lidar using the backscattered signals at 532 nm. Error bars in the height estimations are ± 0.45 and ± 0.06 km from the camera and Lidar, respectively. Images of the EBVH camera are available from 05:15 to 16:35 with a time step of 5 min, whereas Lidar measurements were detected from 09:45 to 16:07 with 30 min time integration. Our analysis shows that the heights retrieved by both instruments were in very good agreement. The column height at the BN showed a slight decrease from the early morning until 10:45, when the explosive activity decreased further, causing a column height to drop by about 0.5 km. It is worth noting that the EBVH camera and Lidar observed two different regions of the volcanic plume. The camera detects the column height above the summit craters while the Lidar probed the volcanic plume above Catania, 25 km away from the volcanic source. Consequently, although differences were within the experimental error of the visible calibrated camera (±0.5 km), the volcanic plume slightly decreased in altitude along its path. Moreover, both instruments were able to detect the ash layer subsidence after 10:45. Analyzing volcanic ash dispersal using the Lagrangian dispersion model Hysplit developed by NOAA/ARL [45,46], the volcanic ash reached the city of Catania approximately after 1 h. According to this, the Lidar observed a decrease of volcanic plume height at about 11:50, about 1 h later than the decrease observed by camera (10:55). We could therefore evaluate the speed of volcanic ash dispersal from the summit craters to Catania, namely 7 m/s approximately. Finally, considering a decrease of 0.5 km within 1 h, the volcanic plume sedimentation speed was about 0.15 m/s.

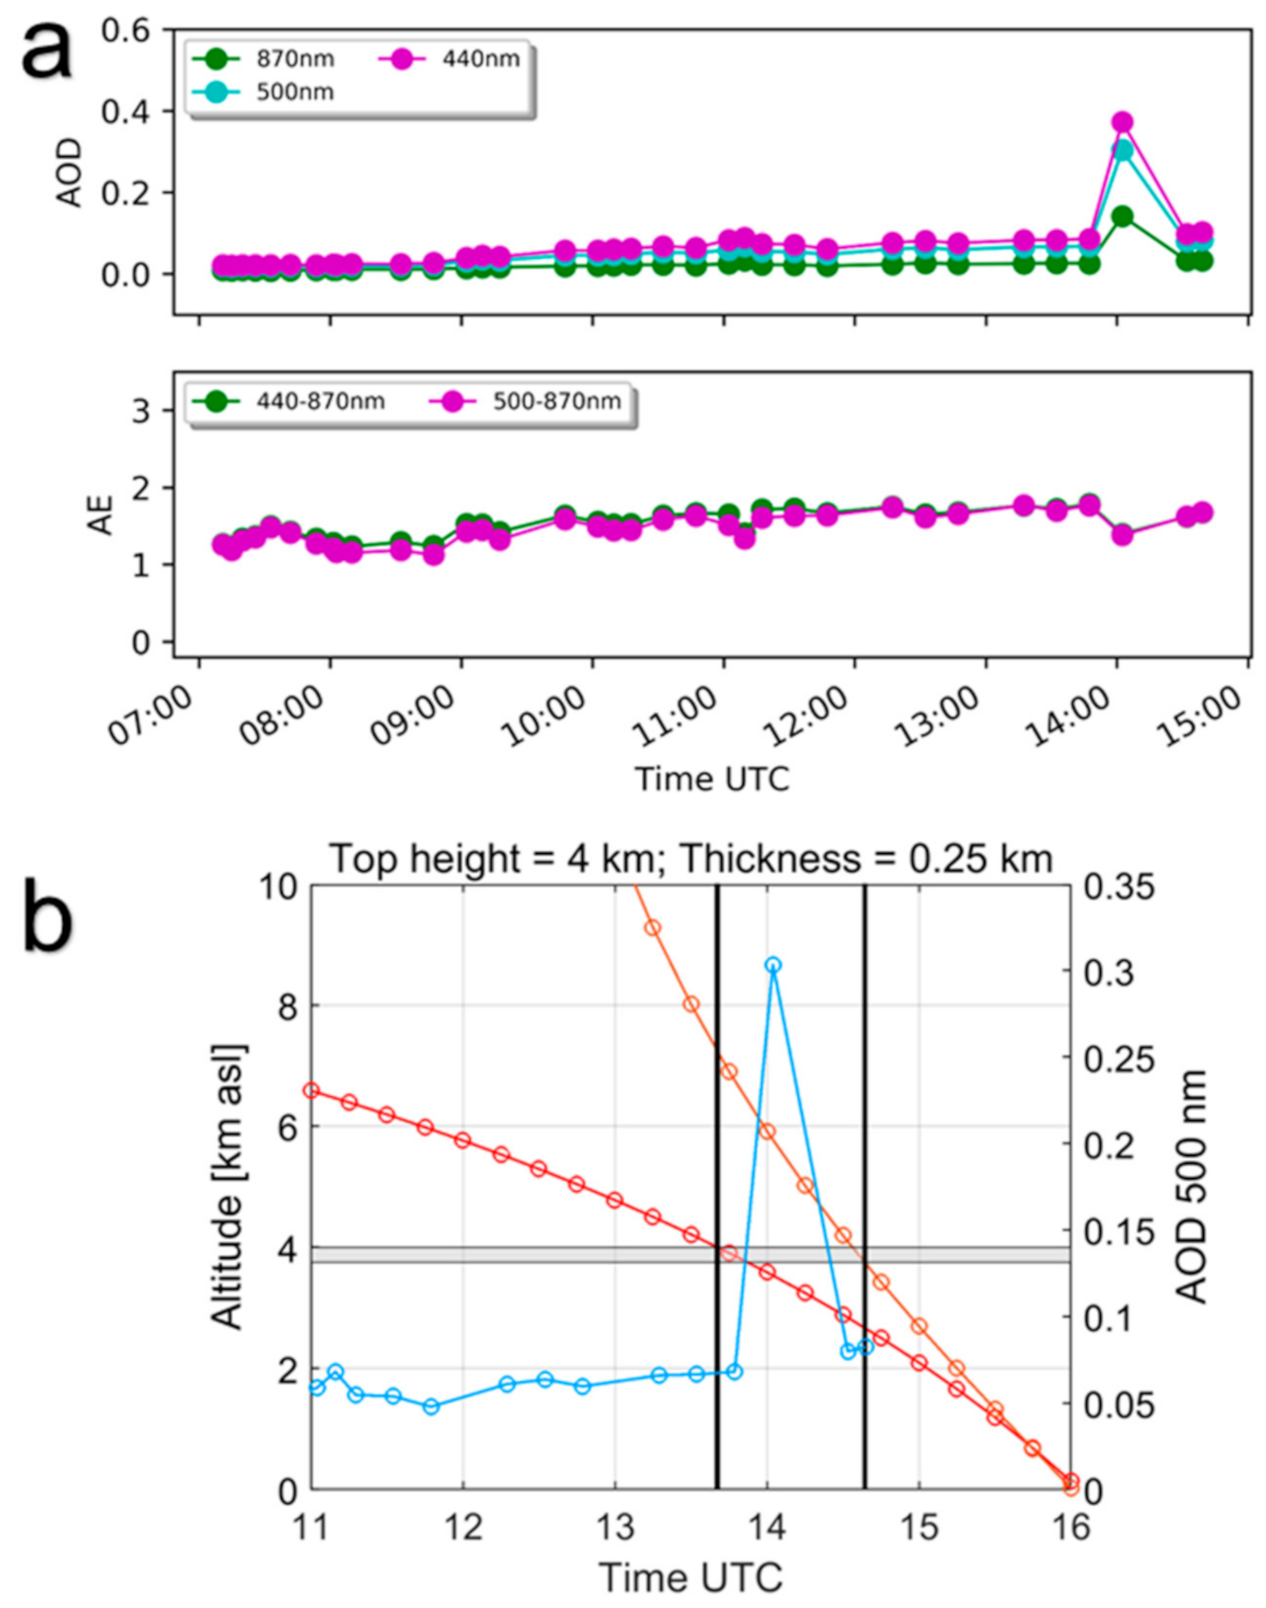
3.2. Volcanic Plume Thickness

Figure 3a shows the thickness of the volcanic plume observed by the EBVH camera at the volcanic source, and Figure 3b the time variability of the range corrected Lidar signals (RCS) above Catania. The volcanic plume thickness at the volcanic source, evaluated from the visible calibrated images of the EBVH camera at 05:30, 06:30, 15:30 and 16:30, was about 1 km. The red and yellow lines indicate the height a.s.l. The line angle, following the materials and methods section, depended on the wind direction.
Interestingly, during the morning, Lidar measurements performed in Catania showed two main volcanic ash layers having a thickness of about ~0.25 km and located at about 3.0 and 4.0 km. The thickness of the top layer is ~0.25 km before 15:15 and ~0.7 km at 15:37. Two main hypotheses can explain the presence of both layers. The first is that volcanic ash erupted from two different volcanic sources, in our case, one from the BN and the other one from the NEC (at about 3000 m). However, volcanic ash emission from the NEC was not reported by the INGV-OE volcanologist on duty and was not visible by the INGV-OE video-surveillance system on 28 December 2018. The second is that the two layers could reflect a distinct separation of the volcanic plume. This separation was recently observed during some volcanic ash episodes of the NSEC in 2020. This latter could be enhanced by atmospheric processes (e.g., wind veering) and/or by ash particles having a different size. Meteorological forecasts, in fact, showed a variation of wind veering. The analysis of the local model weather forecasts [47] highlighted a change of the wind direction (from SSE to E with a variation of about 35°). Instead, wind direction at 3.0 and 5.5 km remained almost constant all day. In general, values of wind speed were very low and always less than 10 m/s below 5500 m. Furthermore, it is noteworthy that also no dust cloud load was forecasted over Sicily on 28 December 2018 (https://ess.bsc.es/bsc-dust-daily-forecast), confirming that the layering observed by Lidar is of volcanic origin.

3.3. Volcanic Plume Dispersal

Figure 4a shows the SEVIRI ash/SO2 volcanic plume detection for four images from 00:00 to 18:00 of 28 December 2020, using the RGB composite as described in Section 2.3. The RGB procedure was used to emphasize the presence of ash and SO2. Green plumes, as observed in the figure, mean that SO2 is preponderant with respect to volcanic ash. The ash abundance could still be determined with more sensitive methods such as quantitative VPR ash and SO2 mass retrievals (see Section 2.3), and this is precisely the case represented in Figure 4a,b. In detail, Figure 4a shows that the volcanic plume was dispersed in the SSE and S sectors and, due to the clear sky conditions and the lack of meteorological clouds over the Etnean area, was still visible at distances of more than 400 km from the Etna summit craters. Figure 4b also shows the area covered by SO2 (blue line) and volcanic ash (red line), obtained considering all pixels with SO2 and ash mass greater than 0.5 g/m2 and 0.1 g/m2, respectively. A slight decrease in the area for both SO2 and volcanic ash was visible after about 13:00. This is in good agreement with the observations from the visible calibrated camera and Lidar (Figure 2).

3.4. Volcanic Aerosol Properties

Figure 5a shows the aerosol backscattering coefficient and linear depolarization profiles obtained from diurnal observations at 11:49. Moreover, Figure 5b shows the aerosol backscattering, extinction coefficients and linear depolarization obtained from elastic/Raman measurements carried out at 15:37. We selected two measurements at 11:49 and 15:37 that we considered representative of the explosive activity during the daytime and in the evening. Moreover, those measurements were performed before and after about 13:00, when there were greater variations of the plume layers observed in Figure 3. Diurnal data retrieval was obtained using the mean LR measured in the afternoon inside the volcanic plume and obtained from the elastic/Raman procedure [25]. Data were grouped with an integration time of 30 min.
Lidar measurements clearly show a layer of fresh volcanic ash at two wavelengths of 355 nm and 532 nm. During daytime observations, Lidar measurements highlighted two different signatures of volcanic ash in the altitude ranges between 2.7 and 3.5 and 3.9 and 4.9 km. The mean aerosol depolarization values changed with time and differed in both layers: peak values at 532 nm reached 15 ± 3% and 18 ± 1% at the bottom and top layers, respectively. Note that during the afternoon after 15:00, there was an increase in the width of the top layer that reached a thickness of about 0.7 km, while the bottom layer mixed with the lower atmosphere. From measurements carried out in the afternoon at 15:37, the mean depolarization values between 3.5 and 4.2 km heights were 11 ± 3% and 14 ± 3% at 355 and 532 nm, respectively. Depolarization values within the observed layers highlighted the contribution of aspherical particles according to the presence of volcanic ash particles with highly irregular shapes. Aerosol depolarization is a useful indicator for identifying irregular particles and provides a way to discriminate ash from water vapor and/or gas aerosol within volcanic plumes. In fact, higher values correspond in general to a higher amount of ash. Hence, differences in the depolarization values are usually related to differences in particle phase and/or shape. The reported values were quite low compared to those obtained in [33], and differences may be related to the different distance from the volcanic source. In [33], the Lidar measurements were performed near the summit craters (7 km far from the vent), capturing the volcanic ash that erupted at the source, while in our study, measurements were performed in Catania, 25 km far from the summit. Therefore, volcanic ash could be mixed with other anthropogenic aerosols during the transport, increasing the percentage of spherical particles. At the same time, larger ash particles could fall down, changing the ash content in the layering observed at a larger distance from the volcanic source. The measured LR in this layer was 56 ± 5 sr and 59 ± 6 sr at 355 and 532 nm, respectively. At lower altitudes, we measured an LR of about 50 ± 10 sr and 51± 5 sr at 355 and 532 nm, respectively. Similarly, those values were used in the altitude ranges between 2.7 and 3.5 km for diurnal data retrievals. Note that we found different LR values that may have also depended on particle size. If this latter hypothesis happened, the bigger particles (tens of microns) could have been located in the first layer at about 3 km, whereas the layer at 4 km should be composed of the finest particles (order of microns). We also estimated the AOD by means of the Lidar data by integrating the aerosol extinction obtained from the elastic/Raman measurements. The AOD values of the volcanic plume above the AMPLE station were equal to 0.9 ± 0.3 and 0.7 ± 0.4 at 355 and 532 nm, respectively. By contrast, the values of the AOD obtained from SEVIRI data were very low (0.02 at 15:45). It is noteworthy that retrievals derived by the SEVIRI satellite were only able to detect particles having a size in the range of ~1–25 µm, and perhaps most of the volcanic plume at this time was composed of particles of a smaller size. This fact is consistent with the derived AE detected by the photometer at 14:02, which showed values between 0.8 and 1.4 at all the wavelengths. Moreover, from Lidar measurements, we finally estimated the planetary boundary layer (PBL) top height using the derivative of the RCS signal with respect to the altitude. The values were estimated at 11:49 and 12:26 in order to show the variation of PBL at midday. They were 0.87 km to 0.93 km, respectively, confirming a slight increase in the BPL. Those values were also in agreement with the BPL values obtained from atmospheric sounding profiles on 28 December 2018 at 12:00 carried out by the Italian air force (IAF) in Trapani Birgi (western Sicily) and available at http://weather.uwyo.edu.
We also analyzed volcanic aerosol properties (AOD, AE) of the VENA (ETNA) AERONET station detected on 28 December 2018 and freely available from (https://aeronet.gsfc.nasa.gov/). In fact, the AOD mean values at different wavelengths were low (e.g., 0.063 at 440 nm, 0.05 at 500 nm, and 0.022 at 870 nm), typical of a clean atmosphere. However, a larger single value was observed in the afternoon at 14:02 at all wavelengths (AOD = 0.46 at 340 nm, Figure 6a). Conversely, at the same time, the photometer observations showed a decrease of AE, highlighting the presence of particles having a greater size than previous measurements (AE = 0.83 at 340 nm, Figure 6a). In order to verify if the photometer intercepted the volcanic plume at that time, we considered the volcanic plume edges derived from the SO2 mass map obtained from the MODIS overpass at 11:25 with the VPR procedure and estimate from the movement of the sunphotometer when the instrument intercepted the volcanic plume. The SO2 map was chosen as being less ‘noisy’ than the ash map. Brown and red lines represent the heights above sea level where the photometer (pointing to the sun) intersects the two planes perpendicular to the ground that contains the volcanic plume edges. They were estimated from geometrical considerations by also knowing also the exact sun position and its variation during the day. This simulation showed that considering a volcanic plume at 4.0 km with a thickness of 0.25 km, the photometer could had encountered the western (red line) and eastern (brown line) edges right in the same time interval where the greatest AOD values were measured (Figure 6b). This confirmed our hypothesis that the significant AOD variations measured at 14:02 were most likely observed while catching the volcanic plume. Note also that we used Level 1.0 “unscreened data” because sudden high AOD variations were automatically removed from the AERONET algorithm for Level 1.5 (cloud-screened) and Level 2 (cloud-screened–quality assured). Furthermore, we analyzed AOD data from 5 November 2018 to 24 December 2018 and found a background level of 0.15 that was in good agreement with the background level reported in [22], and this confirmed the higher values detected during this volcanic event.
Figure 7 shows the effective radius retrieved by the SEVIRI satellite on 28 December from 00:00 to 23:45 every 15 min. The blue and red lines represent the mean Reconsidering the entire volcanic cloud, and the Re obtained from the pixel placed over the AMPLE station in Catania, respectively. The mean Re also showed no significant variations in agreement, with no meaningful change in the volcanic activity. This was probably due to the fact that the short period of your observation did not allow making a comparison, as seen in [24]. On the contrary, Re above the AMPLE station showed higher variations as it is the effective radius of a single pixel placed at the edge of the volcanic cloud. It ranged between 0.2 and 7.8 µm with a mean value of 2 µm during the whole day and 1.5 µm during Lidar measurements. Data clearly show that the volcanic plume was not always detected (Re = 0 at several times). This was probably due to the high variability of the volcanic plume dispersal.

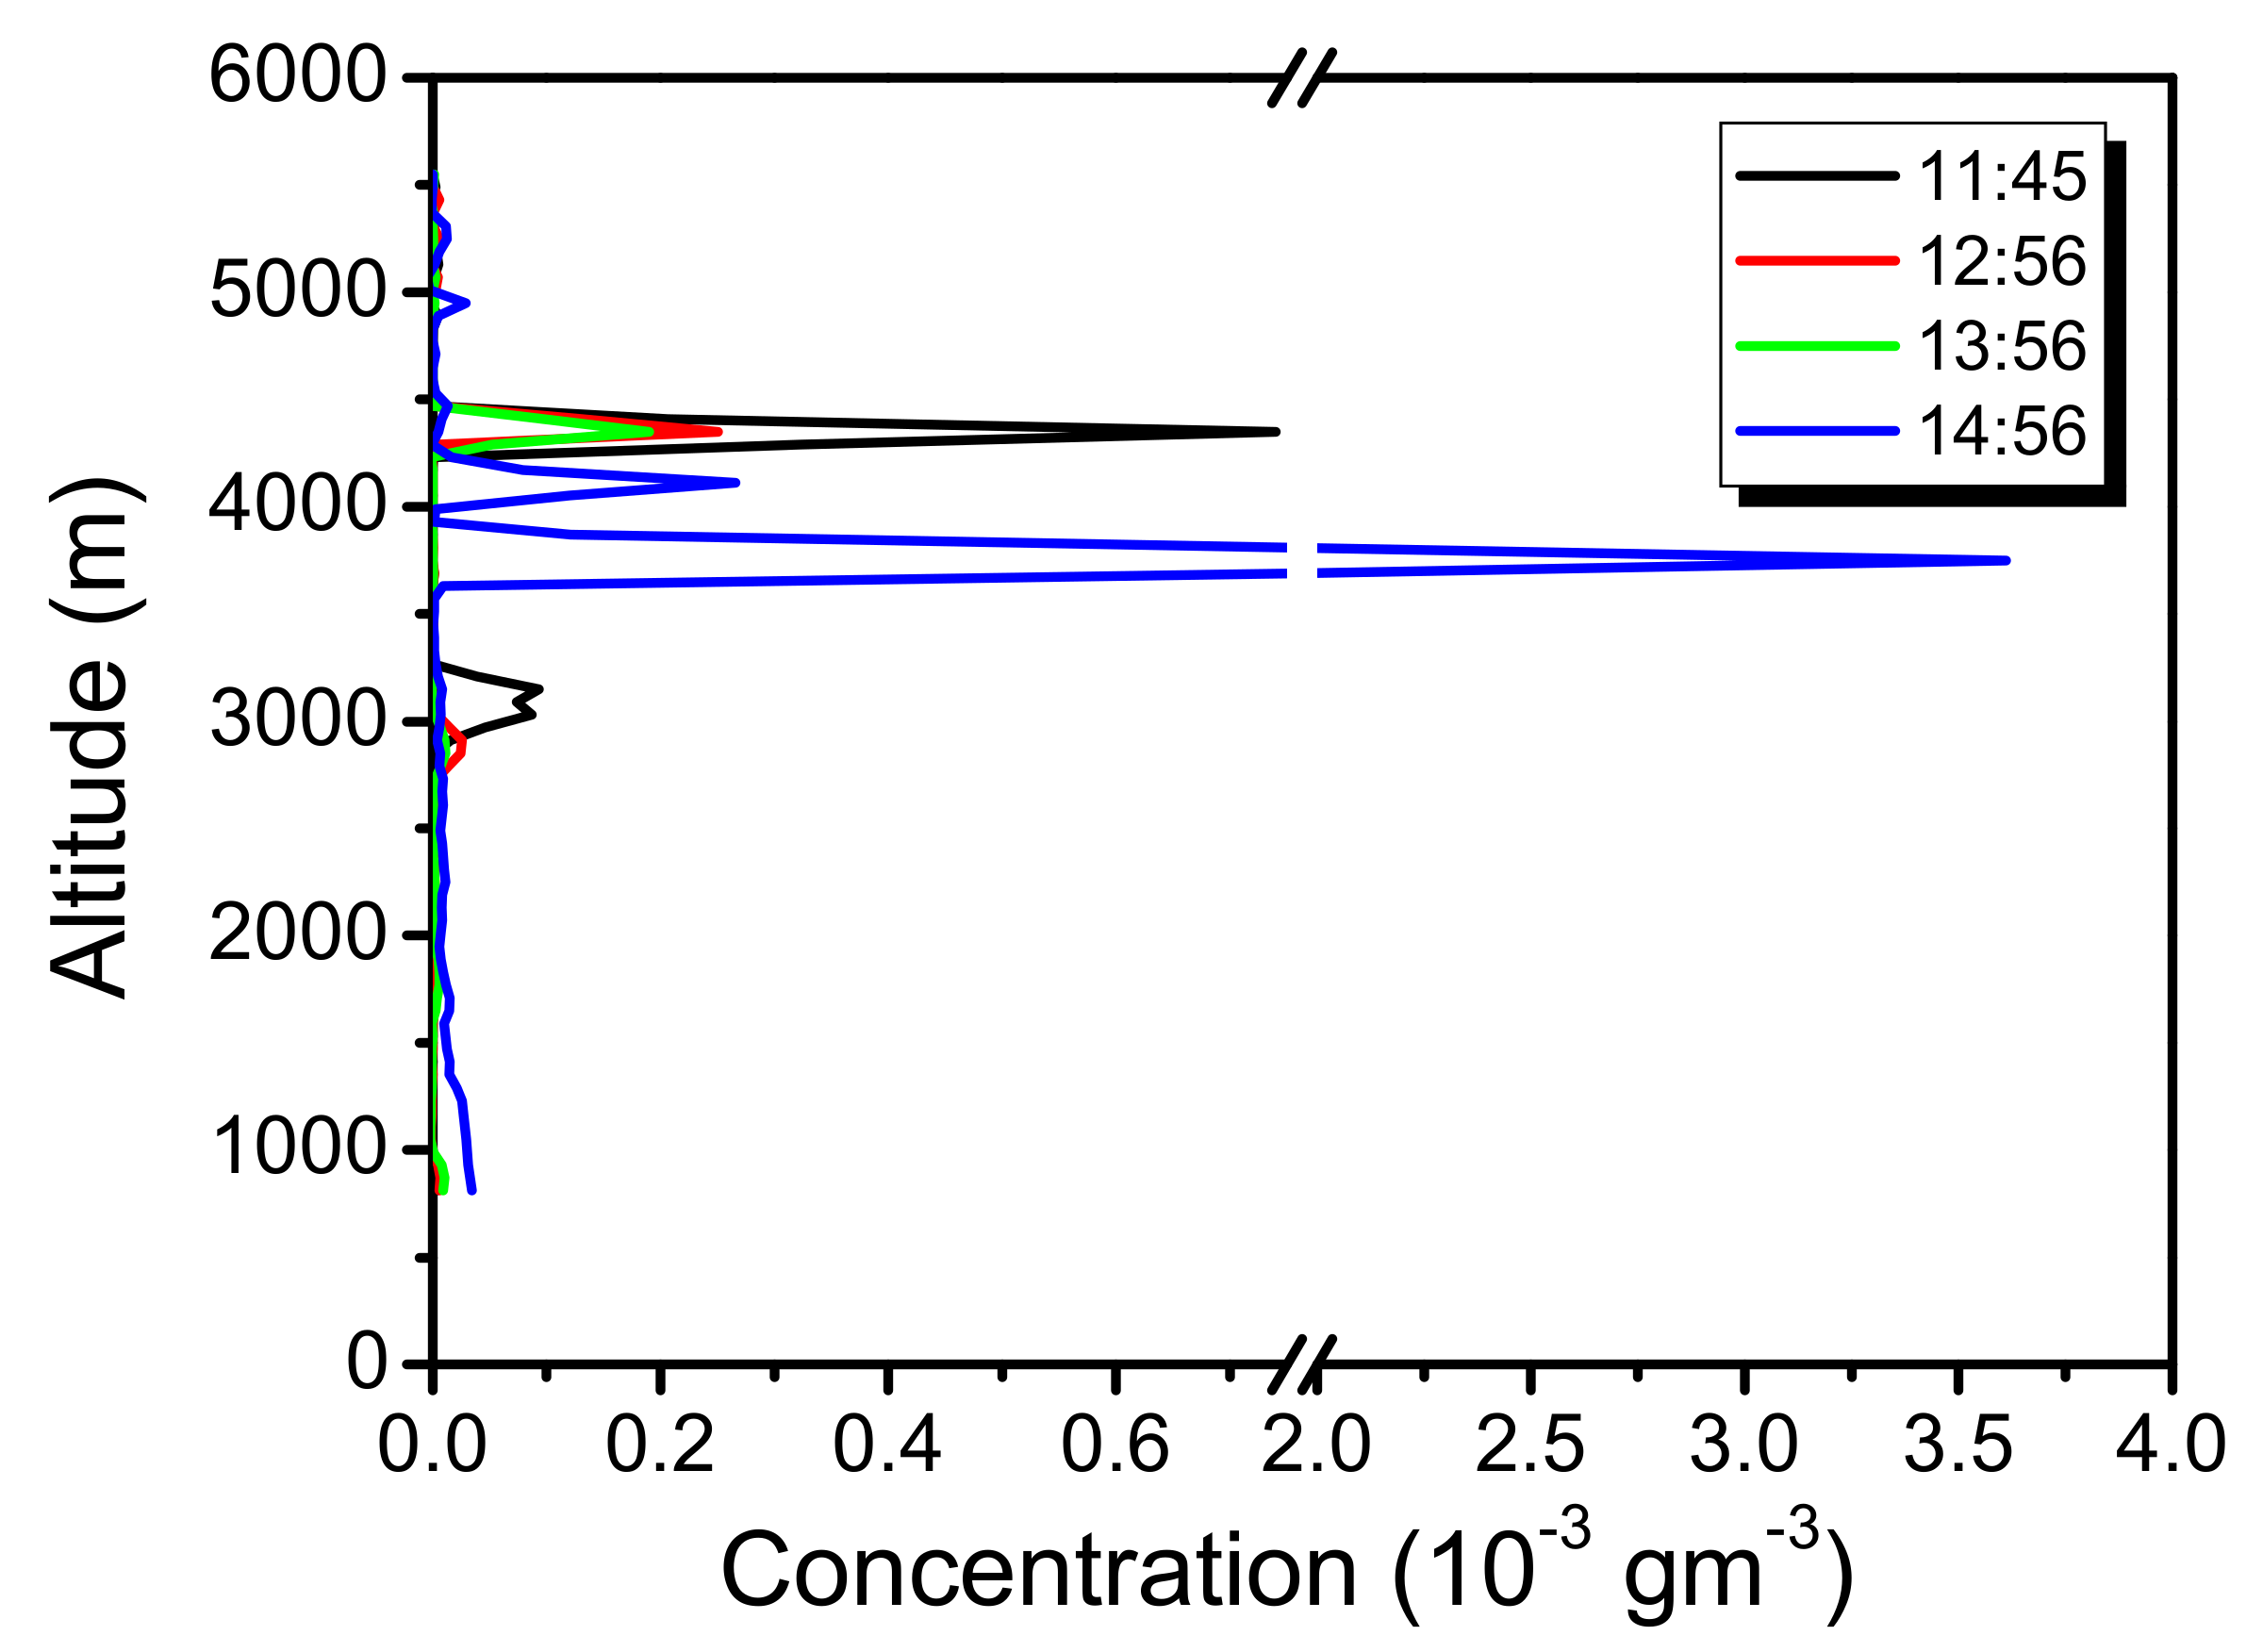
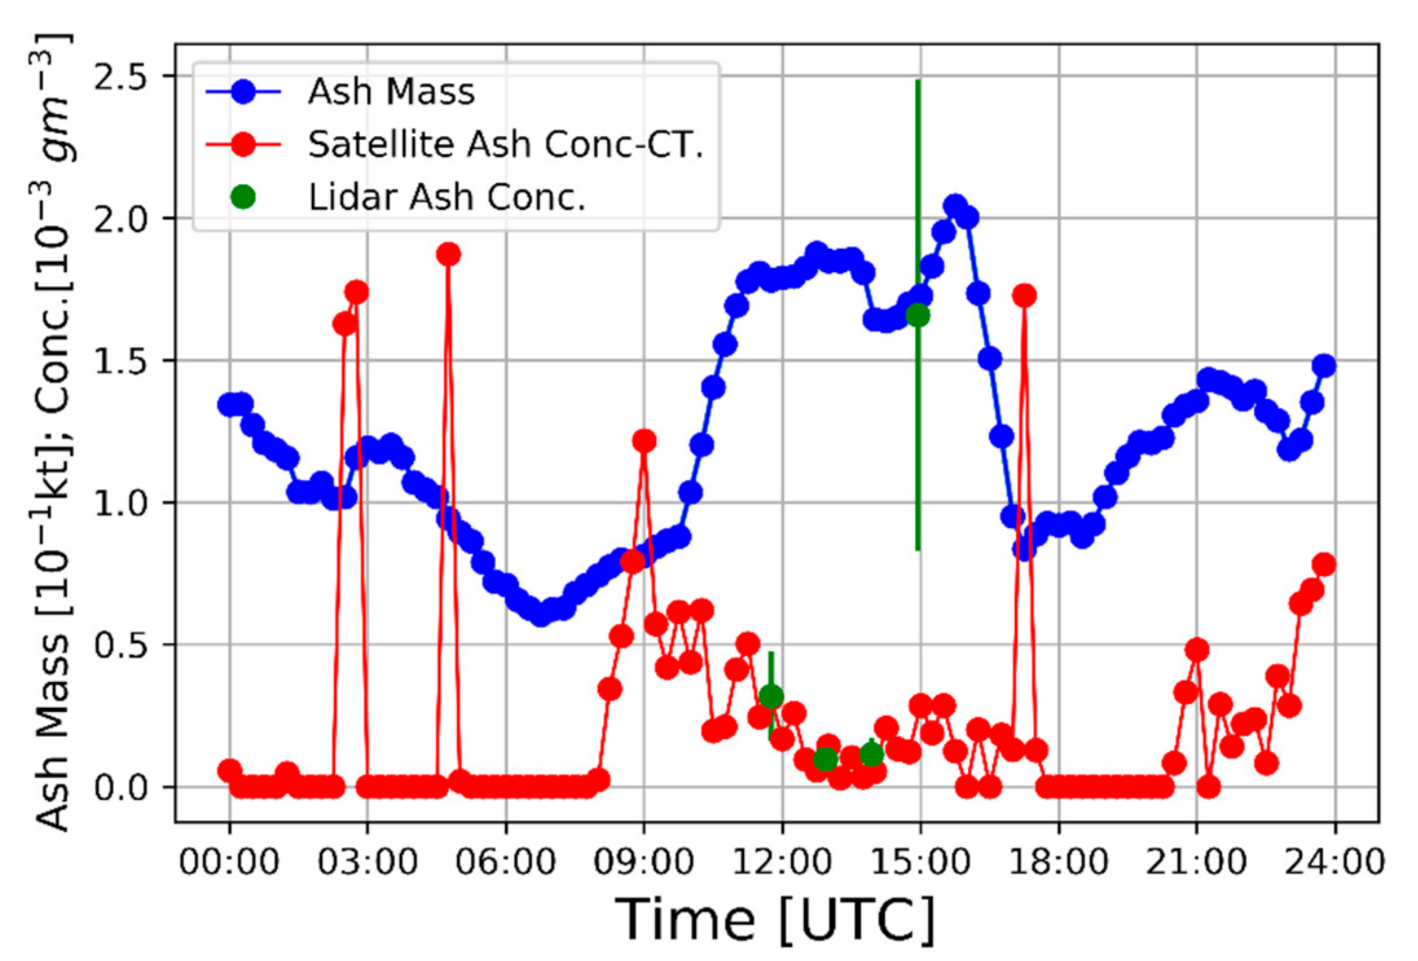
3.5. Volcanic Ash Mass Concentration and Total Mass

The volcanic ash mass concentration (VAMC) is usually difficult to assess from the satellite during an eruption without reliable information on the ash cloud thickness, but it is still very important for aviation safety [48]. After the eruption of the Icelandic volcano Eyjafjallajökull in April and May 2010, there was the recommendation to avoid flights in regions affected by VAMC exceeding 2 × 10⁻³ g m−3 [49]. Even if the volcanic ash emission of 28 December 2018 from the BN was low intensity, the plume dispersal shifted to the southeast direction toward the Fontanarossa Catania airport, which is only 30 km far from Etna’s summit craters [47]. We hence estimated the VAMC from vertical Lidar profiles using the procedure described in the method section. Figure 8 shows the VAMC for four Lidar measurements at 11:45, 12:56, 13:56 and 14:56. We selected four different times with 1 h step (two before and two after 13:00). We assumed the LR = 59 sr obtained from the Raman measurements and Re = 1 μm, similar to the value estimated by satellite measurements above Catania. Results show that VAMC is very near the threshold limit. Furthermore, the worst case was in the afternoon when VAMC reached 3.5 × 10⁻³ g m−3 at 14:56. Statistical uncertainties of βa, LR and Re contributed to the error on ash mass concentration. The uncertainty on the effective radius was a critical point since it gives rise to a systematic error of the order of 50% on the ash mass concentration [33]. Its contribution was included in our results, even if the Re was estimated by satellite. All contributions produce an error on ash mass concentration of about 60%.
Figure 9, similarly to Re plotted in Figure 7, shows the total ash mass retrieved from SEVIRI evaluated for the entire volcanic plume (blue line). Moreover, we estimated the total ash mass within the pixel placed above the AMPLE station in Catania and estimated the VAMC considering a volcanic plume thickness of 250 m (red line). The values showed a very good agreement, except at 14:56. At that time, according to the depolarization values, visual observations documented volcanic ash falling on the ground. This may have decreased the Re inside the volcanic plume. Note also the presence of a slight decrease of Re obtained by satellite, although this is within the error bars as visible in Figure 7. Finally, following Lidar and satellite estimations, results show that values of VAMC above Catania may have also been slightly greater than the aviation thresholds.

4. Summary

In this paper, we have analyzed volcanic ash emission from Etna’s summit craters using different remote sensing systems: camera, photometer, satellite and Lidar, for which few data are available in the literature. The analysis and combination of those remote sensing data allowed new insights into volcanic plume geometry and dispersal processes and improved our knowledge on the main volcanic plume features. Volcanic ash plumes from the low-intensity and long-lasting eruptions similar to that produced on 28 December 2018 could keep an almost constant altitude that disperses volcanic ash and gases more than 400 km from the volcanic source and cover, during the most intense phase, a volcanic area of about 15,000 km2. The speed of volcanic plume dispersal is about 10 m/s, which is perfectly comparable with the wind speed. Moreover, the volcanic plume contains very fine particles having an effective radius < 10 µm and 2 µm within the plume and above Catania, respectively. Volcanic ash mass concentration, in some time intervals, can exceed the thresholds defined by VAAC.
The AOD values retrieved by the sun photometer are consistent with observations of volcanic ash plume retrieved by using a similar sun photometer after the eruptions of the Eyjafjallajökull volcano in 2010 [32]. Conversely, the AE differs from photometer observations of ash-free plume observed at Etna volcano during field campaigns, as those values are always greater than 1 [50,51]. In general, our results demonstrate that such types of volcanic events are mainly composed of very fine particles. However, how particle size distribution may be estimated within volcanic plumes is still a challenge. New methods have been developed using Lidar instruments that provide backscatter coefficients at 355, 532 and 1064 nm and extinction coefficients at 355 and 532 nm [52]. Some attempts have been made so far, often by using other remote-sensing techniques, as for example, satellites [53], radars [54] and infrared cameras [55]. Laboratory measurements have recently shown that infrared transmittance measurements could be sensitive to the particle size, but new experiments are required [56]. One promising way to retrieve the grain-size distribution within volcanic plumes could be to scan them with different remote sensing systems and with a wide spectrum of wavelengths spanning from satellite to Lidar to radars. However, as some instruments do not work automatically, it is often difficult to have different remote sensing measurements performed at the same time.
The volcanic plume of this eruption can be classified as a weak plume that, following the definition reported in [57], typically develops in the troposphere following bent-over trajectories as a result of the wind advection. Our results show that volcanic ash is not uniformly distributed within the volcanic plume but can contain a different amount of volcanic aerosol. This could reflect slight variations of intensity of explosive activity and/or a different frequency of the volcanic explosions. Moreover, column height has only slight variations that were observed by the visual camera and comparisons with the Lidar system show a good agreement. We think that the use of visual calibrated cameras should be more widely used among volcano observatories. Those instruments are low cost and, in addition, a similar methodology could perhaps be applied to thermal cameras allowing the estimation of column height during the night.
The results of our study highlight that during low-intensity and long-lasting ash emission, VAMC can also reach aviation thresholds, not only near the summit craters, as already observed by [19] but also after several kilometers from the volcanic source. Consequently, the international airport of Catania, [47], as well as many airports located near active volcanoes, could be forced to close during similar events. It is noteworthy that VAMC could be detected with an error of about 50% only with an instrument that provides backscatter coefficients at 355, 532 and 1064 nm and extinction coefficients at 355 and 532 nm [52]. However, although the values shown in this paper are not measured but estimated using several approximations, we are confident about our results. This is mainly because the effective radius, which has the greater uncertainty, was taken from satellite measurements and because comparisons of results among this methodology and more complex formulations gave in the past a good agreement [34].

Author Contributions

Conceptualization and work coordination, S.S.; methodology, A.B., S.C., G.L. and S.S.; Satellite data processing, S.C., L.G., D.S., L.M.; Photometer data acquisition, S.C.; photometer processing and analysis, A.B., S.C., L.G. and S.S.; visible camera processing, M.P. and S.S.; Lidar data acquisition, G.L. and R.Z.S.; Lidar data processing, A.B., G.L., A.S. and S.S.; writing—original draft preparation, S.S.; review and editing, all authors; visualization, A.B., G.L., L.G., M.P., and S.S. All authors have read and agreed to the published version of the manuscript.

Funding

This work has benefited from the e-shape project that receives funding from the European Union’s Horizon 2020 research and innovation programme under grant agreement 820852; by the Italian MIUR project Premiale Ash-RESILIENCE (FOE 2015); by the EU Eurovolc project, grant agreement No. 731070; by the ESA project VISTA (Volcanic monItoring using SenTinel sensors by an integrated Approach), grant agreement No 4000128399/19/I-DT and by the Italian Ministry of Education, University and Research, project FISR2017-SOIR (Decreto n. 3455 del 4/12/2017). The AMPLE Lidar system was funded by the VAMOS SEGURO project, Programma di Cooperazione Transfrontaliera Italia—Malta 2007–2013, A1.2.3-62, Obiettivo Specifico 2.3.

Acknowledgments

We thank Gianluca Carà overseeing the project administration and Eugenio Privitera for supporting this activity. We also thank Valentin Freret for reviewing the preliminary draft of the paper. M. Coltelli, L. Lodato, E. Biale and E. Pecora are also thanked for maintaining the video-surveillance system of INGV-OE. The paper was read by Stephen Conway, an English native mother speaker. Authors acknowledge AERONET (https://aeronet.gsfc.nasa.gov/) for maintenance services.

Conflicts of Interest

The authors declare no conflict of interest. The funders had no role in the design of the study; in the collection, analyses or interpretation of data; in the writing of the manuscript or in the decision to publish the results.

References

  1. Branca, S.; Carlo, P. Types of eruptions of Etna volcano AD 1670–2003: Implications for short-term eruptive behaviour. Bull. Volcanol. 2005, 67, 732–742. [Google Scholar] [CrossRef]
  2. Mazzarini, F.; Giammanco, S.; Behncke, B.; Acocella, V.; Neri, M.; Rust, D. Structural analysis of the eruptive fissures at Mount Etna (Italy). Ann. Geophys. 2011, 54, 464–479. [Google Scholar] [CrossRef]
  3. Cannavo’, F.; Sciotto, M.; Cannata, A.; Di Grazia, G. An integrated geophysical approach to track magma intrusion: The 2018 Christmas Eve eruption at Mount Etna. Geophys. Res. Lett. 2019, 46, 8009–8017. [Google Scholar] [CrossRef]
  4. Bonforte, A.; Guglielmino, F.; Puglisi, G. Large dyke intrusion and small eruption: The December 24, 2018 Mt. Etna eruption imaged by Sentinel-1 data. Terra Nova 2019, 31, 405–412. [Google Scholar] [CrossRef]
  5. Calvari, S.; Bilotta, G.; Bonaccorso, A.; Caltabiano, T.; Cappello, A.; Corradino, C.; del Negro, C.; Ganci, G.; Neri, M.; Pecora, E.; et al. The VEI 2 Christmas 2018 Etna eruption: A small but intense eruptive event or the starting phase of a larger one? Remote Sens. 2020, 12, 905. [Google Scholar] [CrossRef] [Green Version]
  6. Laiolo, M.; Ripepe, M.; Cigolini, C.; Coppola, D.; della Schiava, M.; Genco, R.; Innocenti, L.; Lacanna, G.; Marchetti, E.; Massimetti, F.; et al. Space- and ground-based geophysical data tracking of magma migration in shallow feeding system of Mount Etna volcano. Remote Sens. 2019, 11, 1182. [Google Scholar] [CrossRef] [Green Version]
  7. Mercatanti, L.; Sabato, G. Volcanic risk and the role of the media. A case study in the Etna area. AIMS Geosci. 2019, 5, 448–460. [Google Scholar] [CrossRef]
  8. Mastin, L.G.; Guffanti, M.; Servranckx, R.; Webley, P.; Barsotti, S.; Dean, K.; Durant, A.; Ewert, J.W.; Neri, A.; Rose, W.I.; et al. A multidisciplinary effort to assign realistic source parameters to models of volcanic ash-cloud transport and dispersion during eruptions (Book review). J. Volcanol. Geotherm. Res. 2009, 186, 10–21. [Google Scholar] [CrossRef]
  9. Scollo, S.; Boselli, A.; Coltelli, M.; Leto, G.; Pisani, G.; Prestifilippo, M.; Spinelli, N.; Wang, X. Volcanic ash concentration during the 12 August 2011 Etna eruption. Geophys. Res. Lett. 2015, 42, 2634–2641. [Google Scholar] [CrossRef]
  10. Webster, H.N.; Devenish, B.J.; Mastin, L.G.; Thomson, D.J.; van Eaton, A.R. Operational modelling of umbrella cloud growth in a lagrangian volcanic ash transport and dispersion model. Atmosphere 2020, 11, 200. [Google Scholar] [CrossRef] [Green Version]
  11. van Eaton, A.R.; Mastin, L.G.; Herzog, M.; Schwaiger, H.F.; Schneider, D.J.; Wallace, K.L.; Clarke, A.B. Hail formation triggers rapid ash aggregation in volcanic plumes. Nat. Commun. 2015, 6, 7860. [Google Scholar] [CrossRef]
  12. Sellitto, P.; Zanetel, C.; Di Sarra, A.; Salerno, G.; Tapparo, A.; Meloni, D.; Pace, G.; Caltabiano, T.; Briole, P.; Legras, B. The impact of Mount Etna sulfur emissions on the atmospheric composition and aerosol properties in the central Mediterranean: A statistical analysis over the period 2000–2013 based on observations and Lagrangian modelling. Atmos. Environ. 2017, 148, 77–88. [Google Scholar] [CrossRef] [Green Version]
  13. Ridley, D.; Solomon, S.; Barnes, J.; Burlakov, V.; Deshler, T.; Dolgii, S.; Herber, A.; Nagai, T.; Neely, R.; Nevzorov, A.; et al. Total volcanic stratospheric aerosol optical depths and implications for global climate change. Geophys. Res. Lett. 2014, 41, 7763–7769. [Google Scholar] [CrossRef] [Green Version]
  14. Mortier, A.; Goloub, P.; Podvin, T.; Deroo, C.; Chaikovsky, A.; Ajtai, N.; Blarel, L.; Tanre, D.; Derimian, Y. Detection and characterization of volcanic ash plumes over Lille during the Eyjafjallajökull eruption. Atmos. Chem. Phys. 2013, 13, 3705–3720. [Google Scholar] [CrossRef] [Green Version]
  15. Edwards, M.J.; Pioli, L.; Harris, A.J.L.; Gurioli, L.; Thivet, S. Magma fragmentation and particle size distributions in low intensity mafic explosions: The July/August 2015 Piton de la Fournaise eruption. Sci. Rep. 2020, 10, 1–14. [Google Scholar] [CrossRef]
  16. Andronico, D.; del Carlo, P. PM10 measurements in urban settlements after lava fountain episodes at Mt. Etna, Italy: Pilot test to assess volcanic ash hazard to human health. Nat. Hazards Earth Syst. Sci. 2016, 16, 29–40. [Google Scholar] [CrossRef] [Green Version]
  17. Gurioli, L.; Harris, A.J.L.; Houghton, B.F.; Polacci, M.; Ripepe, M. Textural and geophysical characterization of explosive basaltic activity at Villarrica volcano. J. Geophys. Res. Solid Earth 2008, 113, B08206–n/a. [Google Scholar] [CrossRef]
  18. Donnadieu, F.; Freville, P.; Hervier, C.; Coltelli, M.; Scollo, S.; Prestifilippo, M.; Valade, S.; Rivet, S.; Cacault, P. Near-source Doppler radar monitoring of tephra plumes at Etna. J. Volcanol. Geotherm. Res. 2016, 312, 26–39. [Google Scholar] [CrossRef]
  19. Scollo, S.; Boselli, A.; Coltelli, M.; Leto, G.; Pisani, G.; Spinelli, N.; Wang, X. Monitoring Etna volcanic plumes using a scanning LiDAR. Bull. Volcanol. 2012, 74, 2383–2395. [Google Scholar] [CrossRef]
  20. Scollo, S.; Prestifilippo, M.; Pecora, E.; Corradini, S.; Merucci, L.; Spata, G.; Coltelli, M. Eruption column height estimation of the 2011–2013 Etna lava fountains. Ann. Geophys. 2014, 57. [Google Scholar] [CrossRef] [Green Version]
  21. Corradini, S.; Montopoli, M.; Guerrieri, L.; Ricci, M.; Scollo, S.; Merucci, L.; Marzano, F.; Pugnaghi, S.; Prestifilippo, M.; Ventress, L.; et al. A multi-sensor approach for volcanic ash cloud retrieval and eruption characterization: The 23 November 2013 Etna lava fountain. Remote Sens. 2016, 8, 58. [Google Scholar] [CrossRef] [Green Version]
  22. Corradini, S.; Guerrieri, L.; Lombardo, V.; Merucci, L.; Musacchio, M.; Prestifilippo, M.; Scollo, S.; Silvestri, M.; Spata, G.; Stelitano, D. Proximal monitoring of the 2011–2015 Etna lava fountains using MSG-SEVIRI data. Geosciences 2018, 8, 140. [Google Scholar] [CrossRef] [Green Version]
  23. Scollo, S.; Prestifilippo, M.; Bonadonna, C.; Cioni, R.; Corradini, S.; Degruyter, W.; Rossi, E.; Silvestri, M.; Biale, E.; Carparelli, G.; et al. Near-real-time tephra fallout assessment at Mt. Etna, Italy. Remote Sens. 2019, 11, 2987. [Google Scholar] [CrossRef] [Green Version]
  24. Corradini, S.; Guerrieri, L.; Stelitano, D.; Salerno, G.; Scollo, S.; Merucci, L.; Prestifilippo, M.; Musacchio, M.; Silvestri, M.; Lombardo, V.; et al. Near real-time monitoring of the Christmas 2018 Etna eruption using SEVIRI and products validation. Remote Sens. 2020, 12, 1336. [Google Scholar] [CrossRef] [Green Version]
  25. Boselli, A.; Scollo, S.; Leto, G.; Sanchez, R.Z.; Sannino, A.; Wang, X.; Coltelli, M.; Spinelli, N. First volcanic plume measurements by an elastic/raman lidar close to the Etna summit craters. Front. Earth Sci. 2018, 6. [Google Scholar] [CrossRef]
  26. Ansmann, A.; Riebesell, M.; Wandinger, U.; Weitkamp, C.; Voss, E.; Lahmann, W.; Michaelis, W. Combined raman elastic-backscatter LIDAR for vertical profiling of moisture, aerosol extinction, backscatter, and LIDAR ratio. Appl. Phys. B 1992, 55, 18–28. [Google Scholar] [CrossRef]
  27. Ansmann, A.; Riebesell, M.; Weitkamp, C. Measurement of atmospheric aerosol extinction profiles with a Raman lidar. Opt. Lett. 1990, 15, 746–748. [Google Scholar] [CrossRef]
  28. Klett, J.D. Stable analytical inversion solution for processing lidar returns. Appl. Opt. 1981, 20, 211–220. [Google Scholar] [CrossRef] [Green Version]
  29. Fernald, F.G. Analysis of atmospheric lidar observations: Some comments. Appl. Opt. 1984, 23, 652–653. [Google Scholar] [CrossRef]
  30. Biele, J.; Beyerle, G.; Baumgarten, G. Polarization lidar: Correction of instrumental effects. Opt. Express 2000, 7, 427–435. [Google Scholar] [CrossRef] [PubMed]
  31. Freudenthaler, V.; Esselborn, M.; Wiegner, M.; Heese, B.; Tesche, M.; Ansmann, A.; MüLLER, D.; Althausen, D.; Wirth, M.; Fix, A.; et al. Depolarization ratio profiling at several wavelengths in pure Saharan dust during SAMUM 2006. Tellus Ser. B Chem. Phys. Meteorol. 2017, 61, 165–179. [Google Scholar] [CrossRef] [Green Version]
  32. Ansmann, A.; Tesche, M.; Seifert, P.; Groß, S.; Freudenthaler, V.; Apituley, A.; Wilson, K.M.; Serikov, I.; Linné, H.; Heinold, B.; et al. Ash and fine-mode particle mass profiles from EARLINET-AERONET observations over central Europe after the eruptions of the Eyjafjallajökull volcano in 2010. J. Geophys. Res. Atmos. 2011, 116, D00U02. [Google Scholar] [CrossRef]
  33. Pisani, G.; Boselli, A.; Coltelli, M.; Leto, G.; Pica, G.; Scollo, S.; Spinelli, N.; Wang, X. Lidar depolarization measurement of fresh volcanic ash from Mt. Etna, Italy. Atmos. Environ. 2012, 62, 34–40. [Google Scholar] [CrossRef]
  34. Mereu, L.; Scollo, S.; Mori, S.; Boselli, A.; Leto, G.; Marzano, F.S. Maximum-likelihood retrieval of volcanic ash concentration and particle size from ground-based scanning lidar. IEEE Trans. Geosci. Remote Sens. 2018, 56, 5824–5842. [Google Scholar] [CrossRef]
  35. Guerrieri, L.; Merucci, L.; Corradini, S.; Pugnaghi, S. Evolution of the 2011 Mt. Etna ash and SO2 lava fountain episodes using SEVIRI data and VPR retrieval approach. J. Volcanol. Geotherm. Res. 2015, 291, 63–71. [Google Scholar] [CrossRef]
  36. Pugnaghi, S.; Guerrieri, L.; Corradini, S.; Merucci, L. Real time retrieval of volcanic cloud particles and SO2 by satellite using an improved simplified approach. Atmos. Meas. Tech. 2016, 9, 3053–3062. [Google Scholar] [CrossRef] [Green Version]
  37. Pugnaghi, S.; Guerrieri, L.; Corradini, S.; Merucci, L.; Arvani, B. A new simplified approach for simultaneous retrieval of SO2 and ash content of tropospheric volcanic clouds: An application to the Mt Etna volcano. Atmos. Meas. Tech. 2013, 6, 1315–1327. [Google Scholar] [CrossRef] [Green Version]
  38. Corradini, S. Mt. Etna tropospheric ash retrieval and sensitivity analysis using moderate resolution imaging spectroradiometer measurements. J. Appl. Remote Sens. 2008, 2, 023550. [Google Scholar] [CrossRef]
  39. Corradini, S.; Pugnaghi, S.; Piscini, A.; Guerrieri, L.; Merucci, L.; Picchiani, M.; Chini, M. Volcanic Ash and SO2 retrievals using synthetic MODIS TIR data: Comparison between inversion procedures and sensitivity analysis. Ann. Geophys. 2015, 57. [Google Scholar] [CrossRef] [Green Version]
  40. Kylling, A.; Kahnert, M.; Lindqvist, H.; Nousiainen, T. Volcanic ash infrared signature: Porous non-spherical ash particle shapes compared to homogeneous spherical ash particles. Atmos. Meas. Tech. 2014, 7, 919–929. [Google Scholar] [CrossRef] [Green Version]
  41. Dubovik, O.; King, M.D. A flexible inversion algorithm for retrieval of aerosol optical properties from Sun and sky radiance measurements. J. Geophys. Res. Atmos. 2000, 105, 20673–20696. [Google Scholar] [CrossRef] [Green Version]
  42. Dubovik, O.; Sinyuk, A.; Lapyonok, T.; Holben, B.N.; Mishchenko, M.; Yang, P.; Eck, T.F.; Volten, H.; Muñoz, O.; Veihelmann, B.; et al. Application of spheroid models to account for aerosol particle nonsphericity in remote sensing of desert dust. J. Geophys. Res. Atmos. 2006, 111. [Google Scholar] [CrossRef] [Green Version]
  43. O’Neill, N.T.; Eck, T.F.; Smirnov, A.; Holben, B.N.; Thulasiraman, S. Spectral discrimination of coarse and fine mode optical depth. J. Geophys. Res. Atmos. 2003, 108, D11208. [Google Scholar] [CrossRef]
  44. O’Neill, N.T.; Dubovik, O.; Eck, T.F. Modified angström exponent for the characterization of submicrometer aerosols. Appl. Opt. 2001, 40, 2368–2375. [Google Scholar] [CrossRef]
  45. Stein, A.; Draxler, R.; Rolph, G.; Stunder, B.; Cohen, M.; Ngan, F. NOAA’S HYSPLIT atmospheric transport and dispersion modeling system. Bull. Am. Meteorol. Soc. 2015, 96, 2059–2077. [Google Scholar] [CrossRef]
  46. Hurst, T.; Davis, C. Forecasting volcanic ash deposition using HYSPLIT. J. Appl. Volcanol. 2017, 6, 1–8. [Google Scholar] [CrossRef] [Green Version]
  47. Scollo, S.; Prestifilippo, M.; Spata, G.; D’Agostino, M.; Coltelli, M. Monitoring and forecasting Etna volcanic plumes. Nat. Hazards Earth Syst. Sci. 2009, 9, 1573–1585. [Google Scholar] [CrossRef] [Green Version]
  48. Prata, A.; Tupper, A. Aviation hazards from volcanoes: The state of the science. Nat. Hazards 2009, 51, 239–244. [Google Scholar] [CrossRef] [Green Version]
  49. Alexander, D. Volcanic ash in the atmosphere and risks for civil aviation: A study in European crisis management. Int. J. Disaster Risk Sci. 2013, 4, 9–19. [Google Scholar] [CrossRef] [Green Version]
  50. Watson, I.; Oppenheimer, C. Particle size distributions of Mount Etna’s aerosol plume constrained by Sun photometry. J. Geophys. Res. Atmos. 2000, 105, 9823–9829. [Google Scholar] [CrossRef]
  51. Watson, I.M.; Oppenheimer, C. Photometric observations of Mt. Etna’s different aerosol plumes. Atmos. Environ. 2001, 35, 3561–3572. [Google Scholar] [CrossRef]
  52. Veselovskii, I.; Kolgotin, A.; Griaznov, V.; Müller, D.; Franke, K.; Whiteman, D.N. Inversion of multiwavelength Raman lidar data for retrieval of bimodal aerosol size distribution. Appl. Opt. 2004, 43, 1180–1195. [Google Scholar] [CrossRef]
  53. Western, L.M.; Francis, P.N.; Watson, I.M.; Mackie, S. Inferring the size distribution of volcanic ash from IASI measurements and optimal estimation. Atmos. Meas. Tech. Discuss. 2016, 1–25. [Google Scholar] [CrossRef] [Green Version]
  54. Harris, D.; Rose, W. Estimating particle sizes, concentrations, and total mass of ash in volcanic clouds using weather radar. J. Geophys. Res. Ocean. 1983, 88, 10969–10983. [Google Scholar] [CrossRef]
  55. Pioli, L.; Harris, A. Real-time geophysical monitoring of particle size distribution during volcanic explosions at Stromboli volcano (Italy). Front. Earth Sci. 2019, 7, 1–13. [Google Scholar] [CrossRef] [Green Version]
  56. Scollo, S.; Baratta, G.A.; Palumbo, M.E.; Corradini, S.; Leto, G.; Strazzulla, G. Linking the IR transmittance to size and type of volcanic ash particles. J. Geophys. Res. Atmos. 2013, 118, 12207–12215. [Google Scholar] [CrossRef]
  57. Bonadonna, C.; Phillips, J.C.; Houghton, B.F. Modeling tephra sedimentation from a Ruapehu weak plume eruption. J. Geophys. Res. Solid Earth 2005, 110, B08209. [Google Scholar] [CrossRef] [Green Version]
Figure 1. (a) Map of Etna volcano with the circles indicating the location of (1) Lidar station, (2) the sunphotometer, (3) the visible calibrated camera; photos of the volcanic plume taken by B. Behncke from a small town on the Etna’s south flank on 28 December 2018 (b) in the morning and (c) in the afternoon.
Remotesensing 12 03866 g001
Figure 2. Column height retrieved by the visible calibrated EBVH (Etna Bronte Visible High definition) camera (blue line) at the summit craters and volcanic plume height retrieved by Lidar in Catania (red line) located at 25 km far from the volcanic source. Camera data are from 05:15 to 16:35 on 28 December 2018 with a time step of 5 min, and Lidar data are from 09:45 to 16:07 with a time step of 30 min.
Remotesensing 12 03866 g002
Figure 3. (a) Visible calibrated images retrieved by the EBVH camera at 05:30, 06:30, 15:30 and 16:30 on 28 December 2018. The lines indicate the height a.s.l.; (b) time variability of the range corrected Lidar signal (RCS) and depolarization (DEP) on 28 December 2018 from 09:45 to 16:30, with a spatial resolution of 15 m for the RCS and 60 m for the DEP and both with a temporal resolution of 60 s.
Remotesensing 12 03866 g003
Figure 4. (a) Spinning Enhanced Visible and Infrared Imager composite images (red: Tb,8.7–Tb,10.8; green: Tb,12–Tb,10.8) (SEVIRI RGB) at 00:00, 06:00, 12:00 and 18:00 UTC on 28 December 2018 showing volcanic plume dispersal over Sicily; (b) area covered by SO2 (blue line) and volcanic ash (red line) on 28 December 2018.
Remotesensing 12 03866 g004
Figure 5. (a) Aerosol backscattering coefficient (10−4 m−1sr−1) and linear depolarization (%) of Lidar measurements carried out at 11:49; (b) aerosol backscattering coefficient (10−4 m−1sr−1), linear depolarization (%) and aerosol extinction coefficient (10−3m−1) of Lidar measurements carried out at 15:37. For both measurements, the laser wavelengths are 355 nm (blue line) and 532 nm (green line).
Remotesensing 12 03866 g005
Figure 6. (a) The aerosol optical depth (AOD) and Ångström exponent (AE) from the sunphotometer located at the VENA station of the AERONET network (https://aeronet.gsfc.nasa.gov/); (b) time interval (between black vertical lines) in which the direction of view of sun photometer (red and brown lines) has intercepted the edges of the volcanic plume. The horizontal gray bar represents the volcanic plume, while the light blue line shows the AOD measurements at 500 nm.
Remotesensing 12 03866 g006
Figure 7. Effective radius (Re) obtained from SEVIRI measurements every 15 min. Blue line: mean Re computed considering the overall volcanic plume (Re VP). Redline: Re of a single pixel placed above the AMPLE Lidar station in Catania (Re VP-CT).
Remotesensing 12 03866 g007
Figure 8. Lidar ash mass concentration profiles in 10−3 g/m3 at 11:45, 12:56, 13:56 and 14:56. The error in the ash mass concentration is about 60%.
Remotesensing 12 03866 g008
Figure 9. Total ash mass detected by satellite, volcanic ash mass concentration evaluated by satellite in a single pixel placed above the AMPLE Lidar station in Catania, 25 km from the source (Satellite Ash Conc.-CT) and compared with the mean values of volcanic ash concentration obtained by Lidar (Lidar Ash Conc.).
Remotesensing 12 03866 g009
Publisher’s Note: MDPI stays neutral with regard to jurisdictional claims in published maps and institutional affiliations.

