Article

River Flow Monitoring by Sentinel-3 OLCI and MODIS: Comparison and Combination

1
Research Institute for Geo-Hydrological Protection, National Research Council, Via Madonna Alta 126, I-06128 Perugia, Italy
2
VITROCISET, Bratustrasse 7, D64295 Darmstadt, Germany
3
SERCO/ESRIN, Largo Galileo Galilei, I-00044 Frascati, Italy
4
European Space Agency/ESRIN, Largo Galileo Galilei, I-00044 Frascati, Italy
*
Author to whom correspondence should be addressed.
Remote Sens. 2020, 12(23), 3867; https://doi.org/10.3390/rs12233867
Submission received: 20 October 2020 / Revised: 22 November 2020 / Accepted: 23 November 2020 / Published: 25 November 2020
(This article belongs to the Special Issue Application of MODIS Data for Environmental Research)

Abstract

:
The monitoring of rivers by satellite is an up-to-date subject in hydrological studies as confirmed by the interest of space agencies to finance specific missions that respond to the quantification of surface water flows. We address the problem by using multi-spectral sensors, in the near-infrared (NIR) band, correlating the reflectance ratio between a dry and a wet pixel extracted from a time series of images, the C/M ratio, with five river flow-related variables: water level, river discharge, flow area, mean flow velocity and surface width. The innovative aspect of this study is the use of the Ocean and Land Colour Instrument (OLCI) on board Sentinel-3 satellites, compared to the Moderate Resolution Imaging Spectroradiometer (MODIS) used in previous studies. Our results show that the C/M ratio from OLCI and MODIS is more correlated with the mean flow velocity than with other variables. To improve the number of observations, OLCI and MODIS products are combined into multi-mission time series. The integration provides good quality data at around daily resolution, appropriate for the analysis of the Po River investigated in this study. Finally, the combination of only MODIS products outperforms the other configurations with a frequency slightly lower (~1.8 days).

Graphical Abstract

1. Introduction

The estimation of river discharge is of primary importance for the hydrology community as it is fundamental: to close the water cycle, for the efficient management of water resources, and for flood forecasting, especially under severe climate change conditions [1,2,3]. In the last few decades, a specific branch of scientific production inherent to river discharge has been focused on remote sensing and, in particular, on the use of satellite observations for monitoring river flows (see review studies in [4,5]). It is known that radar altimetry measures the water surface elevation of a river and numerous studies demonstrated its efficacy for river monitoring [6,7,8,9]. It is less known that multispectral sensors are able to detect the variability of the dynamic of the river [10,11,12,13].
Multispectral remote sensing is generally based on the simultaneous acquisition of image data of the Earth’s surface at multiple wavelengths, grouped in bands, across the electromagnetic spectrum [14]. Different surface types reflect and absorb differently at different wavelengths. It follows that it is possible to identify materials by their spectral reflectance signatures. For example, the reflectance of clear water is generally low with a maximum at the end of the blue spectrum. Turbid water, typical of the rivers, is characterized by sediment suspension with a consequent increase of reflectance in the red end of the spectrum. The reflectance of soil generally depends on the composition and the water content, i.e., lower for dry soil and higher for wet soil. Vegetation has a unique spectral signature, characterized by a high value of reflectance in the green region and a low reflectance in the blue and red regions of the spectrum due to chlorophyll absorption for photosynthesis. In the near-infrared (NIR) region, the reflectance is much higher than that in the visible band due to the structure of the leaves. Based on these well-known principles, the NIR region is largely used by virtue of its high potential to discriminate between soil and water. In particular, following studies of Brakenridge et al. [15] and successively Tarpanelli et al. [13], the ratio between the reflectance of a dry pixel (C for calibration) and a wet pixel (M for measurement), i.e., the C/M ratio, is expected to represent the river variation well both in terms of mean flow velocity and river discharge.
This principle was already applied in several studies [16,17,18,19,20,21,22,23] and extended to the Terra/Aqua Moderate Resolution Imaging Spectroradiometer (MODIS), ENVISAT MEdium Resolution Imaging Spectrometer (MERIS) and Landsat datasets. Specifically, in accordance with study by Tarpanelli et al. [19], MODIS resulted in being the best performer, especially thanks to its daily temporal resolution and ease of data processing, two features not shared by MERIS and Landsat. However, the MODIS sensor is not accurate for small rivers (<100 m width) and to compensate for this limitation, the studies of Li et al. [21] and Shi et al. [22] investigated the use of a high-resolution satellite. Li et al. [21] used Landsat in three rivers on the Tibet Plateau ranging from 60 m to 130 m width, and obtained Nash–Sutcliffe efficiency, NSE, ranging from 0.32 to 0.82. Shi et al. [22] faced the estimation of river discharge at two study areas in the Murray–Darling basin with 60–90 m width analyzing the Harmonized Landsat and Sentinel-2 surface reflectance product [24], and obtained relative root mean square error, rRMSE, ranging from 19% and 53%. With the purpose to solve the problem of the cloud coverage for the tropical areas, Sahoo et al. [23] proposed an integrated MODIS-Landsat fusion approach to estimate high-frequency discharge and tested the procedure in the Brahmani River Basin in eastern India. The method proposed to merge two datasets through a copula-based model to improve the temporal resolution of the single datasets and demonstrated the improved results versus the original approach of Tarpanelli et al. [13]. This first study on the combination of multi-mission satellites proved its utility in enhancement of the flow monitoring especially on the densely cloudy areas.
Following these studies that deal with the same approach with different satellite products, here we introduce the analysis to a new sensor, the Ocean and Land Colour Instrument (OLCI), testing for the first time its potential in the monitoring of the river flow variation. Despite OLCI not introducing any improved quality feature with respect to the already cited sensors, neither on the spatial nor in the temporal resolution, the testing of its potential has become important to confirm (or not) the capability of the multispectral sensors to monitor flows. In addition, in the future prospect of using the multispectral sensors together with other satellite sensors, i.e., radar altimetry [18,19], the co-location of the different sensors in the same platform should bring added value to the flow monitoring. During the overflight of a river, the contribution of each sensor can be evaluated at the same time frame and the combination of observations allows estimating river discharge during each pass of the satellite [5]. This is allowed by the Sentinel-3A/B satellites in which the Synthetic aperture Radar ALtimeter (SRAL) and the multi-spectral OLCI are part of the same payload [25].
With the aim of developing a new methodology for estimating river discharge through the combination of satellite radar altimeter and multi-spectral sensors data, the European Space Agency (ESA)-funded Project RIDESAT (RIver flow monitoring and Discharge Estimation by integrating multiple SATellite data [26]), under the EO4Society Permanent Open Call, proposes two main activities: (1) to implement algorithms that link altimeter and optical sensor retrievals to river flow-related variables and (2) to develop a merging procedure for the estimation of river discharge through a physically consistent approach. First, the single-instrument products (altimetric or multi-spectral) are independently processed to generate a dataset of proxies of river flow-related variables (e.g., water level, flow velocity, river width). Secondly, these proxies are used to build a physical formulation for the final estimation of river discharge. With this objective, it is important to explore the potential of the reflectance ratio to estimate not only the river discharge, but other flow-related variables useful for the future prospective to incorporate them in the physical formulation.
Differently from similar studies that proposed and used the same approach to derive river discharge from the reflectance ratio, here, we tries to examine in depth new aspects, not only related to a new sensors, but also to scrutinize better which river-flow related variables are best represented by the reflectance ratio and, above all, by the possibility to improve the temporal resolution of the satellite series with a combination of more sensors observing the same region in different temporal instances. Indeed, due to the passive nature of the multispectral instruments, the presence of clouds represents a limit. The possibility to have more than one satellite observing the same area at different times facilitates monitoring and enables us to experiment with the combination of satellite from different missions, in order to shorten the frequency and also to correct possible outliers in the measurements.
Based on these premises, the analysis aims to answer three different scientific questions:
(1)
What is the potential of OLCI in the estimation of the river discharge?
(2)
Which is the river flow-related variable best represented by the reflectance ratio, behind the river discharge?
(3)
Could a multi-mission approach, obtained by the combination of different multispectral sensors (i.e., OLCI and MODIS), provide an improved estimation of river discharge or flow-related river variables?
To answer these questions, the study compares the performances obtained by OLCI with those obtained by the MODIS sensor, already used in previous studies [13,16,18,19], according to independent analyses and, successively, analyzes the integration of the two products to evaluate possible enhancements in river flow monitoring.
The analysis is carried out for the Po River, where a hydro-monitoring network including numerous sites recording water level and river discharge is present and where the geometric survey of the river cross sections is available and used with the purpose of calculating the river flow-related variables, i.e., mean flow velocity, surface width and flow area. All these variables are employed to carry out a sensitivity analysis in function of the reflectance ratio and answer the second scientific question above. More details are given in the next sections.
The paper is organized as follows: Section 2 presents the study area and the in-situ and satellite datasets; Section 3 describes the methods; Section 4 shows and discusses the results; Section 5 summarizes the conclusions.

2. Study Area and Datasets

The Po River in Northern Italy has often been the subject of hydrological/hydraulic studies [27,28,29]. Its characteristics make it particularly suitable for testing potential remote sensing data. For example, its 650 km east-west extension and the large Po Valley, also called the Padan Plain, (46,000 km2, including its Venetic extension not actually related to the Po river basin, see Figure 1) fostered the use of satellite radar altimetry for river discharge estimation [30,31] and implementation of hydraulic models [32,33]. The morphology of the river with a single branch and a width of around 300 m makes it suitable for imaging sensor analysis.
In this work, the river stretch from the Piacenza gauging station up to the Pontelagoscuro gauging station (latitude 44.771°–45.205° and longitude 9.562°–11.901°), already investigated in other papers [13,18], has been selected to test the capability of the Sentinel-3A/B OLCI sensor to monitor the variations of flow along the Po River. This allows us, therefore, to compare the performance obtained by OLCI with those already evaluated and here improved through MODIS sensors.

2.1. In Situ Datasets

Five stations are analyzed: Piacenza, Cremona, Borgoforte, Sermide and Pontelagoscuro. The daily water level and river discharge data are downloaded by the Dexter Service of the Regional Agency for the Forecasting, the Environment and the Energy of the Emilia Romagna Region (Arpae) [34]. Moreover, for each ground station, a 2005 topographic survey by the Interregional Agency of the Po River provided geometric data of the cross-sections. The topographical survey is used to derive the flow-related variables of surface width and flow area for the period January 2016–December 2019. The mean flow velocity is calculated through the ratio between discharge and flow area. Table 1 shows the range of variability (maximum and minimum values) of the variables used in the analysis within the period of interest.

2.2. Satellite Datasets

Concerning satellite data, OLCI and MODIS datasets have been collected for the analysis. Specifically, OLCI observes the Earth in 21 spectral bands, ranging from the visible to the near-infrared (400 nm to 1020 nm). Almost daily OLCI Surface Reflectance OL_1_EFR products from Sentinel-3A and Sentinel-3B have been downloaded for the region of interest from the Copernicus Open Access Hub website [35]. The choice of processing Full-Resolution Earth Observation (EFR) products at Level-1 is due to the masking of river areas in the correspondent Level-2 products. The OLCI Level-1 data include 22 measurement and 7 annotation data files. Measurement files are written in netCDF4 format and contain the top of atmosphere (TOA) radiation and the error estimates for each OLCI channel. OLCI EFR products have a spatial resolution of approximately 300 m on ground.
The following steps have been carried out for obtaining Level-2 OLCI reflectance values:
(1)
pre-processing, including: (i) conversion of reflectance from radiance to the top of the atmosphere based on sensor-specific information [36] and removal of the effects of differences in illumination geometry (different solar angle, Earth–Sun distance); (ii) first phase of pre-classification helps us to understand the performance results of each processor taking into account the type of pixel (clouds and snow / ice);
(2)
correction of TOA reflectance for gaseous absorption (nitrogen—NO2, ozone—O3, oxygen—O2 and water—H2O)
(3)
second phase of pixel pre-classification (consolidated land/water). This allows for systematically generating maps and multi-temporal statistics of water constituents from Sentinel-3 to classify the territory. The classification could make use of various automatic or semi-automatic techniques, however, this being a fundamental step in the production chain, it was decided to create an ad hoc water mask for the study area. The mask filtering allowed the removal of pixels whose spectrum has been contaminated by land or terrestrial targets and that, undoubtedly, would have caused an erroneous estimate of the biogeophysics parameters.
(4)
smile correction, which is a necessary step together with the TOA reflectance correction because of the small-scale variations due to the wavelength of the central body which is not constant in some bands of the visual field. Smile correction can be defined as the second instrumental correction along with TOA to achieve maximum accuracy. Atmospheric correction acts on errors due to the atmosphere, while smile correction acts on errors in the spectral misalignment of the measured wavelength. Both corrections guarantee uniformity in the local variations of reflectance with the wavelength and allow a sure estimate of the reflectance derivative. The correction is made on the basis of a subset of bands, specific to the types of land surface and water.
(5)
system vicarious calibration and alternative atmospheric correction: these are the final pre-processing steps performing an indirect calibration with in -situ high-precision radiometry and improving the atmospheric correction on turbid and highly absorbent waters through a neural network. The Case 2 Regional Coast Color (C2RCC) processor is used, based on a neural network method with multi-sensor per pixel artificial, built on the AC Case 2 Regional and Coast Colour algorithms [37].
Once processed, the OLCI reflectance data coming from band 17 (855–875 nm) are referred to as the Level-2 product.
MODIS observed the Earth in 36 spectral bands ranging from 405 nm to 14,385 nm at a resolution variable from 250 m to 1 km. Here, Level-2 version 6 Surface Reflectance daily product at 250 m resolution from Terra (MOD09GQ) and Aqua (MYD09GQ), tile h18v04, have been collected from the United States Geological Survey (USGS) website [38]. These provide an estimate of the surface spectral reflectance in band 2 (841–876 nm) corrected for atmospheric effects such as gasses, aerosols, and Rayleigh scattering [39].

3. Methods

The adopted method is based on the procedure developed by Tarpanelli et al. [13]. The general principle and the main steps are summarized below, along with the adaptation required by this specific analysis. The derived Level-3 product will be compared to the river flow-related variables as explained in detail in the following subsections.

3.1. Estimation of the Level-3 Reflectance Ratio

The procedure for estimating the reflectance ratio from optical images, proxy of river flow-related variables, is based on the reflectance signal, which differs in the case of water or land. The surface reflectance of a dry pixel is higher than that of a wet pixel. When a pixel close to the river changes its moisture content from dry to wet, its reflectance varies in a decreasing way. For the natural channels, this decreasing signal is related to an increasing of moisture into the river related to the increasing of discharge and, hence, all the other geometric variables connected to it (e.g., water level and surface width). Under this condition, even if it is observed that the reflectance signal is quite sensitive to the variation of river discharge [13,17] some adjustments need to be addressed. For example, analyzing only the pixel close to the river is risky because of the confounding effects of vegetation and atmosphere. Considering a reference pixel that is not affected by water variation, such as a pixel in an urban area or on bare soil, this reduces these effects. Therefore, by defining the reference pixel as a calibration pixel (C), in a dry zone, and the measurement pixel (M) close to the river, the reflectance ratio C/M is used for the retrieval of river discharge. The location of M is really important and should be calibrated in order to obtain plausible results. If the pixel M is fully wet (the pixel is located inside the water course) the reflectance will be almost constant, and less sensitive to the variation of the discharge than a pixel located partially in the river. It has been observed from previous studies [13,19] that the pixel M is highly sensitive to the variation of the water extent and hence the river discharge, especially if taken close to the bank, over sediment deposits that are not vegetated, or emerging during low flows. Indeed, because the riparian vegetation can affect the reflectance measurement, the pixel M should be located, if possible, over areas not fully vegetated. Even if the resolutions of MODIS or OLCI are similar to the surface width of the river, the pixel M should contain enough information to detect a variation of water extent imposed by a flood event. Put simply, the pixel become wetter due to the enlargement of the river and hence its reflectance decreases. Being the denominator in the ratio, this translates into an increase of the reflectance ratio C/M.
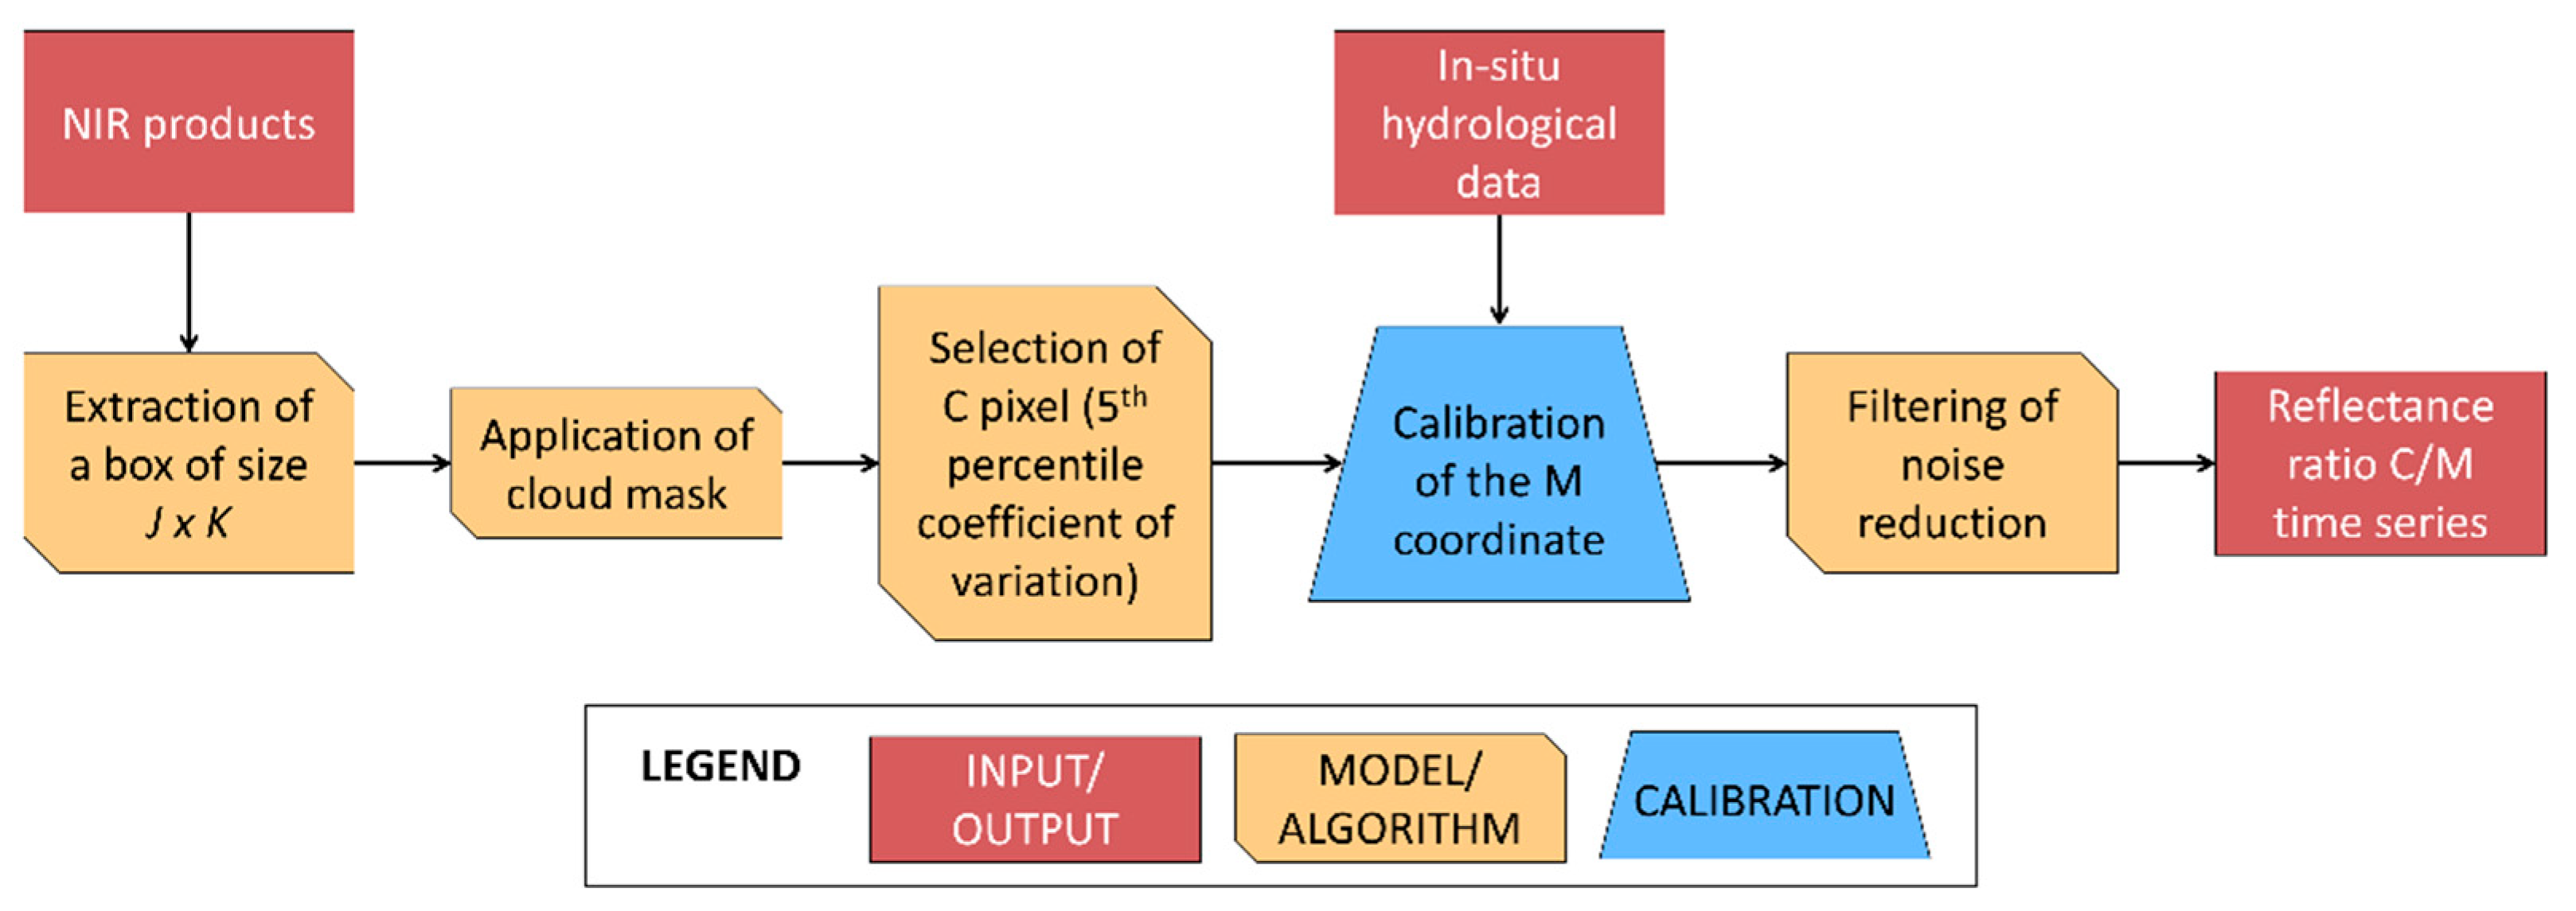
As anticipated, some modifications shall be introduced to main processing described in Tarpanelli et al. [13] to improve the process and account for other aspects of the present analysis. A time series of length N of multi-spectral images is extracted from the NIR band products. From each image, a box of size J × K is extracted and centered on the site of interest (e.g., the ground gauging station). Afterwards, a threshold of 0.2 is applied on the reflectance to discard pixels affected by clouds. All boxes are then visually checked to ensure that clouds are no more affecting the imagery. By contrast with the original development of the approach in [13], in which a single pixel was calibrated, here we focus on multiple pixels with a low temporal coefficient of variation. In order to ensure a constant value of reflectance, we calculate C as the average of the reflectance values of pixels presenting a temporal coefficient of variation lower than the 5th percentile of the pixels contained in each box [16]. For the M pixel, a calibration of its location is done by considering only pixels within a buffer of 1 km on each side of the central river line. This arbitrary value is assumed to be plausible for the Po River, whose median width is around 280 m, and should be extended for rivers having a larger width. Each single pixel included in the 1 km buffer is selected to calculate the C/M time series. Successively, each time series is compared against the observed river discharge in the same time period in terms of correlation coefficient. The time series with the highest correlation coefficient with the observations is selected and, hence, the location of the corresponding M pixel is identified [13].
Li et al. [21], considering the Landsat imagery at 30 m, preferred to resample the original satellite scenes in tiles of 3 × 3 pixels. Indeed, by averaging the reflectance in multiple pixels, the values of the M pixel are expected to be more stable and less affected by the geometric misalignment of the images comprising the temporal series. In the case of high-resolution images, such as those from Landsat, the resampling is an added value to the analysis. Therefore, it is worth investigating if the averaging of multiple pixels provides better results than the original single-pixel approach also for medium-resolution satellites. For this reason, two more configurations (performing a 2 by 2 and 3 by 3 pixels resampling of the original grid) are considered to investigate the effect of multiple-pixel ratio as described by Li et al. [21]. Accordingly, the size of the resampled box is j × k where j = J/2 and k = K/2 or j = J/3 and k = K/3. The original single configuration will, hereafter, be named “single-pixel” whereas the resampled configurations will be named “multiple-pixel”.
In all the configurations, the C/M time series are processed through a low-pass filter (moving window average) to obtain smoothed time series. The resulting Level-3 products are identified with the name of the optical sensor(s) originally used to derive the datasets: MOD for MODIS Terra; MYD for MODIS Aqua; OLCI A for OLCI Sentinel-3A; OLCI B for Sentinel-3B. The flow chart of the procedure to derive the C/M ratio from multi-spectral sensors is represented in Figure 2.

3.2. Reflectance Ratio as a Proxy of River Flow-Related Variables

In previous studies, the reflectance ratio was correlated to river discharge and mean flow velocity [13,19,21,22,23]. Here, to infer possible new relationships between reflectance ratio and hydraulic variables characterizing the river, the C/M time series are compared to the time series of water level, flow area, surface width, river discharge and flow velocity registered at each gauged station (Figure 1). This sensitivity analysis is performed by calculating the Pearson correlation coefficient, R, between the C/M time series and each river flow-related time series.

3.3. Integration Procedure for the Multi-Mission C/M Time Series

The integration of multi-mission time series widens the possibility to describe the flow dynamics in a more accurate and detailed way thanks to the increased sampling frequency coming from different satellite passes. The combination of MODIS and OLCI sensors, which have different revisit frequencies (16 days for MODIS and 27 days for OLCI) and different pass epochs (Terra overpasses the area at 10:05 UTC, Aqua at 13:05 UTC, Sentinel-3A and Sentinel-3B around at 9:30 UTC), also increase the possibility of obtaining cloud-free images. No examples are provided in literature for integrating reflectance products in a multi-temporal scale. Tarpanelli et al. [40] merged five rainfall products, obtained through the application of the SM2RAIN algorithm to five soil moisture products, for the estimation of a multi-mission rainfall product in Italy and India. Here, we follow a similar approach and consider different configurations, for a total of seven combinations, based on the different inputs considered for the integration. In this manner, it is possible to identify the role of each satellite in the estimation of the C/M reflectance ratio.
All the configurations consist in a linear combination of the satellite reflectance products derived from NIR observations [40]. The weights of the linear combination vary in time and space (for each site) and they are computed by maximizing the temporal correlation coefficient between the estimated multi-mission C/M reflectance ratio and ground-based observations (here selected as the more representative variable). The sum of the weighting factors shall be equal to one.
The seven configurations are listed in Table 2, specifying the sensors combination and merging period. The first three configurations are calculated in the common period of the four products, from December 2018 to November 2019, whereas for the other configurations the period from January 2016 to November 2019 is considered. The configurations are set up to identify the best integration approach (e.g., MODIS-only, OLCI-only or a combination of both). The evaluation of the performance is done through: (i) the correlation coefficient versus the river flow-related variable well represented by the reflectance ratio; (ii) the sample frequency of the final multi-mission time series; and (iii) the evaluation of performance metrics in the evaluation of the flow-related river variable best correlated. Concerning the latter point, a regression curve is fitted between the multi-mission C/M time series and the most representative variable. The simulated variable is compared to the ground observed variable to estimate the performance indices described in the Session 3.4 and evaluate its accuracy.

3.4. Evaluation of the Results

The evaluation of the performances of C/M reflectance ratio is carried out in terms of the Pearson coefficient of correlation, R. In order to evaluate whether the differences between the results are significative, the one-way analysis of variance (ANOVA) test is used [41]. ANOVA is a statistical test that determines whether the means between independent groups are equal. Considering a significance level α equal to 0. 05 as a threshold for rejecting the null hypothesis, if the probability p-value is less than or equal to the significant level, the differences between some of the means are statistically significant. If p-value is greater than the significance level the differences between the means are not statistically significant.
Concerning the performance metrics used to evaluate the goodness of the simulated variable in representing the ground-observed variable, we selected the Nash–Sutcliffe efficiency, NSE [42], root mean square error, RMSE, and relative RMSE, rRMSE defined as:
r R M S E = R M S E y ¯ o b s · 100
where y ¯ o b s is the mean value of the observed time series. It varies in the range from 0 (perfect estimate) to infinity (low performances).

4. Results and Discussion

As anticipated, two main analyses were carried out: the first analysis compared the single-mission performance of OLCI and MODIS sensors in monitoring the river flow, whereas the second analysis evaluated the multi-mission performances. In the description of the results, different aspects were taken into account: (1) the analysis of the reflectance of M and C pixels; (2) the use of single and multiple pixels; (3) the sensitivity analysis relating the C/M ratio to the different river flow-related variables (water level, river width, river discharge, mean flow velocity and mean flow area); (4) the possibility to combine several reflectance ratio time series into a single C/M time series to be used for monitoring the river flow at each site.

4.1. Analysis of the Reflectance for M and for C Pixels

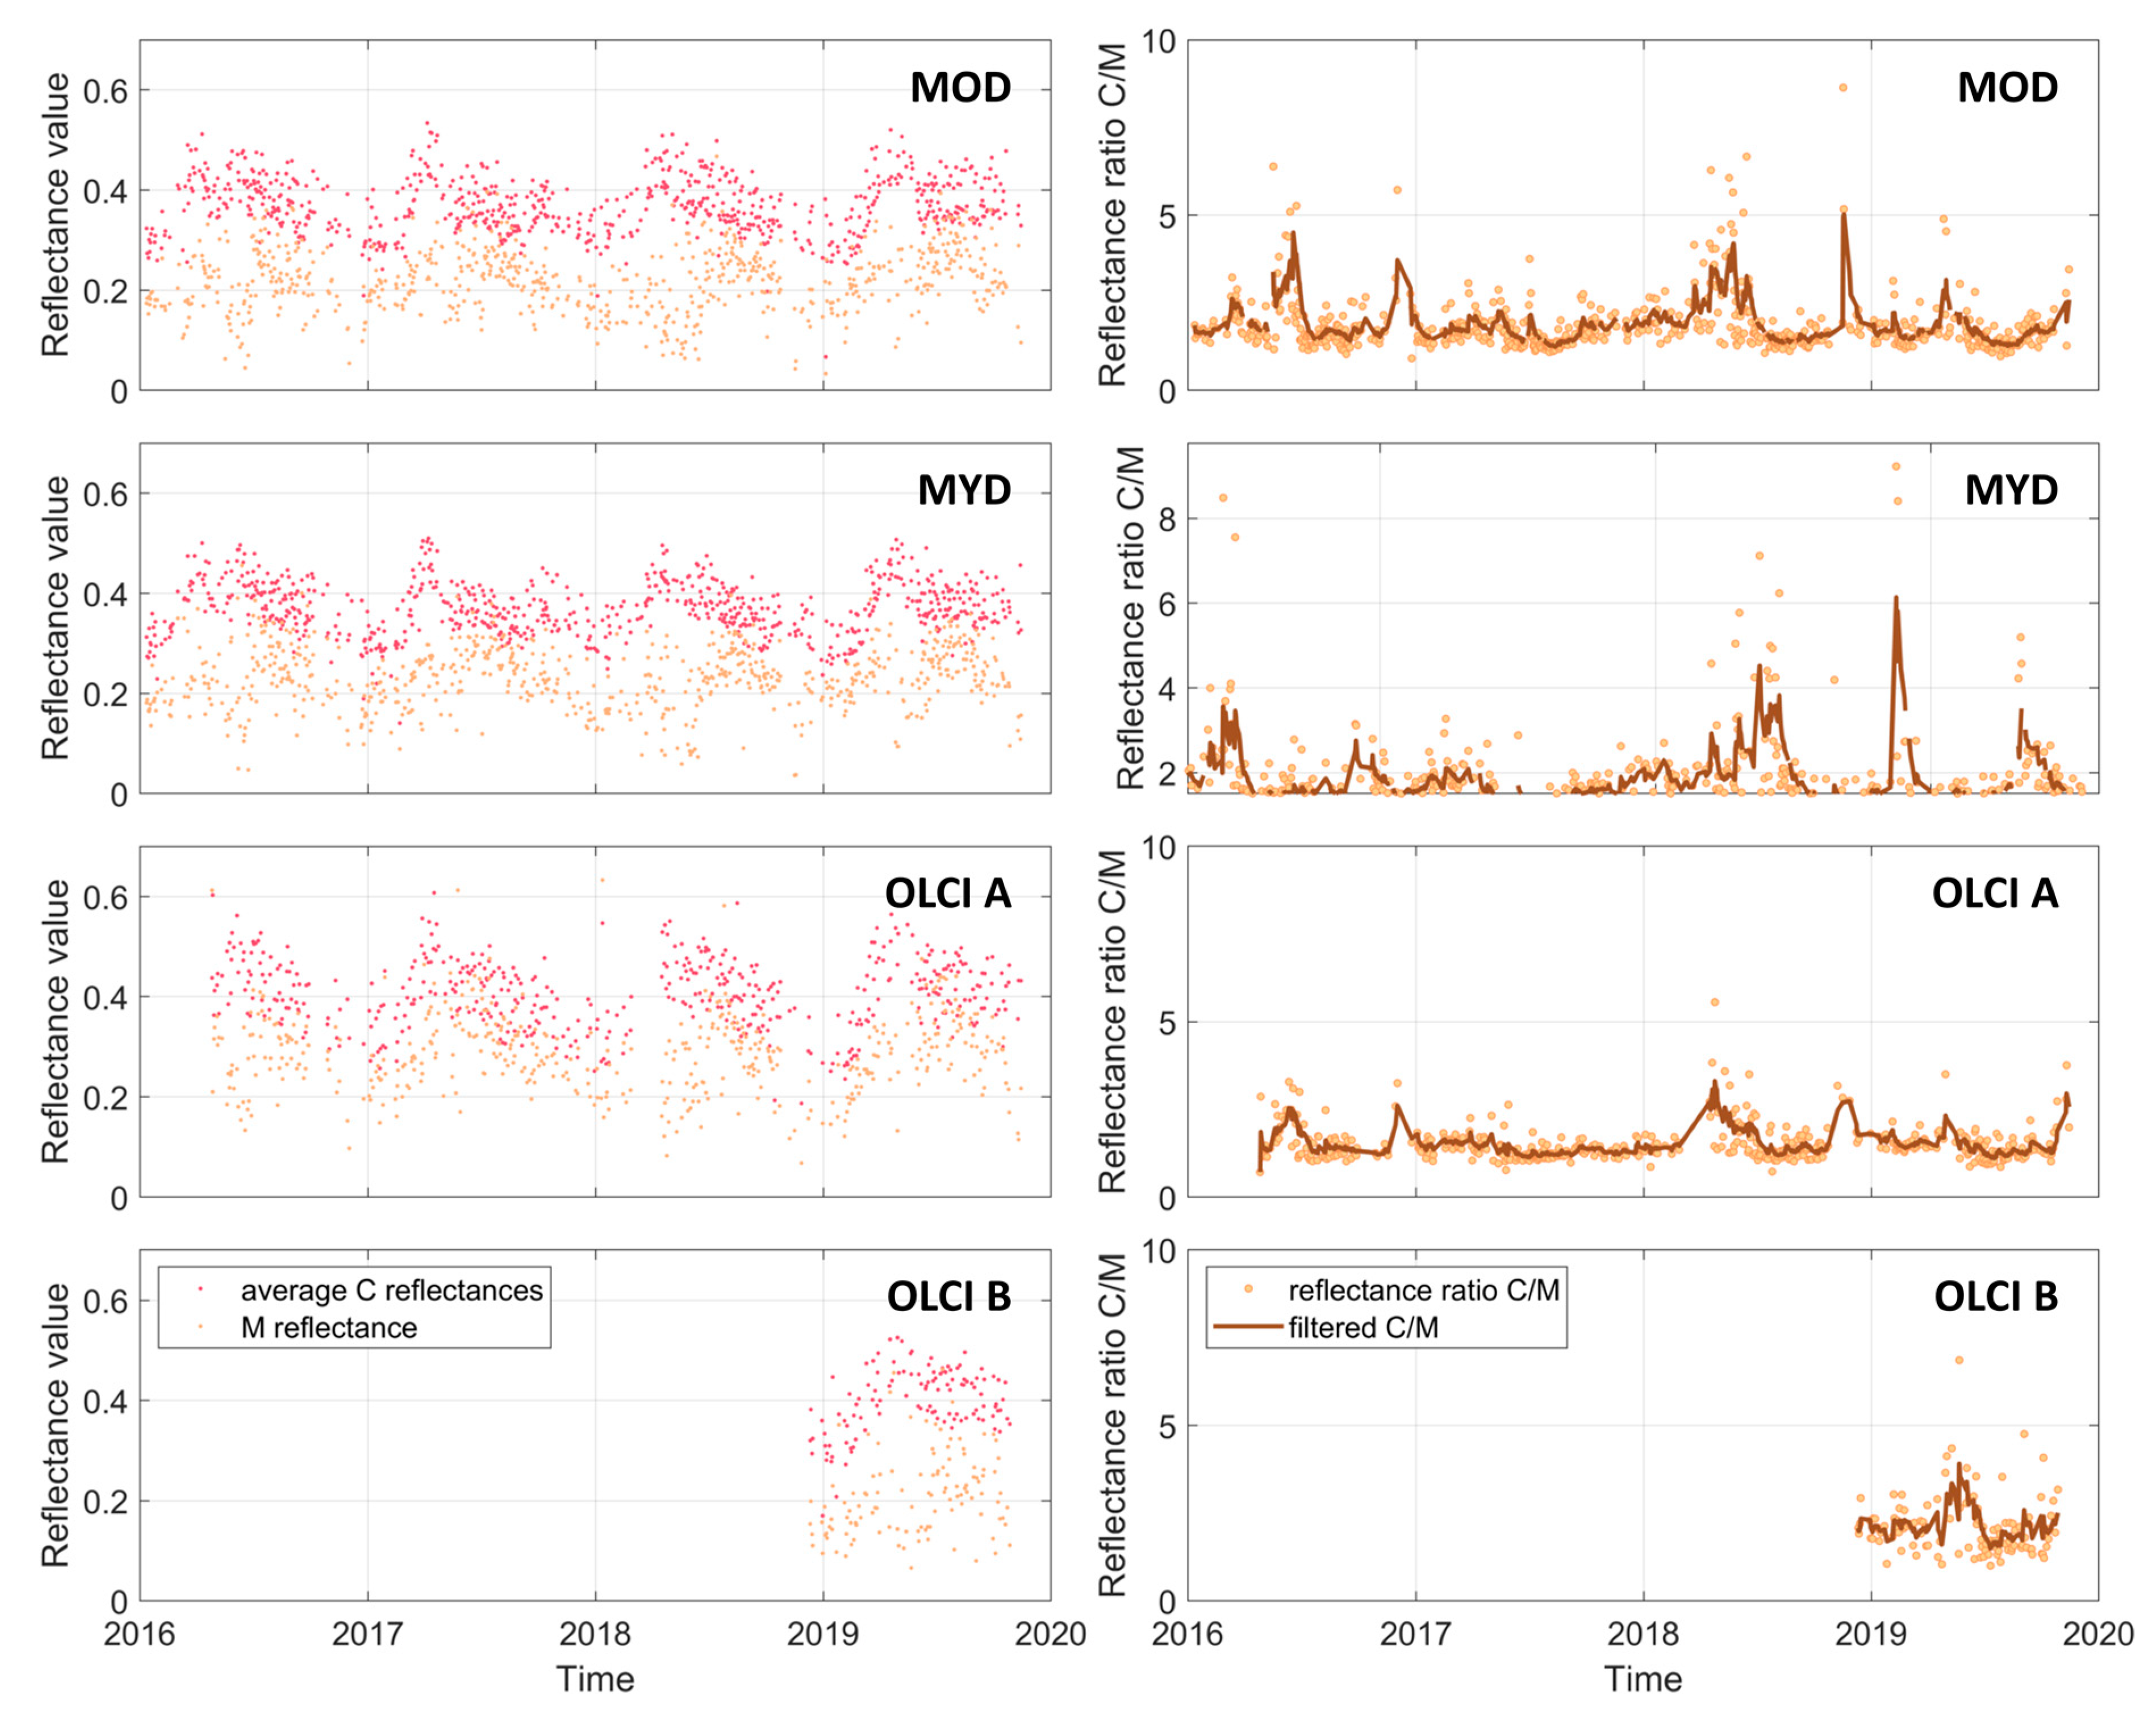
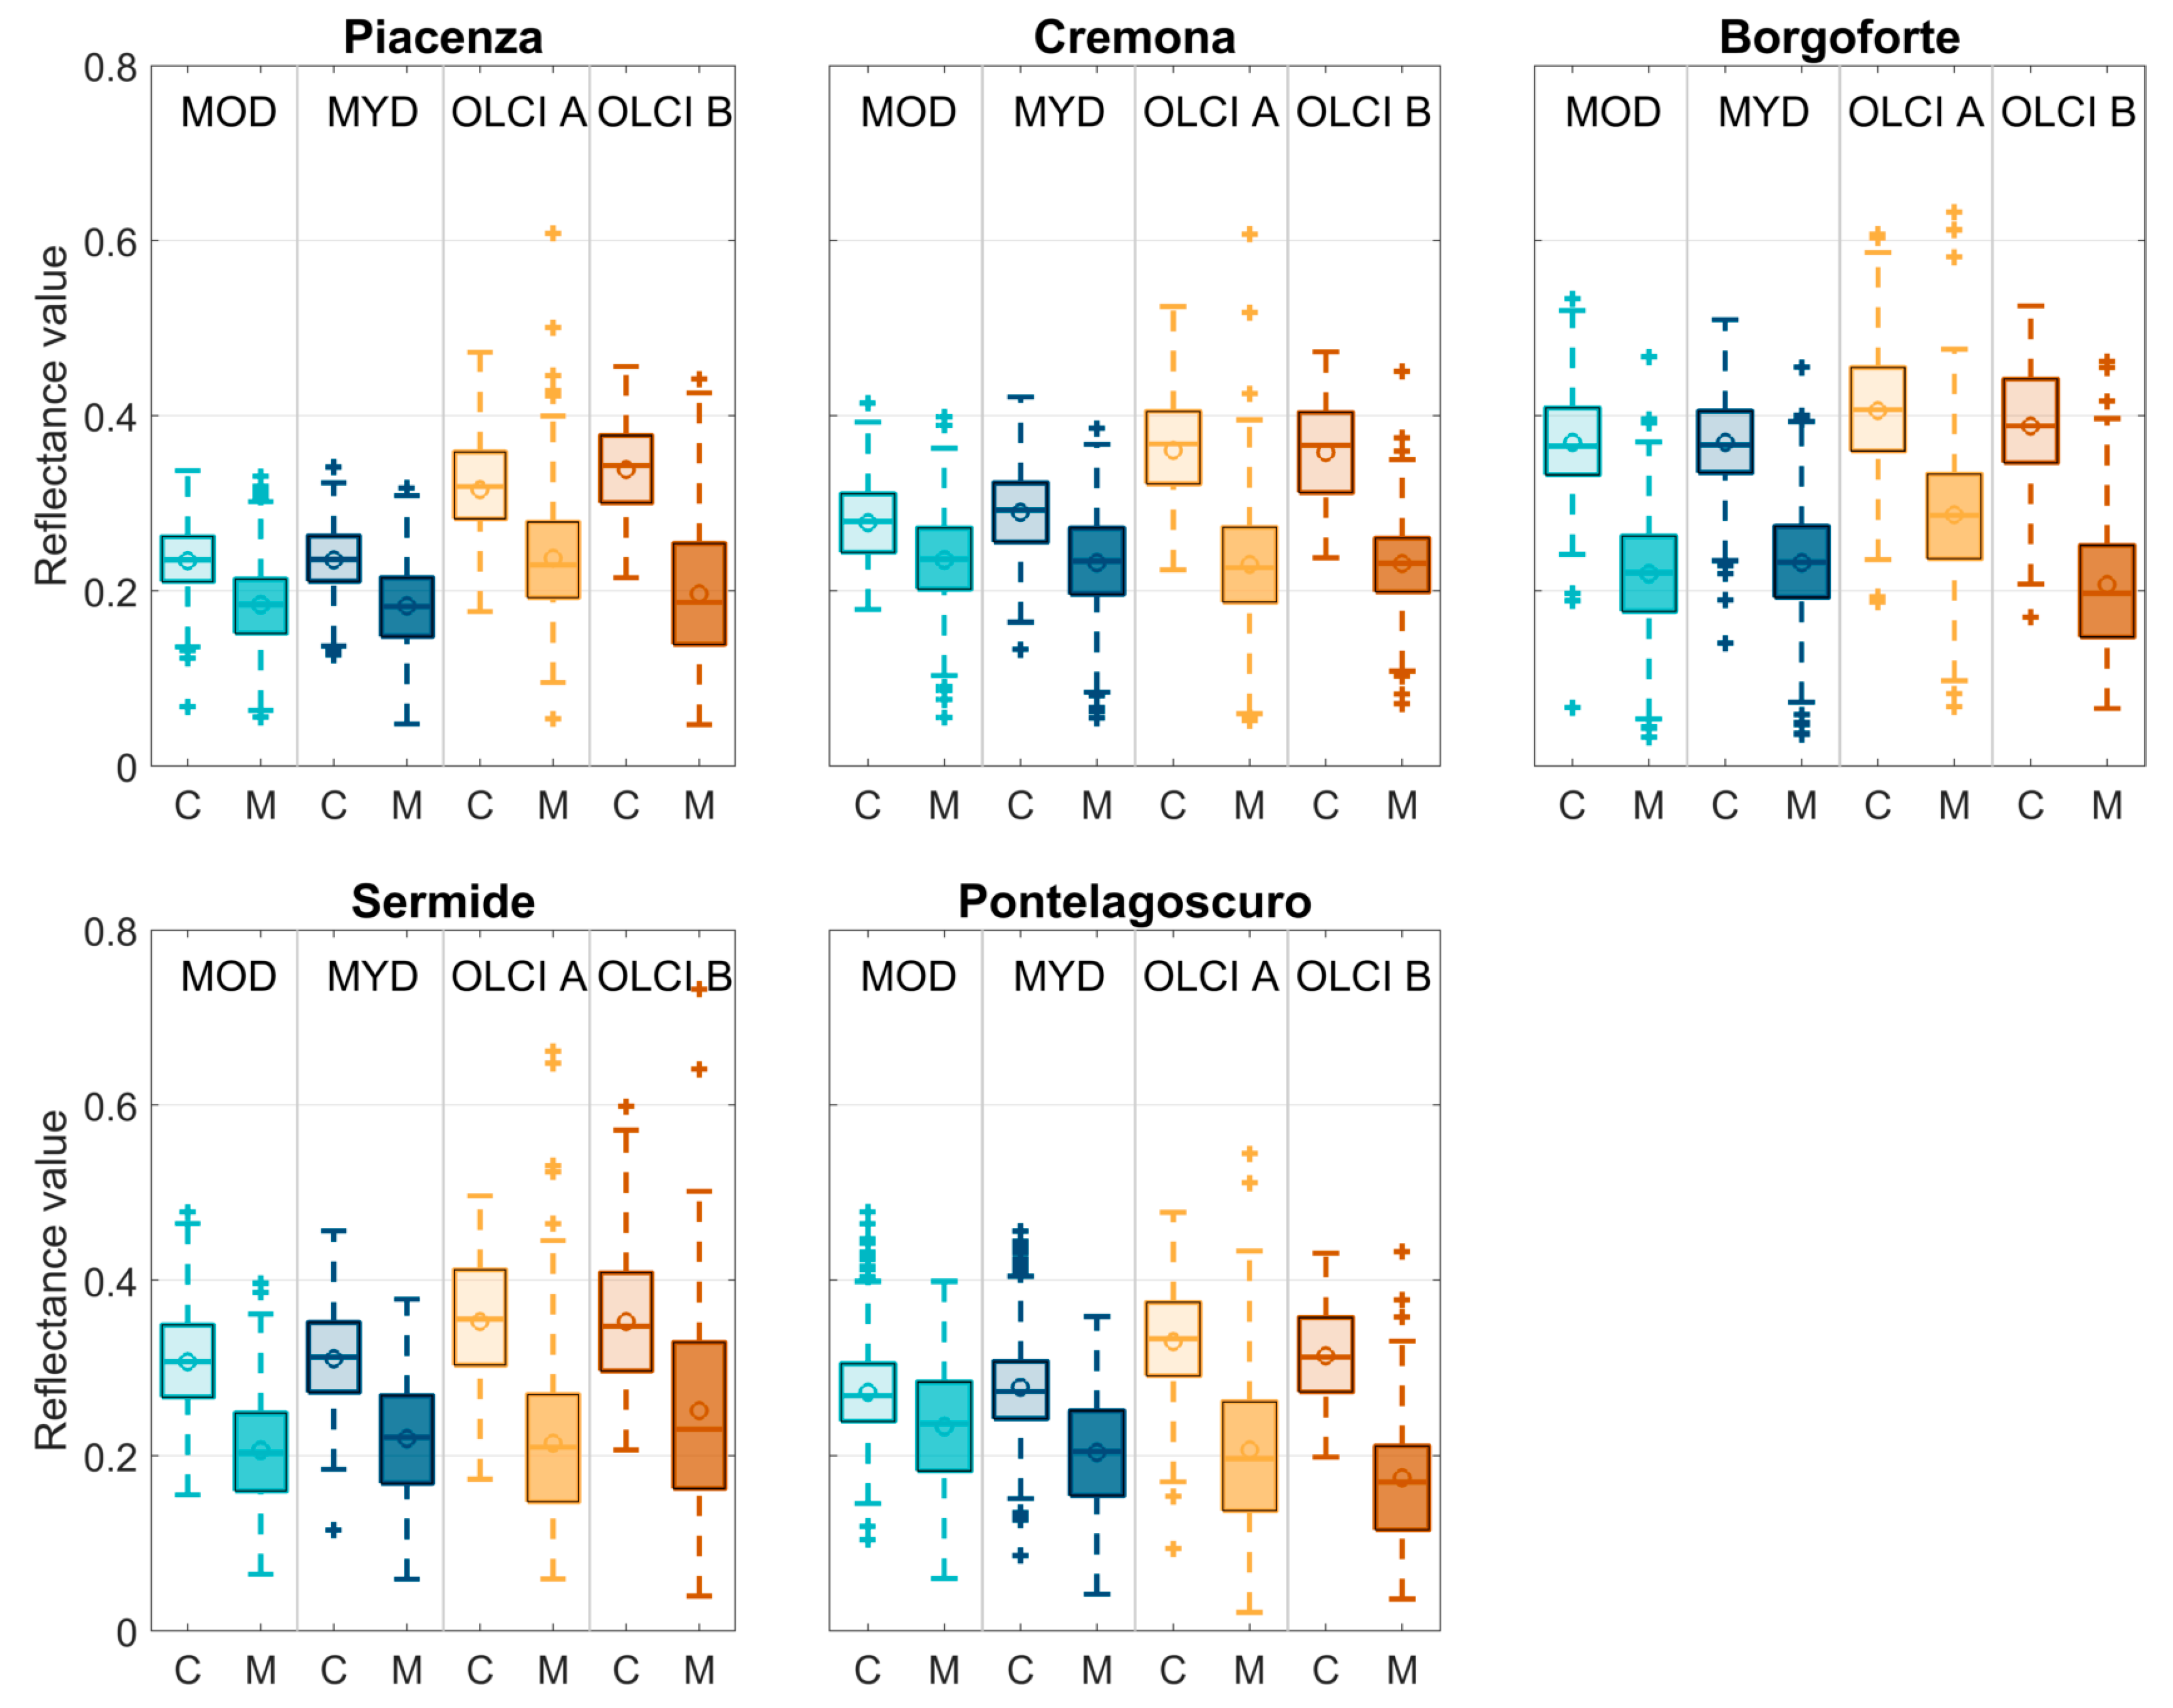
The original formulation [13] of the single pixel approach to derive C has been modified to define a more stable C time series by considering multiple pixels [16]. Pixels with a coefficient of variation smaller than the 5th percentile are selected and their reflectance is spatially averaged in order to obtain a single time series identifying the reference reflectance for each box. For the Borgoforte site, the C time series for each satellite product is reported in Figure 3, along with the M time series. The C time series is always higher than the M time series, confirming that the reflectance of a dry pixel is higher than that of a wet pixel. The differences between C and M time series are quite evident not only in terms of bias but also for their variability (see also Figure 4). The dynamic range of C is narrower than that of M and shows a seasonal trend.
For each site, Figure 4 shows the box plot of M and C pixel reflectance for different sensors. For each boxplot, with respect to the distribution of the five sites, the central mark indicates the median value, whereas the bottom and top edges of the box indicate the 25th and 75th percentiles, respectively. The whiskers extend to the most extreme data points not considering outliers (indicated with the “+” symbol). The circle reported above each box represents the mean value.
Despite the calibration being carried out separately for each sensor, the location of M lies almost always in the same area, and often at the same pixel suggesting a consistency between the reflectance values measured by the sensors for most of the cases. Generally, the median of the reflectance values is quite similar but reflectance values measured by OLCI A in two cases (Piacenza and Borgoforte) are higher. By contrast, OLCI B sometimes shows a very different variation, to be attributed to the short-length time series analyzed. MOD and MYD are very similar both in dynamic and median values.

4.2. Reflectance Values for the Estimation of Different River Flow-Related Variables: Sensitivity Analysis

A sensitivity analysis was carried out to investigate which river flow related variable was reproduced better by the C/M reflectance ratio. For this purpose, the comparisons between the C/M time series and the variables of flow area, A, river width, W, water level, WL, mean flow velocity, v and river discharge, Q, were evaluated in terms of R and reported in Figure 5. Based on the boxplots, all the optical sensors show a good potential for the estimation of river flow-related variables. The ANOVA test in Table 3 (left) shows p-values greater than 0.05. This means that differences in the correlations means are not significant and all the river flow-related variables can be considered as representative of the C/M reflectance ratio. However, speculating on the results, mean flow velocity achieves better performance (i.e., higher R values) consistent with other studies available in literature [13,18] and it is used in the next step of the multi-mission analysis. This result is probably due to the narrow range of variation of the mean flow velocity with respect to the other variables (see Table 1) that facilitates the linear relationship with the reflectance ratio values.
Concerning the sensors, the ANOVA test in Table 3 (right) shows the variability of the sensors to the river flow-related variables. Generally, p-values are lower than 0.05 except for surface width that shows a global p-value of 0.0531. However, considering this variable, the comparison between MOD and OLCI B assumes a p-value equal to 0.0431. MODIS often outperforms OLCI. Specifically, the median and mean values for MOD are globally higher. OLCI B shows lower performance probably due to its temporal availability that covers only one year. These results are due to different aspects. First, MODIS and OLCI have similar spatial resolution but not identical. The pixel size in the OLCI image is around 300 m, and undoubtedly contains more water/soil of the pixel in the MODIS image that is smaller (around 250 m). Therefore, the reflectances measured by the two sensors in the same pixel are different (compare Figure 2). Second, the MODIS grid is not coincident with the OLCI grid and a shift of a few tens of meters can provide different values of reflectance and hence, of the C/M reflectance ratio. Third, each satellite mounting the sensors overpasses the river in different pass epochs. Considering MODIS Terra and MODIS Aqua that are available in the same period, the two sensors overpass the same area in the morning and in the afternoon, respectively. Generally, the Padana Plain is affected by a strong and dense fog during the morning that disappears during the afternoon. Despite the region and the sensors being the same, the observations vary during the day because of the different atmospheric conditions. Four, each sensor is evaluated independently of the others. The time of passage and the cloud coverage have an influence on the temporal series of C/M reflectance ratio. Because the dynamic of the river is quite fast, the four sensors observe four different instances of the river and some missing observations are due to the clouds or simply to the revisit time of the satellite and can determine different temporal series and consequently different performances.
The results are very close to those obtained in the study of Tarpanelli et al. [13], even if slightly improved. Indeed, they analyzed the period 2005–2012 for four stations (all included in the present analysis except Sermide) with Aqua satellite and obtained coefficients of correlation ranging from 0.67 and 0.77 (0.65 and 0.75) against the mean flow velocity (river discharge). For the same stations, in the present study the correlation coefficients range between 0.72 and 0.77 (0.68 and 0.78) against the flow velocity (river discharge).

4.3. Comparison between Single- and Multiple-Pixel Configurations

The performances obtained in the above analysis are referring to the single-pixel configuration. Following the analysis of Li et al. [21] further configurations are considered to test the possibility to increase the performances. Considering the results in Figure 6, an increased performance is not achieved using medium-resolution satellite images over the Po River. Each plot in the figure represents the median values of the correlation coefficients of the distributions obtained for the five sites, grouping for river flow-related variables and configurations. The single-pixel configuration has the highest values compared with the other two configurations with the only exception of flow velocity with OLCI B. The ANOVA test suggests that the differences between single-pixel configuration and multiple-pixel configuration with 2 × 2 pixels for MOD (p-value = 0.29), OLCI A (p-value = 0.14) and OLCI B (p-value = 0.88) are not significant. In the case of MYD, the ANOVA test shows that configurations multiple-pixels, 2 × 2 and 3 × 3, are very similar (p-value = 0.51) even if they deviate from the configuration at single-pixel which exhibits the best performance.

4.4. Multi-Mission Time Series

Based on the previous analyses, the mean flow velocity was the variable that correlated better to the C/M ratio for both OLCI and MODIS sensors. For this reason, the multi-mission time series resulting from the next investigations were compared with the ground observations of the mean flow velocity. In particular, different configurations were analyzed for the resulting time series and two investigations (A and B) were undertaken. The investigation “A” consisted in calibrating the weights of the individual products using coexisting data, that is, belonging to observations that took place on the same day. The investigation “B” consisted in using these weights even if some of the products were missing. In this latter case, as for each day the sum of the weights must be equal to 1, each individual weight was re-scaled with the sum of the weights of the day.
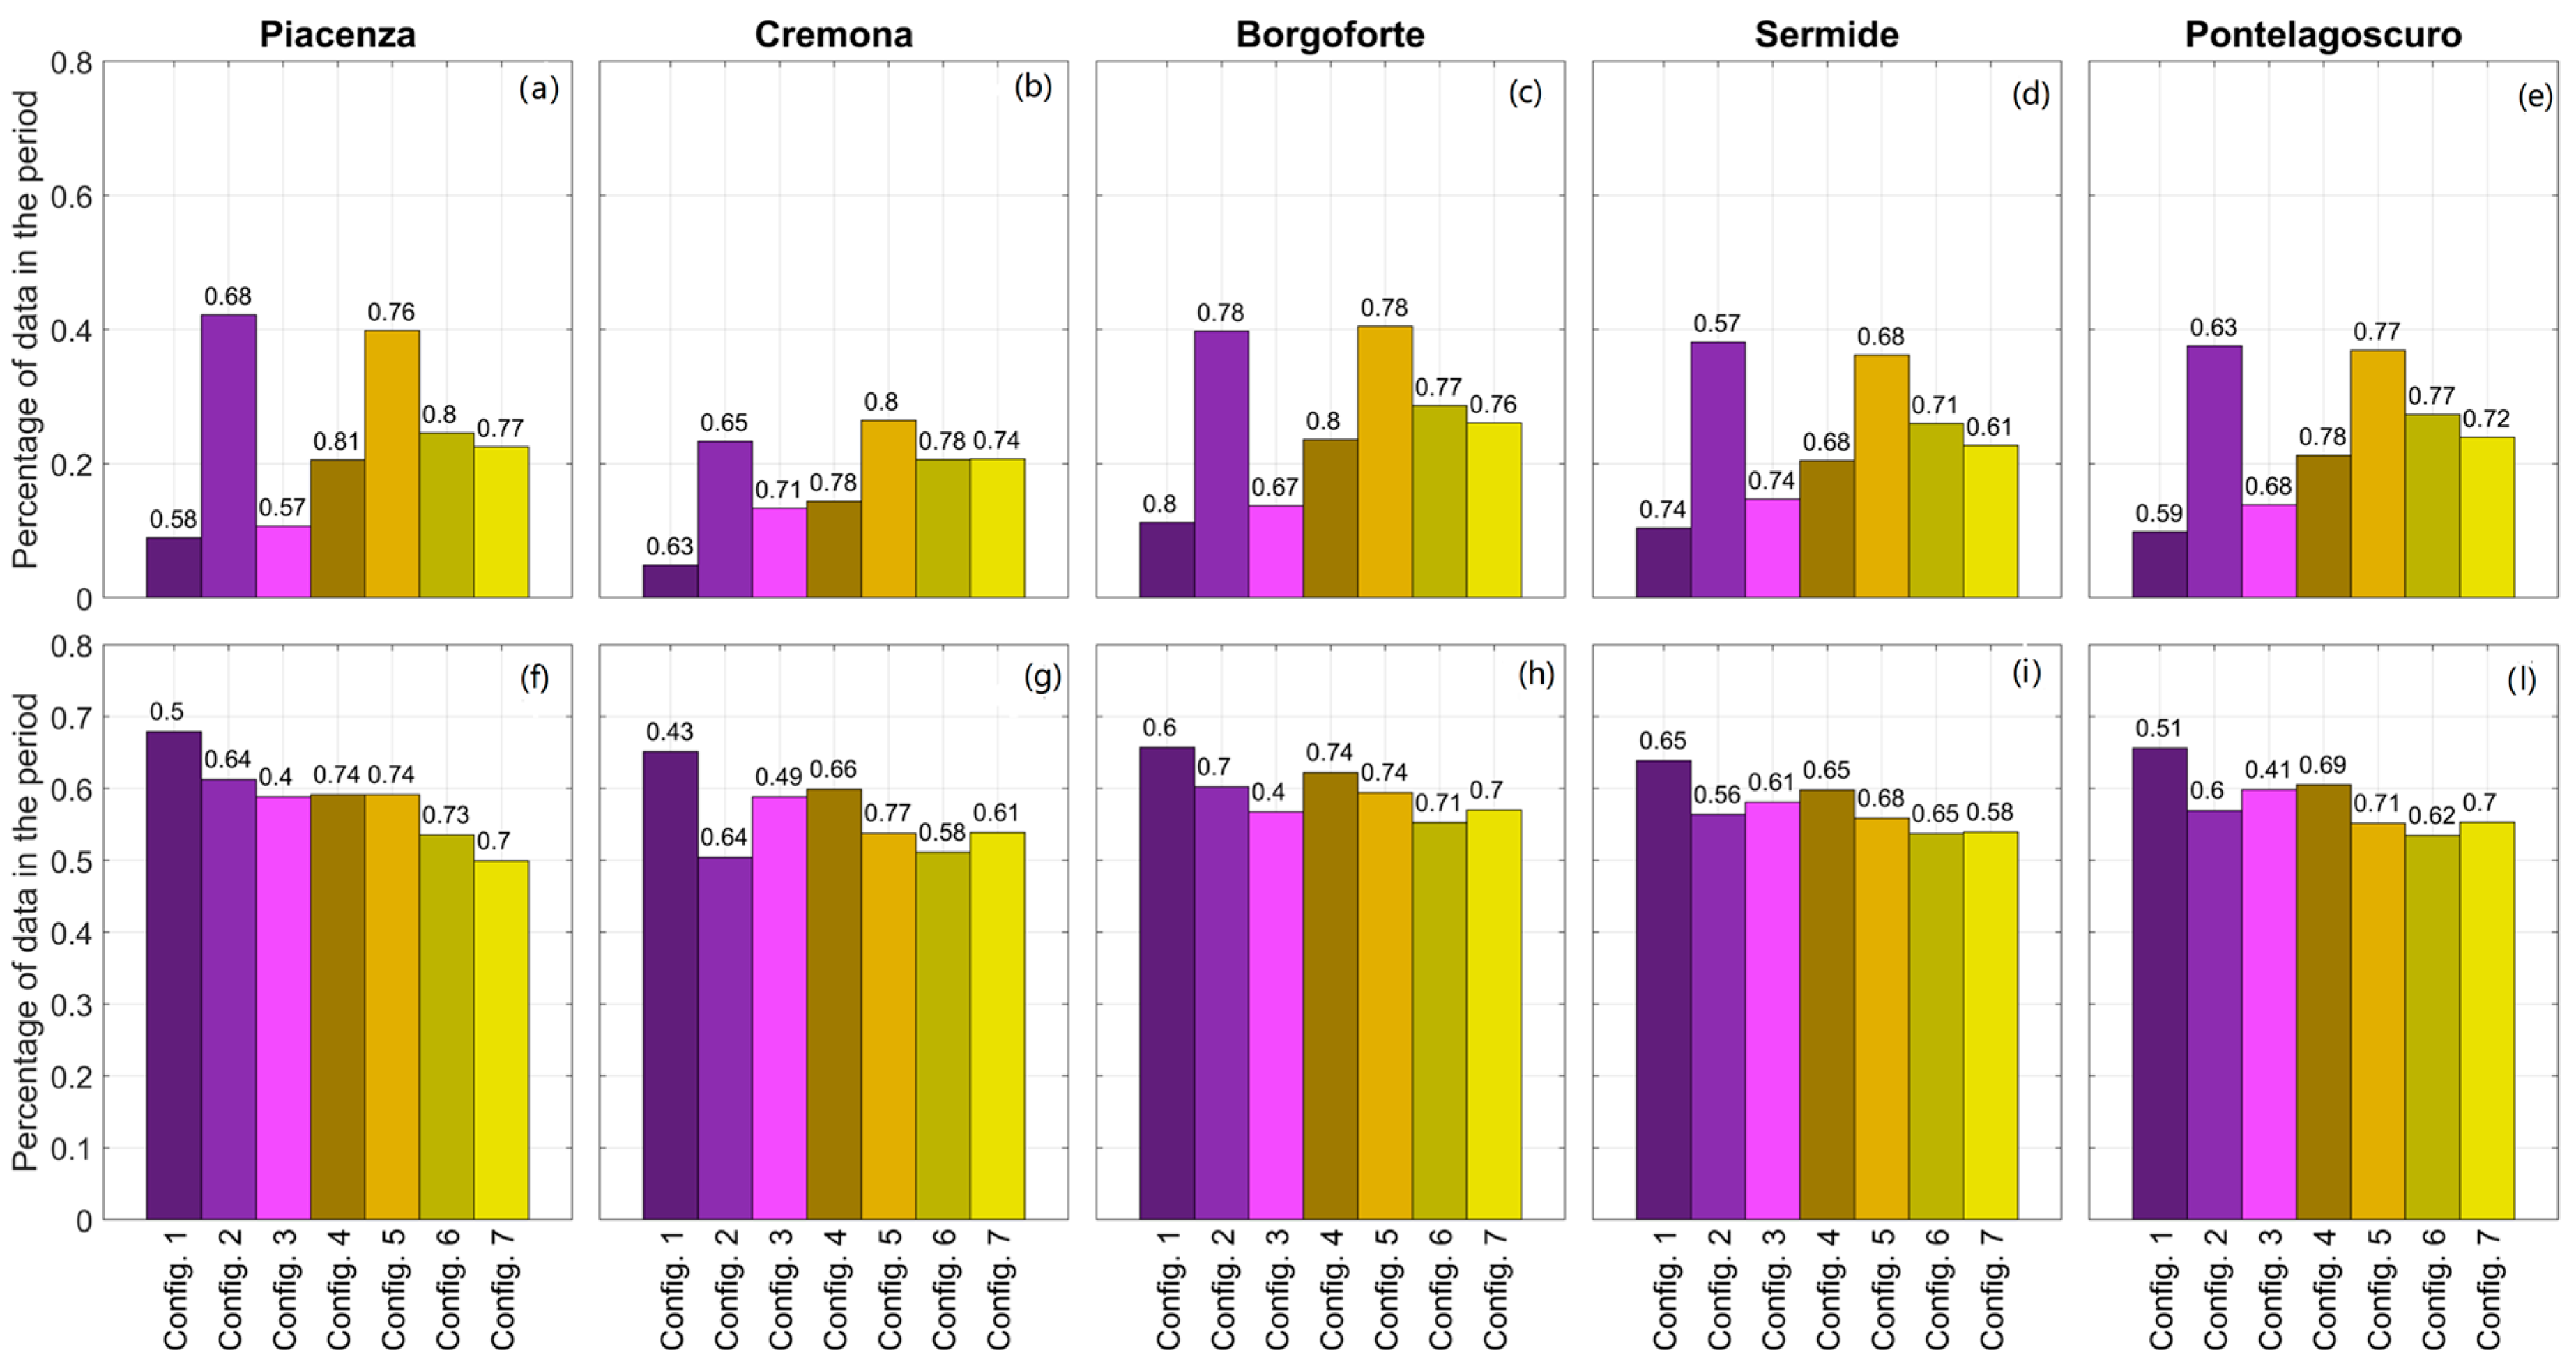
The results of the two investigations are shown in Figure 7. Bar plots report the percentage of data of the multi-mission time series on the y-axis, the adopted configuration on the x-axis and the Pearson correlation coefficient, indicated on the top of the bar. The upper panels show the results for the investigation “A”. For configuration 1, due to the different overpass and variability of clouds, the coexistence among the four products is very rare. The percentage of data, calculated as the number of days in which all products are coexisting divided by the total number of days in the period, is about 9% on average indicating a frequency of about 1 product every 10 days. Configurations 2 and 5 consider only the two MODIS products and show the higher percentage of data (around to 40%, 1 product every 2.8 days). When only OLCI products are included (configuration 3) the percentage is about 13% (1 product every 6.8 days) demonstrating that the orbit/constellation design heavily affects the monitoring frequency. Indeed, the presence of OLCI A in the configuration 4, 6 and 7 decreases the percentage of data in the time series by 20%, 25% and 23% on average (1 product every 4.7, 3.7 and 4 days, respectively). Generally, in terms of R, good performances are found for configuration 4, whereas lower performances are found for configurations 1 and 3.
The bottom panel of Figure 7 shows the results of the investigation “B”. It is quite evident that the increased number of data, with the highest percentages reached in the period of the configurations 1 (66% of data, on average, obtaining 1 data every 1.53 days) and 4 (60% of data, on average, obtaining 1 data every 1.66 days) and percentages above 50% for the other configurations. In terms of R, the combination of MODIS products (configuration 5) provides the highest correlation with 1 datum every 1.77 days.
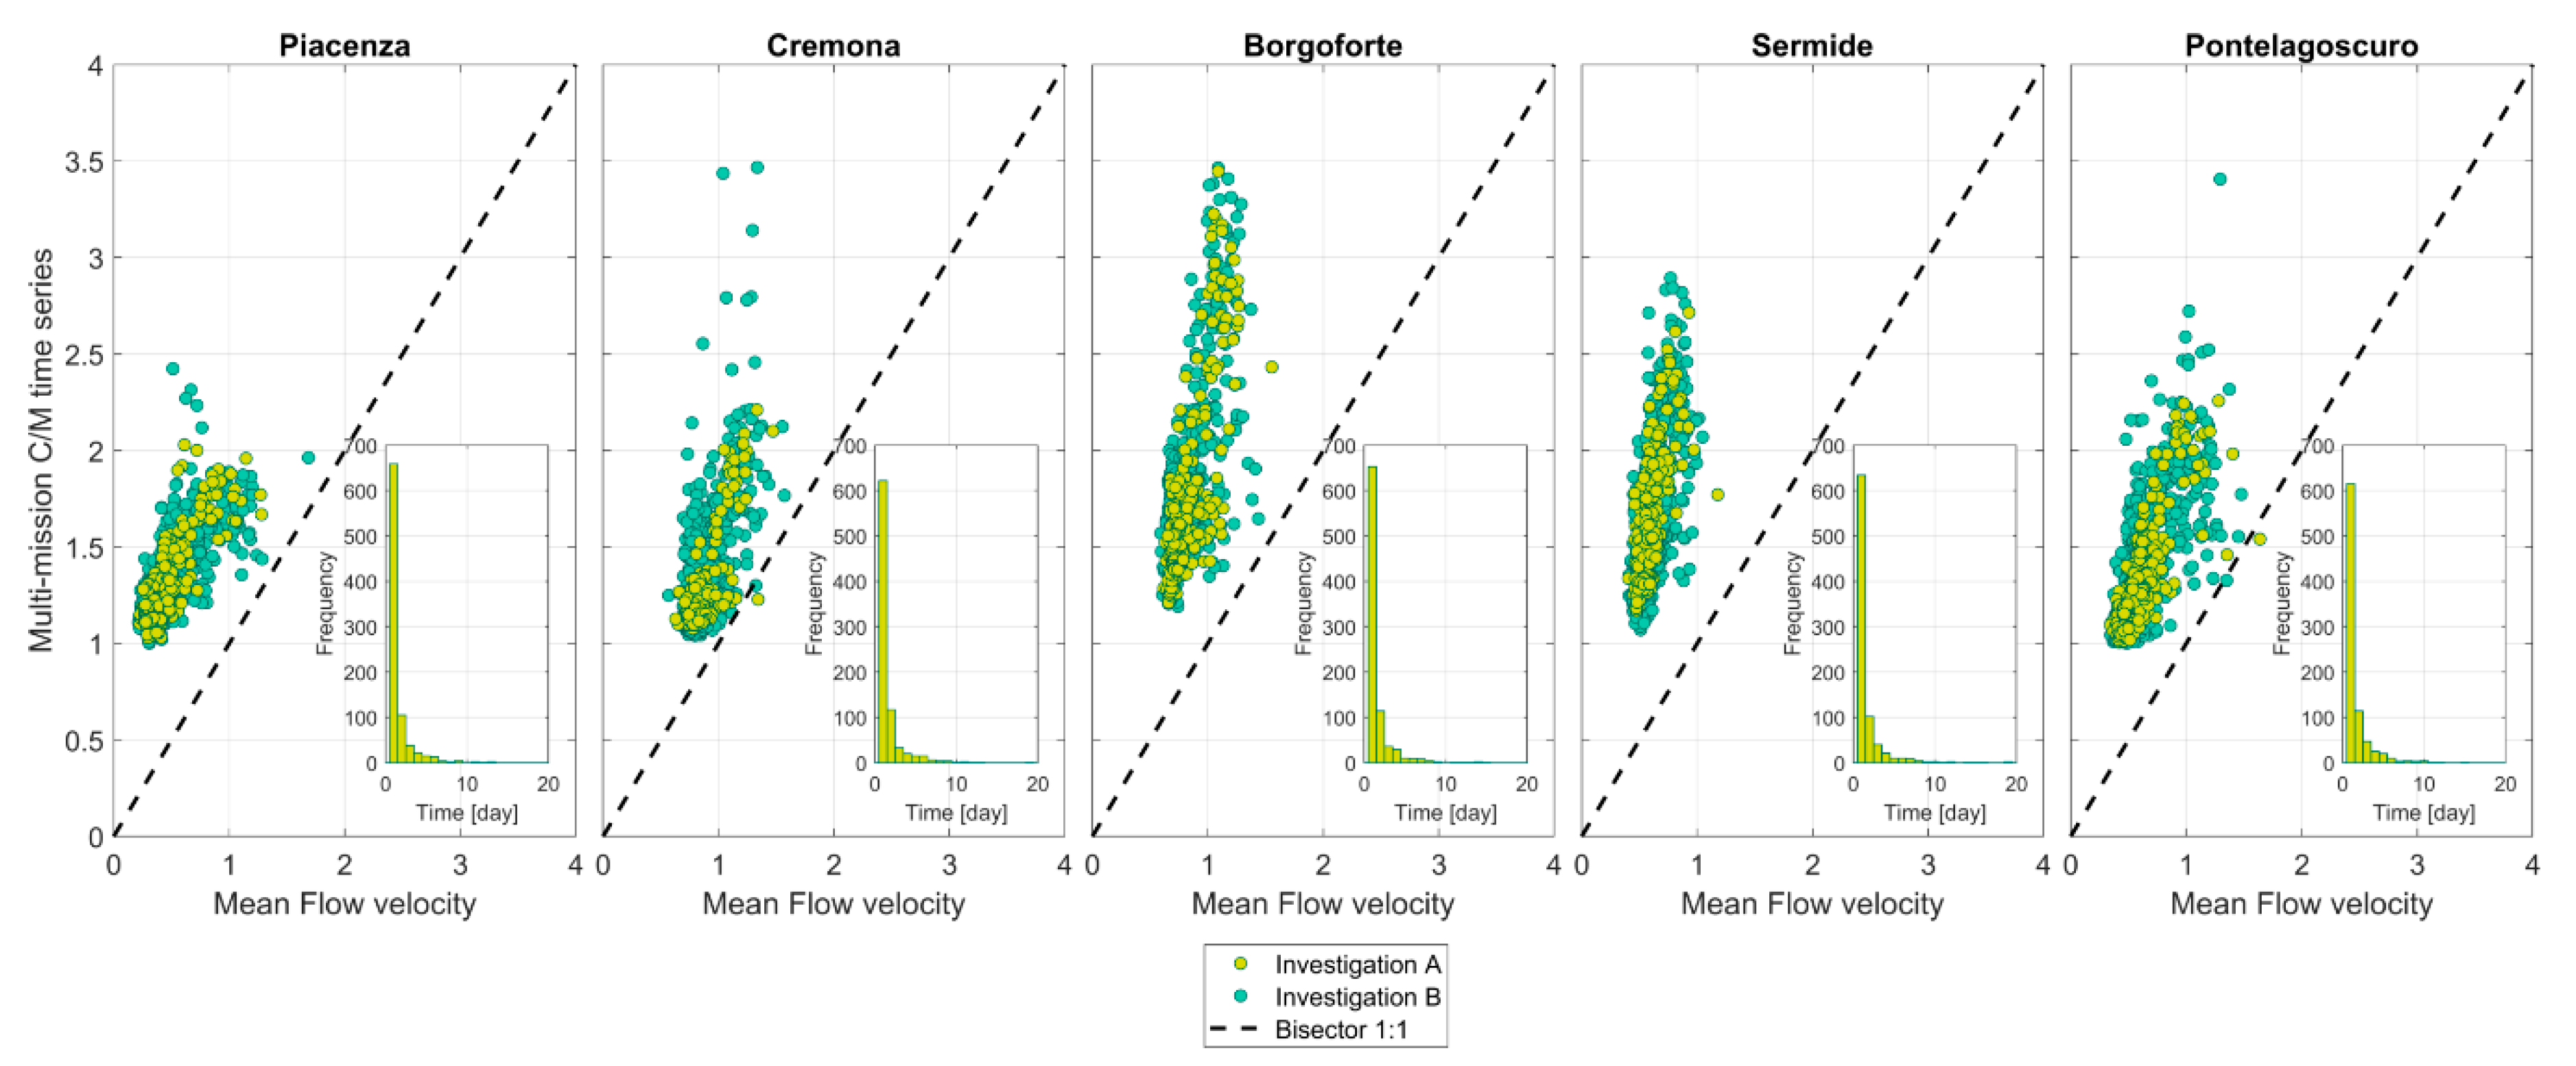
In conclusion, the best trade-off is reached by the configuration 4 and 5, with high correlation and almost daily frequency (the median of the frequency is 1 day for both the configurations). For example, the scatter plot in Figure 8 shows the multi-mission C/M time series against the mean flow velocity at each site for configuration 4. The multi-mission time series is in very good agreement with the observations of flow velocity as demonstrated by the limited spread of the circles. This is an encouraging result for the rivers characterized by fast dynamics and for which the revisit time of a single satellite is not sufficient to describe the flow variations. In this respect, the multi-mission approach guarantees almost daily observations and contributes to reinforcing the hydro-monitoring network of remote areas or areas where the number of gauged stations is small.
In order to understand how this similarity can be translated into the estimation of the mean flow velocity, Table 4 displays the performance indices in terms of R, RMSE, rRMSE and NSE of the simulated v for the two configurations (4 and 5) and for the two investigations. The results show RMSE in the range 0.10–0.12 m/s on average, and this underlines the added value of the multi-mission time series with respect to the single sensor. Indeed, if compared to the results of Tarpanelli et al. [13] with only MODIS Aqua, in which the RMSE lies between 0.11 and 0.17, the present analysis provides improved outcomes. Similar values are obtained for the NSE: in [13], the range was between 0.45 and 0.59 which is similar to the results obtained in the present analysis. The advantage here is the increased observation frequency. In terms of relative errors, stations with higher rRMSE are Piacenza and Pontelagoscuro, with values greater than 22.9% and 18.3%. For the other stations, the relative error is between 10.4 % and the 13.9%. These performances calculated between multi-mission time series C/M and the mean flow velocity represent the first step towards a robust river monitoring system based not only on the multispectral sensors, but also on the altimetry. If on one hand the system is supported by frequent observations guaranteed by the multispectral sensors, on the other hand it benefits from the major accuracy dictated by altimetry missions [18,26].

5. Conclusions

Although no satellite mission so far has been designed with the primary objective of monitoring rivers, several studies have shown that good estimates of river discharge can be obtained separately from altimetry or multi-spectral satellite sensor observations and improved when these data are integrated [9,17,18,19]. Space agencies are now working toward the launch of specific satellite missions, such as the Surface Water and Ocean Topography (SWOT) [43], the Sentinel-6 Michael Freilich [44] and the Copernicus Polar Ice and Snow Topography Altimeter (CRISTAL) missions [45], and supporting scientific projects for demonstrating the potential of the current orbiting satellites in the evaluation of hydrological quantities [26,46,47].
In this respect, RIDESAT Project [26] proposes to implement algorithms that link altimeter and optical sensor retrievals to river flow-related variables. The primary objective of the project is to use the sensors onboard the same satellite to investigate the benefit of co-location of the two sensors. Sentinel-3 is the current satellite with radar altimeter SRAL and a multispectral sensor OLCI on board. As first step, here we analyzed the potential of OLCI sensors onboard Sentinel-3A and B to monitor river flow. We used the NIR band of the multi-spectral sensors to derive a reflectance ratio between a dry pixel and a wet pixel, i.e., the C/M ratio, suitably calibrated to best describe the river flow characteristics of the site of interest. The temporal series of C/M extracted from four years of continuous images acquired from the OLCI Sentinel-3A sensor are compared with those of the MODIS sensor. Generally, the C/M time series derived by different satellites are consistent with each other and small discrepancies are found for the OLCI Sentinel-3B sensor probably due to its reduced data availability (about one year, the satellite was launched on 25 April 2018).
The single-pixel configuration mostly outperforms the multiple-pixel configuration for all variables and sites. This conclusion cannot be taken as definitive as further tests are necessary to understand the limits of applicability for both the spatial resolution of the sensors and the surface width of the selected river. In this case, the Po River has a width of around 280 m that matches the single-pixel resolution of a MODIS image well. The 2 × 2 and 3 × 3 pixel re-sampling proved to be detrimental for the analysis.
The following answers can be given to the three scientific questions posed in the introduction:
(1)
OLCI is able to detect the dynamics of the river, showing good correlations with all the river flow-related variables. The performances are consistent with those of other satellite sensors tested in the past, and specifically, with MODIS.
(2)
For all the sites analyzed, the reflectance ratio C/M is compared with five river flow-related variables: water level, river discharge, flow area, surface width and mean flow velocity. No sensitive differences are found among the river flow-related variables, but all are correlated well with the C/M ratio. However, river flow velocity shows the highest coefficient of correlation.
(3)
The integration of the time series from multiple sensors provides a multi-mission time series that is in frequency well adapted to follow the temporal variation of the river including low- and high-flow periods. From the different configurations analyzed in a one-year period, the combination with only OLCI sensors is found to perform less well than the configuration with MODIS sensors. The linear combination of all sensors (configuration 1), provides good results with a very high frequency (about 1.5 days), even if the best trade-off is represented by the combination of MODIS sensors (configuration 5, with R from 0.68 to 0.77) and MODIS and OLCI Sentinel-3A (configuration 4, with R from 0.65 a 0.74), both with a daily temporal resolution. The accuracy in describing the mean flow velocity is demonstrated by the performance indices calculated: on average the RMSE is lower than 0.14 m/s, the relative rRMSE is between the 10% and the 29%, whereas the NS is higher than 0.42.
In the near future, the procedure will be implemented in other areas to investigate its applicability in different climate and flow regimes. In particular, different aspects should be addressed: the role of the suspended sediment matter and the riparian vegetation in the surface reflectance and the benefit of using the high resolution imagery. Water turbidity, due to suspended sediment at the water pixel, affects the measurement of surface reflectance and if not considered correctly can greatly deteriorate the final estimate of the river discharge. The analysis of vegetation can help to evaluate the effective contribution of the water in the mixed pixel and address the choice of the pixel that better represents the river discharge of the river. Indeed, the variation of reflectance observed by the water pixel is affected by the riparian vegetation included in the interface between land and river. Therefore, specific investigations should be carried out to remove the contribution of the vegetation by incorporating specific satellite products (i.e., Normalized Difference Vegetation Index (NDVI) and leaf area index) derived by optical images. Finally, the understanding of the impact of these two variables and their inclusion in the approach can benefit from a detailed analysis through the high-resolution imagery (i.e., Sentinel-2) that allows us to monitor the fine spatial structure of water variables in inland water allowing us to distinguish the percentage of sediment into clear water and to identify the vegetation role over heterogeneous mix, especially in narrow width rivers.
A global analysis performed on a large dataset of sites with different geomorphological characteristics would help us to understand the limits and advantaged of the procedure and to define specific laws between the C/M ratio and river flow-related variables for a possible application to ungauged river sites.

Author Contributions

Conceptualization, A.T. and L.B.; methodology, software, validation, A.T. and L.B.; data curation, A.T., F.I.; writing—original draft preparation, A.T.; writing—review and editing, L.B., F.I., M.R., J.B.; supervision, M.R., J.B.; project administration, J.B.; funding acquisition, A.T., L.B. All authors have read and agreed to the published version of the manuscript.

Funding

This research was funded by European Space Agency, through the RIDESAT Project, contract n. 4000125543/18/I-NB and the HYDROCOASTAL Project, contract n. 4000129872/20/I-DT.

Acknowledgments

The authors would like to thank the Agenzia Interregionale per il Fiume Po, Parma, Italy, for sharing the cross-section survey along the Po river and the Agenzia regionale prevenzione, ambiente ed energia della Regione Emilia, Arpae for providing in situ observations of water levels and discharge of rivers. They would also like to thank the European Space Agency, Frascati, Italy, and the National Aeronautics and Space Administration, Washington, DC, USA, for providing satellite data.

Conflicts of Interest

The authors declare no conflict of interest.

References

  1. Palmer, M.A.; Reidy Liermann, C.A.; Nilsson, C.; Flörke, M.; Alcamo, J.; Lake, P.S.; Bond, N. Climate change and the world’s river basins: Anticipating management options. Front. Ecol. Environ. 2008, 6, 81–89. [Google Scholar] [CrossRef] [Green Version]
  2. Hirpa, F.A.; Salamon, P.; Alfieri, L.; Pozo, J.T.D.; Zsoter, E.; Pappenberger, F. The effect of reference climatology on global flood forecasting. J. Hydrometeorol. 2016, 17, 1131–1145. [Google Scholar] [CrossRef] [Green Version]
  3. GCOS. The Global Observing System for Climate: Implementation Needs. GCOS-200. 2016, p. 341. Available online: https://public.wmo.int/en/programmes/global-climate-observing-system/ (accessed on 24 November 2020).
  4. Gleason, C.J.; Durand, M.T. Remote Sensing of River Discharge: A Review and a Framing for the Discipline. Remote Sens. 2020, 12, 1107. [Google Scholar] [CrossRef] [Green Version]
  5. Tarpanelli, A.; Camici, S.; Nielsen, K.; Brocca, L.; Moramarco, T.; Benveniste, J. Potentials and limitations of Sentinel-3 for river discharge assessment. Adv. Space Res. 2019, in press. [Google Scholar] [CrossRef]
  6. Birkett, C.M.; Mertes, L.A.K.; Dunne, T.; Costa, M.H.; Jasinski, M.J. Surface water dynamics in the Amazon Basin: Application of satellite radar altimetry. J. Geophys. Res. Atmos. 2002, 107, LBA-26-1. [Google Scholar] [CrossRef]
  7. Da Silva, J.S.; Calmant, S.; Seyler, F.; Rotunno Filho, O.C.; Cochonneau, G.; Mansur, W.J. Water levels in the Amazon basin derived from the ERS 2 and ENVISAT radar altimetry missions. Remote Sens. Environ. 2010, 114, 2160–2181. [Google Scholar] [CrossRef]
  8. Biancamaria, S.; Frappart, F.; Leleu, A.S.; Marieu, V.; Blumstein, D.; Desjonquères, J.D.; Boy, F.; Sottolichio, A.; Valle-Levinson, A. Satellite radar altimetry water elevations performance over a 200 m wide river: Evaluation over the Garonne River. Adv. Space Res. 2017, 59, 128–146. [Google Scholar] [CrossRef] [Green Version]
  9. Zakharova, E.A.; Krylenko, I.N.; Kouraev, A.V. Use of non-polar orbiting satellite radar altimeters of the Jason series for estimation of river input to the Arctic Ocean. J. Hydrol. 2019, 568, 322–333. [Google Scholar] [CrossRef]
  10. Hou, J.; Van Dijk, A.I.; Renzullo, L.J.; Vertessy, R.A. Using modelled discharge to develop satellite-based river gauging: A case study for the Amazon Basin. Hydrol. Earth Syst. Sci. 2018, 22. [Google Scholar] [CrossRef] [Green Version]
  11. Huang, Q.; Long, D.; Du, M.; Zeng, C.; Qiao, G.; Li, X.; Hou, A.; Hong, Y. Discharge estimation in high-mountain regions with improved methods using multisource remote sensing: A case study of the Upper Brahmaputra River. Remote Sens. Environ. 2018, 219, 115–134. [Google Scholar] [CrossRef]
  12. Sichangi, A.W.; Wang, L.; Yang, K.; Chen, D.; Wang, Z.; Li, X.; Zhou, J.; Liu, W.; Kuria, D. Estimating continental river basin discharges using multiple remote sensing data sets. Remote Sens. Environ. 2016, 179, 36–53. [Google Scholar] [CrossRef] [Green Version]
  13. Tarpanelli, A.; Brocca, L.; Lacava, T.; Melone, F.; Moramarco, T.; Faruolo, M.; Pergola, N.; Tramutoli, V. Toward the estimation of river discharge variations using MODIS data in ungauged basins. Remote Sens. Environ. 2013, 136, 47–55. [Google Scholar] [CrossRef]
  14. Huang, C.; Chen, Y.; Zhang, S.; Wu, J. Detecting, extracting, and monitoring surface water from space using optical sensors: A review. Rev. Geophys. 2018, 56, 333–360. [Google Scholar] [CrossRef]
  15. Brakenridge, G.R.; Nghiem, S.V.; Anderson, E.; Chien, S. Space-based measurement of river runoff. Eos Trans. AGU 2005, 86, 185–188. [Google Scholar] [CrossRef] [Green Version]
  16. Tarpanelli, A.; Amarnath, G.; Brocca, L.; Massari, C.; Moramarco, T. Discharge estimation and forecasting by MODIS and altimetry data in Niger-Benue River. Remote Sens. Environ. 2017, 195, 96–106. [Google Scholar] [CrossRef]
  17. Van Dijk, A.I.J.M.; Brakenridge, G.R.; Kettner, A.J.; Beck, H.E.; De Groeve, T.; Schellekens, J. River gauging at global scale using optical and passive microwave remote sensing. Water Resour. Res. 2016, 52, 6404–6418. [Google Scholar] [CrossRef]
  18. Tarpanelli, A.; Brocca, L.; Barbetta, S.; Faruolo, M.; Lacava, T.; Moramarco, T. Coupling MODIS and Radar Altimetry Data for Discharge Estimation in Poorly Gauged River Basins. IEEE J. Sel. Top. Appl. 2015, 8, 141–148. [Google Scholar] [CrossRef]
  19. Tarpanelli, A.; Santi, E.; Tourian, M.J.; Filippucci, P.; Amarnath, G.; Brocca, L. Daily river discharge estimates by merging satellite optical sensors and radar altimetry through artificial neural network. IEEE Trans. Geosci. Remote 2018, 57, 329–341. [Google Scholar] [CrossRef]
  20. Hou, J.; Van Dijk, A.I.J.M.; Beck, H.E. Global satellite-based river gauging and the influence of river morphology on its application. Remote Sens. Environ. 2020, 239, 111629. [Google Scholar] [CrossRef]
  21. Li, H.; Li, H.; Wang, J.; Hao, X. Extending the Ability of Near-Infrared Images to Monitor Small River Discharge on the Northeastern Tibetan Plateau. Water Resour. Res. 2019, 55, 8404–8421. [Google Scholar] [CrossRef]
  22. Shi, Z.; Chen, Y.; Liu, Q.; Huang, C. Discharge Estimation Using Harmonized Landsat and Sentinel-2 Product: Case Studies in the Murray Darling Basin. Remote Sens. 2020, 12, 2810. [Google Scholar] [CrossRef]
  23. Sahoo, D.P.; Sahoo, B.; Tiwari, M.K. Copula-based probabilistic spectral algorithms for high-frequent streamflow estimation. Remote Sens. Environ. 2020, 251, 112092. [Google Scholar] [CrossRef]
  24. Claverie, M.; Ju, J.; Masek, J.G.; Dungan, J.L.; Vermote, E.F.; Roger, J.-C.; Skakun, S.; Justice, C. The Harmonized Landsat and Sentinel-2 surface reflectance data set. Remote Sens. Environ. 2018, 219, 145–161. [Google Scholar] [CrossRef]
  25. Donlon, C.; Berruti, B.; Buongiorno, A.; Ferreira, M.H.; Féménias, P.; Frerick, J.; Goryl, P.; Klein, U.; Laur, H.; Mavrocordatos, C.; et al. The global monitoring for environment and security (GMES) sentinel-3 mission. Remote Sens. Environ. 2012, 120, 37–57. [Google Scholar] [CrossRef]
  26. RIDESAT. River Flow Monitoring and Discharge Estimation by Integrating Multiple SATellite Data. Available online: https://eo4society.esa.int/projects/ridesat/ (accessed on 22 September 2020).
  27. Castellarin, A.; Domeneghetti, A.; Brath, A. Identifying robust large-scale flood risk mitigation strategies: A quasi-2D hydraulic model as a tool for the Po river. Phys. Chem. Earth Parts A/B/C 2011, 36, 299–308. [Google Scholar] [CrossRef]
  28. Montanari, A. Hydrology of the Po River: Looking for changing patterns in river discharge. Hydrol. Earth Syst. Sci. 2012, 16, 3739–3747. [Google Scholar] [CrossRef] [Green Version]
  29. Domeneghetti, A.; Vorogushyn, S.; Castellarin, A.; Merz, B.; Brath, A. Probabilistic flood hazard mapping: Effects of uncertain boundary conditions. Hydrol. Earth Syst. Sci. 2013, 17, 3127–3140. [Google Scholar] [CrossRef] [Green Version]
  30. Tarpanelli, A.; Barbetta, S.; Brocca, L.; Moramarco, T. River discharge estimation by using altimetry data and simplified flood routing modeling. Remote Sens. 2013, 5, 4145–4162. [Google Scholar] [CrossRef] [Green Version]
  31. Tourian, M.J.; Tarpanelli, A.; Elmi, O.; Qin, T.; Brocca, L.; Moramarco, T.; Sneeuw, N. Spatiotemporal densification of river water level time series by multimission satellite altimetry. Water Resour. Res. 2016, 52. [Google Scholar] [CrossRef] [Green Version]
  32. Domeneghetti, A.; Tarpanelli, A.; Brocca, L.; Barbetta, S.; Moramarco, T.; Castellarin, A.; Brath, A. The use of remote sensing-derived water surface data for hydraulic model calibration. Remote Sens. Environ. 2014, 149, 130–141. [Google Scholar] [CrossRef]
  33. Schneider, R.; Tarpanelli, A.; Nielsen, C.; Madsen, H.; Bauer-Gottwein, P. Evaluation of multi-mode Cryosat-2 altimetry data over the Po River against in situ data and a hydrodynamic model. Adv. Water Resour. 2018, 112, 17–26. [Google Scholar] [CrossRef] [Green Version]
  34. D3xter Service. Available online: https://simc.arpae.it/dext3r/ (accessed on 6 November 2020).
  35. Copernicus Open Access Hub. Available online: https://scihub.copernicus.eu/ (accessed on 22 September 2020).
  36. Land Colour Instrument OLCI. Available online: https://sentinel.esa.int/web/sentinel/missions/sentinel-3/instrument-payload/olci (accessed on 22 September 2020).
  37. Case 2 Regional Coast Color Processor, C2RCC. Available online: https://www.brockmann-consult.de/portfolio/climate-change/ (accessed on 22 September 2020).
  38. United States Geological Survey, USGS. Available online: https://search.earthdata.nasa.gov/ (accessed on 22 September 2020).
  39. Land Processes Distributed Active Archive Center, LP DAAC. Available online: https://lpdaac.usgs.gov/products/mod09gqv006/ (accessed on 22 September 2020).
  40. Tarpanelli, A.; Massari, C.; Ciabatta, L.; Filippucci, P.; Amarnath, G.; Brocca, L. Exploiting a constellation of satellite soil moisture sensors for accurate rainfall estimation. Adv. Water Resour. 2017, 108, 249–255. [Google Scholar] [CrossRef]
  41. Cuevas, A.; Febrero, M.; Fraiman, R. An ANOVA test for functional data. Comput. Stat. Data Anal. 2004, 47, 111–122. [Google Scholar] [CrossRef]
  42. Nash, J.E.; Sutcliffe, J.V. River flow forecasting through conceptual models, part I: A discussion of principles. J. Hydrol. 1970, 10, 282–290. [Google Scholar] [CrossRef]
  43. Biancamaria, S.; Lettenmaier, D.P.; Pavelsky, T.M. The SWOT Mission and Its Capabilities for Land Hydrology. Surv. Geophys. 2016, 37, 307–337. [Google Scholar] [CrossRef] [Green Version]
  44. Scharroo, R.; Bonekamp, H.; Ponsard, C.; Parisot, F.; von Engeln, A.; Tahtadjiev, M.; de Vriendt, K.; Montagner, F. Jason continuity of services: Continuing the Jason altimeter data records as Copernicus Sentinel-6. Ocean Sci. 2016, 12, 471–479. [Google Scholar] [CrossRef] [Green Version]
  45. Kern, M.; Cullen, R.; Berruti, B.; Bouffard, J.; Casal, T.; Drinkwater, M.R.; Gabriele, A.; Lecuyot, A.; Ludwig, M.; Midthassel, R.; et al. The Copernicus Polar Ice and Snow Topography Altimeter (CRISTAL) high-priority candidate mission. Cryosphere 2020, 14, 2235–2251. [Google Scholar] [CrossRef]
  46. STREAM SaTellite Based Runoff Evaluation and Mapping. Available online: https://eo4society.esa.int/projects/stream/ (accessed on 22 September 2020).
  47. HydroCoastal: Coastal Ocean and Inland Water Altimetry. Available online: https://eo4society.esa.int/projects/hydrocoastal/ (accessed on 22 September 2020).
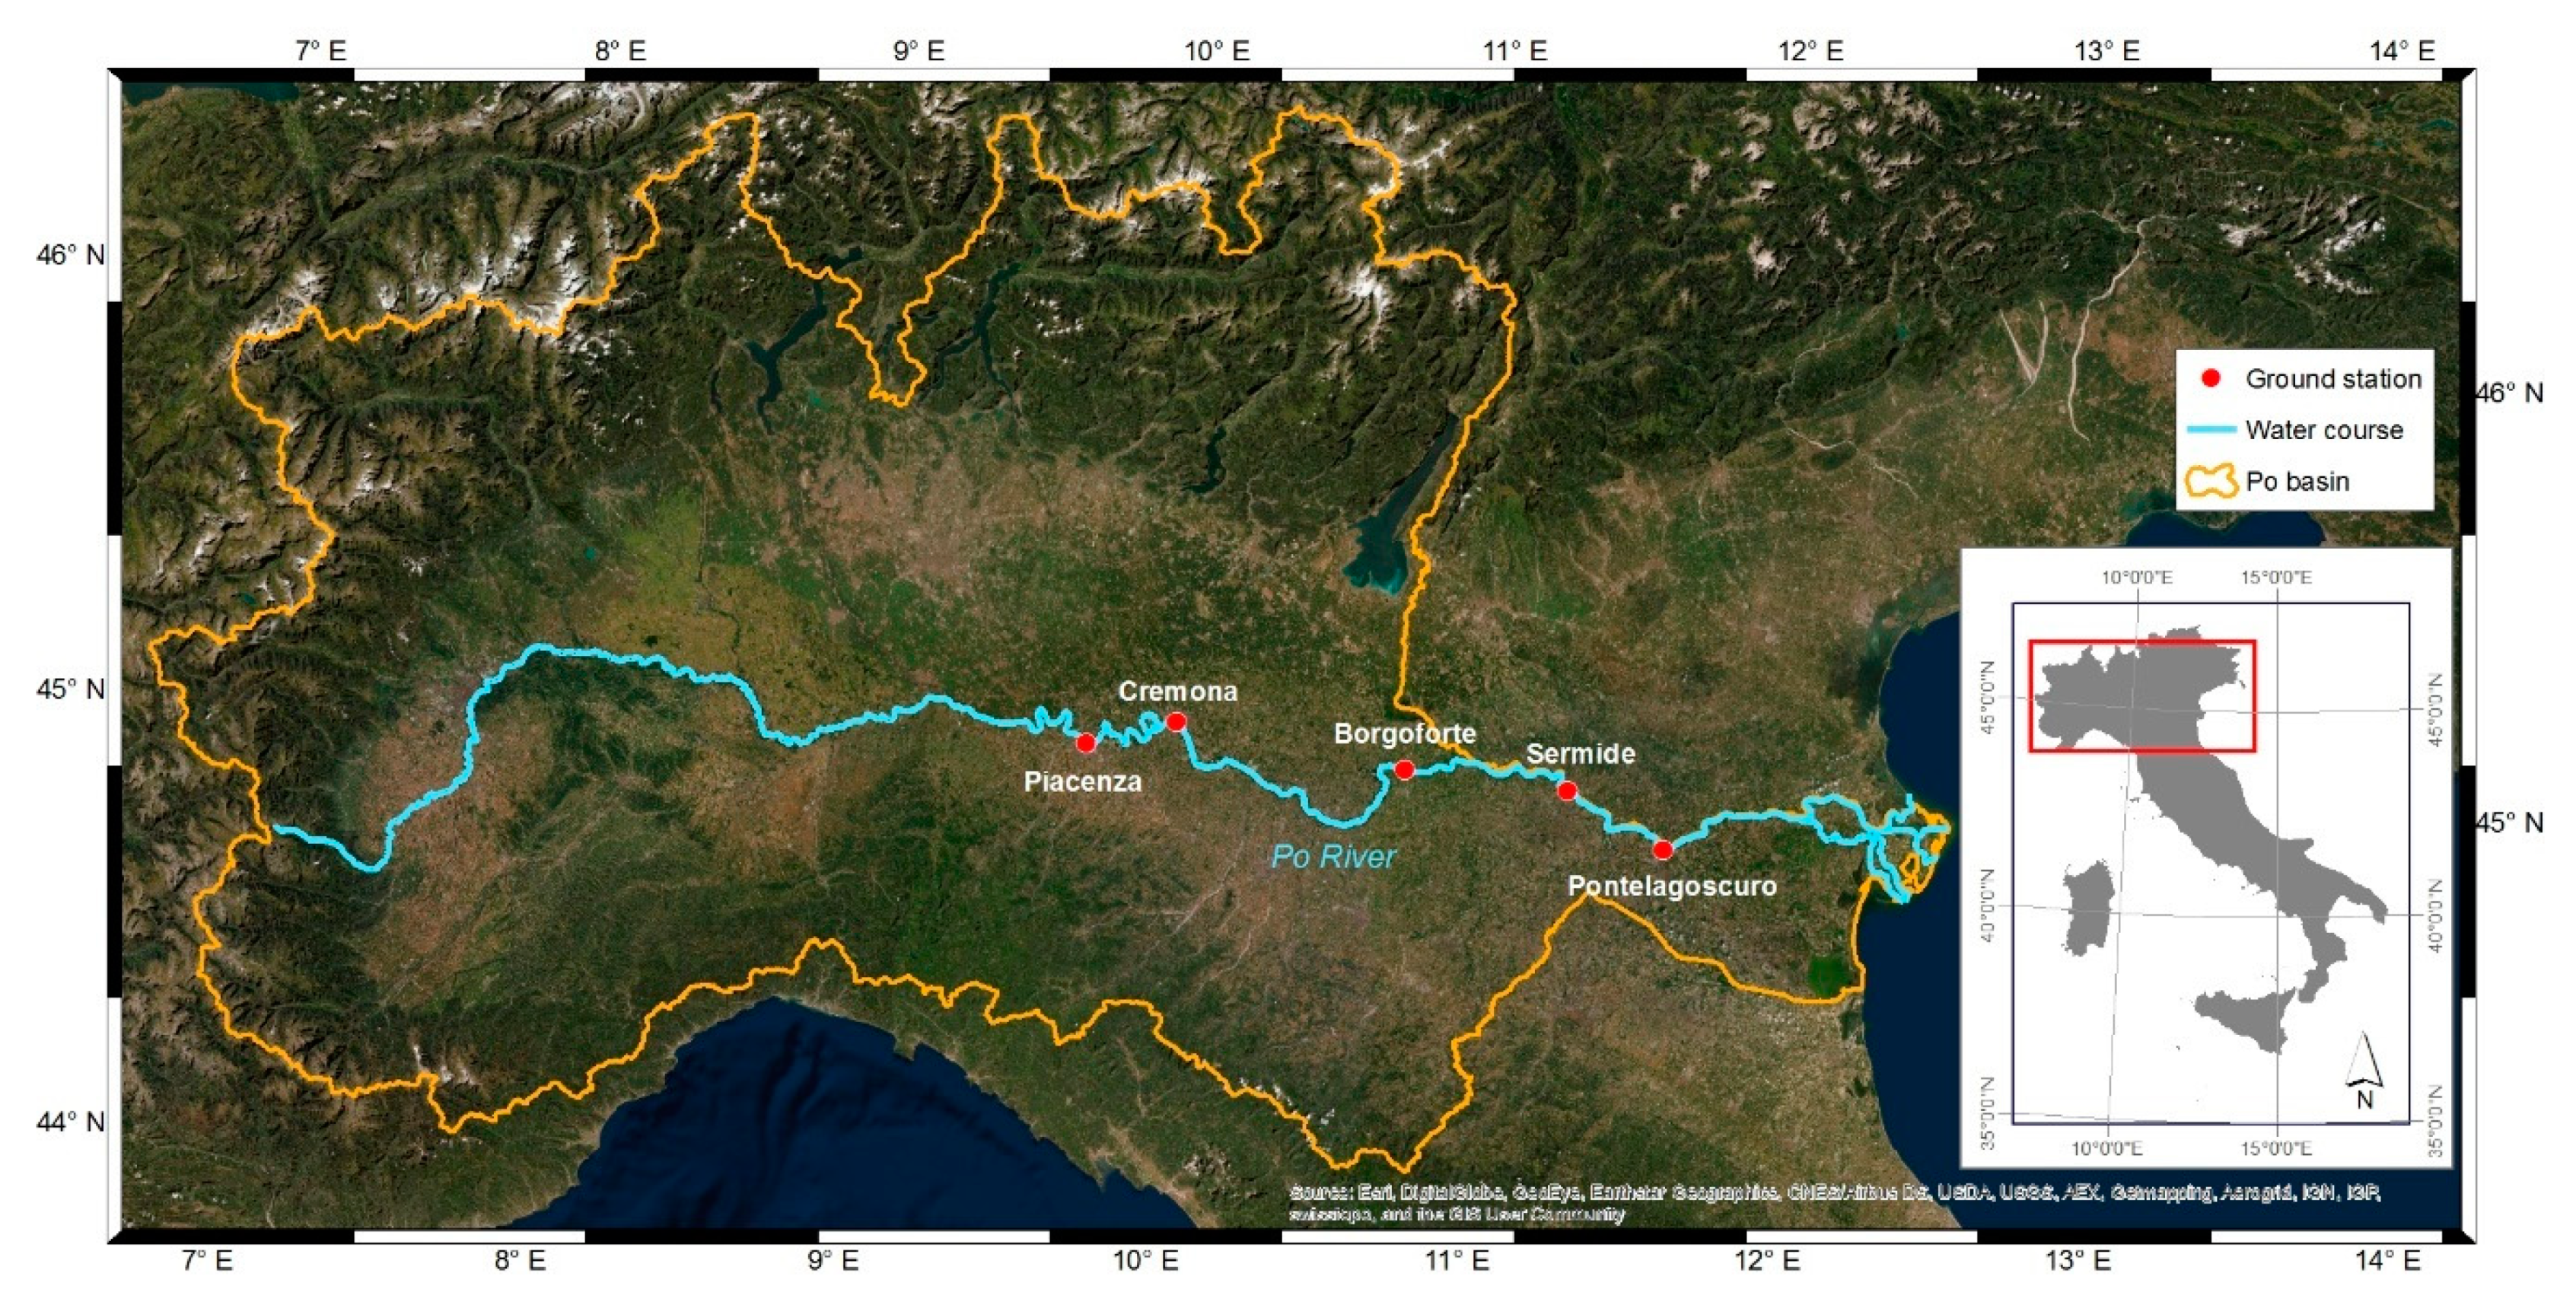
Figure 1. Geographical location of the study area, including spatial distribution of in situ stations used in this study.
Remotesensing 12 03867 g001
Figure 2. Flow chart of the procedure to derive the ratio between the reflectance of a dry pixel and a wet pixel (C/M) from the near-infrared (NIR) images.
Remotesensing 12 03867 g002
Figure 3. Results for the Borgoforte station: (left column) comparison between the time series of reflectance from area C (averaged value) and pixel M calibrated for each satellite sensor; (right column) comparison between the reflectance ratio C/M and the filtered C/M time series (MOD: MODIS Terra, MYD: MODIS Aqua, OLCI A: and OLCI Sentinel-3A, OLCI B: OLCI Sentinel-3B).
Remotesensing 12 03867 g003
Figure 4. Boxplot of the reflectance values for the C and M pixels and for each sensor (MOD is for Moderate Resolution Imaging Spectroradiometer (MODIS) Terra, MYD is for MODIS Aqua, OLCI A is for Ocean and Land Colour Instrument (OLCI) Sentinel-3A, OLCI B is for OLCI Sentinel-3B) at each site.
Remotesensing 12 03867 g004
Figure 5. Boxplot of the Pearson correlations between the C/M reflectance ratio calculated for the different sensors (MOD is for MODIS Terra, MYD is for MODIS Aqua, OLCI A is for OLCI Sentinel-3A, OLCI B is for OLCI Sentinel-3B) and the river flow-related variables of the river cross sections. The boxplot is related to the results obtained from the five sites.
Remotesensing 12 03867 g005
Figure 6. Median correlation coefficient calculated between the reflectance ratio extracted from different satellite sensors (MOD is for MODIS Terra, MYD is for MODIS Aqua, OLCI A is for OLCI Sentinel-3A, OLCI B is for OLCI Sentinel-3B) and the river flow-related variable (WL is for water level, Q is for river discharge, A is for flow area, W is for river surface width and v is for mean flow velocity).
Remotesensing 12 03867 g006
Figure 7. Percentage of data in the periods of analysis (December 2018–November 2019 for configurations 1–3; January 2016–November 2019 for configurations 4–7). The Pearson correlation coefficient, R, between the merged time series and the ground flow velocity time series is indicated at the top of each bar. Upper plots (ae) show the results for investigation “A” (all products coexisting in the same days). Lower plots (fl) show the results for investigation “B” (existence of the least one product and weights redistributed among the datasets).
Remotesensing 12 03867 g007
Figure 8. Scatter plot of the C/M merged time series (obtained by configuration 4) against the mean flow velocity for the five sites analyzed. In the subplots, the frequency of the temporal series is reported.
Remotesensing 12 03867 g008
Table 1. Characteristics of the gauged stations of the Po River in the period January 2016 –December 2019: latitude (Lat), longitude (Lon), basin area (Ab), maximum and minimum of river water level (WL), river discharge (Q), river flow area (A), river width (W) and mean flow velocity (v).
LatLonAb
[km2]
WL
[m]
Q
[m3/s]
A
[m2]
W
[m]
v
[m/s]
Piacenza45.079.7342′03041.27–49.10242–68501119–4467153–8550.22–1.79
Cremona45.139.9950′72626.71–37.50377–6630520–4080237–7070.55–1.94
Borgoforte45.0510.7662′45011.63–21.17457–5957739–3602231–4210.59–1.72
Sermide45.0211.2968′7245.52–13.72397–6062979–5008458–5310.41–1.21
Pontelagoscuro44.8911.6170′0911.45–9.89406–59051181–3443249–2910.34–1.77
Table 2. Configurations for the multi-mission C/M time series and period of analysis.
Configuration NumberCombinationPeriod of Analysis
1MOD, MYD, OLCI A, OLCI BDec. 2018–Nov. 2019
2MOD, MYDDec. 2018–Nov. 2019
3OLCI A, OLCI BDec. 2018–Nov. 2019
4MOD, MYD, OLCI AJan. 2016–Nov. 2019
5MOD, MYDJan. 2016–Nov. 2019
6MOD, OLCI AJan. 2016–Nov. 2019
7MYD, OLCI AJan. 2016–Nov. 2019
Table 3. Analysis of variance (ANOVA) test results referred to the analysis in Figure 5, to evaluate the differences in the means between the correlation coefficients.
SensorsRiver Flow-Related Variables
MODMYDOLCI AOLCI BWLQAWV
F1.870.960.281.315.474.314.463.177.35
p-value0.15560.45020.88810.30150.00880.02080.01850.05310.0026
Table 4. Performances in terms of coefficient of correlation, R, root mean square error, RMSE, Relative RMSE, rRMSE and Nash–Sutcliffe efficiency, NSE, of the multi-mission time series (configuration 4 and configuration 5) against the in situ observations of mean flow velocity (v). In bracket close to the R, the number of sample, ns.
R (ns)
[-]
RMSE
[m/s]
rRMSE
[%]
NSE
[-]
R (ns)
[-]
RMSE
[m/s]
rRMSE
[%]
NSE
[-]
Investigation AInvestigation B
Configuration 4
Piacenza0.81 (290)0.1122.920.660.73 (833)0.1428.820.54
Cremona0.78 (203)0.0910.400.620.66 (844)0.1112.820.46
Borgoforte0.80 (331)0.0911.760.640.74 (873)0.1113.230.55
Sermide0.68 (289)0.0712.120.460.65 (844)0.0813.940.42
Pontelagoscuro0.78 (298)0.1118.330.600.69 (849)0.1422.060.48
Configuration 5
Piacenza0.76 (561)0.1427.530.580.74 (833)0.1428.300.56
Cremona0.80 (373)0.0910.790.640.77 (758)0.1011.240.59
Borgoforte0.78 (568)0.1011.990.610.74 (834)0.1113.220.55
Sermide0.68 (511)0.0712.330.470.68 (789)0.0813.430.46
Pontelagoscuro0.77 (518)0.1218.710.590.71 (774)0.1421.380.50
Publisher’s Note: MDPI stays neutral with regard to jurisdictional claims in published maps and institutional affiliations.