Article

Green Vegetation Cover Dynamics in a Heterogeneous Grassland: Spectral Unmixing of Landsat Time Series from 1999 to 2014

1
Department of Geography, Geomatics and Environment, University of Toronto Mississauga, 3359 Mississauga Road, Mississauga, ON L5L 1C6, Canada
2
Department of Geography and Planning, University of Saskatchewan, Saskatoon, SK S7N 5C8, Canada
*
Author to whom correspondence should be addressed.
Remote Sens. 2020, 12(22), 3826; https://doi.org/10.3390/rs12223826
Submission received: 21 September 2020 / Revised: 14 November 2020 / Accepted: 20 November 2020 / Published: 21 November 2020
(This article belongs to the Special Issue Remote Sensing for Land Cover and Vegetation Mapping)

Abstract

:
The ability to quantify green vegetation across space and over time is useful for studying grassland health and function and improving our understanding of the impact of land use and climate change on grasslands. Directly measuring the fraction of green vegetation cover is labor-intensive and thus only practical on relatively smaller experimental sites. Remote sensing vegetation indices, as a commonly-used method for large-area vegetation mapping, were found to produce inconsistent accuracies when mapping green vegetation in semi-arid grasslands, largely due to mixed pixels including both photosynthetic and non-photosynthetic material. The spectral mixture approach has the potential to map the fraction of green vegetation cover in a heterogeneous landscape, thanks to its ability to decompose a spectral signal from a mixed pixel into a set of fractional abundances. In this study, a time series of fractional green vegetation cover (FGVC) from 1999 to 2014 is estimated using the spectral mixture approach for a semi-arid mixed grassland, which represents a typical threatened, species-rich habitat in Central Canada. The shape of pixel clouds in each of the Landsat images is used to identify three major image endmembers (green vegetation, bare soil/litter, and water/shadow) for automated image spectral unmixing. The FGVC derived through the spectral mixture approach correlates highly with field observations (R2 = 0.86). Change in the FGVC over the study period was also mapped, and green vegetation in badlands and uplands is found to experience a slight increase, while vegetation in riparian zone shows a decrease. Only a small portion of the study area is undergoing significant changes, which is likely attributable to climate variability, bison reintroduction, and wildfire. The results of this study suggest that the automated spectral unmixing approach is promising, and the time series of medium-resolution images is capable of identifying changes in green vegetation cover in semi-arid grasslands. Further research should investigate driving forces for areas undergoing significant changes.

Graphical Abstract

1. Introduction

Grasslands occupy nearly half of the terrestrial globe and play a critical role in supplying food, fiber, and fuel, supporting the biodiversity of animals and plants, maintaining water and air quality, and supporting ecological processes that sustain ecosystems and landscapes [1,2]. However, many grasslands are highly fragmented [3], and the remnants are vulnerable to the effects of adjacent land use, management regimes, and climate variability [4]. Protecting and monitoring grassland health has been a major priority for many local, national, and international agencies.
Green vegetation cover is directly linked to photosynthetic activity and ecosystem productivity [5]. The ability to quantify green vegetation across space over time is thus particularly useful for studying grassland health and function [6], investigating the impact of land use and climate change [7], and improving our understanding of vegetation recovery after major disturbances such as wildfire [8]. Directly measuring green vegetation cover is labor-intensive and thus only practical on relatively small experimental sites [9]. A practical means to map green vegetation cover at the landscape scale, or even global scale, is only possible with remote sensing techniques [10].
Remote sensing has been commonly used to map different types of grassland ecosystems but faces challenges when quantifying green vegetation for unmanaged or arid grasslands [11]. This is because green vegetation in these grassland canopies is often discontinuous, either interspersed with exposed soil in heavily exploited grasslands or by non-photosynthetic vegetative material in preserved semi-arid or arid grasslands [12]. Fractional green vegetation cover (FGVC), defined as the ratio of the vertical projection area of green vegetation on the ground to the total vegetation area, often reflects a relatively limited amount of radiation in these grasslands. A large percentage of canopy reflectance is reflected from non-photosynthetic material such as exposed soil and litter biomass. As a result, individual pixels in grassland images typically contain a mixture of radiation from different ground materials. High spatial resolution images may mitigate this mixed pixel problem to some degree, but their relatively short existence, small coverage, low temporal resolution, and high cost can be an issue for a sustainable and effective grassland monitoring program.
Early remote sensing studies on estimating green vegetation properties mostly used three approaches: vegetation index (VI)-based regression modeling, radiative transfer modeling, and spectral mixture analysis. The VI-based regression modeling approach involves establishing an empirical relationship between a field-measured green vegetation variable, such as FGVC, to a vegetation index calculated using canopy spectral data [7]. Normalized Density Vegetation Index (NDVI), derived from the infrared and near-infrared bands of remote sensing data, has shown a reasonable relationship with many field-measured vegetation biophysical parameters, such as leaf area index (LAI) and biomass, and thus continues to be a commonly used indicator of green vegetation [13].
The VI-based regression approach is mostly used in remote sensing because of its simplicity and computational efficiency. However, detecting the green fraction of a grassland canopy using a popular VI such as NDVI yields varying strength of regression relationships [14] due to the mixed canopy. Some studies report a strong relationship between total and/or green vegetation cover, biomass or leaf area index (LAI) and the NDVI (e.g., r2 = 0.89 [15], r2 = 0.81 to 0.87 [16], r2 = 0.82 [17], r2 = 0.71 to 0.74 [18], r2 = 0.74 [19]), others observed only weak relationships (r2 = 0.66 [12], r2 = 0.54 [20], r2 = 0.42 [21], r2 = 0 to 0.56 [22]). The inconsistent accuracies are, in fact, found to be a result of the large portion of non-photosynthetic vegetative materials. Xu et al. [23] discovered that the percent of dead material impacts the total biomass and NDVI relationships in mixed grasslands. A further fundamental problem with the VI-based regression approach is its lack of generality. Canopy reflectance is a function of the complex interaction of several internal (e.g., leaf shape, angle, and distribution) and external (e.g., illumination conditions, viewing geometry) factors, and thus no universal relationships between canopy variables and spectral signatures exist [24]. As a result, regression relationships are site-, time-, and species-specific, lacking robustness and portability when transferring them from one area, time, and species to another [24,25]. Radiative transfer modeling is a robust and transferable approach for investigating vegetation features and has been used to estimate chlorophyll content and green leaf area index through the inversion of the remote sensing data [26,27,28,29,30]. For mixed grasslands, Tong et al. [31] found that PROSAIL, as the most widely-used leaf and canopy coupled radiative transfer model, is capable of simulating the reflectance of homogeneous green grass canopies. However, the PROSAIL does not yield accurate results when simulating mixed grassland scenes with senescent vegetative materials. Radiative transfer modeling research groups have recently focused their efforts on improving the performance of the models for the canopies that include senescent vegetation materials [29,30]. In summary, the improvement of radiative transferring modeling for mixed scenes, including both green and senescence vegetation, is well underway.
The above-mentioned approaches use an image pixel as the smallest entity, and the spatial heterogeneity within the pixel is ignored. An increase heterogeneity within mixed pixels not only reduces VI-regression accuracies [23] but also affects the precise simulation of the radiative characteristics of land surfaces and the inversion of land surface parameters in the radiative transfer models [32]. This is particularly true for the heterogeneous landscape of semi-arid grassland ecosystems (Figure 1), where patches are often smaller than the dimensions of a median spatial resolution image (e.g., Landsat 30 m) [33]. The relatively new method of the spectral mixture approach is a promising alternative and has improved to better characterize heterogeneous landscapes through the decomposition of a spectral signal from a mixed pixel into a set of fractional abundances, including FGVC using spectral signatures from pure ground components called endmembers. The spectral unmixing analysis describes physical components within the canopy and is thus different from the regression approach and appreciated for its generality in nature. Spectral unmixing may be applied to a wide range of landscapes over time, depending on the type of spectral unmixing algorithm employed. For semi-arid ecosystems, spectral unmixing of remote sensing data yielded satisfactory results. For example, Elmore et al. [13] quantified vegetation change in semi-arid environments and found that the spectral unmixing approach correctly determined 87% of the change in percent live vegetation cover, superior to NDVI, which only determined 67% of the change.
The success of spectral unmixing is largely dependent on endmember selection. Earlier studies extracted endmembers from a spectra pool that was established by laboratory or fieldwork [34]; however, the spectral data in the pool are rarely acquired under the same conditions as the remote sensing data and may misrepresent real endmembers in the images. Recent studies have paid more attention to selecting quality endmembers from the images under investigation. These endmembers (i.e., image endmembers) address the limitation of utilizing lab or field-based spectra pool as they are collected under the same environmental conditions as mixed pixels in the images. It is widely noted that image endmembers should be selected from extreme values (i.e., the purest pixels and composed only for one member) of the image spectral feature space [35].
Automated and fully objective methods for image endmember selection are essential for an efficient image unmixing practice. Several research groups have started to identify the image endmembers by investigating the shape of pixel clouds in spectral mixing spaces [36,37,38]. The optimal shapes of pixel clouds for spectral unmixing are identified to be triangles and tetrahedrons in 2- and 3-dimensional spectral mixing spaces, respectively [37]. When assigning the vertices of triangles and tetrahedrons as endmembers, spectral unmixing has been demonstrated to be valid and meaningful for all the pixels in the image. With this finding, the process of automated image spectral unmixing is thus narrowed down to the characterization of an appropriate spectral mixing space so that the shape of the pixel cloud resembles a triangle or a tetrahedron, and the vertices represent target endmembers.
This study aims to investigate the shape of pixel clouds in a series of Landsat images for a semi-arid grassland and use the identified image endmembers for automated image spectral unmixing. The ultimate goal is to provide an overview of the dynamics of fractional green vegetation cover for the semi-arid mixed grassland, which represents a typical example of threatened, species-rich habitat in central Canada.

2. Methodology

2.1. Study Area

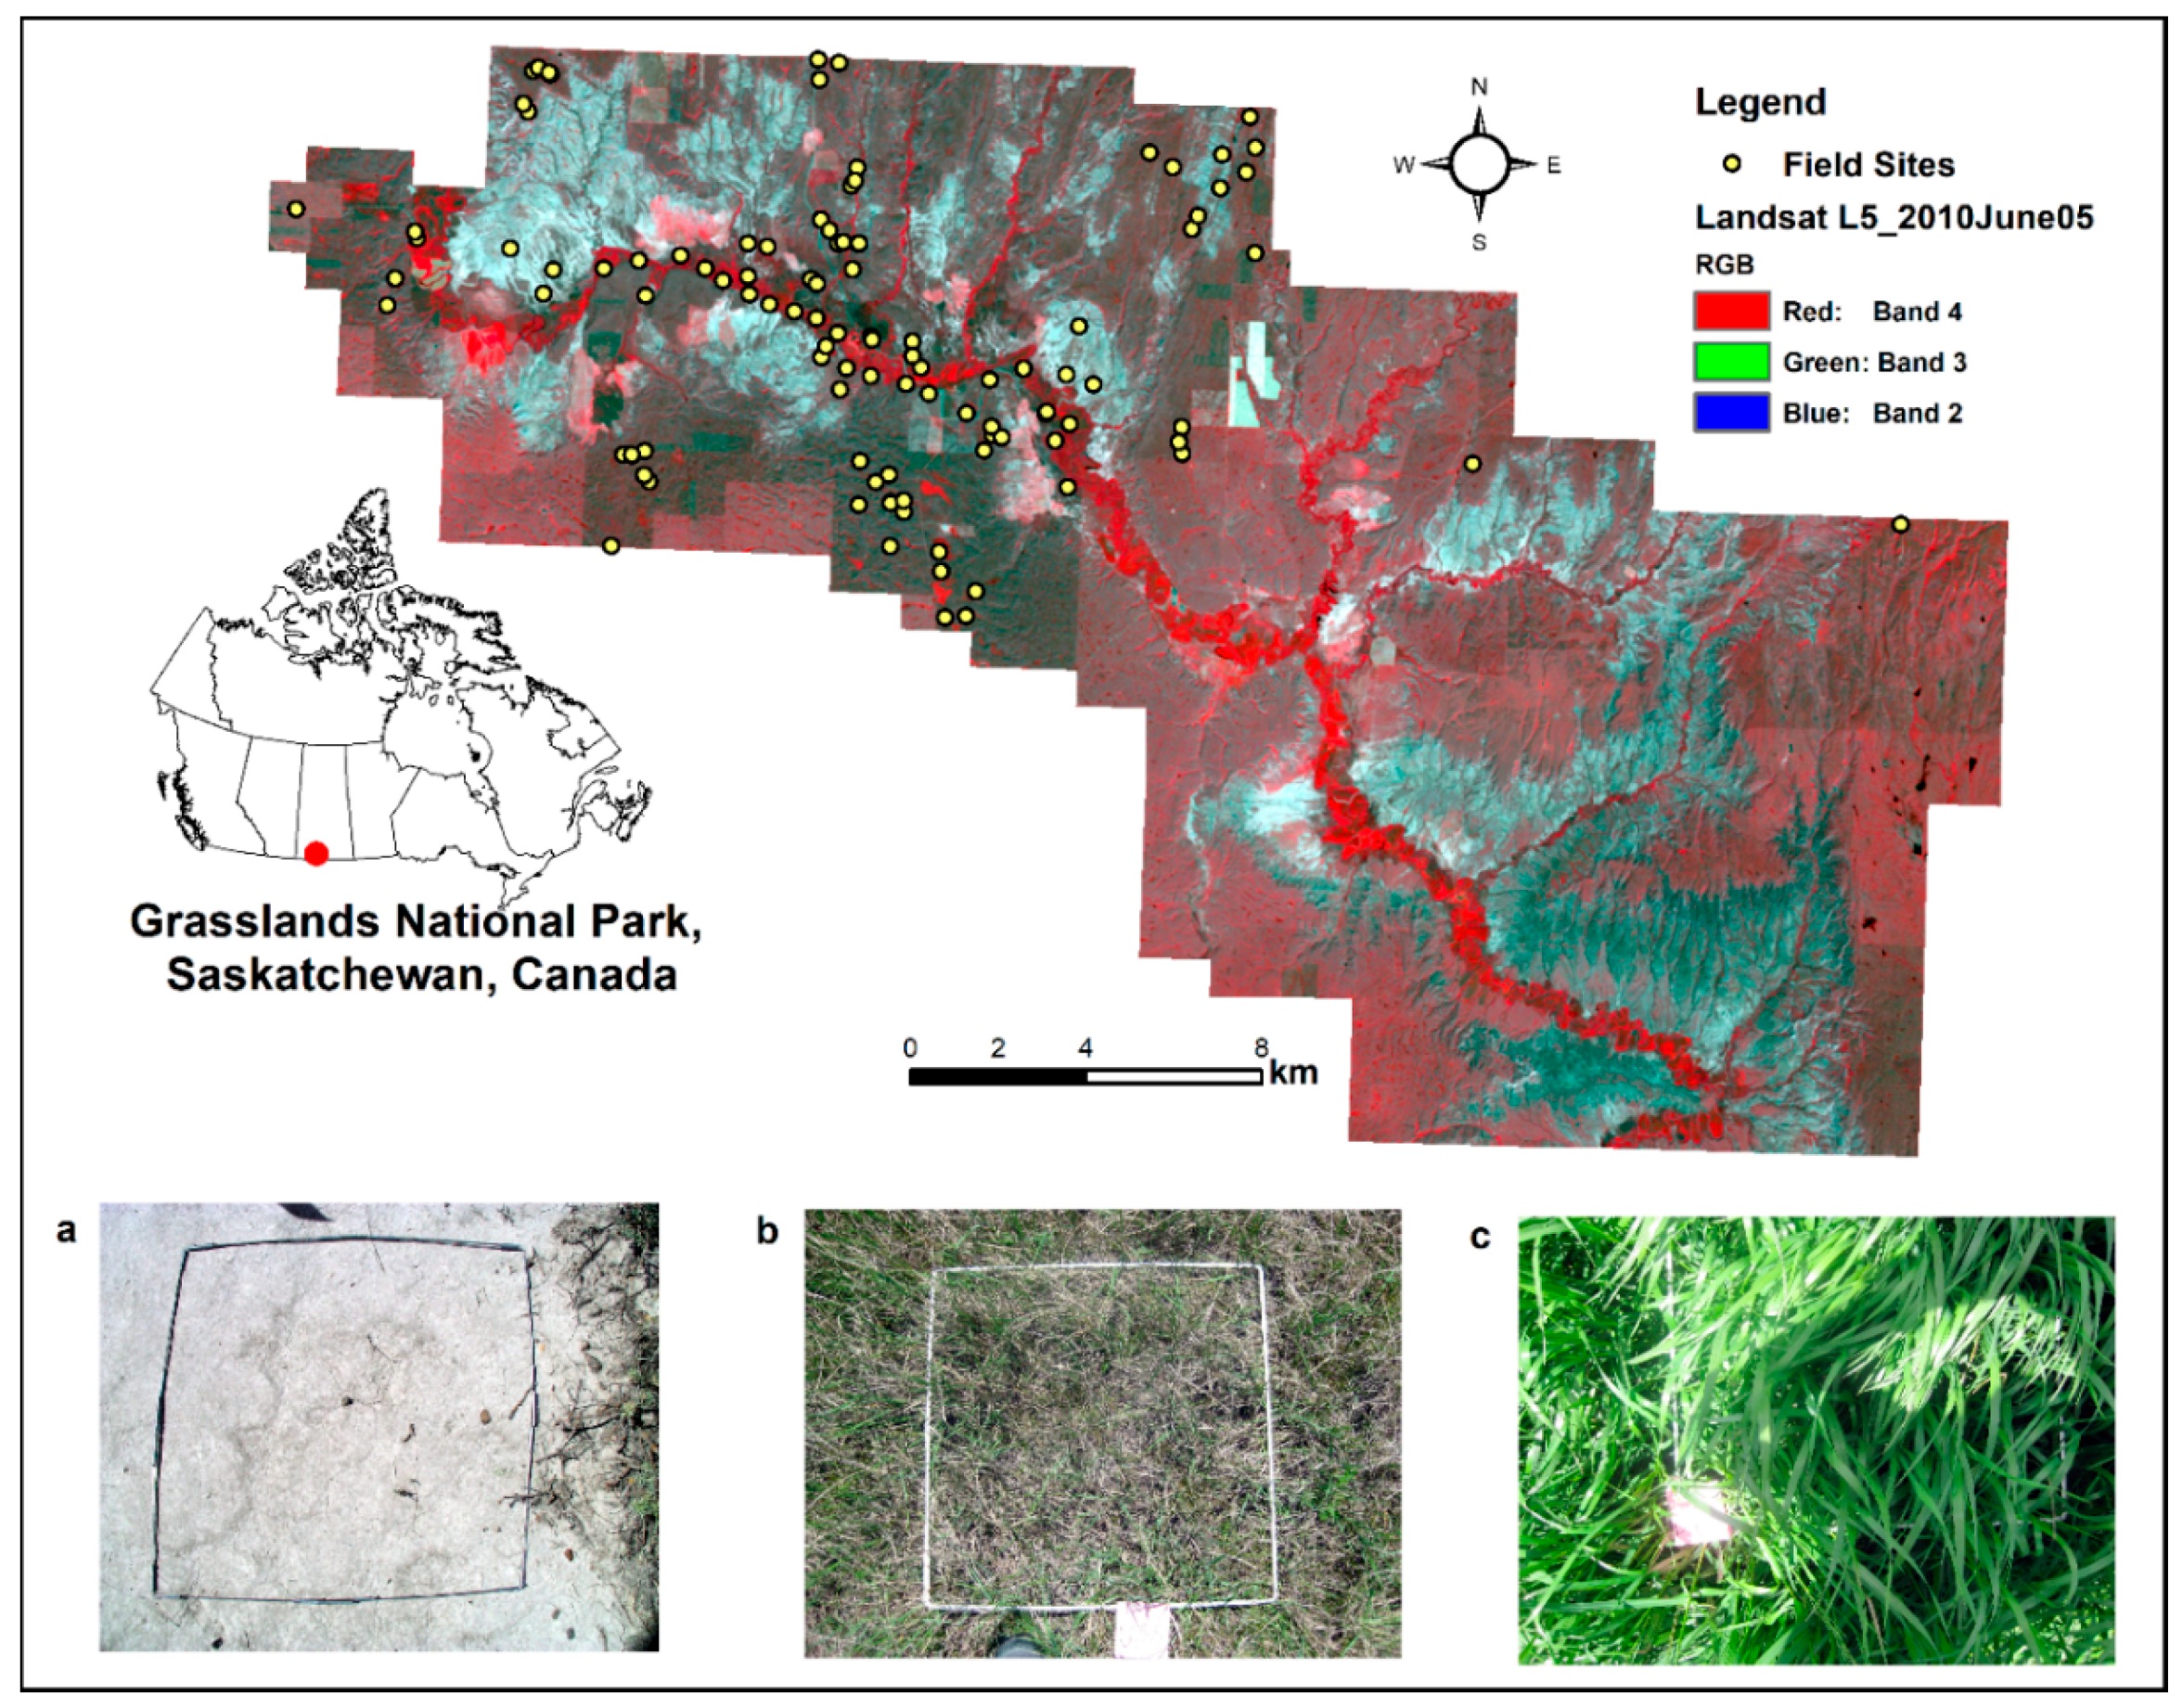
The study area was located in the West Block of the Grasslands National Park (GNP) (49°19′26.3″ N, 107°32′37.4″ W) in southwestern Saskatchewan, Canada (Figure 2). This area is defined as a semi-arid, mixed-grass prairie ecosystem that falls within the northern extent of the Great Plains [7]. The park was established in 1988 to conserve and protect a portion of the remaining natural grasslands that were once so extensive in southwest Saskatchewan. The climate in the study area is typical of a semi-arid environment, with long cold and dry winters, short and hot summers, and low precipitation [39]. The mean annual temperature is approximately 4.1 °C and ranges from −10.8 °C in January to 18.5 °C in July, while the mean annual precipitation is approximately 352.5 mm. The soils in the West Block of the GNP are brown Chernozemic clay to clay loam soils according to the Canadian System of Soil Classification. The dominant native grass species found in the study area were June grass (Koeleria gracilis), needle-and-thread grass (Stipa comata), blue grama (Bouteloua gracilis), western wheatgrass (Agropyron smithii), and northern wheatgrass (Agropyron dasystachym). A non-native invasive grass species, crested wheatgrass (Agropyron cristatum), was also a dominant type found in the study area. Three typical grassland landscape units, including badlands, uplands, and riparian grasslands (Figure 2), can be found in GNP; however, the majority of the grassland landscape in GNP consists of exposed soil and mixed non-photosynthetic grass and green vegetation patches (Figure 1).

2.2. Field Campaigns, Landsat Images, and Climatic Data

Seven field campaigns (i.e., 2003, 2005, 2006, 2010, 2011, 2012, and 2013) were carried out to determine various grassland biophysical characteristics during the peak growing season (Middle June to Middle July). A total of 118 field sites were visited over the seven years, and these sites were distributed across uplands, badlands, and riparian zone (Figure 2). Samples in each site were collected along two 100 m transects that ran north-south and west-east, forming a perpendicular bisector. The perpendicular bisector design was developed for use with moderate spatial resolution sensor data such as Landsat, where each site will cover about nine pixels of a 30-m resolution Landsat image.
A detailed list of sites surveyed during each field campaign can be found in Table 1. To investigate the feasibility of Landsat images in constructing the spectral feature space and in distinguishing green vegetation from bare soil/litter and water for this grassland, we also collected a few field variables, including canopy composition and canopy hyperspectral reflectance. Field measurements were recorded within a 50 cm by 50 cm sampling frame along each 100 m transect at 10 m intervals, resulting in a total of 20 plots at each site. Canopy composition measurements, including percent coverage of the green vegetation, litter, soil, and water percentage coverages, were collected from each sampling site through both field interpretation and field photo classification. In specific, the field photos taken from each sampling frame were used to estimate the percent coverage of different features through unsupervised classification schemes in Geomatica® 10.3 (PCI Geomatics, Richmond Hill, Ontario, Canada). The consistency between field interpreted vegetation cover, and the field photo classification was analyzed to ensure the validity of field data. In addition, field-based hyperspectral reflectance was measured from each plot to simulate Landsat bands and construct spectral feature space. The reflectance data were taken approximately 1 m above each plot using an Analytical Spectral Device (ASD) FieldSpec® 3 Max field portable spectroradiometer (Malvern Panalytical Inc., Westborough, Massachusetts, USA), which is equipped with a fiber optic that has three detectors, each operating in either the visible, near-infrared (NIR), or short-wave infrared region. The ASD spectroradiometer was frequently calibrated with a certified white reference, and spectral measurements were only taken on days with clear sky conditions between 10:00 and 14:00 h. All field measured data were then amalgamated into mean values for each 100 by 100 m site, and the field green vegetation cover data for those sites were used to validate the Landsat-unmixed FGVC.
Geometrically and atmospherically-corrected Landsat Level-2 images were downloaded between the years 1999 and 2014 from the USGS Landsat archive. Images with an acquisition time as close to peak growing season (15 June to 30 August) and as cloud-free as possible for the study area were eventually used in this work to minimize the effects of vegetation phenology and ensure consistency with field data (Table 1). This resulted in a time series of at least one image every summer, other than the year of 2004, in which year all images suffered from cloud issues, and as such no images were used from this year.
Daily precipitation data for this study were downloaded from a nearby weather station (Val Marie Southeast Saskatchewan, Climate ID: 4338412) from Environment Canada (http://climate.weather.gc.ca/historical_data/search_historic_data_e.html). The daily precipitation data for the weather station were accumulated to 3 days, 1 week, 2 weeks, 3 weeks, and a month before each image was taken to show how vegetation in badlands, uplands, and riparian zone responded to climate conditions.

2.3. Spectral Unmixing

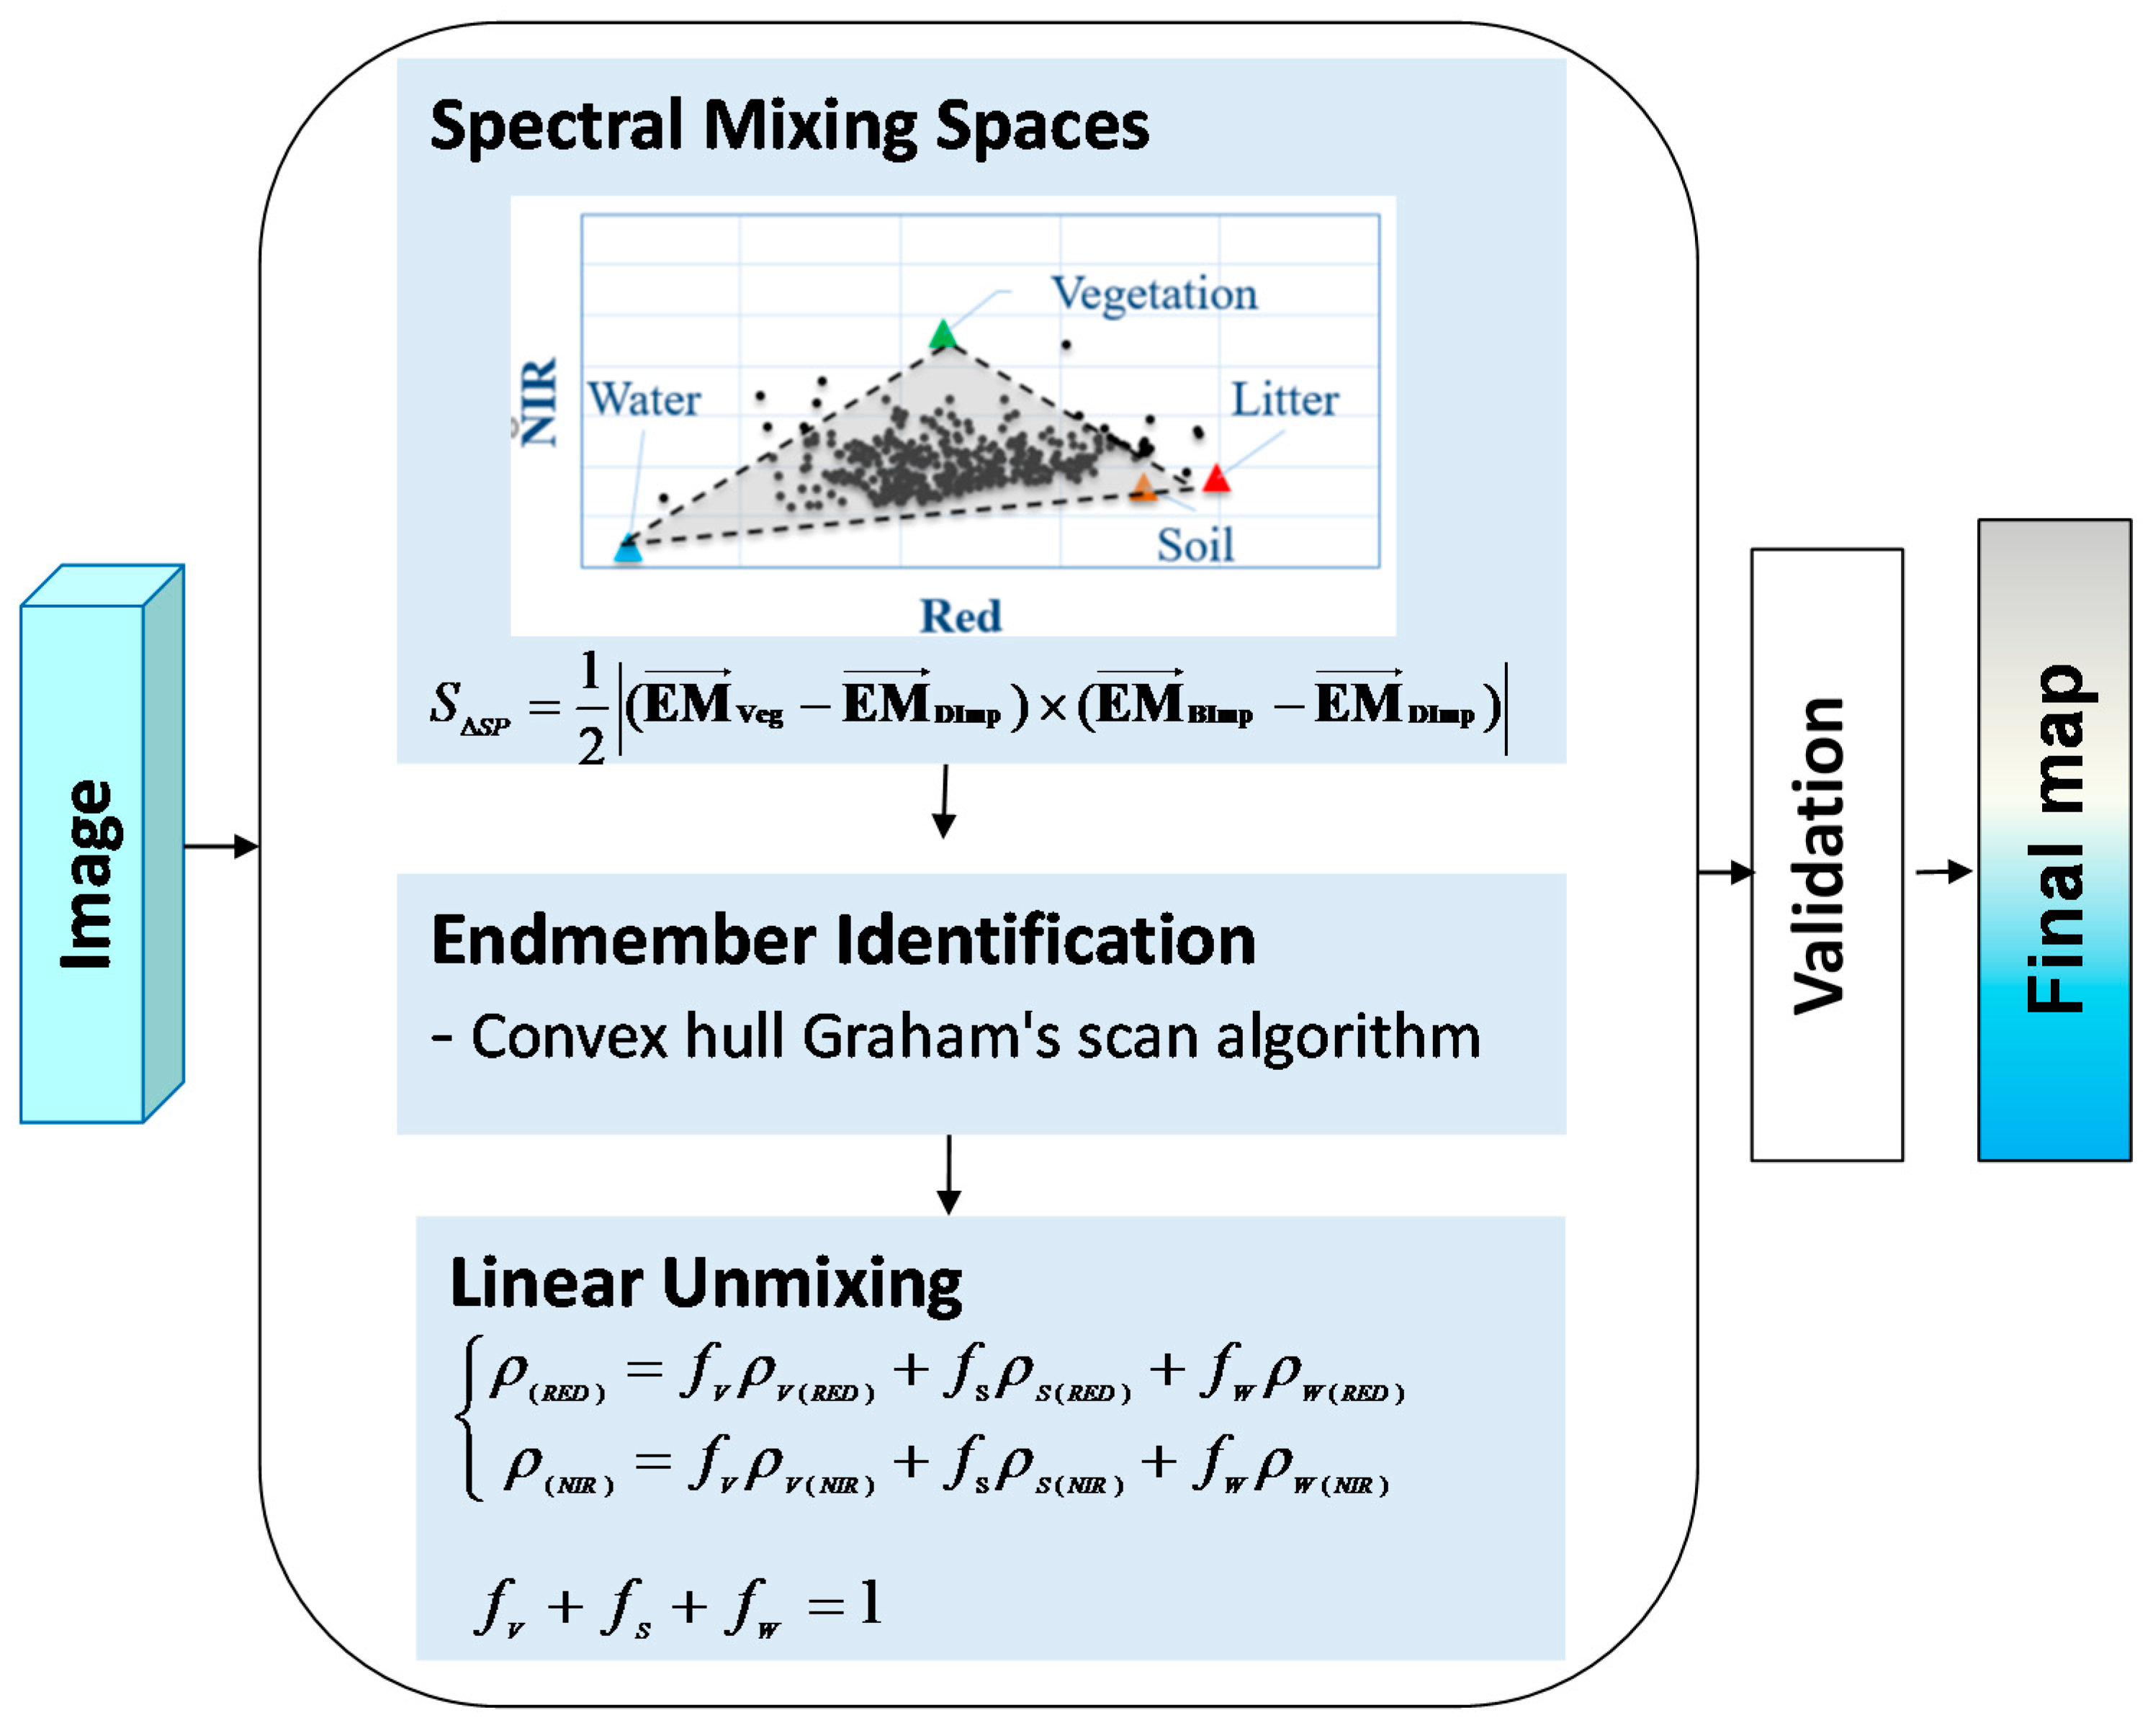
The flowchart (Figure 3) provides a general overview of the spectral unmixing procedure described below. Specifically, the spectral unmixing uses an image as input, followed by spectral mixing space construction, endmember identification, and linear unmixing. The resultant unmixing maps are then validated by ground truth data, and the final maps will then be produced along with an associated accuracy.

2.3.1. Determining an Appropriate Spectral Mixing Space

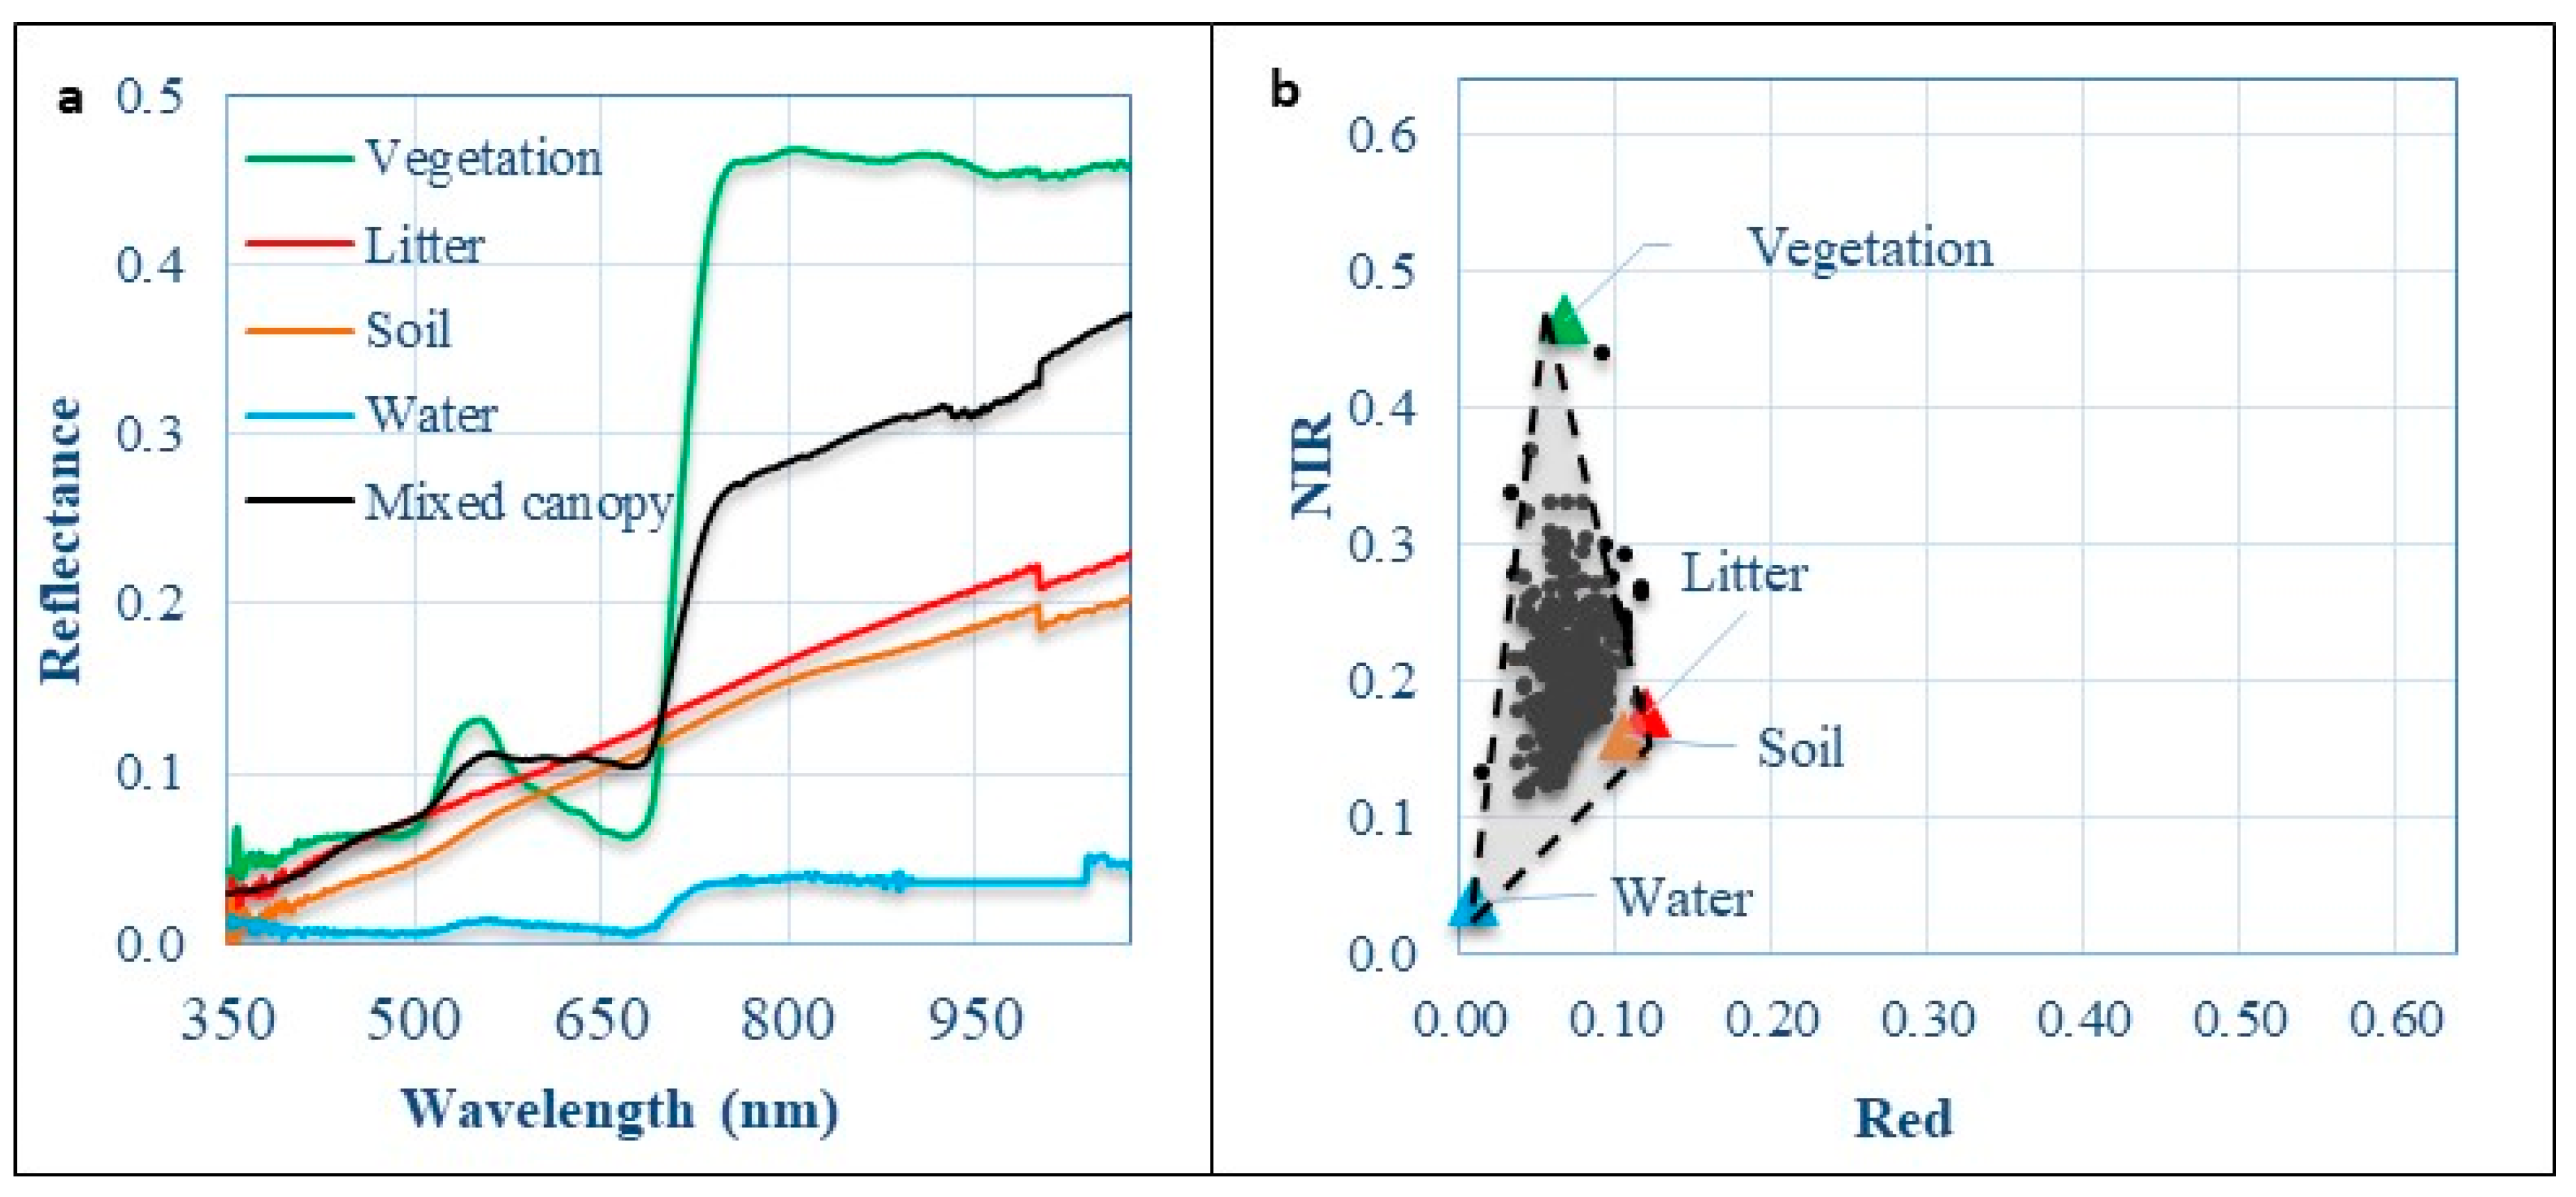
To determine which image bands can be used to distinguish photosynthetic grass from other typical ground features including litter, bare soil, and water, field measured spectra (Figure 4a) were plotted against wavelengths and further used to simulate Landsat bands. Generally, photosynthetic grass has a typical green vegetation spectra curve: high reflectance in green, low in red, and very high in NIR. Litter and bare soil have a very similar spectra curve: reflectance showing an increasing trend from short to longer wavelength regions. In comparison with the spectra of typical green vegetation, the reflectance of a typical semi-arid mixed grassland canopy comprised of green vegetation, bare soil, and a large portion of senescent leaves is lower in green, higher in Red, and much lower in NIR.
The spectral mixing space (Figure 4b) constructed by simulated Landsat red and NIR bands from ASD spectroradiometer measurements indicates that these two bands are able to distinguish green vegetation from bare soil/litter and water. As identified in [40], the reflectance spectra of bare soil and litter are similar enough in simulated Landsat bands to be considered as one ground feature. The three ground features (green vegetation, bare soil/litter, and water) formed the vertices of a point cloud triangle in the red-NIR spectral mixing space (Figure 4b). The majority of spectra from the mixed field plots are found to be within the triangle. The spectra in a few plots that are not within the triangle likely resulted from the different biophysical or/and biochemical properties of vegetation and soil within these plots, in comparison with those of the selected typical green vegetation and soil.

2.3.2. Image Endmember Optimization and Spectral Mixing Space Translation

The above section demonstrated that simulated Landsat Red and NIR bands could be used to distinguish photosynthetic grass from other typical ground features, including litter, bare soil, and water. We can now proceed to identify endmembers from each image under study. The NIR and red values from all pixels in each Landsat image were plotted in the spectral scatterplot to form a specific spectral mixing space [36].
A recently proposed endmember optimization method was employed to automatically identify the endmembers of vegetation and bare soil/litter in the Landsat red-NIR feature space for each year [37]. Specifically, an endmember spatial measure index (ESM2) is directly proportional to the determinant (Det) of all endmember vectors,
E S M 2 D e t ( E M V E M S ) ,
where E M V and E M S represent the endmember vectors of vegetation and bare soil/litter in a 2-dimensional space, respectively. The higher value of ESM2 indicates a better endmember combination for spectral unmixing. It is obvious that the value of ESM2 is proportional to the area of the triangle constructed by the three endmembers. The best endmember combination is, in effect, corresponding to the largest area of the triangle among all the triangles constructed by any three vertices. Considering that the water endmember is fixed to the pixel nearest the coordinate origin, we just need to search for the other two endmembers (vegetation and soil/litter endmembers) from the remaining pixels so that the three vertices construct the largest triangle. To accelerate the process of endmember identification, the convex hull Graham’s scan algorithm [41] that was demonstrated to work well in Yang et al. [42] was applied. The assumption behind this process is that the three pixels that construct the largest triangle area must be located at the convex hull of all the pixels scattered in a two-dimension space. The convex hull was first extracted for the spectral scatter plot by implementing Graham’s scan [41], which is a time-efficient method of computing the convex hull of a finite set of points in the plane.
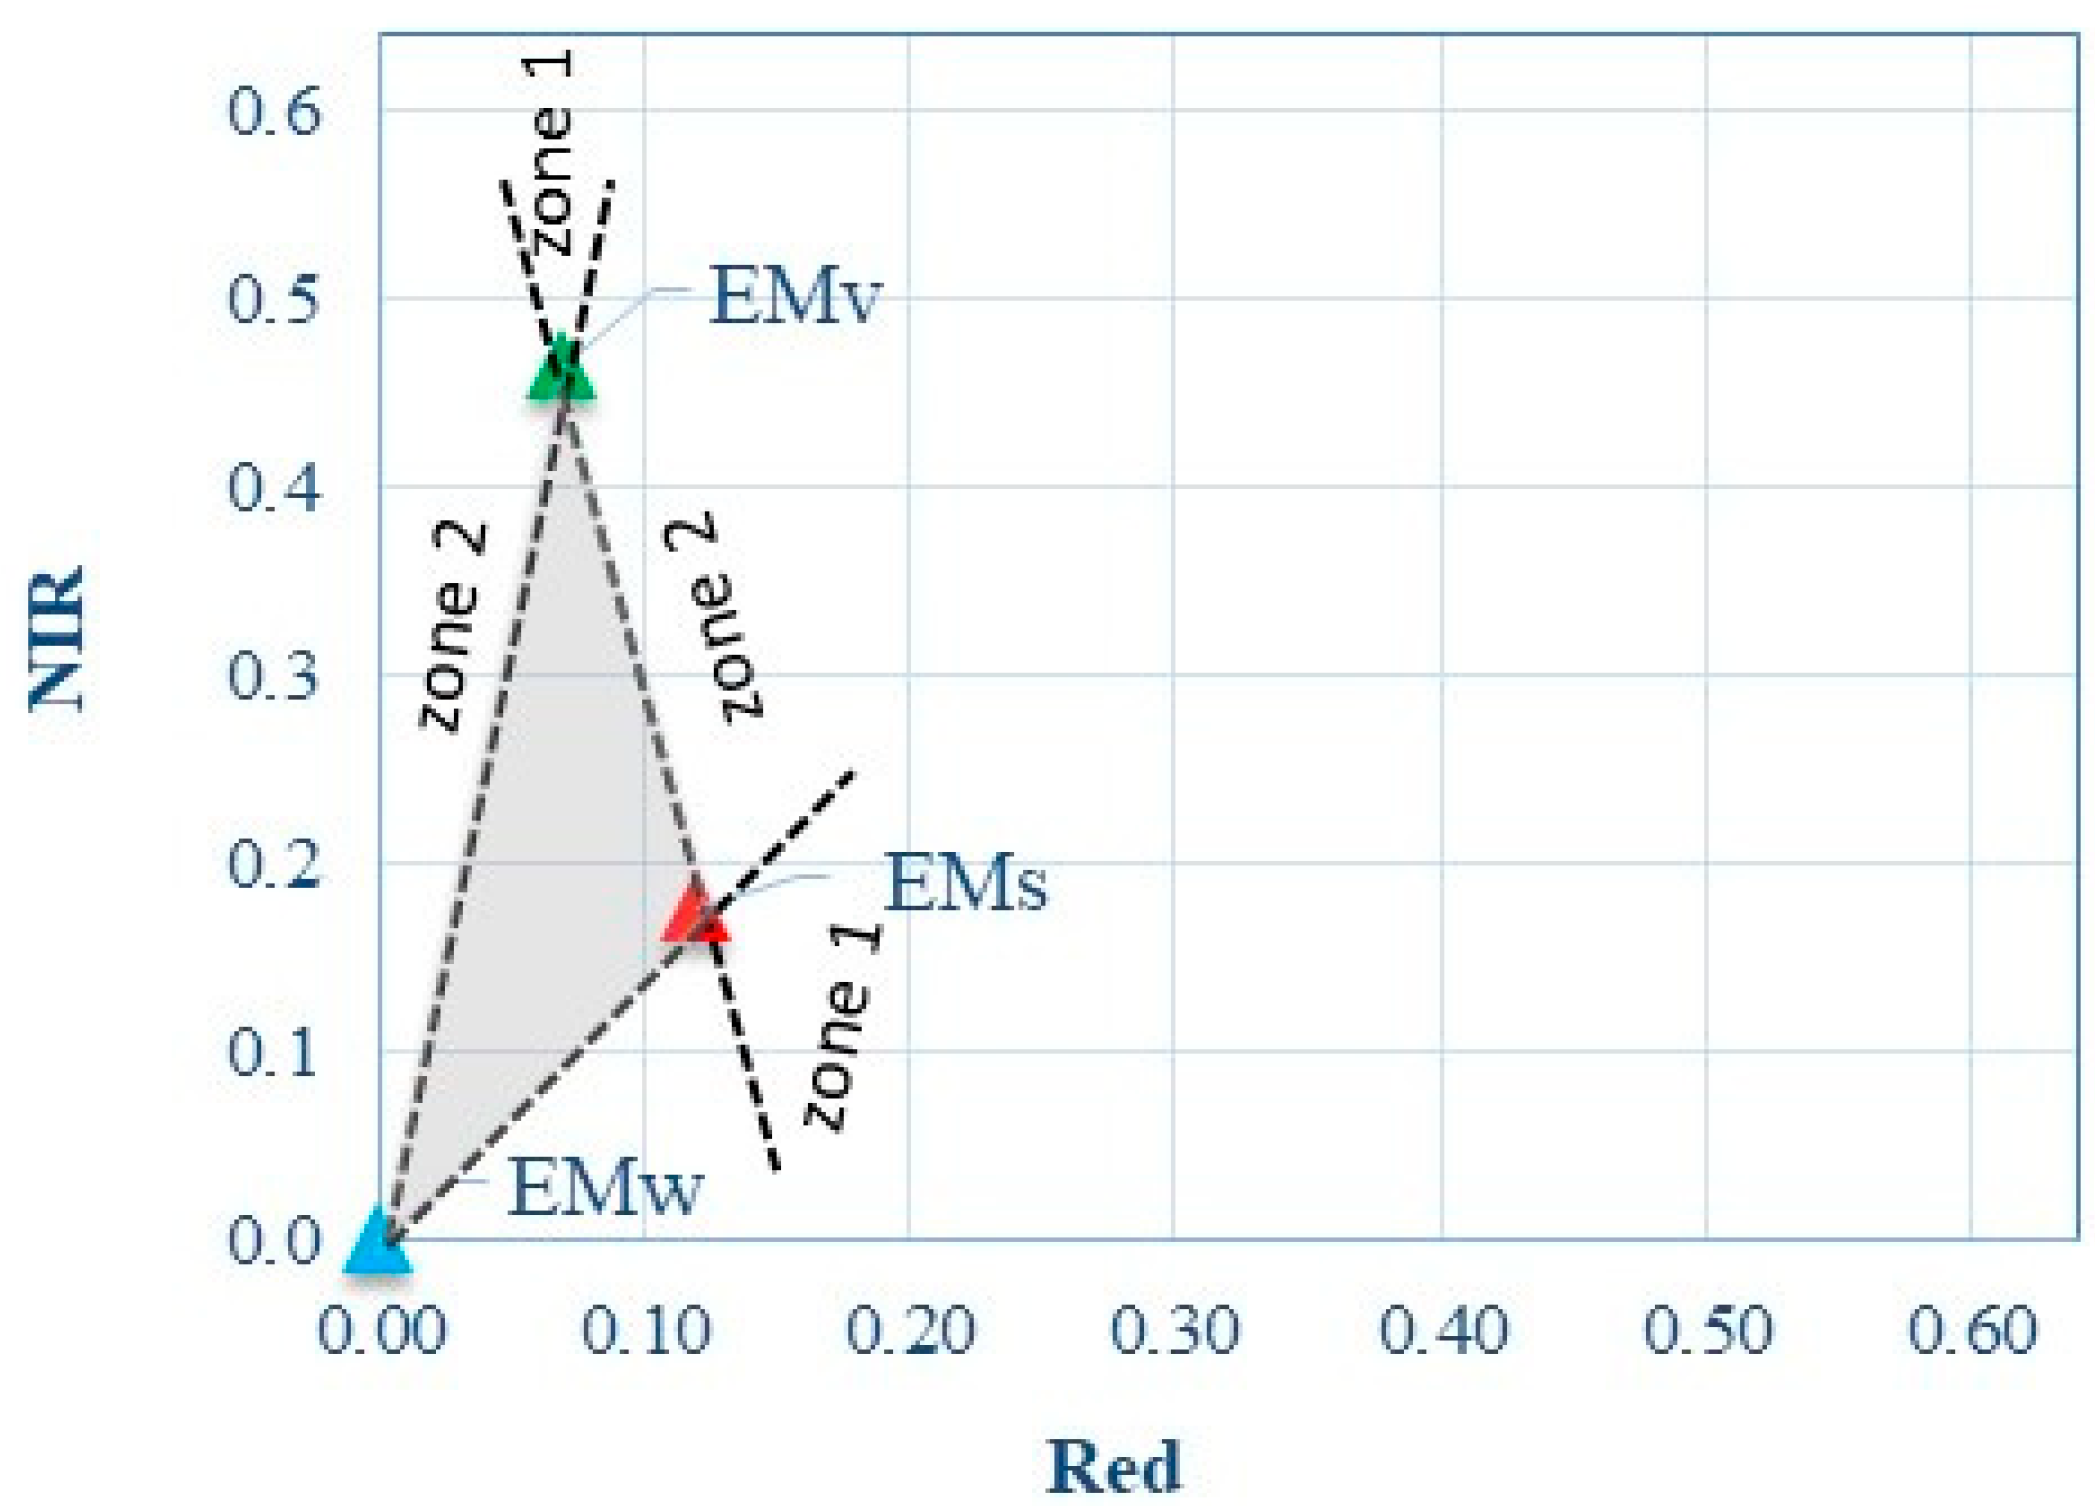
Since the vertex closest to the coordinate origin is not exactly the origin itself (Figure 4b), the origin cannot represent the endmember of water. We thus initiated coordinate translation to ensure that the vertex closest to the coordinate origin matches the origin before the implementation of linear spectral unmixing (Figure 5). The coordinate translation was done in such a way that it would not impact the triangle shape made by the endmembers; therefore, it would not affect the unmixed fractions. As a result, the water endmember was moved to the coordinate origin in the spectral mixing space. The vertex of the pixel cloud triangle close to the axis of the NIR band represents the vegetation endmember, while the one close to the axis of the red band represents the bare soil/litter endmember.

2.3.3. Linear Spectral Unmixing Model

As mentioned above, linear spectral unmixing was applied to obtain the fractions of vegetation, soil/litter, and water for any pixel in an image. Linear spectral unmixing in the translated spectral mixing space is the process of solving the following linear equations:
{ ρ ( R E D ) = f V ρ V ( R E D ) + f S ρ S ( R E D ) + f W ρ W ( R E D ) ρ ( N I R ) = f V ρ V ( N I R ) + f S ρ S ( N I R ) + f W ρ W ( N I R ) ,
where ρ(RED) and ρ(NIR) are the spectra of the mixed pixel in the red and NIR band; fv, fs, and fw are the fractions of vegetation, bare soil/litter, and water, respectively; ρV(RED) and ρV(NIR) denote the spectra of vegetation endmember in the red and NIR band, whereas ρS(RED) and ρS(NIR) represent the spectra of bare soil/litter endmember. Since the coordinate origin is the water endmember, its spectra (ρW(RED), ρW(NIR)) were assigned as (0, 0). Equation (2) can be rewritten as:
{ ρ ( R E D ) = f V ρ V ( R E D ) + f S ρ S ( R E D ) ρ ( N I R ) = f V ρ V ( N I R ) + f S ρ S ( N I R ) ,
In a typical grassland scene, the sum of vegetation, bare soil/litter, and water fractions should be equal to one. The fraction of water can thus be calculated as:
f V + f S + f W = 1 ,

2.3.4. Refinement

In addition to Equation (4), a valid spectral unmixing requires that each endmember fraction is within the range of zero to one. The translated pixel cloud triangle in the 2-dimensional spectral mixing space is shown in Figure 6. EMV and EMS are the pair of pixels with the highest ESM2 value. It is apparent that the pixels within the triangle with the vertices of EMV, EMS, and EMW have a meaningful fraction of vegetation, bare soil, and water (i.e., from 0 to 1). However, not all the pixels are always located within this triangle (Figure 4b). For any outlier, the proposed approach will search for the point on the boundary of this triangle with the minimum Euclidean distance to the outlier. In particular, two zones were used to deal with the outlier pixels (Figure 5). For the pixels in Zone 1, the unmixing solution is the closest endmember (i.e., EMV or EMS), indicating they are pure pixels of vegetation or bare soil class. On the other hand, the solution for the pixels in Zone 2 is the closest point on either side of the triangle. From this point of view, the Refinement was able to ensure the validity of unmixed fractions for all the pixels in the entire image for each year.

2.3.5. Vegetation Fraction Estimation and Accuracy Assessment

Linear regression between the endmember fraction and the field observed green vegetation cover is then implemented to evaluate the spectral unmixing results. The field data are randomly split into 70% and 30% groups, with 70% to form the regression between unmixed FGVC and observed green cover and 30% for further calibration and evaluation. Linear regression is used because many previous studies have demonstrated its usefulness for evaluating spectral unmixing through its parameters, including the coefficient of determination (R2), mean error (ME), mean absolute error (MSE), and root mean square error (RMSE). A high R2, as well as low MAE and RMESE, indicates a better quality of spectral unmixing. After validation, the vegetation maps over multiple years were produced, and vegetation change maps and pixels with significant changes (p < 0.01 or p < 0.05) between 1999 to 2014 were calculated.
M E = 1 n ( X p r e d i c t e d X o b s e r v e d ) ,
M A E = 1 n | X p r e d i c t e d X o b s e r v e d | ,
R M S E = 1 n ( X p r e d i c t e d X o b s e r v e d ) 2 ,
where Xpredicted and Xobserved are the predicted or observed vegetation fraction cover, and n is the number of samples used to validate the predicted vegetation cover.

2.4. Time Series Analysis

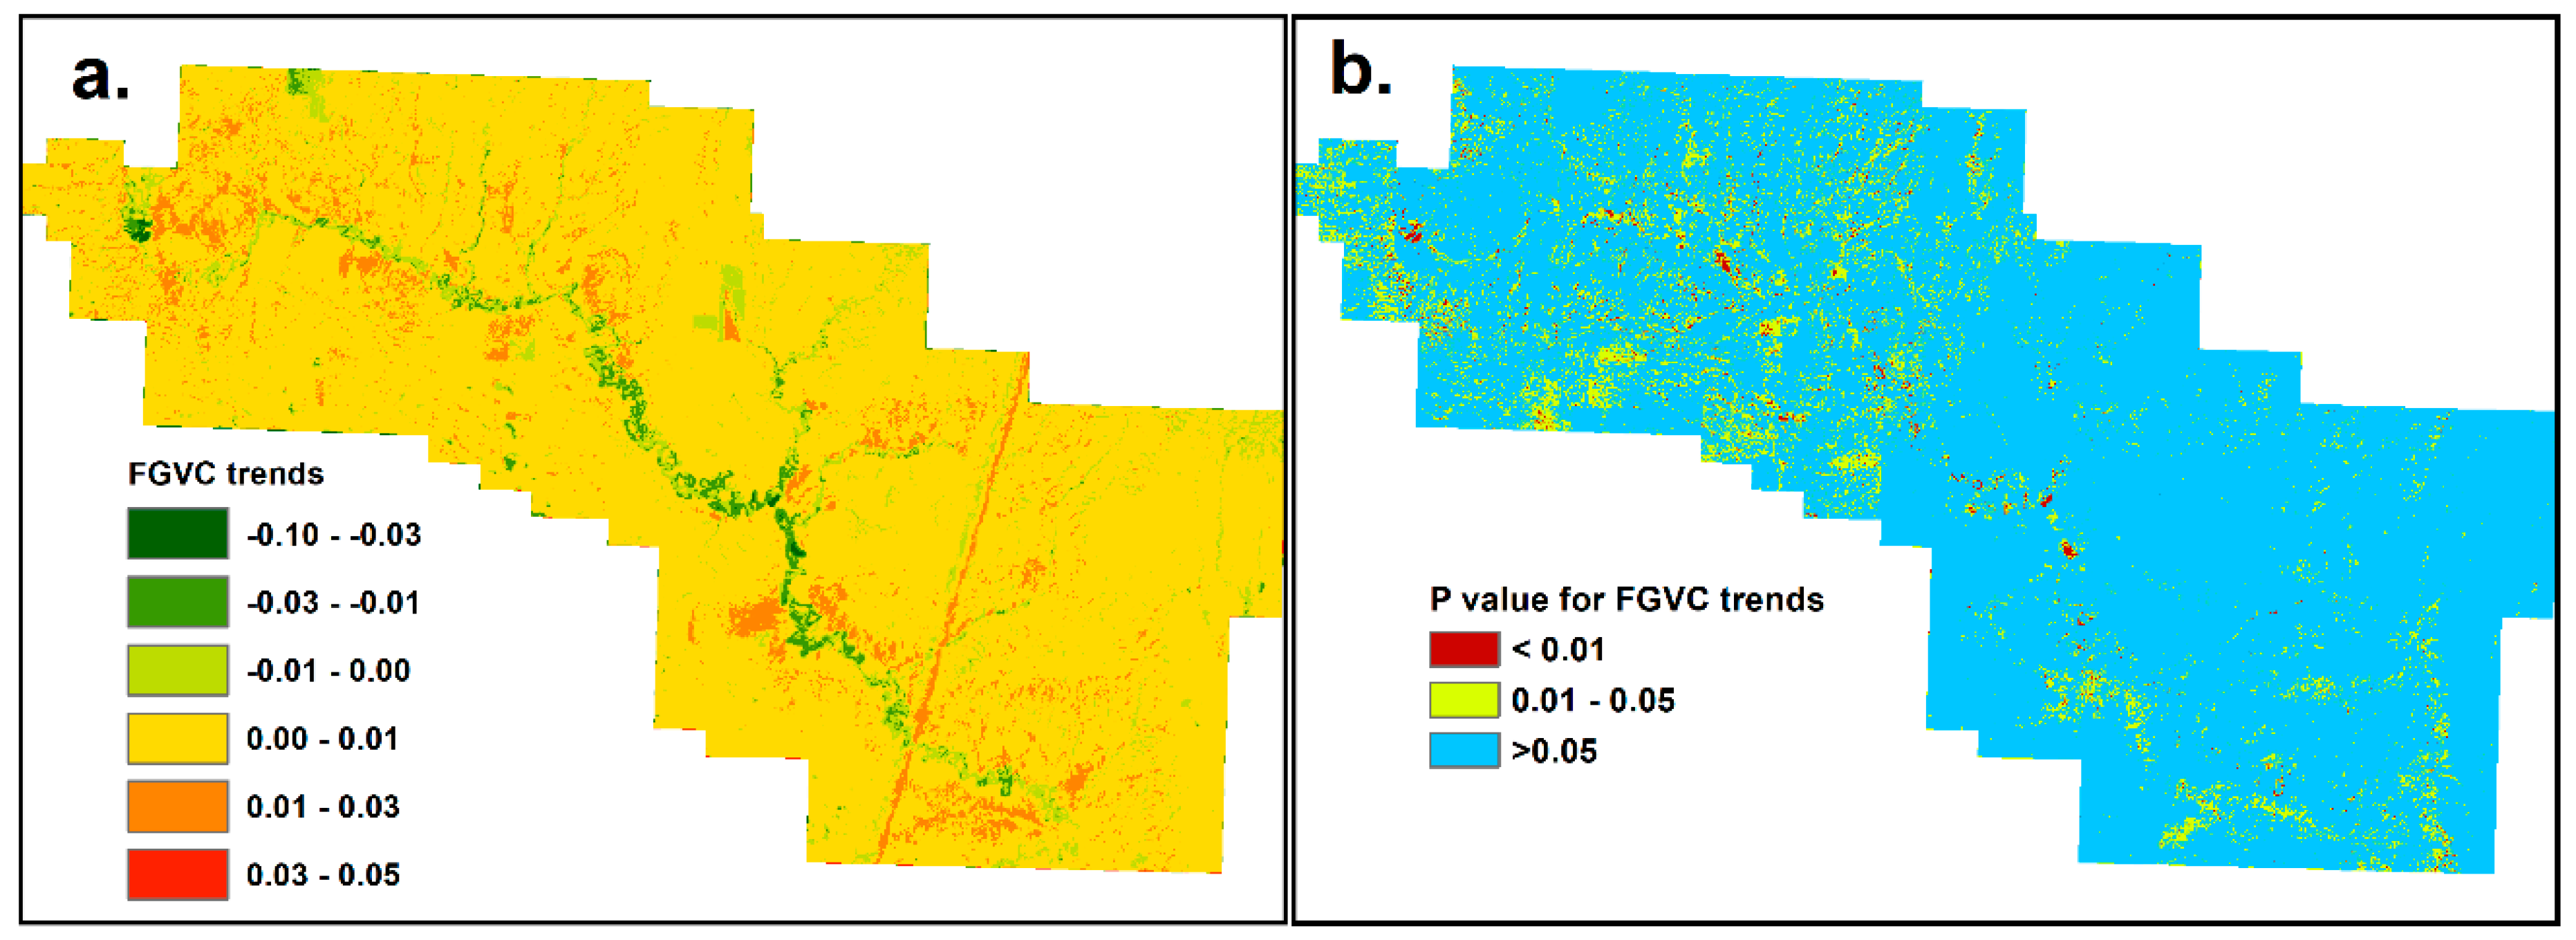
Following the time series analysis conducted by Bonney et al. [43], we used the unmixed FGVC maps for trend analysis using the “raster” package in R [44]. The changes in the FGVC magnitude were mapped on a per pixel basis through linear regressions, where FGVC was the dependent variable and the image acquisition year was the independent variable. Specifically, the slope of each linear regression was mapped for each pixel to indicate the FGVC change magnitude. The significance of per pixel change was also mapped using the corresponding p-values of a t-test where p values were mapped as p < 0.01, p = 0.01 to 0.05, and p > 0.05. FGVC trends with p ≤ 0.05 were considered a significant change in green vegetation, and FGVC trends with p > 0.05 were considered an insignificant change over the years.
The compiled FGVC maps were also used to extract FGVC data for each of the three dominant landscape units (i.e., badlands, uplands, and riparian zone) in the study area. The effects of precipitation from last 3 days, 1 week, 2 weeks, 3 weeks, and 1 month on vegetation were examined in these three landscape units through a Pearson’s r correlation analysis. The significant r values suggested a pronounced impact of the precipitation on the green vegetation cover over time.

3. Results

3.1. Unmixing Results

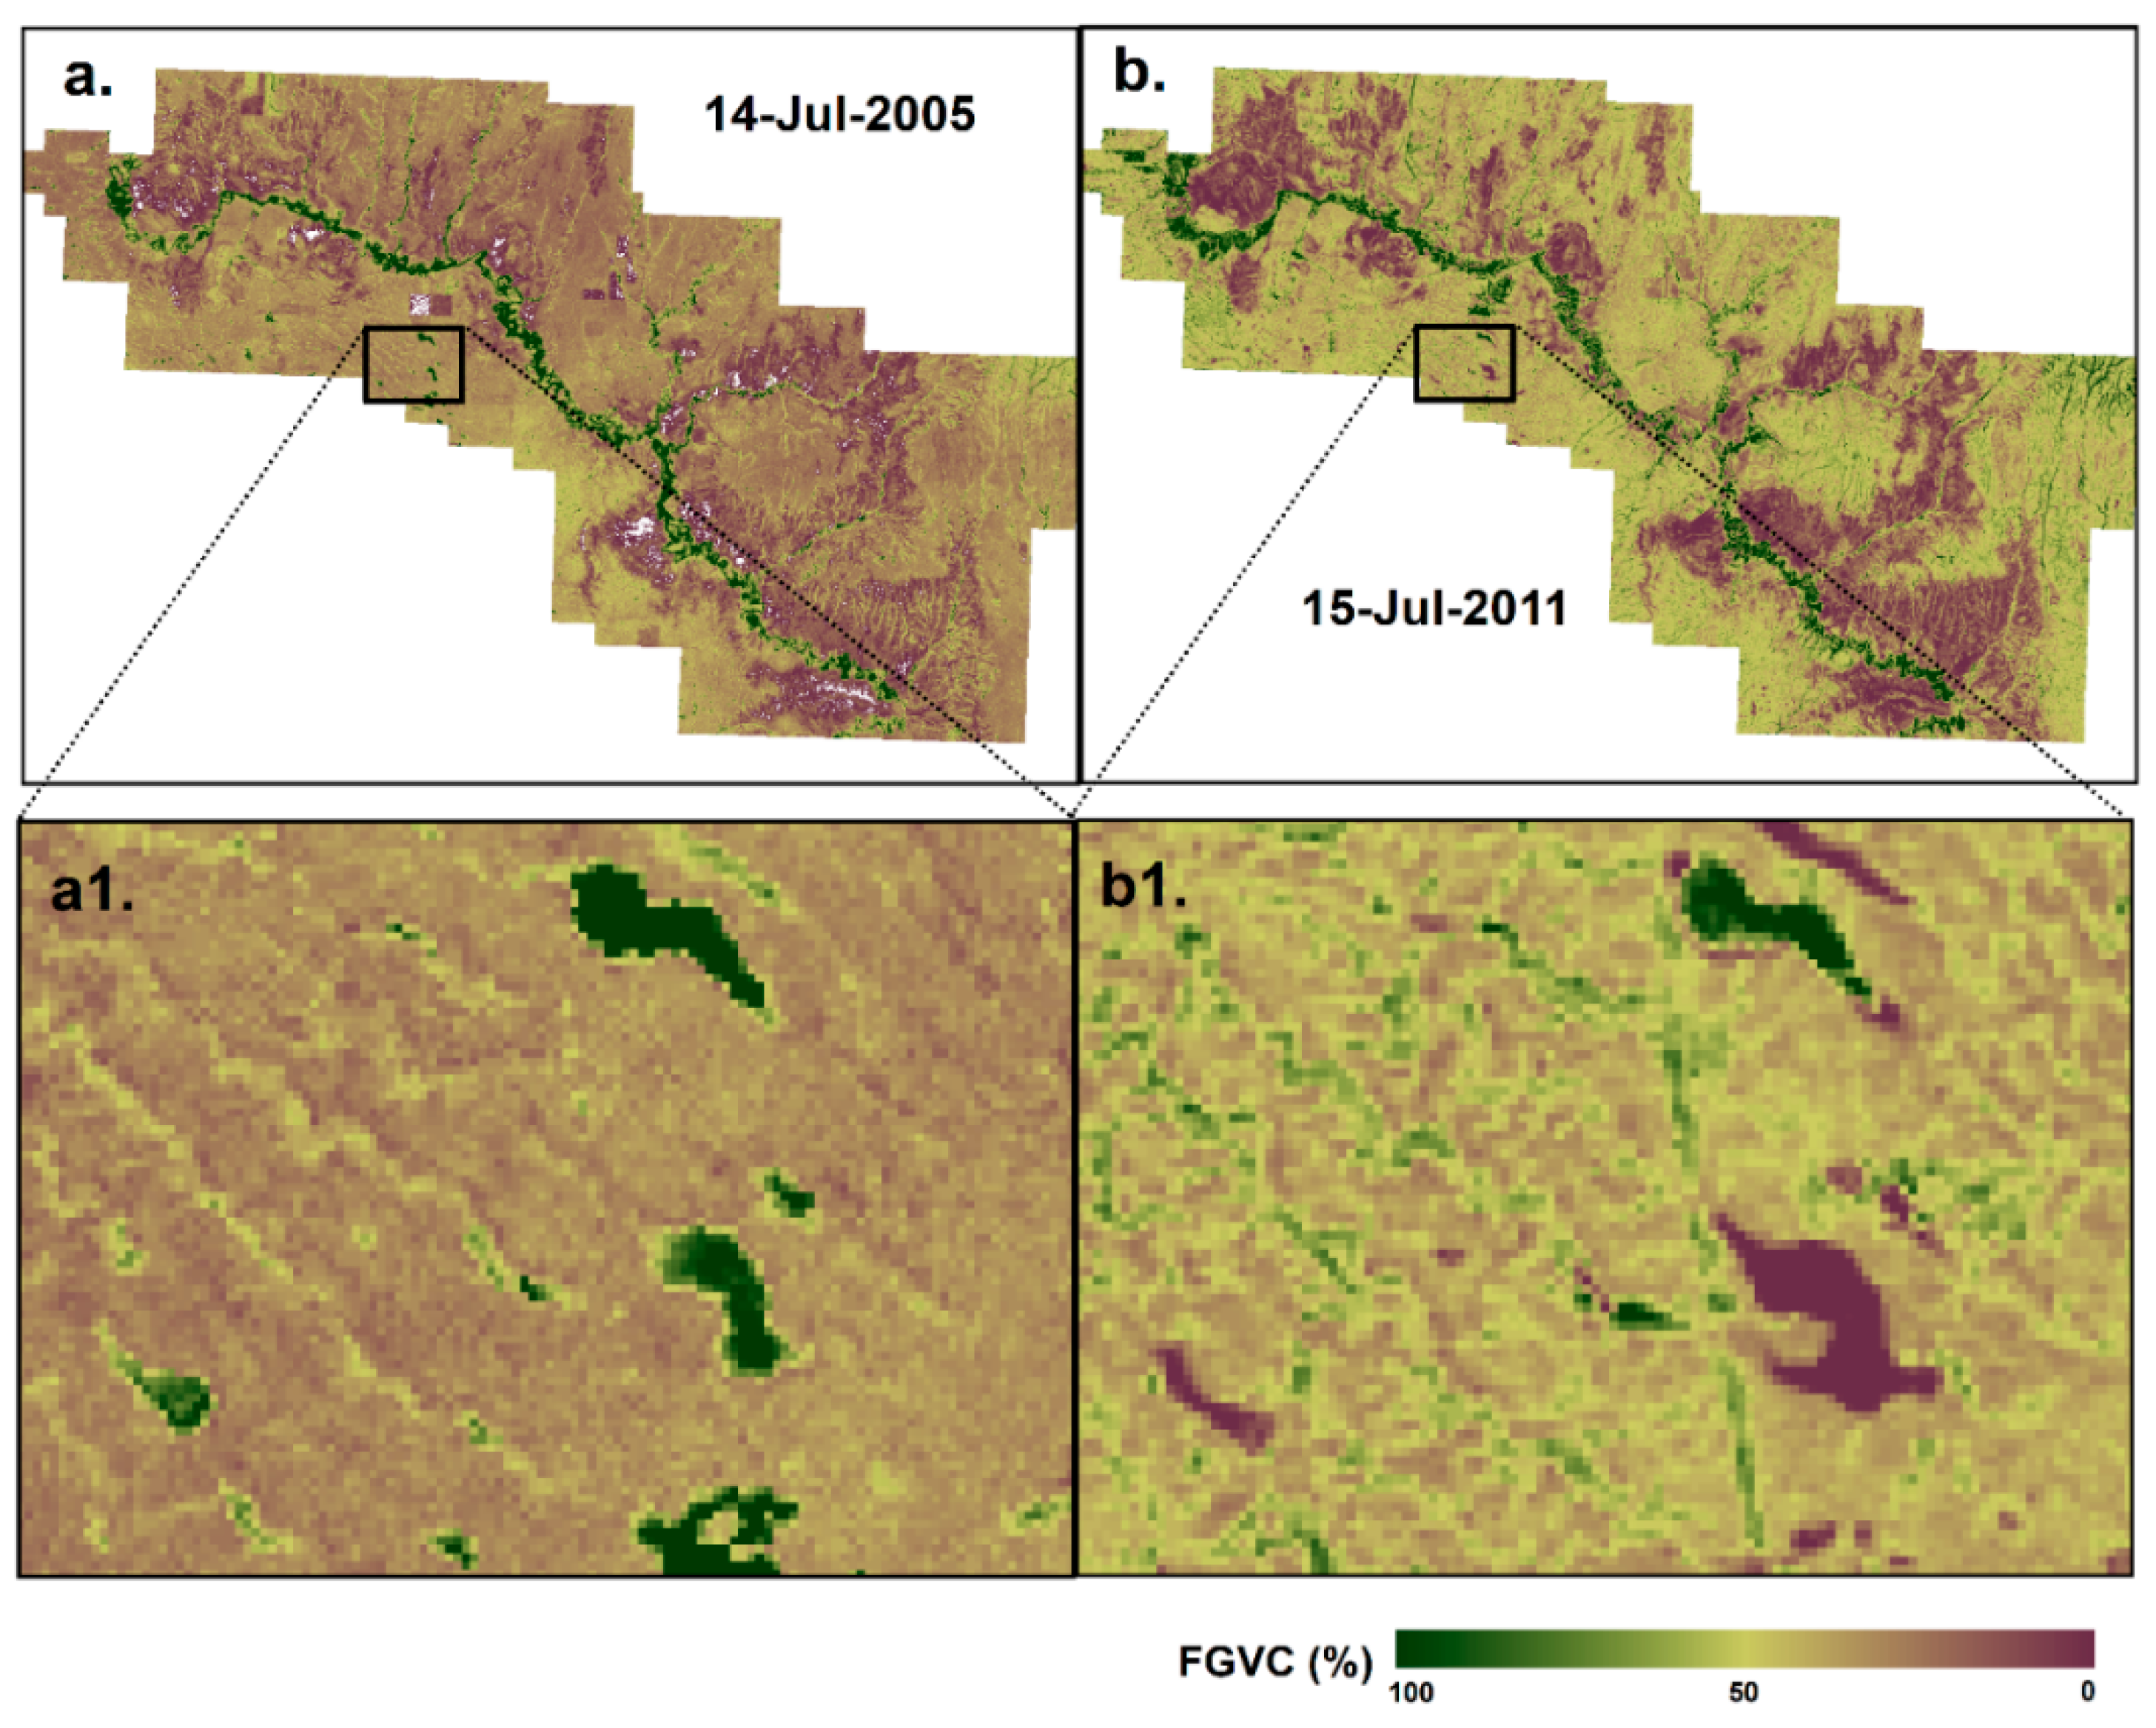
A total of 15 Red-NIR spectral feature spaces (i.e., scatter plots) were constructed for the 15 images under study, and the two example feature spaces with one from 14 July 2005, and the other from 15 July 2011, are displayed in Figure 6. The overall form of the image-bases spectral spaces is consistent between the two years, although the distributions of the mixed pixel values within the feature space triangles vary (Figure 6). The similarity of the spectral spaces, as well as those not shown in the figure, indicate that all 15 years of the images have a consistent feature space and thus similar endmembers. A close look into the difference in the endmembers in 2005 and 2011 indicates that the vegetation endmembers (EMv) are very close, with the EMv of (Red = 0.10, NIR = 0.62) for 2005 and EMv of (Red = 0.10, NIR = 0.63) for 2011. Water endmember exhibits a higher water reflectance in 2005 (Red = 0.08, NIR = 0.06) than in 2011 (Red = 0.05, NIR = 0.04), and it is noticeable that there are fewer water mixing points near the water endmember in 2005. Similarly, soil/litter reflectance has slightly higher reflectance in both Red and NIR bands in 2005 than in 2011. The fewer water points and higher soil/litter reflectance in 2005 suggest that 2005 is drier than 2011. Historical precipitation data we downloaded from the nearby weather station confirm that the two years had distinctly different precipitation conditions. The early summer of 2005 was very dry, with total precipitation of 36.8 mm in May, 96.2 mm in June, and 16.8 mm from 1–14 July (i.e., right before the image was acquired). On the contrary, the early summer of 2011 was wetter, and its total precipitation was 93.2 mm in May, 77.3 mm in June, and 61.7 mm 1–14 July. Within the three days before the images were taken, the study area had 1.8 mm of rainfall on 13 July of 2005, but with 52.2 mm on 13 July 2011.
The 15 Landsat images are then unmixed with the image endmembers obtained from the Red-NIR feature space. An example of the resultant unmixing images for 15 July 2011, is displayed in Figure 7. Visual interpretation clearly indicates low green vegetation cover (purple in Figure 7a), high bare soil/litter cover (dark brown in Figure 7b), and low water content (light blue in Figure 7c) in badlands. On the contrary, there is obvious high green vegetation cover (green in Figure 7a) and low bare soil/litter cover (light yellow in Figure 7b) along the Frenchman River running from northwest to southeast. These results suggest that the unmixing approach resulted in a reasonable FGVC estimation for the study area. However, water content is notably low (light blue to white in Figure 7c) along the Frenchman River, which is likely due to high green vegetation cover in the form of the dense green shrubs and tall grasses growing along the riverbank.
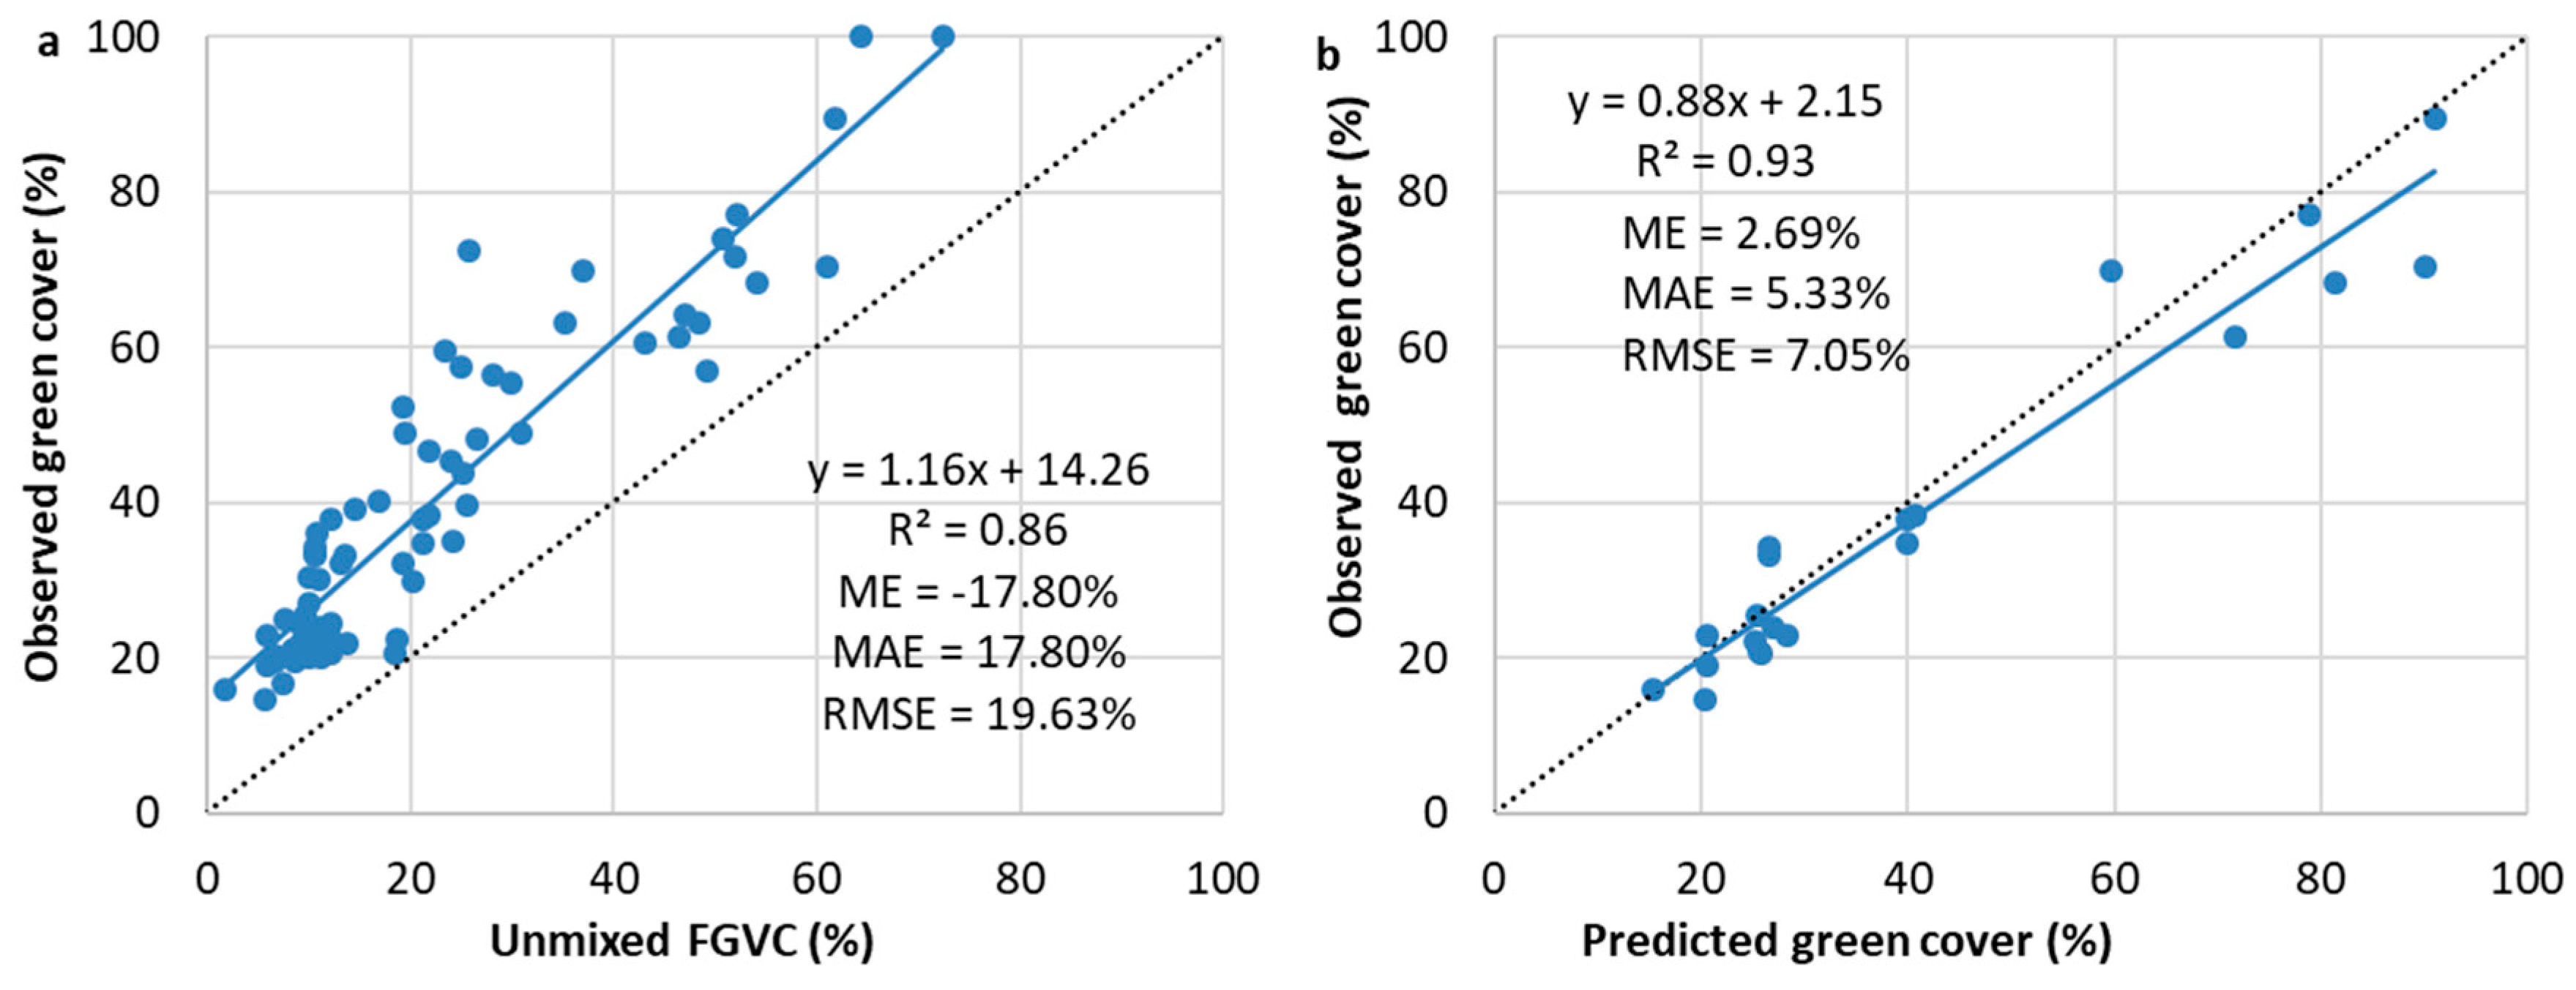
A quantitative evaluation was then conducted to validate spectral unmixing results using ground observation data. A strong linear relationship (R2 = 0.86) between the unmixed FGVC and 70% of observed green cover data is observed (Figure 8a). The regression-derived relationship between unmixed green vegetation cover and 70% of observed field data was applied to the entire map of the unmixed FGVC, which was then validated by the remaining 30% of observed green vegetation cover data. The results indicate that the correction led to a strong FGVC estimation with an R2 value of 0.93 and an RMSE of 7.05% (Figure 8b).

3.2. Time Series Results

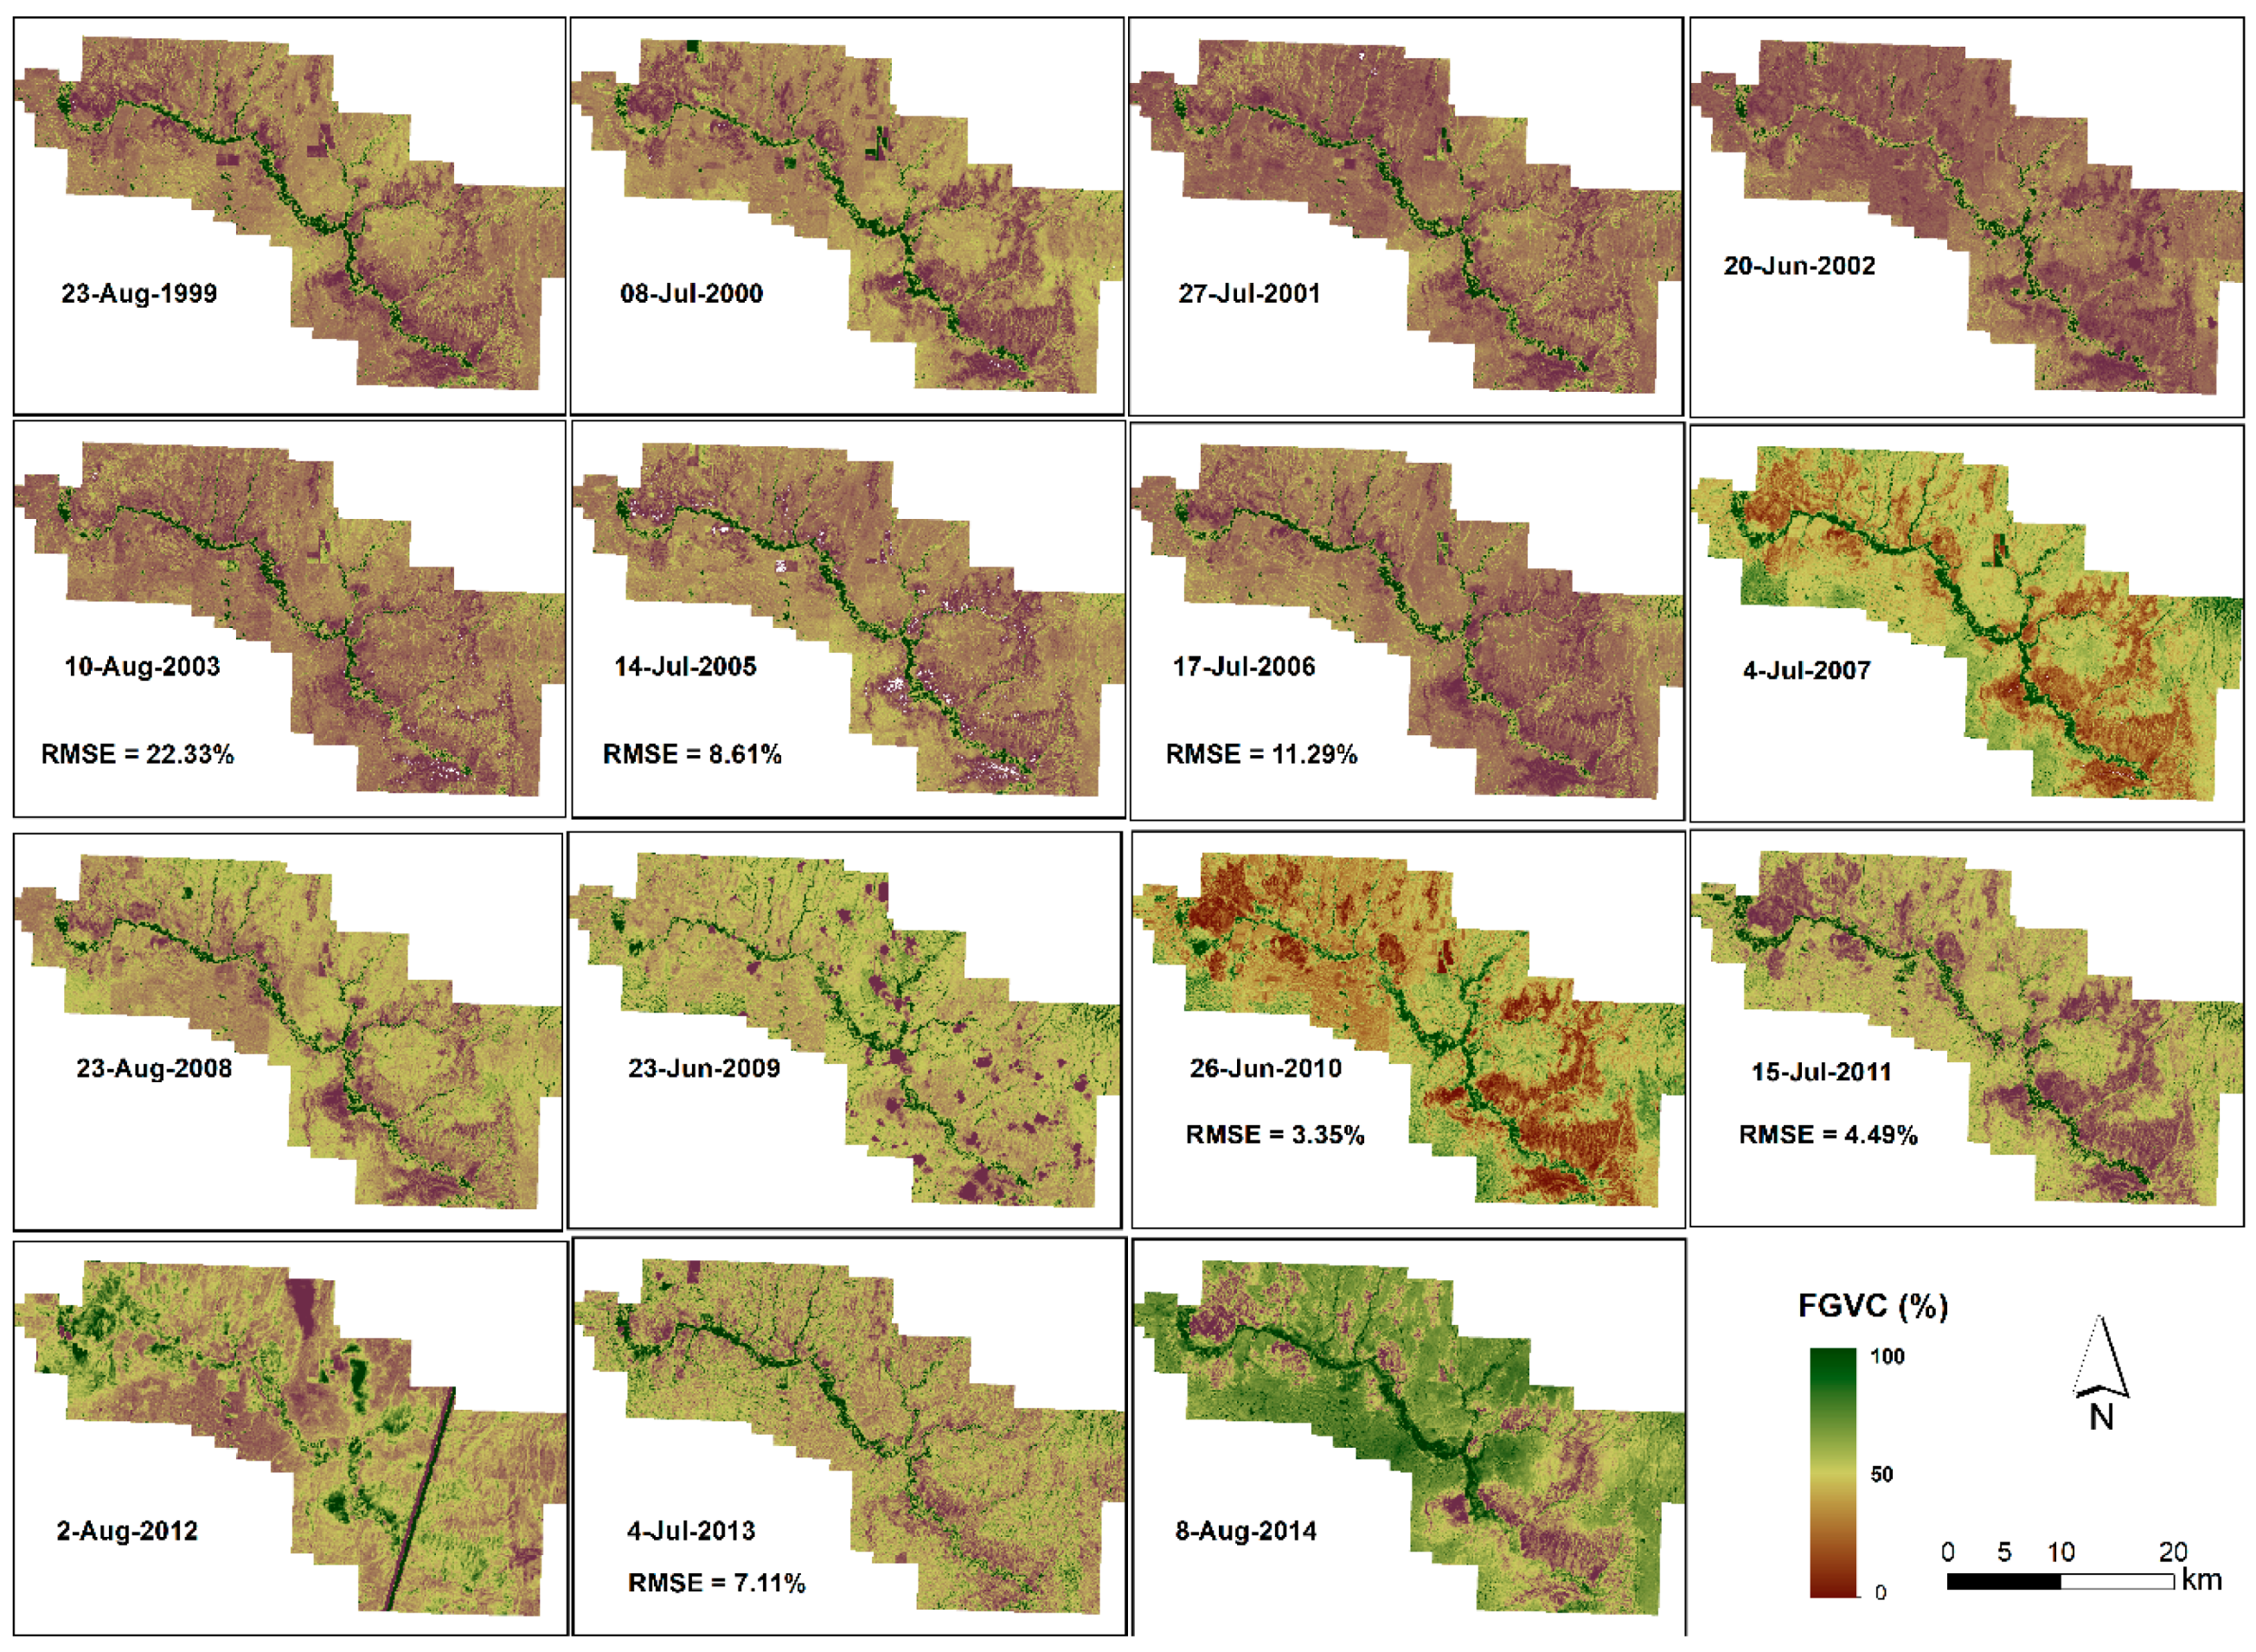
The FGVC maps from 1999 to 2014 are displayed in Figure 9. The field data that were reserved for validation were also used to calculate the RMSE for each year between the unmixing FGVC and observed green vegetation cover. The RMSE ranges from the lowest value of 3.35% in 2010 to the highest 22.33% in 2003. It is clear that the farther the image acquisition date was away from the field data collection season (15 June to 15 July), the greater the RMSE is. For example, the unmixing result in 2003 has a large error, while the 2013 image was taken on August 10, about a month after the field data were collected. In contrast, the FGVC in 2010 has a small RMSE, corresponding to a complete match between the field season and image acquisition date of 26 June.
The amount of green vegetation varies substantially from year to year, and the change is not uniform across space (Figure 9). To further investigate the difference in the greenness in the study area, we selected the unmixed FGVC maps from 14 July 2005 and 15 July 2011, for a detailed comparison. Consistent with higher precipitation in 2011 than in 2005, the unmixed FGVC has a generally higher vegetation cover in the year of 2011 (i.e., the wet year) than in the year of 2005 (i.e., the dry year). This is demonstrated by more areas with a light green color (i.e., closer to 100% FGVC) and by badlands having a lighter purple color (i.e., farther from 0% vegetation) in 2011 in comparison with 2005 images (Figure 10a,b). The enlarged maps (Figure 10(a1,b1) further show that a few ponds full of water in the 2011 FGVC map (purple colored polygons in Figure 10(b1)) were occupied by dense green vegetation (dark green colored polygons in Figure 10(a1)) in the 2005 FGVC map. These results confirm that water availability is the primary driver of variations in green vegetation cover in this semi-arid area.
FGVC trends from the year 1999 to 2014 were mapped over the entire study area (Figure 11a). An increase in FGVC of less than 1% per year is observed in most of the study area. Only a small portion of the study area has experienced a decreasing trend, mainly along the Frenchman River and its tributaries, with a reduced rate of less than 1% per year. Significant changes, both increasing and decreasing (Figure 11b), occurred mainly in the west half of the study area or along the river.
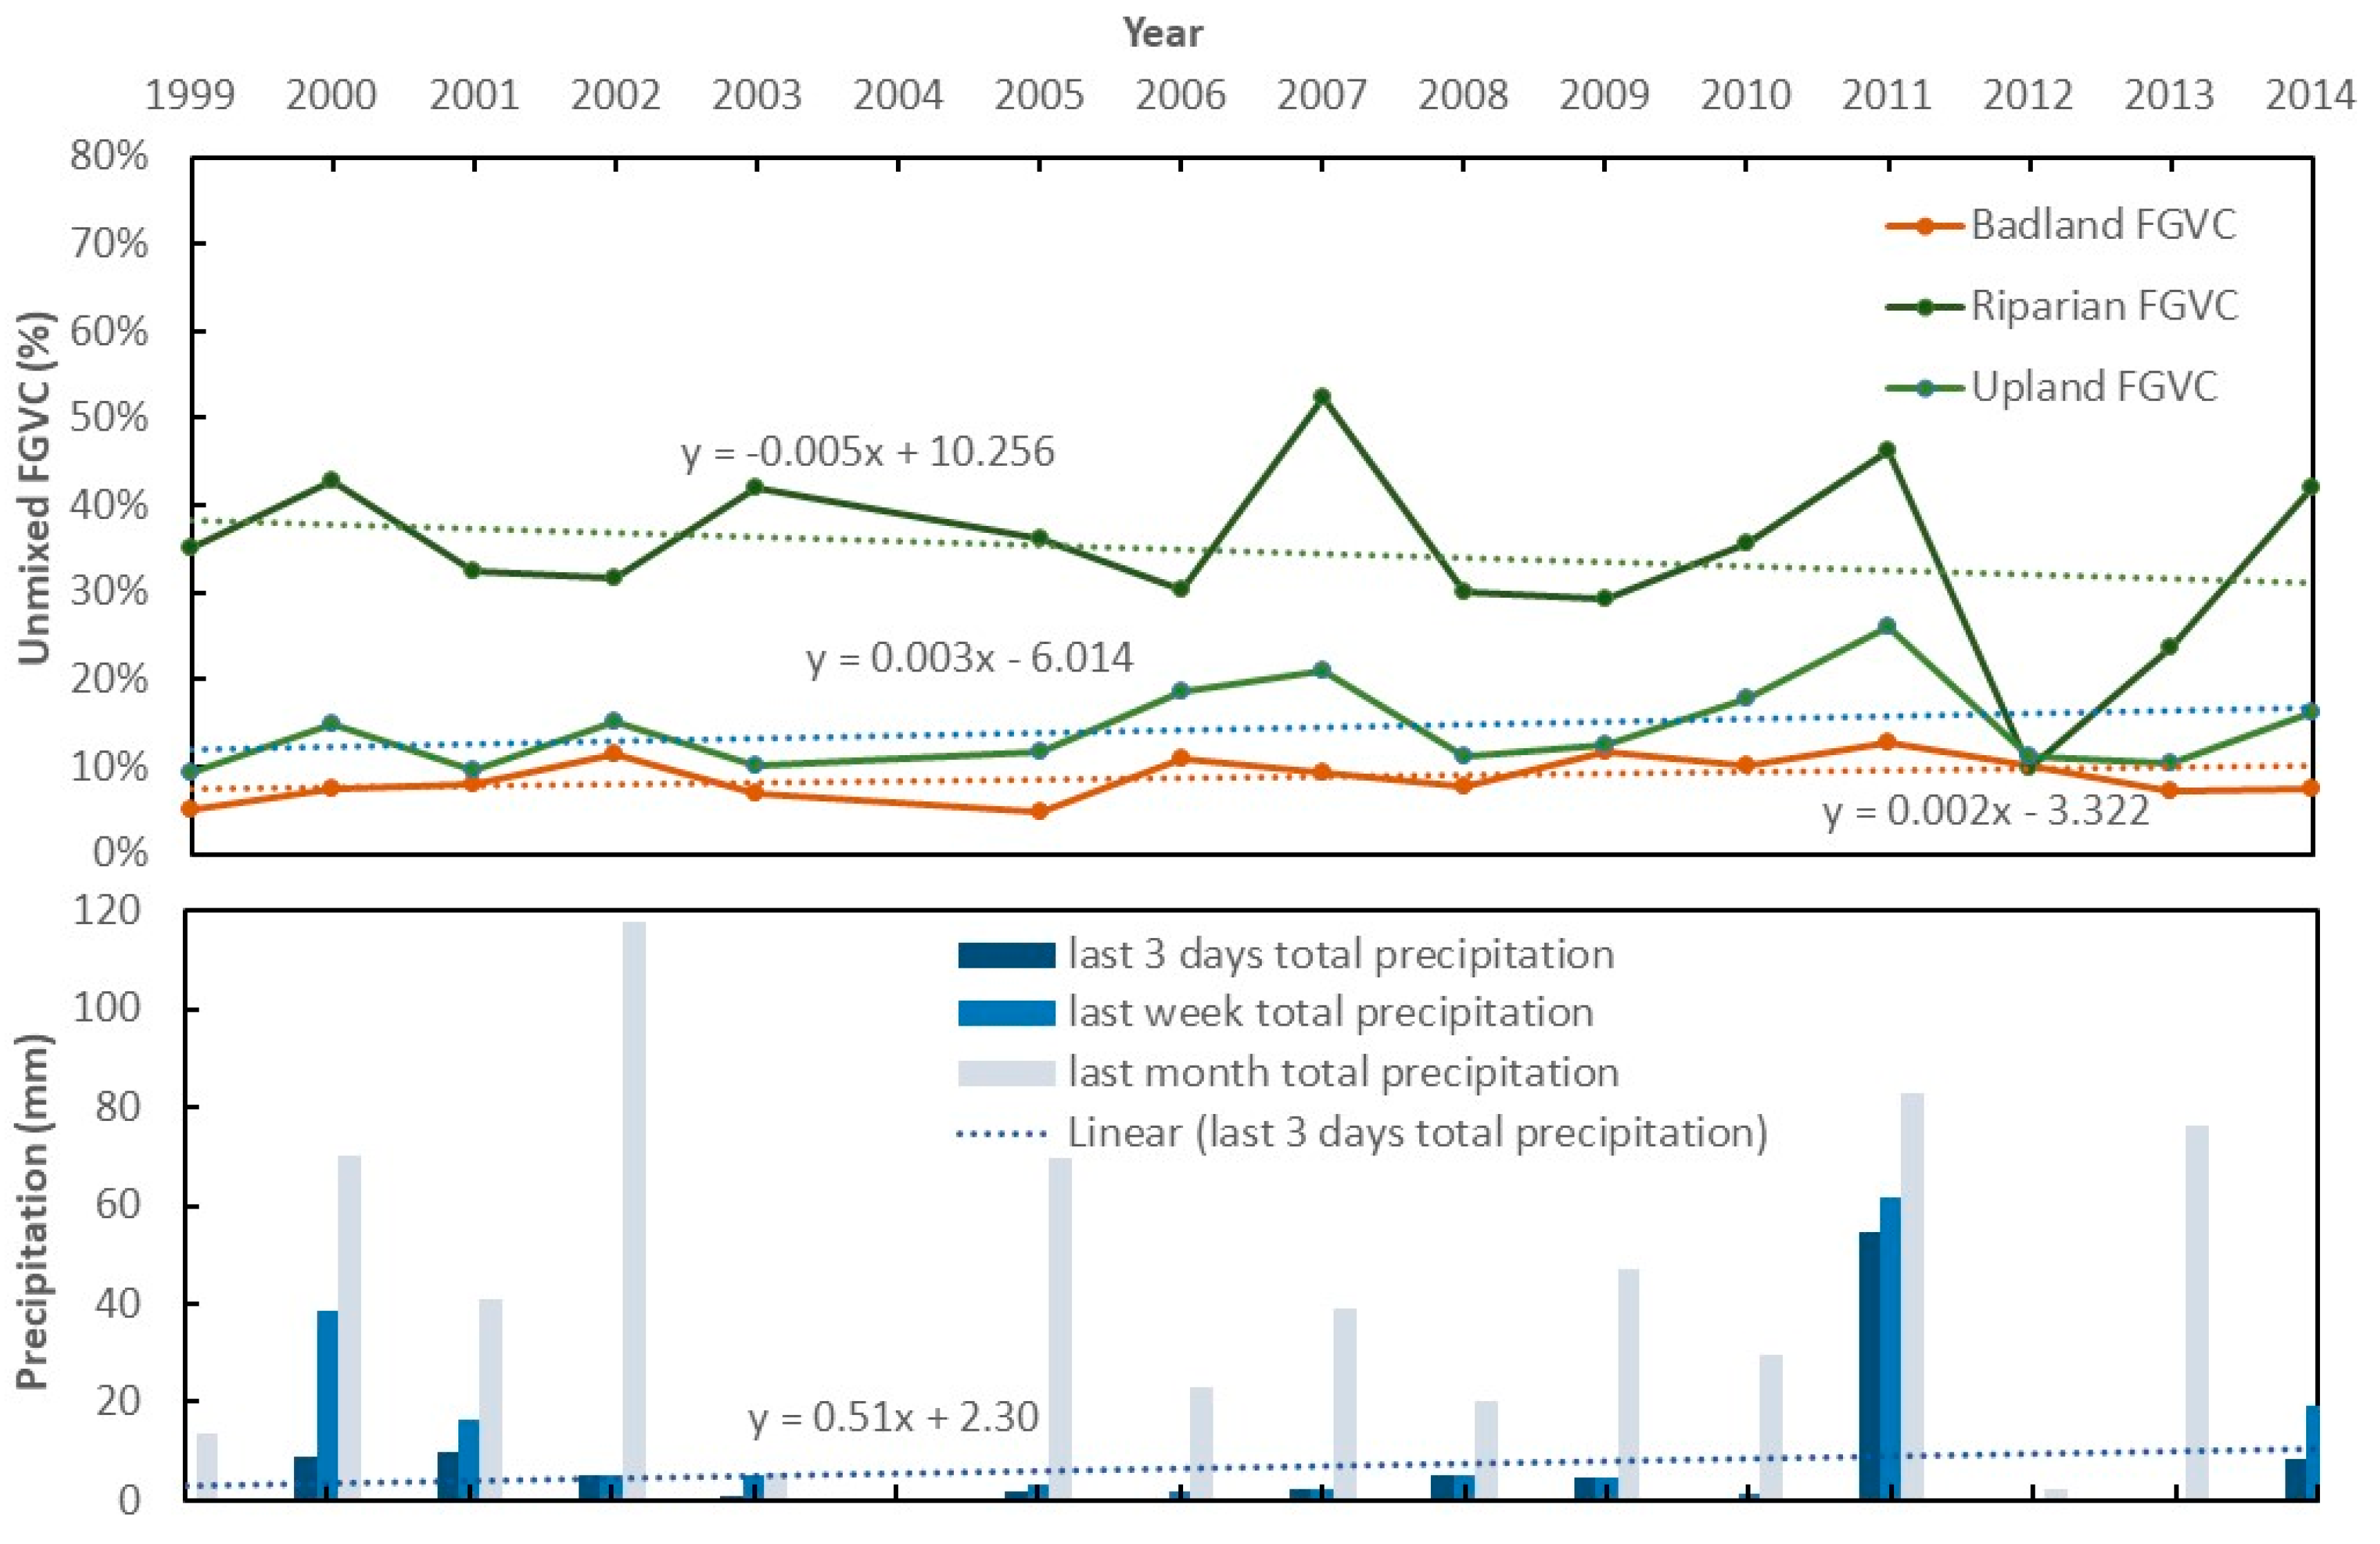
The unmixed FGVC for badlands, uplands, and riparian zone were further extracted from each FGVC map, and their temporal variations are displayed in Figure 12. FGVC is always higher in the riparian zone, followed by the uplands and then the badlands. Consistent with the significance map (Figure 11b), the linear regression trend lines in Figure 12a also suggest a slight increase in FGVC in the uplands and badlands but a decrease in the riparian zone. The vegetation greenness in badlands and uplands are most highly correlated with the total precipitation accumulated from 3 days before the images were taken (Table 2). Similarly, the last 3-day total precipitation also showed a slightly increasing trend during the study period (Figure 12b). On the other hand, vegetation greenness in the riparian zone is less impacted by the short-term precipitation, as shown by their weaker correlation in comparison with the correlations for the badlands and uplands. Vegetation in the riparian zone tends to have a stronger correlation with the last 7-day precipitation (Table 2).

4. Discussion

As an important branch of soft classification, spectral unmixing has been commonly used in many remote sensing applications, especially for medium/low-resolution imagery. In recent years, several studies have started to unmix fine-scale imagery (i.e., IKONOS and WorldView-2) through the analysis of spectral mixing space [36,37]. In comparison with the conventional spectral unmixing, these studies identified and determined the endmembers by investigating the shape of pixel clouds in spectral mixing spaces. Specifically, the shape of the pixel cloud in the spectral mixing space constructed by the red and NIR band was found to be a triangle, and the three vertices of this triangle were 100% vegetation, bare soil/litter, and water endmembers. The image-based red-NIR space feature space is consistent over the years, and similarly, vegetation endmembers are also stable for this study area, suggesting a simple linear mixture is able to construct a consistent grassland reflectance. Using the endmembers identified from each image, spectral unmixing was successfully conducted, and the unmixed FVGC with an acceptable RMSE indicates fully automated spectral unmixing is possible for the semi-arid mixed grasslands and yields reasonable vegetation fraction estimation.
Caution should be taken when applying the automated spectral unmixing approach, because a close look at the unmixing images suggests a systematic FGVC underestimation (Figure 8a), resulting from the overestimation of water percentage in the mixed pixels. A potential explanation for water overestimation is the contribution of standing vegetation shadows to the unmixing results but not to the field observation data. In the field, the shadows of standing grasses would not contribute to the visual interpretation of the green vegetation cover, and thus the canopy cover will be estimated properly by a field crew. However, the shadows of grasses would contribute to spectral unmixing because shadow spectra are inherent in each mixed pixel, and the shadow spectra are similar to water given lower spectral values of shadow in the red and NIR region. Similarly, Li et al. [45] and Jiang et al. [46] also found that the presence of shadow leads to NDVI saturation, which then results in the overestimation of FVGC.
It is also worth noting that this study only focused on green vegetation cover, so it was not an issue to combine bare soil and litter as one endmember. However, if the goal is to obtain litter abundance or soil coverage, SWIR or the decay pigment index may be added to separate litter and soil [30,47]. Still, attention should be paid to ensure that these endmembers are not correlated. Otherwise, the inversion of the linear spectral mixture model would become unstable, and the estimated fractions would be highly sensitive to random error [48,49]. It has been advised that an appropriate spectral mixing space is required to avoid endmember collinearity and multi-collinearity, to further improve the quality of spectral unmixing [37].
The study showed an increasing trend in FGVC in general for badlands and uplands in the study area. The results are consistent with previous studies; for example, Ju and Masek [50] found a greening trend from 1984 to 2012 using Landsat in Canadian grasslands in Southern Saskatchewan. In our study site, however, the FGVC in the riparian zone has shown a slight negative trend over the years. The different trends in different landscape units are likely a result of different plant communities and their various sensitivities to climatic conditions, especially precipitation. Native grass-dominated uplands and badlands are more likely dependent on precipitation (Table 2), while the riparian zone with more tall shrubs and dense invasive vegetation is not as sensitive to the precipitation as grass, especially to 3-day precipitation. Similarly, Flanagan etc. also suggested that grasslands respond greatly to annual precipitation variation [51], and they further indicated that the responses are not even. Knapp and Smith found that grasslands experience an increase in productivity in wet years and a reduction during drought years [52].
Only a small portion of the pixels exhibited a significant change in our study area. This is understandable because the area represents the Prairie Grasslands natural region in Canada and has been protected from human activities for decades. The pixels undergoing significant change are likely a result of climate dynamics and natural disturbances. Other than precipitation, moisture has been identified as a limiting factor for plant growth in semi-arid ecosystems like the northern mixed-grass and shortgrass prairie [8], and litter is a critical structural component which conserves moisture. Two other potential factors may have contributed to a decreased green vegetation cover in the riparian zone by reducing litter amount and further leading to lower soil moisture. The first is that the GNP reintroduced bison into the park in 2005 [12], and the second is a massive wildfire that occurred in the riparian zone of the study area in 2013 [8]. However, these are only possible explanations, and future work is warranted to confirm this. In specific, longer-term changes (e.g., the past 40 years) and the reasons behind these significant changes need to be further explored.
Other than the different drivers that may contribute to the FGVC trends, the phenological stage when an image is taken could also impact the FGVC values in certain years and further contribute to the trends. We have five images taken from August (1999, 2003, 2008, 2012, 2014), and apparent lower FGVC values in 1999, 2008, and 2012 (Figure 12) could have been a combined result of climate conditions and plants experiencing a different phenological stage. Sonnenschein et al. (2011) also found high variability in vegetation temporal trends in grasslands, and they further indicated that high phenological variability potentially affects a single year’s relationship between different vegetation estimates and leads to varying trends. They suggested that stratifying a study region prior to trend analyses may address the varying trends. Following the advice, we performed a trend analysis over three different landscape units in the study area and did observe a different trend between units. Still, when interpreting our trend analysis results, the readers should keep in mind that phenological stages of varying vegetation communities may have played a role in our trend analysis results.

5. Conclusions

In this study, an automated spectral mixture approach is applied to a series of Landsat images to unmix green vegetation cover for a mixed grassland between 1999 and 2014. The spectral unmixing results correctly reflected the spatial and temporal variations of green vegetation cover in the study area. An increasing trend in FGVC is observed in general for the study area during the period, and this increase is mainly observed in the badlands and uplands, as a result of temporal variation in the short term precipitation. In contrast, a decreasing trend is observed in riparian zone vegetation, likely due to its insensitivity to precipitation. Further research should explore the ways to remove the impact of grass shadows in the spectral unmixing, distinguish bare soil and litter by introducing another endmember, and understand the drivers behind the pixels with a significant decrease in this endangered grassland environment. With precipitation in Canadian prairies predicted to fluctuate under a warmer climate [53], further studies on this topic will be essential to understand the implications of climate dynamics on grassland functions [52].

Author Contributions

Conceptualization, Y.H.; methodology, Y.H., J.Y. and X.G.; software, Y.H. and J.Y.; validation, Y.H.; formal analysis, Y.H.; investigation, Y.H.; resources, Y.H. and X.G.; data collection, Y.H. and X.G.; writing—original draft preparation, Y.H.; writing—review and editing, Y.H., J.Y. and X.G.; visualization, Y.H.; supervision, Y.H. and X.G.; project administration, Y.H. and X.G.; funding acquisition, Y.H. and X.G. All authors have read and agreed to the published version of the manuscript.

Funding

This work was supported by the Natural Sciences and Engineering Research Council of Canada (NSERC) Discovery grants to Yuhong He and Xulin Guo; and the Department of Geography, Geomatics and Environment, the University of Toronto Mississauga under Graduate Expansion Funds.

Acknowledgments

We would like to thank the field crew from Xulin Guo and Yuhong He’s groups for collecting field data over the years and appreciated a few research assistants in Yuhong He’s group who helped with image pre-processing. Thanks also go to Mitchell Bonney in Yuhong He’s group for sharing the R codes for trends analysis.

Conflicts of Interest

The authors declare no conflict of interest.

References

  1. Sala, O.E.; Yahdjian, L.; Havstad, K.; Aguiar, M.R. Rangeland Ecosystem Services: Nature’s Supply and Humans’ Demand; Springer: New York, NY, USA, 2017; pp. 467–489. [Google Scholar]
  2. Ali, I.; Cawkwell, F.; Dwyer, E.; Barrett, B.; Green, S. Satellite remote sensing of grasslands: From observation to management. J. Plant Ecol. 2016, 9, 649–671. [Google Scholar] [CrossRef] [Green Version]
  3. Wimberly, M.C.; Narem, D.M.; Bauman, P.J.; Carlson, B.T.; Ahlering, M.A. Grassland connectivity in fragmented agricultural landscapes of the north-central United States. Biol. Conserv. 2018, 217, 121–130. [Google Scholar] [CrossRef]
  4. Xu, D.; Koper, N.; Guo, X. Quantifying the influences of grazing, climate and their interactions on grasslands using Landsat TM images. Grassl. Sci. 2018, 64, 118–127. [Google Scholar] [CrossRef]
  5. Stuart Chapin, F.; Matson, P.A.; Vitousek, P.M. Principles of Terrestrial Ecosystem Ecology; Springer: New York, NY, USA, 2012; ISBN 9781441995049. [Google Scholar]
  6. Xu, D.; Guo, X. Some insights on grassland health assessment based on remote sensing. Sensors 2015, 15, 3070–3089. [Google Scholar] [CrossRef] [Green Version]
  7. He, Y. The effect of precipitation on vegetation cover over three landscape units in a protected semi-arid grassland: Temporal dynamics and suitable climatic index. J. Arid Environ. 2014, 109, 74–82. [Google Scholar] [CrossRef] [Green Version]
  8. Lu, B.; He, Y.; Tong, A. Evaluation of spectral indices for estimating burn severity in semiarid grasslands. Int. J. Wildland Fire 2016, 25, 147. [Google Scholar] [CrossRef]
  9. He, Y.; Guo, X.; Wilmshurst, J.F. Comparison of different methods for measuring leaf area index in a mixed grassland. Can. J. Plant Sci. 2007, 87, 803–813. [Google Scholar] [CrossRef]
  10. Wong, K.K.; He, Y. Estimating grassland chlorophyll content using remote sensing data at leaf, canopy, and landscape scales. Can. J. Remote Sens. 2013, 39, 155–166. [Google Scholar] [CrossRef]
  11. Ren, H.; Zhou, G. Estimating green biomass ratio with remote sensing in arid grasslands. Ecol. Indic. 2019, 98, 568–574. [Google Scholar] [CrossRef]
  12. He, Y.; Guo, X.; Wilmshurst, J.F. Reflectance measures of grassland biophysical structure. Int. J. Remote Sens. 2009, 30, 2509–2521. [Google Scholar] [CrossRef]
  13. Elmore, A.J.; Mustard, J.F.; Manning, S.J.; Lobell, D.B. Quantifying vegetation change in semiarid environments. Remote Sens. Environ. 2000, 73, 87–102. [Google Scholar] [CrossRef]
  14. He, Y.; Guo, X.; Wilmshurst, J. Studying mixed grassland ecosystems I: Suitable hyperspectral vegetation indices. Can. J. Remote Sens. 2006, 32, 98–107. [Google Scholar] [CrossRef]
  15. Zhang, W.; Yang, X.; Manlike, A.; Jin, Y.; Zheng, F.; Guo, J.; Shen, G.; Zhang, Y.; Xu, B. Comparative study of remote sensing estimation methods for grassland fractional vegetation coverage-A grassland case study performed in Ili prefecture, Xinjiang, China. Int. J. Remote. Sens. 2018, 40, 2243–2258. [Google Scholar] [CrossRef]
  16. Wylie, B.K.; DeJong, D.D.; Tieszen, L.L.; Biondini, M.E. Grassland canopy parameters and their relationships to remotely sensed vegetation indices in the Nebraska Sand Hills. Geocarto Int. 1996, 11, 39–52. [Google Scholar] [CrossRef]
  17. Smith, A.M.; Hill, M.J.; Zhang, Y. Estimating ground cover in the mixed Prairie Grassland of Southern Alberta using vegetation indices related to physiological function. Can. J. Remote Sens. 2015, 41, 51–66. [Google Scholar] [CrossRef]
  18. Paruelo, J.M.; Oesterheld, M.; Di Bella, C.M.; Arzadum, M.; Lafontaine, J.; Cahuepé, M.; Rebella, C.M. Estimation of primary production of subhumid rangelands from remote sensing data. Appl. Veg. Sci. 2000, 3, 189–195. [Google Scholar] [CrossRef] [Green Version]
  19. Zha, Y.; Gao, J.; Ni, S.; Liu, Y.; Jiang, J.; Wei, Y. A spectral reflectance-based approach to quantification of grassland cover from Landsat TM imagery. Remote Sens. Environ. 2003, 87, 371–375. [Google Scholar] [CrossRef]
  20. An, N.; Price, K.P.; Blair, J.M. Estimating above-ground net primary productivity of the tallgrass prairie ecosystem of the Central Great Plains using AVHRR NDVI. Int. J. Remote Sens. 2013, 34, 3717–3735. [Google Scholar] [CrossRef]
  21. Boschetti, M.; Bocchi, S.; Brivio, P.A. Assessment of pasture production in the Italian Alps using spectrometric and remote sensing information. Agric. Ecosyst. Environ. 2007, 118, 267–272. [Google Scholar] [CrossRef]
  22. Numata, I.; Roberts, D.; Chadwick, O.; Schimel, J.; Galvao, L.; Soares, J. Evaluation of hyperspectral data for pasture estimate in the Brazilian Amazon using field and imaging spectrometers. Remote Sens. Environ. 2008, 112, 1569–1583. [Google Scholar] [CrossRef]
  23. Xu, D.; Guo, X.; Li, Z.; Yang, X.; Yin, H. Measuring the dead component of mixed grassland with Landsat imagery. Remote Sens. Environ. 2014, 142, 33–43. [Google Scholar] [CrossRef]
  24. Houborg, R.; Soegaard, H.; Boegh, E. Combining vegetation index and model inversion methods for the extraction of key vegetation biophysical parameters using Terra and Aqua MODIS reflectance data. Remote Sens. Environ. 2007, 106, 39–58. [Google Scholar] [CrossRef]
  25. Baret, F.; Guyot, G. Potentials and limits of vegetation indices for LAI and APAR assessment. Remote Sens. Environ. 1991, 35, 161–173. [Google Scholar] [CrossRef]
  26. Jacquemoud, S.; Verhoef, W.; Baret, F.; Bacour, C.; Zarco-Tejada, P.J.; Asner, G.P.; François, C.; Ustin, S. PROSPECT+SAIL models: A review of use for vegetation characterization. Remote Sens. Environ. 2009, 113, S56–S66. [Google Scholar] [CrossRef]
  27. Zarco-Tejada, P.J.; González-Dugo, V.; Williams, L.E.; Suárez, L.; Berni, J.A.J.; Goldhamer, D.A.; Fereres, E. A PRI-based water stress index combining structural and chlorophyll effects: Assessment using diurnal narrow-band airborne imagery and the CWSI thermal index. Remote Sens. Environ. 2013, 138, 38–50. [Google Scholar] [CrossRef]
  28. Croft, H.; Chen, J.; Zhang, Y.; Simic, A.; Noland, T.L.; Nesbitt, N.; Arabian, J. Evaluating leaf chlorophyll content prediction from multispectral remote sensing data within a physically-based modelling framework. ISPRS J. Photogramm. Remote Sens. 2015, 102, 85–95. [Google Scholar] [CrossRef]
  29. Féret, J.-B.; Gitelson, A.; Noble, S.; Jacquemoud, S. PROSPECT-D: Towards modeling leaf optical properties through a complete lifecycle. Remote Sens. Environ. 2017, 193, 204–215. [Google Scholar] [CrossRef] [Green Version]
  30. Proctor, C.; Lu, B.; He, Y. Determining the absorption coefficients of decay pigments in decomposing monocots. Remote Sens. Environ. 2017, 199, 137–153. [Google Scholar] [CrossRef]
  31. Tong, A.; He, Y. Estimating and mapping chlorophyll content for a heterogeneous grassland: Comparing prediction power of a suite of vegetation indices across scales between years. ISPRS J. Photogramm. Remote Sens. 2017, 126, 146–167. [Google Scholar] [CrossRef]
  32. Yu, W.; Li, J.; Liu, Q.; Zeng, Y.; Zhao, J.; Xu, B.; Yin, G. Global land cover heterogeneity characteristics at moderate resolution for mixed pixel modeling and inversion. Remote Sens. 2018, 10, 856. [Google Scholar] [CrossRef] [Green Version]
  33. Kuemmerle, T.; Röder, A.; Hill, J. Separating grassland and shrub vegetation by multidate pixel-adaptive spectral mixture analysis. Int. J. Remote Sens. 2006, 27, 3251–3271. [Google Scholar] [CrossRef]
  34. Boardman, J.W.; Kruse, F.A.; Green, R.O. Mapping target signatures via partial unmixing of AVIRIS data. In Summaries of JPL Airborne Earth Science Workshop; Jet Propulsion Laboratory: Pasadena, CA, USA, 1995. [Google Scholar]
  35. Roberts, D.A.; Batista, G.T.; Pereira, J.L.G.; Waller, E.K.; Nelson, B.W. Change identification using multitemporal spectral mixture analysis: Applications in Eastern Amazonia. In Remote Sensig Change Detection Environmental Monitoring Methods and Applications; Taylor & Francis: London, UK, 1999; ISBN 0748408614. [Google Scholar]
  36. Small, C. High spatial resolution spectral mixture analysis of urban reflectance. Remote Sens. Environ. 2003, 88, 170–186. [Google Scholar] [CrossRef]
  37. Yang, J.; He, Y.; Oguchi, T. An endmember optimization approach for linear spectral unmixing of fine-scale urban imagery. Int. J. Appl. Earth Obs. Geoinf. 2014, 27, 137–146. [Google Scholar] [CrossRef]
  38. Yang, J.; He, Y. Automated mapping of impervious surfaces in urban and suburban areas: Linear spectral unmixing of high spatial resolution imagery. Int. J. Appl. Earth Obs. Geoinf. 2017, 54, 53–64. [Google Scholar] [CrossRef]
  39. Parks Canada Grasslands National Park. Weather. Available online: https://www.pc.gc.ca/en/pn-np/sk/grasslands/visit/meteo-weather (accessed on 11 November 2020).
  40. Okin, G.S. Relative spectral mixture analysis-A multitemporal index of total vegetation cover. Remote Sens. Environ. 2007, 106, 467–479. [Google Scholar] [CrossRef]
  41. Graham, R.L. An efficient algorith for determining the convex hull of a finite planar set. Inf. Process. Lett. 1972, 1, 132–133. [Google Scholar] [CrossRef]
  42. Yang, J.; He, Y.; Weng, Q. An Automated method to parameterize segmentation scale by enhancing intrasegment homogeneity and intersegment heterogeneity. IEEE Geosci. Remote Sens. Lett. 2015, 12, 1282–1286. [Google Scholar] [CrossRef]
  43. Bonney, M.T.; Danby, R.; Treitz, P.M. Landscape variability of vegetation change across the forest to tundra transition of central Canada. Remote Sens. Environ. 2018, 217, 18–29. [Google Scholar] [CrossRef] [Green Version]
  44. R Development Core Team 3.0.1. A Language and Environment for Statistical Computing; R Foundation for Statistical Computing: Vienna, Austria, 2013. [Google Scholar]
  45. Li, F.; Chen, W.; Zeng, Y.; Zhao, Q.; Wu, B. Improving estimates of grassland fractional vegetation cover based on a pixel dichotomy model: A case study in inner Mongolia, China. Remote Sens. 2014, 6, 4705–4722. [Google Scholar] [CrossRef] [Green Version]
  46. Jiang, Z.; Huete, A.R.; Chen, J.; Chen, Y.; Li, J.; Yan, G.; Zhang, X. Analysis of NDVI and scaled difference vegetation index retrievals of vegetation fraction. Remote Sens. Environ. 2006, 101, 366–378. [Google Scholar] [CrossRef]
  47. Asner, G.P.; Lobell, D. A Biogeophysical approach for automated SWIR unmixing of soils and vegetation. Remote Sens. Environ. 2000, 74, 99–112. [Google Scholar] [CrossRef]
  48. Van Der Meer, F.; De Jong, S.; De Jong, S.M. Improving the results of spectral unmixing of Landsat Thematic Mapper imagery by enhancing the orthogonality of end-members. Int. J. Remote Sens. 2000, 21, 2781–2797. [Google Scholar] [CrossRef]
  49. Van Der Meer, F.D.; Jia, X. Collinearity and orthogonality of endmembers in linear spectral unmixing. Int. J. Appl. Earth Obs. Geoinf. 2012, 18, 491–503. [Google Scholar] [CrossRef]
  50. Ju, J.; Masek, J.G. The vegetation greenness trend in Canada and US Alaska from 1984–2012 Landsat data. Remote Sens. Environ. 2016, 176, 1–16. [Google Scholar] [CrossRef]
  51. Flanagan, L.B.; Wever, L.A.; Carlson, P.J. Seasonal and interannual variation in carbon dioxide exchange and carbon balance in a northern temperate grassland. Glob. Chang. Biol. 2002, 8, 599–615. [Google Scholar] [CrossRef]
  52. Knapp, A.K. Variation among biomes in temporal dynamics of aboveground primary production. Science 2001, 291, 481–484. [Google Scholar] [CrossRef] [PubMed] [Green Version]
  53. Cutforth, H.W.; McConkey, B.G.; Woodvine, R.J.; Smith, D.G.; Jefferson, P.G.; Akinremi, O.O. Climate change in the semiarid prairie of southwestern Saskatchewan: Late winter-early spring. Can. J. Plant Sci. 1999, 79, 343–350. [Google Scholar] [CrossRef]
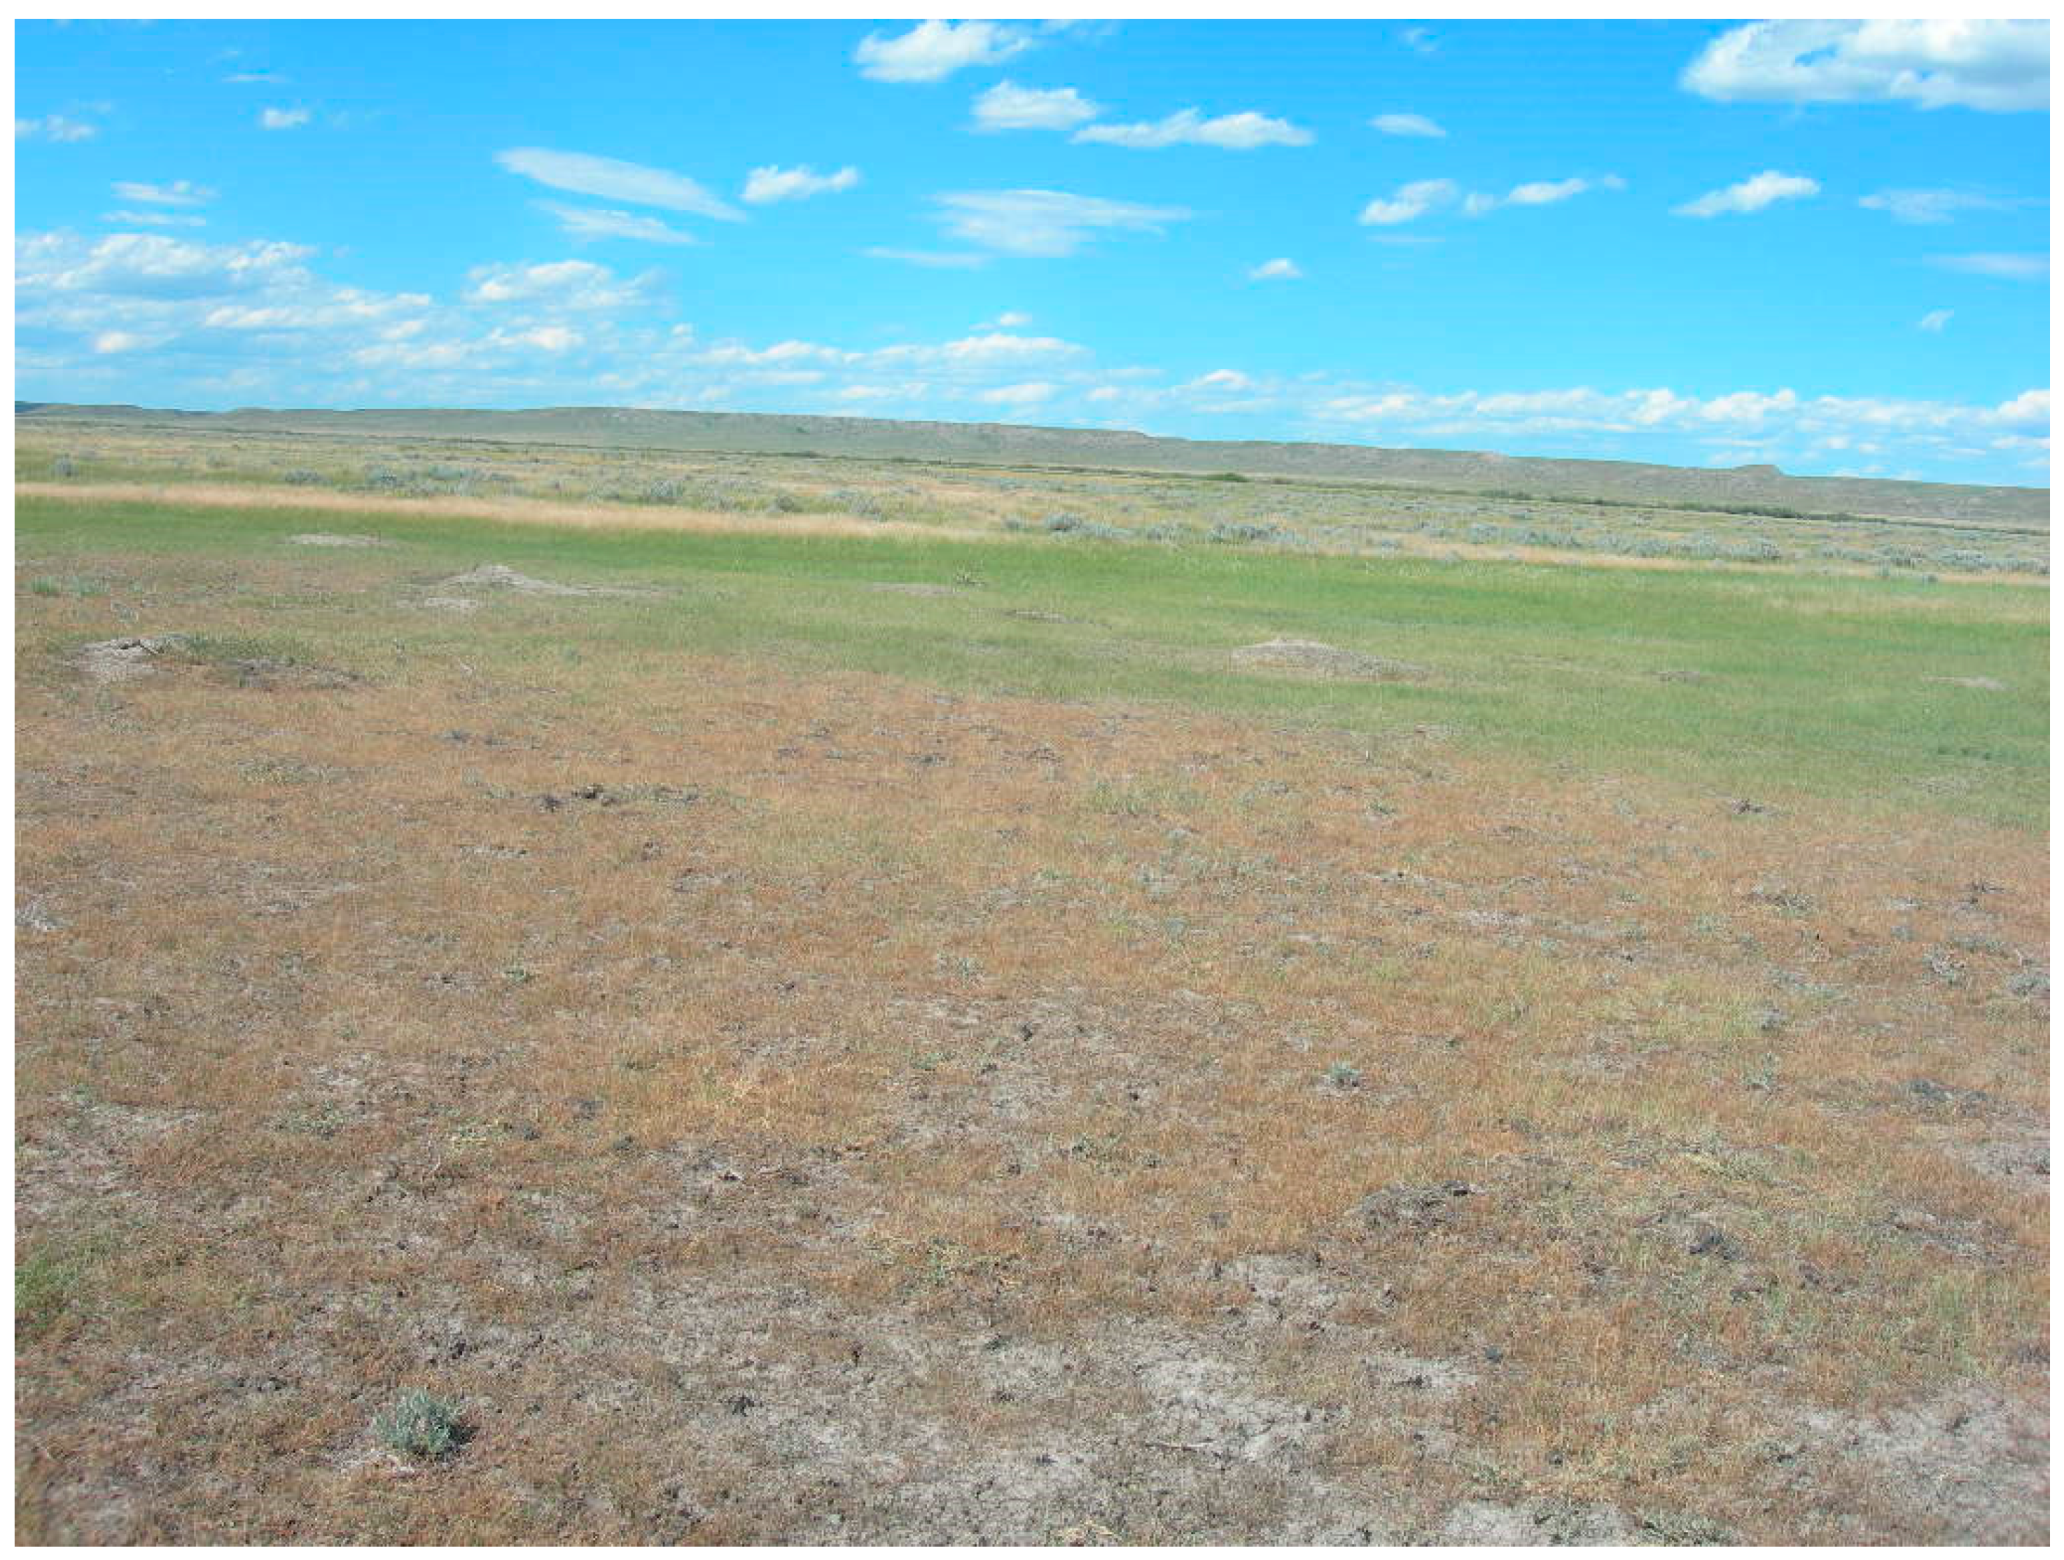
Figure 1. A typical mixed grassland scene with exposed soil, photosynthetic grass, and non-photosynthetic grass.
Remotesensing 12 03826 g001
Figure 2. Study area is located in the West Block of the Grasslands National Park, Saskatchewan, Canada. (ac) are photos were taken from badlands, upland grassland, and riparian grassland areas, respectively.
Remotesensing 12 03826 g002
Figure 3. Flowchart of methodology.
Remotesensing 12 03826 g003
Figure 4. Geometric interpretation of the mixture problem in a two-dimensional space using field-collected hyperspectral data; (a) field observed spectra curves of typical ground features including vegetation, litter, soil, water, and a mixed canopy; (b) point cloud plotted from field spectral simulated Landsat Thematic Mapper (TM) red and near-infrared (NIR) bands for the typical ground features (vertexes forming a triangle shade) and for all field-collected plot spectra (black dots).
Remotesensing 12 03826 g004
Figure 5. An illustration of a translated pixel cloud triangle in the 2-dimensional spectral mixing space constructed by the red and NIR band. EMV, EMS, and EMW represent the endmembers of vegetation, bare soil/litter, and water, respectively.
Remotesensing 12 03826 g005
Figure 6. Example two-dimensional image feature spaces constructed from Red and NIR bands (a) Landsat 5 image collected from the study area on 14 July 2005; (b) Landsat 5 image collected from the study area on 15 July 2011.
Remotesensing 12 03826 g006
Figure 7. An example spectral unmixing results from the west block of Grasslands National Park (GNP) using Landsat image acquired from 15 July 2011. (ac) are unmixed fractional green vegetation cover (FGVC), bare soil/litter, and water.
Remotesensing 12 03826 g007
Figure 8. The relationship between unmixed green fraction and 70% of observed green vegetation cover (a), and the relationship between predicted green vegetation cover and the remaining 30% of observed green vegetation cover (b).
Remotesensing 12 03826 g008
Figure 9. The unmixed FGVC maps from each year, and the FGVC prediction accuracy is also listed for the year with field data.
Remotesensing 12 03826 g009
Figure 10. Two spectral unmixing green vegetation cover maps using Landsat images acquired from 15 July 2005 (a,a1 from a dry year) and 15 July 2011 (b,b1 from a wet year).
Remotesensing 12 03826 g010
Figure 11. FGVC trend over the study period (a) and their significant level (b).
Remotesensing 12 03826 g011
Figure 12. The unmixed FGVC extracted from typical badlands, typical riparian zone, and typical uplands from 1999 to 2014, their linear regression trend lines (a), and the total precipitation from the last three days to the last month before the images were taken and the last three-day total precipitation linear regression trend line (b).
Remotesensing 12 03826 g012
Table 1. Field campaigns, field sites, and Landsat images used.
Year of Field CampaignsNo. of Sites SurveyedLandsat Images Used
Acquisition DateSensor
23-August-1999L7
8-July-2000L7
27-July-2001L7
20-June-2002L5
20031210-August-2003L5
20054014-July-2005L5
20062217-July-2006L5
4-July-2007L5
23-August-2008L5
23-June-2009L5
2010826-June-2010L5
2011615-July-2011L5
2012182-August-2012L5
2013124-July-2013L8
8-August-2014L8
Table 2. Correlations between the unmixed FGVC and total precipitation from the last 3 days to the last month before the images were taken.
Total Precipitation (mm)
Last 3 Days Last WeekLast 2 WeeksLast 3 WeeksLast Month
Badland FGVC0.450.300.350.190.18
Upland FGVC0.64 *0.57 *0.290.270.33
Riparian FGVC0.370.460.150.190.26
* Indicating significance at 0.05 level.
Publisher’s Note: MDPI stays neutral with regard to jurisdictional claims in published maps and institutional affiliations.