Article

Thirty Years of Land Cover and Fraction Cover Changes over the Sudano-Sahel Using Landsat Time Series

1
Remote Sensing Unit, Flemish Institute for Technological Research (VITO), Boeretang 200, 2400 Mol, Belgium
2
Department of Geosciences and Natural Resource Management, University of Copenhagen, ster Voldgade 10, 1350 Copenhagen, Denmark
3
CAVELab Computational and Applied Vegetation Ecology, Faculty of Bioscience Engineering, Ghent University, Coupure links 653, 9000 Gent, Belgium
4
Laboratory of Geo-Information Science and Remote Sensing, Wageningen University, Droevendaalsesteeg 3, 6708 PB Wageningen, The Netherlands
5
Division Forest, Nature and Landscape, KU Leuven, Celestijnenlaan 200E, 3001 Heverlee, Belgium
*
Author to whom correspondence should be addressed.
Remote Sens. 2020, 12(22), 3817; https://doi.org/10.3390/rs12223817
Submission received: 28 September 2020 / Revised: 13 November 2020 / Accepted: 17 November 2020 / Published: 20 November 2020

Abstract

:
Historical land cover maps are of high importance for scientists and policy makers studying the dynamic character of land cover change in the Sudano-Sahel, including anthropogenic and climatological drivers. Despite its relevance, an accurate high resolution record of historical land cover maps is currently lacking over the Sudano-Sahel. In this study, 30 m resolution historically consistent land cover and cover fraction maps are provided over the Sudano-Sahel for the period 1986–2015. These land cover/cover fraction maps are achieved based on the Landsat archive preprocessed on Google Earth Engine and a random forest classification/regression model, while historical consistency is achieved using the hidden Markov model. Using these historical maps, a multitude of variability in the dynamic Sudano-Sahel region over the past 30 years is revealed. On the one hand, Sahel-wide cropland expansion and the re-greening of the Sahel is observed in the discrete land cover classification. On the other hand, subtle changes such as forest degradation are detected based on the cover fraction maps. Additionally, exploiting the 30 m spatial resolution, fine-scale changes, such as smallholder or subsistence farming, can be detected. The historical land cover/cover fraction maps presented in this study are made available via an open-access platform.

Graphical Abstract

1. Introduction

The Sudano-Sahel is a region of particular interest regarding land cover and vegetation dynamics as high climatic variability is present in the region, which impacts both livelihoods and ecosystems. Land cover changes can therefore serve as an early sign of climate change. The Sudano-Sahel forms the transition zone between the dry Sahara in the north and tropical areas towards the south. It therefore comprises a high number of distinct eco-regions [1]. The northern part consists of grassland planes with patchy bushes, while more to the south, perennial grasses and woodland are common [2]. Additionally, the region is characterized by a high amount of landscape fragmentation including small agricultural fields and crop/fallow rotation cycles [3,4], both of which represent a real challenge for robust land cover mapping [5]. The Sahel gained specific attention in the 1980s as extreme droughts severely impacted vegetation. The area was considered to be under the imminent threat of desertification in the future [6]. Nevertheless, many studies indicated that since this period, the Sahel experienced significant re-greening, showing the resilient character of the region [7,8] and the existence of so-called turning points in the region [9]. Besides the influence of climatology, anthropogenic activities also strongly affect land cover and vegetation. Population increases led for example to higher demands for wood, agricultural lands, and livestock grazing areas [10,11,12,13]. Furthermore, a large portion of these anthropogenic-induced changes occur at a local scale (e.g., typical fine-scale farming) [14]. It is clear that both natural influences and human(-induced) activities are responsible for a large amount of land cover and vegetation changes over the Sudano-Sahel [15].
In order to correctly interpret land cover changes over the Sudano-Sahel, records of vegetation characteristics and land cover need to be available. In the past, an important source of information came from aerial photographs and field measurements [7,11]. However, long-term consistent observations for broad areas remain scarce. Satellite remote sensing has been a major source of information regarding the detection of vegetation dynamics since the 1970s. Landsat, AVHRR, and MODIS, among others, have provided long-term records of reflectance data on a global scale [16]. These datasets have been used to detect changes in tree cover and different species [17,18,19], agricultural expansion [20], or grassland dynamics [21] over the Sahel.
Due to the rise in the number of (publicly available) Earth observation records and the increase in computer power resources, discrete land cover maps have become increasingly available for different regions around the world at high resolution. At the global scale, one of the first land cover maps was produced using MODIS satellite data at a 500 m spatial resolution, offering yearly independent products [22]. The yearly European Space Agency (ESA) Climate Change Initiative (CCI) and Copernicus Climate Change Service (C3S) land cover maps have a 300 m spatial resolution targeting the climate community, which is reflected in the discrete classes that are offered [23]. The yearly Copernicus Global Land Service Land Cover maps (CGLS-LC100) at 100 m resolution attained a high overall accuracy of 80% [24], while lately, also global maps at 10 m and 30 m resolution are produced, attaining however a lower overall accuracy [25,26,27]. One of the main advantages of the CGLS-LC100 map of [24] is the fact that it also presents cover fractions at the pixel level. This allows users to make their own interpretation of the discrete class and to detect more subtle variability in land cover.
Dynamic land cover products at high spatial and temporal resolution are of high interest to the public, policy makers, and scientists (e.g., as input for vegetation models). However, a high variability in land cover products is currently present, and inconsistent spatial-temporal land cover change is a major problem when producing independent land cover maps for distinct time periods [28]. Small differences in image quality, the classification algorithm, and the definition of distinct classes may lead to inconsistencies [29]. In order to increase the quality of multi-temporal land cover maps, spatio-temporal cleaning is advised as a post-processing step. Several methodologies focus on discriminating real from false land cover changes. Examples are break-detection methods such as Breaks For Additive Seasonal and Trend (BFAST) [30] or the Continuous Change Detection and Classification (CCDC) algorithm [31]. Other change detection models are based on probabilistic models, such as the hidden Markov model or Markov random fields, which can take both spatial and temporal context into account [32,33]. Most of these algorithms focus on regions of limited area [28] or are used to detect the dynamical character of one specific land cover class [34]. Hermosilla et al. [35] for example applied the hidden Markov model on Canada to obtain annual forest cover maps for the years 1984 to 2012, achieving good results.
Currently, robust land cover (change) maps at high spatial resolution focusing on the Sudano-Sahel region are lacking. This is mainly attributed to the fragmented nature of land cover and the dynamic character of the region, which makes land cover (change) detection challenging [5]. This is reflected in several mapping efforts in the past, revealing high disagreements over the Sudano-Sahel region [36]. Furthermore, historical mapping efforts at high resolution are lacking over the region. The goal of this study is to present a new set of consistent long-term land cover and cover fractions products at 30 m resolution for the period 1986–2015. These are the first dynamically consistent high resolution land cover maps that retrace the history of Sudano-Sahelian land cover changes over the past 30 years, obtained using traditional land cover mapping techniques. A large added value of our approach is the fact that cover fraction maps are created, which allow to detect more subtle land cover variability and changes that have not been captured by the discrete land cover classification algorithm. All together, these new products have the potential to become key sources of information for scientists and policy-makers studying land cover dynamics over the region.
First, a high resolution land cover map for the Sudano-Sahel for the year 2015 at a spatial resolution of 30 m is presented. Additionally, for each land cover class, continuous cover fraction maps are made available. Second, for four focal areas covering a broad part of the Sudano-Sahel, the same set of maps is produced for selected years in the period 1986–2015. To remove spurious class transitions between multiple years caused by the independent mapping for each time period, the land cover maps are post-processed using the hidden Markov model. A comparison between the observed land cover (trends) in this study and other works is provided.

2. Materials and Methods
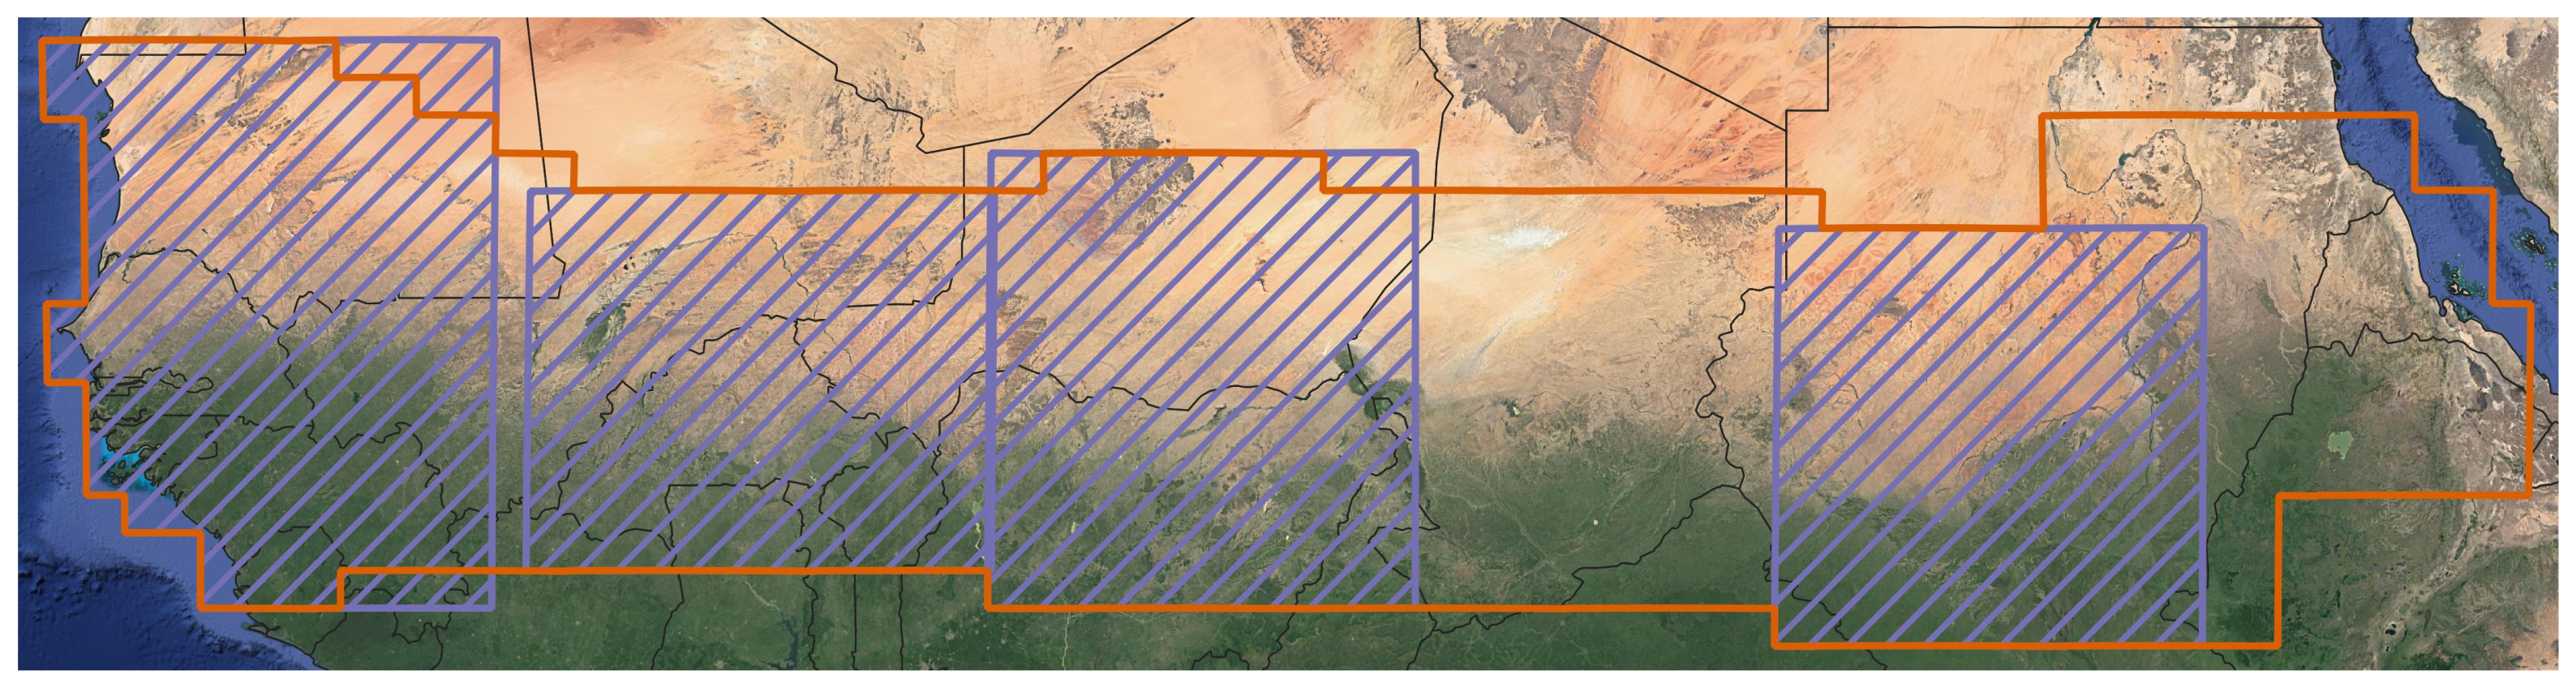
2.1. Study Area

Our study area comprises a broad part of the Sudano-Sahelian zone [16] and constitutes the transitional zone between the dry Sahara and the tropical rain forest (Figure 1). The area is characterized by a dry (boreal winter) and wet (boreal summer) season, and precipitation increases from north to south. Furthermore, fine-scale and subsistence farming are present over the region [37], while land cover is highly influenced by both climatological and anthropogenic variability, making it profoundly difficult to perform land cover classification [5]. Four focal areas are defined for which historical maps are produced (Figure 1). These focal areas were selected based on the following criteria:
  • The areas are characterized by known historical land cover changes induced by climatological and anthropogenic influences.
  • Abrupt changes or turning points in land cover (i.e., when the functioning of an ecosystem changes significantly, but not necessarily in an irreversible manner [38]) were identified over the areas in the past [9].
  • The areas have a substantial amount of field and satellite observations available (see also Section 2.2).
Figure 1. 2015 land cover and cover fraction map extent (brown) and definition of the four focal areas (denoted in the rest of this manuscript from west to east as: Senegal, Burkina Faso, Nigeria-Niger, Sudan) for which historical maps are produced (purple). Google Satellite Imagery is used as the background.
Remotesensing 12 03817 g001

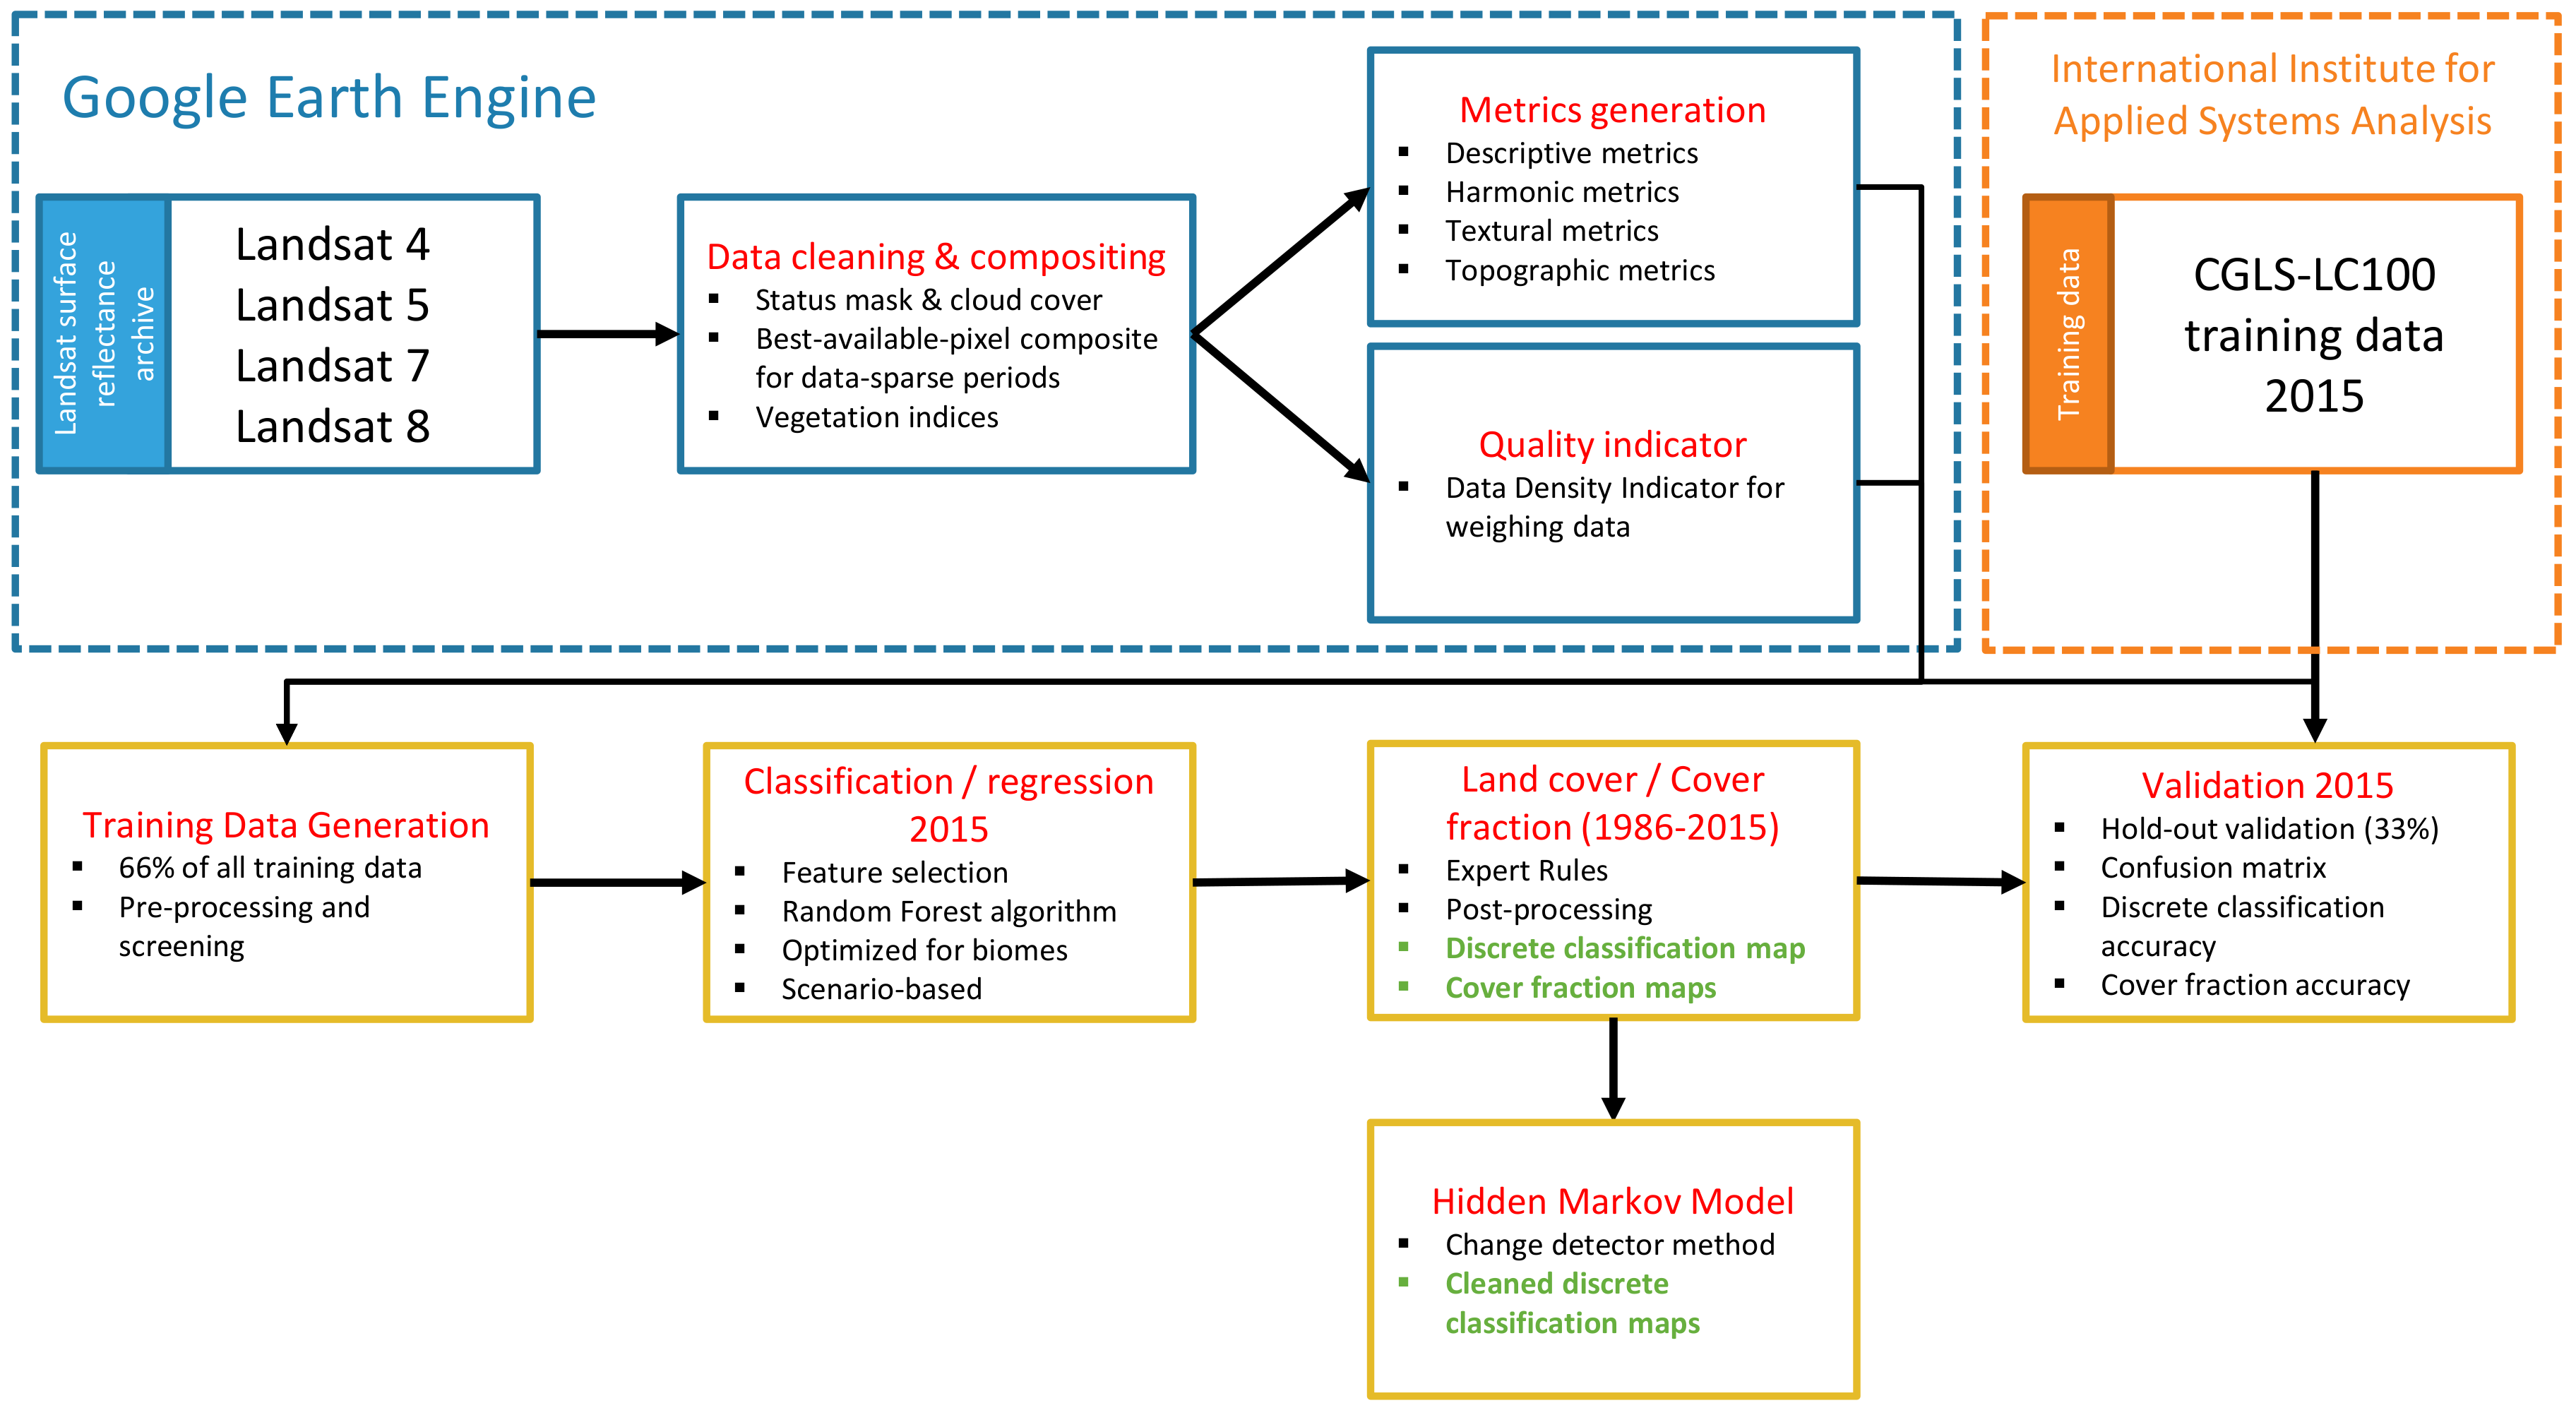
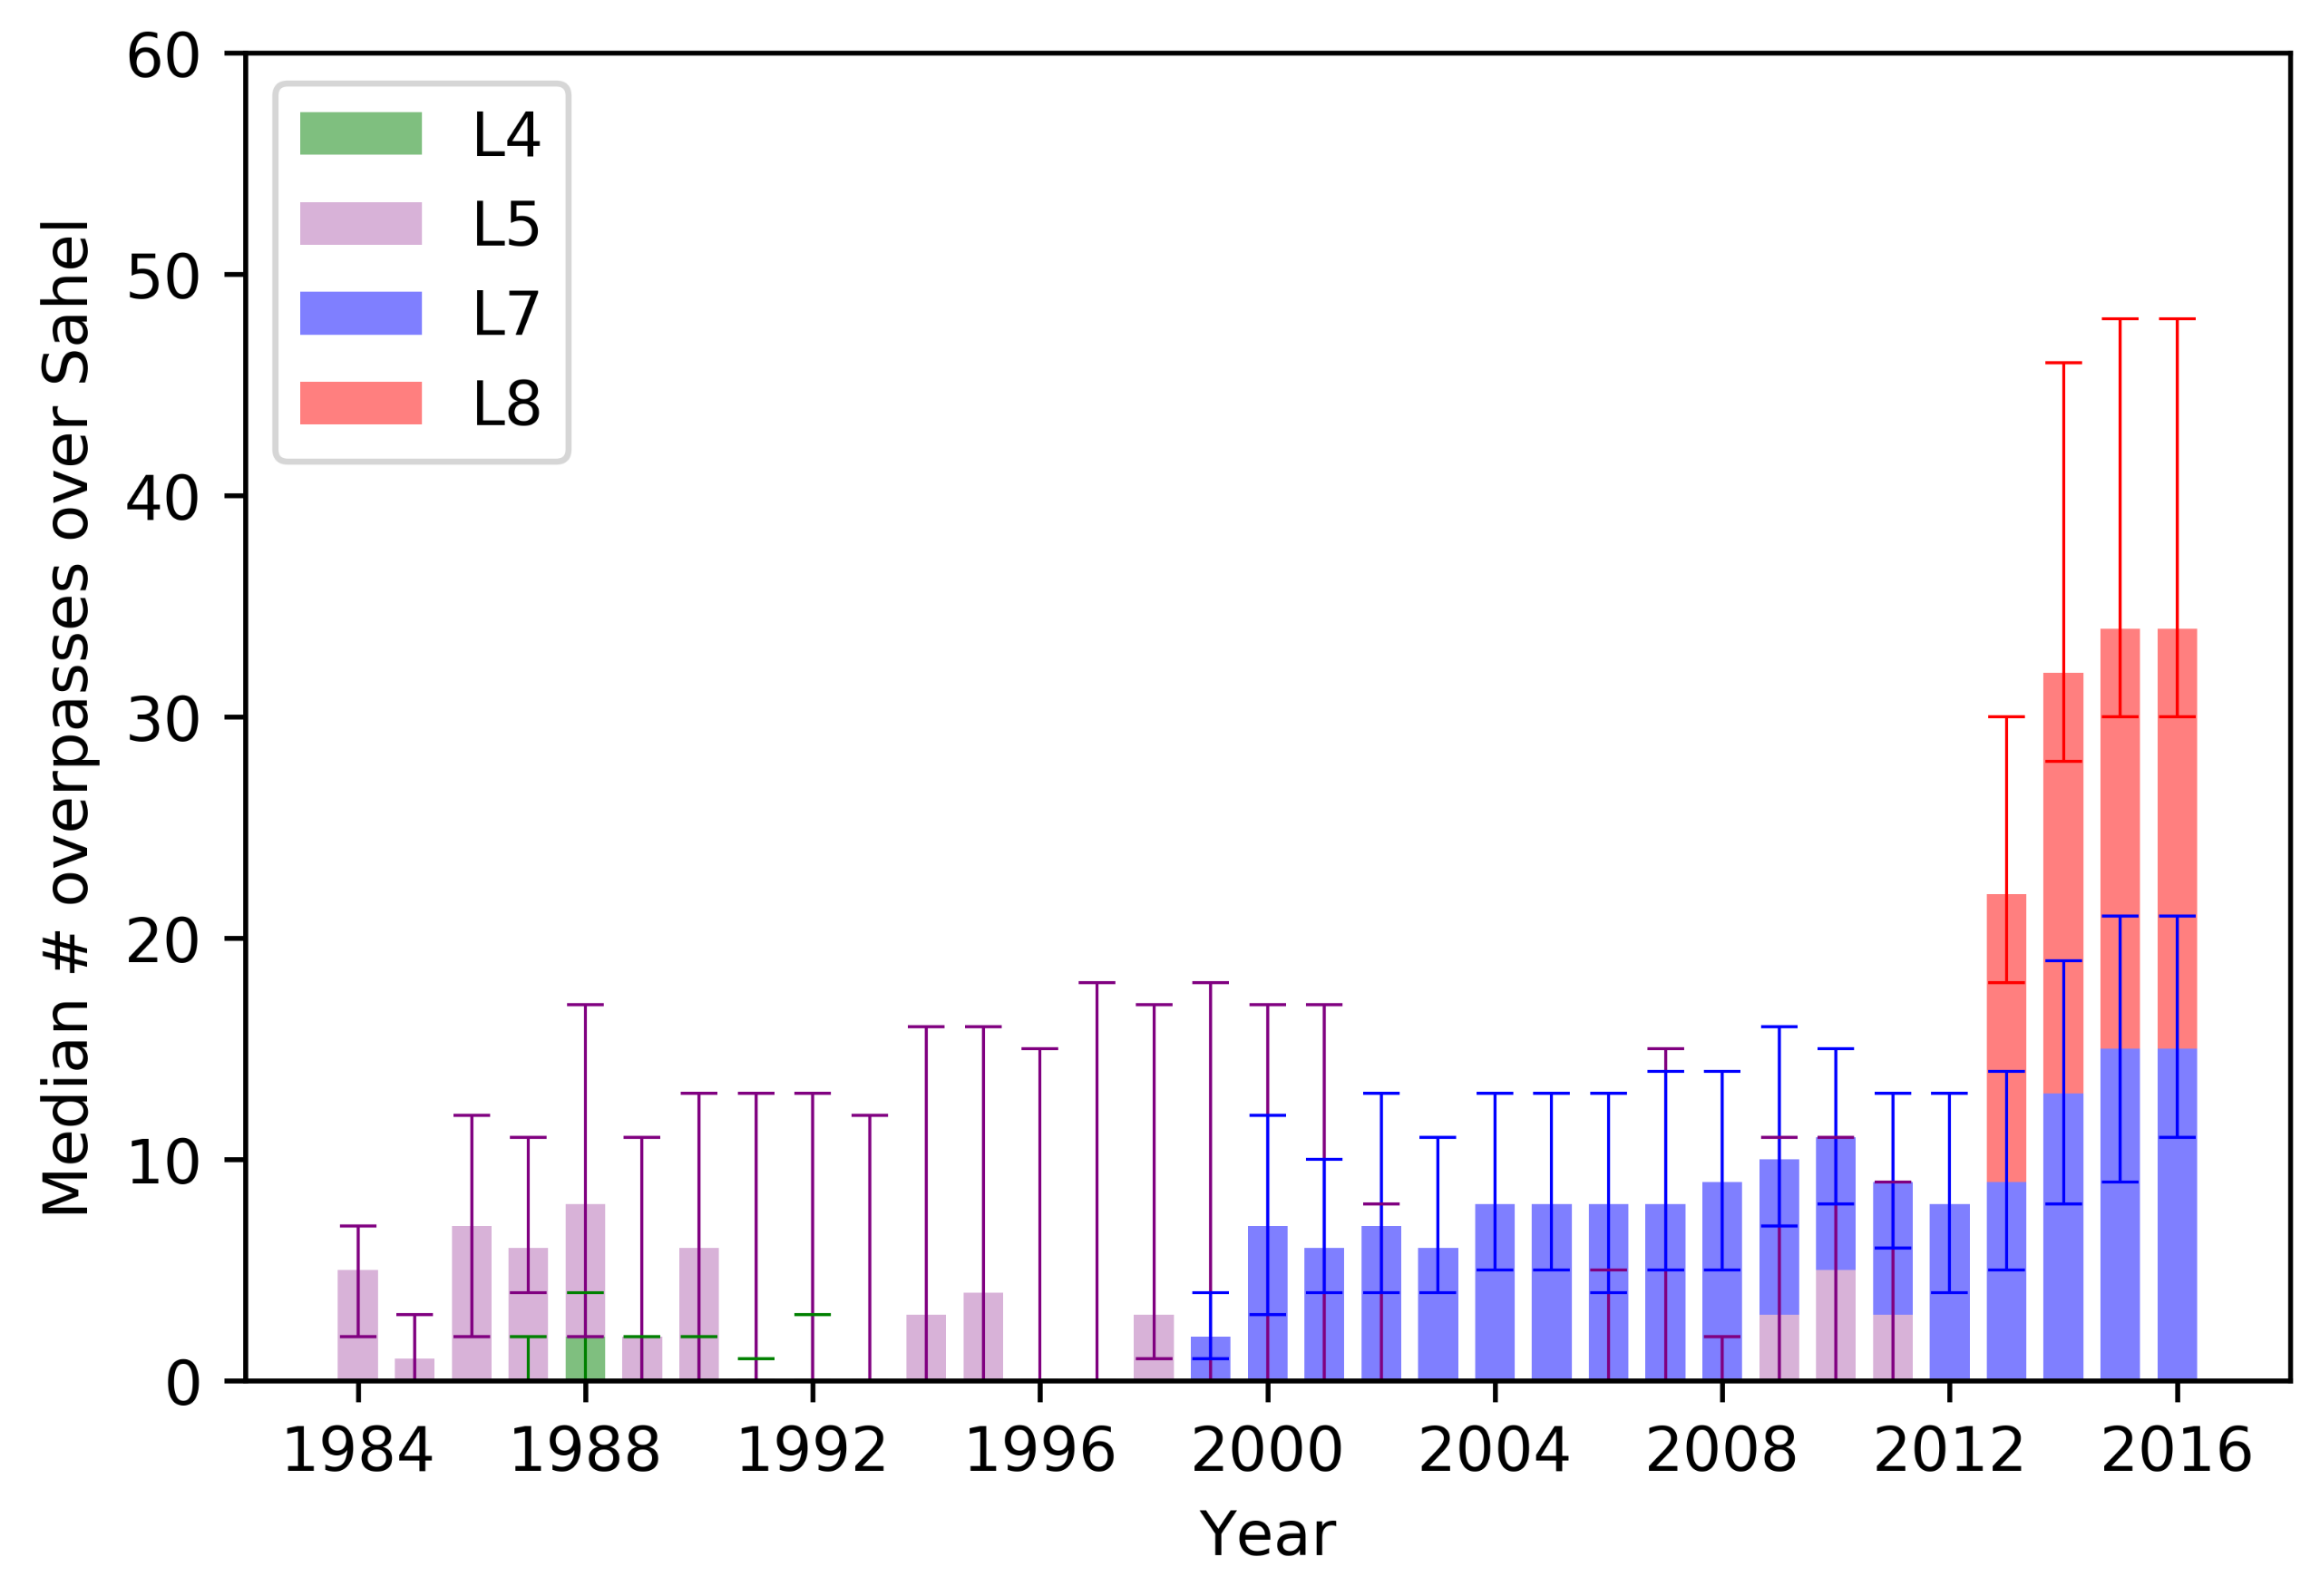
2.2. Landsat Data and Pre-Processing

The workflow described in these methodological sections is a regional Landsat-adapted version of the CGLS-LC100 land cover classification algorithm as described in Buchhorn et al. [24]. In the sections below, we summarize this methodology and indicate the changes that have been implemented for regional land cover mapping with Landsat. A detailed overview of the original approach can be found in Buchhorn et al. [39].
Since the opening of the Landsat archive to the public, the number of land cover studies using these data products has increased significantly [40]. In this study, we use Collection 1 Tier 1 surface reflectance data of Landsat 4, 5, 7, and 8 for the period 1984–2015 provided by the United States Geological Survey (USGS) and available on the Google Earth Engine [41]. This Landsat archive was processed to a Level-1 precision, terrain- and atmospherically-corrected product, while cloudy and cloud shadow pixels were flagged by the internal C Function of Mask (CFMASK) algorithm. Several pre-processing steps were executed on the data (see also Figure 2). Firstly, the differences in sensor characteristics between Landsat satellites were corrected following the strategy of Roy et al. [42]. Secondly, by using the spectral information of Landsat, several vegetation indices were calculated (a full list can be found in Appendix A). For each of these spectral bands and indices, descriptive metrics (mean, median, 10th and 90th percentile, and the 10th–90th percentile range), harmonic metrics based on the Harmonic ANalysis of Time Series (HANTS) algorithm using a Fourier transformation [43], textural metrics (the uniformity of a pixel compared to its neighbors), and topographic metrics are calculated and used as the input for our classification algorithm [24]; see also Appendix A. In order to obtain correct harmonic metrics, all calculations were performed on three year epochs (e.g., calculations for 2015 include data from 2014–2016). Lastly, a data quality indicator was calculated based on the amount of cloud-free satellite overpasses for each of the time periods (Figure 2).
The availability of Landsat satellite data increased substantially over the Sudano-Sahel since the launch of Landsat 8 (Figure 3). Before 2013, the amount of satellite overpasses was much lower (10 or less cloud-free overpasses per year over the Sudano-Sahel). The failure of the scan line corrector of Landsat 7 further decreased the number of qualitative images for the period 2003–2013 [44]. In order to account for the lack of data during the pre-Landsat 8 era (i.e., 1984–2012), the best available pixel approach of White et al. [45] was applied, which has been proven to be an accurate method for change detection studies over areas with limited amounts of cloud-free Landsat data [46]. Multi-annual composites were generated for both the dry (December, January, February) and wet (June, July, August) season, and five year epochs were used for the periods before 2013 to counter the lack of data (e.g., calculations for 2000 include data from 1998–2002). As the lack of dense gap-free data prohibits the calculation of harmonic metrics, only descriptive, textural, and topographic metrics were computed for all spectral bands and vegetation indices for these time periods. During 1990–2000, a broad part of the Sudano-Sahel was not covered by Landsat satellite acquisitions (Figure 3; a spatial interpretation of the amount of cloud-free Landsat overpasses can be found in Appendix B). This low amount of satellite overpasses limits the number of maps created for the pre-2000 era as a minimum number of satellite overpasses needs to be available to achieve reliable land cover classification/regression. As such, only one pre-2000 map was created for the Senegal and Burkina Faso focal areas, while for Nigeria-Niger, no maps before 2000 are available. A full overview of the historical maps that are provided is given in Table 1.

2.3. Land Cover Classification

This subsection summarizes the different steps in the land cover classification workflow (Figure 2). The random forest supervised machine learning method was used to train a discrete land cover classification model [24]. To correctly predict these discrete classes, accurate training data should be available. Ground-validated data were achieved for the year 2015 from the GEO-Wiki dataset by the International Institute for Applied Systems Analysis (IIASA) [24,47]. 100 m pixels were subdivided into 10 m × 10 m sub-pixels that served as elementary land cover mapping units and were assigned a land cover class. When re-sampled to the Landsat resolution (30 m), this accounted for a total of 37,824 ground-validated points over the Sudano-Sahel for which both a discrete class and cover fractions were available. 67% of these points were used to train the random-forest algorithm, while the remainder was used for validation. These were equally distributed among the different discrete classes. The quality indicator indicates the weight of each point in the training of the classifier by the random forest algorithm.
The classification was optimized per biome [24], which accounts for the various eco-regions within the Sahel [48]. After selecting the best features from the list of metrics, classification models were trained for each biome separately. For each of these eco-regions, distinct classification scenarios were achieved, which were combined with expert rules to obtain an accurate discrete classification (Figure 2 and Buchhorn et al. [39]). Finally, two high resolution ancillary data masks for water and urban were imprinted to account for omission errors within the original classification. These were respectively the Global Surface Water (GSW) dataset of the Joint Research Centre of the European Commission [49] and the World Settlement Footprint (WSF) of the German Aerospace Center [50]. For the latter, no historical information is available. Therefore, for the historical periods, the urban extent of 2015 was imprinted. Using this procedure, discrete maps were obtained. The 2015 map was validated using the pixels that were excluded from the ground-validated point sample (i.e., hold-out validation). Next to the overall accuracy of the discrete classification map, a confusion matrix and Cohen’s Kappa value are provided. A historical update of the urban layers is to be expected soon (WSF Evolution [51]). An update of the maps with historically correct urban extent will be issued as soon as this dataset is released and will be distributed via the open-access channel (https://doi.org/10.5281/zenodo.4013392).

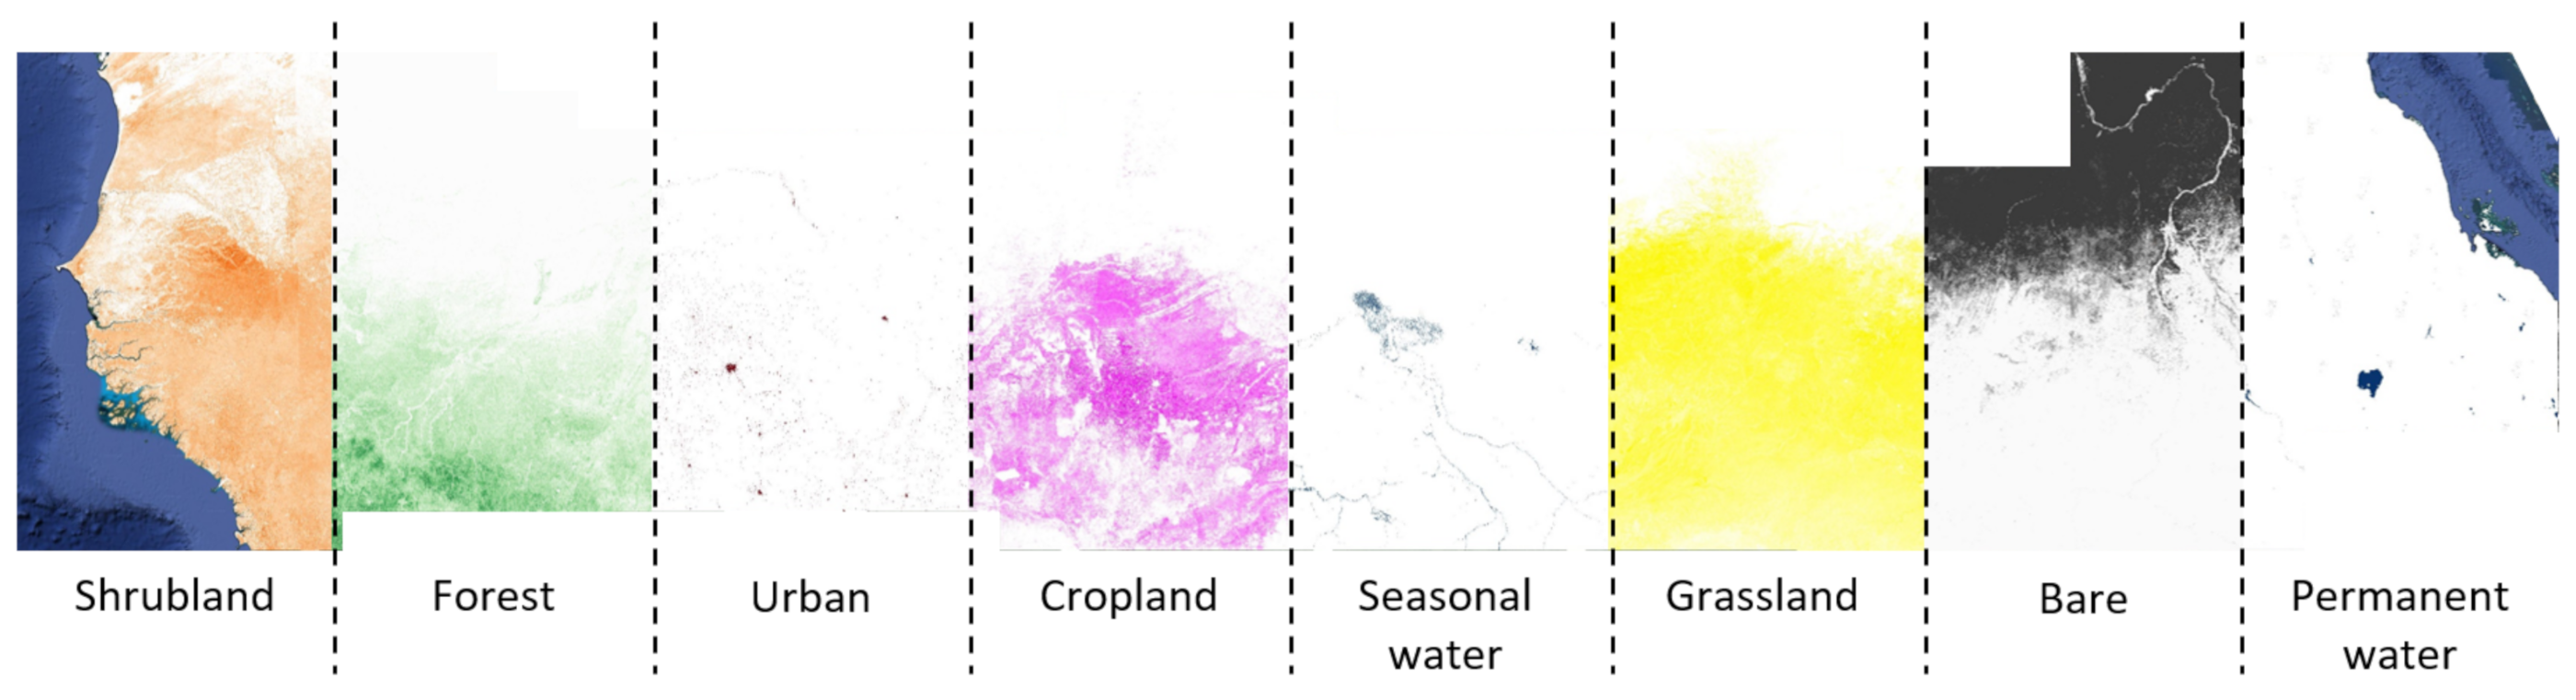
2.4. Cover Fractions

Apart from a discrete land cover classification, the strength of the land cover classification algorithm is the fact that also cover fraction maps are provided. Since each ground-validated data point contains sub-pixel information, for a 30 m training point, information about the fraction of each discrete land cover class is available (e.g., one 30 m training point consists of 33% shrubland and 66% forest). Based on these fractions, random forest regression models were generated, which were used to produce cover fraction maps [24]. Similar to the classification models, for each biome, one regression model was generated to tackle the different characteristics of the eco-regions (Figure 2).
Cover fraction maps were evaluated based on the same hold-out validation sample as used for the classification workflow. The accuracy of the cover fraction maps was quantified using the Mean Absolute Error (MAE) and the Root Mean Squared Error (RMSE) and compared to the results of Buchhorn et al. [24].
Both the random forest classification and regression technique can be applied to achieve land cover/cover fraction maps for the past. Ideally, for each of the historical classification periods/regions, the full ground-validated training sample should be re-evaluated. Due to the large set of training points and time frames, this is unfortunately unfeasible in this study. Some tests with iterative training sample selection [52] were executed, resulting in a strong decrease in accuracy compared to the 2015 map. As such, we opted to also apply the classification and regression models for 2015 on the historical time periods. Since our training sample contained representative samples for all land covers present over the region and seasonal dynamics were accurately captured, these classification and regression models were not expected to significantly lower the accuracy of the historical maps [53].

2.5. Change Detection

In the above setup, the classification of historical periods was executed independent of each other. It is a known problem that change detection is negatively affected by classification errors of individual maps [32]. The hidden Markov model was applied on the full time series of land cover maps in order to improve the temporal consistency of each pixel and reduce the number of inconsistent and spurious changes [28,33]. The hidden Markov model makes use of the Viterbi algorithm, which was found to be the most appropriate approach for change detection [54]. The model was applied to the past starting from the 2015 land cover map classification. In order to account for changes in land cover, a transition probability matrix is provided: for each land cover, the probability of change towards a different land cover class was set to 1%, apart from urban, as we assumed that urban areas only get smaller towards the past. The value of 1% is based on information from previous studies [23,28,35,55]. Last, a covariation matrix between different land cover classes was calculated. This was again done at the biome level.
Based on the sequence of land cover fractions, the transition probability matrix, and the covariation matrix, the most likely land cover class for each time period was inferred. This resulting time series was used for break detection, i.e., when a change in the land cover time series was observed, it only propagated in the final time series product when the original product also detected a change. This way, the area-specific expert rules and post-processing steps executed in the original classification were not impacted by the hidden Markov model time sequence.
It is noteworthy that the hidden Markov model was applied on the full time series, assuming equal distances between the different time periods. As we only provide yearly maps for the years 2010–2015, while for earlier periods, only about every five years, a map is offered, it is mainly useful for the years 2010–2015, where we see many spurious changes in the original land cover maps. For the periods before 2010, the main strength of the hidden Markov model is to discard land cover changes caused by a lack of Landsat overpasses. The latter should be considered for the specific areas of study in which users are interested.

3. Results

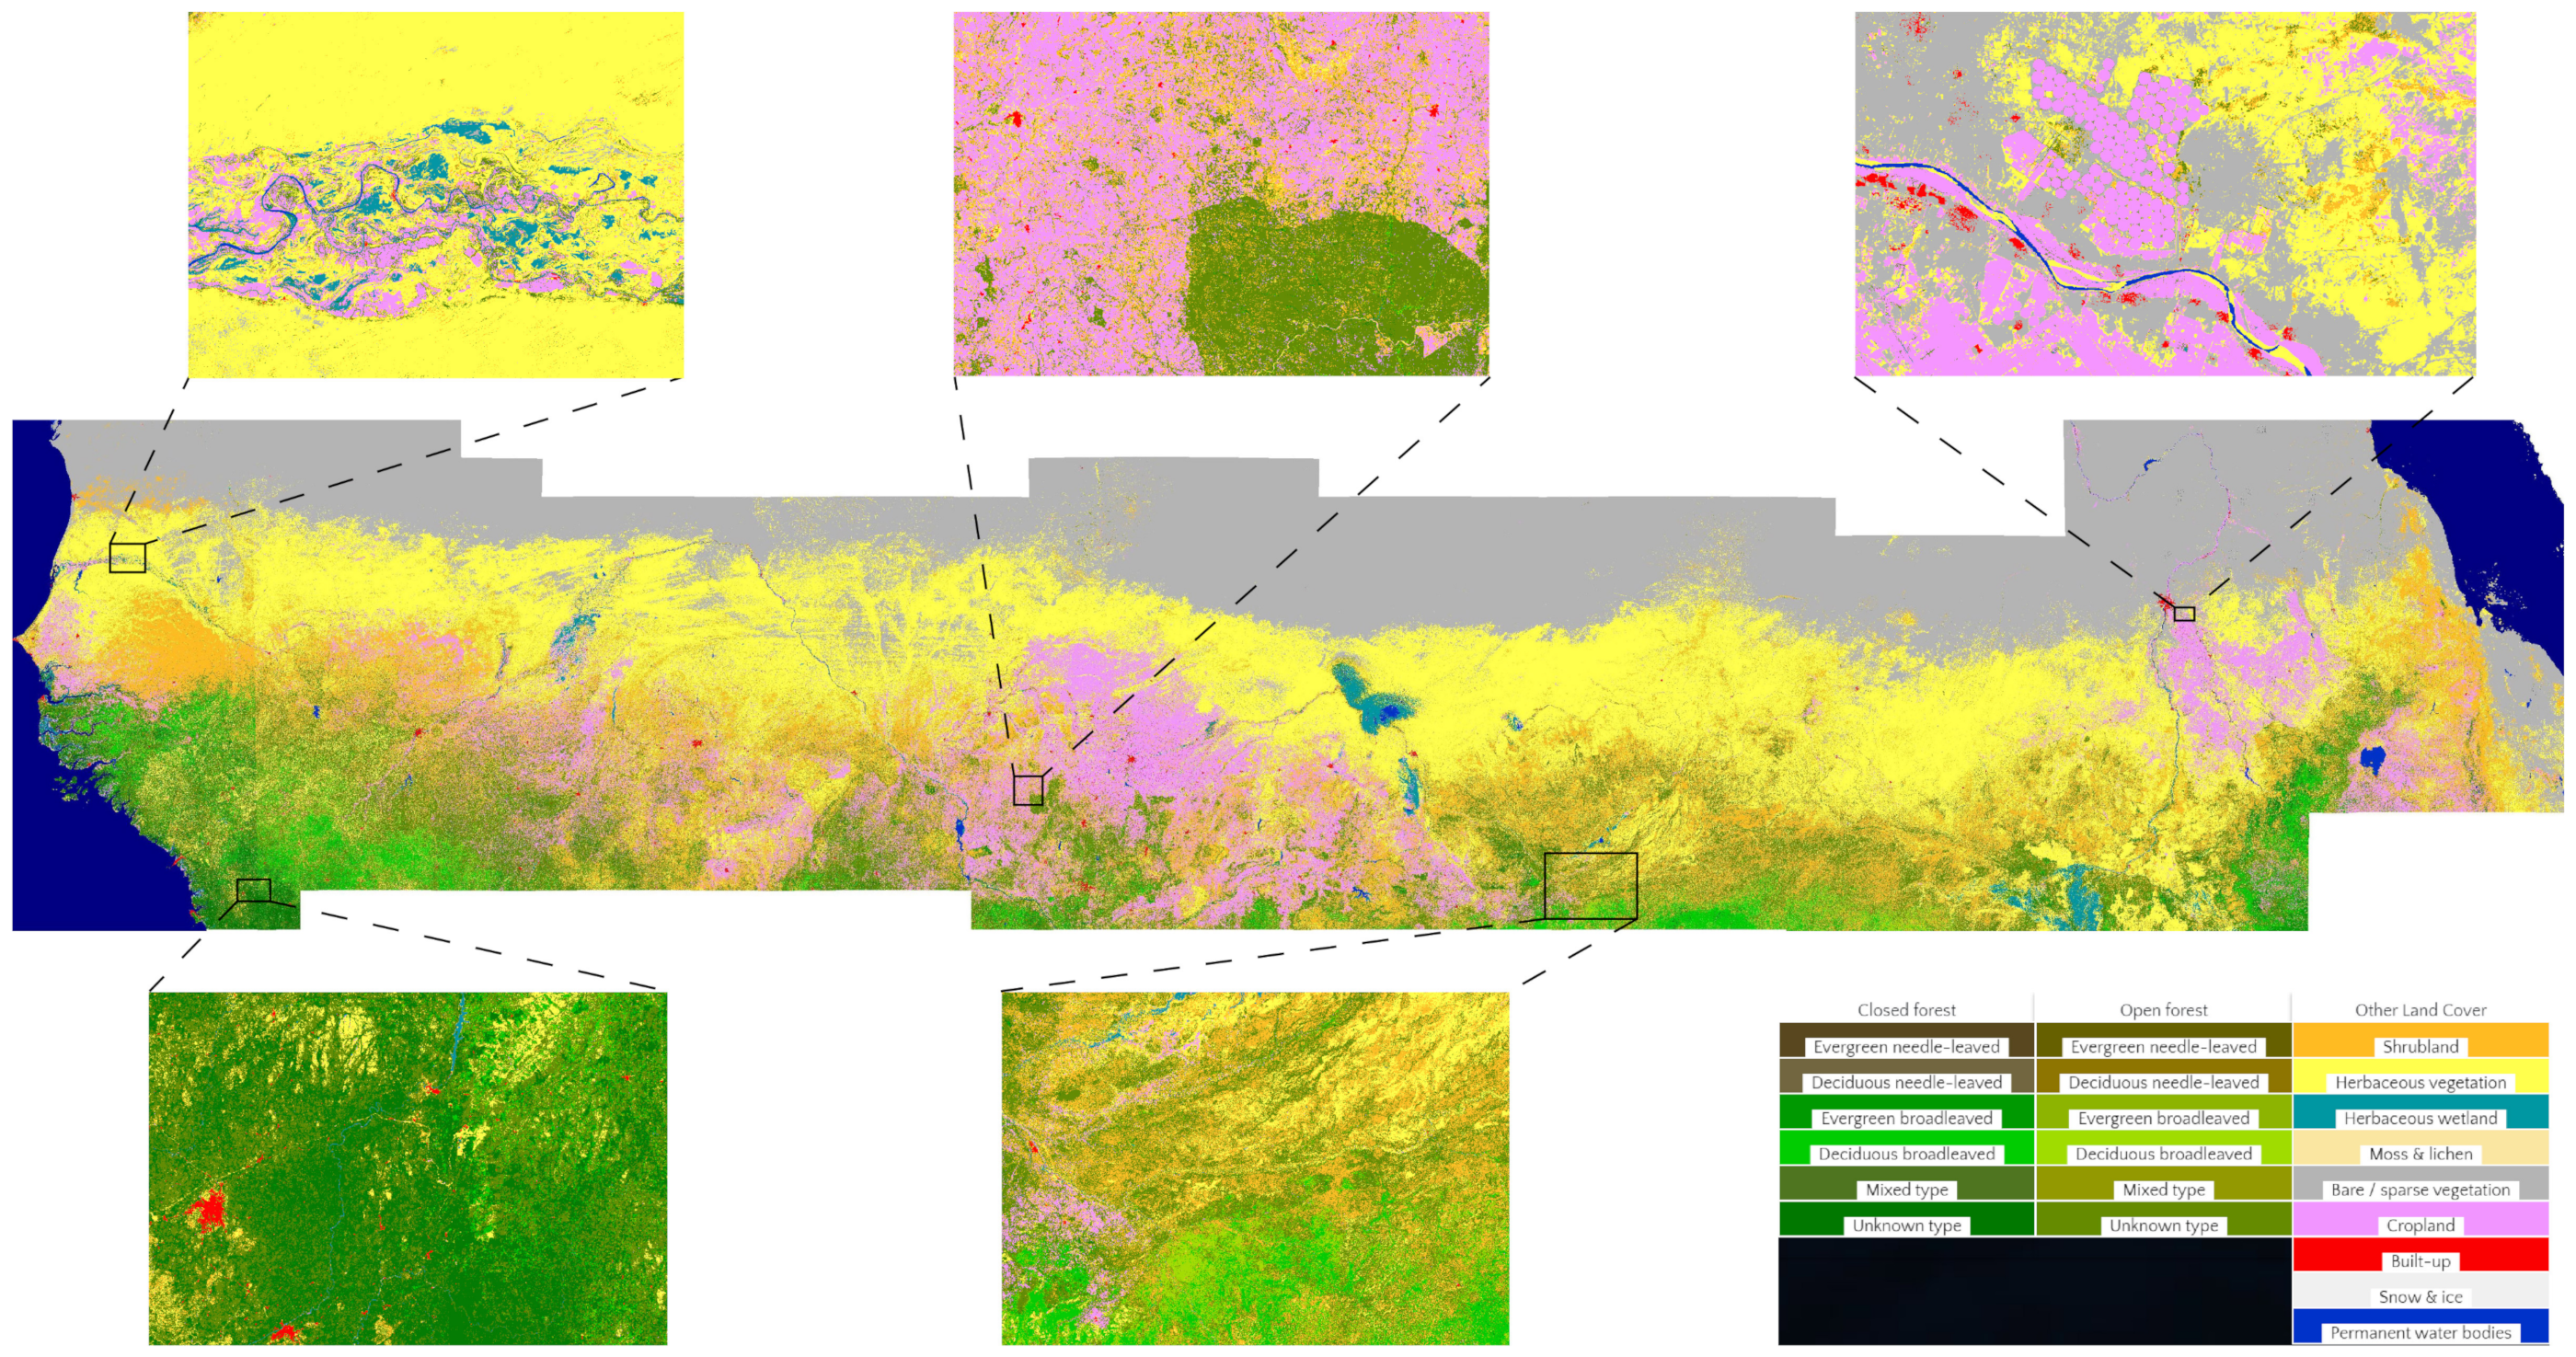
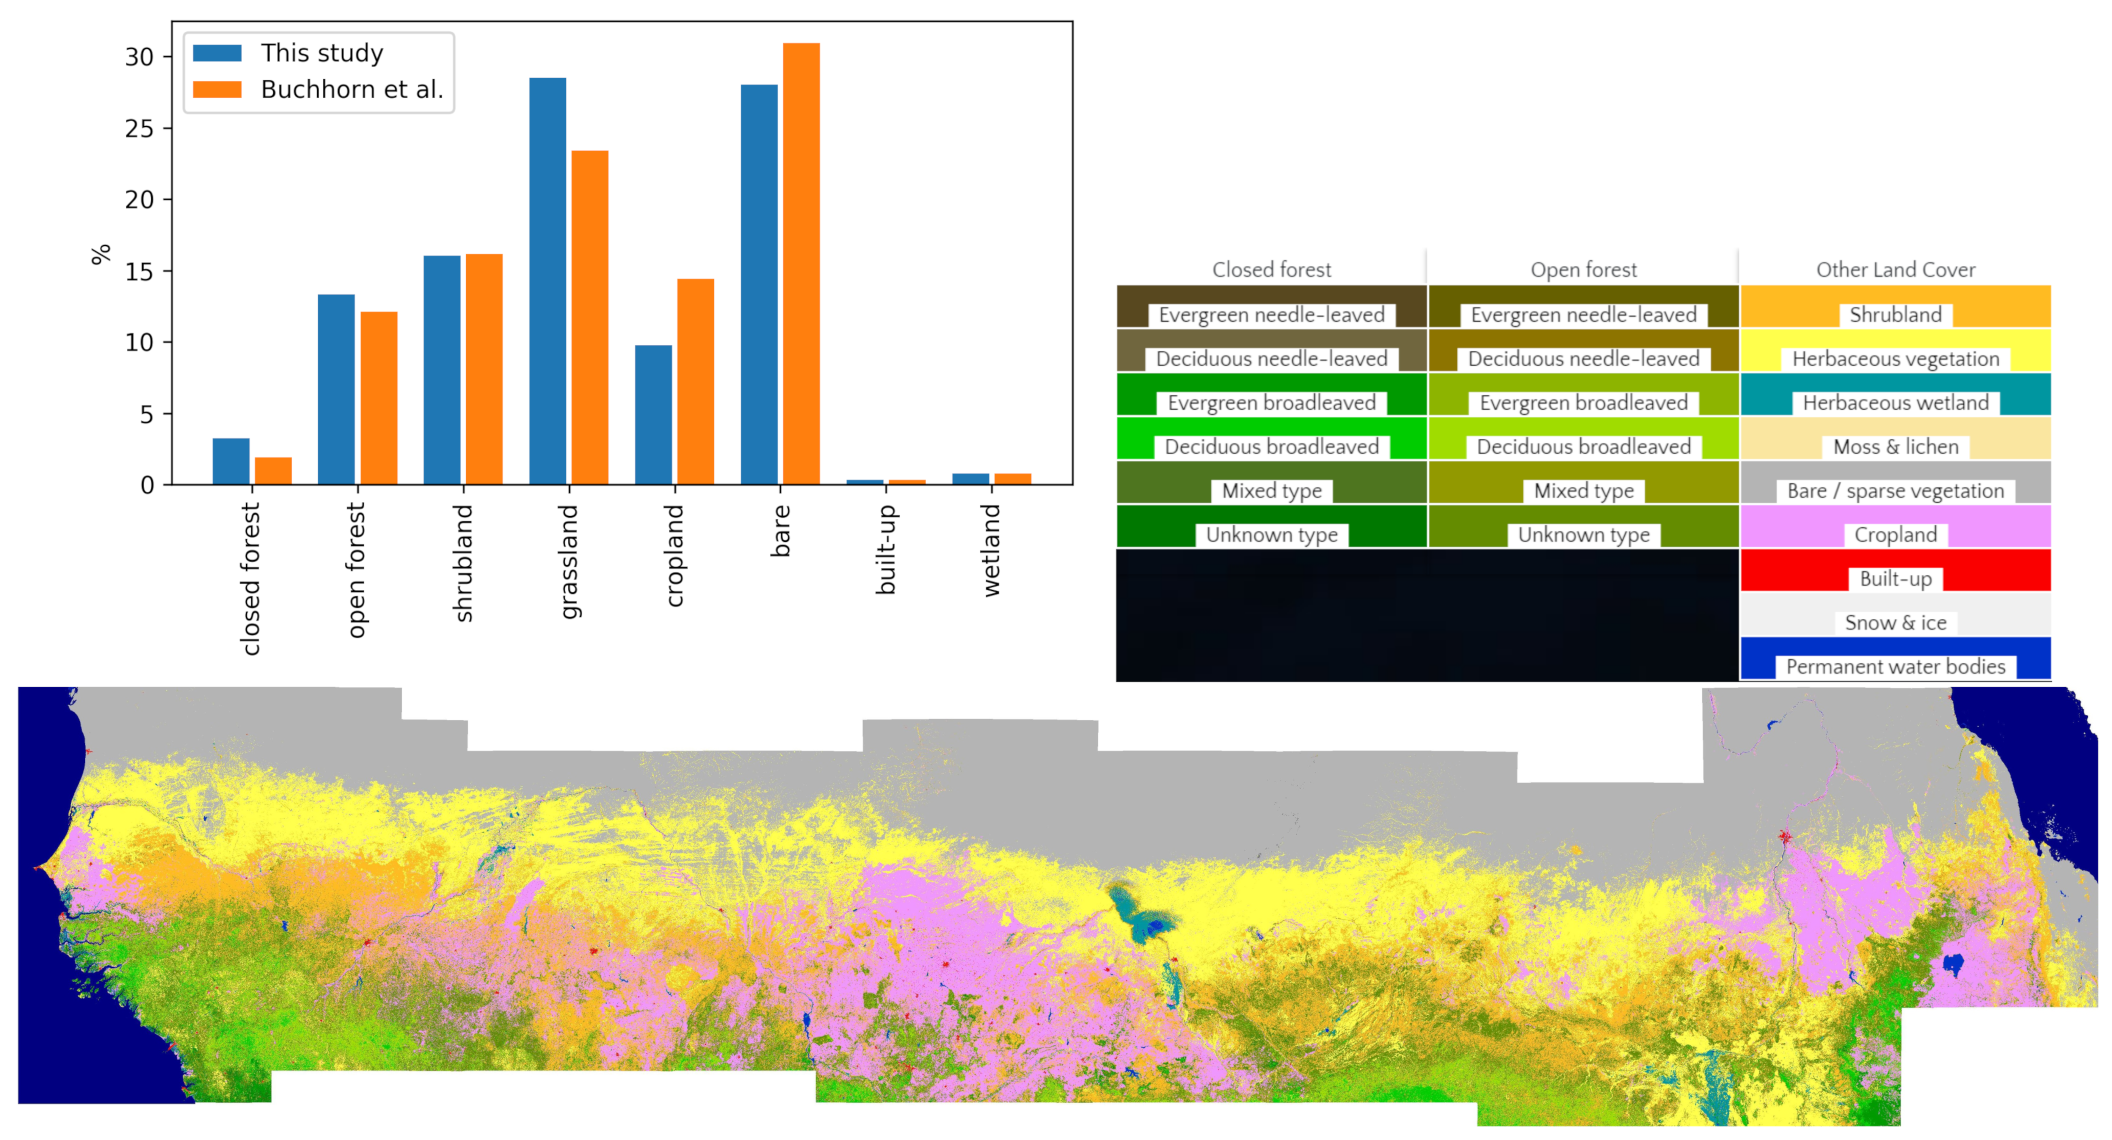
3.1. 30 Meter Land Cover Products for the Sudano-Sahel for 2015

Using the random forest classification model as presented in Section 2.3, a discrete land cover map at a 30 m resolution for 2015 over the Sudano-Sahel was generated (Figure 4). The characteristic north-south gradient of the Sudano-Sahel is well captured, with bare areas in the northern parts transiting towards grassland and shrubland, and finally, forest in the most southern sections. Furthermore, the broad agricultural areas in the north of Nigeria and surrounding the Nile river are captured. A close up of some of these areas shows the level of detail that is achieved with these maps (Figure 4).
Per-pixel cover fractions varying between 0 and 100% for each class are provided (Figure 5). These maps provide a large added value as they allow for much more detailed analyses of land cover. One can create tailored discrete land cover maps out of the cover fractions or composite figures. These cover fraction maps allow for easy detection of the density of the different vegetation classes. Furthermore, more subtle changes in land cover that are not captured in a single discrete classification can be distinguished (e.g., woody vegetation die-off or shrub encroachment [56]).
A statistical analysis of the accuracy of the discrete land cover map is provided. An area-weighed (proportional to the total mapped area) overall accuracy of 68% and Cohen’s Kappa value of 59% are achieved (Table 2). Highest confusion is caused by the high similarities in the spectral signature of forest and shrubland on the one hand and shrubland and grassland on the other hand at the transition of eco-zones. A relatively high disagreement between these classes is found here, which is expected as the shrubland class is in reality a mixed composition of grassland and trees. This reflects the heterogeneity within a 30 m × 30 m pixel in the complex Sudano-Sahel ecosystem [57]. It is noted that when accommodating for spectral similarities between neighboring classes (forest and shrubland on the one hand and shrubland and grassland on the other hand), the overall accuracy of the map increases to 83%, while Cohen’s Kappa value attains 78% (Table 2; numbers in parentheses). The accuracy of bare, cropland, and wetland is above average, while for water and urban, it is generally below average. It must be noted that water and built-up surfaces are mainly fused in from external datasets (see Section 2.3). Since accuracy is weighed based on the area of each class, a very low users’ accuracy is obtained for built-up surfaces.
When looking at cover fractions, accuracy measures are in line with the results for the discrete classification (Table 3). The highest errors are again found for the grassland, shrubland, and crop cover fractions.

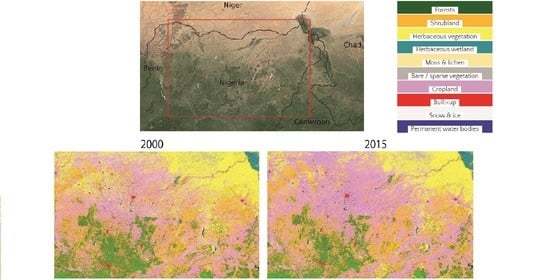
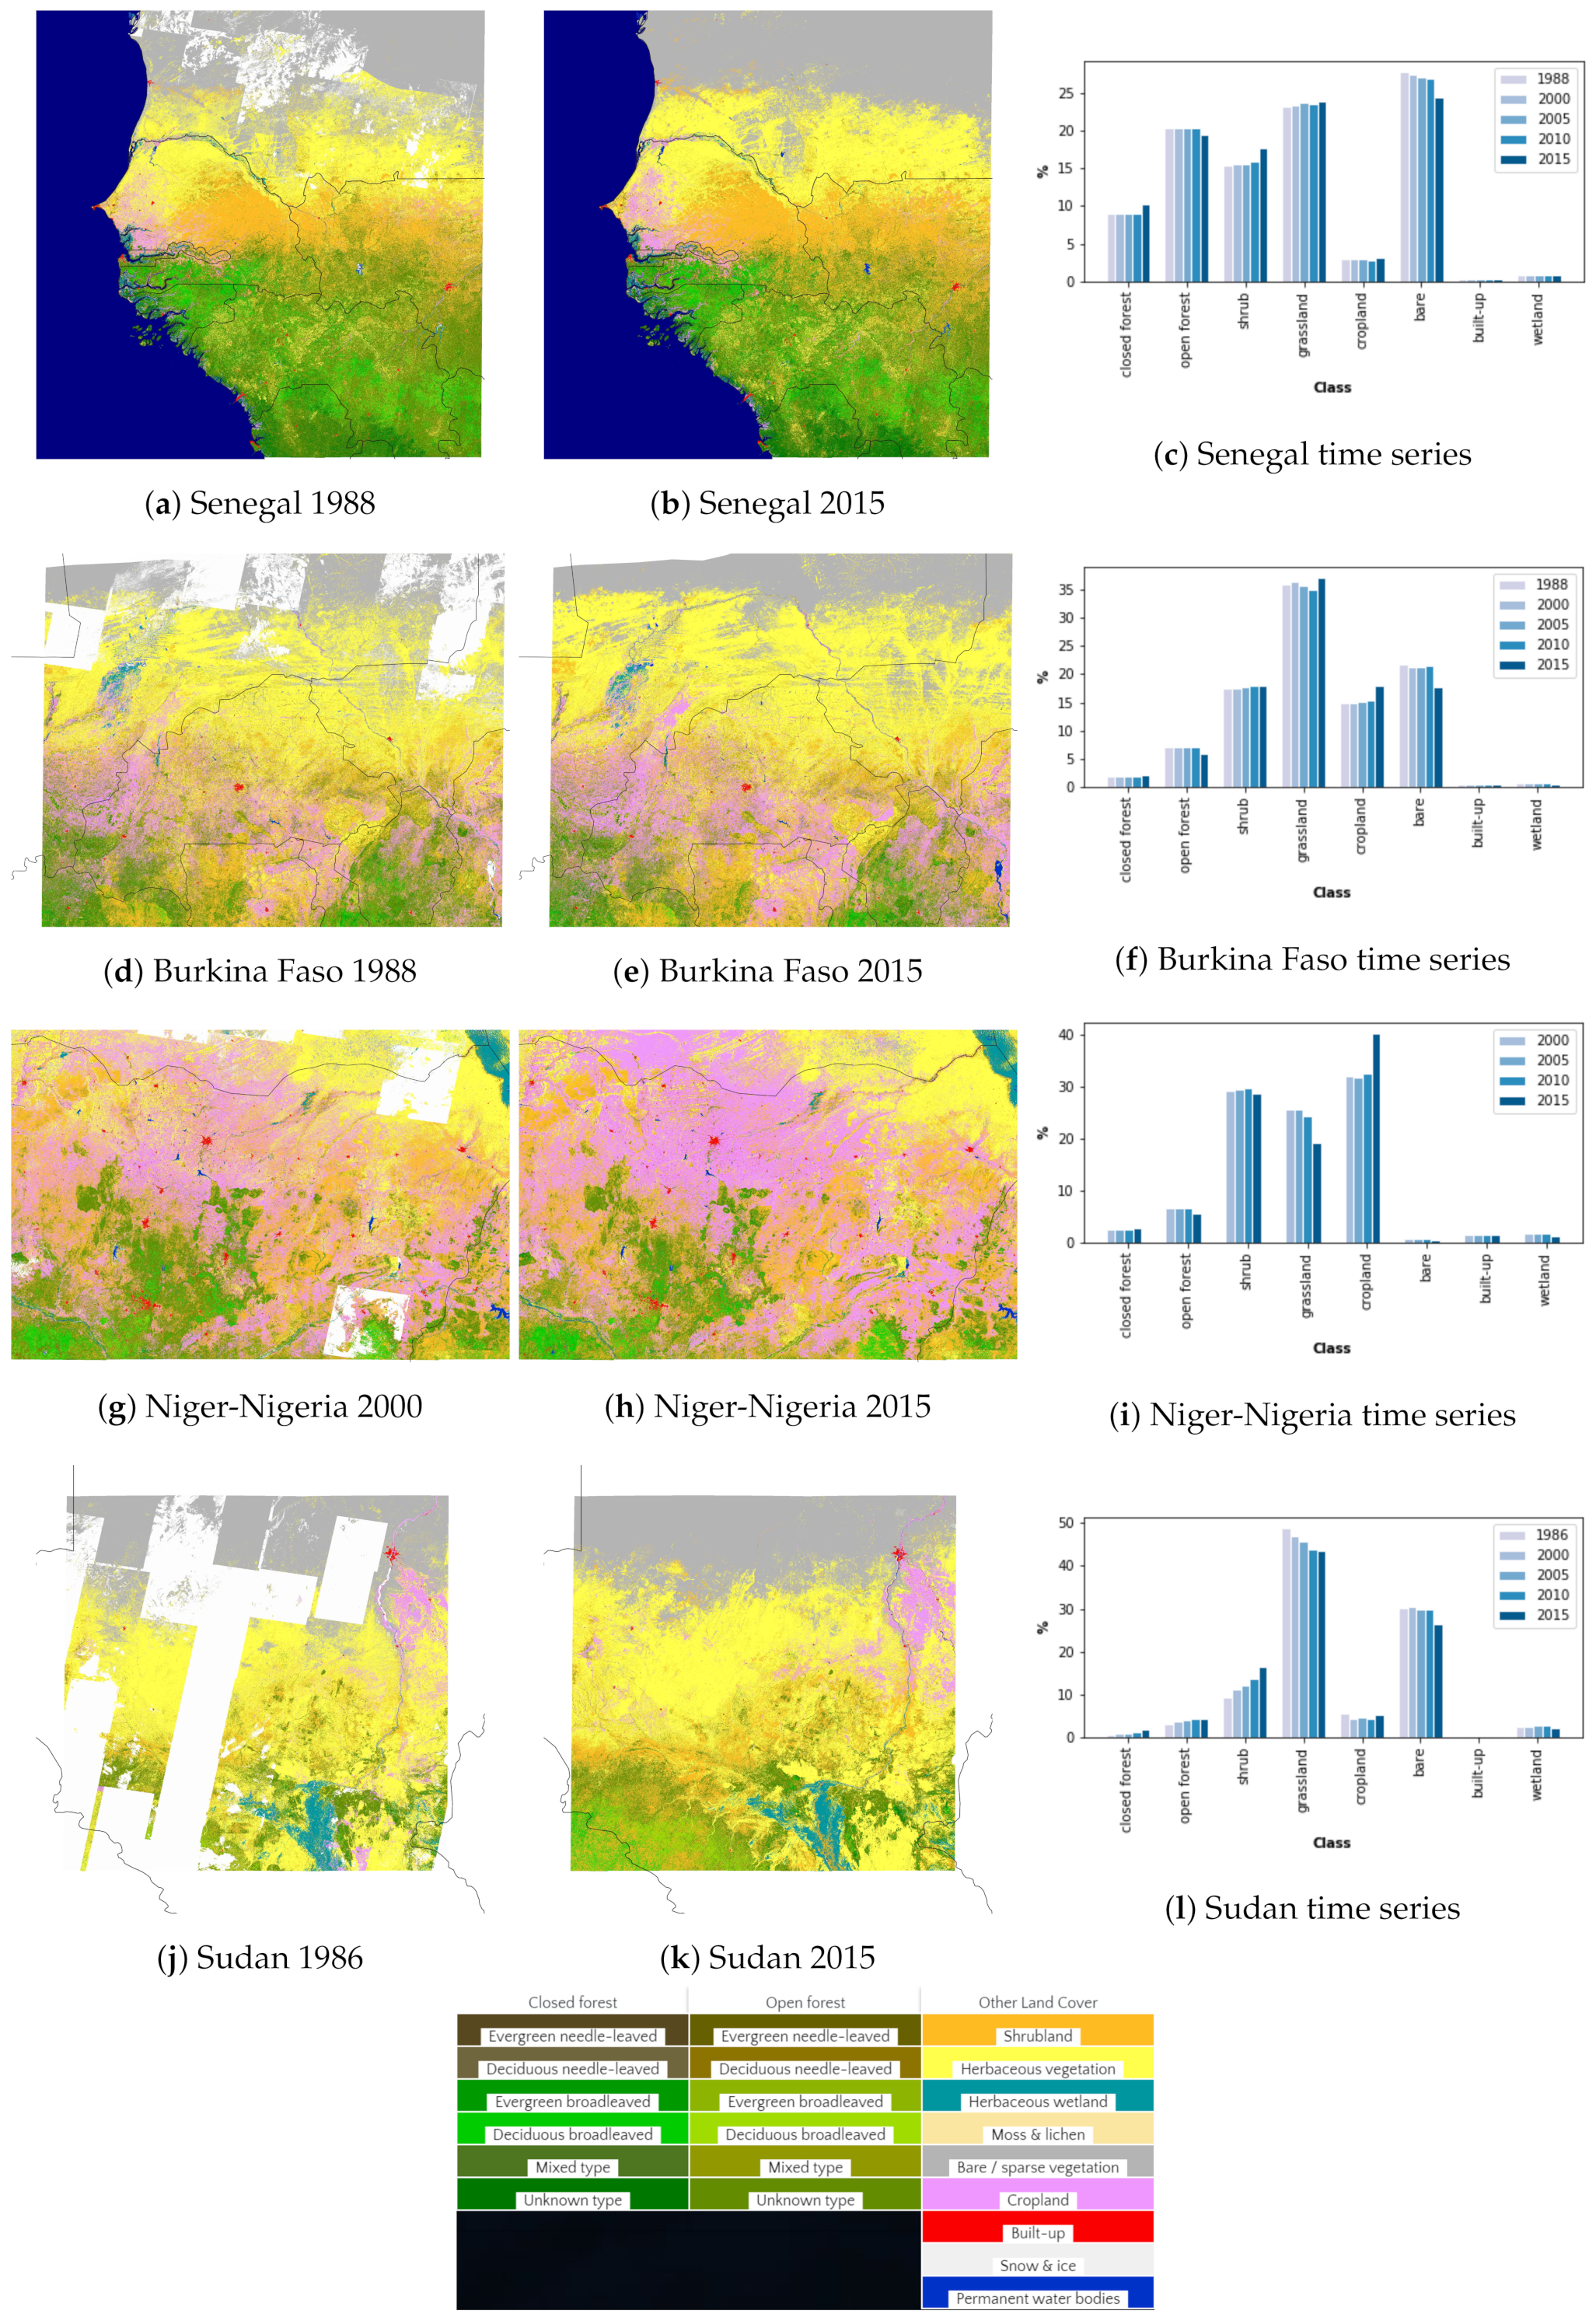
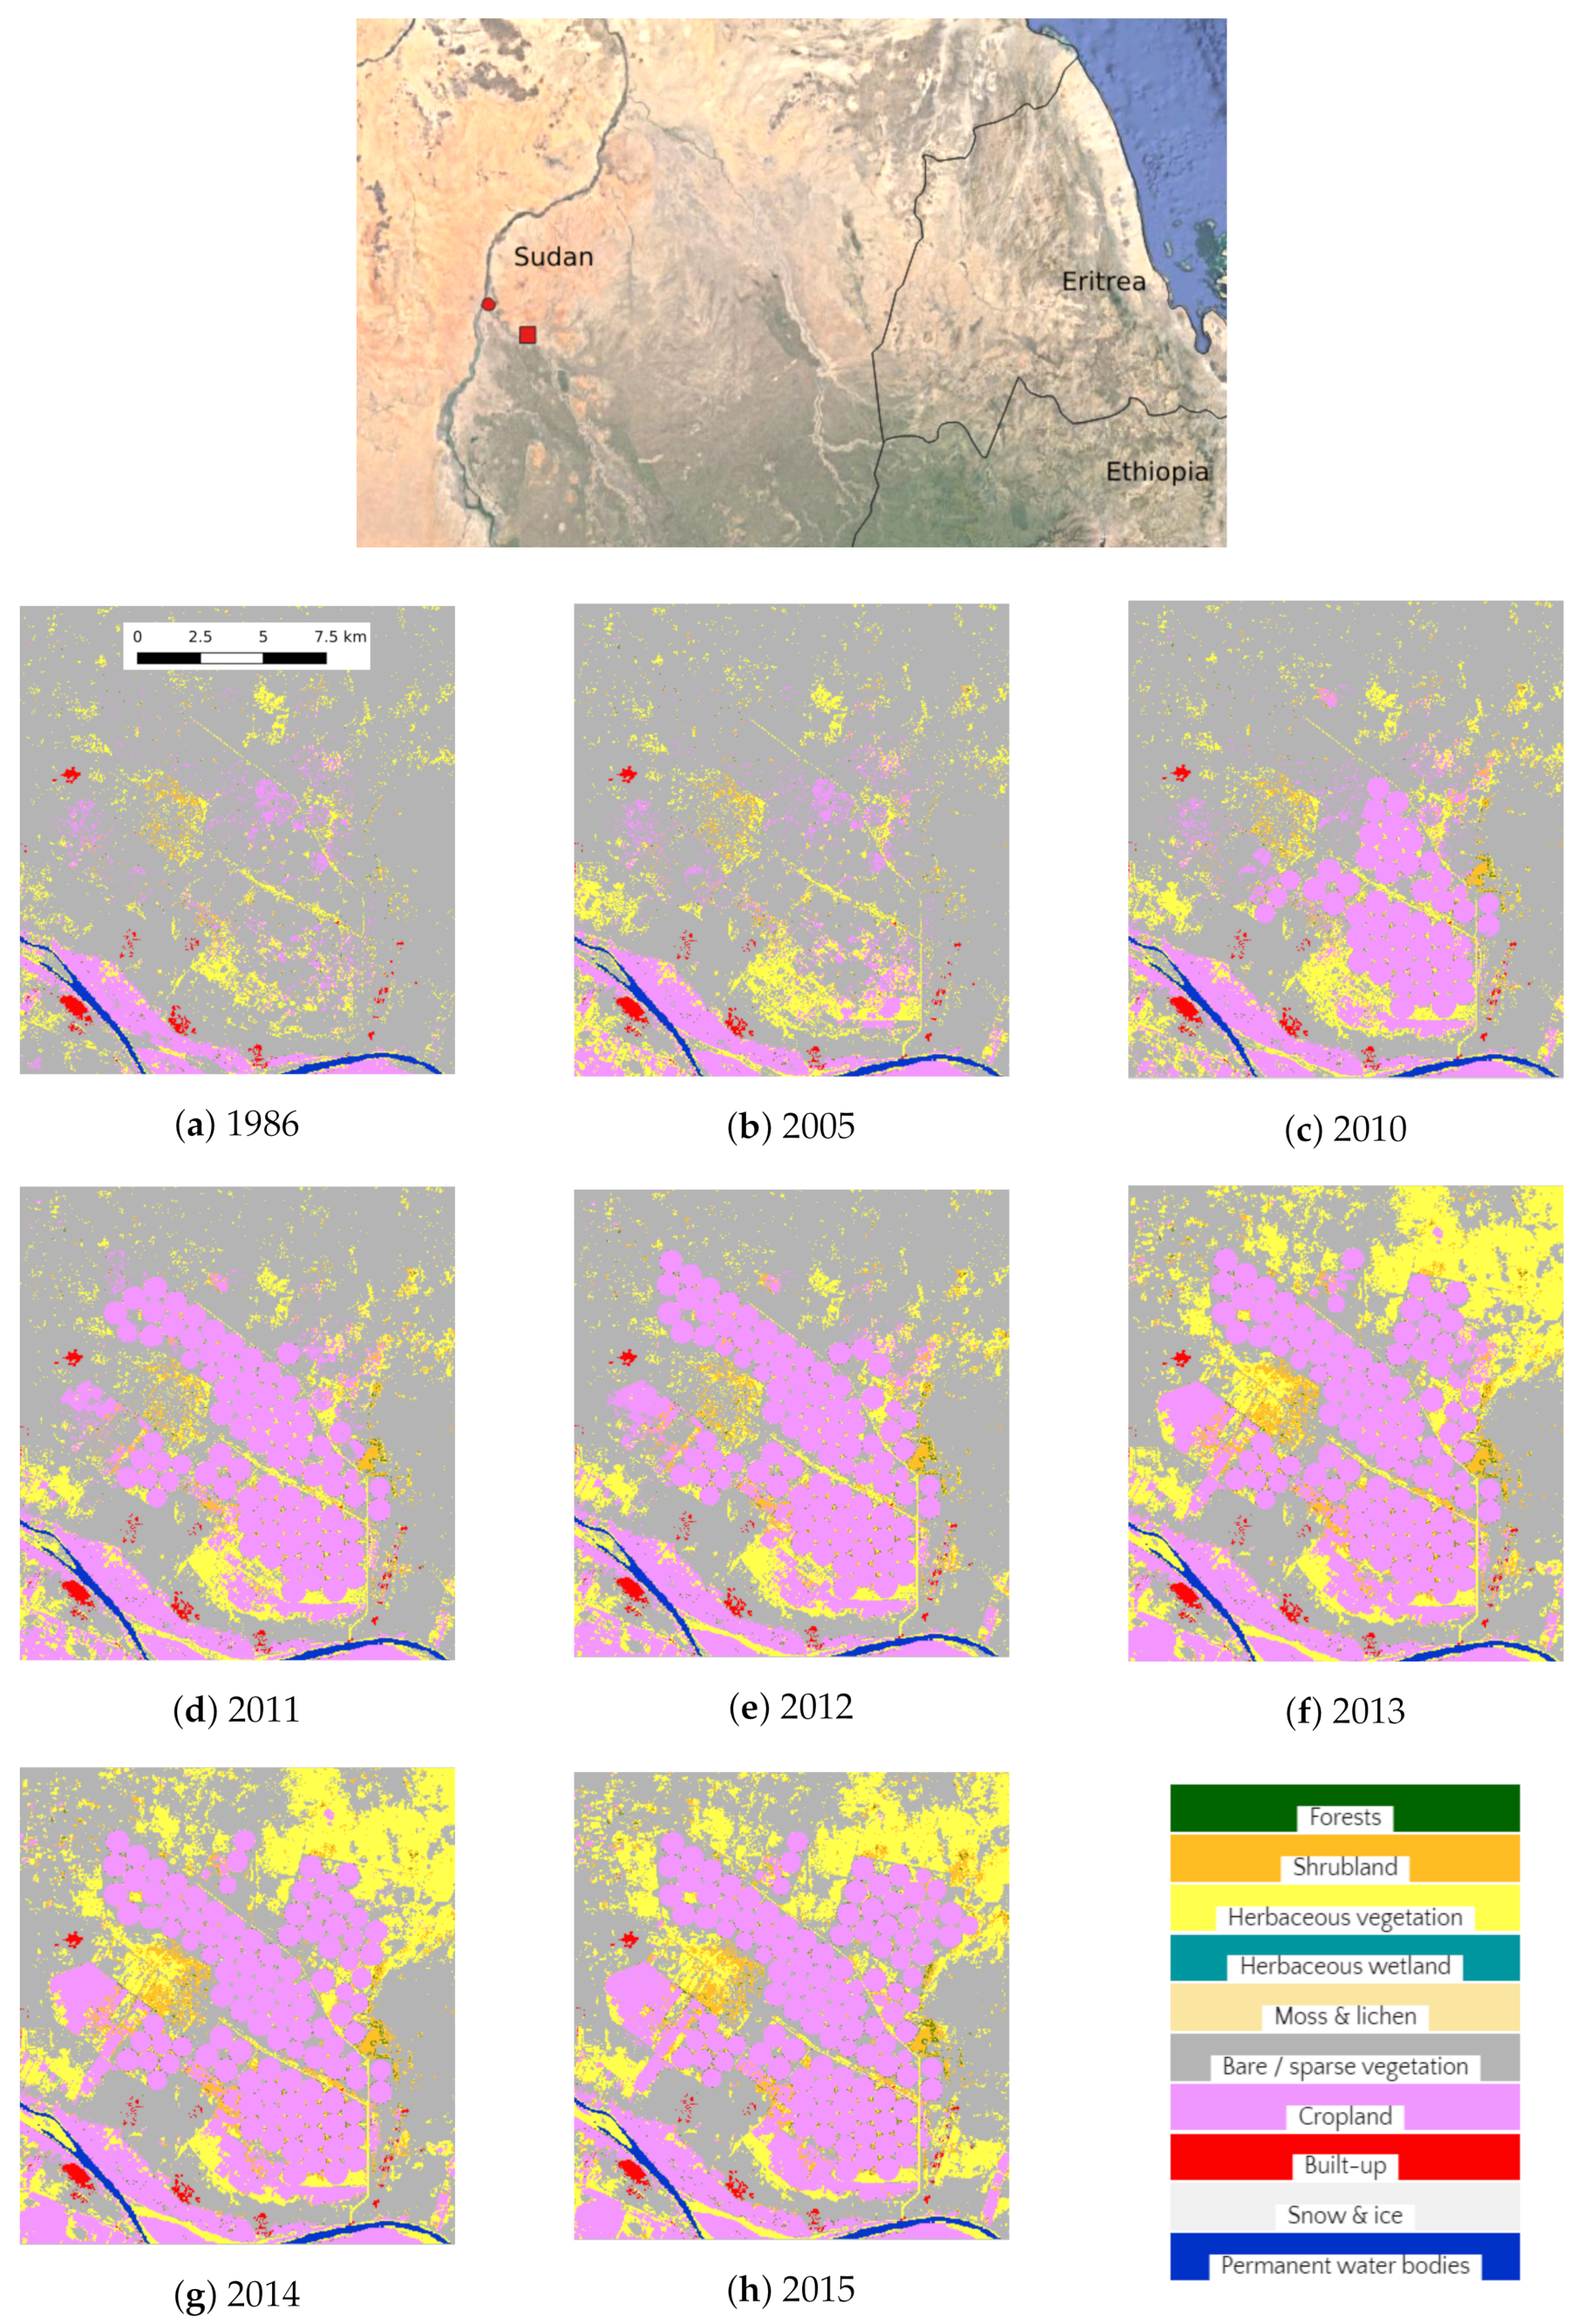
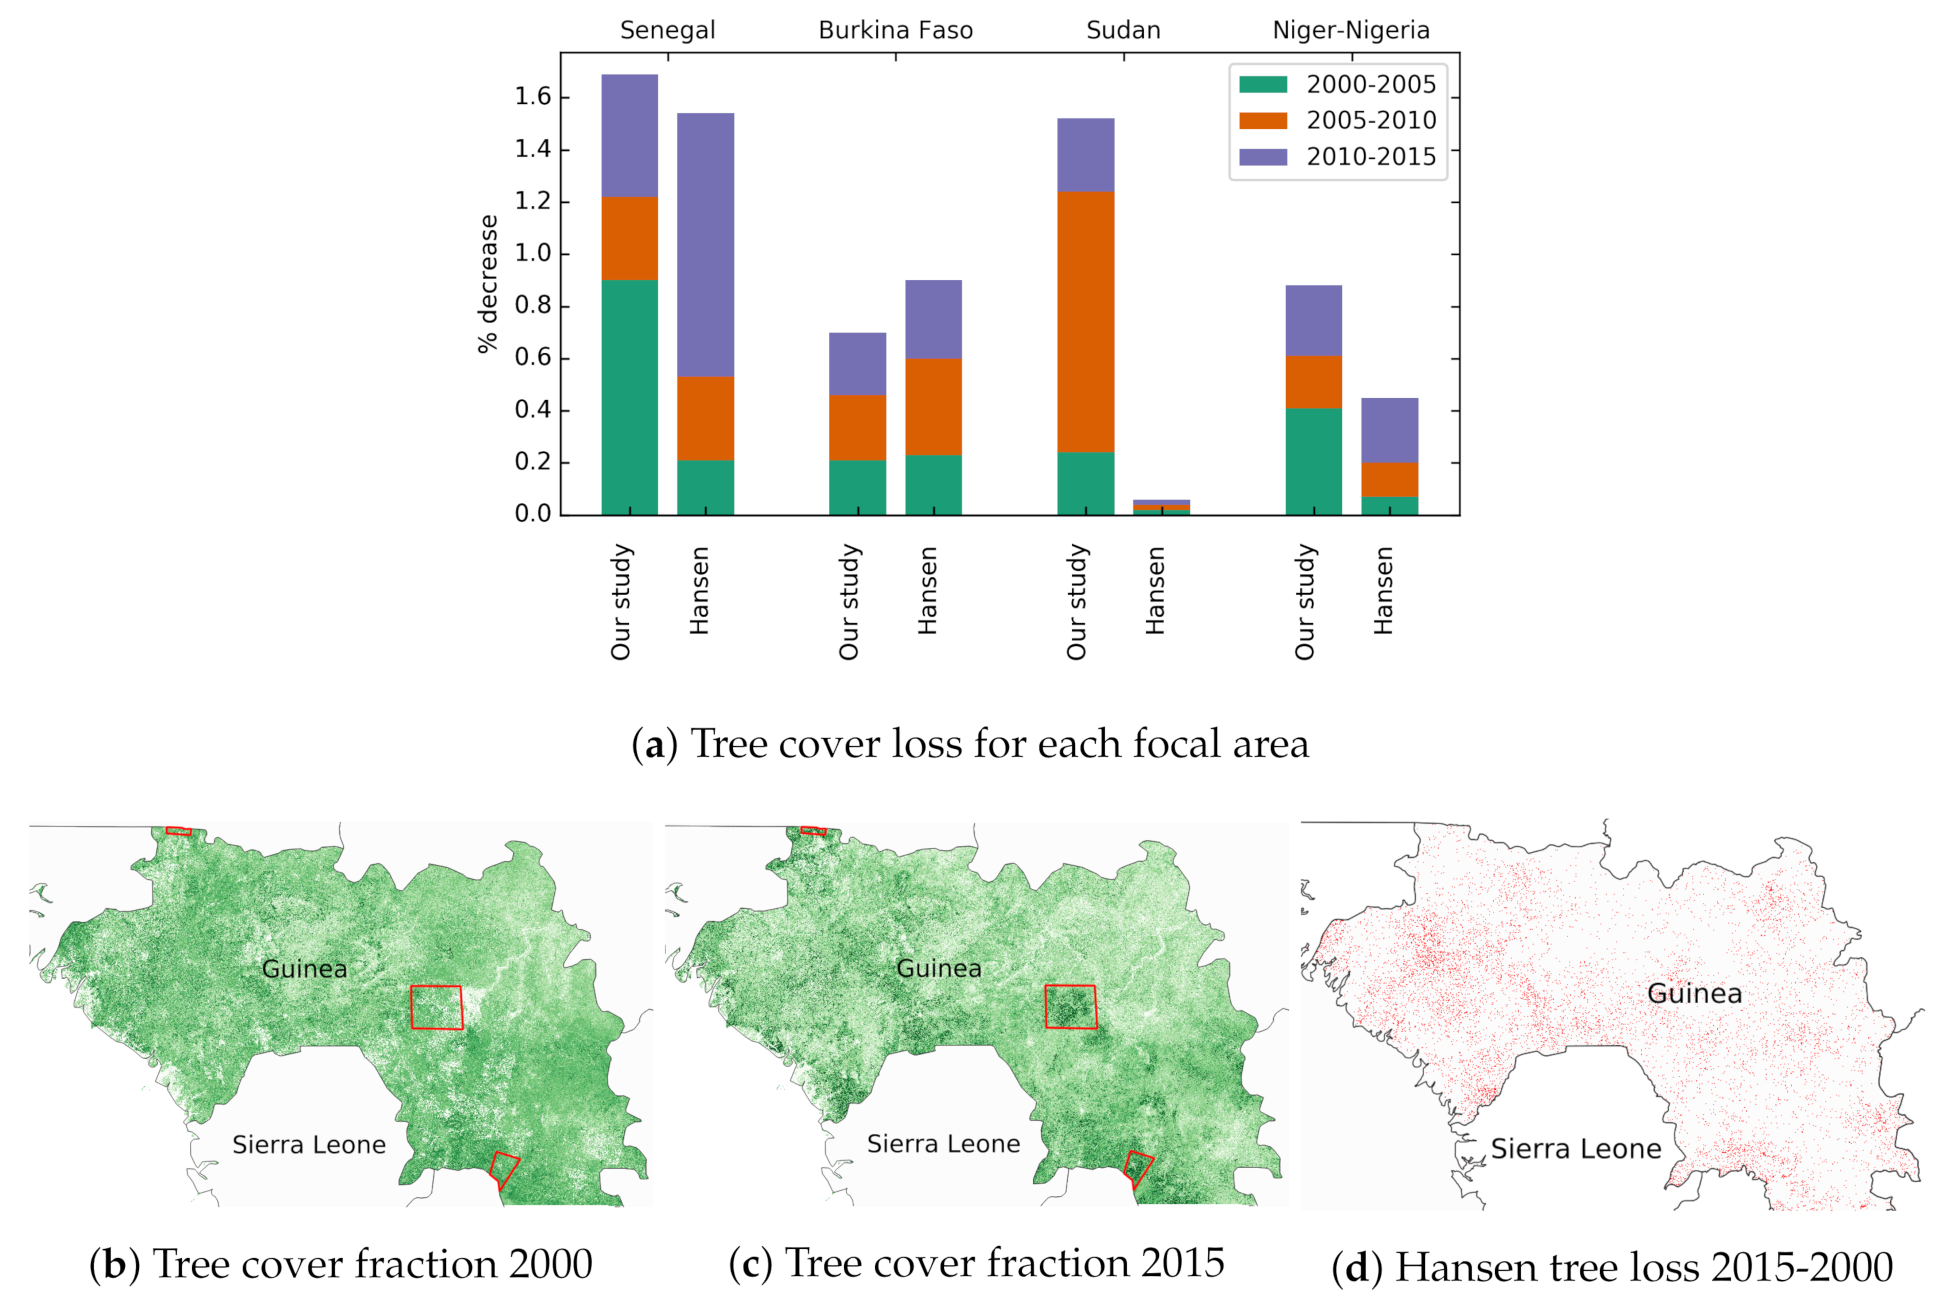
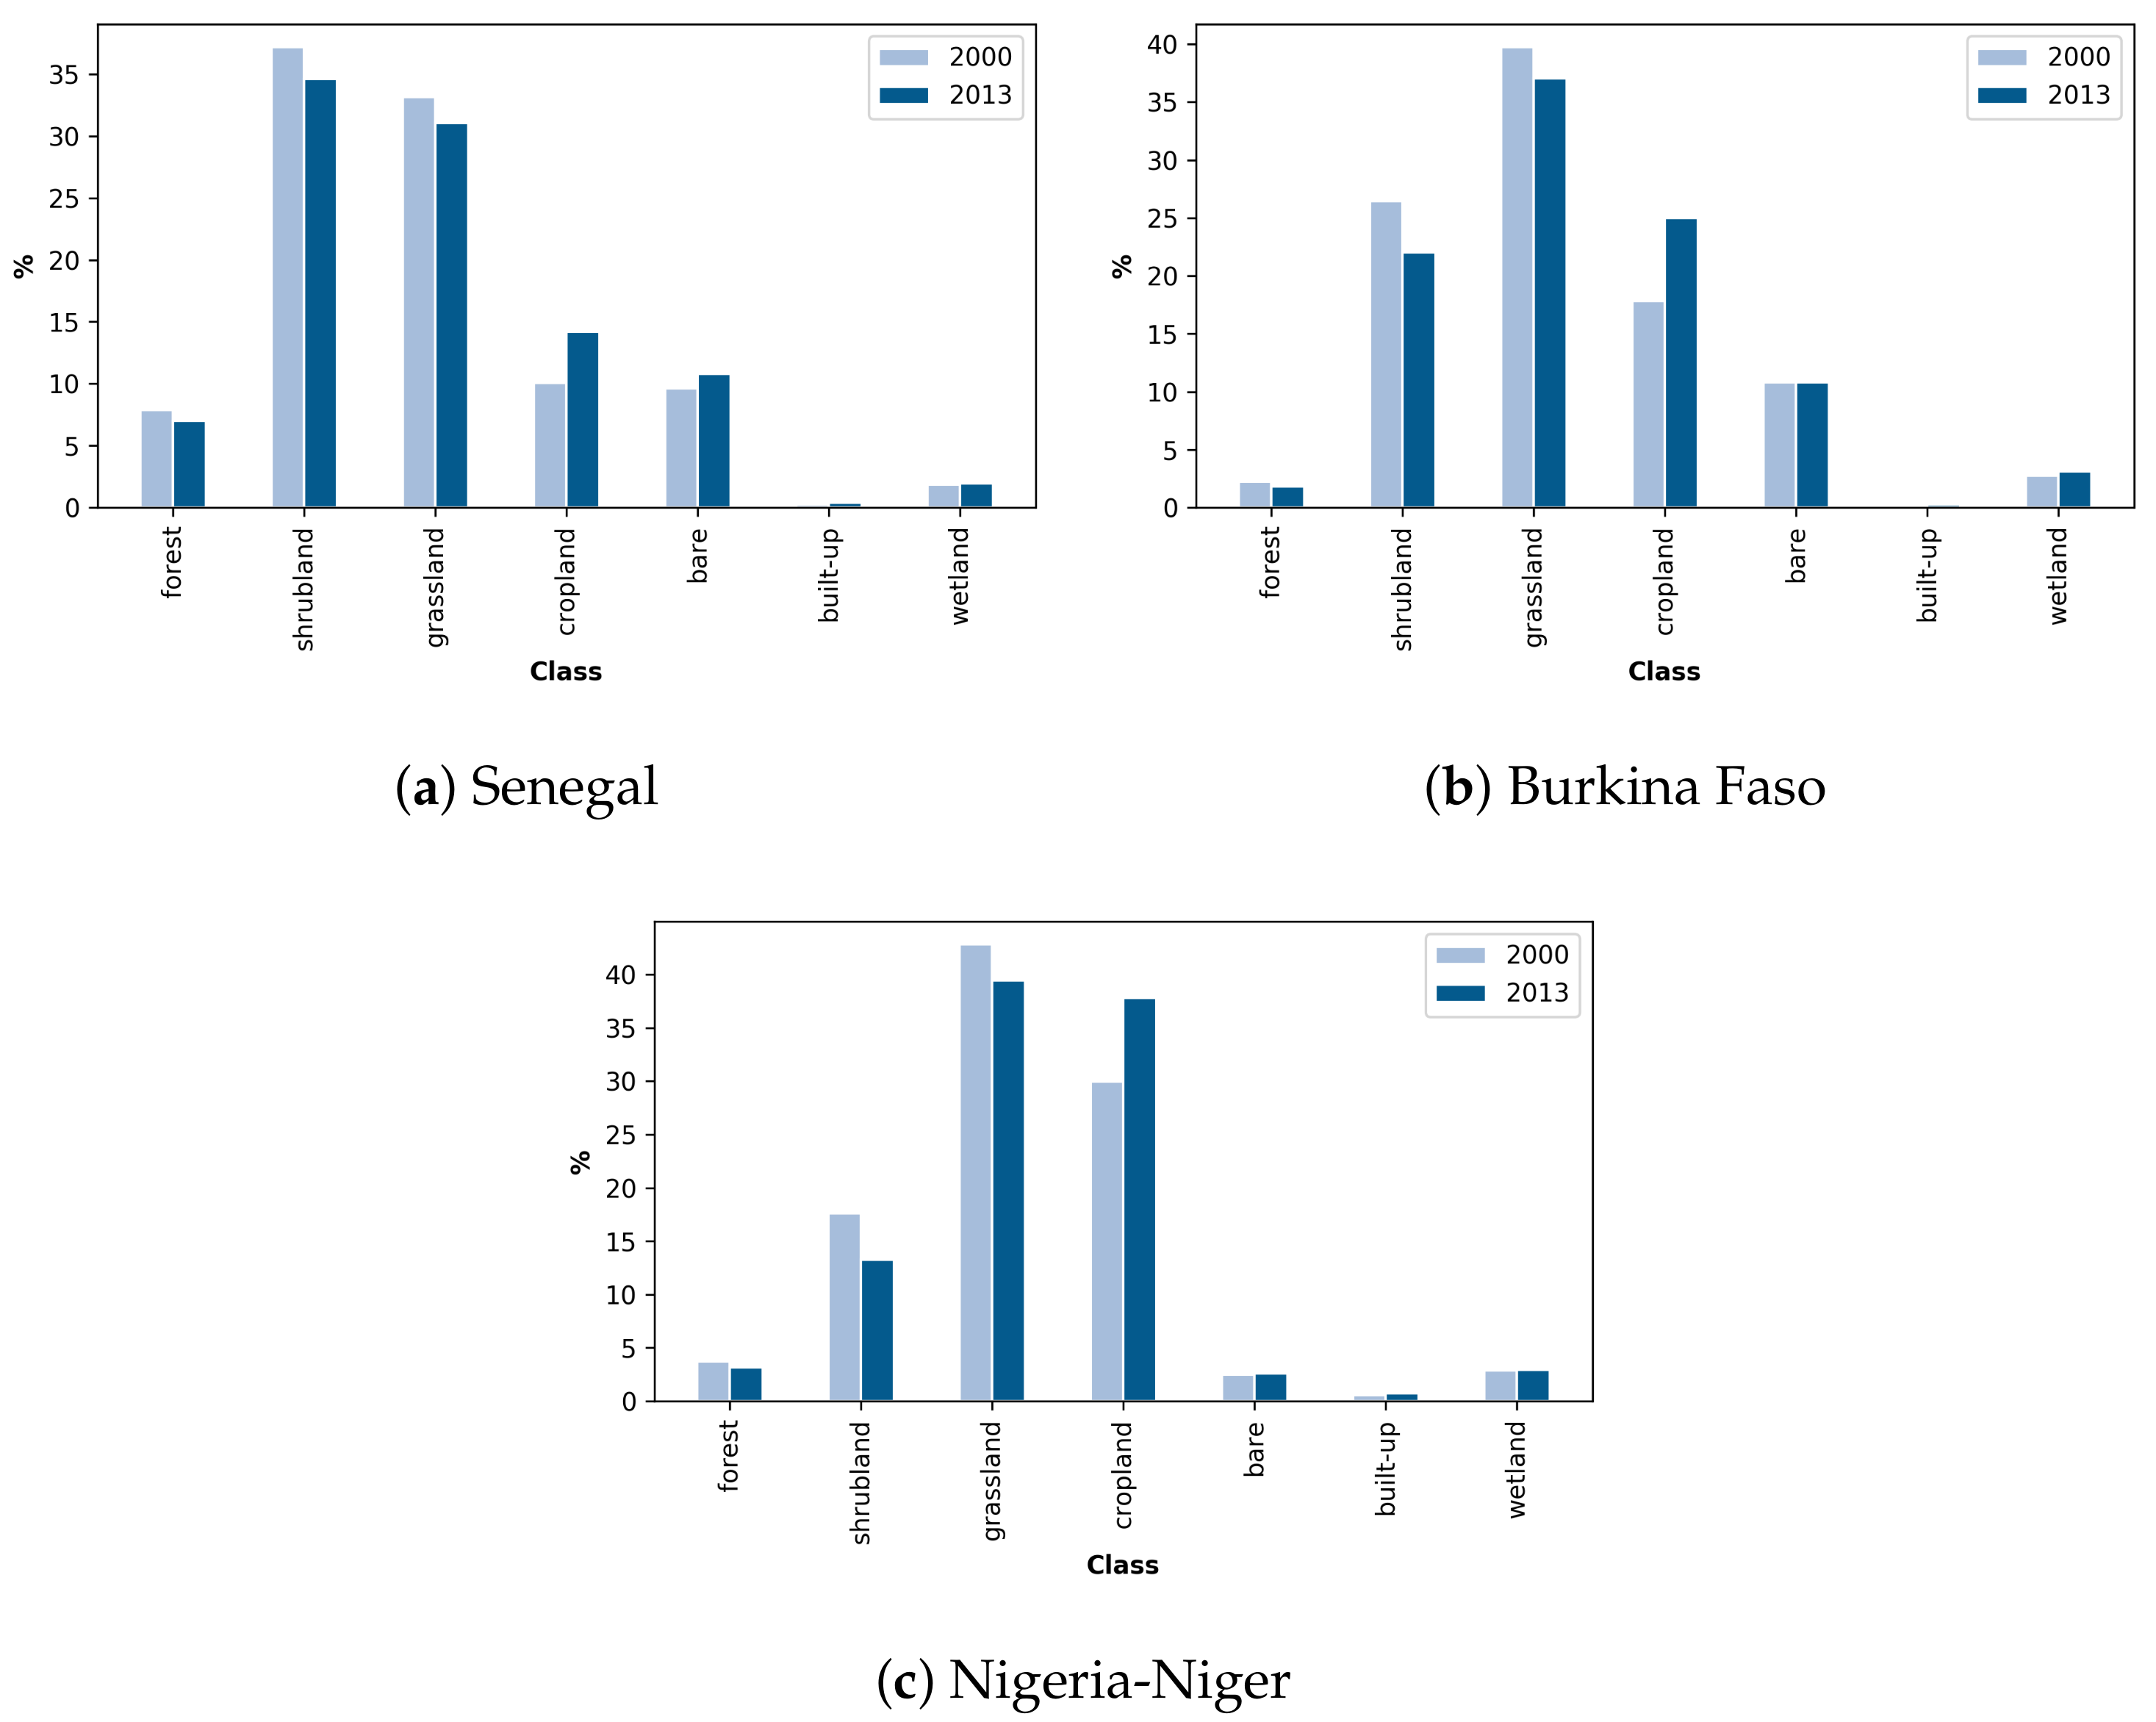
3.2. Historical Land Cover over the Sudano-Sahel

Historical results for the period 1986(1988)–2015 are provided for all regions indicated in Figure 1 apart from the region covering Nigeria and Niger. For the latter, historical land cover maps are limited to the period 2000–2015 due to a lack of satellite overpasses over the region before the launch of Landsat 7 (see also Table 1 and Section 2.2). The earliest and most recent land cover map for each of the four focal areas noted above are visualized (Figure 6). Masked areas indicate regions with less than four satellite overpasses during the dry or the wet season within the full period of analysis for a specific time frame. This limit has been set to acquire reliable land cover/cover fraction maps over these regions. Next to this, the historical time series of land cover change is visualized for each of the focal areas (Figure 6). This displays the magnitude and timing of changes in land cover. Historical maps for each of the focal areas and time periods as listed in Table 1 can be downloaded via an open-access channel (https://doi.org/10.5281/zenodo.4013392).
Several features are identified in these overview figures. At first, for all focal areas, an increase in cropland area is observed. This is most pronounced in western Senegal (Figure 6a–c), near the Nile river (Figure 6j–l), Burkina Faso, and the southern parts of Mali (Figure 6d–f). For the northern part of Nigeria and the border with Niger, a clear expansion of cropland areas is observed between 2010 and 2015 (Figure 6i). Apart from extensions in cropland areas, our products appear to also capture agriculture intensification. In the surroundings of the cities in the north of Nigeria for example, in 2000, patches of grassland and shrubland were still visible, whereas in 2015, these were converted to cropland (Figure 6g,h). Apart from cropland growth, other anthropogenic influences can be identified. For each of the focal areas, a decrease in open forest areas is identified over time. Despite this deforestation, also some increases in closed forest areas are identified for the focal areas of Senegal and Sudan (Figure 6c,l), indicating the presence of protected national parks.
Climatological influences and their dynamical impact on land cover over the Sudano-Sahel are also observed in Figure 6. In the 1970s and 1980s, the Sudano-Sahel experienced many years with anomalous low rainfall amounts, which only recovered to normal conditions towards the new millennium [14,58,59]. This is reflected in the most northern parts of the Sudano-Sahel, where an expansion of grasslands towards the north is observed compared to the 1980s maps, following the results observed by Brandt et al. [58]. A clear increase in vegetation is visible in Senegal, Burkina Faso, and Sudan since the 1980s, where not only a northward expansion of grassland is visible, but also of shrubland and forest (Figure 6).
The results above show the capability of our land cover maps to detect several land cover changes in the last 30 years over broad regions or at the country level. Yet, since our product is available at 30 m resolution, it is also important that small details and fine-scale changes are captured correctly. One form of land cover change at the fine-scale level is cropland expansion in the form of crop circles near the Nile river in Sudan. An example is provided for a small location southeast of the city of Khartoum (Figure 7). These irrigation circles have been constructed since 2005 and are expanding over time, with a broad expansion in 2011 and a gradual increase in the period 2011–2015. Thanks to the yearly maps present between 2010 and 2015, the timing of the cropland growth can be captured in high detail both on the temporal and spatial scale. This example shows the capability of our land cover maps to discriminate not only broad-scale land cover changes, but also very detailed and fine-scale variability, which is a large added value to the community studying the Sudano-Sahel region.

4. Discussion

In order to further assess the accuracy of the (historical) land cover/cover fraction maps presented in Section 3, a comparison with other studies is executed in this section and Appendices Appendix C and Appendix D.
Several efforts have been executed in the past to achieve land cover products over the Sudano-Sahel, often focused on one land cover class. The cropland maps produced by Lambert et al. [60] (their Figure 14) show broad agricultural areas in the west of Senegal, the north of Nigeria, and the east of Sudan. More scattered agriculture is found at the same latitudes over the remaining parts of the Sudano-Sahel. This is consistent with our results. Brandt et al. [13] provided an overview of woody cover over the Sudano-Sahel (their Figure 5). These regions closely match the areas indicated by shrubland and forest in Figure 4. Buchhorn et al. [24] provided a validated global land cover database that employs the same discrete classification legend. Apart from a large spatial co-occurrence, there is a good statistical synergy with our discrete land cover map. A detailed comparison can be found in Appendix C.
Historical land cover maps are scarce over the Sahel region. The USGS provides historical maps for West Africa for 2000 and 2013 based on a Landsat record at 2 km spatial resolution [61,62]. A detailed comparison between their maps and our results can be found in Appendix D.
Apart from the historical discrete land cover maps of the USGS, Hansen et al. [63] provided a record of forest loss since 2000 on a global scale at a 30 m spatial resolution. For a broad part of the Sudano-Sahel, they indicated forest losses. When analyzing our discrete land cover maps, these forest clearings are not so evident (Figure 6). This can be attributed to the fact that the forest discrete class covers a wide range of forest densities within a pixel [39]. For these kinds of analyses, there is a large added value in the more detailed historical cover fraction maps that are provided within this study (Figure 8). Depending on the application of the map users, one might use the discrete land cover or cover fraction map for change detection.
Hansen et al. [63] defined forest loss as a stand replacement or complete removal of forest. In our tree cover fraction maps, we define forest loss as the removal of a minimum of 40% of the trees within a pixel when a pixel is at least 50% covered by trees before the disturbance/removal. Despite the presence of confounding errors due to a different definition of forest loss in both datasets, a comparison for the historical time series between 2000 and 2015 is made (Figure 8a). For the Senegal and Burkina Faso focal areas, a good correspondence between forest loss recorded in both studies is obtained, despite an inaccurate timing for Senegal. For Niger-Nigeria, our study achieves a higher amount of forest loss, while for Sudan, much higher forest losses are recorded. Apart from a different definition of forest loss, this can also be attributed to lower amounts of forest present in Hansen et al. [63]. Based on a recent study of Brandt et al. [64], tree cover over the Sahel is highly underestimated in several datasets. This is also the case for Hansen et al. [63], while more realistic values are obtained in our cover fraction maps. This underestimation of forest partly explains the low number of forest and forest loss in Hansen et al. [63] for the Sudan and Niger-Nigeria focal areas.
In order to show the spatial coherence between forest loss recorded by Hansen et al. [63] and our tree cover fraction maps, a case study for Guinea is highlighted. In 2000, the tree cover fraction map shows that Guinea was characterized by a uniform open forest throughout the country with limited spatial differences, apart from some clearings surrounding human settlements (Figure 8b). In 2015, a clear and uniform decrease in tree cover fraction is visible throughout broad parts of the country (Figure 8c). These decreases are also observed in Figure 8d, and their regions of forest loss match closely with our results (Figure 8d). Despite this decrease in forest cover for most of the country, also some regions with an increase in tree cover are observed. These areas often coincide with national parks that have a protected status by the government. Three of these protected areas have been indicated (from north to south, respectively the national parks of Badiar, the Upper Niger, and the Ziama Massif) and clearly experienced an increase in tree cover fraction between 2000 and 2015.
Based on the comparison executed in this section and the results in Appendices Appendix C and Appendix D, it is shown that the historical land cover maps presented in this study are in line with the literature and other data sources. All analyses show a high correspondence in land cover distribution, while land cover changes are captured in both the discrete land cover and cover fraction maps.

5. Conclusions

In the past, a multitude of land cover maps were provided at varying spatial resolution and different levels of categorical detail and accuracy for both fine-scale regions and the whole globe. For the Sudano-Sahel, the number of land cover maps is limited, probably due to the dynamical and fragmented character of the region. Furthermore, historical maps for the region are also limited and often only available at very low spatial resolution [61,62]. Using the resources of the Google Earth Engine, an adapted version of the CGLS-LC100 land, cover classification algorithm and the hidden Markov model, it is possible to exploit the full Landsat archive and achieve historically consistent land cover and cover fraction maps at an unprecedented spatial resolution of 30 m for the first time over the Sudano-Sahel.
A Sudano-Sahel-wide land cover and cover fraction map achieving an overall accuracy of 83% is produced for 2015, with noted confusion between forest and shrubland and shrubland and grassland. This is a fairly good result compared to other global land cover maps over the region, which are characterized by large disagreements [36]. Furthermore, several historical land cover changes were identified using the resulting land cover maps. In line with population increases over the last decades, a clear increase in cropland areas is detected over broad parts of the Sudano-Sahel. Largest upscaling is found near the border of Niger-Nigeria between 2010–2015, which was also indicated by previous studies as a region with broad cropland expansions [61,62]. Additionally, the re-greening of the Sahel can easily be identified in the discrete land cover maps. Apart from broad-scale changes, our high resolution 30 m maps allow detecting fine-scale changes in land cover, such as the implementation of crop circles near the Nile River. The cover fraction maps that are provided facilitate the detection of subtle changes that are potentially missed by a discrete land cover classification. It was shown that forest decreases and conservation can easily be identified using these maps, in line with the results of Hansen et al. [63].
The historical land cover and cover fraction maps provided in this study are made available via an open-access channel (https://doi.org/10.5281/zenodo.4013392), providing Sahelian experts, scientists, and policy makers with a new robust dataset that can be used to retrace and understand better the long history of vegetation and land cover changes in the Sahel. It should be noted for users to use these maps with care and take into account the limited amount of Landsat data available before the Landsat 7 era during the interpretation of these maps. A quality layer is therefore provided for each time period indicating the amount of valid Landsat overpasses on which the land cover and cover fraction maps are based. Furthermore, urban extents have not been historically updated. As soon as the German Aerospace Center releases its historical WSF-Evolution datasets [51], these will be imprinted in our land cover maps, and an update of the maps on the open-source platform will be issued.

Author Contributions

Conceptualization, N.S. and R.V.D.K.; methodology, N.S., M.B. and R.V.D.K.; software, M.B. and N.S.; validation, N.S, J.V., M.H., and N.-E.T.; formal analysis, N.S.; investigation, N.S.; resources, N.S., R.V.D.K., and M.B.; data curation, N.S.; writing, original draft preparation, N.S.; writing, review and editing, all; visualization, N.S.; supervision, R.V.D.K.; project administration, R.V.D.K., S.H., and B.S.; funding acquisition, R.V.D.K., S.H., H.V., J.V., and B.S. All authors read and agreed to the published version of the manuscript.

Funding

This research was funded by the Belgian Science Policy Office in the framework of the STEREOIII program (project U-TURN, Understanding Turning Points in Dryland Ecosystem Functioning, Grant SR/00/339).

Acknowledgments

We would like to thank the United States Geological Service (USGS) for making the Landsat archive publicly available and Google Earth Engine for providing their platform and computational resources. Furthermore, we would like to thank Martin Brandt (University of Copenhagen) for his valuable suggestions.

Conflicts of Interest

The authors declare no conflict of interest. The funders had no role in the design of the study; in the collection, analyses, or interpretation of data; in the writing of the manuscript; nor in the decision to publish the results.

Appendix A. List of Spectral Bands and Vegetation Indices Used as the Input for the Classification Algorithm

The following spectral band information and vegetation indices were used as input for the classification/regression algorithm:
  • Blue surface reflectance
  • Green surface reflectance
  • Red surface reflectance
  • Near-Infrared surface reflectance
  • Shortwave infrared 1 surface reflectance
  • Shortwave infrared 2 surface reflectance
  • Enhanced Vegetation Index (EVI) [65]
  • Normalized Burn Ratio (NBR) [66]
  • Normalized Burn Ratio 2 (NBR2) [66]
  • Normalized Difference Moisture Index (NDMI) [67]
  • Normalized Difference Vegetation Index (NDVI) [68]
  • Soil-adjusted Vegetation Index (SAVI) [69]
  • Modified Soil-adjusted Vegetation Index (MSAVI) [70]
  • Tasseled Cap Brightness Index (TCBRIGHT) [71]
  • Tasseled Cap Greenness Index (TCGREEN) [71]
  • Tasseled Cap Wetness Index (TCWET) [71]
  • Structure Insensitive Pigment Index (SIPI) [72]
  • Near-Infrared Reflectance of Vegetation (NIRV) [73]
  • Area Under the Curve (AUC)
  • Normalized Area Under the Curve (NAUC)
  • Angle at Near-Infrared (ANIR) [74]
For each of these bands and vegetation indices, the following metrics were calculated for the time period of interest (three or five year epoch) and used as the input for the classification/regression algorithm:
  • Mean
  • Median
  • 10th percentile
  • 90th percentile
  • 10th–90th percentile range
  • Four most important amplitudes of the time series generated by the fitted harmonic model (only for three year epochs)
  • Four most important phases of the time series generated by the fitted harmonic model (only for three year epochs)
  • Textural metric calculated based on the standard deviation of a 3 × 3 moving window for each pixel (only for three year epochs)
Lastly, topographic metrics (elevation, slope, aspect, and purity) were added.

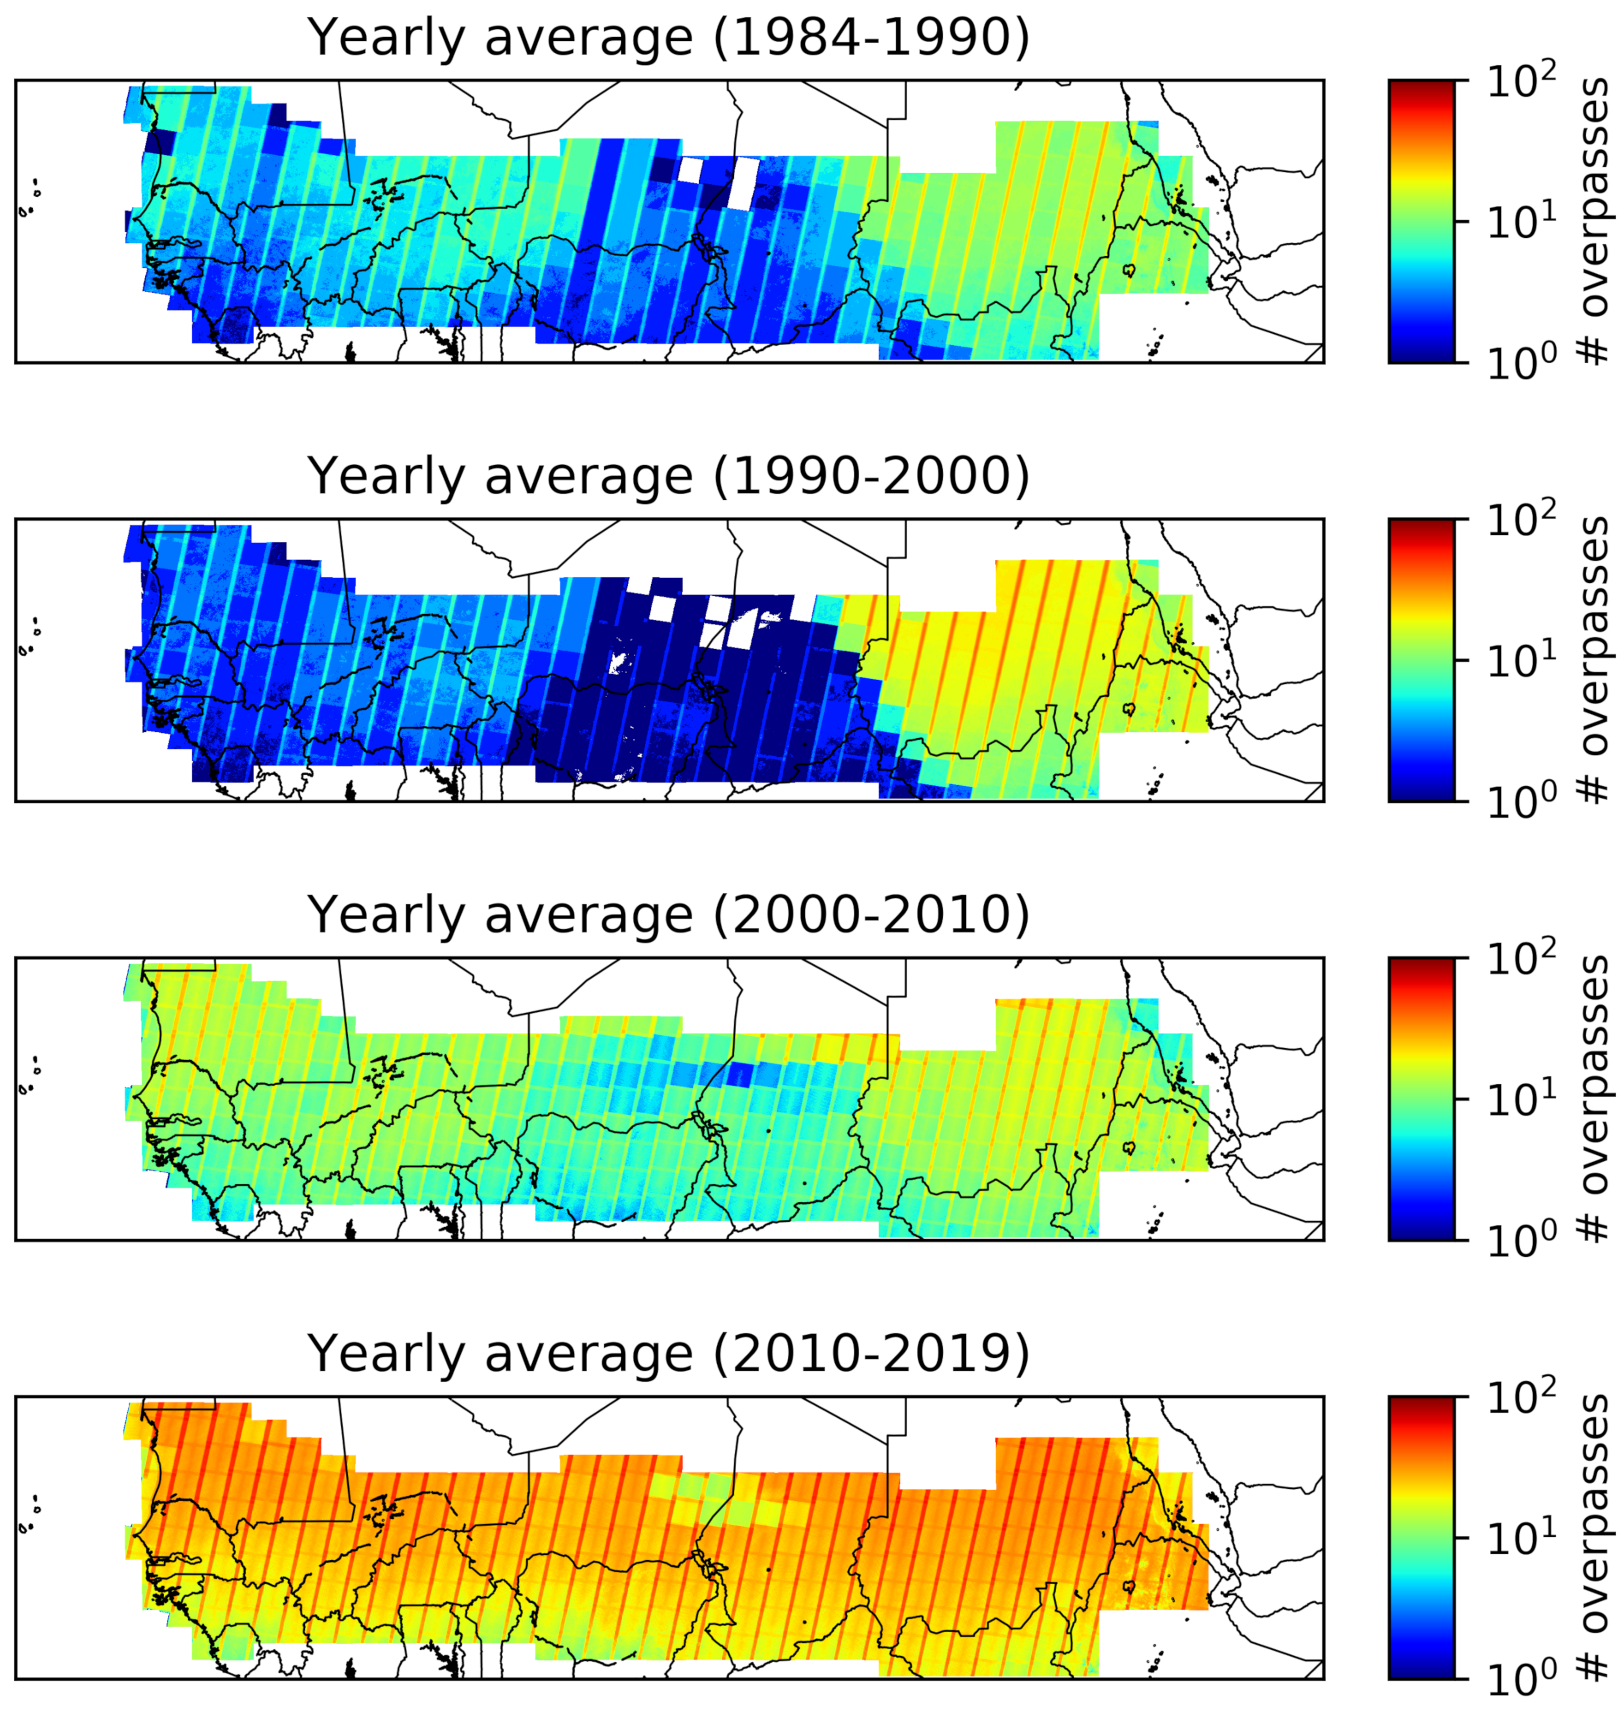
Appendix B. Spatial Visualization of the Yearly Average Amount of Cloud-Free Overpasses over the Study Area for Different Epochs

Figure A1. Spatial visualization of the yearly average amount of cloud-free overpasses for different time periods.
Remotesensing 12 03817 g0a1

Appendix C. Comparison between the 30 m Landsat Land Cover Map for the Sudano-Sahel and the 100 m Proba-V Land Cover Map

Buchhorn et al. [24] produced a global land cover map at 100 m spatial resolution using the same classification workflow as presented in this paper making use of Proba-V satellite data as the input for 2015 (Figure A2). The resulting map and statistical comparison for the Sudano-Sahel show many similarities compared to our 30 m map. The main difference can be found in the cropland class, which was much larger in Buchhorn et al. [24]. Agriculture is difficult to capture over the Sudano-Sahel, due to its similar spectral signature compared to grasslands. Buchhorn et al. [24] solved this by integrating expert rules regarding agricultural areas within this area, which are not compatible with working backward towards the past. As our goal is to detect land cover changes towards the past, a discrimination between spectral signatures of grassland and cropland detected by the random forest algorithm is necessary to detect changes between grassland and cropland in the historical time series, which is why we did not include this expert rule to avoid inconsistencies. For all other classes, a high agreement between both maps is obtained.
The accuracy of the cover fraction maps is comparable to the results obtained by the global 100 m land cover classification of Buchhorn et al. [24].
Figure A2. 2015 100 m land cover map for the Sudano-Sahel region produced using Proba-V satellite data [24]. A statistical comparison of the discrete classification is provided.
Remotesensing 12 03817 g0a2

Appendix D. Comparison between Historical Maps and the Maps of United States Geological Survey for West Africa

Historical maps for West Africa were produced by the USGS for the year 2000 and 2013 [61,62]. In order to facilitate the comparison with our maps, their land cover classification legend was harmonized to the discrete classification legend as defined in our maps using a conversion table (Table A1). For the three focal areas that encompass the USGS maps, a clear increase in agriculture is visible (Figure A3). This occurs mainly at the expense of shrubland and grassland areas, similar to the results obtained in our maps (compare with Figure 6). Despite the typical patterns of re-greening indicated in our results and confirmed by many authors [13,19,75,76,77], a substantial increase in bare areas is found over the Senegal focal area in the USGS maps. This lack of re-greening in the north of the Sahel accounts for a total loss of shrubland and grassland in their maps, while in our maps, the loss of shrubland and grassland caused by agricultural expansion is partly compensated by this northern re-greening.
Table A1. Harmonization of the classification legend of the USGS West Africa map.
Harmonized LegendUSGS Legend
ForestForest (1), Mangrove (7), Riparian forest (15), Degraded forest (21), Woodland (25), Swamp forest (28)
ShrublandSavanna (2), Shrub savanna (16), Fourré(23), Shrubland (32)
GrasslandSteppe (4), Bowé(22), Grass savanna (29), Herbaceous savanna (31)
CroplandPlantation (6), Agriculture (8), Irrigated agriculture (14), Bottomland agriculture (24), Agroforestry (27)
BareSand (10), Rocks (11), Bare (12), Open mine (78)
Built-upSettlements (13)
WetlandWetland (3), Oasis (5)
Figure A3. Senegal
Figure A3. Senegal
Remotesensing 12 03817 g0a3

References

  1. Olson, D.M.; Dinerstein, E.; Wikramanayake, E.D.; Burgess, N.D.; Powell, G.V.N.; Underwood, E.C.; D’amico, J.A.; Itoua, I.; Strand, H.E.; Morrison, J.C.; et al. Terrestrial Ecoregions of the World: A New Map of Life on Earth. BioScience 2001, 51, 933. [Google Scholar] [CrossRef]
  2. Hiernaux, P.; Diarra, L.; Trichon, V.; Mougin, E.; Soumaguel, N.; Baup, F. Woody plant population dynamics in response to climate changes from 1984 to 2006 in Sahel (Gourma, Mali). J. Hydrol. 2009, 375, 103–113. [Google Scholar] [CrossRef] [Green Version]
  3. Eberenz, J.; Verbesselt, J.; Herold, M.; Tsendbazar, N.E.; Sabatino, G.; Rivolta, G. Evaluating the potential of PROBA-V satellite image time series for improving LC classification in semi-arid African landscapes. Remote Sens. 2016, 8, 987. [Google Scholar] [CrossRef] [Green Version]
  4. Tong, X.; Brandt, M.; Hiernaux, P.; Herrmann, S.; Rasmussen, L.V.; Rasmussen, K.; Tian, F.; Tagesson, T.; Zhang, W.; Fensholt, R. The forgotten land use class: Mapping of fallow fields across the Sahel using Sentinel-2. Remote Sens. Environ. 2020, 239, 111598. [Google Scholar] [CrossRef]
  5. Nabil, M.; Zhang, M.; Bofana, J.; Wu, B.; Stein, A.; Dong, T.; Zeng, H.; Shang, J. Assessing factors impacting the spatial discrepancy of remote sensing based cropland products: A case study in Africa. Int. J. Appl. Earth Obs. Geoinf. 2020, 85, 102010. [Google Scholar] [CrossRef]
  6. Giannini, A.; Biasutti, M.; Verstraete, M.M. A climate model-based review of drought in the Sahel: Desertification, the re-greening and climate change. Glob. Planet. Chang. 2008, 64, 119–128. [Google Scholar] [CrossRef]
  7. Dardel, C.; Kergoat, L.; Hiernaux, P.; Mougin, E.; Grippa, M.; Tucker, C.J. Re-greening Sahel: 30 Years of remote sensing data and field observations (Mali, Niger). Remote Sens. Environ. 2014, 140, 350–364. [Google Scholar] [CrossRef]
  8. Brandt, M.; Mbow, C.; Diouf, A.A.; Verger, A.; Samimi, C.; Fensholt, R. Ground-and satellite-based evidence of the biophysical mechanisms behind the greening Sahel. Glob. Chang. Biol. 2015, 21, 1610–1620. [Google Scholar] [CrossRef] [Green Version]
  9. Bernardino, P.N.; De Keersmaecker, W.; Fensholt, R.; Verbesselt, J.; Somers, B.; Horion, S. Global-scale characterization of turning points in arid and semi-arid ecosystem functioning. Glob. Ecol. Biogeogr. 2020, 29, 1230–1245. [Google Scholar] [CrossRef] [Green Version]
  10. Vincke, C.; Diédhiou, I.; Grouzis, M. Long term dynamics and structure of woody vegetation in the Ferlo (Senegal). J. Arid Environ. 2010, 74, 268–276. [Google Scholar] [CrossRef]
  11. Ruelland, D.; Tribotte, A.; Puech, C.; Dieulin, C. Comparison of methods for LUCC monitoring over 50 years from aerial photographs and satellite images in a Sahelian catchment. Int. J. Remote Sens. 2011, 32, 1747–1777. [Google Scholar] [CrossRef]
  12. Brandt, M.; Romankiewicz, C.; Spiekermann, R.; Samimi, C. Environmental change in time series—An interdisciplinary study in the Sahel of Mali and Senegal. J. Arid Environ. 2014, 105, 52–63. [Google Scholar] [CrossRef]
  13. Brandt, M.; Hiernaux, P.; Rasmussen, K.; Mbow, C.; Kergoat, L.; Tagesson, T.; Ibrahim, Y.Z.; Wélé, A.; Tucker, C.J.; Fensholt, R. Assessing woody vegetation trends in Sahelian drylands using MODIS based seasonal metrics. Remote Sens. Environ. 2016, 183, 215–225. [Google Scholar] [CrossRef] [Green Version]
  14. Rasmussen, K.; D’haen, S.; Fensholt, R.; Fog, B.; Horion, S.; Nielsen, J.O.; Rasmussen, L.V.; Reenberg, A. Environmental change in the Sahel: Reconciling contrasting evidence and interpretations. Reg. Environ. Chang. 2016, 16, 673–680. [Google Scholar] [CrossRef]
  15. Ouedraogo, I.; Runge, J.; Eisenberg, J.; Barron, J.; Sawadogo Kaboré, S. The re-greening of the Sahel: Natural cyclicity or human-induced change? Land 2014, 3, 1075–1090. [Google Scholar] [CrossRef]
  16. Karlson, M.; Ostwald, M. Remote sensing of vegetation in the Sudano-Sahelian zone: A literature review from 1975 to 2014. J. Arid Environ. 2016, 124, 257–269. [Google Scholar] [CrossRef] [Green Version]
  17. Bégué, A.; Vintrou, E.; Ruelland, D.; Claden, M.; Dessay, N. Can a 25-year trend in Soudano-Sahelian vegetation dynamics be interpreted in terms of land use change? A remote sensing approach. Glob. Environ. Chang. 2011, 21, 413–420. [Google Scholar] [CrossRef]
  18. Fensholt, R.; Langanke, T.; Rasmussen, K.; Reenberg, A.; Prince, S.D.; Tucker, C.; Scholes, R.J.; Le, Q.B.; Bondeau, A.; Eastman, R.; et al. Greenness in semi-arid areas across the globe 1981–2007—An Earth Observing Satellite based analysis of trends and drivers. Remote Sens. Environ. 2012, 121, 144–158. [Google Scholar] [CrossRef]
  19. Herrmann, S.M.; Tappan, G.G. Vegetation impoverishment despite greening: A case study from central Senegal. J. Arid Environ. 2013, 90, 55–66. [Google Scholar] [CrossRef]
  20. Wood, E.C.; Tappan, G.G.; Hadj, A. Understanding the drivers of agricultural land use change in south-central Senegal. J. Arid Environ. 2004, 59, 565–582. [Google Scholar] [CrossRef]
  21. Miehe, S.; Kluge, J.; von Wehrden, H.; Retzer, V. Long-term degradation of Sahelian rangeland detected by 27 years of field study in Senegal. J. Appl. Ecol. 2010, 47, 692–700. [Google Scholar] [CrossRef]
  22. Sulla-Menashe, D.; Gray, J.M.; Abercrombie, S.P.; Friedl, M.A. Hierarchical mapping of annual global land cover 2001 to present: The MODIS Collection 6 Land Cover product. Remote Sens. Environ. 2019, 222, 183–194. [Google Scholar] [CrossRef]
  23. ESA. Land Cover CCI Product User Guide Version 2; Technical report; ESA: Louvain-La-Neuve, Belgium, 2017. [Google Scholar]
  24. Buchhorn, M.; Lesiv, M.; Tsendbazar, N.E.; Herold, M.; Bertels, L.; Smets, B. Copernicus Global Land Cover Layers—Collection 2. Remote Sens. 2020, 12, 1044. [Google Scholar] [CrossRef] [Green Version]
  25. Gong, P.; Wang, J.; Yu, L.; Zhao, Y.; Zhao, Y.; Liang, L.; Niu, Z.; Huang, X.; Fu, H.; Liu, S.; et al. Finer resolution observation and monitoring of global land cover: First mapping results with Landsat TM and ETM+ data. Int. J. Remote Sens. 2013, 34, 2607–2654. [Google Scholar] [CrossRef] [Green Version]
  26. Chen, J.; Chen, J.; Liao, A.; Cao, X.; Chen, L.; Chen, X.; He, C.; Han, G.; Peng, S.; Lu, M.; et al. Global land cover mapping at 30 m resolution: A POK-based operational approach. ISPRS J. Photogramm. Remote Sens. 2015, 103, 7–27. [Google Scholar] [CrossRef] [Green Version]
  27. Gong, P.; Liu, H.; Zhang, M.; Li, C.; Wang, J.; Huang, H.; Clinton, N.; Ji, L.; Li, W.; Bai, Y.; et al. Stable classification with limited sample: Transferring a 30-m resolution sample set collected in 2015 to mapping 10-m resolution global land cover in 2017. Sci. Bull. 2019, 64, 370–373. [Google Scholar] [CrossRef] [Green Version]
  28. Gong, W.; Fang, S.; Yang, G.; Ge, M. Using a Hidden Markov Model for Improving the Spatial-Temporal Consistency of Time Series Land Cover Classification. ISPRS Int. J. Geo-Inf. 2017, 6, 292. [Google Scholar] [CrossRef] [Green Version]
  29. Van Oort, P.A. Improving land cover change estimates by accounting for classification errors. Int. J. Remote Sens. 2005, 26, 3009–3024. [Google Scholar] [CrossRef]
  30. Verbesselt, J.; Hyndman, R.; Newnham, G.; Culvenor, D. Detecting trend and seasonal changes in satellite image time series. Remote Sens. Environ. 2010, 114, 106–115. [Google Scholar] [CrossRef]
  31. Zhu, Z.; Woodcock, C.E. Continuous change detection and classification of land cover using all available Landsat data. Remote Sens. Environ. 2014, 144, 152–171. [Google Scholar] [CrossRef] [Green Version]
  32. Liu, D.; Song, K.; Townshend, J.R.; Gong, P. Using local transition probability models in Markov random fields for forest change detection. Remote Sens. Environ. 2008, 112, 2222–2231. [Google Scholar] [CrossRef]
  33. Abercrombie, S.P.; Friedl, M.A. Improving the Consistency of Multitemporal Land Cover Maps Using a Hidden Markov Model. IEEE Trans. Geosci. Remote Sens. 2016, 54, 703–713. [Google Scholar] [CrossRef]
  34. Li, X.; Gong, P.; Liang, L. A 30-year (1984–2013) record of annual urban dynamics of Beijing City derived from Landsat data. Remote Sens. Environ. 2015, 166, 78–90. [Google Scholar] [CrossRef]
  35. Hermosilla, T.; Wulder, M.A.; White, J.C.; Coops, N.C.; Hobart, G.W. Disturbance-Informed Annual Land Cover Classification Maps of Canada’s Forested Ecosystems for a 29-Year Landsat Time Series. Can. J. Remote Sens. 2018, 44, 67–87. [Google Scholar] [CrossRef]
  36. Tsendbazar, N.E.; de Bruin, S.; Fritz, S.; Herold, M. Spatial accuracy assessment and integration of global land cover datasets. Remote Sens. 2015, 7, 15804–15821. [Google Scholar] [CrossRef] [Green Version]
  37. Sissoko, K.; van Keulen, H.; Verhagen, J.; Tekken, V.; Battaglini, A. Agriculture, livelihoods and climate change in the West African Sahel. Reg. Environ. Chang. 2011, 11, 119–125. [Google Scholar] [CrossRef] [Green Version]
  38. Horion, S.; Prishchepov, A.V.; Verbesselt, J.; de Beurs, K.; Tagesson, T.; Fensholt, R. Revealing turning points in ecosystem functioning over the Northern Eurasian agricultural frontier. Glob. Chang. Biol. 2016, 22, 2801–2817. [Google Scholar] [CrossRef]
  39. Buchhorn, M.; Smets, B.; Bertels, L.; Lesiv, M.; Tsendbazar, N.E. Copernicus Global Land Service: Land Cover 100m: Version 2 Globe 2015: Algorithm Theoretical Basis Document; Technical Report; Copernicus Global Land Operation: Geneva, Switzerland, 2019. [Google Scholar] [CrossRef]
  40. Wulder, M.A.; Coops, N.C.; Roy, D.P.; White, J.C.; Hermosilla, T. Land cover 2.0. Int. J. Remote Sens. 2018, 39, 4254–4284. [Google Scholar] [CrossRef] [Green Version]
  41. Gorelick, N.; Hancher, M.; Dixon, M.; Ilyushchenko, S.; Thau, D.; Moore, R. Google Earth Engine: Planetary-scale geospatial analysis for everyone. Remote Sens. Environ. 2017, 202, 18–27. [Google Scholar] [CrossRef]
  42. Roy, D.; Kovalskyy, V.; Zhang, H.; Vermote, E.; Yan, L.; Kumar, S.; Egorov, A. Characterization of Landsat-7 to Landsat-8 reflective wavelength and normalized difference vegetation index continuity. Remote Sens. Environ. 2016, 185, 57–70. [Google Scholar] [CrossRef] [Green Version]
  43. Roerink, G.J.; Menenti, M.; Verhoef, W. Reconstructing cloudfree NDVI composites using Fourier analysis of time series. Int. J. Remote Sens. 2000, 21, 1911–1917. [Google Scholar] [CrossRef]
  44. Markham, B.L.; Storey, J.C.; Williams, D.L.; Irons, J.R. Landsat sensor performance: History and current status. IEEE Trans. Geosci. Remote Sens. 2004, 42, 2691–2694. [Google Scholar] [CrossRef]
  45. White, J.C.; Wulder, M.A.; Hobart, G.W.; Luther, J.E.; Hermosilla, T.; Griffiths, P.; Coops, N.C.; Hall, R.J.; Hostert, P.; Dyk, A.; et al. Pixel-based image compositing for large-area dense time series applications and science. Can. J. Remote Sens. 2014, 40, 192–212. [Google Scholar] [CrossRef] [Green Version]
  46. Potapov, P.; Turubanova, S.; Hansen, M.C. Regional-scale boreal forest cover and change mapping using Landsat data composites for European Russia. Remote Sens. Environ. 2011, 115, 548–561. [Google Scholar] [CrossRef]
  47. Fritz, S.; See, L.; Perger, C.; McCallum, I.; Schill, C.; Schepaschenko, D.; Duerauer, M.; Karner, M.; Dresel, C.; Laso-Bayas, J.C.; et al. A global dataset of crowdsourced land cover and land use reference data. Sci. Data 2017, 4, 170075. [Google Scholar] [CrossRef] [Green Version]
  48. Jamali, S.; Seaquist, J.; Eklundh, L.; Ardö, J. Automated mapping of vegetation trends with polynomials using NDVI imagery over the Sahel. Remote Sens. Environ. 2014, 141, 79–89. [Google Scholar] [CrossRef]
  49. Pekel, J.F.; Cottam, A.; Gorelick, N.; Belward, A.S. High-resolution mapping of global surface water and its long-term changes. Nature 2016, 540, 418–422. [Google Scholar] [CrossRef]
  50. Marconcini, M.; Metz-Marconcini, A.; Üreyen, S.; Palacios-Lopez, D.; Hanke, W.; Bachofer, F.; Zeidler, J.; Esch, T.; Gorelick, N.; Kakarla, A.; et al. Outlining Where Humans Live—The World Settlement Footprint 2015. Sci. Data 2020, 7, 242. [Google Scholar] [CrossRef]
  51. Marconcini, M.; Gorelick, N.; Metz-Marconcini, A.; Esch, T. Mapping the Global Settlement Growth from 1985 to 2015-the World Settlement Footprint Evolution Dataset; American Geophysical Union: Washington, DC, USA, 2018. [Google Scholar]
  52. Jia, K.; Liang, S.; Wei, X.; Zhang, L.; Yao, Y.; Gao, S. Automatic land-cover update approach integrating iterative training sample selection and a markov random field model. Remote Sens. Lett. 2014, 5, 148–156. [Google Scholar] [CrossRef]
  53. Gong, P.; Yu, L.; Li, C.; Wang, J.; Liang, L.; Li, X.; Ji, L.; Bai, Y.; Cheng, Y.; Zhu, Z. A new research paradigm for global land cover mapping. Ann. GIS 2016, 22, 87–102. [Google Scholar] [CrossRef] [Green Version]
  54. Salberg, A.B.; Trier, D. Temporal Analysis of Forest Cover Using Hidden Markov models. In Proceedings of the International Geoscience and Remote Sensing Symposium (IGARSS), Vancouver, QC, Canada, 24–29 July 2011; pp. 2322–2325. [Google Scholar] [CrossRef]
  55. FAO. Global Forest Resources Assesment 2015; Technical Report; FAO: Rome, Italy, 2015. [Google Scholar]
  56. Roques, K.; O’Connor, T.; Watkinson, A. Dynamics of shrub encroachment in an African savanna: Relative influences of fire, herbivory, rainfall and density dependence. J. Appl. Ecol. 2001, 38, 268–280. [Google Scholar] [CrossRef]
  57. Schwieder, M.; Leitão, P.J.; da Cunha Bustamante, M.M.; Ferreira, L.G.; Rabe, A.; Hostert, P. Mapping Brazilian savanna vegetation gradients with Landsat time series. Int. J. Appl. Earth Obs. Geoinf. 2016, 52, 361–370. [Google Scholar] [CrossRef]
  58. Brandt, M.; Verger, A.; Diouf, A.A.; Baret, F.; Samimi, C. Local vegetation trends in the Sahel of Mali and Senegal using long time series FAPAR satellite products and field measurement (1982–2010). Remote Sens. 2014, 6, 2408–2434. [Google Scholar] [CrossRef] [Green Version]
  59. Biasutti, M. Rainfall trends in the African Sahel: Characteristics, processes, and causes. Wiley Interdiscip. Rev. Clim. Chang. 2019, 10, e591. [Google Scholar] [CrossRef] [Green Version]
  60. Lambert, M.J.; Waldner, F.; Defourny, P. Cropland Mapping over Sahelian and Sudanian Agrosystems: A Knowledge-Based Approach Using PROBA-V Time Series at 100-m. Remote Sens. 2016, 8, 232. [Google Scholar] [CrossRef] [Green Version]
  61. Tappan, G.; Cushing, W.; Cotillon, S.; Mathis, M.; Hutchinson, J.; Herrmann, S.; Dalsted, K. West Africa Land Use Land Cover Time Series: U.S. Geological Survey Data Release; U.S. Geological Survey: Reston, VA, USA, 2016. [Google Scholar] [CrossRef]
  62. Cotillon, S.E. West Africa Land Use and Land Cover Time Series; Technical report; U.S. Geological Survey: Reston, VA, USA, 2017. [Google Scholar] [CrossRef]
  63. Hansen, M.C.; Potapov, P.V.; Moore, R.; Hancher, M.; Turubanova, S.A.; Tyukavina, A.; Thau, D.; Stehman, S.V.; Goetz, S.J.; Loveland, T.R.; et al. High-Resolution Global Maps of 21st-Century Forest Cover Change. Science 2013, 342, 850–853. [Google Scholar] [CrossRef] [Green Version]
  64. Brandt, M.; Tucker, C.J.; Kariryaa, A.; Rasmussen, K.; Abel, C.; Small, J.; Chave, J.; Rasmussen, L.V.; Hiernaux, P.; Diouf, A.A.; et al. An unexpectedly large count of trees in the West African Sahara and Sahel. Nature 2020, 587, 78–82. [Google Scholar] [CrossRef]
  65. Huete, A.; Didan, K.; Miura, T.; Rodriguez, E.P.; Gao, X.; Ferreira, L.G. Overview of the radiometric and biophysical performance of the MODIS vegetation indices. Remote Sens. Environ. 2002, 83, 195–213. [Google Scholar] [CrossRef]
  66. López García, M.; Caselles, V. Mapping burns and natural reforestation using thematic Mapper data. Geocarto Int. 1991, 6, 31–37. [Google Scholar] [CrossRef]
  67. Jin, S.; Sader, S.A. Comparison of time series tasseled cap wetness and the normalized difference moisture index in detecting forest disturbances. Remote Sens. Environ. 2005, 94, 364–372. [Google Scholar] [CrossRef]
  68. Rouse, J.W.; Hass, R.H.; Schell, J.; Deering, D. Monitoring vegetation systems in the great plains with ERTS. In Proceedings of the Third Earth Resources Technology Satellite (ERTS) Symposium, Washington, DC, USA, 10–14 December 1973; pp. 309–317. [Google Scholar]
  69. Huete, A. A soil-adjusted vegetation index (SAVI). Remote Sens. Environ. 1988, 25, 295–309. [Google Scholar] [CrossRef]
  70. Qi, J.; Chehbouni, A.; Huete, A.R.; Kerr, Y.H.; Sorooshian, S. A modified adjusted vegetation index (MSAVI). Remote Sens. Environ. 1994, 48, 119–126. [Google Scholar] [CrossRef]
  71. Crist, E.; Cicone, R. A Physically-Based Transformation of Thematic Mapper Data-The TM Tasseled Cap. IEEE Trans. Geosci. Remote Sens. 1984, 22, 256–263. [Google Scholar] [CrossRef]
  72. Penuelas, J.; Baret, F.; Filella, I. Semi-empirical indices to assess carotenoids/chlorophyll a ratio from leaf spectral reflectance. Photosynthetica 1995, 31, 221–230. [Google Scholar]
  73. Badgley, G.; Field, C.B.; Berry, J.A. Canopy near-infrared reflectance and terrestrial photosynthesis. Sci. Adv. 2017, 3, e1602244. [Google Scholar] [CrossRef] [Green Version]
  74. Khanna, S.; Palacios-Orueta, A.; Whiting, M.L.; Ustin, S.L.; Riaño, D.; Litago, J. Development of angle indexes for soil moisture estimation, dry matter detection and land-cover discrimination. Remote Sens. Environ. 2007, 109, 154–165. [Google Scholar] [CrossRef]
  75. Fensholt, R.; Rasmussen, K.; Kaspersen, P.; Huber, S.; Horion, S.; Swinnen, E. Assessing land degradation/recovery in the African Sahel from long-term earth observation based primary productivity and precipitation relationships. Remote Sens. 2013, 5, 664–686. [Google Scholar] [CrossRef] [Green Version]
  76. Brandt, M.; Rasmussen, K.; Hiernaux, P.; Herrmann, S.; Tucker, C.J.; Tong, X.; Tian, F.; Mertz, O.; Kergoat, L.; Mbow, C.; et al. Reduction of tree cover in West African woodlands and promotion in semi-arid farmlands. Nat. Geosci. 2018, 11, 328–333. [Google Scholar] [CrossRef]
  77. Anchang, J.Y.; Prihodko, L.; Kaptué, A.T.; Ross, C.W.; Ji, W.; Kumar, S.S.; Lind, B.; Sarr, M.A.; Diouf, A.A.; Hanan, N.P. Trends in Woody and Herbaceous Vegetation in the Savannas of West Africa. Remote Sens. 2019, 11, 576. [Google Scholar] [CrossRef] [Green Version]
Figure 2. Methodological workflow used in this paper. Green indicates output products. Details can be found in Section 2.
Remotesensing 12 03817 g002
Figure 3. Median cloud-free Landsat overpass amounts per pixel over the Sudano-Sahel study area. The error bars indicate the spatial variability (10th–90th percentile).
Remotesensing 12 03817 g003
Figure 4. Discrete land cover classification at 30 m for the Sudano-Sahel for 2015, including several high resolution insets.
Remotesensing 12 03817 g004
Figure 5. The cover fraction layers for the eight base land cover classes for the Sudano-Sahel for 2015. Higher saturation indicates higher cover fractions scaled between 0 and 100%.
Remotesensing 12 03817 g005
Figure 6. Land cover classification for 2015 and the earliest historical period. The hidden Markov model was applied to remove spurious changes. White areas are masked due to limited satellite overpasses. The historical time series of land cover evolution averaged over each focal area is depicted on the right.
Remotesensing 12 03817 g006
Figure 7. Cropland expansion southeast of Khartoum from 1986–2015. Khartoum is indicated by the red dot in the overview figure (top), while the area of interest is denoted by a square.
Remotesensing 12 03817 g007
Figure 8. (a) Forest decrease based on tree cover fraction results from our study and Hansen et al. [63]. Tree cover fraction for Guinea in 2000 (b) and 2015 (c). Higher saturation indicates higher tree cover fractions. The red areas indicate protected areas by the government and are respectively (from north to south) the national parks of Badiar, the Upper Niger, and the Ziama Massif. (d) The Hansen tree cover loss between 2000 and 2015 (right) [63].
Remotesensing 12 03817 g008
Table 1. Overview of the historical maps produced in this study for the focal areas defined in Figure 1.
SenegalBurkina FasoNigeria-NigerSudan
2010–2015All yearsAll yearsAll yearsAll years
2005xxxx
2000xxxx
1995 x
1990 x
1988xx
1986 x
Table 2. Area-weighed confusion matrix of the discrete classification result between the different land cover classes for the Sudano-Sahel for 2015. Users’ and producers’ accuracy are denoted in the final column and row. Numbers in parentheses take into account spectral similarities between forest and shrubland on the one hand and shrubland and grassland on the other hand.
Reference
ForestShrublandGrasslandCroplandBuilt-upBareWaterWetlandTotalUsers acc.
PredictedForest11.2 (14.6)3.2 (0.0)1.40.50.00.20.00.016.5 (16.7)68.1 (87.6)
Shrubland3.4 (0.0)8.0 (14.6)5.0 (0.0)0.90.01.10.00.018.4 (16.7)43.3 (87.5)
Grassland1.63.5 (0.0)19.1 (24.0)1.30.03.10.10.128.7 (30.4)66.5 (79.7)
Cropland0.50.71.36.50.00.30.00.09.469.4
Built-up0.30.00.40.00.32.00.00.03.08.4
Bare0.00.30.60.00.021.90.00.022.995.6
Water0.00.00.00.00.00.00.10.00.147.7
Wetland0.10.10.10.10.00.00.10.71.165.3
Total17.115.727.99.30.328.60.20.8100
Prod.acc.65.9 (85.5)50.5 (92.9)68.4 (86.2)70.081.976.529.182.0 67.7 (82.7)
Table 3. Accuracy of the fractional land covers for the Sudano-Sahel for 2015.
TreeShrublandGrasslandCropsBareBuilt-Up
RMSE16.420.433.221.515.211.3
MAE8.714.924.38.64.51.8
Publisher’s Note: MDPI stays neutral with regard to jurisdictional claims in published maps and institutional affiliations.

