Article

Growth Stage Classification and Harvest Scheduling of Snap Bean Using Hyperspectral Sensing: A Greenhouse Study

by
Amirhossein Hassanzadeh
1,*,
Sean P. Murphy
2,
Sarah J. Pethybridge
2 and
Jan van Aardt
1
1
Chester F. Carlson Center for Imaging Science, Rochester Institute of Technology, Rochester, NY 14623, USA
2
Plant Pathology and Plant-Microbe Biology Section, School of Integrative Plant Science, Cornell AgriTech at The New York State Agricultural Experiment Station, Cornell University, Geneva, NY 14456, USA
*
Author to whom correspondence should be addressed.
Remote Sens. 2020, 12(22), 3809; https://doi.org/10.3390/rs12223809
Submission received: 19 October 2020 / Revised: 10 November 2020 / Accepted: 13 November 2020 / Published: 20 November 2020

Abstract

:
The agricultural industry suffers from a significant amount of food waste, some of which originates from an inability to apply site-specific management at the farm-level. Snap bean, a broad-acre crop that covers hundreds of thousands of acres across the USA, is not exempt from this need for informed, within-field, and spatially-explicit management approaches. This study aimed to assess the utility of machine learning algorithms for growth stage and pod maturity classification of snap bean (cv. Huntington), as well as detecting and discriminating spectral and biophysical features that lead to accurate classification results. Four major growth stages and six main sieve size pod maturity levels were evaluated for growth stage and pod maturity classification, respectively. A point-based in situ spectroradiometer in the visible-near-infrared and shortwave-infrared domains (VNIR-SWIR; 400–2500 nm) was used and the radiance values were converted to reflectance to normalize for any illumination change between samples. After preprocessing the raw data, we approached pod maturity assessment with multi-class classification and growth stage determination with binary and multi-class classification methods. Results from the growth stage assessment via the binary method exhibited accuracies ranging from 90–98%, with the best mathematical enhancement method being the continuum-removal approach. The growth stage multi-class classification method used raw reflectance data and identified a pair of wavelengths, 493 nm and 640 nm, in two basic transforms (ratio and normalized difference), yielding high accuracies (~79%). Pod maturity assessment detected narrow-band wavelengths in the VIS and SWIR region, separating between not ready-to-harvest and ready-to-harvest scenarios with classification measures at the ~78% level by using continuum-removed spectra. Our work is a best-case scenario, i.e., we consider it a stepping-stone to understanding snap bean harvest maturity assessment via hyperspectral sensing at a scalable level (i.e., airborne systems). Future work involves transferring the concepts to unmanned aerial system (UAS) field experiments and validating whether or not a simple multispectral camera, mounted on a UAS, could incorporate < 10 spectral bands to meet the need of both growth stage and pod maturity classification in snap bean production.

1. Introduction

Snap bean is one of the largest sources of broad-acre crop income in the United States, and is planted from California to New York [1]. However, more than four million pounds of the harvested snap bean was disposed of unsold in 2017 [1]. One of the contributing factors to overall “food loss” is our lack of understanding, developing, and adopting site-specific crop management, with one example being crop growth stage assessment, e.g., when and where to schedule the harvest, or apply pesticides and fertilizers. Precision agriculture, or site-specific management, has been shown to provide management inputs that could maximize output by optimizing inputs [2]. This approach has been put into practice in recent decades via a variety of remote sensing systems [3]. Remote sensing systems are non-destructive in nature, provide rapid data collection, and offer synoptic coverage, via ground-based (e.g., spectroradiometers), airborne (e.g., aircraft and UAS), or spaceborne (satellite) platforms [4,5]. Precision agriculture and remote sensing thus are closely tied and poised to take advantage of sensors, such as hyperspectral and structural systems, that exceed our visual assessment ability.
Most spectral imaging systems are categorized as either of the multispectral and hyperspectral (imaging spectroscopy) types, with the former defined as broader, non-contiguous bands and the latter as containing narrow, contiguous spectral coverage [6]. The spectral range covered by these devices differ between applications, from visible-to-near-infrared (VNIR; 380–1000 nm) enabling assessments of (i) soil properties [7,8,9,10,11], (ii) crop disease [12,13], (iii) crop yield [14,15,16], (iv) crop ripeness [15,17,18]; to shortwave- (SWIR; 1000–2500 nm), midwave-, and far-infrared (1–200 µm), with applications focused on chemical identification in the food industry [19,20,21,22] and soil analysis [23,24]. We will focus our discussion on the VNIR-SWIR, due to its pivotal role in crop analysis.
The electromagnetic energy incident on crops results in a unique spectral characterization, which is called a spectral signature (or spectral response), associated with either vegetation as general cover type, or the physiological state of a plant [25]. As a plant grows, its biochemical composition is altered and in turn impacts the spectral response [26]. This change in the spectral response of crops typically is more pronounced in the VNIR-SWIR region, in terms of spectral curve shape, amplitude, and absorption features [27]. The change in crop spectral behavior in the VNIR-SWIR region is dominated by pigment levels, scattering due to intercellular leaf structure, water status, etc. [28,29,30]. These variabilities in crop spectral behavior have led scholars to use spectral information to assess plant health, growth, and deviation from an “ideal” seasonal spectral evolution. We will focus on the applications related to growth stage assessment using two different approaches in this context, namely machine learning techniques and spectral indicators.
Machine learning-based crop growth stage assessment, among many other applications [31,32,33,34,35], has gained traction with the advent of artificial intelligence approaches. Doktor et al. (2014) studied the use of random forests (RF) to extract the physiological status of summer barley crops using simulated signatures, as well as hyperspectral laboratory and field measurements in the VNIR-SWIR region [36]. Their results show that random forests can explain much of the variability (R2 = 0.80–0.89) in leaf area index (LAI) using spectral data. Yuan et al. (2017) also evaluated the use of machine learning techniques on VNIR hyperspectral data for LAI assessment [37]. Their findings show that RF proved the most accurate when compared to other approaches, with a high coefficient of determination (R2 = 0.74). Senthilnath et al. (2013), on the other hand, investigated crop stage classification using hyperspectral images, using dimensionality reduction via principal component analysis (PCA), followed by an unsupervised clustering method with the objective of distinguishing between three different growth stages of wheat [38]. Findings from this study showed a high efficiency (ɳ = 81.5%), as well as an acceptable kappa coefficient (κ = 0.72).
Spectral indicators and vegetation indices (i.e., a mathematical transform or formulation based on two or more bands) have proven advantageous in terms of rapid assessment of crop spectra, with an extension to crop growth stage assessment [26,39]. Vegetation indices are classified as either of the broad- or narrow-band type [40]. Narrow-band indices correspond to fine spectral resolution and are more sensitive to subtle changes in the spectrum, whereas broad-band indices take advantage of coarser spectral resolution. The peak in the first derivative of reflectance spectra between 680–750 nm, known as red edge peak, is a narrow-band spectral indicator of plant stress and age [41,42]. On the other hand, broadband indices, such as the ratio vegetation index (RVI; [43]) and normalized vegetation index (NDVI; [44]), highlight relative biomass, as well as plant vigor/health/leaf area [43]. It also is important to briefly differentiate between plant maturity contexts, which focus either on the fruit-level or plant-level.
Fruit maturity assessment often involves correlating internal characteristics (e.g., chlorophyll, firmness, soluble solid content, moisture content, etc.) with ripeness, using various techniques, such as colorimetry [45,46,47,48,49], RGB imaging [48,49,50,51,52], VNIR spectroscopy [53,54,55,56,57] hyperspectral imaging [58,59,60,61,62], and multispectral imaging [60,63,64,65,66]. However, there is a general lack of research regarding plant- or leaf-level ripeness evaluation. A study by Johnson et al. (2004) addressed ripeness assessment of coffee fields via airborne multispectral imagery [67]. The authors called for additional future work, given the inverse correlation of the introduced ripeness index with ground truth ripeness measurements. Furthermore, Merzlyak et al. (1999) assessed both fruit ripening and leaf-level senescence of multiple crops using visible to near-infrared (VNIR) spectroscopy [68]. A reflectance index (plant senescence reflective index; PSRI) based on the 500 nm, 678 nm, and 700 nm bands, was identified as a quantitative measure that could explain both maturity measures (fruit ripening and leaf senescence). It is with studies such as these in mind, that we developed a detailed experimental setup to evaluate our ability to assess growth stages and optimal harvest scheduling, with snap bean as a proxy crop.
We hypothesize that growth stage and pod maturity assessment of snap bean for precision agriculture purposes can be addressed via hyperspectral systems, since growth and maturity are functions of spectral and biophysical features. The objectives of this research therefore were to: (i) evaluate the feasibility of snap bean growth stage assessment using a machine learning and spectral indices approach; (ii) assess snap bean pod maturity level via machine learning techniques, and (iii) determine spectral and biophysical attributes that correspond to accurate growth stage and pod maturity classification.

2. Materials and Methods

2.1. Study Area

This study was carried out in a greenhouse located at Rochester Institute of Technology (RIT), Rochester, NY, during March–May 2019. One hundred forty-two snap bean seeds (cv. Huntington) were sown on March 6, 2019, in a peat moss-based potting mix (“Potting Mix”, Miracle-Gro), after which 48 plants were moved to 6-inch diameter pots, when at least 50% of the seeds had germinated (see Figure 1).

2.2. Plant Growth Characteristics

Each plant was considered a single sampling unit. All samples were irrigated every two days with 500 mL of water, and artificial light (tungsten–halogen light), as well as natural sunlight, were available to plants. Two different harvests were scheduled for this experiment; plants 1–24 were harvested when 50% of the 24 samples showed pods of industry sieve size 4–6, and plants 25–48 were harvested when 70% of the 24 samples carried pods of sieve size 4–6. The four critical growth periods, as outlined by Fernández et al. (1986) were defined as vegetative growth (i.e., first to second trifoliate; V3–V4), budding (i.e., pre-flowering; R5), flowering (R6), and pod formation (R7–R9); each was determined when at least 50% of plants from each harvest set showed corresponding signs (see Figure 2) [69].
Six different pod stages, marked by industry sieve sizes (sieve size 1, [S1] < 5.8 mm; sieve size 2, 5.8 mm < [S2] < 7.5 mm; sieve size 3, 7.5 mm < [S3] < 8.5 mm; sieve size 4, 8.5 mm < [S4] < 9.7 mm; sieve size 5, 9.7 mm < [S5] < 10.9 mm; sieve size 6, [S6] > 10.9 mm), were used to classify pods non-destructively (i.e., pods remained on plant) during the pod formation stage. It would be worthwhile to mention that these measurements are widths of the pods. At the time of harvest, however, pods from plants were destructively removed, classified into different sieve sizes, and the average pod weight of each sieve size was determined. This average pod weight was then multiplied by the number of pods per sieve size per plant (recorded during pod formation stage), and the category that had the maximum weighted mass was assigned as the plant maturity level.

2.3. Data Collection

Hyperspectral and biophysical data were collected every 2–3 days after 50% of plants showed second trifoliate emergence (i.e., large enough canopy cover to encompass as much of the spectroradiometer’s field of view ([FOV] as possible). This temporal resolution allowed us to capture data 25 times during the growth cycle of 69 days. A Spectra Vista Corporation spectroradiometer (“HR-1024i” model, Spectra Vista Corporation, Poughkeepsie, NY) was used to collect the hyperspectral data. This device captures hyperspectral data in 978 bands, ranging from VIS to SWIR (350-2500 nm), which are collected via three different detectors; silicon, InGaAs, and extended InGaAs detectors, responsible for the 350–1000 nm, 1000-1890 nm, and 1890–2500 nm ranges, respectively. A 14° FOV fore-optic lens was utilized for accurate pointing accuracy, with a resultant sampling diameter of 3–4 cm, at 15–20 cm height above the plant canopy. In order to ensure a repeatable data acquisition procedure, a plant’s center was directly positioned beneath the center of the FOV (marked by the spectrometer’s laser). The spectroradiometer was installed on a height-adjustable platform, covered on both sides with two tungsten–halogen lamps that provided incident electromagnetic energy throughout the VIS-SWIR region (see Figure 3a). Plant biophysical attributes (PHY), namely height, canopy width (along the longest axis), and the number of leaves, were concurrently collected with spectral data (spec.) acquisition to evaluate whether or not structural information may improve the performance of the growth stage classification.
This study thus aimed to assess a best-case scenario, i.e., one for which a high signal-to-noise ratio (SNR) and pure, limited-background vegetative spectra were observed. This was enabled via the setup depicted in Figure 3a, where we covered the collection chamber with thick black felt to inhibit any external, stray light from entering the assembly. Moreover, to ensure a pure vegetative spectrum, a collar-shaped black felt was used to cover the base of the plant to effectively exclude the soil signal from each spectral sample (see Figure 3b). Calibration to reflectance was achieved using a Spectralon panel (see Figure 3c), set on a tripod to coincide with plant height, thereby minimizing illumination differences or variability between sample and collection days. There still existed system and/or spectral noise in few regions; we therefore omitted select spectral ranges from the analysis: 335–480 nm, due to detector fall off and associated low SNR, and 850–1000 nm, 1900–2000 nm, 2400–2500 nm regions, due to low SNR caused by detector overlap [70]. This step reduced the original 978 bands (before data cleaning) to 678 bands. The next step involved data dimensionality reduction, a common approach when dealing with oversampled (hyper)spectral data [71,72].

2.4. Principal Component Analysis

Principal component analysis (PCA), a proven approach for variability assessment, outlier detection, and dimensionality reduction, was used to evaluate spectral variability in the data set [73,74,75]. PCA is a linear transform of a random variable into a new space, such that the projected features (i.e., principal components) have maximum variance and are orthogonal to one another. The mathematical expression, shown below in (1), contains X is the random vector, e as the jth normalized eigenvectors, sorted in descending order, and P as the corresponding jth principal component:
P j = e j T X
Var P j   =   λ j
This mathematical transformation will result in principal components, with the first principal component exhibiting the highest variability (X; [76]).

2.5. Data Analysis

Several preprocessing steps were applied to the spectral data set. The Small’s and χ-squared tests for multivariate normality were used to identify the proper approach, i.e., parametric vs. non-parametric, for classification analysis [77]. Moreover, due to different scales and units between spectral and biophysical features, we scaled all features to a specific range (0–1 in our study), enabling all features to have the same influence on the analysis [77].

2.5.1. Growth Stage Binary Classification

Scholars and crop growers both are keenly interested in evaluating plant maturity stages and transitions, for scientific or practical, management reasons, respectively. We approached such a growth stage classification as either a binary or multi-class classification. The binary classification approach includes a spectral enhancement step, in addition to using raw reflectance data, as an input to the classifier. Mathematical enhancement techniques include the Savitzky–Golay filter for smoothing and first derivative calculation, and the well-known continuum-removal (CR) approach [78,79]. A configuration of 11 bands, with a second-order smoothing polynomial, was utilized in this study for the Savitzky–Golay approach to reduce spectral noise artifacts, without suppressing pertinent absorption features [70]. The continuum-removal approach was implemented to enhance absorption features in the 555–775 nm, 1120–1265 nm, 1275–1675 nm, 1676–1825 nm, and 1900–2397 nm regions, due to their tie to chlorophyll absorption, structural and water absorption, sugar, protein, and nitrogen absorption, and cellulose and lignin absorption, respectively [79]. Table 1 represents the number of samples in each data set that was used in the analysis in a one-vs.-rest fashion. We ensured an unbiased classification procedure by balancing classes via random sampling.
These mathematically-enhanced spectra were then subjected to a logistic regression routine to calculate the corresponding per-wavelength discriminating power (C-index; [80,81]). Consequently, C-indices of all features were ordered in descending fashion and collinearity was assessed in a pairwise fashion in order to remove features with high collinearity. Features with an absolute correlation coefficient (Pearson’s r) of 0.7 and higher were removed, while maintaining the one with the higher C-index [82]. This approach was essential to avoid potential overfitting in the analysis.
We used nine different parametric and non-parametric classifiers, namely logistic regression (LR), a support vector machine (SVM), a linear support vector classifier (LSVM), the K nearest neighbor (KNN) algorithm, a naïve Bayes (NB) approach, perceptron (Perc.) stochastic gradient descent (SGD), decision trees (DT), and a random forest (RF) method to evaluate the performance of our analysis [83,84,85,86,87,88,89,90]. We used four-fold cross-validation for vegetative growth and flowering and a 10-fold approach for budding and pod formation in order to ensure an unbiased judgment of classifier performance, as well as classifier efficiency on new data (i.e., test data) [91]. This difference in the number of folds is due to sample size for each test (see Table 1). Finally, the false positive rate (FPR) and true positive rate (TPR) were recorded, along with overall accuracy, averaged across all folds. The mentioned scores are presented in terms of receiver operating characteristic (ROC) curves and confusion matrices [92]. The accuracy metric used in this study was average accuracy [92].

2.5.2. Growth Index Classification

Over 200,000 combinations, derived from a two-band-index approach, were selected for the 678 spectral bands (i.e., C 2 678 ) and used as input to the SVM to identify the pair that resulted in the highest accuracy, derived from five-fold cross-validation, for the four growth stages. Two different arrangements of wavelengths were examined in this study for multi-class classification: (i) ratio indices (i.e., w 1 w 2 ) and (ii) normalized difference indices (i.e., w 1 w 2 w 1 + w 2 ). The ratio index was named the snap-bean growth index (SGI), while the normalized form was called the normalized difference snap-bean growth index (NDSI). The reported score was average accuracy. We ensured that our classes were balanced, where such a balanced data set for the multi-class classification approach contained 48 samples of each growing stage, totaling 192 samples.

2.5.3. Pod Maturity Classification

The multiclass classification procedure, used for multiclass growth stage assessment, was used to evaluate multiclass pod maturity classification with five-fold cross-validation (see Figure 4). Table 2 shows the number of samples (plants) per sieve size. Three different sub data sets were produced using these data: [set 1], combining sieve size 1–4 as class 0 (not ready-to-harvest; immature and mid-mature), and sieve size 5–6 as class 1 (ready-to-harvest; mature and over-mature); [set 2], merging sieve size 1–4 as class 0 (immature and mid-mature), sieve size 5 as class 1 (mature), and sieve size 6 as class 2 (over-mature); [set 3], mixing sieve size 1–2 as class 0 (immature), sieve size 3–4 as class 1 (mid-mature), and sieve size 5–6 as class 2 (ready-to-harvest; mature and over-mature).

2.6. Software

All data preprocessing and machine learning tasks were performed in Python 3.5 [93] with the Scikit–learn module [94]. Publicly-available multivariate normality and continuum-removal algorithms were utilized [95,96]. The presented data are publicly available in FigShare [97].

3. Results

We noticed large variability in plant height (35.71 ± 6.39; Figure 5) over the 25 days of biophysical data collection. This distinct change in height could imply that this biophysical trait may be a critical attribute for classification, and can be readily assessed via structural sensors, such as ranging sensors (e.g., light detection and ranging; LiDAR) on unmanned aerial system (UAS) platforms. The width feature, on the other hand, exhibited a smaller mean and standard deviation (32.01 ± 4.87), when compared to plant height (Figure 5). As for the number of leaves (20.19 ± 6.72), we observed a steady increase as the season progressed, followed by leaf loss and yellowing closer to harvest. It is worth noting that these data sets are normal, with only a slight indication of non-normality. The reported p-values were 0.49 and 0.52 for the Small and χ-squared methods, respectively. Biophysical variable levels were a function of our greenhouse study environment and may exhibit different values (mean, range, variability) for operational grower settings.

3.1. Principal Component Analysis

Figure 6 shows the results for the principal component analysis for spectral data, i.e., the results for the first four principal components (PCs) in terms of impact plots [77]. The reported impact plots explain ± 7 standard deviations around the mean (as positive and negative lines). The total explained variability for the first four PCs was over 99%. As can be seen from Figure 6, PC-1 accounted for most of the variability in the dataset (explained variability = 95.56%) in the 700–1800 nm range. PC-2 showed a more significant change in the visible region, and the higher end of the SWIR region, when compared to PC-1. The visible region’s amplitude shifts toward higher reflectance values in the green reflective pigment, and lower amplitudes for blue and red reflective pigments. A closer look at Figure 6 reveals that as chlorophyll absorbs more visible energy (negative impact in the visible region, i.e., less reflective), higher reflectance values can be observed at the longer end of the SWIR region (1500–2500 nm). This could be considered a change in the overall “slope” of the spectrum, with its origin at ~750 nm (i.e., higher reflectance in the visible region, with lower reflectance in wavelengths > 750 nm). PC-2 is responsible for 2.2% of the total variability in the data set, which demonstrates potential for being impactful through the continuum-removal approach and being an ideal input feature to a classifier. PC-3, in turn, is responsible for 1.2% of the total variability and exhibits high variability in the 1490 nm and 1900 nm absorption peaks, which are also close to water absorption troughs. We can also see zero shift in the ~1250 nm region, minimal change in the visible region, and shifts toward higher and lower reflectance values in the 800–1200 nm region. Finally, PC-4 encapsulates mostly noise in the wavelengths shorter than 500 nm, due to the low SNR in that region.

3.2. Growth Stage Binary Classification

This section includes findings for the classification of four growth stages (viz., vegetative growth, budding, flowering, and pod formation), presented as four tables and figures for different classification results, i.e., one table–figure pair per growth stage.

3.2.1. Vegetative Growth

Table 3 shows that both raw reflectance and smoothed data sets exhibited similar classification performances. Specifically, we observed explanatory spectral features residing in the 610–620 nm (red), 700–770 nm (red edge), 810–830 nm (NIR), and 1130 nm, 1390 nm, 1490 nm, 1560 nm, 2010–2090 nm, 2170 nm, 2380–2390 nm regions in SWIR domain. The last column in Table 3 represents the selected features, following the feature removal process. The raw reflectance and smoothed data sets exhibited a similar number of selected features (only one for spectral-only and four for spec. + PHY). The limited number of selected features for raw and smoothed data sets demonstrates the problem of collinearity. The addition of biophysical attributes significantly improved the classification performance for raw and smoothed data sets (Table 3). For the first derivative model, among biophysical features, the number of leaves was only identified as differentiating, and for the continuum-removed data set, no physical attributes were detected. It seems that the continuum-removal approach results in superior performance that is independent of biophysical data, when compared to other models. Moreover, while plant height and canopy width could be assessed relatively easily via ranging devices (e.g., LiDAR; [98,99,100]), the number of leaves arguably cannot be considered a feature for more practical applications (i.e., UAS-based).
It can be concluded from Table 3 that both continuum-removed data sets show strong classification performance. We chose to only report classification results for [CR-spec], since both continuum-removal tests show superior and similar performance. Figure 7 shows the classification results for [CR-spec] for the top five features, with corresponding perceptron classifiers. Figure 7a,b represent the confusion matrix and ROC curve, respectively, for the top five features for the [CR-spec] data set, and the confusion matrix is highly diagonal, and the ROC curve shows an AUC of 1.00 and accuracy of 0.97, demonstrating robustness, as well as solid classification performance between vegetative spectra and non-vegetative spectra, based on a nonparametric classifier (perceptron).

3.2.2. Snap Bean Budding

Table 4 shows that the spectral wavelengths responsible for accurate classification of budding are located in the 560–595 nm (far green), 600–690 nm (red), 700–710 nm (red edge) regions, and regions in the SWIR domain including 1193 nm, 1400–1460 nm, 2030–2090 nm, 2110 nm, 2210–2300 nm, and 2315–2380 nm. Furthermore, all biophysical attributes show enhancement in classification performance, similar to when plants were vegetative only. All biophysical features were identified for raw and smoothed models, and width was detected as differentiating in first derivative and CR models. However, as can be seen, the continuum-removal approach resulted in a superior performance that did not rely on biophysical characteristics. The corresponding classifier for CR was KNN.
Figure 8 includes the classification results, presented as confusion matrices (Figure 8a, class 0 = non-budding, class 1 = budding) and ROC curve (Figure 8b) for the [CR-spec] data set, as the most accurate model, based on the top five features. Figure 8a and b show a strongly diagonal matrix, provided by the KNN classifier, as well as an AUC = 0.94. This classifier thus resulted in a high accuracy (> 0.90) for classifying the presence of budding.

3.2.3. Snap Bean Flowering

The third stage of growth, flowering, was observed for this study over a two-day period in the growth cycle. Table 5 presents findings from this growth stage and shows that the differentiating wavelengths are located in ~500 nm (green), 690–775 nm (red edge), 830 nm (NIR), and 1396 nm, 1460 nm, 1630 nm, 1750 nm, 1800–1890 nm, 2010–2080 nm, 2220–2230 nm, 2310–2390 nm in the SWIR region. Physical attributes only enhanced performance of raw and smoothed data sets and were not identified by the first derivative and CR models. The best-performing model (continuum-removal) achieved optimal results (accuracy = 0.98), without the need to include biophysical attributes. LSVM and DT proved accurate when using both continuum-removed data sets. Figure 9 depicts the corresponding confusion matrix and ROC curve for the [CR.-spec] model, i.e., the model with superior performance. The observed confusion matrix is diagonal, and the ROC curve presents an AUC = 0.99, which reflects solid classification performance.

3.2.4. Pod Formation

The final growth stage of the snap bean crop is represented by pod formation, which lasted almost a month in our study; pods varied from small pins to over-mature maturity levels (industry sieve size 1–6). There were several wavelength regions that were identified as distinguishing between pod-forming and non-pod-forming plants: 595–610 nm (red), 660–770 (red edge), and wavelengths ~1090 nm, 1190 nm, 1230 nm, 1380–1385 nm, 1460–1490 nm, 1820 nm, 2040 nm, 2350–2390 nm in the NIR and SWIR spectral regions.
This stage also showed an increase in classification accuracy when biophysical attributes were added. Similar to the vegetative growth stage, the number of leaves and canopy width were selected as outcome predictors. It is likely that both traits show significance due to leaf yellowing (due to natural senescence), which causes foliage loss. However, in the first derivative model, only width was identified as discriminating (similar to results from budding; see Table 4). While the addition of biophysical attributes increased performance, we can observe from Table 6 that both CR tests selected only spectral attributes and still outperformed other models. Both CR models yielded superior performance when RF and KNN classifiers were used.
We opted to show results for the [CR- spec] data set, which represents a classification accuracy of 0.91, based on the RF classifier with the top five features. Figure 10 depicts the confusion matrix and ROC curve, corresponding to the pod formation classification. The analysis again exhibits a diagonal confusion matrix, which is indicative of the robustness of the algorithm, while the ROC curve shows an AUC of 0.98.

3.3. Growth Indices

3.3.1. Snap-Bean Growth Index (SGI) Assessment

Figure 11 shows the histogram of the first and second wavelengths (W1 and W2) of the most accurate 1000 spectral pairs; it is evident that the range between 490–500 nm (far-blue) exhibited the highest frequency, followed by the 540–570 nm (green) spectral region. Both of these spectral domains are crucially important in terms of chlorophyll absorption [101]. Figure 11b shows that the second wavelength in the 600–650 nm (red) spectral region is prominent, followed by the 2000–2050 nm (SWIR) wavelength region. Wavelength regions 490–500 nm (far-blue), 600–650 (red), and 2000–2050 nm (SWIR) were highly relevant to all stages of growth classification; the first two spectral regions are associated with chlorophyll absorption, while the latter has been coupled with starch absorption features [101]. The most accurate wavelength pair for this ratio index was W1 = 493 nm and W2 = 640 nm, as identified by the SVM classifier. Table 7 represents the confusion matrix, as well as user’s and producer’s accuracies (commission and omission errors, respectively), and kappa (κ) value for this snap bean growth index (SGI) [102,103]. The introduced index was termed the SGI.
Table 7 lists the confusion matrix for the SGI classification, as well as the producer’s accuracy (also referred to as recall), user’s accuracy (also called precision), and their corresponding errors, i.e., errors of omission (also known as a type I error), and error of commission (also known as a type II error), and the kappa value.
From a producer’s point of view, we observe that the vegetative growth and pod formation stages are best separated at ~93.75% accuracy, indicating a high degree of separability between early growth stage plants and those that are relatively mature. This wavelength combination yielded a 68.5% producer’s accuracy for the budding class, and as Table 7 shows, this classification error is primarily due to misclassifying budding stages as vegetative growth. Finally, the flowering stage exhibited the least accurate performance (producer’s accuracy = 60.42%), indicating there is some confusion between plants that are in the flowering and pod formation stages. This result again is to be expected, since both of these stages arguably requires plant resources to be reallocated to either flowering or pod generation, resulting in potentially similar physiological outcomes and associated spectral region impacts. The separability between the flowering and budding stages, in contrast, exhibited relatively little misclassification. This outcome could prove useful in terms of management logistics for the industry, since these are critical stages for management interventions [104,105]. The error of omission, which corresponds to the producer’s accuracy, shows how the algorithm failed to apply the correct label to the sample (cost to producers). On the other hand, the user’s accuracy ranges from 75–82%, which shows less variability than the producer’s accuracy. When comparing these results with the ones from the raw reflectance spectra for binary growth stage classification (see Table 3, Table 4, Table 5 and Table 6), we observe these two visible domain bands outperformed all binary classification accuracies for raw reflectance data sets (accuracies ranging between 0.51–0.71). This band pair indicates a robust, reliable index with potential for use without preprocessing of spectral data.
The corresponding kappa value represents a measure of how well a classification algorithm performs relative to a chance class assignment [102]. The kappa value of 0.72 for SGI showed a solid level of agreement. Generally speaking, the overall accuracy of 79.17% and high kappa value proved that the SGI can be used for classifying snap bean maturity levels, based on two wavelengths in the visible region. This is a significant outcome, since growers and industry service providers can implement this index in cost-effective (silicon detector spectral range), operational UAS-based sensing solutions.

3.3.2. Normalized Difference Snap-bean Index (NDSI) Assessment

Figure 12 shows the most accurate first and second 1000 wavelengths for the normalized difference index form. Similar to the SGI results, there is a high incidence for W1 in the 490–500 nm wavelength range, followed by wavelengths in the 550–575 nm range. Both ranges have proven discrimination for vegetative growth and flowering stage (see Table 3 and Table 5). This validates our notion that features selected by SVM in multi-class classification are also detected by the binary classification. Figure 12b represents the most accurate second 1000 wavelengths, with two peaks around the 600–650 nm and 2000–2250 nm regions; both regions have proven useful for binary classification (see Table 3, Table 4, and Table 6).
The most accurate wavelength pair is W1 = 493 nm and W2 = 640 nm, with an accuracy of 78.64%. These wavelengths agree with those from the SGI-based approach. We dubbed this index the normalized difference snap-bean growth index (NDSI). Table 8 contains the results for classification of the NDSI via SVM. Although the overall accuracy is similar to SGI, the producer’s accuracies are different (especially for the flowering and pod formation classes). The results from this analysis exhibited a higher producer’s accuracy for flowering by 10%, when compared to SGI, but a lower producer’s accuracy for pod formation by almost 10% (i.e., 83% vs. 93%). Moreover, when evaluating the findings for the vegetative growth stage, we observed a higher producer’s accuracy and a better distinguishability between vegetative growth and budding. The budding class exhibited the same behavior as those from SGI (i.e., a large portion of samples were misclassified as belonging to the vegetative growth class). The results for the flowering class showed a smaller misclassification error when using NDSI, when considering the flowering and pod formation stages.
Table 8 also shows, in terms of user’s accuracy, that there is an almost similar performance to SGI, with the difference that there is a slightly lower user’s accuracy for flowering, albeit a higher pod formation stage accuracy. This is indicative of the complex nature of this study and the difficulty in differentiating between growth stages. The kappa value also bears out the null hypothesis (the classification outcome is better than chance) and validates our findings presented earlier. The overall accuracy of 78.64% is similar to the SGI, but with the difference being that there is an observed lower variability in producer’s accuracy for the NDSI results.

3.4. Pod Maturity Classification

Table 9 shows the results for multi-class pod maturity classification on the three introduced sets. As can be seen from the table, [Set 1] (ready-to-harvest vs. not ready-to-harvest) exhibited the highest accuracy when compared to the other two sets (accuracy = 78%). The identified differentiating wavelengths for the best performing model, [CR-spec.], for [Set 1] were: VIS region ~550 nm, 720–740 nm areas; 2000–2060 nm region in the SWIR domain. The [CR-spec.] model, again, proved to be superior (~65%) when compared to other sets. The highlighted model identified the wavelengths in the same vicinity as of those from [Set 1- CR.-spec.]: ~555 nm and 710–740 nm regions in the (VIS) domain; ~2070 nm in the SWIR region. [Set 3] models showed accuracies ranging between 65–71%, with the best performing model being [CR-spec.]. Identified wavelengths were in the proximity of those from the best performing model of [Set 1] and [Set 2]: ~555 nm and 720–740 nm in the VIS domain; ~2045 nm in the SWIR domain. As we can see, when biophysical data were added, the best performing models (i.e., [CR-spec.]) either improved the performance only slightly, while detecting the width feature as discriminating, or did not detect biophysical features as contributing to pod maturity level classification.
The three models that exhibited superior performance for the three sets are summarized in Figure 13. As can be seen from the three subfigures, the low accuracy measures for [Set 2] and [Set 3] was due to the poor distinction between class 1 and other classes. Class 1 in [Set 2], which is sieve size 5, is largely misclassified as sieve size 6. [Set 2] showed similar but weaker performance, as class 1 (sieve size 3–4) is distinctly misclassified as other two classes (class 0 with sieve size 1–2; class 2 with sieve size 5–6). These findings proved that that there was not much spectral difference between: (i) under-mature (sieve size 1–2) and mid-mature (sieve size 3–4) plants, as shown by Figure 13b,c; and (ii) mature (sieve size 5) and over-mature (sieve size 6) plants, as shown by Figure 13b. However, a diagonal confusion matrix with definite distinction between not-ready-to-harvest (sieve size 1–4) and ready-to-harvest (sieve size 5–6) proved a promising classification scheme.

4. Discussion

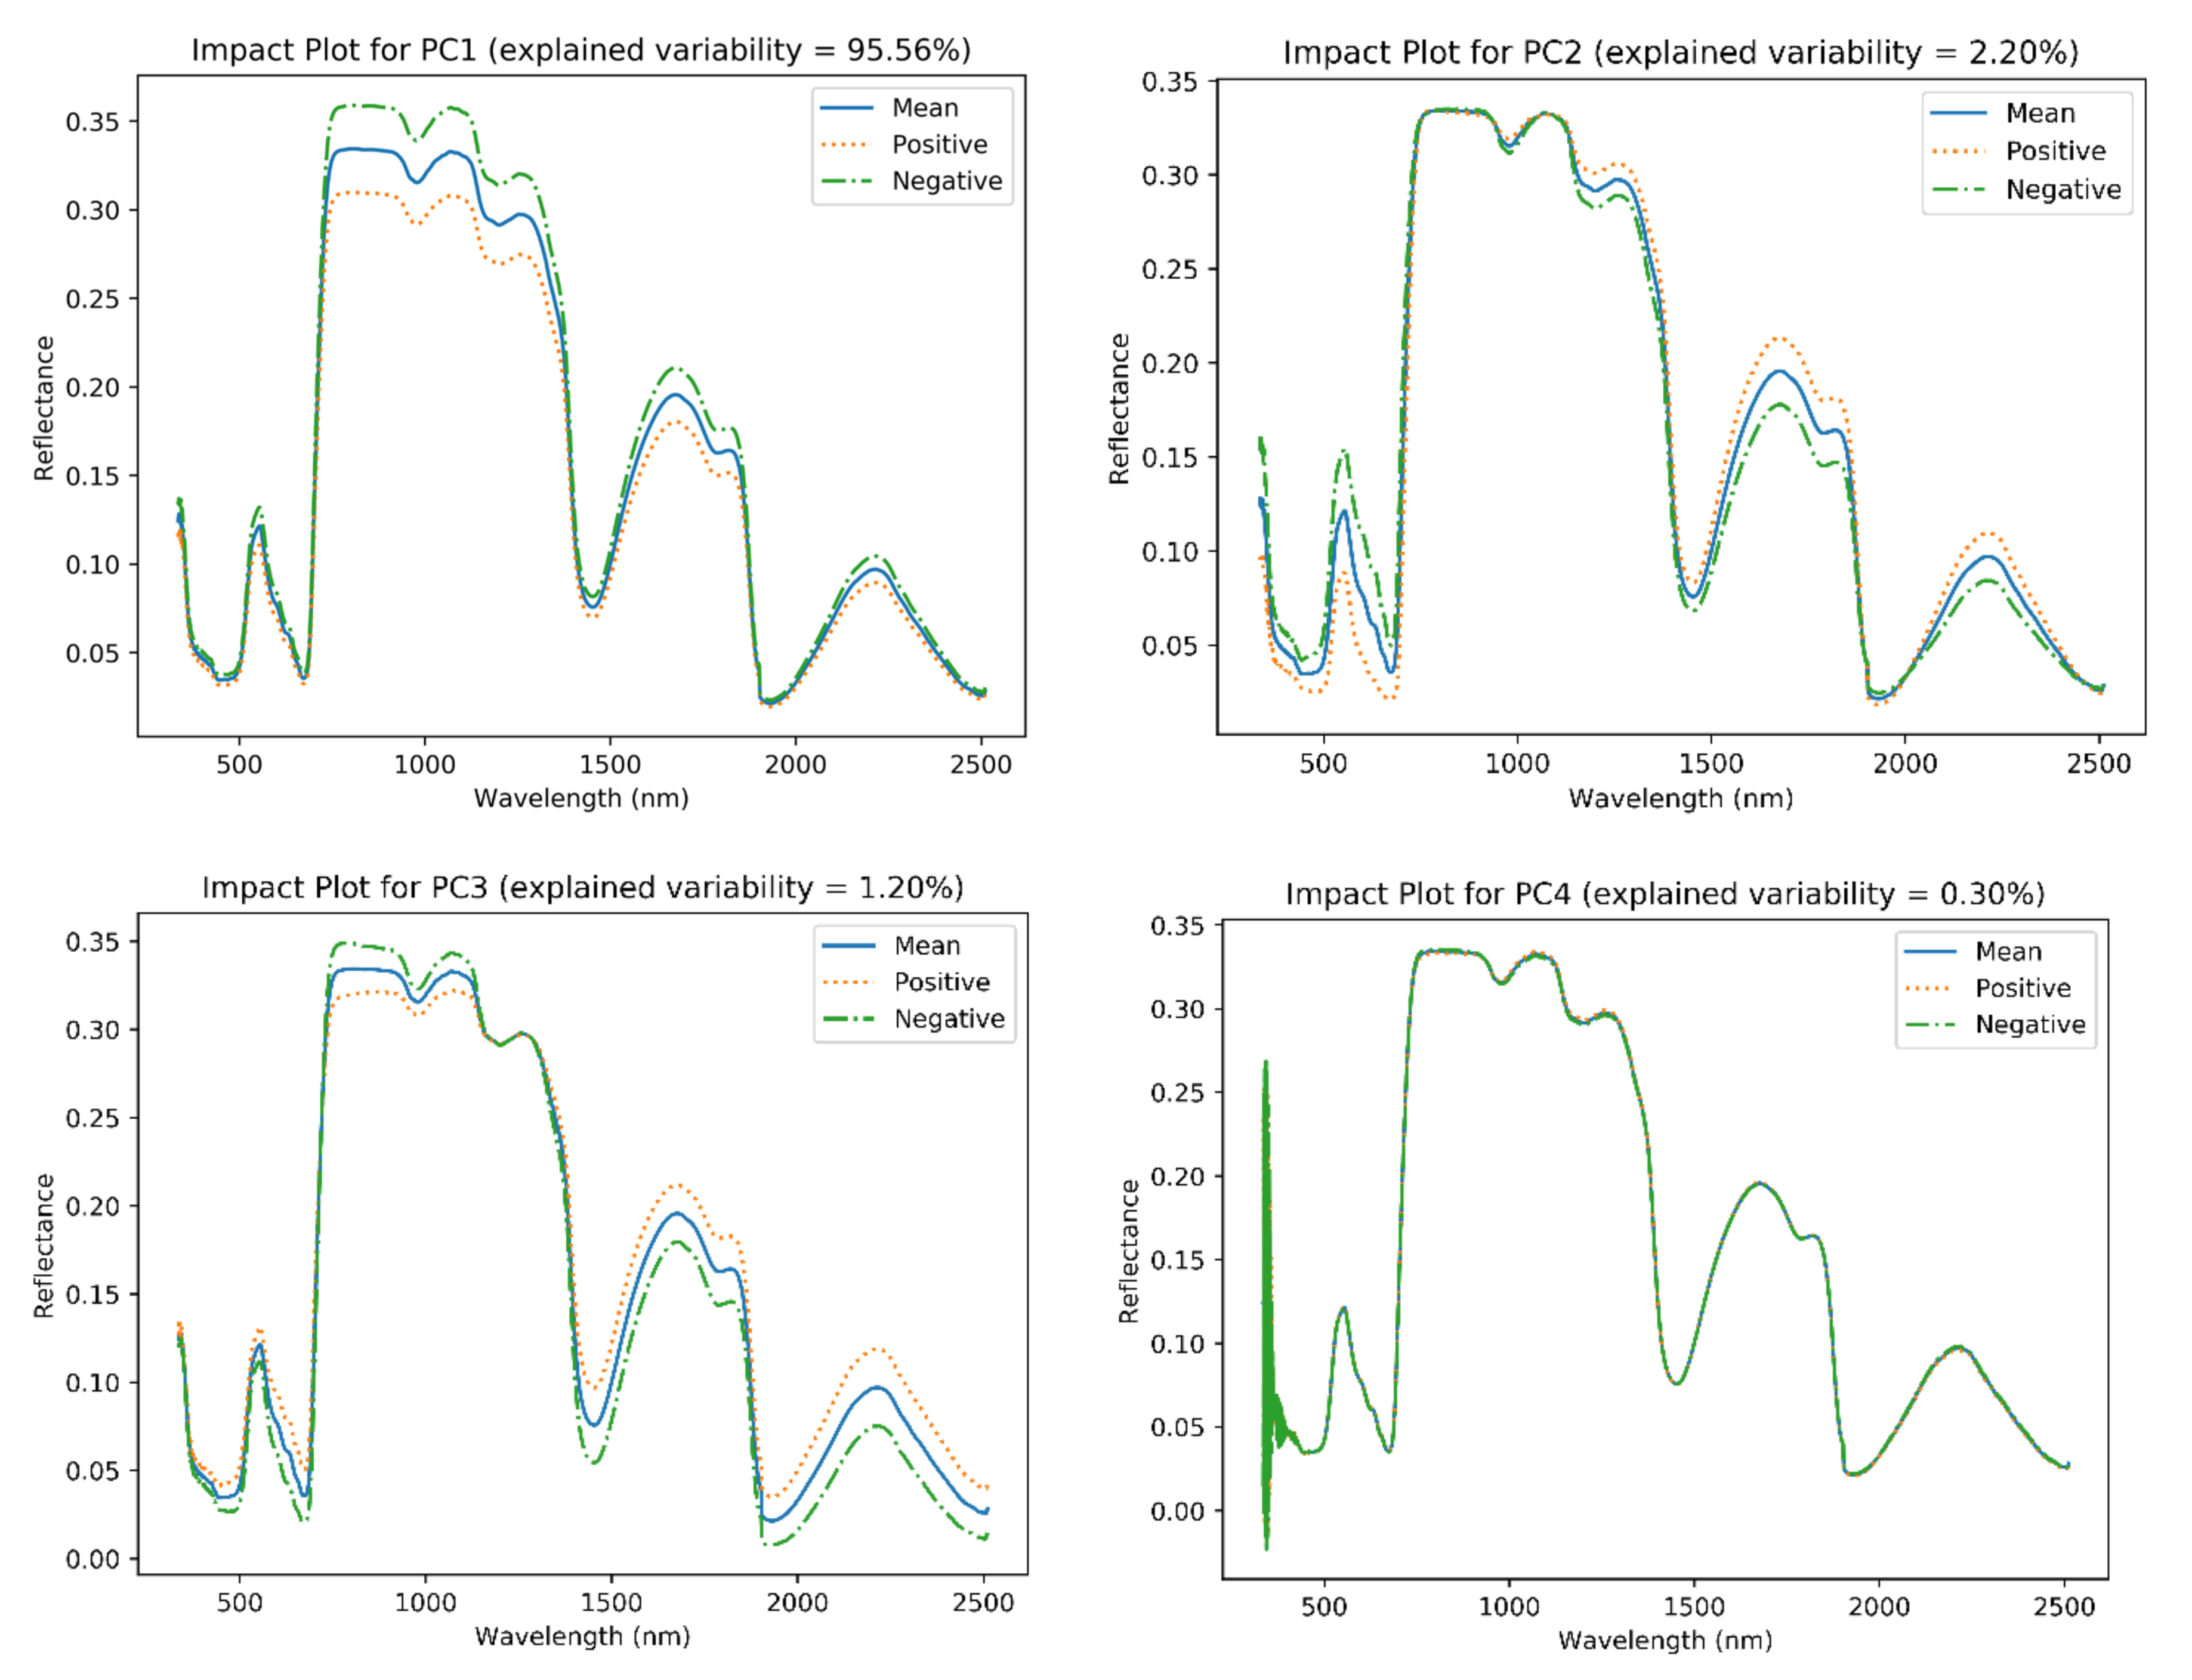
The generated impact plots by PCA can be linked to the plants’ biophysical attributes (Figure 6). The generated impact plot for PC-1 demonstrated changes in the 700–1800 nm range, especially for the 700–1250 nm range. This range is responsible for both water and structural absorption (e.g., cellulose) features [101]; plant water intake, as well as structural characteristics, which change substantially with plant maturity. PC-2, on the other hand, showed changes in the visible and higher end of the SWIR region, denoting overall plant growth; the ratio between green reflectance and the red absorption trough, which increases as the plant matures, is tied to total visible light absorption by chlorophyll. PC-3 is mostly responsible for sugar, starch, and protein (both in the 800–1200 nm and ~1900 nm regions), cellulose and sugar absorption in the ~1490 nm region, as well as starch, protein, oil, and water absorption in the 800–1200 nm region [101]. However, in an operational airborne data campaign setting, the 1400 nm and 1900 nm atmospheric water absorption features (low SNR) could impact the PC-3 outcome, thus diminishing the influence of these regions on the growth stage classifiers.
Our binary approach identified spectral wavelengths, at each growth stage, which proved to be discriminating. These spectral features, however, need to be scrutinized in terms of their remote sensing implications and extension to operational scenarios and sensors, and ultimately, they need to be linked to plant physiology. For example, the results from the most accurate model [CR-spec.] for binary classification of vegetative growth stage included chlorophyll, lignin, water, nitrogen, and starch-related chemical changes, as evidenced via spectral features:
  • The 610–620 nm range, identified as discriminating features for both continuum-removal approaches (see Table 3) are strong indicators of chlorophyll absorption in the red spectral region, necessary for photosynthesis [101]. Also, Card et al. (1988) found high correlation coefficients (R2 = 0.93) between nitrogen and the 620 nm band, and between lignin and the 610 nm band (R2 = 0.93) [106].
  • The 700–710 nm wavelength region represents the well-known red edge spectral feature, and was identified by continuum-removal models. The red edge peak reflects plant growth, health/vigor, and maturity, as well as indicating sugar absorption [42]. The red edge peak is an easy-to-detect spectral metric in first derivative spectra, since the slope of the red edge exhibits a common high value in comparison to other spectral metrics. However, it is notable that the continuum-removal approach proved useful in independently identifying the red edge peak.
  • The single wavelength at ~1390 nm in the SWIR region falls in the atmospheric water absorption feature, due to bending O–H bonds, as well as reflecting total nitrogen absorption [101,106].
  • The single wavelength at 1490 nm was deemed as being explanatory for cellulose and sugar absorption, via stretching of O–H bonds [101].
  • The 1560–1570 nm region, resides in the vicinity of two regions, 1540 nm and 1580 nm, which have associations with starch and sugar, due to stretching O–H bonds [101].
  • The 2000–2020 nm region, which also appeared in the raw and smoothed data sets, reflects starch absorption, causing deformation in O–H and C–O bonds [101].
  • Finally, for the 2380–2390 nm region, we could not find any physiological link in the literature. This may require future efforts to concentrate on detecting ties between spectral signatures in the far-SWIR region and the biophysical/chemical changes due to plant growth.
Results from the continuum removal approach (Table 4) show the budding maturity stage classification can be coupled with oil content in the plant, which was not important in differentiating vegetative growth, starch, protein, nitrogen, lignin, and water, with detected wavelengths as follows:
  • The significant association with ~560 nm highlights the predictive power of reflective green pigment in the plant, and this selection was attributed to leaf senescence (yellowing; or mosaic virus; [107]) and abscission associated with plant senescence.
  • The 690–700 nm spectral domain was a strong predictor both first derivative and continuum-removal features (see Table 4), previously associated with the vegetative stage (see Table 3), and encompasses the red edge peak.
  • The single wavelength of 1400 nm highlights water absorption via bending of O-H bonds [101]. This wavelength feature was not previously detected at the vegetative stage.
  • The wavelength at ~2300 nm is coupled to protein (not detected in vegetative stage) and nitrogen absorption by stretching of N–H and C=O bonds, as well as bending of C–H bonds [101,108].
  • A scientific link in the literature was identified between the 2315 nm wavelength and oil absorption, due to the bending of C–H bonds [101].
  • The single wavelength of 2327 nm is within that previously described as associated with starch absorption (2320 nm) caused by a stretch in C–H bonds and deforming of CH2 molecules [101]. Moreover, Card et al. (1988) identified a link between lignin absorption and the 2320 nm band [106].
  • Finally, the single wavelength at 2365 nm has been associated with nitrogen content [106].
  • There was no clear association between 1190 and 2030 nm and physiological changes in the plant.
The best performing model for the flowering stage was identified as the continuum-removal method. The ability to capture this phenological change is of pivotal importance for plant maturity assessment, especially since it has bearing on disease risk (e.g., white mold caused by the fungus, Sclerotinia sclerotiorum; [109]). This model identified spectral indicators indicative of oil (detected in budding classification), cellulose (not detected previously), starch, sugar, starch, and lignin, as below:
  • The 690–705 nm range, previously detected in the vegetative and budding stage, represents the red edge peak spectral metric.
  • The wavelength at ~1740 nm is linked to lignin absorption [108].
  • The ~2080 nm wavelength in the SWIR region is coupled to sugar and starch absorption, via stretching and deforming of O–H bonds [101].
  • The wavelength region at ~2310 nm is attributed to oil absorption (previously found in budding stage), via bending in C–H bonds [101].
  • A single wavelength was found at 2334 nm, in the vicinity of two absorption features due to starch and cellulose (not detected previously), and also linked to stretching of O–H/C–H bonds and being responsible for deformation in O–H/C–H/CH2 bonds and molecules [101].
  • Lastly, no relevant information was found for the wavelength at 1626 nm and the selection of the 2370–2390 nm region, which calls for future work. It is worth noting that the latter region has been given less attention in the literature due to the associated low SNR caused by atmospheric effects in aerial remote sensing systems.
Finally, pod formation, the final growth stage, is mainly dominated by chlorophyll absorption in the red portion of electromagnetic spectrum, coupled to water, starch, sugar, lignin, protein, nitrogen, and abundant cellulose absorption features (as identified by the most accurate model—continuum-removal). The corresponding wavelengths are:
  • The 610 nm wavelength, as previously detected in the vegetative classification, is linked to chlorophyll and lignin absorption [106].
  • The 700–710 nm wavelength region, representing the red edge peak, proves to be crucial in all stages of growth (detected in all stages of growth; see Table 3, Table 4 and Table 5).
  • The wavelength at ~1190 nm, in the proximity of water, cellulose, starch, lignin absorption ranges (~1200 nm), due to bending of O–H bonds.
  • The single wavelength at 1490 nm corresponds to cellulose and sugar absorption, with stretching in O–H bonds.
  • The wavelength at ~1820 nm (stretching of O–H/C–H bonds) is responsible for cellulose absorption.
  • The ~2350 nm wavelength, accountable for absorption of cellulose, protein, and nitrogen, causing CH2 molecules to bend and deforming C–H bonds [101]. Moreover, Card et al. (1988) identified that wavelength at 2350 nm correlates to plant’s lignin level [106].
  • Finally, no information was found in the literature for the ~1230 nm, 2040 nm, and ~1380 nm wavelength regions, thus demanding future work. It also is worth noting that the selected ~2390 nm feature may be rendered useless due to its proximity to the longer SWIR region, which suffers from low SNR due to atmospheric considerations.
In short, the multi-class growth classification, using the proposed vegetation indices (ratio and normalized forms), identified two discriminative wavelengths, namely at 493 nm and 640 nm. Both wavelengths varied with chlorophyll absorption throughout the growth stages of the plant. Results from the pod maturity classification, on the other hand, showed that models that performed best (i.e., [CR-spec.] models) used detected wavelengths in the ~550 nm region (attributed to reflective green pigment and leaf senescence/yellowing), the 720–740 nm range (encompassing the red edge peak, between 2000-2070 nm (starch absorption, causing O–H and C–O deformation in the 2000 nm area), the 2040 nm spectral region (no relevant scientific link found), and protein and nitrogen absorption stretching and bending of N–H and N=H bands in the 2060 nm spectral region [101].

5. Conclusions

We studied growth stage and pod maturity classification of snap bean, as a proxy broadacre crop, via an experimental greenhouse setup with a high spectral and temporal resolution. We approached growth stage assessment with binary (one-vs.-rest) and multi-class classification (vegetative index identifier), and pod maturity detection via multi-class classification. The reason we approached this study using both binary and multi-class fashion for growth stage classification, was to identify wavelengths that are not only discriminatory between four different levels of maturity, but to also generate results that could detect spectral wavelengths corresponding to each stage of snap-bean maturity, which is more conclusive and extensible to operational implementation.
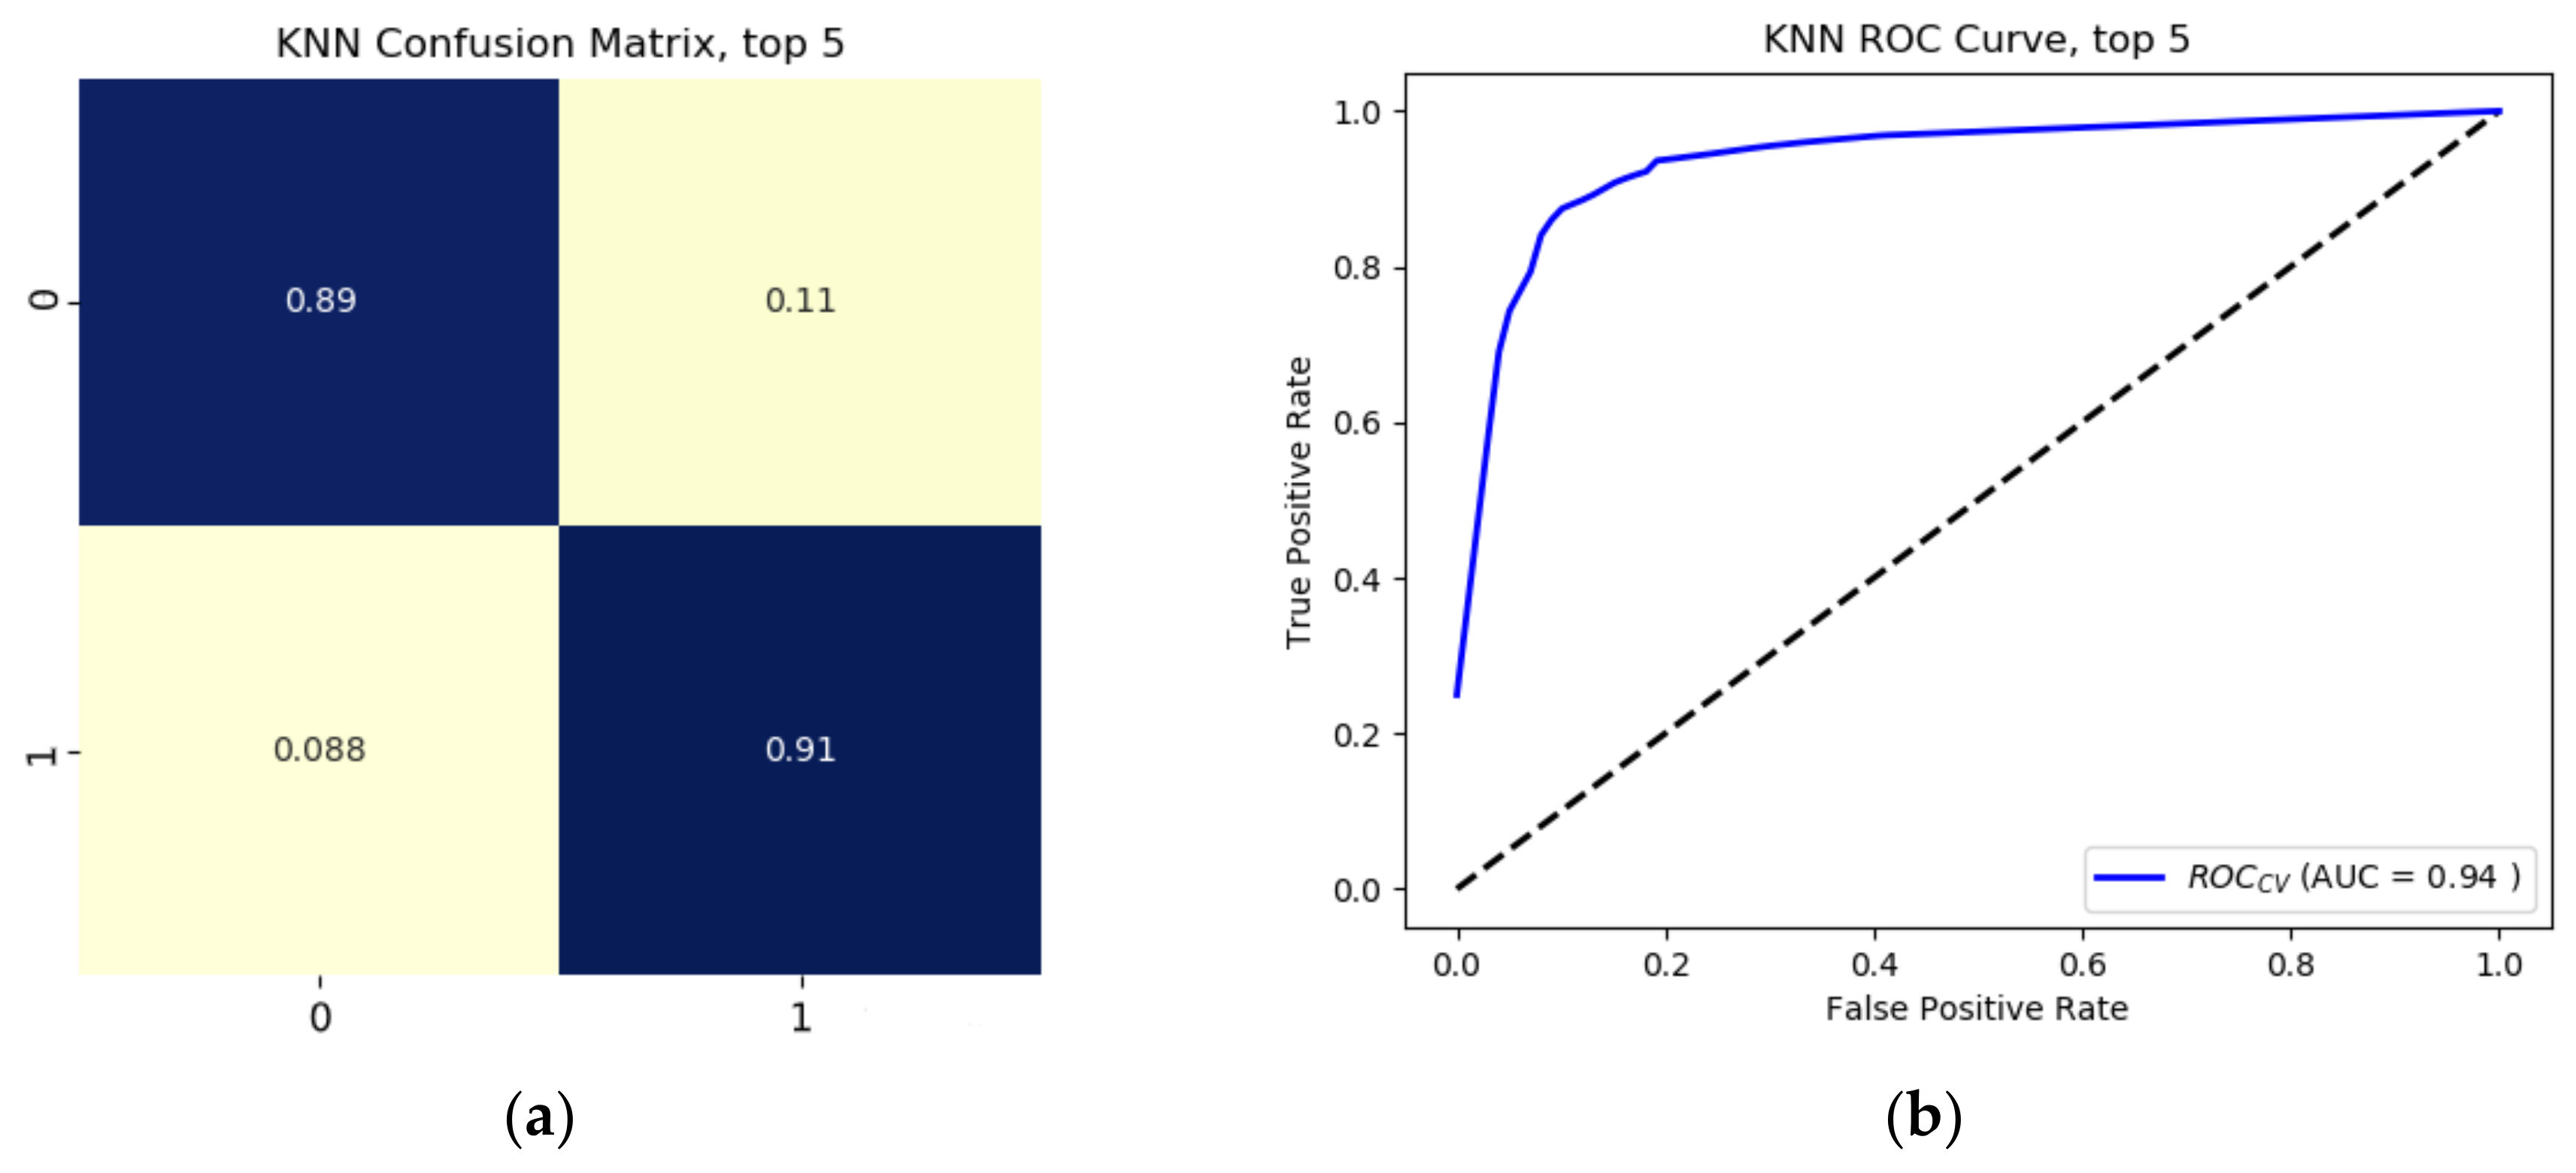
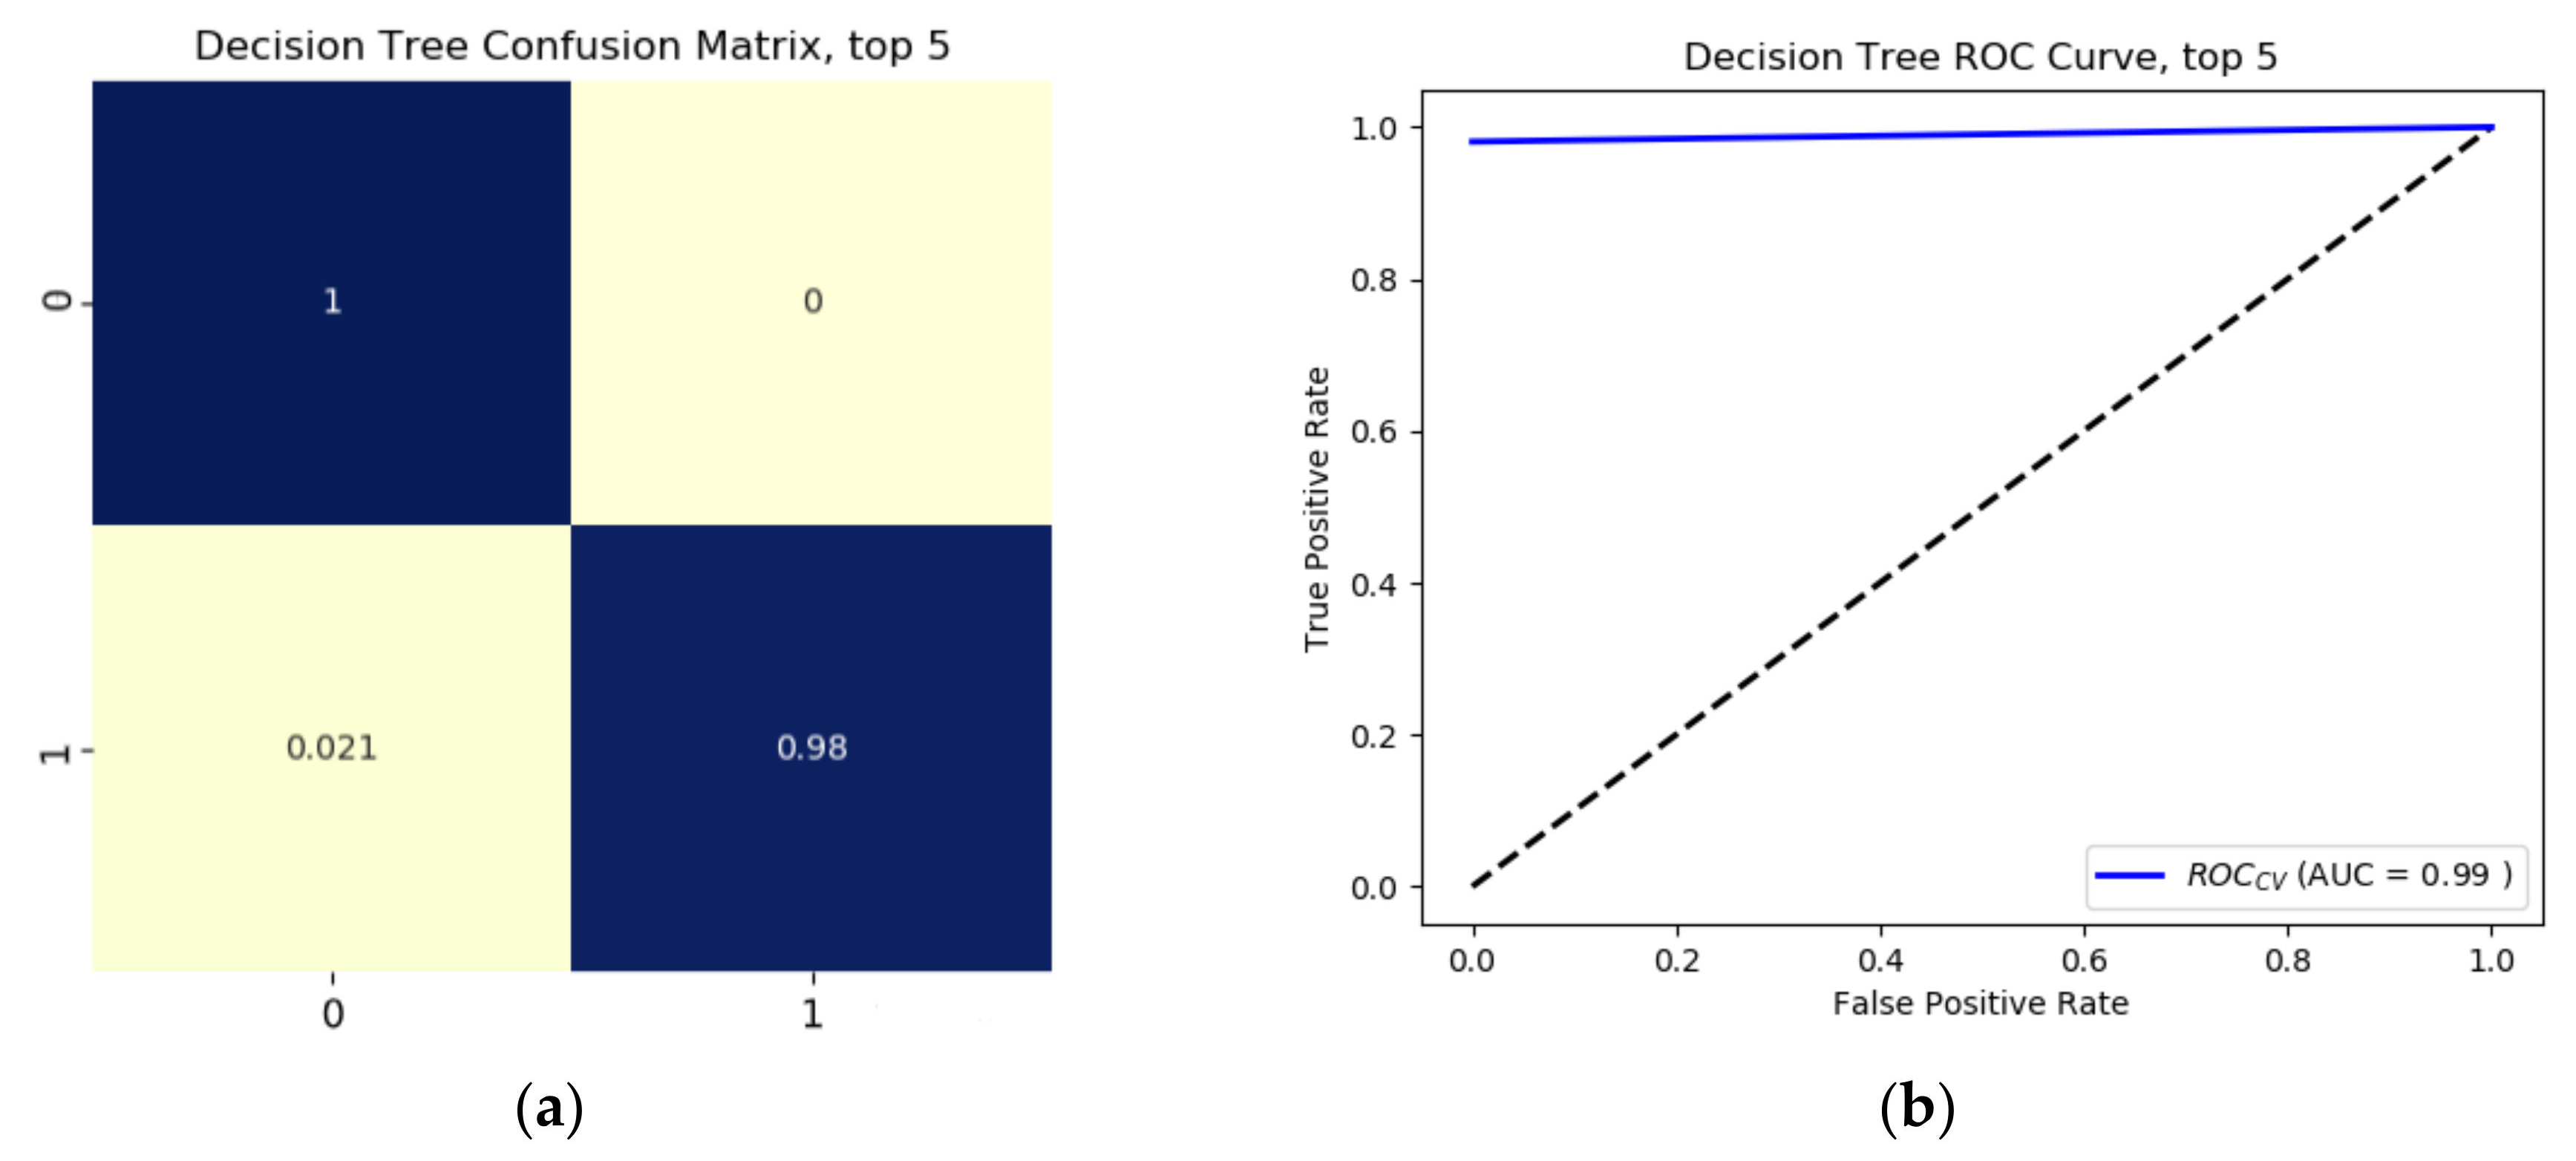
Results from the binary growth stage classification showed the continuum-removal technique was adept at detecting growth-related spectral features for all maturity stages, with accuracies ranging from 0.90–0.98. We determined that addition of biophysical features to spectral data for growth stage assessment enhanced the classification accuracy. Despite this improvement, it was found that the continuum-removal approach exhibited similarly promising results, with or without the addition of biophysical attributes. Findings for the multi-class growth stage classification approach showed that two distinguishing wavelengths at 493 nm and 640 nm yielded the best separation between the four growth classes. Accuracies of 79% for the ratio index (i.e., snap-bean growth index [SGI]) and 78% for the normalized difference form (i.e., normalized difference snap-bean growth index [NDSI]) were observed. The selected binary classification algorithm was effective at determining plant growth stage, relying on both VIS-NIR and SWIR regions for accurate outcomes. However, the multi-class classification and the proposed indices also yielded solid classification results, even if with marginally lower accuracies, with the distinct benefit of only using two wavelengths in the visible region.
Findings from the pod maturity assessment, coupled to harvest scheduling, proved that distinction between not ready-to-harvest and ready-to-harvest sieve sizes (immature + mid-mature vs. mature + over-mature; i.e., industry sieve sizes 1–4 vs. 5–6) is feasible with solid accuracy measures (~78% with only two selected narrow-band wavelengths), while the algorithm failed to differentiate immature vs. mid-mature and mature vs. over-mature due to the similarity of spectral data between these pod maturity levels.
Specific limitations of this study include the relatively small sample size, our focus on only one snap bean cultivar (i.e., cv. Huntington), and the absence of mixed-pixel effects and atmospheric noise by collecting data under controlled laboratory conditions. All of these factors can be evaluated in future studies, e.g., an extension to unmanned aerial systems (UAS) and subsequent transitioning to other airborne remote sensing platforms would introduce both mixed-pixel and atmospheric noise and enable sampling of thousands of individual plants. In terms of the advantages of this approach, we noted the robustness of the algorithms to newly introduced data, while the growth stage classification results exhibited high classification accuracy via the SWIR region, and solid performance using only two bands in the visible spectral domain. We are especially intrigued by this last finding, i.e., the potential of using only two wavelengths in the “cheap” silicon detector range to develop cost-effective, operational platforms to accurately assess snap bean growth stages. An acceptable classification performance for pod maturity to differentiate between not ready-to-harvest and ready-to-harvest, with identified wavelengths residing in the silicon and SWIR spectral regions, may prove to be advantageous to operational implementation, as long as a practical and affordable solution is available to merge the two detectors into one multispectral sensor suite.

Author Contributions

Conceptualization, A.H., J.v.A., S.P.M. and S.J.P.; methodology, A.H. and J.v.A.; validation, A.H. and J.v.A.; formal analysis, A.H. and J.v.A.; investigation, A.H. and J.v.A.; resources, A.H., J.v.A., S.P.M., S.J.P.; Writing—Original Draft preparation, A.H.; Writing—Review and Editing, A.H., J.v.A., S.P.M. and S.J.P.; visualization, A.H.; supervision, J.v.A.; project administration, J.v.A. All authors have read and agreed to the published version of the manuscript.

Funding

This research was funded by National Science Foundation Partnerships for Innovation (PFI) program (Award Number #1827551).

Acknowledgments

We would like to thank Jeff Johnson from Seneca Foods Corporation for their insightful inputs on the experimental design. We also appreciate the reviewers’ feedbacks and editor’s constructive comments to improve the quality of this manuscript.

Conflicts of Interest

The authors declare no conflict of interest.

References

  1. USDA. USDA National Agricultural Statistics Service, Choice Reviews Online. Available online: https://www.nass.usda.gov/Data_and_Statistics/index.php (accessed on 8 June 2020).
  2. Mulla, D.J. Twenty five years of remote sensing in precision agriculture: Key advances and remaining knowledge gaps. Biosyst. Eng. 2013, 114, 358–371. [Google Scholar] [CrossRef]
  3. Liaghat, S.; Balasundram, S.K. A Review: The Role of Remote Sensing in Precision Agriculture. Am. J. Agric. Biol. Sci. 2010, 5, 50–55. [Google Scholar] [CrossRef] [Green Version]
  4. Sabins, F.F. Remote Sensing: Principles and Applications; Waveland Press: Long Grove, IL, USA, 2007. [Google Scholar]
  5. Lu, B.; Dao, P.D.; Liu, J.; He, Y.; Shang, J. Recent Advances of Hyperspectral Imaging Technology and Applications in Agriculture. Remote. Sens. 2020, 12, 2659. [Google Scholar] [CrossRef]
  6. Applications S. Multispectral vs. Hyperspectral Imagery Explained Rent a Spectrometer. Available online: http://gisgeography.com/%0Amultispectral-vs-hyperspectral-imagery-explained/ (accessed on 1 August 2020).
  7. Idowu, O.J.; Van Es, H.M.; Abawi, G.S.; Wolfe, D.W.; Ball, J.I.; Gugino, B.K.; Moebius, B.N.; Schindelbeck, R.R.; Bilgili, A.V. Farmer-oriented assessment of soil quality using field, laboratory, and VNIR spectroscopy methods. Plant. Soil 2008, 307, 243–253. [Google Scholar] [CrossRef]
  8. Ben-Dor, E.; Banin, A. Near-Infrared Analysis as a Rapid Method to Simultaneously Evaluate Several Soil Properties. Soil Sci. Soc. Am. J. 1995, 59, 364–372. [Google Scholar] [CrossRef]
  9. Chang, C.-W.; Laird, D.A.; Mausbach, M.J.; Hurburgh, C.R. Near-Infrared Reflectance Spectroscopy-Principal Components Regression Analyses of Soil Properties. Soil Sci. Soc. Am. J. 2001, 65, 480–490. [Google Scholar] [CrossRef] [Green Version]
  10. Bertone, E.; Venturello, A.; Leardi, R.; Geobaldo, F. Prediction of the optimum harvest time of ‘Scarlet’ apples using DR-UV–Vis and NIR spectroscopy. Postharvest Biol. Technol. 2012, 69, 15–23. [Google Scholar] [CrossRef]
  11. Xu, S.; Zhao, Y.; Wang, M.; Shi, X. Comparison of multivariate methods for estimating selected soil properties from intact soil cores of paddy fields by Vis–NIR spectroscopy. Geoderma 2018, 310, 29–43. [Google Scholar] [CrossRef]
  12. Nagasubramanian, K.; Jones, S.; Singh, A.K.; Singh, A.; Ganapathysubramanian, B.; Sarkar, S. Explaining hyperspectral imaging based plant disease identification: 3D CNN and saliency maps. arXiv 2018, arXiv:1804.08831. [Google Scholar]
  13. Zarco-Tejada, P.J.; González-Dugo, V.; Berni, J.A.J. Fluorescence, temperature and narrow-band indices acquired from a UAV platform for water stress detection using a micro-hyperspectral imager and a thermal camera. Remote. Sens. Environ. 2012, 117, 322–337. [Google Scholar] [CrossRef]
  14. Reza, N.; Na, I.S.; Baek, S.W.; Lee, K.-H. Rice yield estimation based on K-means clustering with graph-cut segmentation using low-altitude UAV images. Biosyst. Eng. 2019, 177, 109–121. [Google Scholar] [CrossRef]
  15. Munera, S.; Amigo, J.M.; Blasco, J.; Cubero, S.; Talens, P.; Aleixos, N. Ripeness monitoring of two cultivars of nectarine using VIS-NIR hyperspectral reflectance imaging. J. Food Eng. 2017, 214, 29–39. [Google Scholar] [CrossRef]
  16. Bu, H.; Sharma, L.K.; Denton, A.; Franzen, D. Comparison of Satellite Imagery and Ground-Based Active Optical Sensors as Yield Predictors in Sugar Beet, Spring Wheat, Corn, and Sunflower. Agron. J. 2017, 109, 299–308. [Google Scholar] [CrossRef] [Green Version]
  17. Li, B.; Lecourt, J.; Bishop, G. Advances in Non-Destructive Early Assessment of Fruit Ripeness towards Defining Optimal Time of Harvest and Yield Prediction—A Review. Plants 2018, 7, 3. [Google Scholar] [CrossRef] [Green Version]
  18. Zhang, A.C.; Guo, C.; Liu, F.; Kong, W.; He, Y.; Lou, B. Hyperspectral imaging analysis for ripeness evaluation of strawberry with support vector machine. J. Food Eng. 2016, 179, 11–18. [Google Scholar] [CrossRef]
  19. Bureau, S.; Cozzolino, D.; Clark, C.J. Contributions of Fourier-transform mid infrared (FT-MIR) spectroscopy to the study of fruit and vegetables: A review. Postharvest Biol. Technol. 2019, 148, 1–14. [Google Scholar] [CrossRef]
  20. Craig, A.P.; Botelho, B.G.; Oliveira, L.S.; Franca, A.S. Mid infrared spectroscopy and chemometrics as tools for the classification of roasted coffees by cup quality. Food Chem. 2018, 245, 1052–1061. [Google Scholar] [CrossRef]
  21. Cozzolino, D.; Holdstock, M.; Dambergs, R.G.; Cynkar, W.U.; Smith, P.A. Mid infrared spectroscopy and multivariate analysis: A tool to discriminate between organic and non-organic wines grown in Australia. Food Chem. 2009, 116, 761–765. [Google Scholar] [CrossRef]
  22. Al-Jowder, O.; Defernez, M.; Kemsley, E.K.; Wilson, R.H. Mid-infrared spectroscopy and chemometrics for the authentication of meat products. J. Agric. Food Chem. 1999, 47, 3210–3218. [Google Scholar] [CrossRef]
  23. Siebielec, G.; Mccarty, G.W.; Stuczynski, T.I.; Reeves, J.B. Near- and Mid-Infrared Diffuse Reflectance Spectroscopy for Measuring Soil Metal Content. J. Environ. Qual. 2004, 33, 2056–2069. [Google Scholar] [CrossRef] [Green Version]
  24. Mccarty, G.W.; Reeves, J.B.; Reeves, V.B.; Follett, R.F.; Kimble, J.M. Mid-Infrared and Near-Infrared Diffuse Reflectance Spectroscopy for Soil Carbon Measurement. Soil Sci. Soc. Am. J. 2002, 66, 640–646. [Google Scholar] [CrossRef]
  25. Plaza, J.; Plaza, J.; Perez, R.; Martinez, P. On the use of small training sets for neural network-based characterization of mixed pixels in remotely sensed hyperspectral images. Pattern Recognit. 2009, 42, 3032–3045. [Google Scholar] [CrossRef]
  26. Bellairs, S.; Turner, N.C.; Hick, P.; Smith, R. Plant and soil influences on estimating biomass of wheat in plant breeding plots using field spectral radiometers. Aust. J. Agric. Res. 1996, 47, 1017–1034. [Google Scholar] [CrossRef]
  27. Secker, J.; Staenz, K.; Gauthier, R.P.; Budkewitsch, P. Vicarious calibration of airborne hyperspectral sensors in operational environments. Remote. Sens. Environ. 2001, 76, 81–92. [Google Scholar] [CrossRef]
  28. Xu, H.; Ying, Y.; Fu, X.; Zhu, S. Near-infrared Spectroscopy in detecting Leaf Miner Damage on Tomato Leaf. Biosyst. Eng. 2007, 96, 447–454. [Google Scholar] [CrossRef]
  29. Sinclair, T.R.; Hoffer, R.M.; Schreiber, M.M. Reflectance and Internal Structure of Leaves from Several Crops During a Growing Season 1. Agron. J. 1971, 63, 864–868. [Google Scholar] [CrossRef]
  30. Gates, D.M.; Keegan, H.J.; Schleter, J.C.; Weidner, V.R. Spectral Properties of Plants. Appl. Opt. 1965, 4, 11–20. [Google Scholar] [CrossRef]
  31. Zhang, D. Advances in Machine Learning Applications in Software Engineering; Tsai, J.J.P., Ed.; IGI Global: Hershey, PA, USA, 2006. [Google Scholar]
  32. Kourou, K.; Exarchos, T.P.; Exarchos, K.P.; Karamouzis, M.V.; Fotiadis, D.I. Machine learning applications in cancer prognosis and prediction. Comput. Struct. Biotechnol. J. 2015, 13, 8–17. [Google Scholar] [CrossRef] [Green Version]
  33. Karvekar, S.; Abdollahi, M.; Rashedi, E. A Data-Driven Model to Identify Fatigue Level Based on the Motion Data from a Smartphone. In Proceedings of the 2019 IEEE Western New York Image and Signal Workshop (WNYISPW), Rochester, NY, USA, 4 October 2019; pp. 8–17. [Google Scholar] [CrossRef]
  34. Kayad, A.; Sozzi, M.; Gatto, S.; Marinello, F.; Pirotti, F. Monitoring Within-Field Variability of Corn Yield using Sentinel-2 and Machine Learning Techniques. Remote Sens. 2019, 11, 2873. [Google Scholar] [CrossRef] [Green Version]
  35. Wei, L.; Yu, M.; Liang, Y.; Yuan, Z.; Huang, C.; Li, R.; Yu, Y. Precise Crop Classification Using Spectral-Spatial-Location Fusion Based on Conditional Random Fields for UAV-Borne Hyperspectral Remote Sensing Imagery. Remote Sens. 2019, 11, 2011. [Google Scholar] [CrossRef] [Green Version]
  36. Doktor, D.; Lausch, A.; Spengler, D.; Thurner, M. Extraction of Plant Physiological Status from Hyperspectral Signatures Using Machine Learning Methods. Remote Sens. 2014, 6, 12247–12274. [Google Scholar] [CrossRef] [Green Version]
  37. Yuan, H.; Yang, G.; Li, C.; Wang, Y.; Liu, J.; Yu, H.; Feng, H.; Xu, B.; Zhao, X.; Yang, X. Retrieving Soybean Leaf Area Index from Unmanned Aerial Vehicle Hyperspectral Remote Sensing: Analysis of RF, ANN, and SVM Regression Models. Remote Sens. 2017, 9, 309. [Google Scholar] [CrossRef] [Green Version]
  38. Senthilnath, J.; Omkar, S.N.; Mani, V.; Karnwal, N.; Shreyas, P.B. Crop Stage Classification of Hyperspectral Data Using Unsupervised Techniques. IEEE J. Sel. Top. Appl. Earth Obs. Remote. Sens. 2013, 6, 861–866. [Google Scholar] [CrossRef]
  39. Bendig, J.; Yu, K.; Aasen, H.; Bolten, A.; Bennertz, S.; Broscheit, J.; Gnyp, M.L.; Bareth, G. Combining UAV-based plant height from crop surface models, visible, and near infrared vegetation indices for biomass monitoring in barley. Int. J. Appl. Earth Obs. Geoinf. 2015, 39, 79–87. [Google Scholar] [CrossRef]
  40. Thenkabail, P.S.; Smith, R.B.; De Pauw, E. Evaluation of narrowband and broadband vegetation indices for determining optimal hyperspectral wavebands for agricultural crop characterization. Photogramm. Eng. Remote Sens. 2002, 68, 607–621. [Google Scholar]
  41. Curran, P.J.; Dungan, J.L.; Macler, B.A.; Plummer, S.E. The effect of a red leaf pigment on the relationship between red edge and chlorophyll concentration. Remote. Sens. Environ. 1991, 35, 69–76. [Google Scholar] [CrossRef]
  42. Collins, W. Remote Sensing of Crop Type and Maturity. Photogramm. Eng. Remote Sens. 1978, 44, 43–55. [Google Scholar]
  43. Birth, G.S.; McVey, G.R. Measuring the Color of Growing Turf with a Reflectance Spectrophotometer. Agron. J. 1968, 60, 640–643. [Google Scholar] [CrossRef]
  44. Rouse, J.W.; Haas, R.H.; Schell, J.A.; Deering, D.W. Monitoring Vegetation Systems in the Great Plains with ERTS. In Proceedings of the 3rd ERTS Symposium, NASA SP-351, Washington, DC, USA, 10–14 December 1973; pp. 309–317. [Google Scholar]
  45. Castro, W.; Oblitas, J.; De-La-Torre, M.; Cotrina, C.; Bazan, K.; Avila-George, H. Classification of Cape Gooseberry Fruit According to its Level of Ripeness Using Machine Learning Techniques and Different Color Spaces. IEEE Access 2019, 7, 27389–27400. [Google Scholar] [CrossRef]
  46. Luchsinger, L.; Walsh, C. Development of an objective and non-destructive harvest maturity index for peaches and nectarines. Acta Hortic. 1998, 7, 679–688. [Google Scholar] [CrossRef]
  47. Ferrer, A.; Remón, S.; Negueruela, A.I.; Oria, R. Changes during the ripening of the very late season Spanish peach cultivar Calanda. Sci. Hortic. 2005, 105, 435–446. [Google Scholar] [CrossRef]
  48. Mendoza, F.; Dejmek, P.; Aguilera, J.M. Calibrated color measurements of agricultural foods using image analysis. Postharvest Biol. Technol. 2006, 41, 285–295. [Google Scholar] [CrossRef]
  49. Jha, S.; Chopra, S.; Kingsly, A. Modeling of color values for nondestructive evaluation of maturity of mango. J. Food Eng. 2007, 78, 22–26. [Google Scholar] [CrossRef]
  50. Dadwal, M.; Banga, V.K. Estimate Ripeness Level of fruits Using RGB Color Space and Fuzzy Logic Technique. Int. J. Eng. Adv. Technol. 2012, 2, 225–229. [Google Scholar]
  51. Gastélum-Barrios, A.; López-Bórquez, R.; Rico-García, E.; Toledano-Ayala, M.; Soto-Zarazúa, G. Tomato quality evaluation with image processing: A review. Afr. J. Agric. Res. 2011, 6, 3333–3339. [Google Scholar] [CrossRef]
  52. Schouten, R.E.; Huijben, T.P.; Tijskens, L.M.M.; Van Kooten, O. Modelling quality attributes of truss tomatoes: Linking colour and firmness maturity. Postharvest Biol. Technol. 2007, 45, 298–306. [Google Scholar] [CrossRef]
  53. Zude, M. Comparison of indices and multivariate models to non-destructively predict the fruit chlorophyll by means of visible spectrometry in apple fruit. Anal. Chim. Acta 2003, 481, 119–126. [Google Scholar] [CrossRef]
  54. Cavaco, A.M.; Pinto, P.; Antunes, M.D.; Da Silva, J.M.; Guerra, R. ‘Rocha’ pear firmness predicted by a Vis/NIR segmented model. Postharvest Biol. Technol. 2009, 51, 311–319. [Google Scholar] [CrossRef]
  55. Lafuente, V.; Herrera, L.J.; Pérez, M.D.M.; Val, J.; Negueruela, I. Firmness prediction in Prunus persica ‘Calrico’ peaches by visible/short-wave near infrared spectroscopy and acoustic measurements using optimised linear and non-linear chemometric models. J. Sci. Food Agric. 2014, 95, 2033–2040. [Google Scholar] [CrossRef] [Green Version]
  56. Olarewaju, O.O.; Bertling, I.; Magwaza, L.S. Non-destructive evaluation of avocado fruit maturity using near infrared spectroscopy and PLS regression models. Sci. Hortic. 2016, 199, 229–236. [Google Scholar] [CrossRef]
  57. Subedi, P.; Walsh, K.; Purdy, P. Determination of optimum maturity stages of mangoes using fruit spectral signatures. Acta Hortic. 2013, 199, 521–527. [Google Scholar] [CrossRef]
  58. Peng, Y.; Lu, R. Analysis of spatially resolved hyperspectral scattering images for assessing apple fruit firmness and soluble solids content. Postharvest Biol. Technol. 2008, 48, 52–62. [Google Scholar] [CrossRef]
  59. Hong, T.; Qiao, J.; Ning, W.; Ngadi, M.O.; Zhao, Z.; Li, Z. Non-destructive inspection of Chinese pear quality based on hyperspectral imaging technique. Nongye Gongcheng Xuebao/Transactions Chinese Soc. Agric. Eng. 2007, 23, 151–155. [Google Scholar]
  60. Lu, R.; Peng, Y. Hyperspectral Scattering for assessing Peach Fruit Firmness. Biosyst. Eng. 2006, 93, 161–171. [Google Scholar] [CrossRef]
  61. Rajkumar, P.; Wang, N.; Eimasry, G.; Raghavan, G.; Gariepy, Y. Studies on banana fruit quality and maturity stages using hyperspectral imaging. J. Food Eng. 2012, 108, 194–200. [Google Scholar] [CrossRef]
  62. Sivakumar, S.; Qiao, J.; Wang, N.; Gariépy, Y.; Raghavan, G.; McGill, J. Detecting Maturity Parameters of Mango Using Hyperspectral Imaging Technique. In Proceedings of the 2006 ASABE Annual International Meeting, Portland, OR, USA, 9–12 July 2006; pp. 194–200. [Google Scholar] [CrossRef]
  63. Lleó, L.; Barreiro, P.; Ruiz-Altisent, M.; Herrero, A. Multispectral images of peach related to firmness and maturity at harvest. J. Food Eng. 2009, 93, 229–235. [Google Scholar] [CrossRef] [Green Version]
  64. Liu, C.; Liu, W.; Chen, W.; Yang, J.; Zheng, L. Feasibility in multispectral imaging for predicting the content of bioactive compounds in intact tomato fruit. Food Chem. 2015, 173, 482–488. [Google Scholar] [CrossRef]
  65. Muhua, L.; Peng, F.; Renfa, C. Non-destructive estimation peach SSC and firmness by mutispectral reflectance imaging. N.Z. J. Agric. Res. 2007, 50, 601–608. [Google Scholar] [CrossRef]
  66. Tallada, J.G.; Nagata, M.; Kobayashi, T. Non-Destructive Estimation of Firmness of Strawberries (Fragaria x ananassa Duch.) Using NIR Hyperspectral Imaging. Environ. Control. Biol. 2006, 44, 245–255. [Google Scholar] [CrossRef] [Green Version]
  67. Johnson, L.F.; Herwitz, S.R.; Lobitz, B.M.; Dunagan, S.E. Feasibility of monitoring coffee field ripeness with airborne multispectral imagery. Appl. Eng. Agric. 2004, 20, 845–849. [Google Scholar] [CrossRef]
  68. Merzlyak, M.N.; Gitelson, A.A.; Chivkunova, O.B.; Rakitin, V.Y. Non-destructive optical detection of pigment changes during leaf senescence and fruit ripening. Physiol. Plant. 2002, 106, 135–141. [Google Scholar] [CrossRef] [Green Version]
  69. Fernández, F.; Paul, G.; Marceliano, L. Stages of Development of The Common Bean Plant; Centro Internacional de Agricultura Tropical: Cali, Colombia, 1986; p. 32. [Google Scholar]
  70. Hassanzadeh, A.; Van Aardt, J.; Murphy, S.P.; Pethybridge, S.J. Yield modeling of snap bean based on hyperspectral sensing: A greenhouse study. J. Appl. Remote. Sens. 2020, 14, 024519. [Google Scholar] [CrossRef]
  71. Van Aardt, J.A.N.; Wynne, R.H. Examining pine spectral separability using hyperspectral data from an airborne sensor: An extension of field-based results. Int. J. Remote. Sens. 2007, 28, 431–436. [Google Scholar] [CrossRef]
  72. Van Aardt, J.A.N.; Norris-Rogers, M. Spectral–age interactions in managed, even-aged Eucalyptus plantations: Application of discriminant analysis and classification and regression trees approaches to hyperspectral data. Int. J. Remote. Sens. 2008, 29, 1841–1845. [Google Scholar] [CrossRef]
  73. Pearson, K. LIII. On lines of closes fit to system of points in space, London, E dinb. Dublin Philos. Mag. J. Sci. 1901, 2, 559–572. [Google Scholar] [CrossRef] [Green Version]
  74. Hubert, M.; Rousseeuw, P.J.; Branden, K.V. ROBPCA: A New Approach to Robust Principal Component Analysis. Technometrics 2005, 47, 64–79. [Google Scholar] [CrossRef]
  75. Daffertshofer, A.; Lamoth, C.J.; Meijer, O.G.; Beek, P.J. PCA in studying coordination and variability: A tutorial. Clin. Biomech. 2004, 19, 415–428. [Google Scholar] [CrossRef]
  76. Syms, C. Principal Components Analysis. Encyclopedia of Ecology. Available online: https://strata.uga.edu/software/pdf/pcaTutorial.pdf (accessed on 8 June 2020).
  77. Bajorski, P. Statistics for Imaging, Optics, and Photonics; John Wiley & Sons: Hoboken, NJ, USA, 2011; Volume 808. [Google Scholar]
  78. Savitzky, A.; Golay, M.J.E. Smoothing and Differentiation of Data by Simplified Least Squares Procedures. Anal. Chem. 1964, 36, 1627–1639. [Google Scholar] [CrossRef]
  79. Kokaly, R.; Clark, R.N. Spectroscopic Determination of Leaf Biochemistry Using Band-Depth Analysis of Absorption Features and Stepwise Multiple Linear Regression. Remote. Sens. Environ. 1999, 67, 267–287. [Google Scholar] [CrossRef]
  80. Harrell, F.E.; Califf, R.M.; Pryor, D.B.; Lee, K.L.; Rosati, R.A. Evaluating the Yield of Medical Tests. JAMA 1982, 247, 2543–2546. [Google Scholar] [CrossRef]
  81. Harrell, F.E., Jr.; Lee, K.L.; Mark, D.B. Multivariable prognostic models: Issues in developing models, evaluating assumptions and adequacy, and measuring and reducing errors. Stat. Med. 1996, 15, 361–387. [Google Scholar] [CrossRef]
  82. Ratner, B. The correlation coefficient: Its values range between +1/−1, or do they? J. Target. Meas. Anal. Mark. 2009, 17, 139–142. [Google Scholar] [CrossRef] [Green Version]
  83. Hosmer, D.W.; Lemeshow, S.; Sturdivant, R.X. Applied Logistic Regression; John Wiley & Sons: Hoboken, NJ, USA, 2013; Volume 398, pp. 35–48. [Google Scholar]
  84. Cortes, C.; Vapnik, V. Support-Vector Networks. Mach. Learn. 1995, 20, 273–297. [Google Scholar] [CrossRef]
  85. Singh, S.; Haddon, J.; Markou, M. Nearest-neighbour classifiers in natural scene analysis. Pattern Recognit. 2001, 34, 1601–1612. [Google Scholar] [CrossRef]
  86. Lee, E.P.F.; Lozeille, J.; Soldã¡n, P.; Daire, S.E.; Dyke, J.M.; Wright, T.G. An ab initio study of RbO, CsO and FrO (X2Σ+; A2Π) and their cations (X3Σ−; A3Π). Phys. Chem. Chem. Phys. 2001, 3, 4863–4869. [Google Scholar] [CrossRef]
  87. Rosenblatt, F. The perceptron: A probabilistic model for information storage and organization in the brain. Psychol. Rev. 1958, 65, 386–408. [Google Scholar] [CrossRef] [Green Version]
  88. Bottou, L. Large-Scale Machine Learning with Stochastic Gradient Descent. In Proceedings of the COMPSTAT’2010, 19th International Conference on Computational Statistics, Paris, France, 22–27August 2010; pp. 177–186. [Google Scholar]
  89. Quinlan, J.R. Induction of Decision Trees. Mach. Learn. 1986, 1, 81–106. [Google Scholar] [CrossRef] [Green Version]
  90. Breiman, L. Random Forests. Mach. Learn. 2001, 45, 5–32. [Google Scholar] [CrossRef] [Green Version]
  91. Browne, M.W. Cross-Validation Methods. J. Math. Psychol. 2000, 44, 108–132. [Google Scholar] [CrossRef] [Green Version]
  92. Hossin, M.; Sulaiman, M.N. A Review on Evaluation Metrics for Data Classification Evaluations. Int. J. Data Min. Knowl. Manag. Process. 2015, 5, 1–11. [Google Scholar] [CrossRef]
  93. Van Rossum, G.; Drake, F.L., Jr. Python Tutorial; Centrum voor Wiskunde en Informatica: Amsterdam, The Netherlands, 1995; Volume 620. [Google Scholar]
  94. Pedregosa, F.; Varoquaux, G.; Gramfort, A.; Michel, V.; Thirion, B.; Grisel, O.; Blondel, M.; Prettenhofer, P.; Weiss, R.; Dubourg, V. Scikit-learn: Machine learning in Python. J. Mach. Learn. Res. 2011, 12, 2825–2830. [Google Scholar]
  95. Hassanzadeh, A. yxoos/MultivariateNormality: Zenodo Release (Version 1.0). Zenodo. Available online: https://github.com/yxoos/MultivariateNormality (accessed on 19 January 2020).
  96. Hassanzadeh, A. yxoos/ContinuumRemoval: Zenodo Release (Version 1.0). Zenodo. Available online: https://github.com/yxoos/ContinuumRemoval (accessed on 19 January 2020).
  97. Hassanzadeh, A. Snap Bean Growth and Maturity Spectral Data. Available online: 10.6084/m9.figshare.13111064 (accessed on 9 September 2020).
  98. Lim, K.; Treitz, P.; Wulder, M.; St-Onge, B.; Flood, M. LiDAR remote sensing of forest structure. Prog. Phys. Geogr. Earth Environ. 2003, 27, 88–106. [Google Scholar] [CrossRef] [Green Version]
  99. Rouzbeh Kargar, A.; MacKenzie, R.; Asner, G.P.; van Aardt, J. A Density-Based Approach for Leaf Area Index Assessment in a Complex Forest Environment Using a Terrestrial Laser Scanner. Remote Sens. 2019, 11, 1791. [Google Scholar] [CrossRef] [Green Version]
  100. Kargar, A.R.; MacKenzie, R.A.; van Aardt, J.A. Assessment of Aboveground Root Growth and Surface Elevation Changes In Mangrove Forests Using a Rapid-Scan, Low Point Density Terrestrial Laser Scanner. In Proceedings of the American Geophysical Union Fall Meeting, San Francisco, CA, USA, 9–13 December 2019. [Google Scholar]
  101. Curran, P.J. Remote sensing of foliar chemistry. Remote. Sens. Environ. 1989, 30, 271–278. [Google Scholar] [CrossRef]
  102. Story, M.; Congalton, R.G. Accuracy assessment: A user’s perspective. Photogramm. Eng. Remote Sens. 1986, 52, 397–399. [Google Scholar]
  103. Cohen, J. A Coefficient of Agreement for Nominal Scales. Educ. Psychol. Meas. 1960, 20, 37–46. [Google Scholar] [CrossRef]
  104. Boutraa, T.; Sanders, F.E. Influence of Water Stress on Grain Yield and Vegetative Growth of Two Cultivars of Bean (Phaseolus vulgaris L.). J. Agron. Crop. Sci. 2001, 187, 251–257. [Google Scholar] [CrossRef]
  105. Prasad, P.V.V.; Boote, K.J.; Allen, L.H.; Thomas, J.M.G. Effects of elevated temperature and carbon dioxide on seed-set and yield of kidney bean (Phaseolus vulgaris L.). Glob. Chang. Biol. 2002, 8, 710–721. [Google Scholar] [CrossRef]
  106. Card, D.H.; Peterson, D.L.; Matson, P.A.; Aber, J.D. Prediction of leaf chemistry by the use of visible and near infrared reflectance spectroscopy. Remote. Sens. Environ. 1988, 26, 123–147. [Google Scholar] [CrossRef]
  107. Graham, P.; Ranalli, P. Common bean (Phaseolus vulgaris L.). Field Crop. Res. 1997, 53, 131–146. [Google Scholar] [CrossRef]
  108. Martin, M.E.; Aber, J.D. High spectral resolution remote sensing of forest canopy lignin, nitrogen, and ecosystem processes. Ecol. Appl. 1997, 7, 431–443. [Google Scholar] [CrossRef]
  109. Boland, G.; Hall, R. Index of plant hosts of Sclerotinia sclerotiorum. Can. J. Plant. Plant. Pathol. 1994, 16, 93–108. [Google Scholar] [CrossRef]
Figure 1. The experimental greenhouse environment—48 snap bean plants served as our test bed, with artificial lights providing additional light and heat, necessary for healthy plant growth.
Remotesensing 12 03809 g001
Figure 2. Three important stages of growth in snap bean: (a) budding, (b) flowering, and (c) pod formation.
Remotesensing 12 03809 g002
Figure 3. (a) The assembly used for collecting spectral data with the spectroradiometer, (b) black felt covering the soil background to capture pure vegetative spectra, and (c) the Spectralon panel used for calibration to reflectance and normalizing samples to correct for illumination differences between plants and collection days.
Remotesensing 12 03809 g003
Figure 4. Flowchart of the algorithm used in this study.
Remotesensing 12 03809 g004
Figure 5. Biophysical boxplot of height, width, and number of leaves data.
Remotesensing 12 03809 g005
Figure 6. Impact plots for first four principal components and their corresponding explained variability. Note the negative and positive impact lines as indicators of how spectra evolved over the growing season.
Remotesensing 12 03809 g006
Figure 7. The vegetative growth binary classification for the [CR-spec] data set: (a) shows the confusion matrix where class 0 = non-vegetative growth, and class 1 = vegetative growth, while (b) shows the associated receiver operating characteristic (ROC) curve.
Remotesensing 12 03809 g007
Figure 8. Budding binary classification for the [CR-spec] data set: (a) confusion matrix (class 0 = non-budding, class 1 = budding), and (b) the associated ROC curve.
Remotesensing 12 03809 g008
Figure 9. Flowering binary classification for [CR-spec] data: (a) confusion matrix class 0 representing non-flowering, and class 1 indicating flowering, (b) ROC curve.
Remotesensing 12 03809 g009
Figure 10. The pod formation binary classification for the [CR-spec] data set: (a) confusion matrix (class 0 = non-pod formation, class 1 = pod formation), (b) ROC curve.
Remotesensing 12 03809 g010
Figure 11. Results from support vector machine (SVM) classification and their corresponding frequency based on wavelengths for SGI, where first wavelength = w1 and second wavelength = w2 in w 1 w 2 . (a) represents the histogram of the most accurate first wavelengths, while (b) depicts the most accurate second wavelengths.
Remotesensing 12 03809 g011
Figure 12. Frequency based on wavelengths for normalized difference snap-bean growth index (NDSI) via SVM classifier, where first wavelength = w1 and second wavelength = w2 in w 1   w 2 w 1 + w 2 . Histogram of the most accurate first wavelengths represented in (a), while (b) shows the most accurate second wavelengths.
Remotesensing 12 03809 g012
Figure 13. Confusion matrices for pod maturity classification using top five discriminating features of (a) [Set 1], immature + mid-mature (class 0) vs. mature + over-mature (class 1), (b) [Set 2], immature + mid-mature (class 0) vs. mature (class 1) vs. over-mature (class 2), and (c) [Set 3], immature (class 0) vs. mid-mature (class 1) vs. mature + over-mature (class 2). Note that the distinction between mid-mature from immature and ripe is challenging. The same is true for distinction between mature and over-mature.
Remotesensing 12 03809 g013aRemotesensing 12 03809 g013b
Table 1. Growth stage binary classification data used in this study and the corresponding number of samples in a one-vs.-rest fashion: True class samples indicate the number of samples that were labeled as the “true” class (e.g., vegetative growth) or of the “false” class (non-vegetative growth; i.e., rest). Numbers below indicate the number of samples for each class.
Data SetDays CapturedTrue Class SamplesFalse Class Samples
Vegetative Growth29696
Budding5240240
Flowering14848
Pod Formation17384384
Table 2. Pod maturity classification data and the number of samples in for each sieve size.
Ripeness Level
ImmatureMid-MatureMatureOver-Mature
Sieve Size123456
Number of Samples158332863148194
Table 3. Results for growth stage classification—snap bean vegetative only. Note the superior performance of continuum-removal approach compared to other techniques.
ModelAccuracy (Top 2)Accuracy (Top 5)Accuracy (Top 10)Selected Features (Top 10; nm or mm)
Raw − spec. aKNN2018
0.51
Raw − spec.+ PHY bDTRFNL c, W d, H e, 2018
0.860.83
Smoothed − spec.KNN2010
0.48
Smoothed − spec. + PHYDTRFNL, W, H, 2010
0.860.83
1st Deriv. f − spec.SVMPerc.LSVM733, 759, 814, 834, 1132, 2168, 615, 825, 2143, 767
0.680.770.81
1st Deriv. − spec. + PHYSVMRFRF733, 759, 814, NL, 834, 1132, 2168, 615, 825, 2143
0.680.850.84
C.R. g − spec.RFPerc.DT2018, 2381, 614, 1490, 697, 2092, 711, 1567, 1389, 2007
0.960.970.97
C.R. − spec. + PHYRFPerc.Perc.2018, 2381, 612, 1490, 697, 2092, 711, 1560, 1389, 2394
0.960.970.98
(a) Spec.: spectral data, (b) PHY: biophysical data, (c) NL: Number of Leaves, (d) W: Width, (e) H: Height, (f) 1st Deriv.: first derivative, and (g) CR: Continuum-removal. KNN: K Nearest Neighbor, RF: Random Forest, SVM: Support Vector Machine, LSVM: Linear SVM, Perc.: Perceptron, DT: Decision Tree, SGD: Stochastic Gradient Descent, LR: Logistic Regression, and NB: Naïve Bayes.
Table 4. Results for growth stage classification—snap bean budding. Note the detection of canopy width in first derivative and CR data sets.
ModelAccuracy (Top 2)Accuracy (Top 5)Accuracy (Top 10)Selected Features (Top 10; nm or mm)
Raw − specPerc.2089
0.53
Raw − spec.+ PHYRFRFW, 2089, H, NL
0.660.80
Smoothed − spec.Perc.2107
0.53
Smoothed − spec. + PHYDTRFW, 2107, H, NL
0.660.80
1st Deriv. − spec.SVMNBRF2383, 685, 641, 659, 667, 595, 712, 1464, 2213, 603
0.650.690.80
1st Deriv. − spec. + PHYRFRFPerc.2383, W, 685, 641, 659, 667, 595, 712, 1464, 2213
0.670.680.81
C.R. − spec.KNNKNNKNN691, 2327, 701, 2315, 1400, 2365, 2029, 1193, 564, 2299
0.820.900.95
C.R. − spec. + PHYKNNKNNKNN691, 2327, 701, 2315, 1400, 2365, 2029, 1193, 564, W
0.820.900.95
Table 5. Results for growth stage classification—flowering. Note the high accuracy in CR models achieved without the use of biophysical attributes.
ModelAccuracy (Top 2)Accuracy (Top 5)Accuracy (Top 10)Selected Features (Top 10; nm or mm)
Raw − specLR1396, 498
0.71
Raw − spec.+ PHYRFPerc.W, 1396, NL, H, 498
0.650.80
Smoothed − spec.LR1396, 501
0.70
Smoothed − spec. + PHYRFRFW, 1396, H, NL, 501
0.660.80
1st Deriv. − spec.NBLRLR1804, 1460, 2010, 761, 1890, 2042, 775, 834, 2230, 2140
0.790.820.88
1st Deriv. − spec. + PHYNBLRSVM1804, 1460, 2010, 761, 1890, 775, 2042, 2230, 834, 2220
0.790.820.85
C.R. − spec.LSVMDTDT1626, 2381, 2377, 705, 2388, 2374, 2076, 2308, 1747, 693
0.980.980.98
C.R. − spec. + PHYLSVMDTDT1626, 2381, 2383, 705, 2334, 2388, 2374, 2076, 1747, 693
0.980.980.98
Table 6. Results for growth stage classification—pod formation. Note how continuum-removed model outperform others without the use of biophysical features.
ModelAccuracy (Top 2)Accuracy (Top 5)Accuracy (Top 10)Selected Features (Top 10; nm or mm)
Raw − specLSVM692
0.54
Raw − spec.+ PHYRFRFW, NL, 693, H
0.800.77
Smoothed − spec.LSVM692
0.55
Smoothed − spec. + PHYRFRFW, NL, 692, H
0.800.76
1st Deriv. − spec.NBRFPerc.595, 2383, 1093, 772, 601, 659, 767, 790, 1460, 684
0.650.720.77
1st Deriv. − spec. + PHYRFRFPerc.W, 595, 2383, 1093, 772, 601, 659, 767, 790, 1460
0.670.700.78
C.R. – spec.KNNRFRF700, 1381, 1490, 2347, 608, 2042, 1231, 2394, 712, 1822
0.780.910.94
C.R. – spec. + PHYKNNRFRF700, 1385, 1490, 1193, 2347, 608, 2042, 2394, 712, 1822
0.790.920.94
Table 7. Confusion matrix for snap bean growth index (SGI). Note the high producer’s accuracy for vegetative growth and pod formation stages.
Predicted Labels
ClassVegetative GrowthBuddingFloweringPod FormationTotalProd. Acc. (%)Err. of Omission (%)
Ref. labelsVegetative growth453004893.756.25
Budding1033504868.7531.25
Flowering0429154860.4239.58
Pod formation003454893.756.25
Total55403760192
User. Acc. (%)81.8282.5078.3875.00 79.17
Err. of commission (%)18.1817.5021.6225.00 20.83
Kappa (κ): 0.72; Overall Accuracy (%): 79.17.
Table 8. Confusion matrix for NDSI; note the higher accuracy at the flowering stage and the lower accuracy at the pod formation stage.
Predicted Labels
ClassVegetative GrowthBuddingFloweringPod FormationTotalProd. Acc. (%)Err. of Omission (%)
Ref. labelsVegetative growth462004895.834.16
Budding1133404868.7531.25
Flowering0532114866.6633.33
Pod formation008404883.3316.66
Total57404451192
User. Acc. (%)80.7082.5072.7278.43 78.64
Err. of commission (%)19.2917.5027.2721.56 21.35
Kappa: 0.71; Overall accuracy (%): 78.64.
Table 9. Results for pod maturity classification. Note the superior performance of continuum-removal model in all sets.
SetModelAccuracySelected Features (Top 5; nm or mm)
(Top 2)(Top 5)
Set 1Raw − specPerc.: 0.72 629
Raw − spec.+ PHYLR: 0.73Perc.: 0.76636, W, NL, H
Smoothed − spec.Perc.: 0.72 627
Smoothed − spec. + PHYLR: 0.73Perc.: 0.76627, W, NL, H
1st Deriv. − spec.LR: 0.73LR: 0.74685, 665, 669, 785, 819
1st Deriv. − spec. + PHYLR: 0.73KNN: 0.78665, 685, W, NL, 669
C.R. − spec.NB: 0.78Perc.: 0.78721, 2060, 742, 556, 2004
C.R. − spec. + PHYNB: 0.79Perc.: 0.79716, 2060, 742, W, 556
Set 2Raw − specPerc.: 0.58 637
Raw − spec.+ PHYPerc.: 0.59Perc.: 0.65642, NL, W, 1005, H
Smoothed − spec.Perc.: 0.62 642, 1016
Smoothed − spec. + PHYLR: 0.59Perc.: 0.65641, NL, W, 817, H
1st Deriv. − spec.Perc.: 0.59LR: 0.61487, 665, 780, 819, 669
1st Deriv. − spec. + PHYPerc.: 0.59LR: 0.61487, 665, 780, 819, 669
C.R. − spec.LR: 0.65Perc.: 0.65713, 2071, 556, 554, 742
C.R. − spec. + PHYLR: 0.65Perc.: 0.65713, 2071, 556, 554, 742
Set 3Raw − specSVM: 0.66 637
Raw − spec.+ PHYPerc.: 0.67Perc.: 0.68637, W, NL, H
Smoothed − spec.Perc.: 0.68 640, 749
Smoothed − spec. + PHYPerc.: 0.67Perc: 0.68636, W, NL, H
1st Deriv. − spec.SGD: 0.66SVM: 0.68645, 685, 822, 818, 780
1st Deriv. − spec. + PHYSGD: 0.66RF: 0.70645, 685, W, NL, 822
C.R. − spec.SGD: 0.70Perc.: 0.71720, 742, 556, 2044, 554
C.R. − spec. + PHYSGD: 0.70Perc.: 0.70720, 742, 556, 2044, W
Publisher’s Note: MDPI stays neutral with regard to jurisdictional claims in published maps and institutional affiliations.

