Article

Spatial and Temporal Human Settlement Growth Differentiation with Symbolic Machine Learning for Verifying Spatial Policy Targets: Assiut Governorate, Egypt as a Case Study

1
Faculty of Geo-Information Science and Earth Observation, University of Twente, P.O. Box 125, 7500 AE Enschede, The Netherlands
2
Architectural Engineering Department, Faculty of Engineering, Assiut University, P.O. 71515 Assiut, Egypt
3
Independent Researcher, P.O. Box 39, 7421 AR Deventer, The Netherlands
*
Author to whom correspondence should be addressed.
Remote Sens. 2020, 12(22), 3799; https://doi.org/10.3390/rs12223799
Submission received: 17 September 2020 / Revised: 11 November 2020 / Accepted: 17 November 2020 / Published: 19 November 2020
(This article belongs to the Section Urban Remote Sensing)

Abstract

:
Since 2005, Egypt has a new land-use development policy to control unplanned human settlement growth and prevent outlying growth. This study assesses the impact of this policy shift on settlement growth in Assiut Governorate, Egypt, between 1999 and 2020. With symbolic machine learning, we extract built-up areas from Landsat images of 2005, 2010, 2015, and 2020 and a Landscape Expansion Index with a new QGIS plugin tool (Growth Classifier) developed to classify settlement growth types. The base year, 1999, was produced by the national remote sensing agency. After extracting the built-up areas from the Landsat images, eight settlement growth types (infill, expansion, edge-ribbon, linear branch, isolated cluster, proximate cluster, isolated scattered, and proximate scattered) were identified for four periods (1999:2005, 2005:2010, 2010:2015, and 2015:2020). The results show that prior to the policy shift of 2005, the growth rate for 1999–2005 was 11% p.a. In all subsequent periods, the growth rate exceeded the target rate of 1% p.a., though by varying amounts. The observed settlement growth rates were 5% (2005:2010), 7.4% (2010:2015), and 5.3% (2015:2020). Although the settlements in Assiut grew primarily through expansion and infill, with the latter growing in importance during the last two later periods, outlying growth is also evident. Using four class metrics (number of patches, patch density, mean patch area, and largest patch index) for the eight growth types, all types showed a fluctuated trend between all periods, except for expansion, which always tends to increase. To date, the policy to control human settlement expansion and outlying growth has been unsuccessful.

Graphical Abstract

1. Introduction

Currently, urban land consumption is a significant challenge for sustainable development. As the global population is expected to reach 9.7 billion by 2050 [1], a substantial amount of further human settlement growth (HSG) is anticipated, especially in developing countries. Accordingly, it is projected that built-up areas in developing countries may increase from 300,000 km2 in 2000 to 770,000 km2 in 2030, and 1,200,000 km2 by 2050 [2]. With almost 60% of the world’s population already experiencing a critical food-deficit [3], the further consumption of agricultural land by HSG increases food insecurity in certain regions. HSG also contributes to pollution, global warming, water quality problems, soil degradation, land fragmentation, and impairs biological systems’ ability to support human demands [4].
There is no universal definition for HSG [5]. Generally, HSG may be viewed as a process in which undeveloped areas are occupied by buildings and infrastructures that support human occupation and use. Wilson et al. [6] identified three main types of HSG: infill growth (Figure 1a), edge-expansion (Figure 1b), and outlying (Figure 1c–e). Infill growth fills the gaps between existing built-up patches or within an existing built-up patch, whereas edge-expansion occurs on the edge of an existing patch. In contrast, outlying growth happens at a distance from any existing patch and forms a new patch. Outlying growth was further subdivided into three types: linear branch (Figure 1c) which is any linear growth adjoining roads; clustered growth which are large, compact, and dense patches (Figure 1d); and scattered growth, which is neither clustered nor linear branch (Figure 1e).
To observe such dynamics and types of HSG, several researchers have utilized remote sensing [6,7,8]. Recently, machine learning algorithms that extract built-up areas from remote sensing data have started to play a significant role in extracting built-up area estimates [9]. Pesaresi et al. [9] introduced a supervised classification technique in urban remote sensing called symbolic machine learning (SML). This technique was used earlier in ecological modeling [10]. SML allows users to find systematic relations between sequenced data (image instances) and a spatial reference set containing encoded information [11].
In contrast with neural networks, which mostly produce black-box models, SML allows users to modify and verify modeling dynamics [10]. Unlike other machine learning techniques (e.g., logistic regression, linear regression, decision trees, support vector machines, clustering, dimensionality reduction, and density estimation) that are used in remote sensing, SML can deal with datasets that have variable characteristics (e.g., different sensors, and atmospheric characteristics) using less time, training sets, and complex learning processes [11]. SML was used in extracting the global built-up area producing a data set that is called Global Human Settlement Layer (GHSL) [12]. Although the GHSL provides useful information to monitor HGS in four temporal points (1975, 1990, 2000, 2014), the accuracy of this dataset was not tested only for Europe [12].
For the spatial analysis of HSG, Geographic Information Systems (GIS) provide tools such as spatial metrics to measure and visualize the Spatio-temporal patterns and changes [6,13,14,15,16,17,18,19,20]. Spatial metrics are quantitative measures based on a patch-based representation of the spatial phenomenon under investigation (e.g., HSG) and may be used to identify and characterize different types of HSG (e.g., class metrics). Identifying various types of HSG supports the assessment of land development policies, such as sustainable development and smart growth [13]. For example, the high presence of scattered growth indicates that the land development pattern is sprawling rather than compact [21], the latter often promoted under sustainable urban development policies.
Egypt is a developing country that is expected to have rapid HSG, especially in the Nile Valley region [22]. Between 1907 and 2018, Egypt’s population grew from 14 million to 104 million inhabitants [23], and this growth was accompanied by uncoordinated HSG, especially after 1952 [24]. Since the 1970s, three strategies to manage HSG have been adopted. The first was to expand in the adjacent desert of the Nile Valley and Delta region [25,26]. The second was to implement a land-use development plan at the national level [27]. The third was to criminalize building on agricultural land [28]. In 1986, the first national land-use development plan in rural areas was adopted to preserve agricultural land and manage HSG [29]. Despite these strategies, Egypt lost more than one million acres (404,670 hectares) of its best agricultural land between 1980 and 2004 because of HSG [30], while between 1984 and 2007, the built-up area on agricultural lands has doubled [31]. By 2015, Khalifa reported that 85% of unplanned (informal) settlements were built on agricultural land [32]. This transformation contributed to the decline in agricultural jobs, the formation of unplanned settlements with a lack of local services and open spaces, land fragmentation, and pollution [24].
In 2003, the central government realized that the policy toward HSG had to be changed [24]. First, planning was decentralized [24]. The local authorities and the governorate received more power in planning and implementation processes. Second, the existing built-up area was densified by allowing vertical expansion and utilizing undeveloped pockets [24]. Accordingly, the (second) national project for land-use development plans in rural areas was introduced in 2005 [27]. This project aimed to reduce the annual HSG rate to be around 1% until 2020 by directing HSG to fill in the vacant pockets (infill) and preventing all types of outlying growth [33]. However, in 2011 the Arab Spring disrupted all ongoing projects in Egypt [34]. Even though the third land-use development plan for 2020–2035 is now in preparation, until now, no study has evaluated recent policies on HSG in Egypt and Assiut Governorate in particular.
From a methodological perspective, we aimed to show how new machine learning techniques can improve the accuracy of human settlement data sets to enable settlement growth analysis, which goes beyond that shown in Figure 1. From a substantive perspective, we use these data sets to answer three questions. Did the 2005 land-use development plan manage to control the HSG rate to the desired level? Was the land-use plan able to promote infill growth and prevent outlying growth? How was the HSG pattern affected by the Arab Spring? The analysis was executed with data from 1999, 2005, 2010, 2015, and 2020.
In our approach, machine learning and remote sensing were used for extracting the built-up area. GIS, Landscape Expansion Index, and class metrics were used to analyze the spatiotemporal characteristics of HSG in the study area and identify growth types that occurred during the study period. Further, we developed a QGIS Growth Classifier, a plugin tool that fosters the analysis of HSG types. We also introduce five new HSG types that highlight the impact of roads and corridors on settlement growth. Free data sources and tools were used.

2. Materials and Methods

To assess the impact of the policy shift on HSG, five steps were followed: (1) extract the built-up area from satellite imageries using SML; (2) validate the results and the training sets; (3) calculate the Landscape Expansion Index (infill growth, edge-expansion, and outlying growth); (4) identify outlying growth types (linear branch, proximate scattered isolated scattered, proximate scattered, and isolated clustered); (5) compute and compare some class metrics for the various growth types. After the description of the study area and input data, these steps are described in detail.

2.1. Study Area

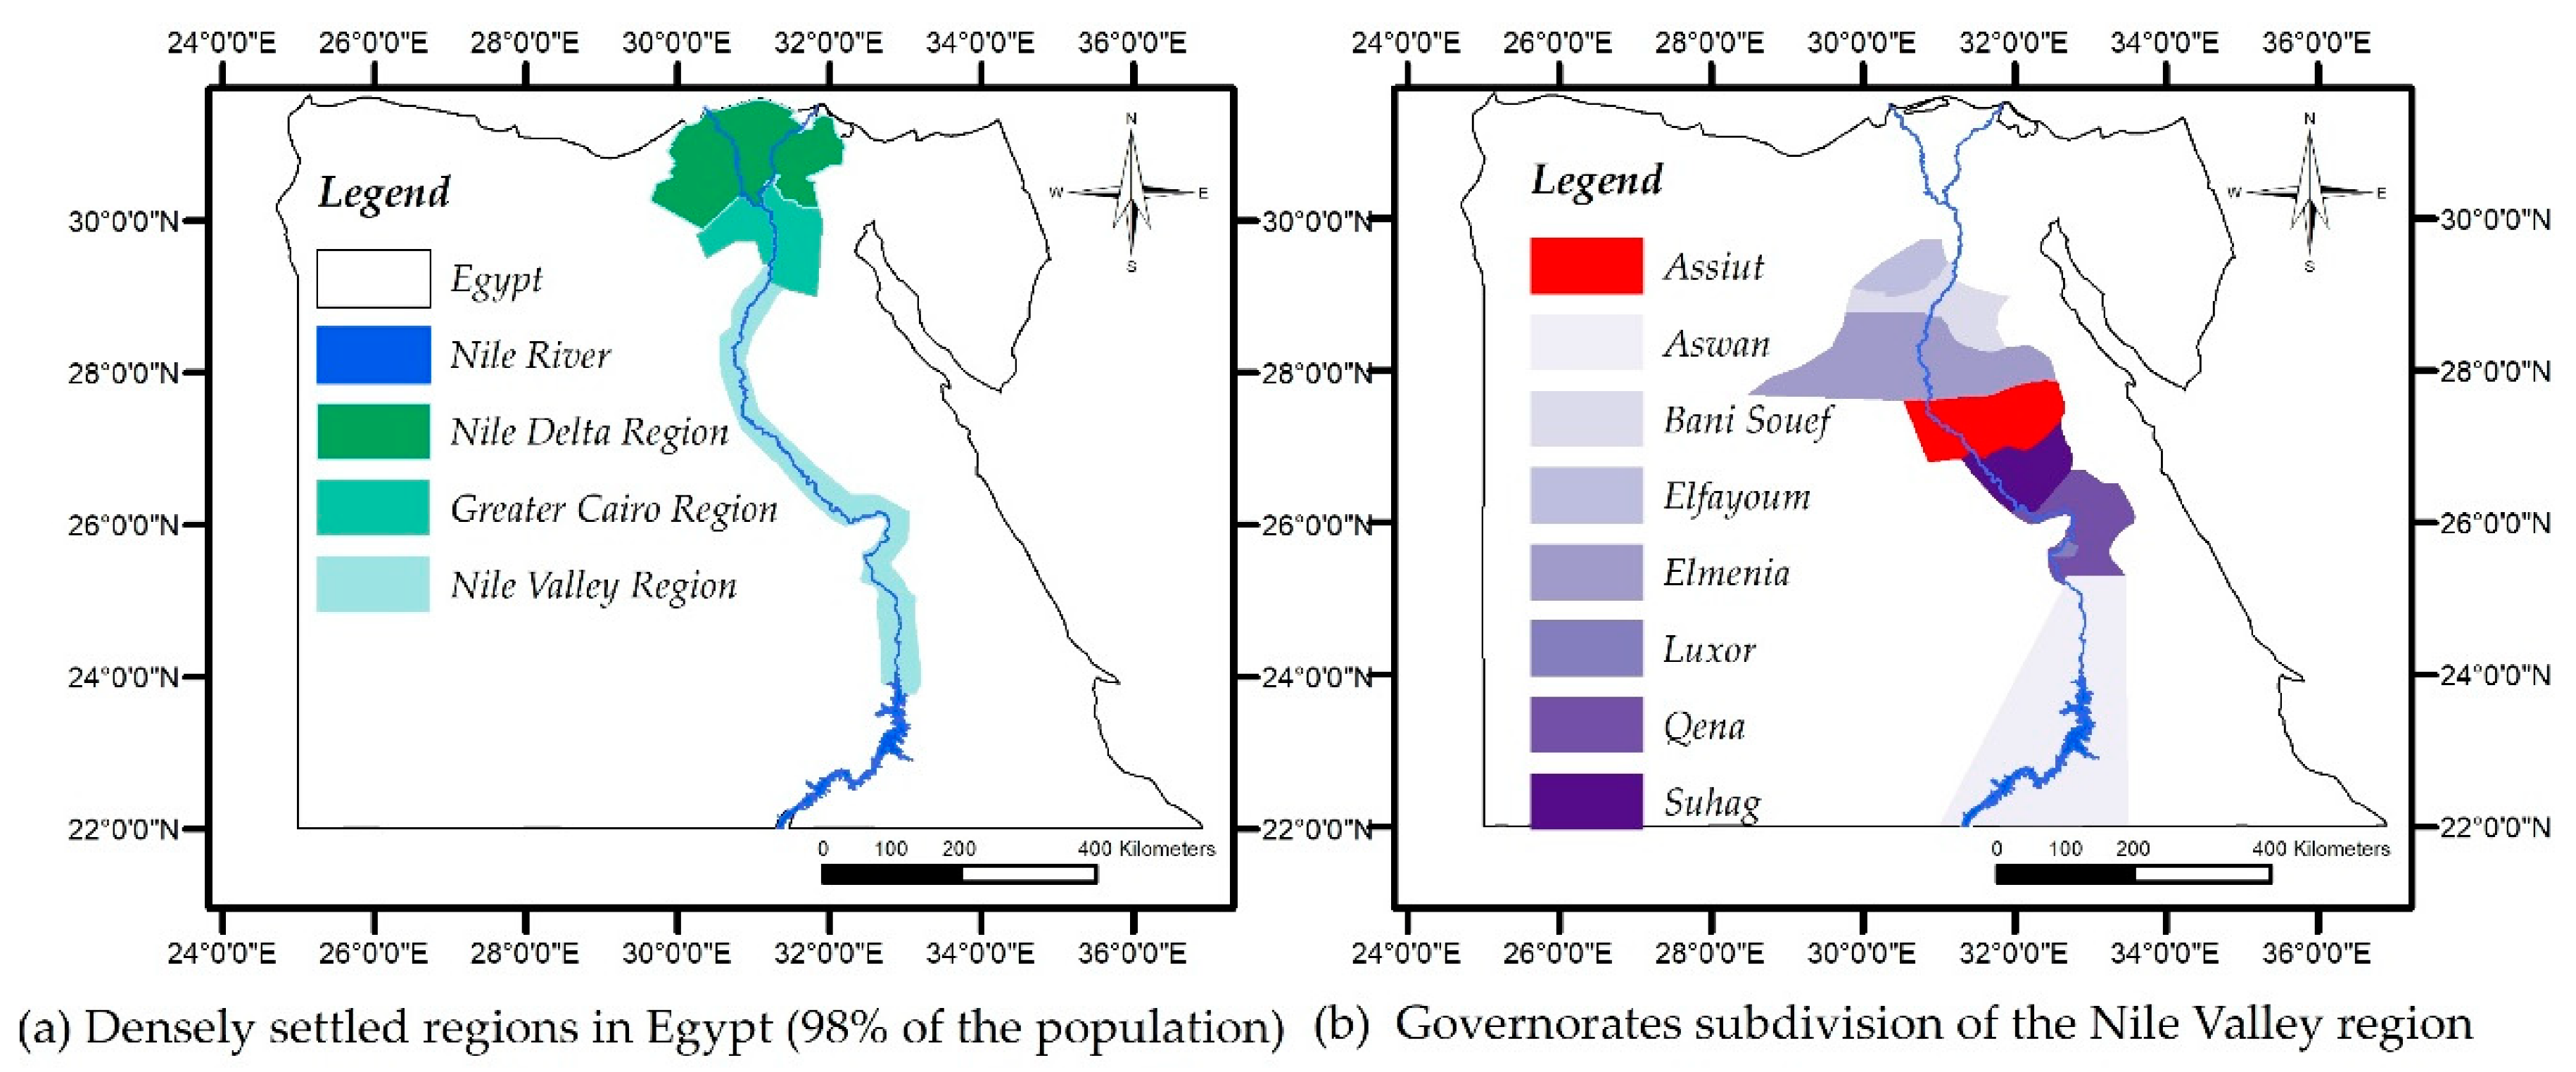
We examined the situation in the Nile Valley region. With approximately 1000 km length and an average of 12 km width (Figure 2a), the Nile Valley region represents 1.2% of the country’s total area [23]. In contrast, it provides a living environment for 28% of the total population [23]. Although the agriculture sector contributes to 63% of rural employment and 40% of rural income for the Nile Valley inhabitants [23], 7.5% of the total agricultural area was lost between 1984 and 2007 due to HSG [31].
The Nile Valley consists of eight governorates (Figure 2b). Assiut Governorate, which is located in the middle region of the Nile Valley approximately 400 km south of Cairo, was chosen because it has been experiencing rapid HSG since the 1950s. Moreover, between 2011 and 2014, it has reportedly experienced the highest number of encroachments on agricultural land by unplanned HSG of any governorate in the Nile Valley region [35]. Assiut Governorate consists of 11 centers, each of which has a city, and a total number of 235 villages. Assiut’s population was 2.9 million in 1999 and had increased to 4.5 million inhabitants by 2018 (2.9% p.a. growth) [23], representing approximately 4.2% of Egypt’s total population.

2.2. Input Data

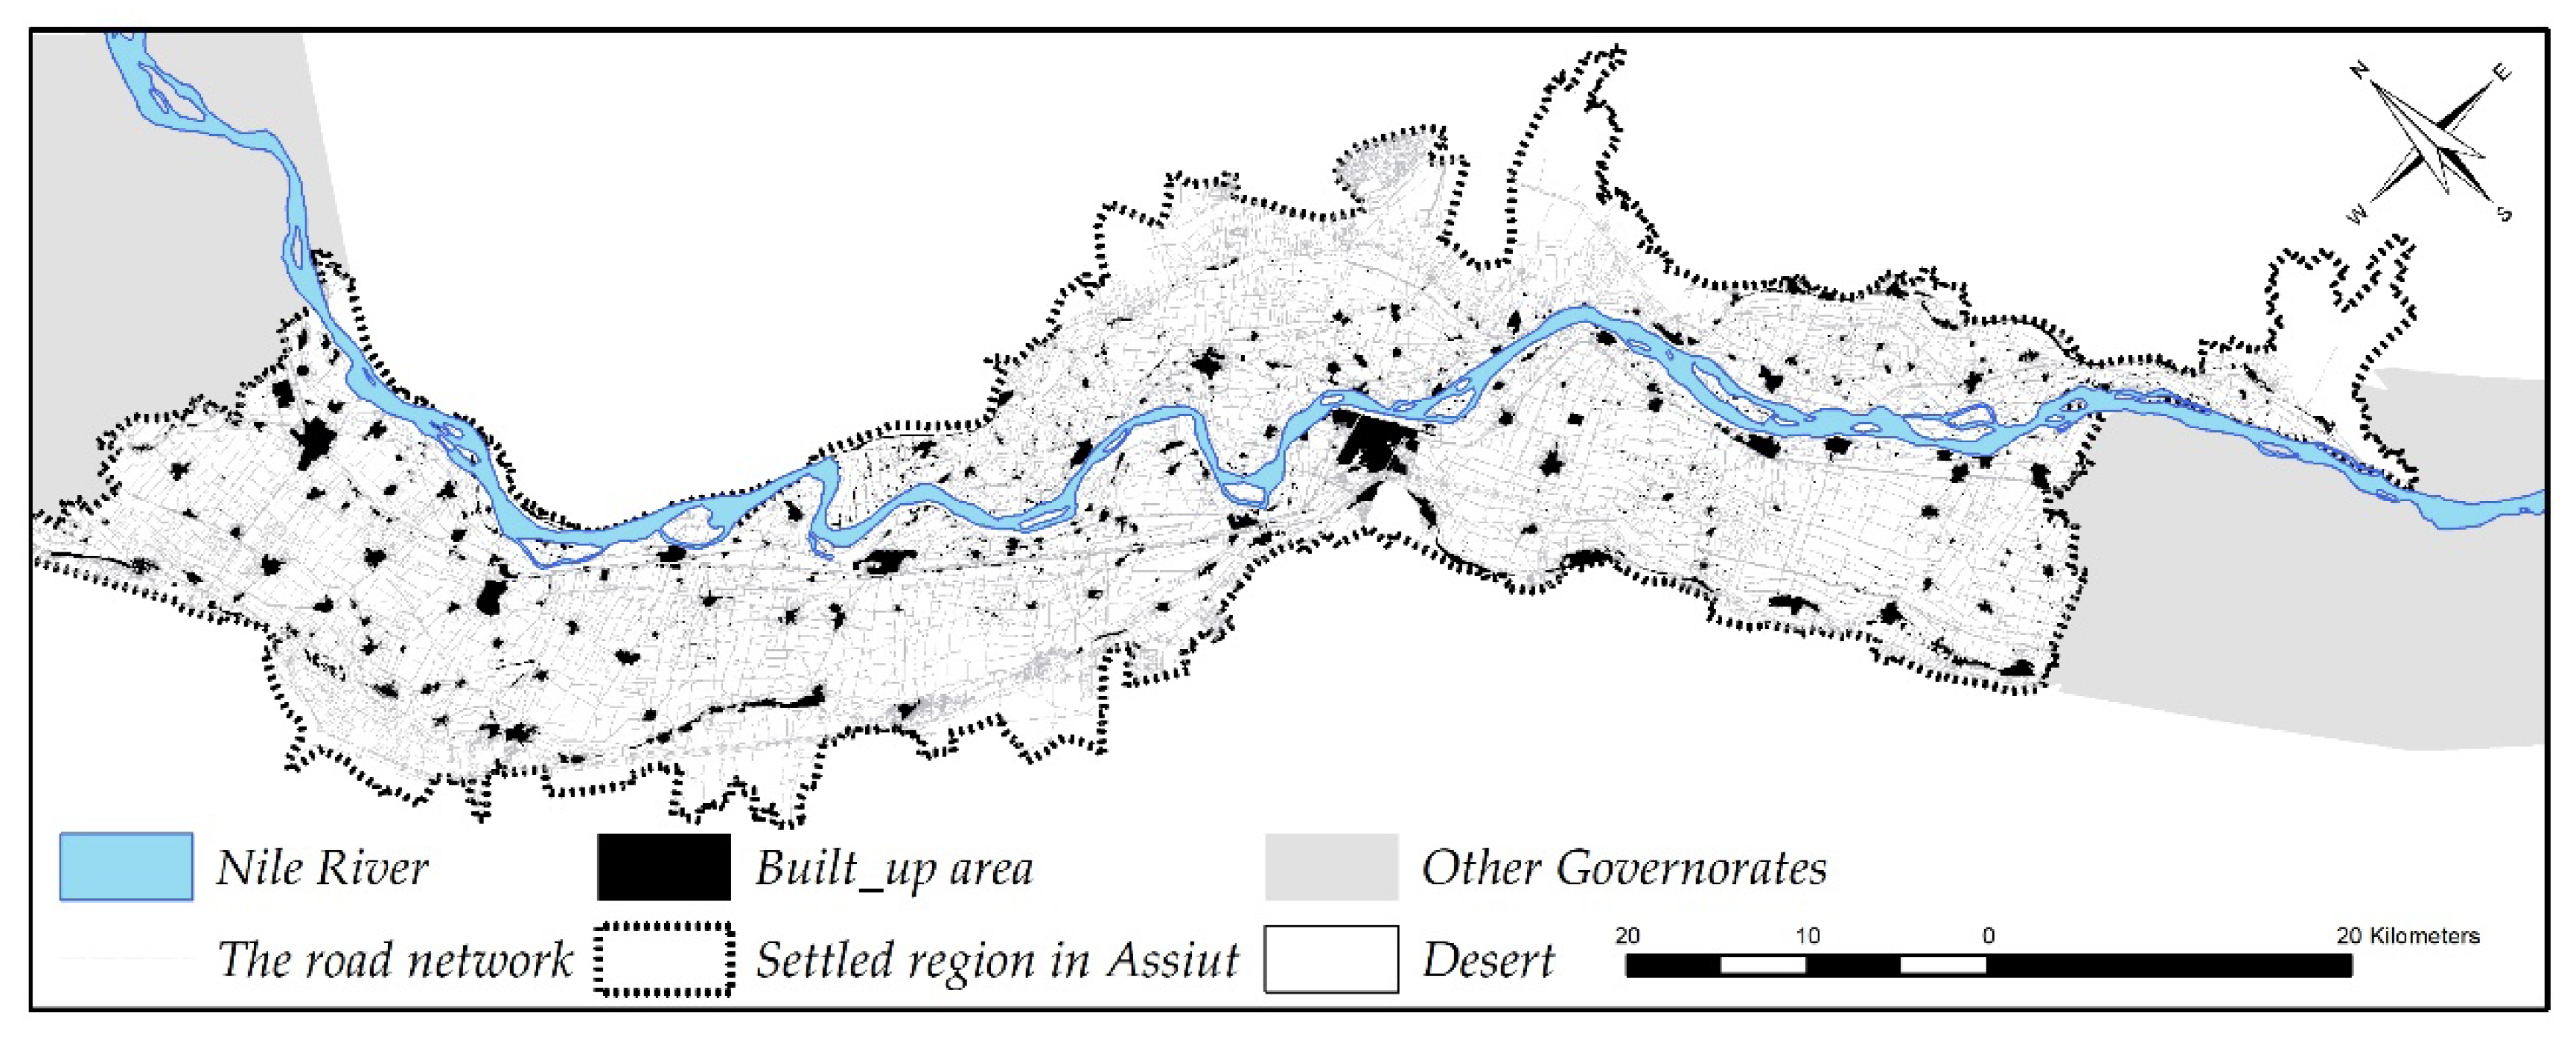
As shown in Table 1, five inputs were used: Assiut built-up area in 1999, four Landsat images, Assiut roads and water bodies, the Global Human Settlement Layer (GHSL), and the African Land Cover (ALC). The “Shapefile” for Assiut’s built-up area in 1999 was obtained from the National Agency for Remote Sensing and Space (NARSS), which gives a total built-up area of 85.5 km2 for Assiut, as shown in Figure 3.
Landsat images for the years 2005, 2010, 2015, and 2020 were used to extract the built-up area. Landsat data was chosen because it provides a free image for the same place every 16 days since the 1980s. Assiut is located within Landsat path 176, row 41. The Landsat 7 images were pre-processed by and obtained from Maryland University’s Global Land Cover Facility database (GLCF) [36], whereas Landsat 8 images were pre-processed by and collected from the United States Geological Survey (USGS) [37].
The Global Human Settlement Layer (GHSL) [38] was used as a training set for the 2005 and 2010 built-up areas’ extraction process, as demonstrated further in the following section. The GHSL is a set of layers that estimates the global built-up area in four years: 1975, 1990, 2000, and 2014. The Joint Research Center developed this open-source dataset. Due to data scarcity, only the GHSL layer for 2014 was validated using reference data, mostly located in Europe. Thus, it was used in this study as a training set other than a final estimation for Assiut built-up area. The GHSL consists of 6 layers: (1) water, (2) non-built area, (3) built-up area for 2014, (4) built-up area for 2000, (5) built-up area for 1990, and (6) built-up area for 1975. The spatial resolution for the GHSL is 30 m. For this study, the built-up area for 2000 (layers 4, 5, and 6) was the training set for estimating the built-up area for 2005 and 2010.
The African Land Cover (ALC), which was developed by the European Space Agency (ESA) [39], was used for extracting the built-up area for 2015 and 2020. ALC is a thematic land cover map for Africa at a 20m spatial resolution. ALC and GHSL were considered training sets, rather than the final estimation for the built-up area because they have not yet been validated with enough data covering all regions in the world [12].
The roads and water bodies (e.g., irrigation canals) layer (Figure 3), which was obtained from OpenStreetMap (OSM) [40] and updated, was used for identifying two types of HSG: edge-ribbon and linear branch. OSM allows users to digitize different objects, such as buildings, roads, and water bodies. Approximately 50% of Assiut’s roads and water bodies were added to the OSM data set by the lead author in order to have full coverage of the study area.

2.3. Extracting the Built-Up Area Using Symbolic Machine Learning

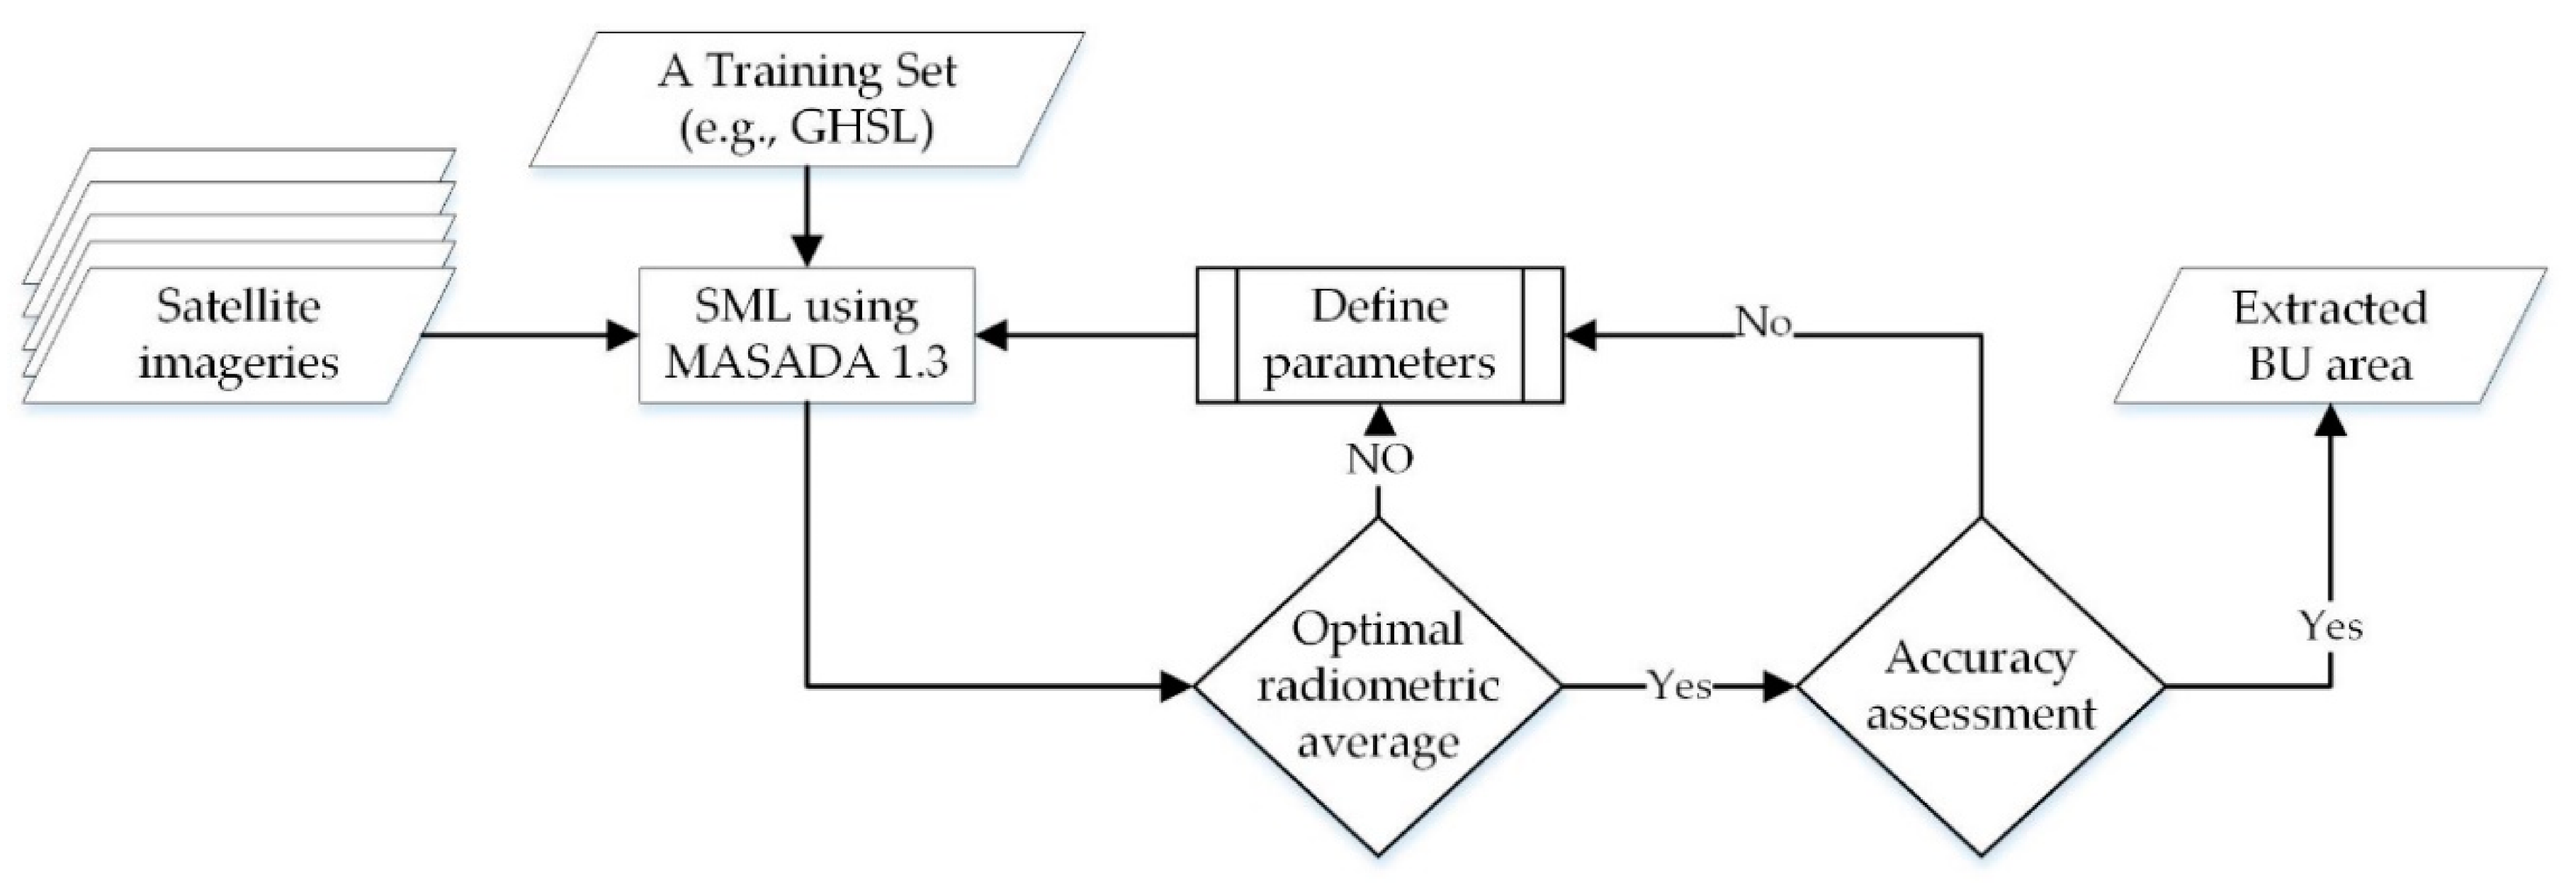
MASADA 1.3 was used to extract the built-up area for four temporal points: 2005, 2010, 2015, and 2020, as Figure 4 shows. MASADA 1.3 is free software developed by the European Commission’s Joint Research Center (JRC) for built-up area extraction using Symbolic machine learning (SML) [41]. MASADA 1.3 allows the user to use multispectral satellite imagery regardless of its spatial and radiometric resolution. Further, it supports high to very high-resolution imageries (10 m to 0.5 m) with an additional two embedded models for extracting textural and morphological features as inputs to the SML. In the current study, there is no use for these embedded models because we relied on Landsat imagery. The software offers an assessment for the output using a reference set (e.g., a thematic map for the built-up area that had already been validated). In this study, we also did not rely on this feature due to the unavailability of reference sets. Besides the satellite bands, a training set for the built-up area and water is needed to execute the analysis.
Like many machine learning algorithms, SML is a supervised classification method for extracting information (e.g., built-up area estimations) from big data (e.g., multispectral satellite bands) [9]. SML consists of two steps: (1) data reduction and quantization; (2) evaluating the association between the symbolic data and a reference set [11].
Data reduction and quantization have three main phases [9]. First, a taxonomy for each input data (e.g., multispectral imagery bands) is generated. This phase aims to reduce the colors in each spectral band. Second, the sequences of each pixel in all inputs are constructed. Third, the unique sequence for each pixel is defined based on the occurrence in frequency analysis results. After obtaining a symbolic data layer from the data reduction and quantization step, a comparison between the symbolic data layer and the training set (e.g., GHSL) was conducted to determine each pixel’s value (class). Accordingly, a confidence measure (the Evidence-based Normalized Differential Index (ENDI)) was developed for evaluating the association between the symbolic data and training data. Based on this evaluation, each pixel’s value was used as a decision criterion for the final classification output. MASADA 1.3 uses an automatic threshold method that identifies the threshold to minimize the intra-class variance between built-up and non-built-up areas. The SML was used before for extracting the Global Human Settlement Layer (GHSL) [12].
MASADA 1.3 radiometric workflow produced nine raster output maps and five documents. All but one, the map “BU_class.tif” which is the final estimated built-up area, are intermediate outputs. The five output documents measure the analysis performance and state the logs and inputs of the analysis.
To allow using any multispectral optical sensor, MASADA 1.3 software facilitates the user to tune the algorithm’s parameters. For the SML supervised classification of medium resolution sensors (e.g., Landsat), three significant parameters could be tuned to reach the optimal condition for the classification: rad_q_minlev, rad_q_maxlev, and rad_qlev, as presented in Table 2. Rad_qlev parameter [41] determines the number of levels used to reduce the input satellite bands’ colors. The optimal number of levels should result in average support (smlAvgSuppRad) [41] between 100 and 1000. The software calculates the smlAvgSuppRad after each run. Rad_q_minlev and rad_q_maxlev are used to exclude the outliers from the input data.
The new built-up area during each period was identified by taking the last time-step as the baseline [12,42]. Accordingly, the classification result for 2020 was subtracted from the former temporal point classification (i.e., 2015) to obtain the built-up area that was built between 2015 and 2020. The process of subtracting the classification of one temporal point from the former was followed until reaching 1999, which is the first time-step in this study.

2.4. Accuracy Assessment for the Training Sets and Classification Results

For accuracy assessment, a dataset that consists of 500 random points was used to validate the classification results (2005, 2010, 2015, and 2020) as well as the training sets (the GHSL built-up dataset for 2014, which consists of layer 3, 4, 5, and 6 (GHSL_2014) and ALC) [43]. Meanwhile, the GHSL built-up dataset for 2000, which consists of layers 4, 5, and 6 (GHSL_2000), was validated using the 1999 built-up area. By calculating the sensitivity and specificity [44], the training set that has more probability for detecting built-up area (sensitivity) and the less probability for false detection (less omission error) could be identified. Moreover, the classification results could be compared to the training sets (inputs) to determine which gives more probability for detecting urban areas. This procedure allows determining whether the outputs are more accurate than the training sets.

2.5. Identifying Human Settlement Growth Types

After obtaining the built-up area during each period, a QGIS plugin tool (Growth Classifier) [45], which we developed to identify HSG types based on the Landscape Expansion Index (LEI) [7,15,19,46], was applied to the four built-up area epochs (outputs step 1). Using buffer analysis, LEI depends on three rules for the identification of urban growth types. Rule 1 is that if the buffer around the new patch is mostly intersecting with the old patch, this type is considered infill growth. Rule 2 is that if the buffer area around the new patch is partially intersecting with the old patch, this type is edge-expansion. Rule 3 is that if the buffer area around the new patch does not intersect with any existing patch, this growth type is outlying.
The application of these three rules is represented in the following equation:
L E I   = 100 × α α + β
where α is the area of the intersection between the existing patch and buffer area, β is the area of the intersection between the buffer area and the non-built-up area. According to this equation, the LEI values could be between zero and 100. As shown in Figure 5, the value of LEI is >50 for infill growth, whereas the edge-expansion is 0 < LEI < 50. Finally, the LEI for outlying growth is zero. It is worth mentioning that Liu et al. (2010) tested many values for the buffer distance, and they reported that 1 m is the best buffer distance.
Colsaet et al. [47] reviewed more than 200 papers, and found that proximity to roads and transport facilities increases land take, which subsequently leads to HSG. Accordingly, we proposed five growth types that examine the effect of corridors on growth types. The first is a sub-type for edge-expansion, which is edge-ribbon (the other four are discussed in the next section). Angel et al. [5] defined ribbon development as built-up areas that are less than 100 m wide and have less than 30% built-up neighborhoods. Verbeek et al. [48,49] identified ribbon development as any patch with 200 m minimum length or if the ratio between the patch length and the adjoining road is more than 80%. In our study, edge-ribbon is any edge-expansion patch that adjoins a corridor (i.e., roads and irrigation networks) such that the patch has a linear shape.
Accordingly, and based on Rule 2, Rule 4 is that if a new patch is classified as edge-expansion, adjoining a corridor, its width is less than 100 m, and length is more than 150, this growth type is edge-ribbon. These values were chosen to identify (relatively) dense patches on the sides of the corridor. In Assiut, a previous study reported that the average area for unplanned units is 250 m2 [35]. Accordingly, the minimum patch area for edge-ribbon growth type would contain an average of 60 units. To identify different patch dimensions for different contexts, the QGIS plugin tool allows tuning the length and the width of the designated edge-ribbon growth type.
To explore the aggregated properties for HSG in Assiut as a whole, the Mean Expansion Index (MEI) and the Area Weighted Mean Expansion Index (AWMEI) were calculated for each period [46]. MEI is the simple average of the LEI values for all patches. MEI is calculated according to the following equation:
M E I   = i = 1 n L E I i N
where L E I i   is the LEI for the patch, and N is the total number of newly grown patches in this period. Low MEI means the diffused expansion, and high MEI means a more compact growth. AWMEI is the sum of all new patches LEI values multiplied by the patch’s proportional abundance (the patch area divided by the total patches’ area). AWMEI is calculated as follows:
A W M E I   = i = 1 n L E I i × ( a i A )
where a i is the patch area, and A is the total area of the newly grown patches. More compact growth results in higher AWMEI, whereas diffused expansion gets low AWMEI.

2.6. Identifying Outlying Growth Types

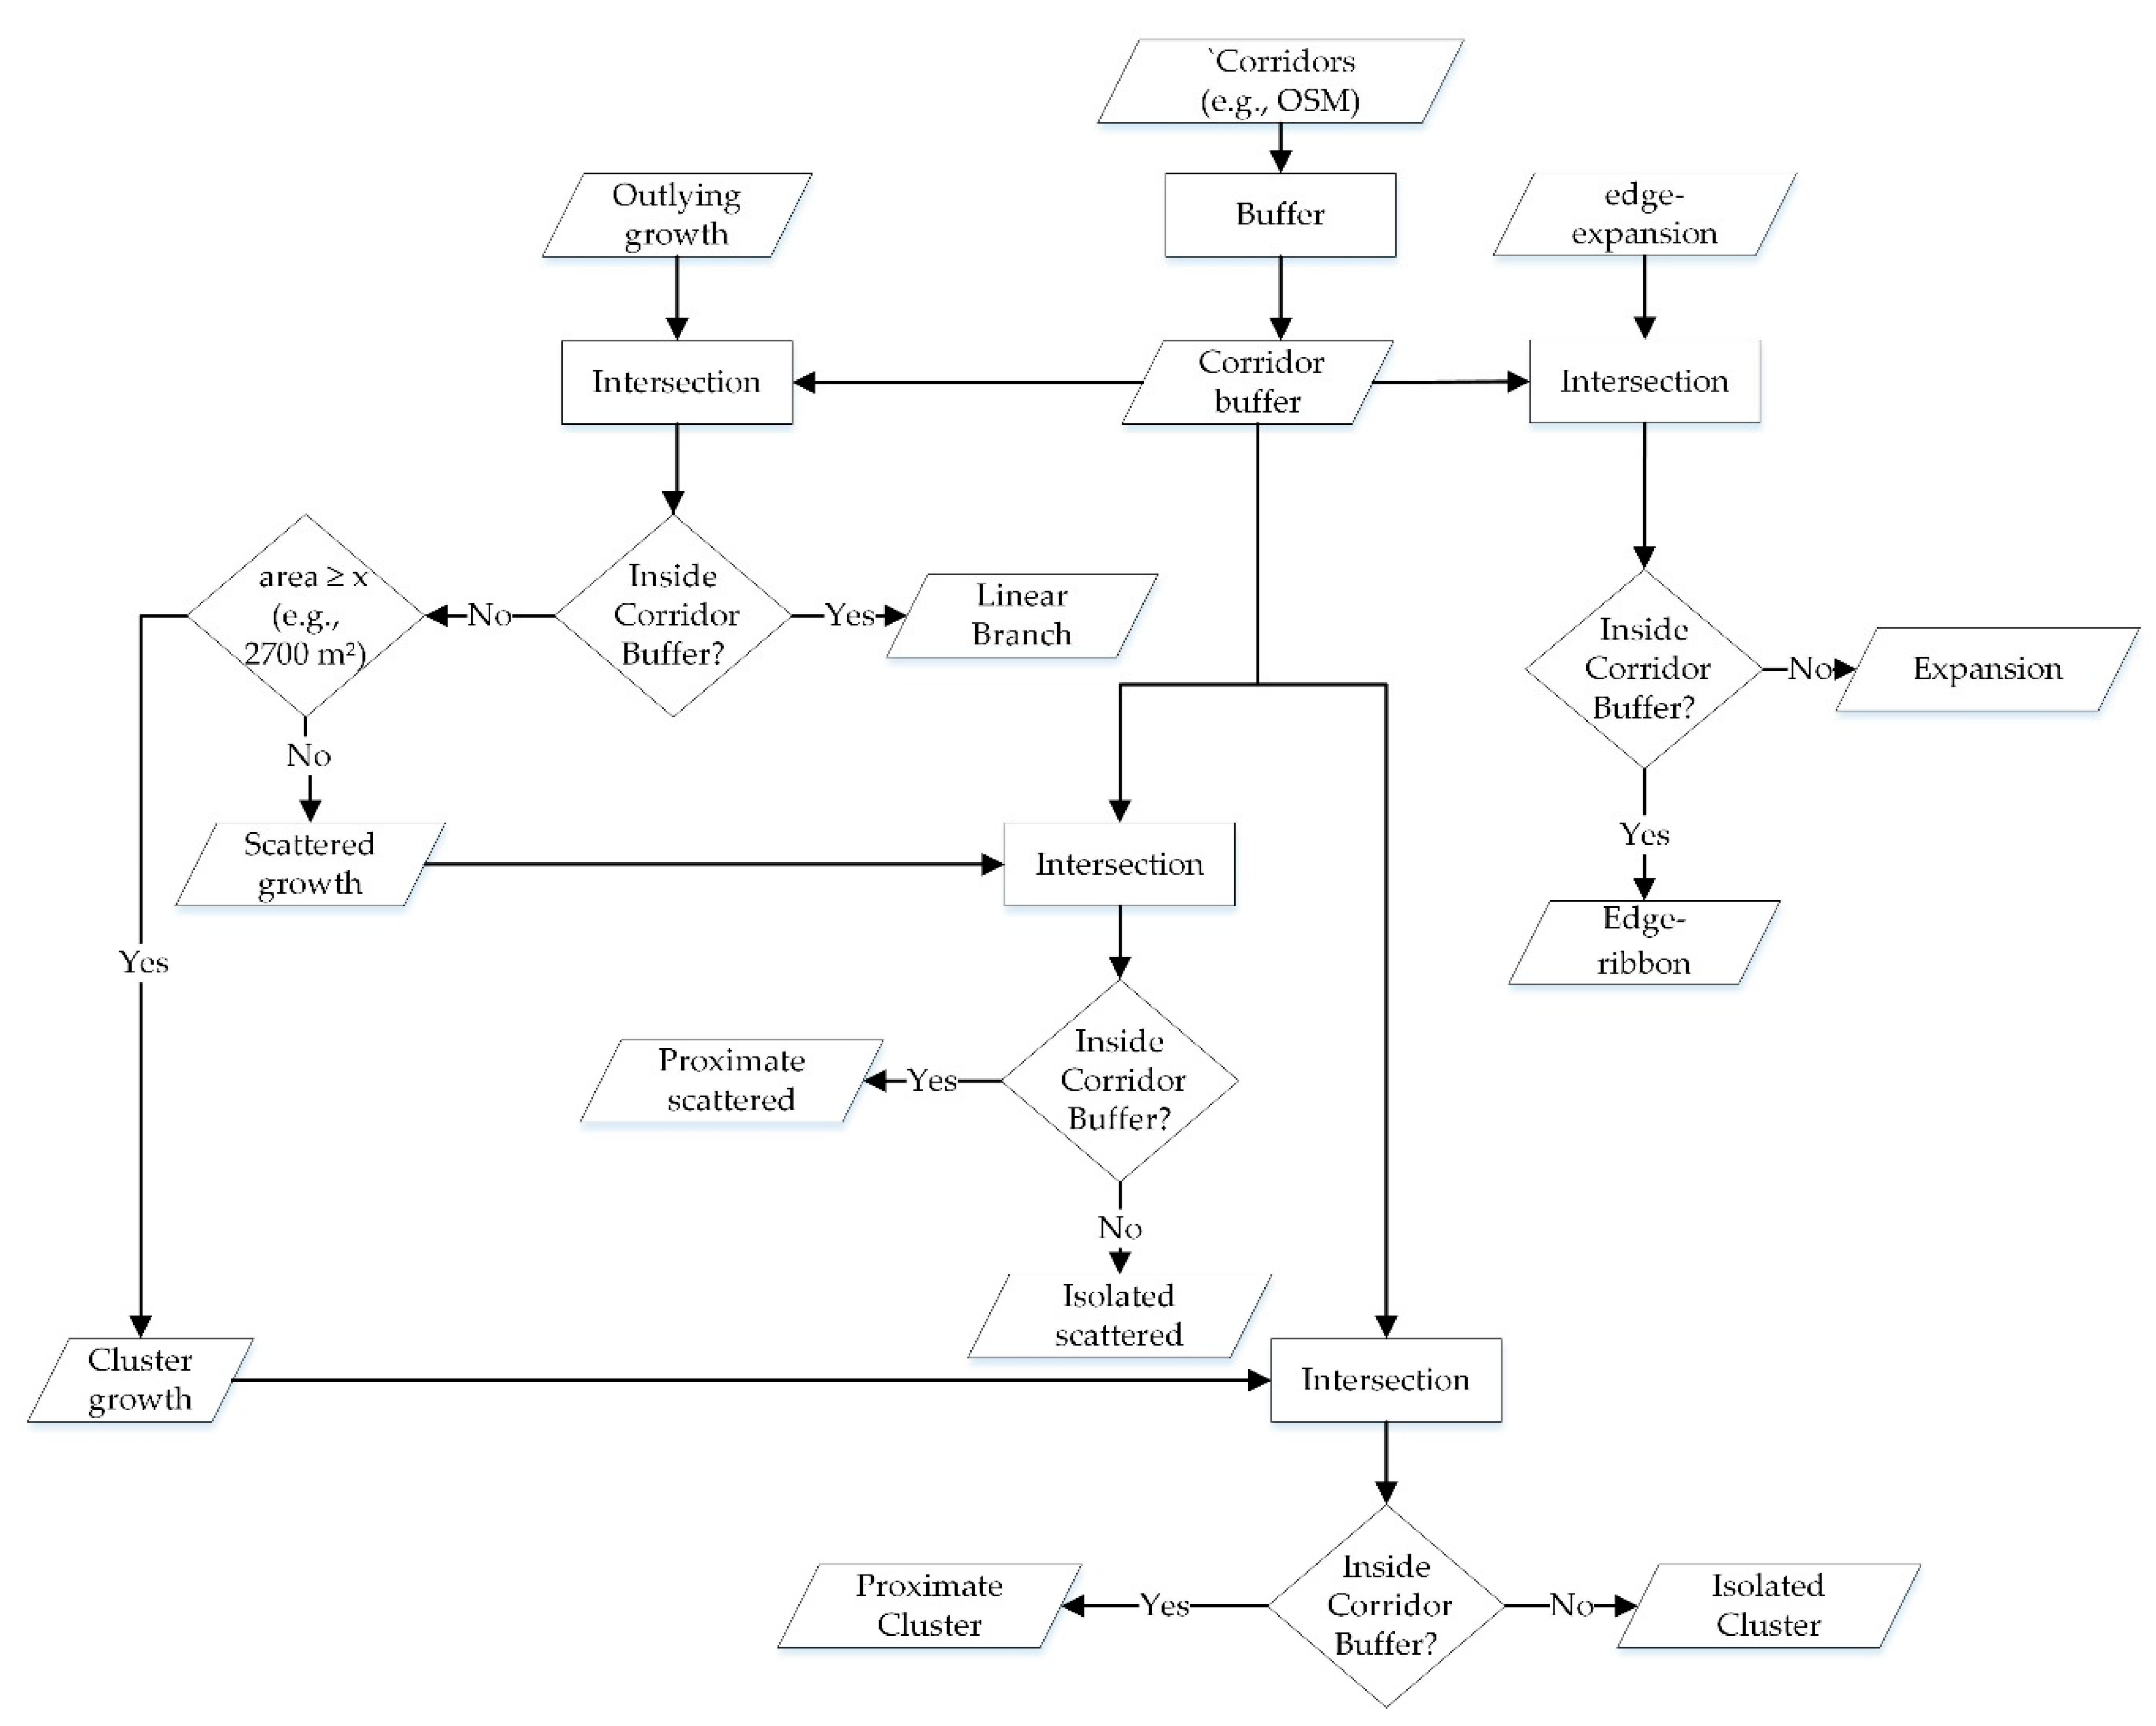
Using the same QGIS plugin, outlying growth types were identified, as presented in Figure 6. The linear branch was defined as edge-ribbon in terms of width (less than 100 m) and length (more than 150 m). The only difference is that linear branch patches are outlying growth (has no intersection with any existing patch), whereas the edge-ribbon is edge-expansion growth (intersect with at least one existing patch).
The clustered growth was identified as the new patches of outlying growth that are more than or equal to 2700 m2 in terms of area. The minimum cluster patch would contain more than ten units. The tool also allows changing the area to fit in a different context. Same as Wilson et al. (2003) [6], we defined scattered as any outlying growth that is neither a linear branch nor clustered.
To investigate the effect of corridors on other outlying types than the linear branch, we proposed Four subtypes. The first is the proximate cluster, which is any patch that was classified as cluster growth as well as being located in the corridor buffer area. In contrast, the second is isolated cluster, representing any cluster patch that is not located inside the corridor buffer area. The third is proximate scattered, which represents the scattered patches that are located inside the corridor buffer area. The fourth is isolated scattered, which is for any scattered patch that is not located inside the buffer area.

2.7. Class Metrics

After identifying the eight growth types, four class metrics (number of patches, patch density, largest patch index, and mean patch area) were calculated to compare these growth types [50,51]. The number of patches is the total number of patches in each class. Patch density is the total number of patches divided by area (patches/100 ha). The largest patch index is the area of the largest patch in the class divided by the total area of all patches. The mean patch area is the area of all patches in the class divided by the number of patches. Fragstats was used to compute these metrics [52].

3. Results

3.1. Results of Extracting the Built-Up Area from Satellite Imageries

Three radiometric parameters control the process of quantization: the radiometric quantization minimum level (rad_q_minlev), radiometric quantization maximum level (rad_q_maxlev); the number of radiometric quantization levels (rad_qlev). The radiometric quantization minimum level was 0.01, and the maximum level was 1. After several tests, the optimal number for quantization levels for the years 2005, 2010, 2015, and 2020 imageries were 640, 20, 275, and 130, respectively. This variance between these values may be a result of the atmospheric settings, which vary every day.
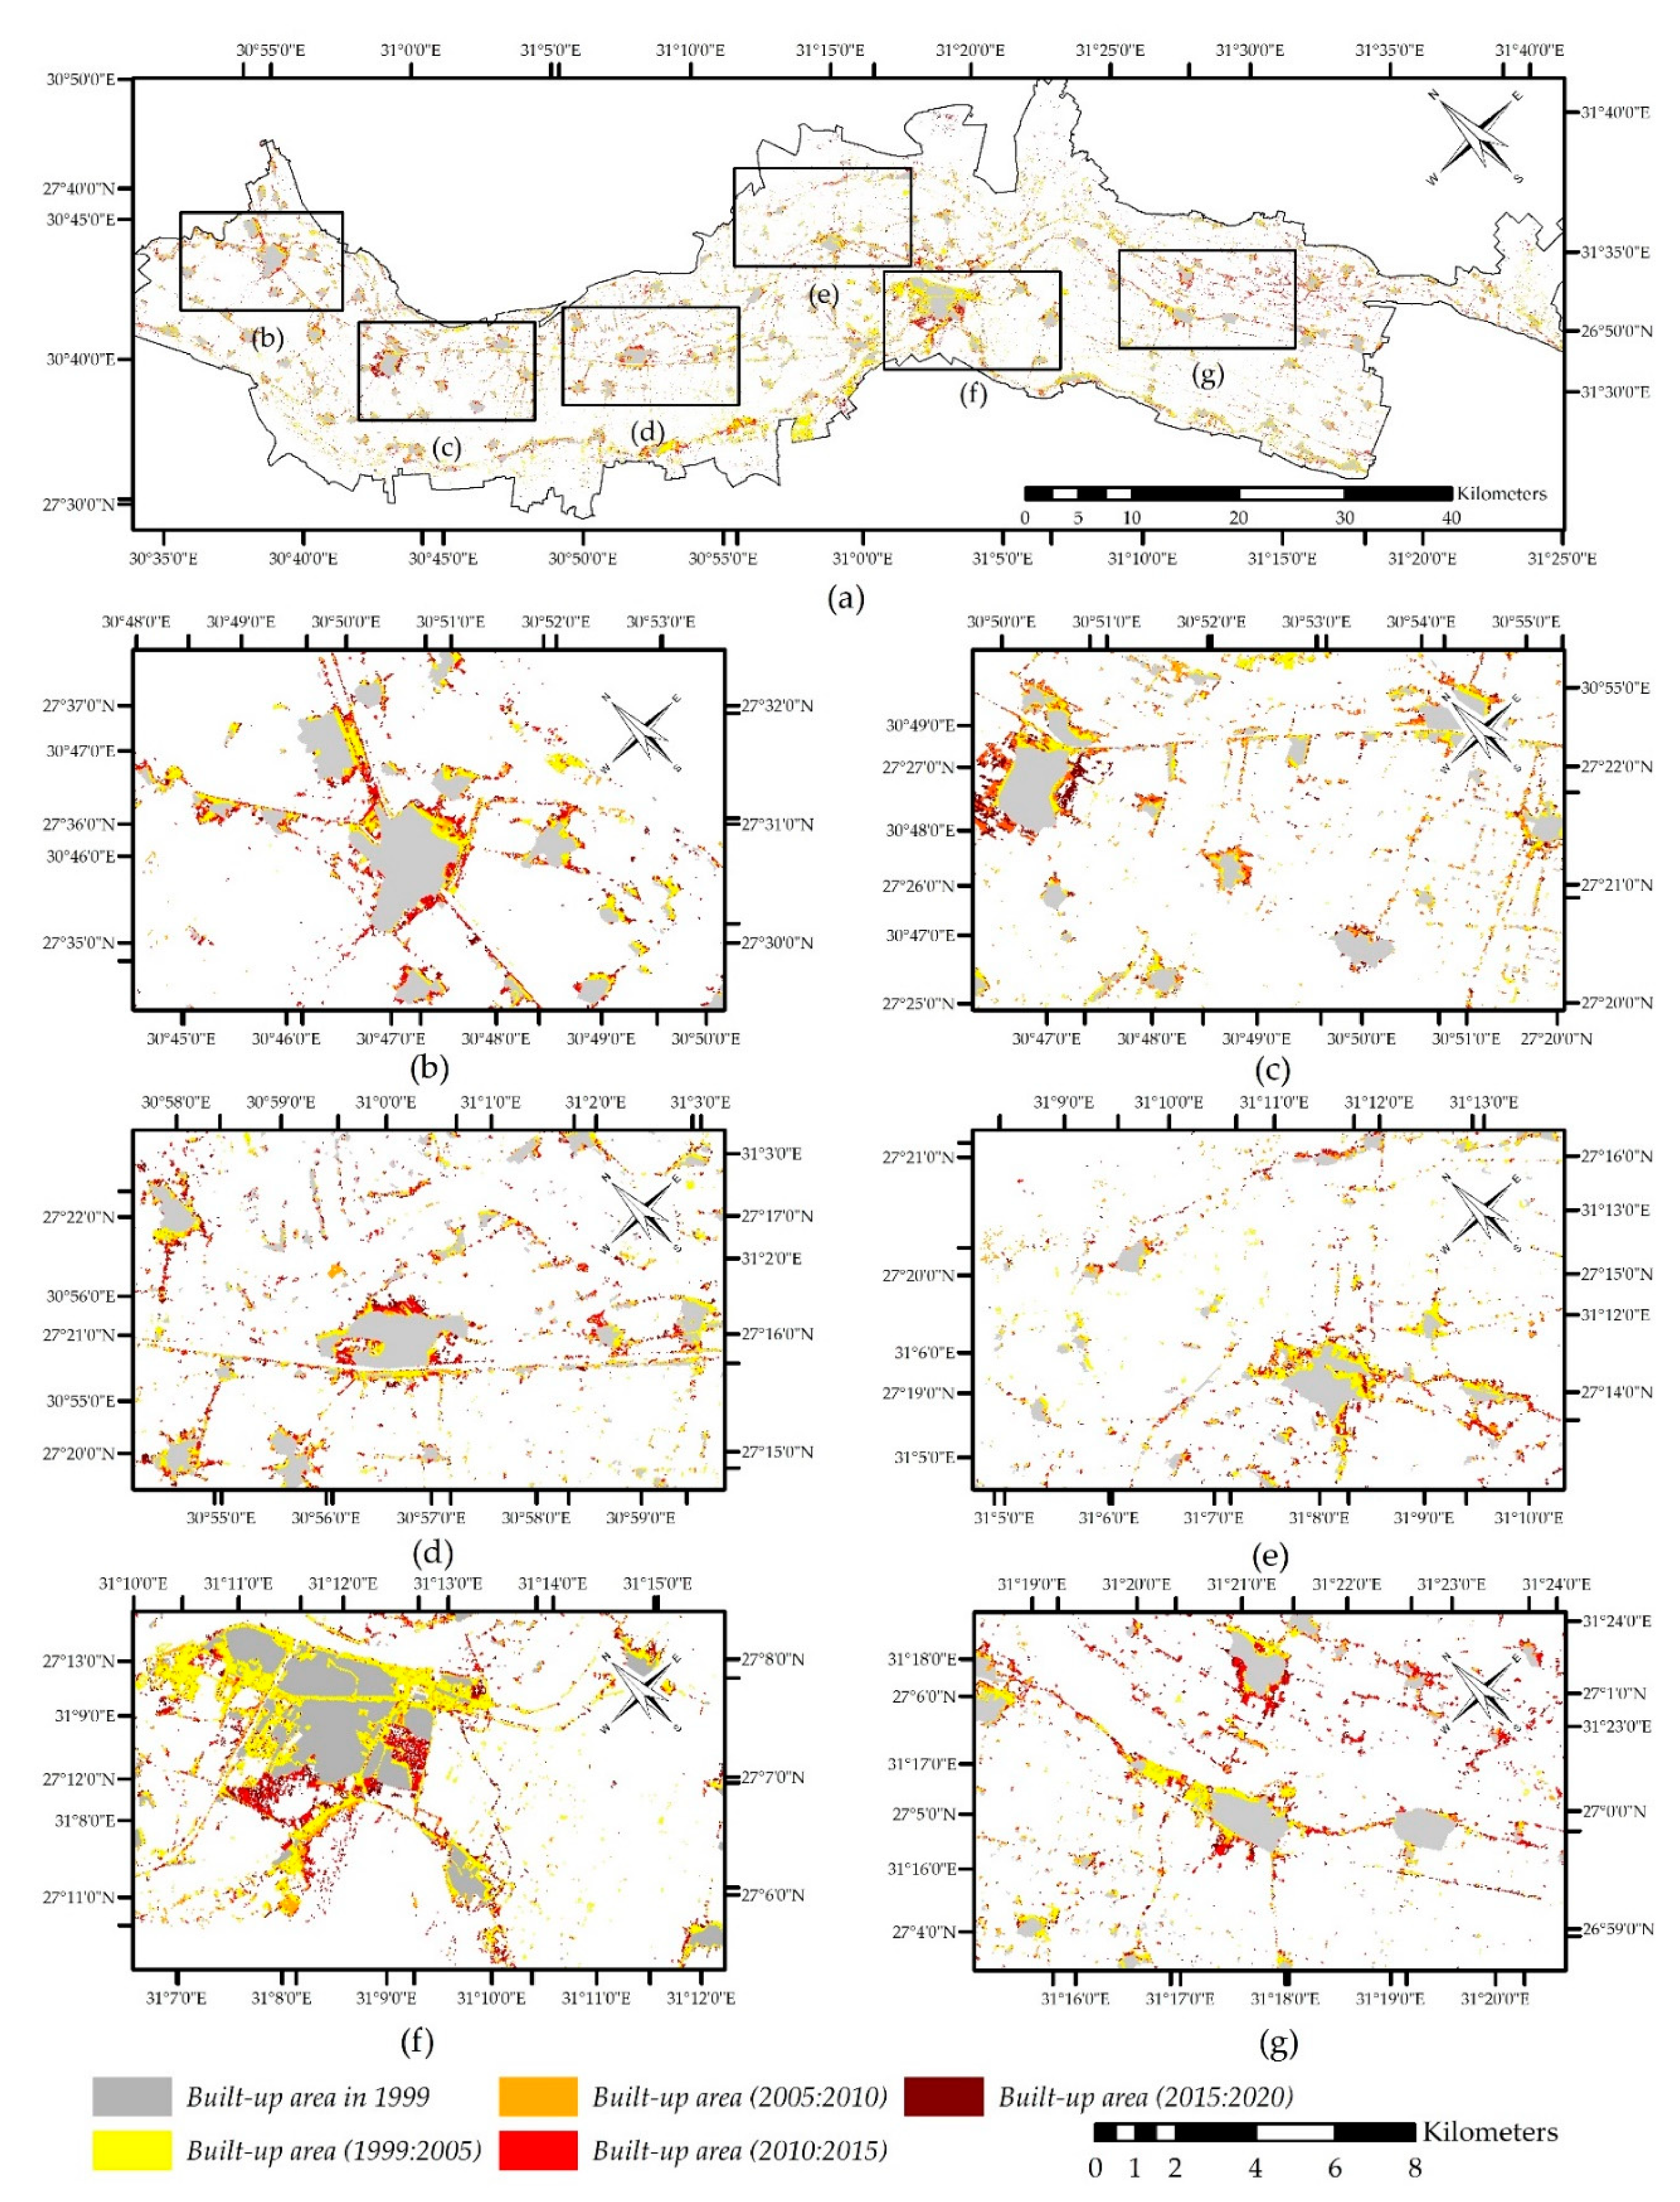
As shown in Table 3, SmlAvgSuppRad was within 100 and 1000. Assiut built-up area was 85.5 km2 in 1999. The newly built area (Figure 7) between 1999 and 2005 was 57.5 km2 (11% annual growth). In the second period, when the second land-use development plan started, the newly built area was 37.9 km2 (5.3% annual growth). The third period (2005:2010) had an increase in the newly built area to be 52.6 km2 (7.3% annual growth). Finally, the newly built area in the fourth period (2015:2020) was 36.5 km2 (5.1% annual growth).

3.2. Validation Results for the Training Sets and Classification Results

The validation results with the 500 randomly chosen points showed that the accuracy and the False Negative Rate (False Negative Rate = 1-Specificity) for the classification results and the training sets had similar patterns (Table 4 and Table 5). In contrast, the Sensitivity rate had variant values.
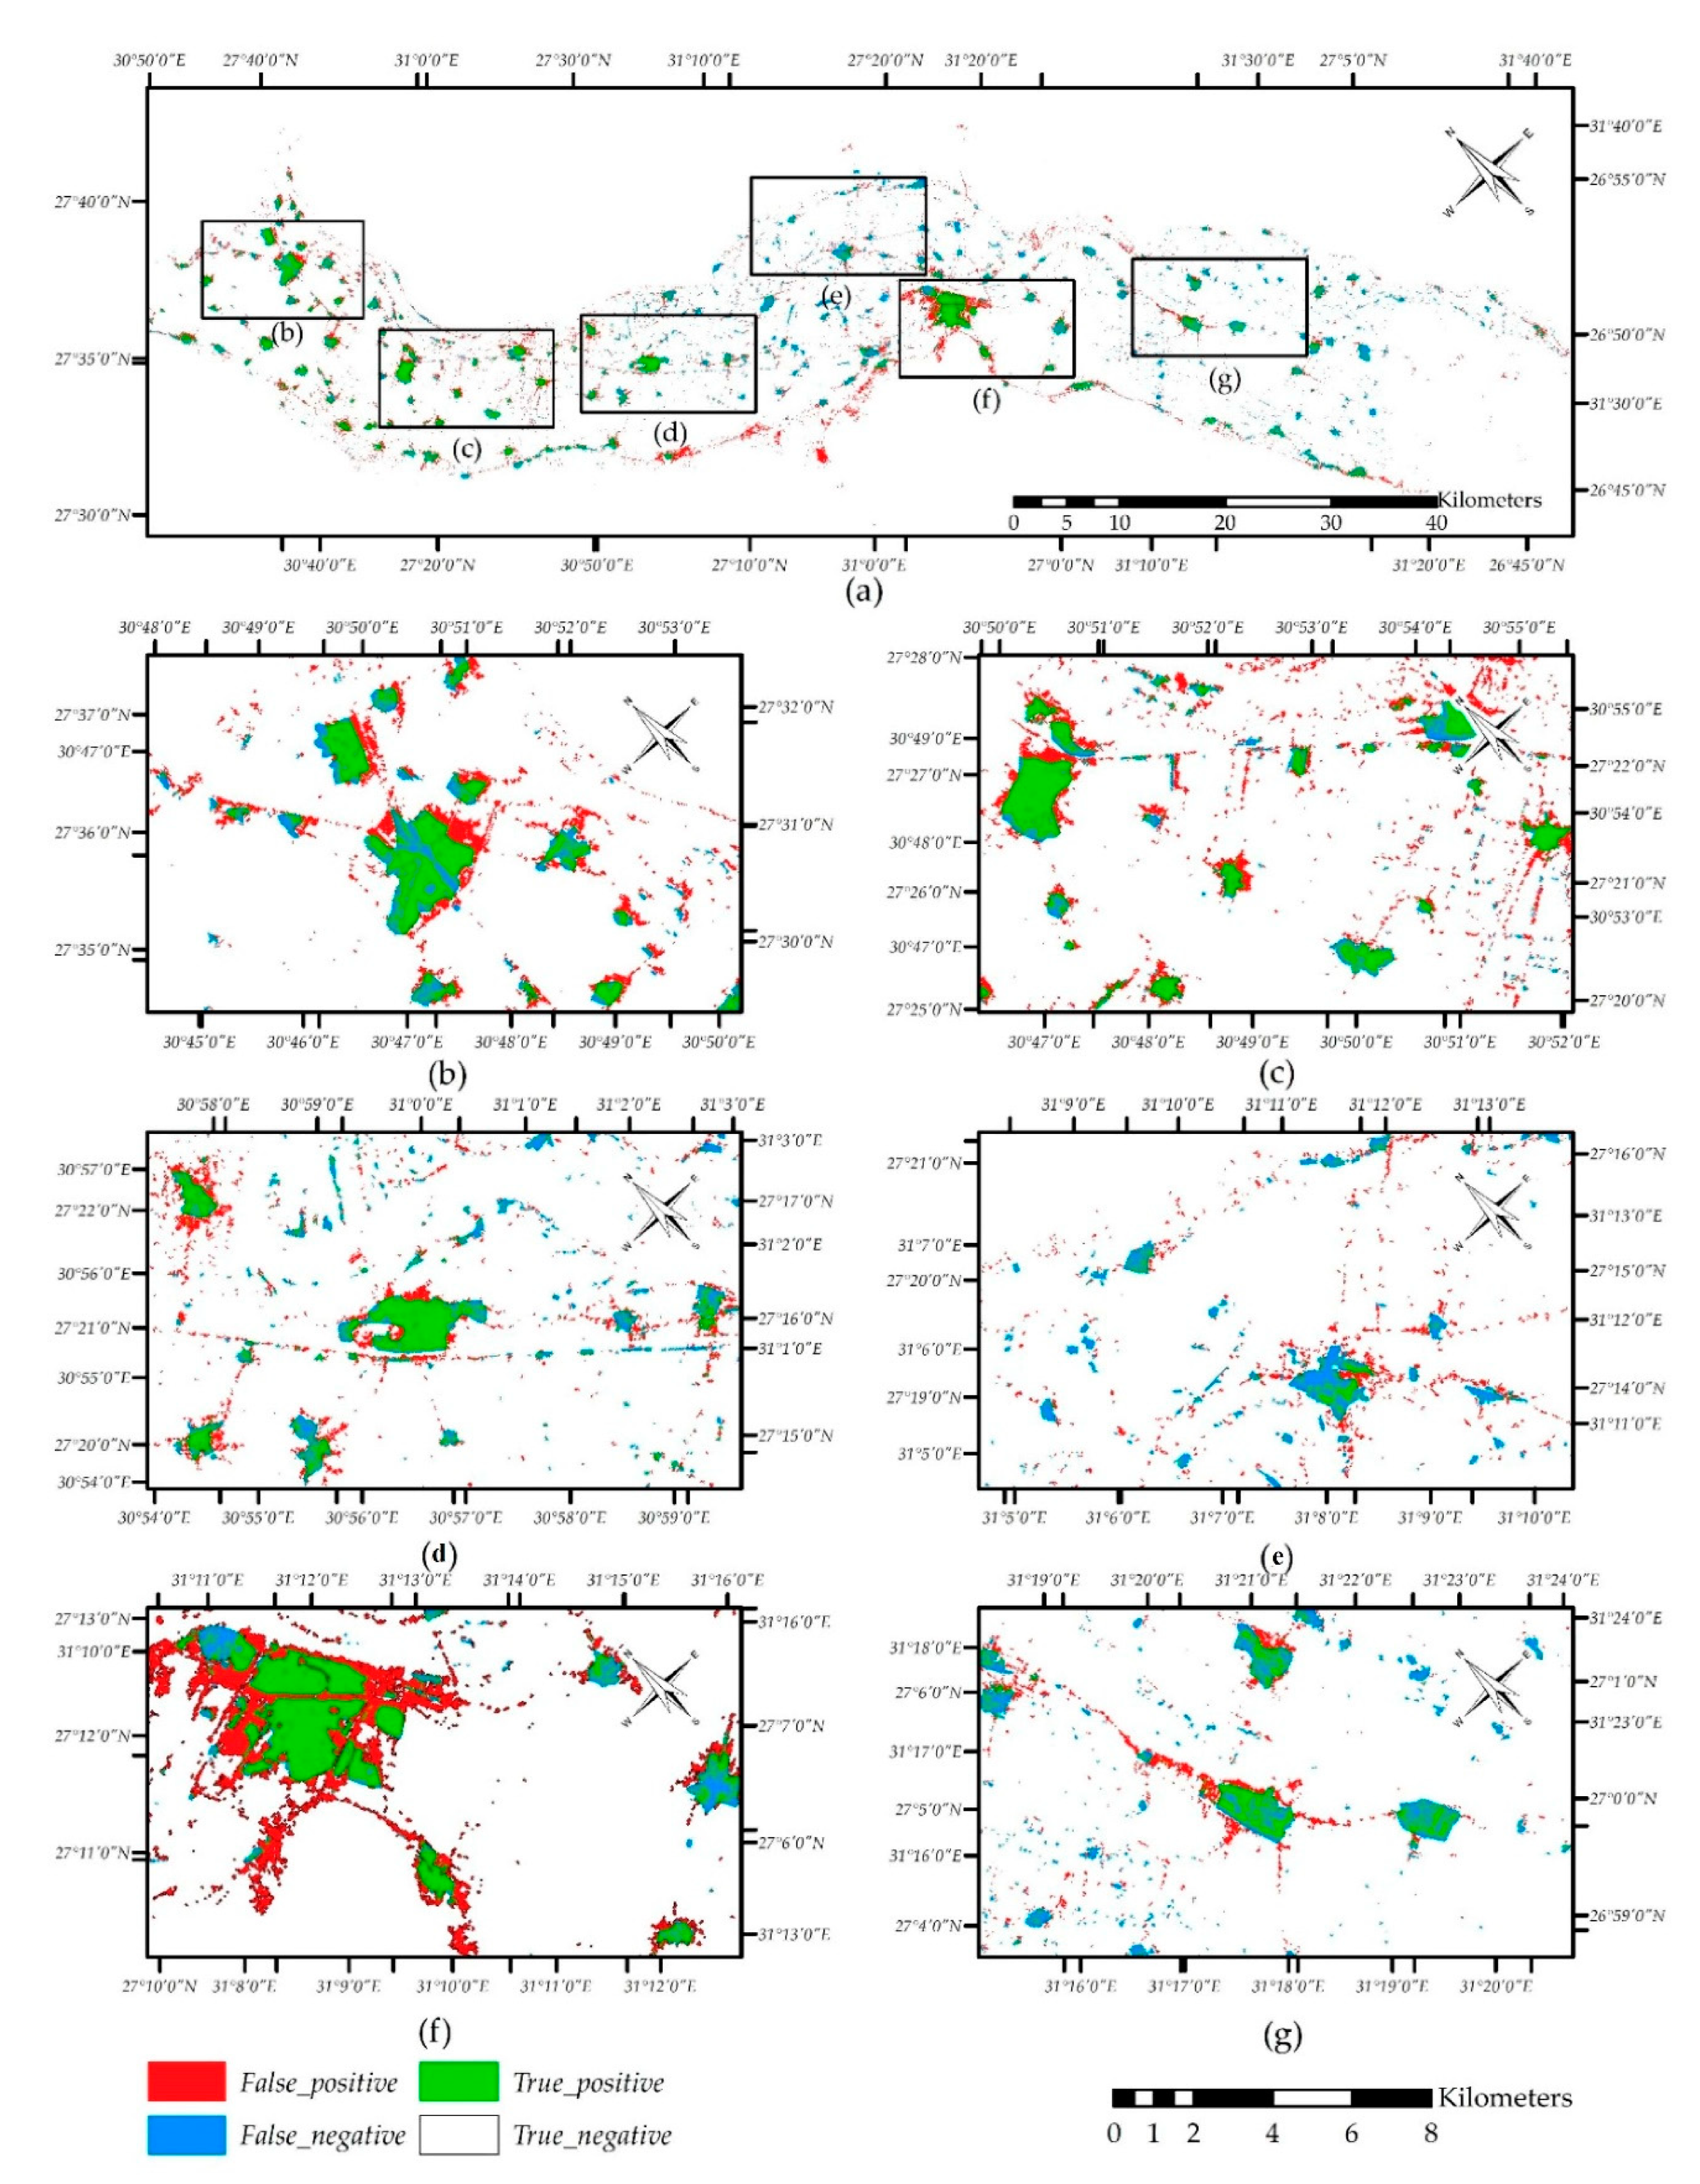
The accuracy for the classification results of 2005, 2010, 2015, and 2020 were 96.2, 97.2, 98.2, and 97.8%, respectively, whereas the accuracy for the GHSL_2000 (Figure 8), GHSL_ 2014, and ALC layers (training sets) was 93.8, 95.2, and 94.4%, respectively. Similarly, the false negative rate for all seven datasets (Table 4 and Table 5) was ranging between 0.009 and 0.038, where BU_2005 had the lowest Rate and ALC had the highest rate.
The sensitivity rate varies between 0.471 and 0.861. Among the classified layers, the estimated built-up area for 2020 (BU_2020) had the highest sensitivity rate (0.861), whereas the classified built-up area for 2005 and 2010 (i.e., BU_2005, and BU_2010) had the least rate (0.800). The training sets, however, had a drop in the sensitivity rate. The ALC had the highest sensitivity rate (0.590), followed by the GHSL_2000 (0.496). The lowest sensitivity rate between the training sets was the GHSL_2014 (0.471).

3.3. Results of Human Settlement Growth Types

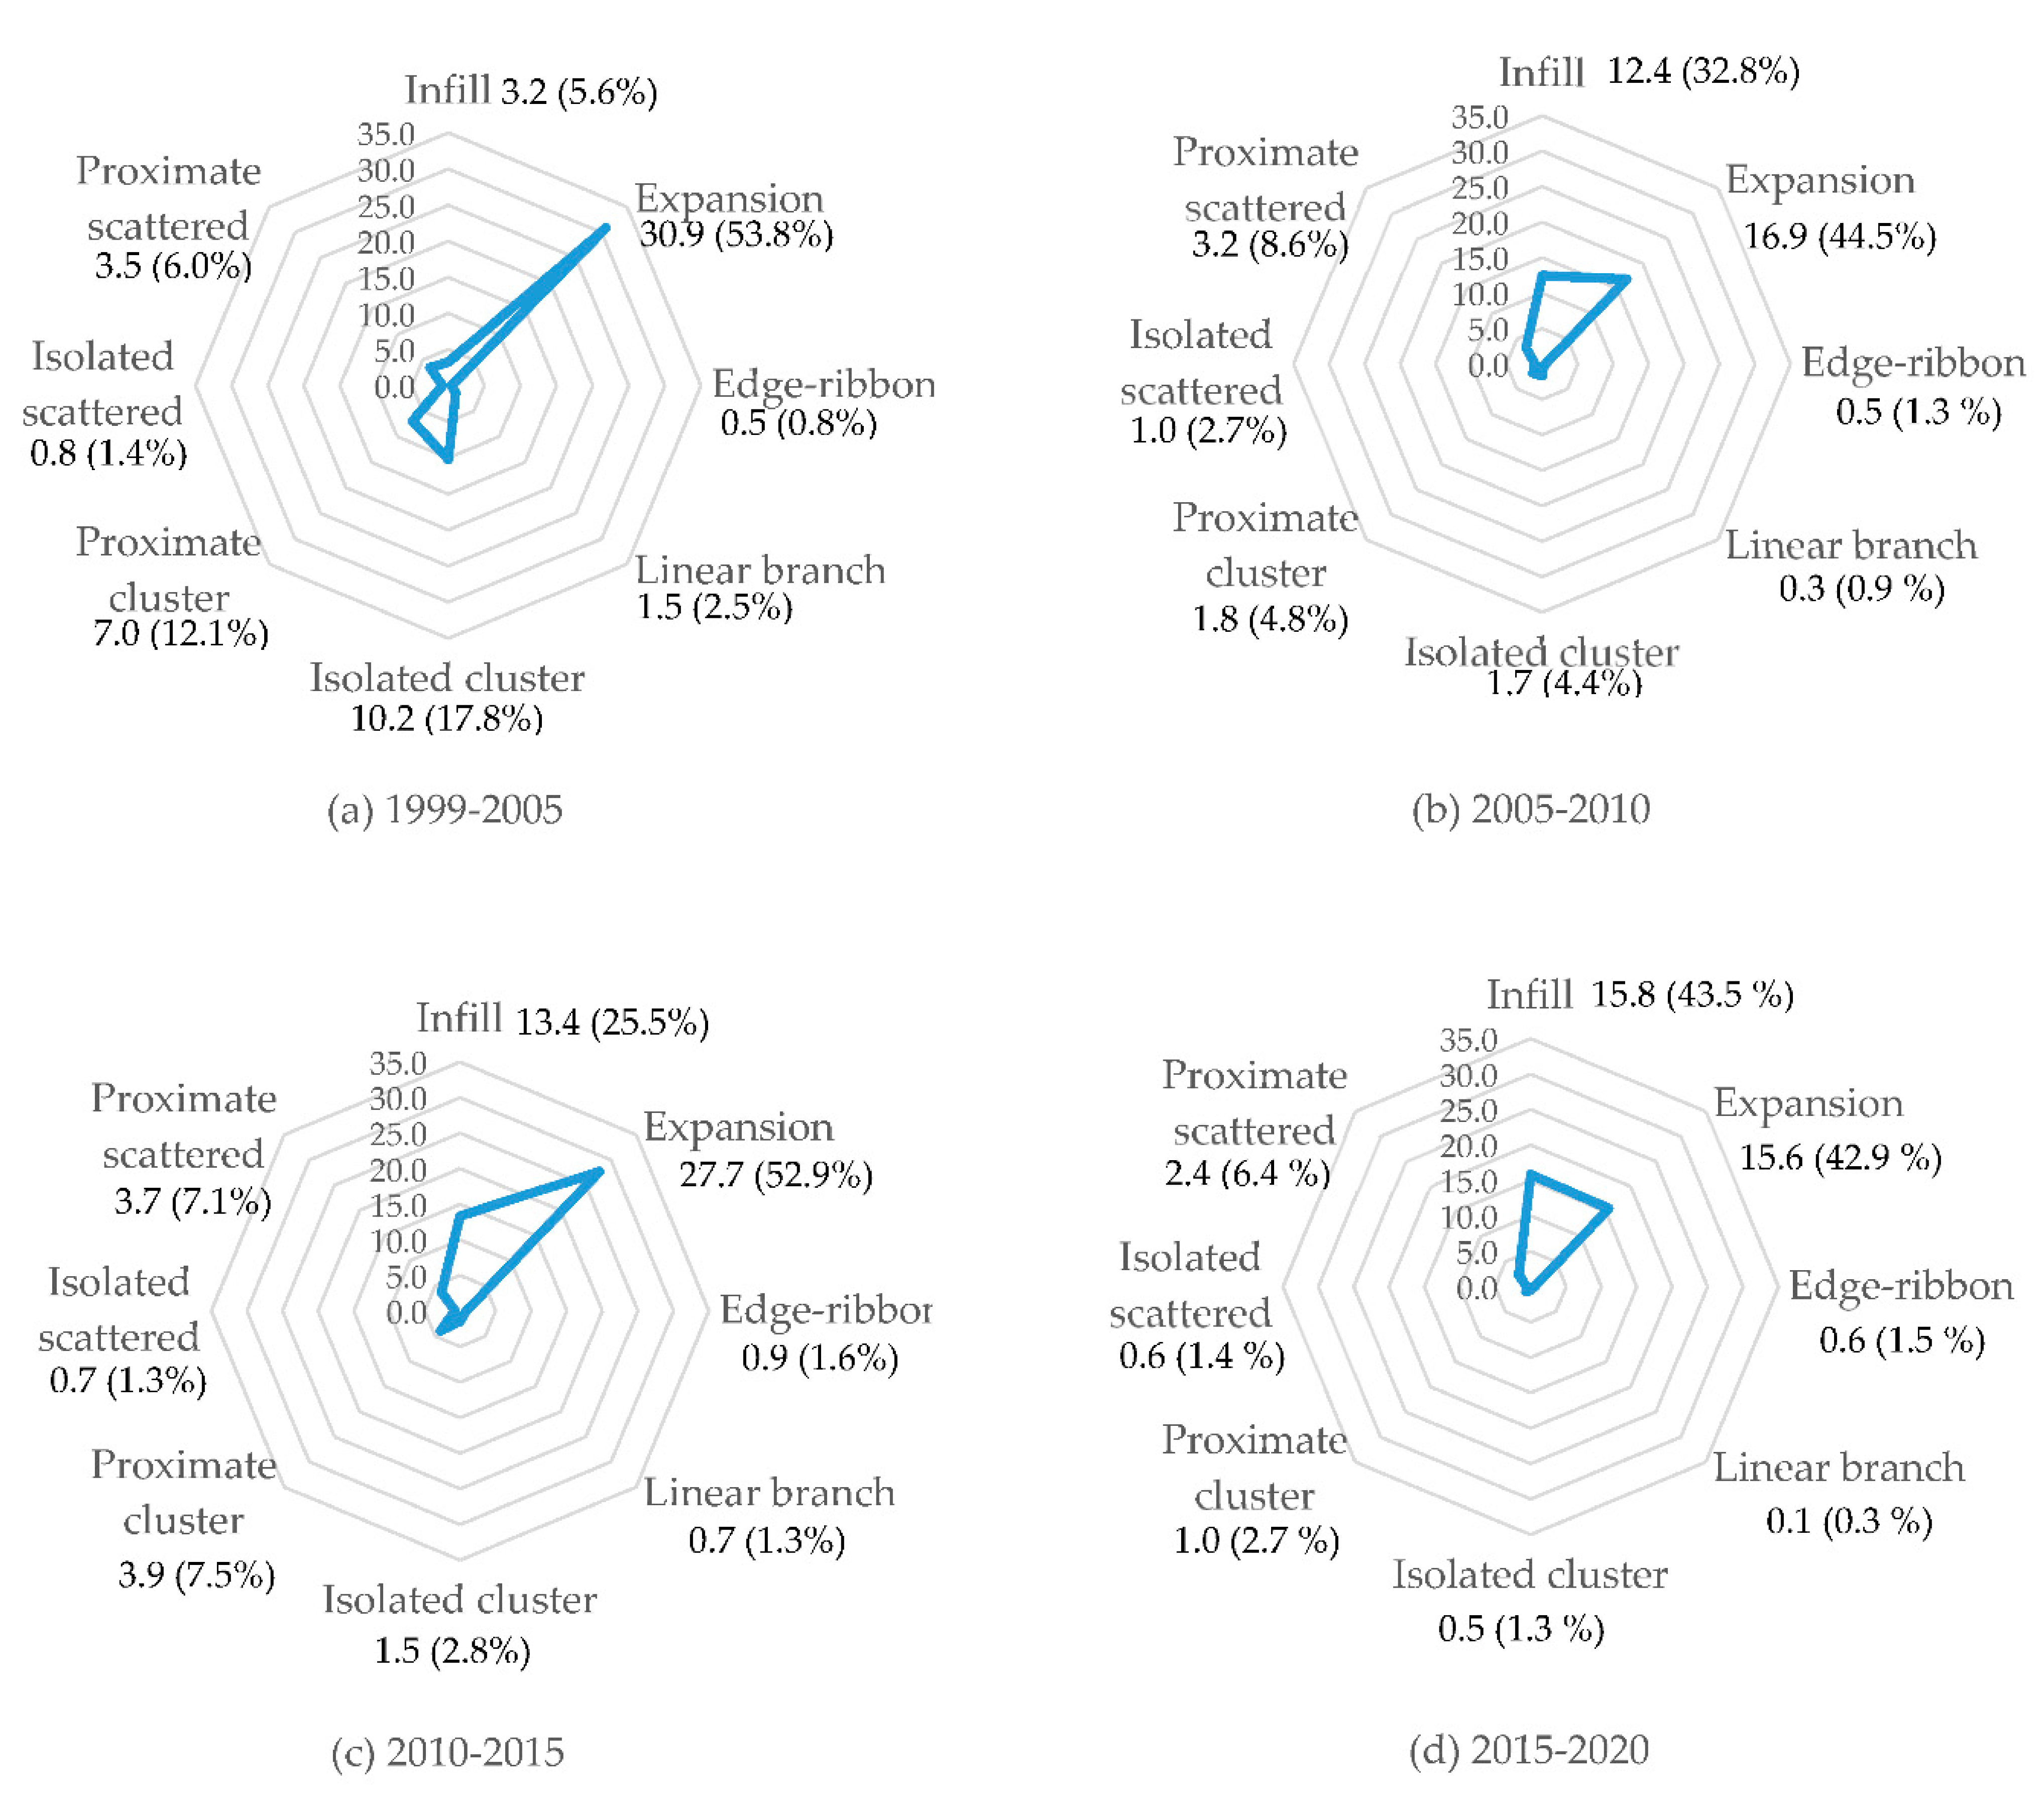
Calculating the total area for HSG types presented comprehensive information about growth types within all periods. As Figure 9 shows, edge-expansion was the dominant growth type throughout all periods, except for the fourth period when the infill was more than expansion. In contrast, the linear branch was the least type except during the first period when edge-ribbon was the least.
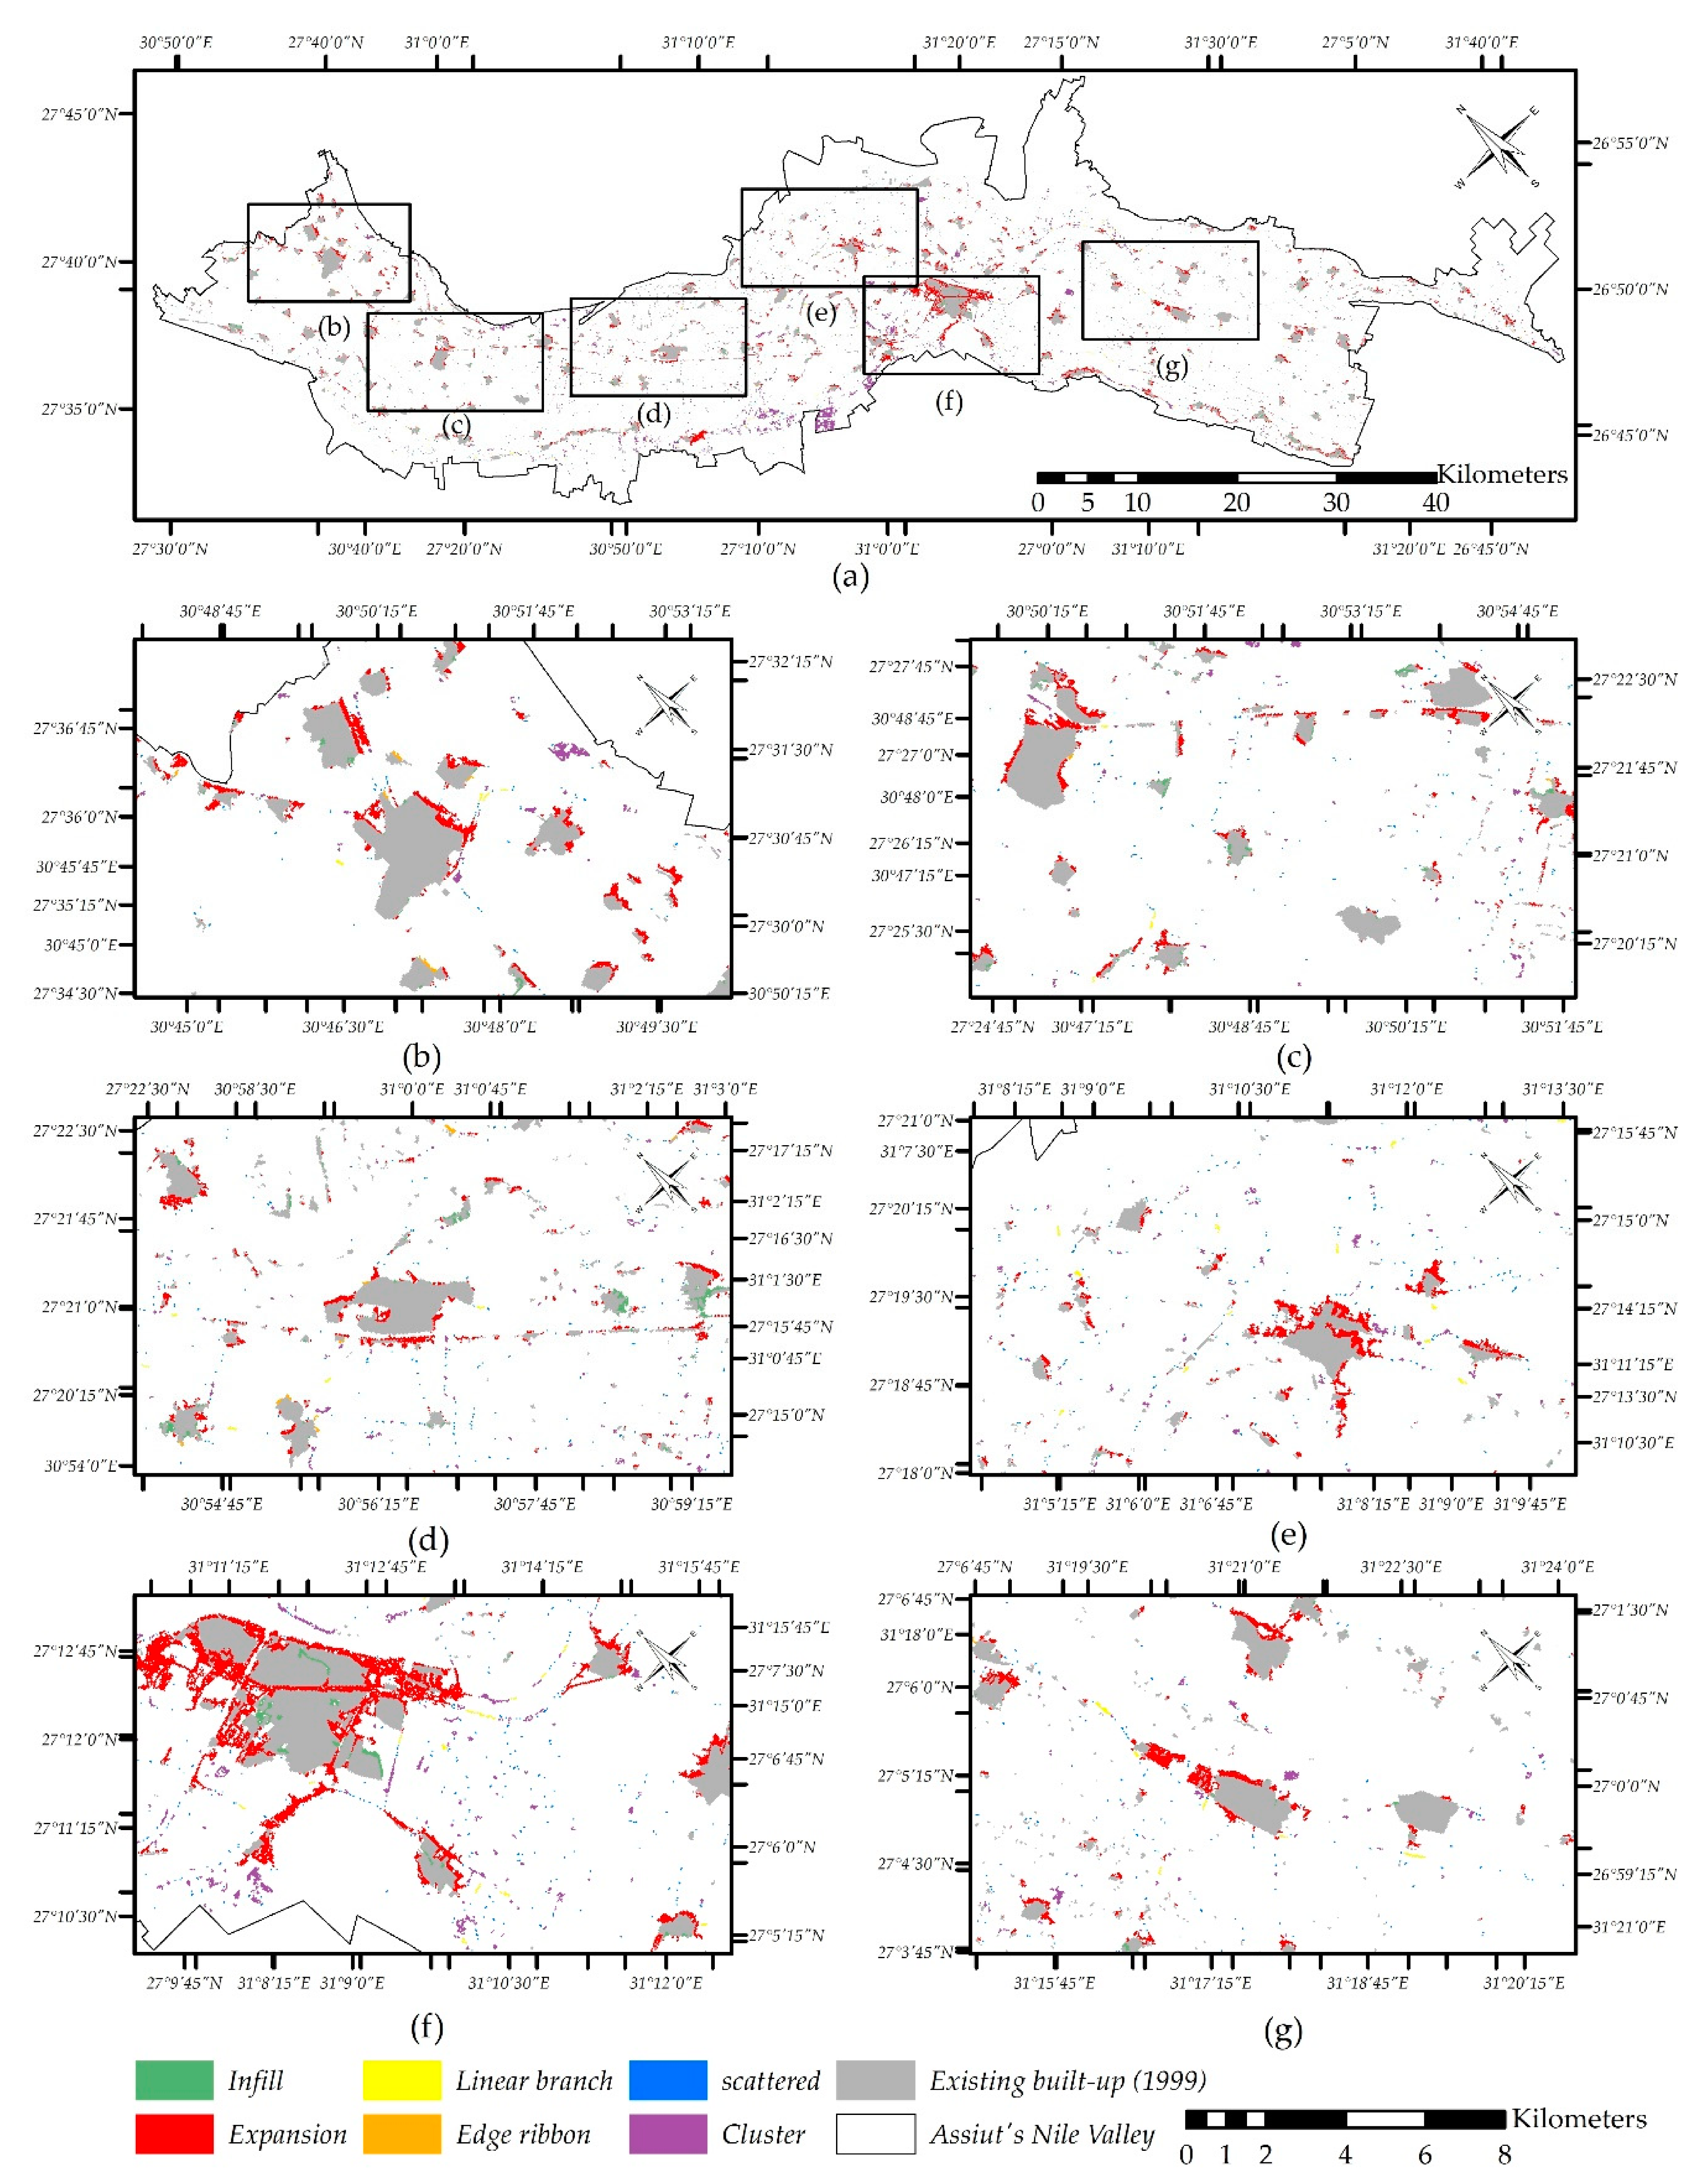
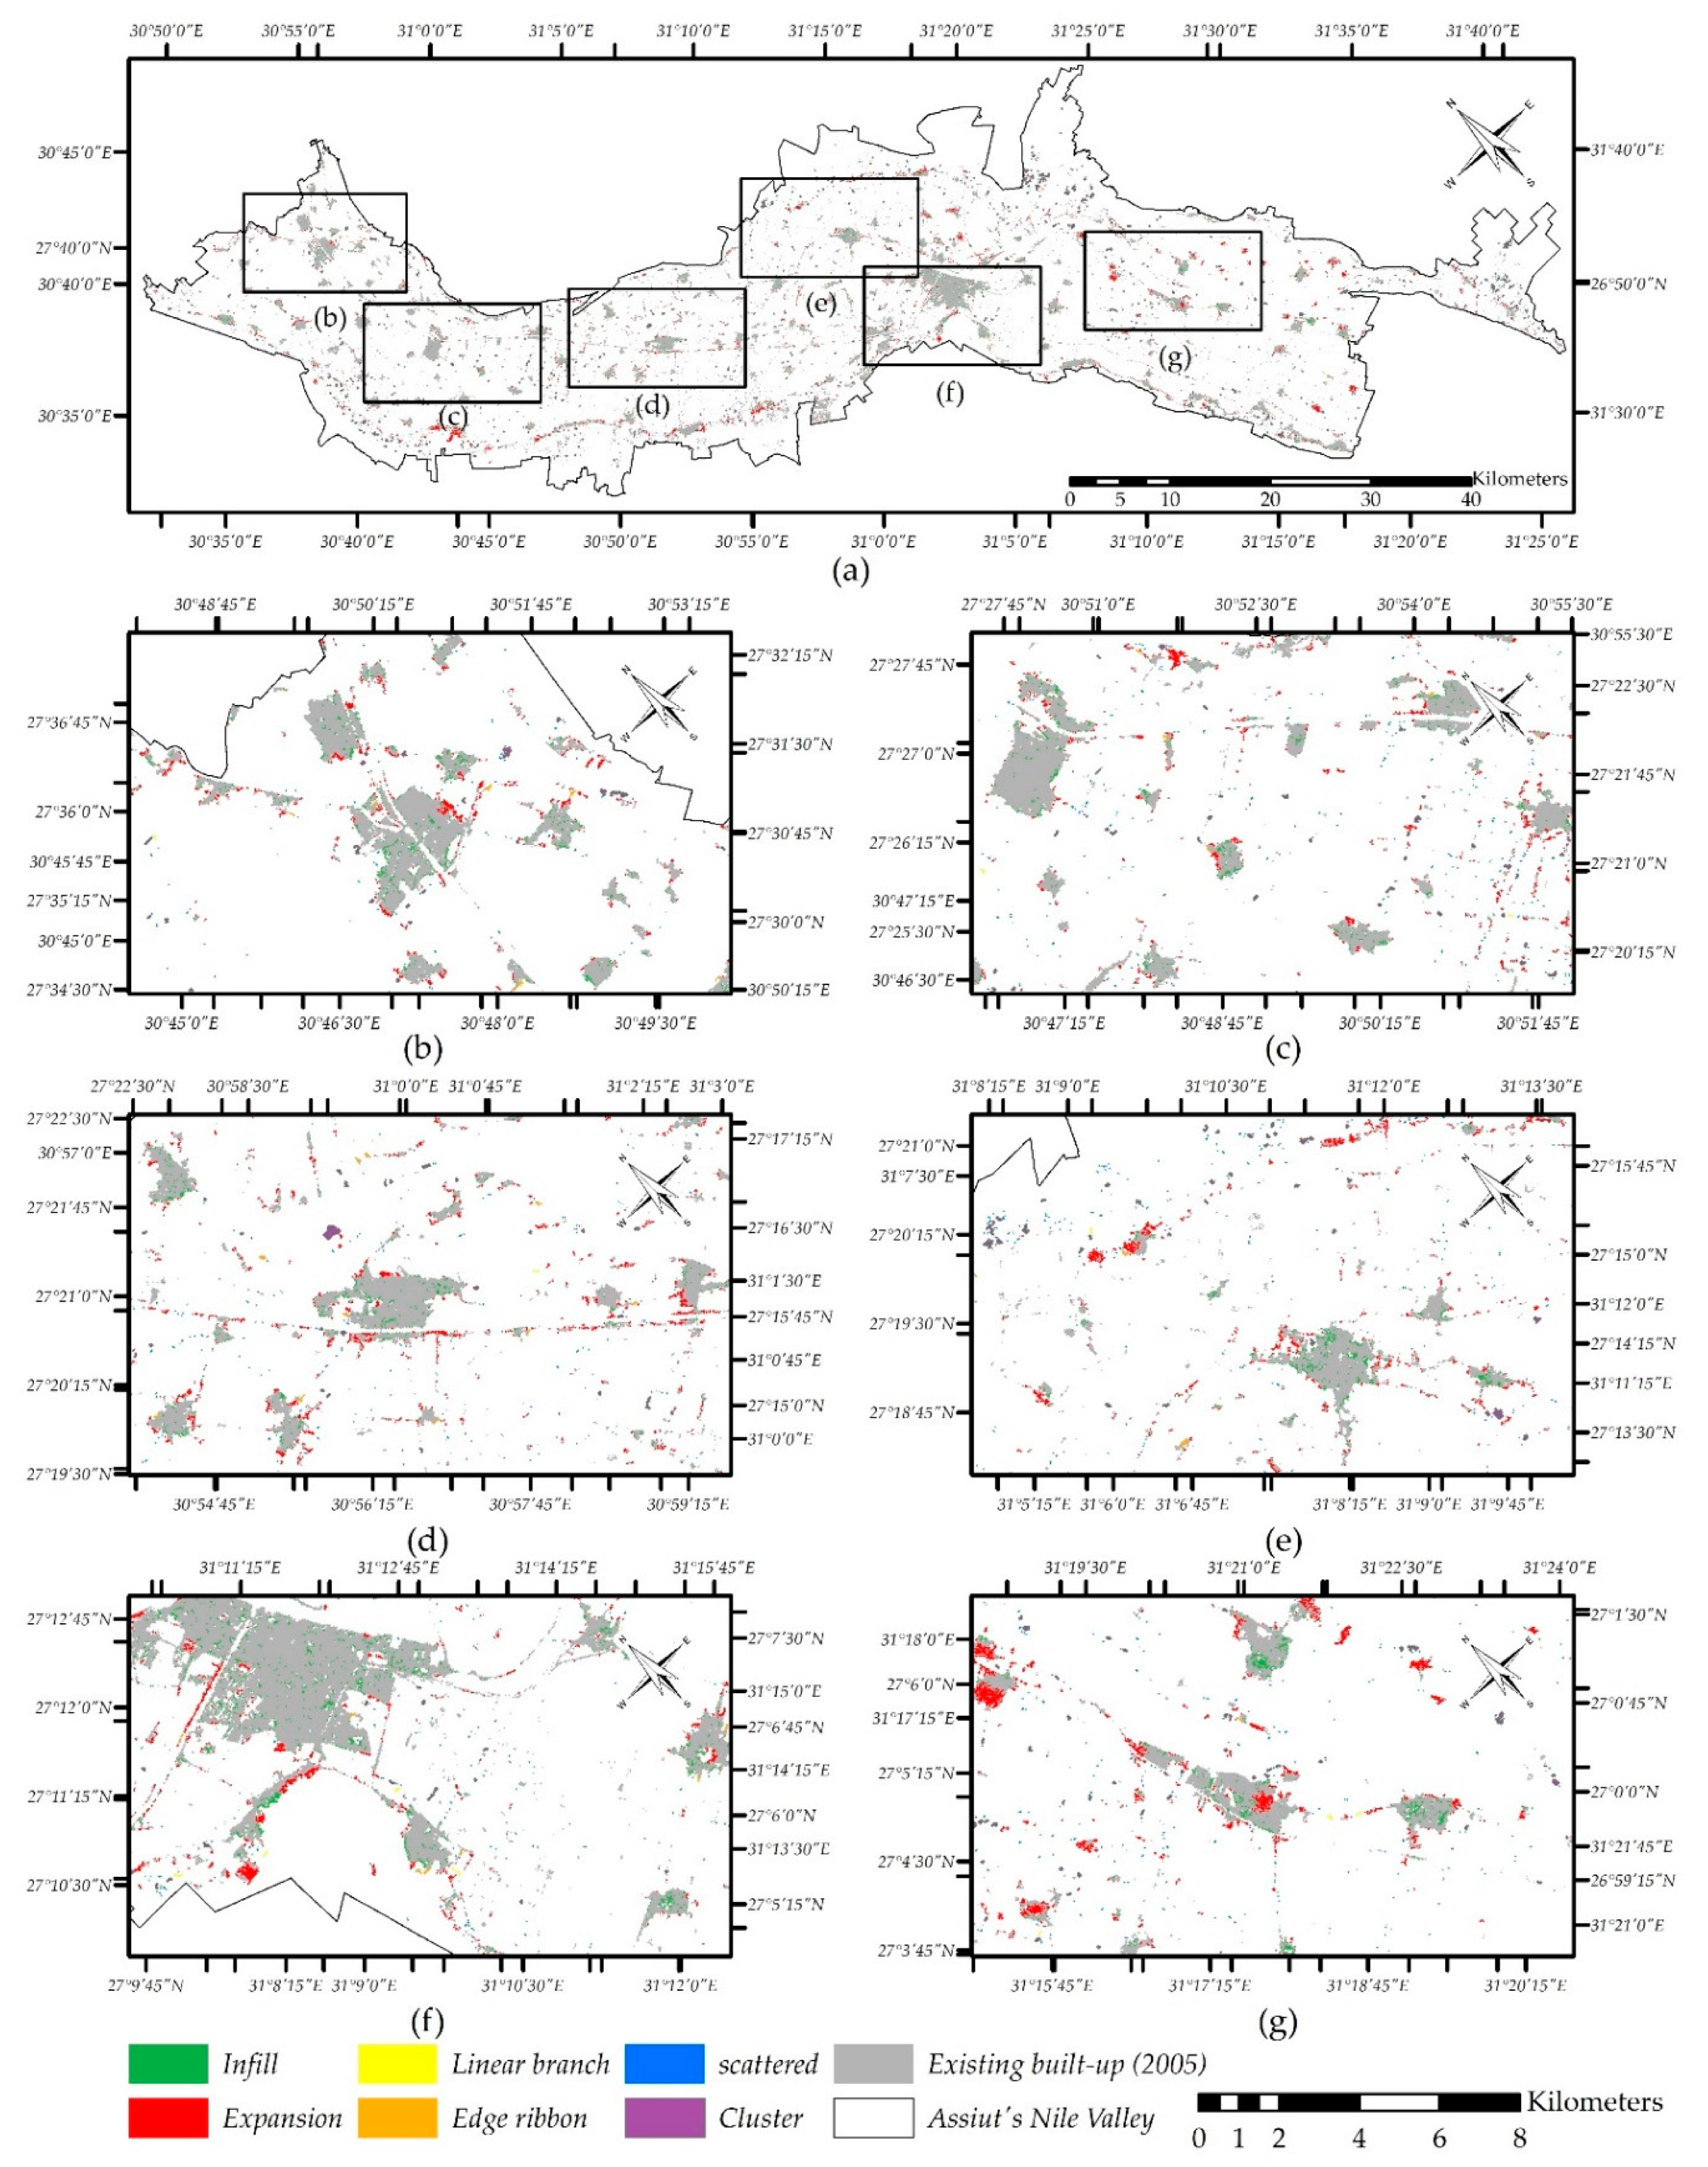
Throughout the first period (Figure 10), expansion was the primary growth type (31 km2), while the cluster was the second (17.8 km2). The isolated cluster area (10.2 km2) was more than the proximate cluster (7.6 km2). Scattered growth had the third-highest proportion of the newly built-up area (4.3 km2). Unlike cluster growth types, the area of isolated scattered patches (3.7 km2) was more than proximate scattered (0.7 km2). The total area for the infill, linear branch, and edge-ribbon was only less than 9% of the newly built area.
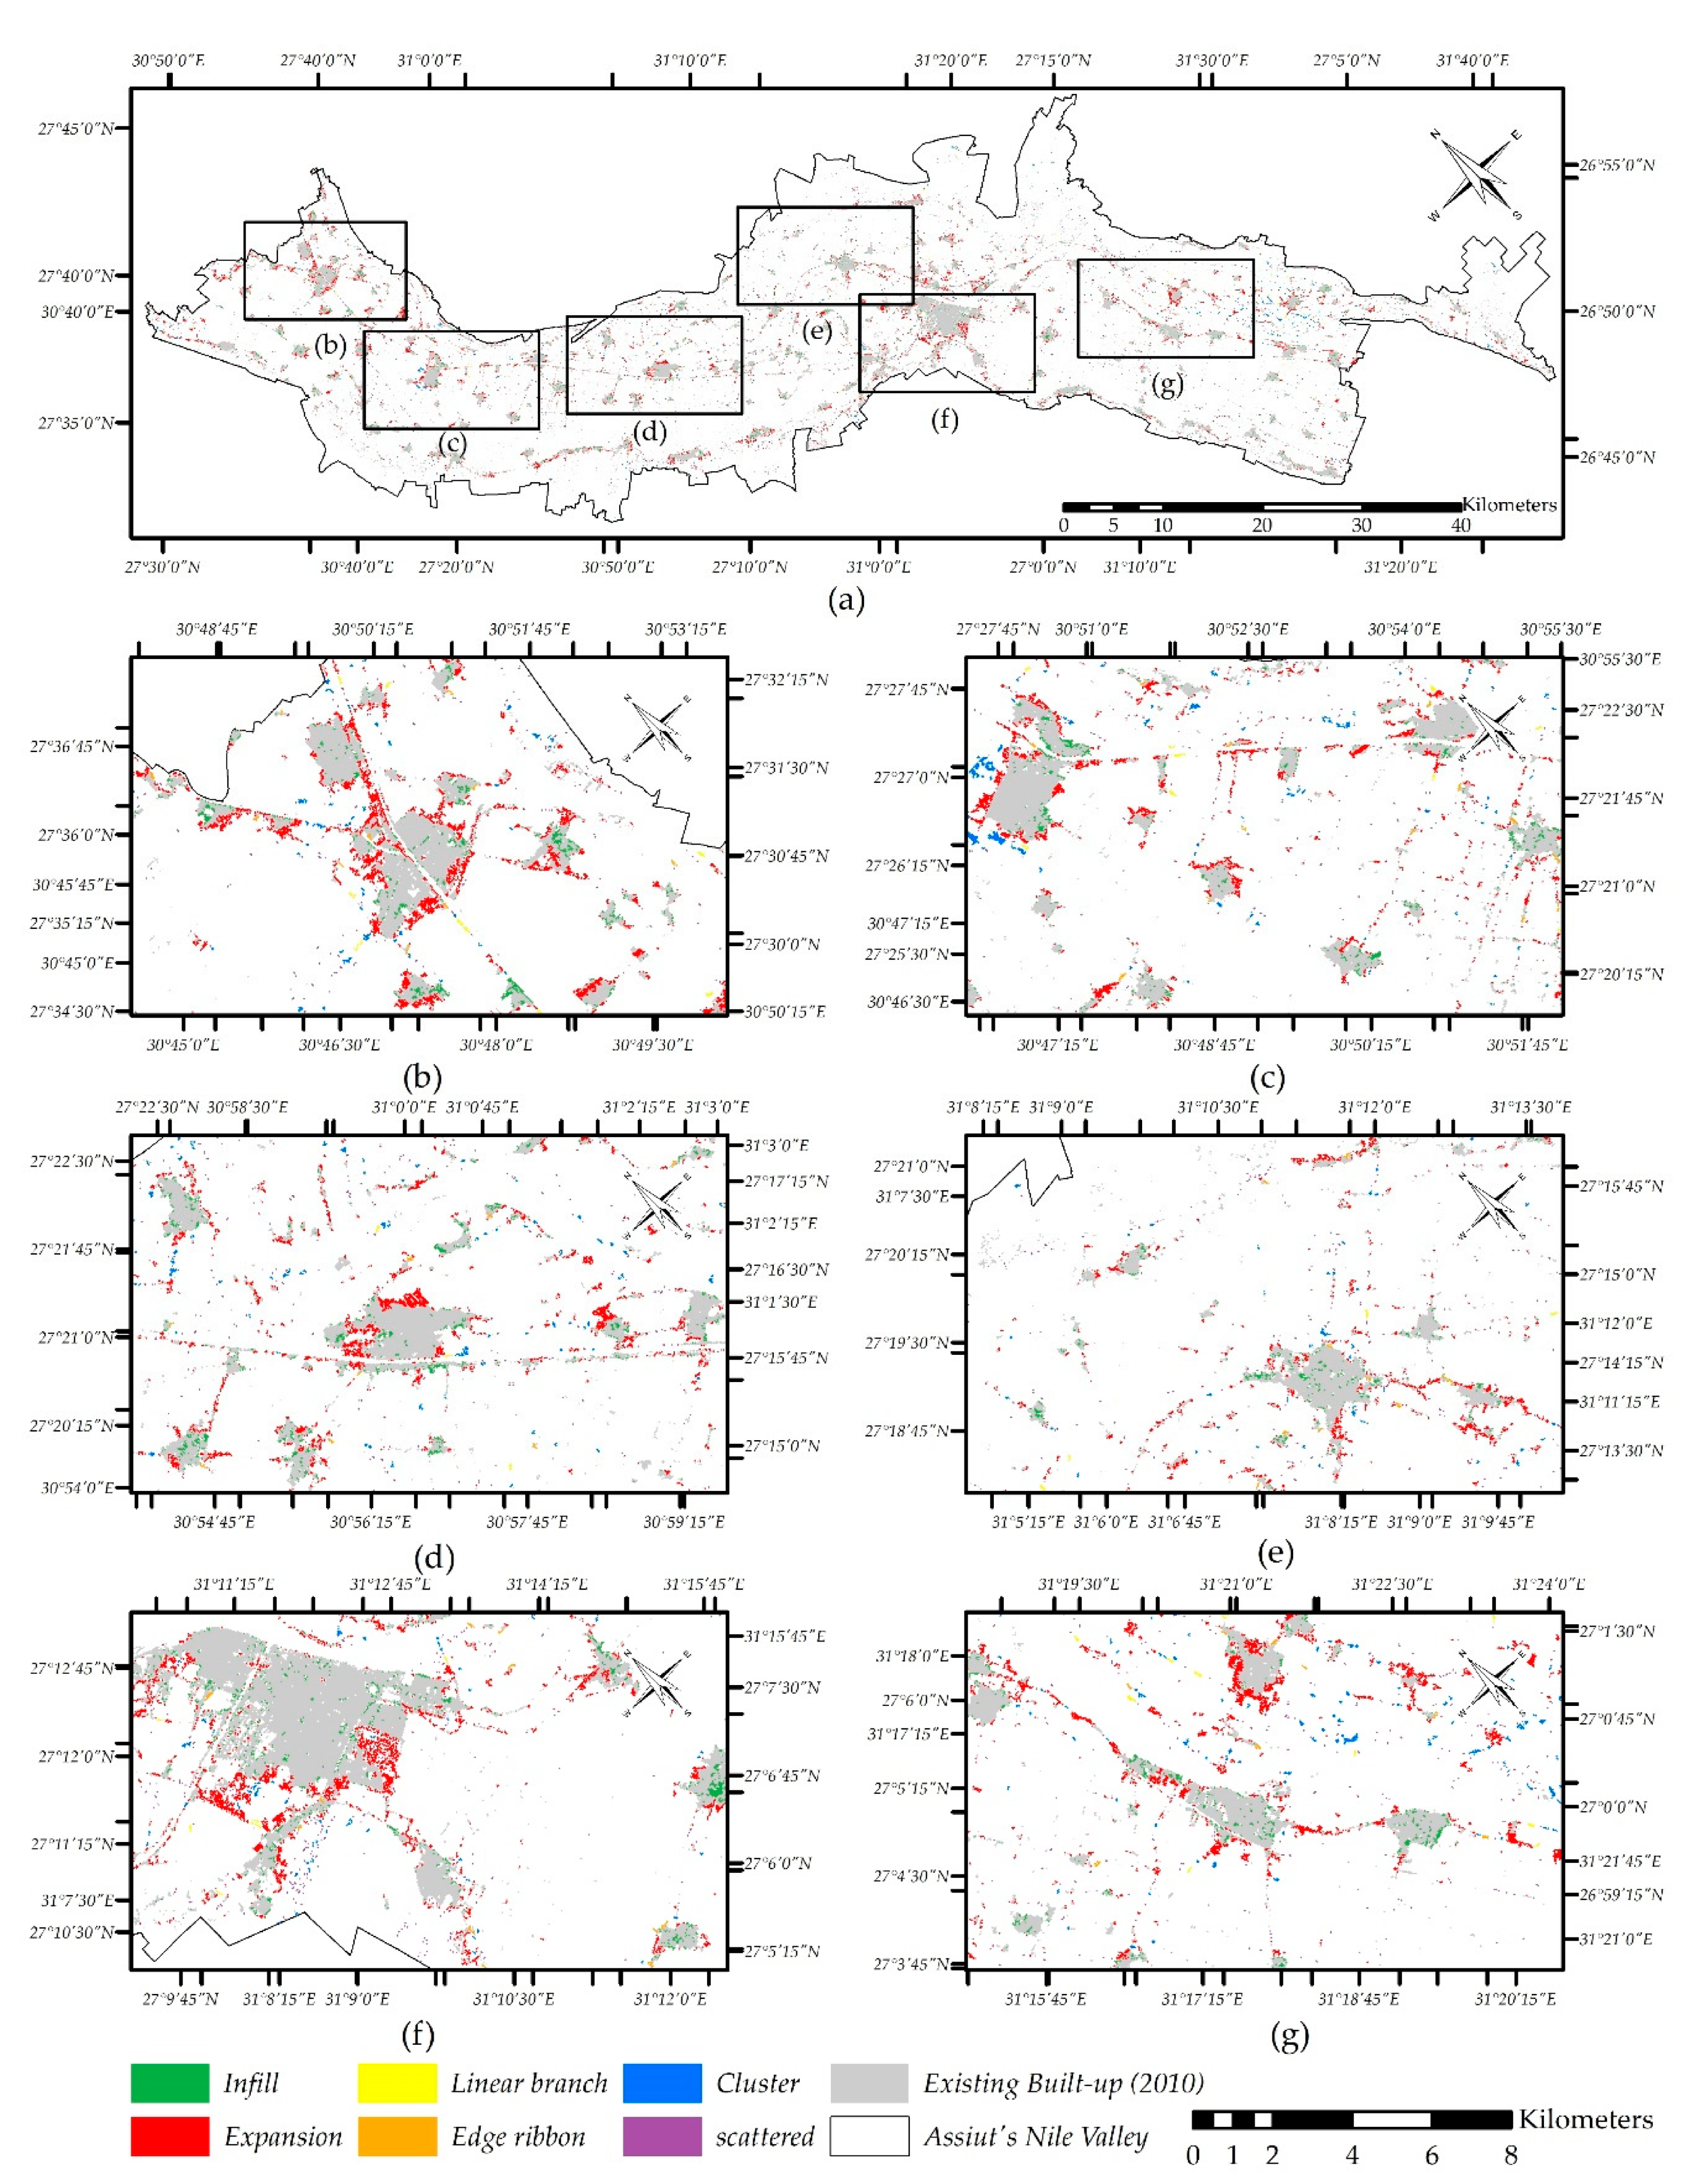
In the second period (Figure 11), expansion continued with the highest proportion of area (44.5%), whereas the area decreased to be 16.9 km2. Infill growth increased to be the second with 12.4 km2 (32.8%) after it was 3.2 km2 (5.6%) in the first period. Unlike infill, the cluster decreased to 3.5 km2. The area of the isolated cluster was 1.7 km2, while the proximate cluster area was 1.8 km2. Meanwhile, the scattered growth had (approximately) the same area in the first and second periods (4.2 km2), while the proportion from the total built area increased from 7.4% in the first period to 11.3% in the second. Proximate scattered (3.2 km2) was also more the isolated scattered (1.0 km2), as in the previous period. Both linear branch and edge-ribbon were less than one km2.
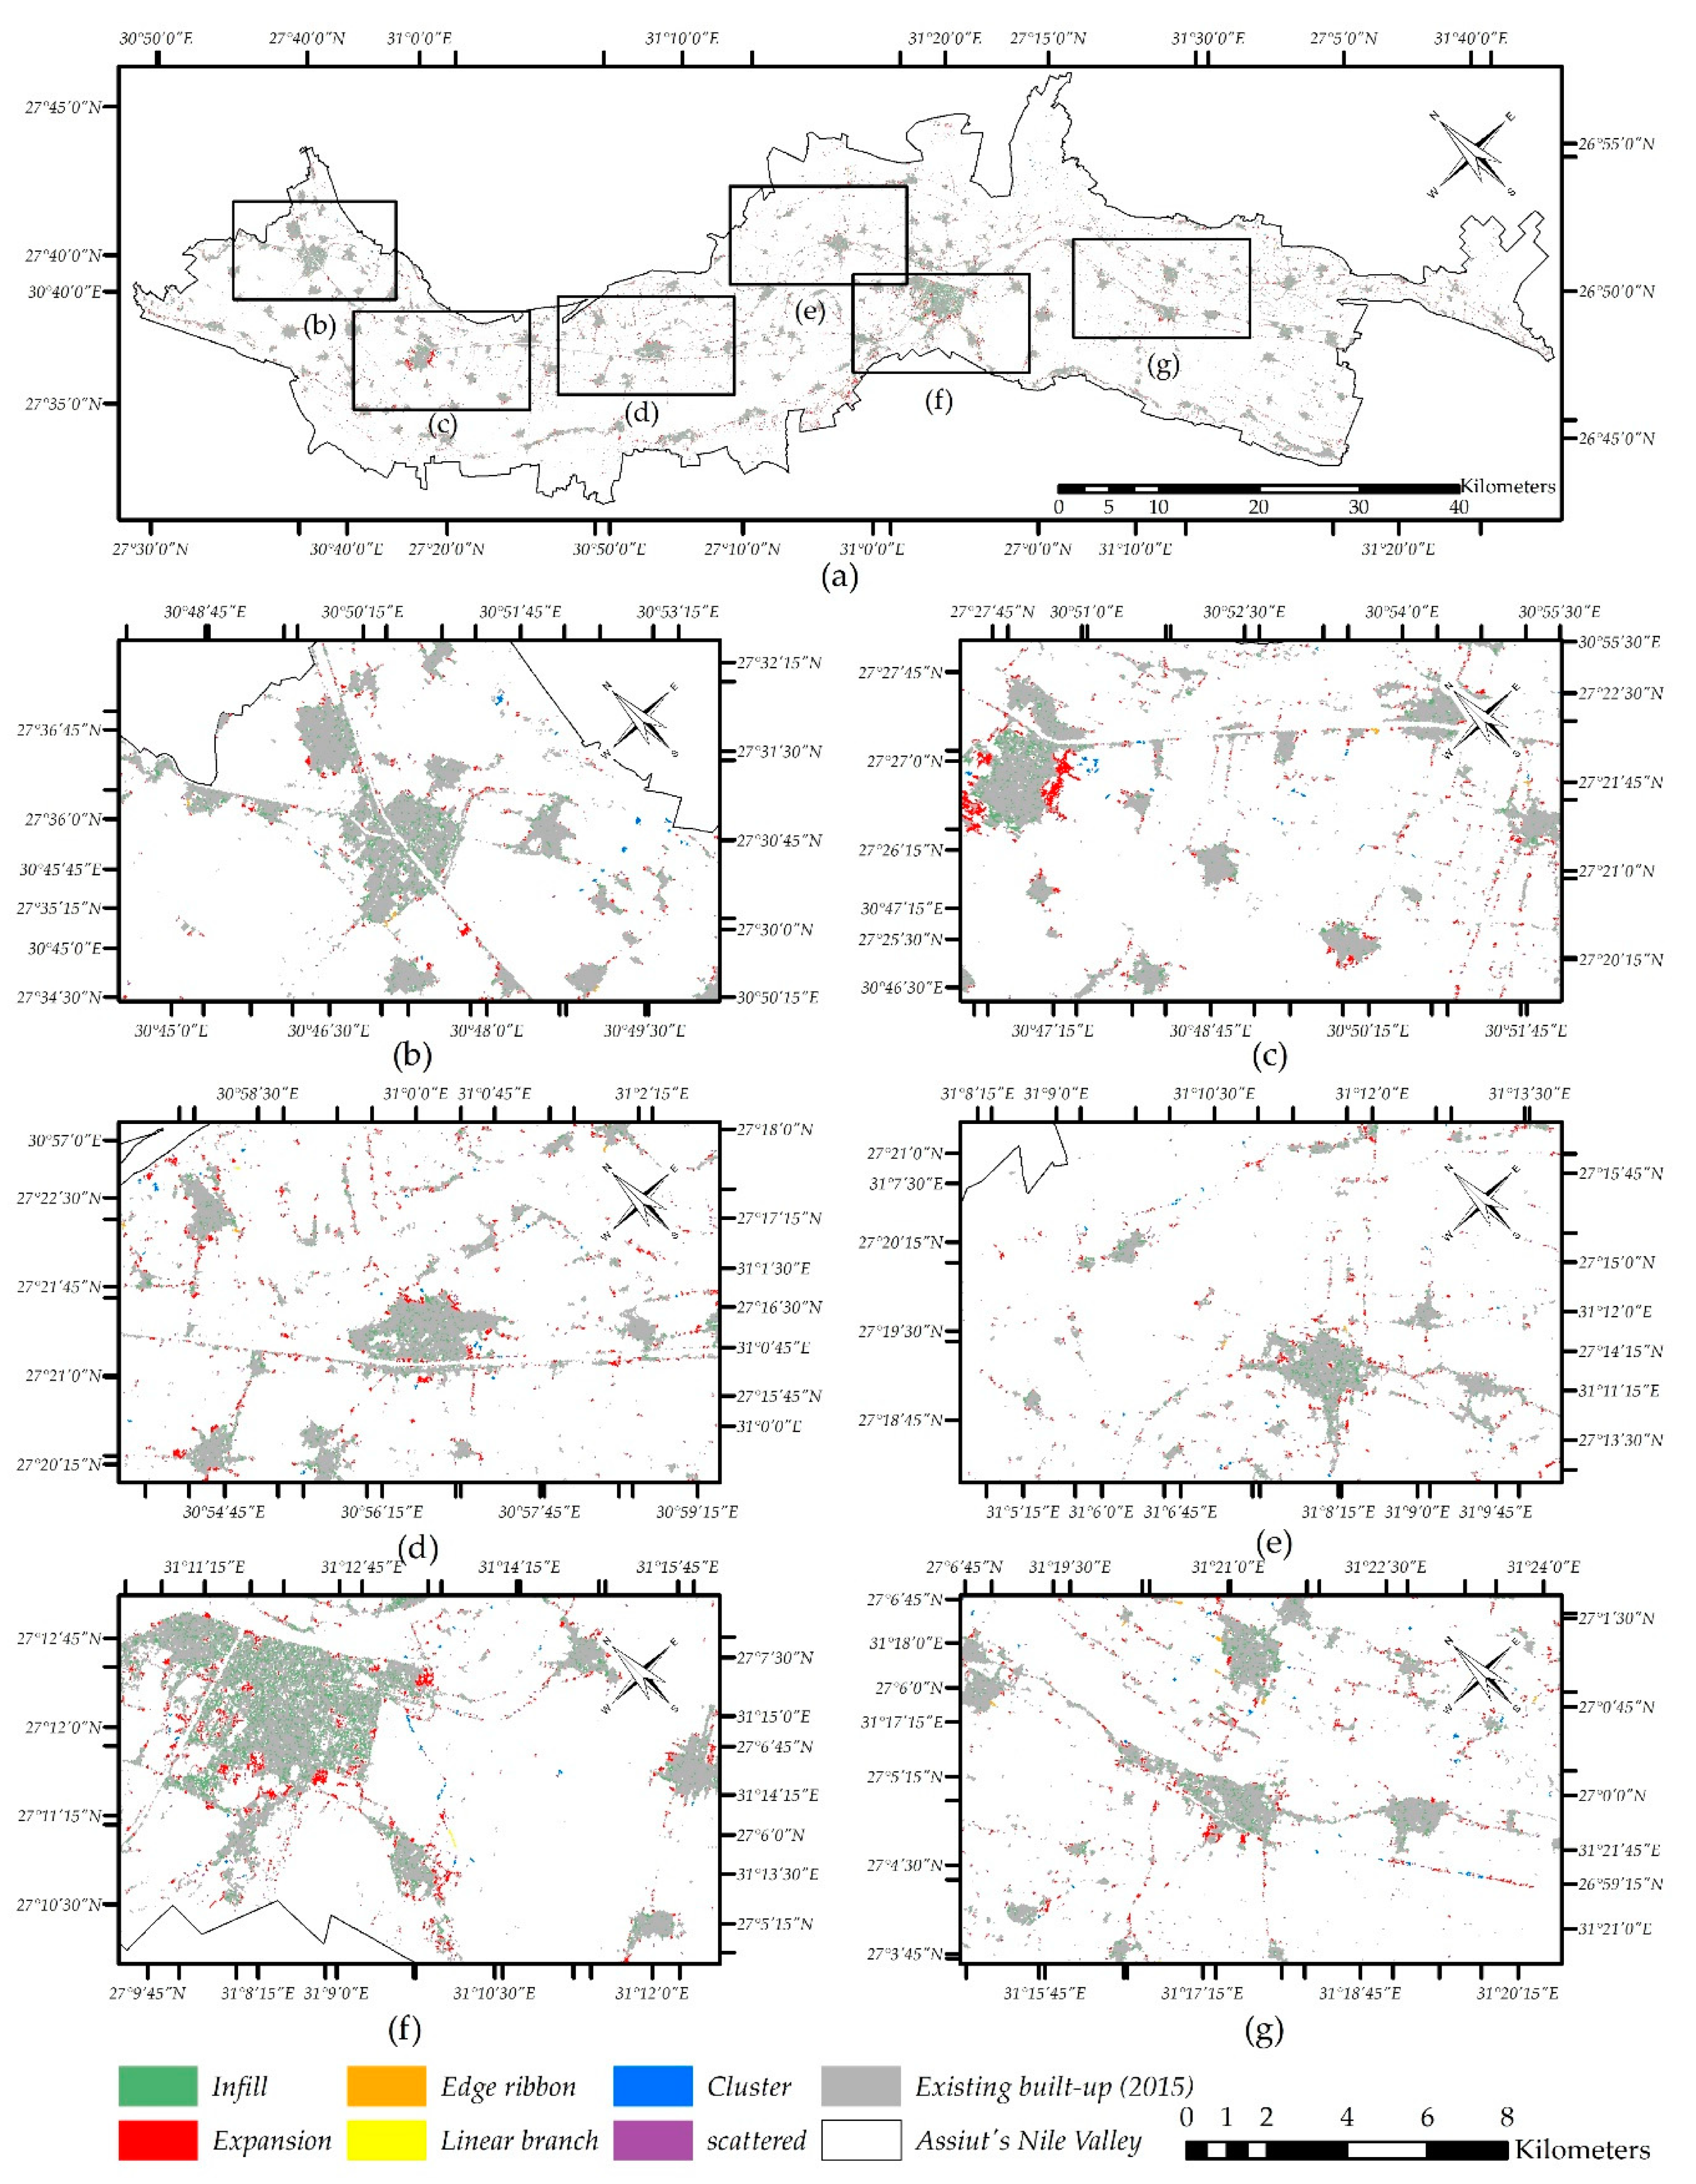
In the third period (Figure 12), the pattern was similar to the first period. Expansion area increased to 27.7 km2 (52.9%). Infill area was approximately (13.4 km2), such that the proportion decreased to 25.5% after it was 32.8% in the second period. The cluster growth area increased to be 5.4 km2 (10.3%), such that the proximate cluster increased (3.5 km2), while the isolated cluster had a slight decrease (1.5 km2). The area of scattered was 4.4 km2 (8.4%), which was mostly proximate scattered (3.5 km2). Finally, the linear branch and edge-ribbon were 0.7 and 0.9 km2, respectively.
In the fourth period (Figure 13), infill and expansion recorded approximately a similar area (15.8 and 15.6 km2, respectively). Meanwhile, Linear branch (0.1 km2), cluster (1.5 km2), and scattered (3.0 km2) had the least area, if compared to previous periods. Proximate cluster (1.0 km2) was more than Isolated cluster (0.5 km2). Similarly, Proximate scattered (3.7 km2) was more the isolated scattered (0.7 km2).
In terms of landscape properties, MEI and AWMEI results (Table 6) showed that HSG in Assiut had an ascending trend from dispersed to compact. MEI was 11.1, 32.6, 30.2, and 43.9 for the first, second, third, and fourth periods, respectively. The highest increase was in the second period, while the only decrease was in the third period. AWMEI for the first, second, third, and fourth periods was 18.0, 35.4, 32.5, and 44.2, respectively. Similarly, the highest increase was in the second period, and the only decrease was in the third period.

3.4. Class Metrics

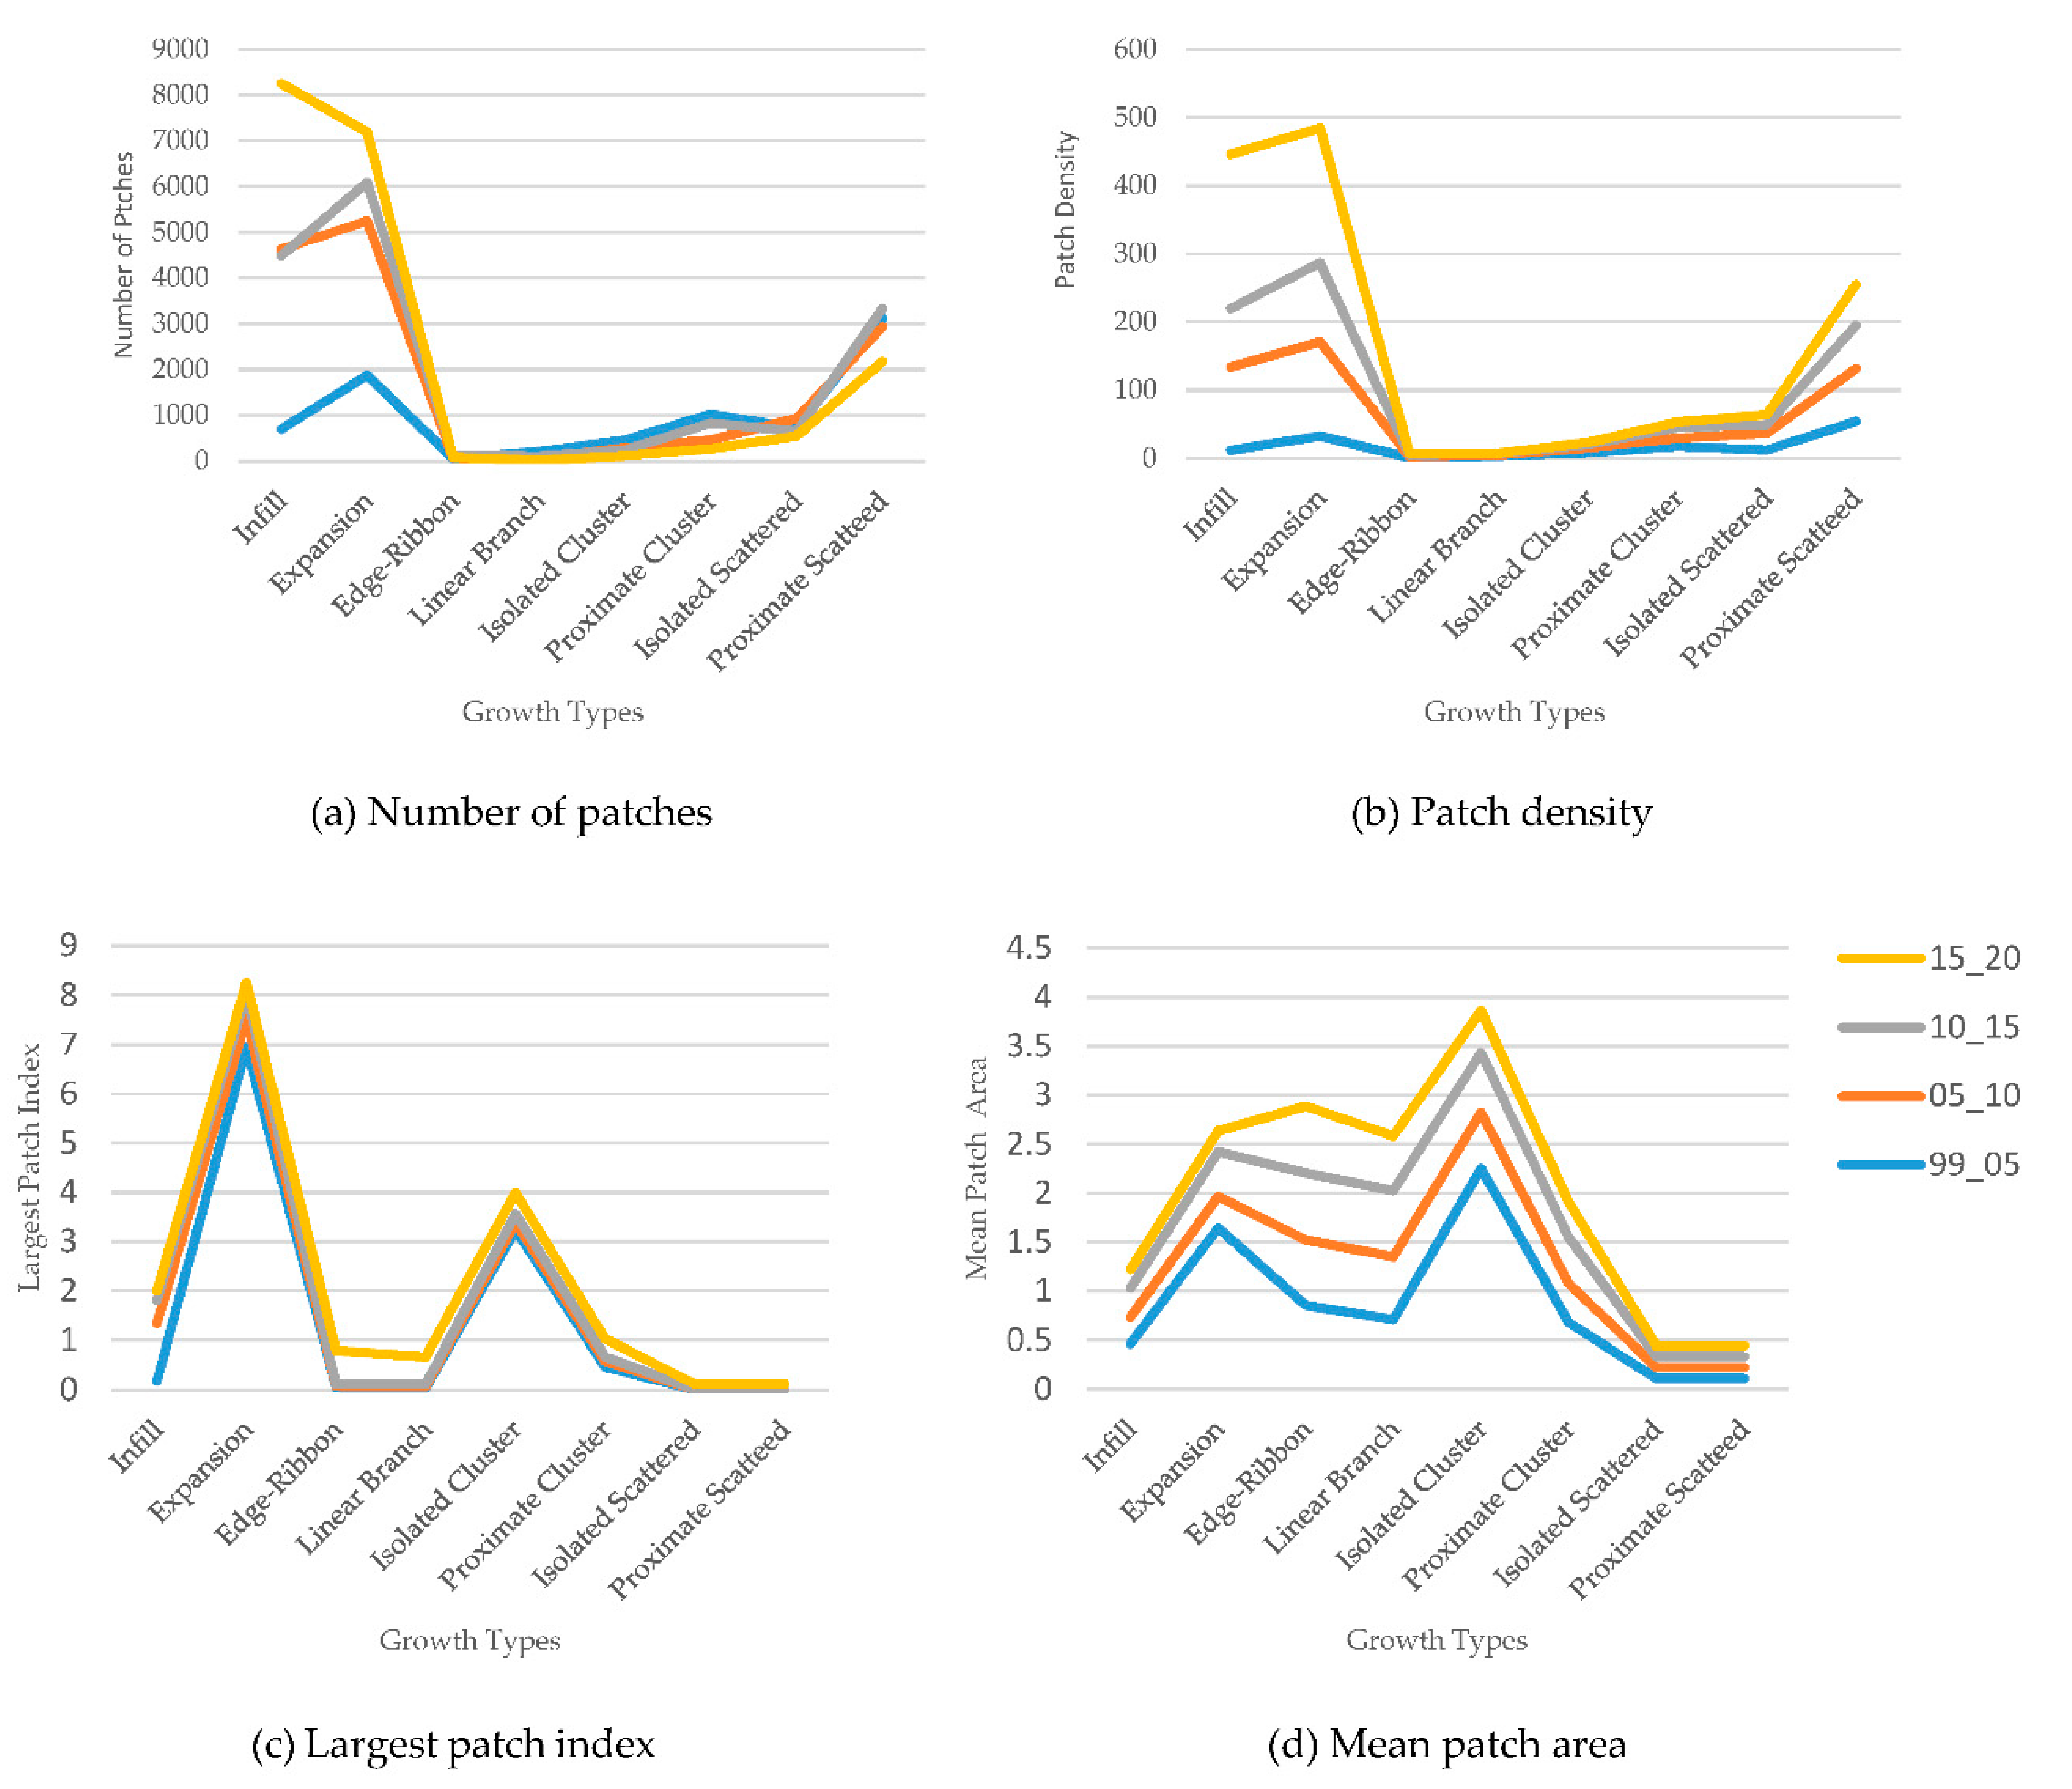
Comparing the eight growth types over all periods, only expansion experienced a continuous increase in the number of patches from 1999 until 2020, while proximate cluster decreased continuously (Figure 14a). While the number of patches for the six other types fluctuated, infill has increased very strongly overall, perhaps reflecting some desire for consolidation and more compact growth. From the patch density perspective (Figure 14b), all types had an increase in each period except for edge-ribbon, linear branch, and isolated cluster that exhibited little change. Expansion and isolated cluster had the highest largest patch index (Figure 14c), while for the mean patch area, all types showed an increase over time, with isolated cluster, linear branch, and expansion showing the highest values (Figure 14d).

4. Discussion

From a technical perspective, both the GHSL and the ALC were useful for estimating the built-up area in Assiut using SML, though the ALC had a higher probability of detecting built-up areas than the GHSL. This difference could be the result of tuning the parameters of the GHSL to global scale requirements, while ALC was tuned for Africa only. Nevertheless, despite their differences, both were useful as training sets, enabling us to tune the SML classifier and improve the accuracy of Assiut’s built-up area maps. Future research could examine to what extent the settings used here could be transferred for classifying other parts of the Nile Delta.
The new QGIS Growth Classifier plugin has some advantages over existing tools. Lui et al. [46], for instance, developed a tool for a commercial GIS platform (ArcGIS) that defines three HSG types (i.e., infill, edge-expansion, and outlying). By contrast, Growth Classifier operates on the open-source QGIS platform and classifies eight HSG types, as described in Section 2, thereby providing a more detailed insight into HSG dynamics over time. As previous studies highlighted the need for identifying HSG dynamics to support modeling and simulating unplanned (informal) settlements using remote sensing and GIS [53,54], the more detailed information that Growth Classifier generates may prove to be useful in future simulation work. For example, it could provide further insights into the conditions under which ribbon and clustered development may consolidate or transform into new urban expansion areas over time.
From a substantive perspective, human settlements in Assiut Governorate, we have observed changes in the mix of growth types and rates since 1999. The epoch of 2015:2020 had the lowest growth area, whereas the period between 2010 and 2015 had the highest growth area. This change of areas between the four periods can, to some extent, be explained by the land-use development plan during each period.
Before 1986, rural human settlement growth in Egypt was autonomous. In 1986, the first land-use development plan for settlements in Assiut created planning schemes for 15 years, following the master planning approach. These plans failed to regulate settlement development beyond the physical boundaries of the plan [31] as they neglected the socioeconomic context and focused exclusively on establishing spatial and physical boundaries [55]. The failure of the first land-use development plan is clearly reflected by the results of the first period (1999–2005) when almost 58 km2 was added to the settlement area.
In 2005, the second land-use development plan for 2005–2020 was launched [33]. This plan relied on a strategic planning schema, and the socioeconomic contextual characteristics were considered. The second plan was intended to stimulate infill growth and prevent all types of outlying growth. Accordingly, the annual growth rate decreased considerably between 2005 and 2010. Although the plan succeeded in utilizing the undeveloped pockets (infill growth), the growth rate (5.3% p.a.) was still higher than envisaged. Overall, the second land-use development plan was also unsuccessful in managing HSG in Assiut. Although the proportion of infill growth from the total growth area has increased, it has failed to limit the total growth area. While the plan’s target was to limit settlement growth to 15% (1% p.a.) of the 2005 built-up area (approximately 23 km2), the observed growth rate was more than 88.8% (almost 127 km2). Further, the plan also failed to restrict outlying settlement growth. Although one may conclude that the second plan had a limited effect on controlling growth, it is also important to mention a major external force, the 2011 civil uprising, which disrupted all government operations, including this plan’s implementation. The data show a large amount of settlement growth in the period 2010–2015 (52.6 km2, which is at least 14 km2 more than the second and the fourth periods), which might be partly attributed to the effect of the uprising.
The strong effect of accessibility on outlying growth types in the four periods is in accordance with Colsaet et al. [47], who found that roads (corridors) increase the probability of land development. Although edge-ribbon and linear branch were the least (in terms of area), other growth types (e.g., cluster) were also affected by their proximity to corridors. With a road network of more than 7000 km was built in Egypt between 2014 and 2020 [56], more studies should study the impact of these roads on expanding HSG types that are affected by corridors (edge_ribbon, linear branch, proximate cluster, and proximate scattered. To improve the identification of linear branch and edge-ribbon in the Nile Valley region, more studies should be conducted to define the optimal patch dimension that can describe cluster, edge-ribbon, and linear branch in the Nile Valley context.
Unplanned HSG in the Nile Valley is driven by many factors [57]. In terms of the policy, there is a lack of efficient participatory planning processes while developing and implementing the land-use plan. In addition, urban policy ignores residents’ preferences and lifestyle requirements. The government has also failed to establish a consistent policy toward unplanned HSG. On the one hand, legislation criminalizes unplanned HSG while, on the other hand, it also sometimes adopts a reconciliation policy for regularizing unplanned settlements. Such contradictions encourage unplanned HSG as opportunities for reconciliation through regularization are often on the table. The regularization of informal settlements is often supported by international, pro-poor development agendas [58].
The presence of outlying growth types in all periods reflects insufficient subsidized housing opportunities for poorer households in Assiut. Consequently, more than 70% of unplanned HSG between 1986 and 2005 was for residential use for the lower-income groups [27]. Meanwhile, all new settlements that were built in the desert adjacent to the Nile Valley and Delta regions failed to attract their targeted populations [23]. Thus, future land-use development plans might continue to fail in preventing outlying growth unless the current housing policy toward the lower-income groups is reconsidered, such as presenting housing subsidies for these groups and providing subsidies for farmers to prevent them from building on the agricultural land.
Uncontrolled growth was not only caused by policy failures. Administrative, economic, and cultural dimensions have also contributed. Top-down decision-making processes, administrative fragmentation, and disrupted bureaucratic structures are some of the administrative drivers for unplanned HSG, and the local culture of parents providing housing on their land for their children’s families also drives settlement growth [57].
By comparing the dynamics of HSG types in Assiut with other areas experiencing rapid growth such as Dongguan, China, edge-expansion type was the dominant urban growth type for both areas [46]. In Dongguan, edge-expansion growth was the dominant type from 1988 to 2006. By contrast, the outlying growth type had the lowest area in Dongguan, whereas it was the second-largest component of settlement growth in Assiut. Such differences may be attributed to the specific socioeconomic and geographic characteristics of the two locations. The difference also indicates that Dongguan’s policy managed to achieve more compact growth than the policy in Assiut.
Dietzel et al. [59] showed that Houston’s urban growth passes through two phases: diffusion and coalescence. Starting from an urban seed, the built-up area grows in scattered patches, which ultimately leads to the emergence of several urban cores (diffusion). Thereafter, edge expansion occurs around existing urban cores and then infilling occurs on the unoccupied areas between the cores (coalescence). As presented in Section 3, Assiut’s growth showed high levels of diffusion in the period 1999–2005 and was expanding significantly between 2005 and 2020 as a symptom of uncontrolled growth. The increasing values of the mean patch size also indicate a trend against the policy of fixing the growth area between 2005 and 2020. These results suggest that the future phase may be expected to show increased signs of coalescence, as the spaces between existing settlements are subject to infilling, though this will also likely be accompanied by a degree of diffusion as both processes do co-exist. This is also reflected by the relative change in the number of patches per growth type (Section 3.4). Moreover, from an urban policy perspective, it would be worthwhile to give more attention to the four growth types that are adjoining corridors (i.e., edge-ribbon; linear branch; proximate cluster; proximate scattered) as some of these are increasing in number and these have the potential to open-up large tracts of farmland to the forces of urban development in a manner which is fragmented and may be challenging to service efficiently.

5. Conclusions

Our study makes several methodological and substantive contributions. We have demonstrated the practical value of using open remote sensing and GIS data (Landsat, GHSL, ALC, OpenStreetMap) and open processing tools (MASADA 1.3) to extract human settlement maps, which are tuned to the context of Assiut Governorate and potentially the wider Nile Delta region. Another contribution is the open-source QGIS plugin tool, Growth Classifier, which may help others to classify major settlement growth types, including five new HSG types that highlight the effect of corridors (e.g., road network) on settlement growth. Moreover, Growth Classifier can also be used for other purposes, such as analyzing deforestation/reforestation dynamics through time.
By tuning the SML parameters within MASADA 1.3, the classification accuracy of built-up areas was significantly improved. This higher quality assessment of the built-up area over time provides a better understanding of the human settlement growth processes through time. The classification of eight settlement growth types (infill, expansion, edge-ribbon, linear branch, proximate cluster, isolated cluster, proximate scattered, and isolated scattered) provides insights into the form and compactness of settlement growth and allowing the effectiveness of urban growth policy in Assiut to be assessed.
From a substantive perspective, we conclude that the land-use development policy in the Nile Valley region of Assiut has been mostly ineffective in managing unplanned HSG between 2005 and 2020. Although the rate of unplanned HSG did decrease after 2005, HSG was clearly still ongoing. Moreover, we observe that the ability to regulate such settlement growth processes is weakened by periods of civil unrest, such as the 2011 crisis in Egypt. There is, therefore, a need to critically evaluate the recent strategies for regulating land-use development in the next 2020–2035 plan. Further, institutionalizing an efficient settlement growth monitoring system to regularly inform policymakers, using tools and methods such as those used here is worthy of consideration.

Author Contributions

Conceptualization, M.A., R.S. and L.B.; methodology, M.A., R.S. and L.B; software, M.A. and A.E.; validation, M.A.; formal analysis, M.A.; resources, M.A.; writing—original draft preparation, M.A.; writing—review and editing, M.A, R.S., L.B., A.E. and J.Z.; visualization, M.A.; supervision, R.S., L.B. and J.Z. All authors have read and agreed to the published version of the manuscript.

Funding

This research was funded by The Ministry of Higher Education, Egypt, grant number 2014/2015.

Conflicts of Interest

The authors declare no conflict of interest. The Ministry of Higher Education, Egypt had no role in the design of the study; in the collection, analyses, or interpretation of data; in the writing of the manuscript, or in the decision to publish the results.

References

  1. UN. World Population Prospects: The 2015 Revision; United Nations: New York, NY, USA, 2015. [Google Scholar]
  2. Angel, S.; Parent, J.; Civco, D.L.; Blei, A.; Potere, D. The dimensions of global urban expansion: Estimates and projections for all countries, 2000–2050. Prog. Plan. 2011, 75, 53–107. [Google Scholar] [CrossRef]
  3. Alfiky, A.; Kaule, G.; Salheen, M. Agricultural fragmentation of the Nile Delta; a modeling approach to measuring agricultural land deterioration in Egyptian Nile Delta. In Proceedings of the Landscape, Environment, European Identity, Bucharest, Romania, 4–6 November 2011; pp. 79–97. [Google Scholar]
  4. Christiansen, F. Food Security, Urbanization and Social Stability in China. J. Agrar. Chang. 2009, 9, 548–575. [Google Scholar] [CrossRef]
  5. Angel, S.; Parent, J.; Civco, D.L. Urban Sprawl Metrics: An Analysis Of Global Urban Expansion Using GIS. In Proceedings of the ASPRS 2007 Annual Conference, Tampa, FL, USA, 7–11 May 2007. [Google Scholar]
  6. Wilson, E.H.; Hurd, J.D.; Civco, D.L.; Prisloe, M.P.; Arnold, C. Development of a geospatial model to quantify, describe and map urban growth. Remote Sens. Environ. 2003, 86, 275–285. [Google Scholar] [CrossRef]
  7. Shi, Y.; Sun, X.; Zhu, X.; Li, Y.; Mei, L. Characterizing growth types and analyzing growth density distribution in response to urban growth patterns in peri-urban areas of Lianyungang City. Landsc. Urban Plan. 2012, 105, 425–433. [Google Scholar] [CrossRef]
  8. Bhatta, B. Analysis of Urban Growth and Sprawl from Remote Sensing Data; Springer: Berlin/Heidelberg, Germany, 2010. [Google Scholar]
  9. Pesaresi, M.; Syrris, V.; Julea, A. A New Method for Earth Observation Data Analytics Based on Symbolic Machine Learning. Remote Sens. 2016, 8, 399. [Google Scholar] [CrossRef] [Green Version]
  10. Džeroski, S. Applications of symbolic machine learning to ecological modelling. Ecol. Model. 2001, 146, 263–273. [Google Scholar] [CrossRef]
  11. Pesaresi, M.; Vasileios, S.; Julea, A. Benchmarking of the Symbolic Machine Learning Classifier with State of the Art Image Classification Methods; Joint Research Centre: Luxembourg, 2015; p. 46. [Google Scholar]
  12. Pesaresi, M.; Ehrlich, D.; Ferri, S.; Florczyk, A.J.; Freire, S.; Halkia, M.; Julea, A.; Kemper, T.; Soille, P.; Syrris, V. Operating Procedure for the Production of the Global Human Settlement Layer from Landsat Data of the Epochs 1975, 1990, 2000, and 2014; European Union: Brussels, Belgium, 2016; p. 67. [Google Scholar]
  13. Herold, M.; Goldstein, N.C.; Clarke, K.C. The spatiotemporal form of urban growth: Measurement, analysis and modeling. Remote Sens. Environ. 2003, 86, 286–302. [Google Scholar] [CrossRef]
  14. Aguilera, F.; Valenzuela, L.M.; Botequilha-Leitão, A. Landscape metrics in the analysis of urban land use patterns: A case study in a Spanish metropolitan area. Landsc. Urban Plan. 2011, 99, 226–238. [Google Scholar] [CrossRef]
  15. Hao, R.; Su, W.; Yu, D. Quantifying the Type of Urban Sprawl and Dynamic Changes in Shenzhen. In Computer and Computing Technologies in Agriculture VI, Proceedings of the 6th IFIP WG 5.14 International Conference, CCTA 2012, Zhangjiajie, China, 19–21 October 2012; Revised Selected Papers, Part II; Li, D., Chen, Y., Eds.; Springer: Berlin/Heidelberg, Germany, 2013; pp. 407–415. [Google Scholar] [CrossRef] [Green Version]
  16. Jiang, F.; Liu, S.; Yuan, H.; Zhang, Q. Measuring urban sprawl in Beijing with geo-spatial indices. J. Geogr. Sci. 2007, 17, 469–478. [Google Scholar] [CrossRef]
  17. Jiao, L.; Liu, J.; Xu, G.; Dong, T.; Gu, Y.; Zhang, B.; Liu, Y.; Liu, X. Proximity Expansion Index: An improved approach to characterize evolution process of urban expansion. Comput. Environ. Urban Syst. 2018. [Google Scholar] [CrossRef]
  18. Mu, B.; Mayer, A.L.; He, R.; Tian, G. Land use dynamics and policy implications in Central China: A case study of Zhengzhou. Cities 2016, 58, 39–49. [Google Scholar] [CrossRef]
  19. Ou, J.; Liu, X.; Li, X.; Chen, Y. Quantifying Spatiotemporal Dynamics of Urban Growth Modes in Metropolitan Cities of China: Beijing, Shanghai, Tianjin, and Guangzhou. Am. Soc. Civ. Eng. 2017, 143. [Google Scholar] [CrossRef]
  20. Sun, C.; Wu, Z.-F.; Lv, Z.-Q.; Yao, N.; Wei, J.-B. Quantifying different types of urban growth and the change dynamic in Guangzhou using multi-temporal remote sensing data. Int. J. Appl. Earth Obs. Geoinf. 2013, 21, 409–417. [Google Scholar] [CrossRef]
  21. Ewing, R.; Pendall, R.; Chen, D. Measuring Sprawl and Its Impacts; Smart Growth America: Washington, DC, USA, 2002. [Google Scholar]
  22. Seto, K.C.; Güneralp, B.; Hutyra, L.R. Global forecasts of urban expansion to 2030 and direct impacts on biodiversity and carbon pools. Proc. Natl. Acad. Sci. USA 2012, 109, 16083–16088. [Google Scholar] [CrossRef] [Green Version]
  23. Central Agency for Public Mobilization and Statistics. Annual Statistical Book; CAPMAS Press: Cairo, Egypt, 2018. [Google Scholar]
  24. El-Hefnawi, A. “Protecting” agricultural land from urbanization or “Managing” the conflict between informal urban growth while meeting the demands of the communities (Lessons learnt from the Egyptian policy reforms). In Proceedings of the Third Urban Research Symposium on Land Development, Urban Policy, and Poverty Reduction, The World Bank Institute of Applied Economic Research, Brasilia, Brazil, 4–6 April 2005. [Google Scholar]
  25. New Urban Communities Authority. New Cities in Egypt. Available online: http://www.newcities.gov.eg/know_cities/default.aspx (accessed on 17 April 2019).
  26. Tipple, A.G. The new cities of Egypt. Ekistics 1986, 53, 50–53. [Google Scholar]
  27. GOPP. The National Strategic Plan for the Egyptian Village: Assiut Governorate; The General Organization for Physical Planning, Ministry of Housing Utilities & Urban Communities: Cairo, Egypt, 2009. [Google Scholar]
  28. Abbas, W.G. A Study about Criminalizing Encroachments on Agricultural Land in Egypt; The National Center for Jurisdictional Studies: Cairo, Egypt, 2015. [Google Scholar]
  29. Abdelkader, M. The Digital Maps of the 1986 National Strategic Plan for the Egyptian Village: Assiut Governorate; GOPP: Cairo, Egypt, 2011. [Google Scholar]
  30. Osman, T.; Divigalpitiya, P.; Arima, T. Driving factors of urban sprawl in Giza Governorate of Greater Cairo Metropolitan Region using AHP method. Land Use Policy 2016, 21–31. [Google Scholar] [CrossRef]
  31. MALR. Urban Expansion and Agricultural Land between 1984 and 2007; Agricultural Land Preservation Agency, Ed.; Ministry of Agriculture and Land Reclamation: Cairo, Egypt, 2010.
  32. Khalifa, M.A. Evolution of informal settlements upgrading strategies in Egypt: From negligence to participatory development. Ain Shams Eng. J. 2015, 6, 1151–1159. [Google Scholar] [CrossRef] [Green Version]
  33. The General Organization for Physical Planning. The National Strategic Development Plans for Egyptian Villages—Table of References; Ministry of Housing, Utilities and Urban Communities: Cairo, Egypt, 2006.
  34. Bassiouni, M.C. Chronicles of the Egyptian Revolution and Its Aftermath: 2011–2016; Cambridge University Press: Cambridge, UK, 2016. [Google Scholar]
  35. MALR. The Annual Report 2014; Agricultural Land Preservation Agency, Ed.; Ministry of Agriculture and Land Reclamation: Cairo, Egypt, 2014.
  36. GLCF. Global Land Survey. Available online: http://glcf.umd.edu/data/gls/ (accessed on 15 October 2017).
  37. USGS. Landsat Imageries. Available online: http://landsat.usgs.gov/Landsat_Search_and_Download.php (accessed on 20 March 2020).
  38. JRC. The Global Human Settlement Layer. Available online: https://ghsl.jrc.ec.europa.eu/ (accessed on 4 May 2018).
  39. ESA. African Land Cover. Available online: https://www.esa.int/ESA_Multimedia/Images/2017/10/African_land_cover (accessed on 25 January 2018).
  40. OSM. OpenStreetMap. Available online: https://www.openstreetmap.org/#map=10/27.1295/31.1133 (accessed on 20 January 2020).
  41. Politis, P.; Corbane, C.; Maffenini, L.; Kemper, T.; Pesaresi, M. MASADA User Guide; Joint Research Centre: Luxembourg, 2017. [Google Scholar]
  42. Taubenböck, H.; Esch, T.; Felbier, A.; Wiesner, M.; Roth, A.; Dech, S. Monitoring urbanization in mega cities from space. Remote Sens. Environ. 2012, 117, 162–176. [Google Scholar] [CrossRef]
  43. Stehman, S.V. Sampling designs for accuracy assessment of land cover. Int. J. Remote Sens. 2009, 30, 5243–5272. [Google Scholar] [CrossRef]
  44. Fawcett, T. An introduction to ROC analysis. Pattern Recognit. Lett. 2006, 27, 861–874. [Google Scholar] [CrossRef]
  45. Abdelkader, M.; Elseicy, A. Growth Classifier, 1.0.0. 2020. Available online: https://zenodo.org/record/4279178#.X7jAvlARXIU (accessed on 17 September 2020).
  46. Liu, X.; Li, X.; Chen, Y.; Tan, Z.; Li, S.; Ai, B. A new landscape index for quantifying urban expansion using multi-temporal remotely sensed data. Landsc. Ecol. 2010, 25, 671–682. [Google Scholar] [CrossRef]
  47. Colsaet, A.; Laurans, Y.; Levrel, H. What drives land take and urban land expansion? A systematic review. Land Use Policy 2018, 79, 339–349. [Google Scholar] [CrossRef]
  48. Verbeek, T.; Boussauw, K.; Pisman, A. Presence and trends of linear sprawl: Explaining ribbon development in the north of Belgium. Landsc. Urban Plan. 2014, 128, 48–59. [Google Scholar] [CrossRef]
  49. Verbeek, T.; Tempels, B. Measuring fragmentation of open space in urbanised Flanders: An evaluation of four methods. Belgeo 2016, 2. [Google Scholar] [CrossRef] [Green Version]
  50. McGarigal, K.; Marks, B. FRAGSTATS: Spatial Pattern Analysis Program for Quantifying Landscape Structure; PNW-351; USDA Forest Service General: Washington, DC, USA, 1995. [Google Scholar]
  51. Akintunde, J.A.; Adzandeh, E.A.; Fabiyi, O.O. Spatio-temporal pattern of urban growth in Jos Metropolis, Nigeria. Remote Sens. Appl. Soc. Environ. 2016, 4, 44–54. [Google Scholar] [CrossRef]
  52. McGarigal, K.; Cushman, S.; Neel, M.; Ene, E. FRAGSTATS: Spatial Pattern Analysis Program for Categorical Maps, 4th ed.; University of Massachusetts: Amherst, MA, USA, 2002. [Google Scholar]
  53. Hofmann, P.; Taubenböck, H.; Werthmann, C. Monitoring and modelling of informal settlements—A review on recent developments and challenges. In Proceedings of the 2015 Joint Urban Remote Sensing Event (JURSE), Lausanne, Switzerland, 30 March–1 April 2015; pp. 1–4. [Google Scholar]
  54. Vahidi, H.; Yan, W. How is an informal transport infrastructure system formed? Towards a spatially explicit conceptual model. Open Geospat. Data Softw. Stand. 2016, 1, 8. [Google Scholar] [CrossRef] [Green Version]
  55. Khalifa, M.A. A critical review on current practices of the monitoring and evaluation in the preparation of strategic urban plans within the Egyptian context. Habitat Int. 2012, 36, 57–67. [Google Scholar] [CrossRef]
  56. Hemadah, N. The Biggest Road Network in Egypt; Akhbarelyom Press: Cairo, Egypt, 2020. [Google Scholar]
  57. Abdelkader, M.; Boerboom, L.; Sliuzas, R. The Unintended Consequences of Egypt’s National Development Policy on Unplanned Settlement Growth in the Nile Valley. Land Use Policy 2020. under review. [Google Scholar]
  58. United Nations New Urban Agenda; United Nations: Quito, Ecuador, 2017.
  59. Dietzel, C.; Oguz, H.; Hemphill, J.J.; Clarke, K.C.; Gazulis, N. Diffusion and Coalescence of the Houston Metropolitan Area: Evidence Supporting a New Urban Theory. Environ. Plan. B Plan. Des. 2005, 32, 231–246. [Google Scholar] [CrossRef] [Green Version]
Figure 1. HSG types: (a) Infill; (b) Edge-Expansion; (c) Linear Branch; (d) Cluster; (e) Scattered; (adapted from [6]).
Remotesensing 12 03799 g001
Figure 2. (a) Settled regions in Egypt; (b) The location of Assiut Governorate between other governorates in the Nile Valley region, Egypt.
Remotesensing 12 03799 g002
Figure 3. The built-up area in Assiut Governorate in 1999 and its road network. (Source: NARSS).
Remotesensing 12 03799 g003
Figure 4. The methodology for estimating Assiut built-up area in using MASADA 1.3.
Remotesensing 12 03799 g004
Figure 5. Landscape Expansion Index classification for HSG types.
Remotesensing 12 03799 g005
Figure 6. The process of classifying outlying growth types.
Remotesensing 12 03799 g006
Figure 7. (a) HSG in Assiut between 1999 and 2020; (bg) Focus on HSG between 1999 and 2020 for different regions in Assiut Governorate.
Remotesensing 12 03799 g007
Figure 8. (a) The confusion map for the global human settlement layer (GHSL_2000) and NARSS’s 1999 built-up layer (reference set); (bg) Focus on the confusion matrix for different regions in Assiut Governorate.
Remotesensing 12 03799 g008
Figure 9. Areas (km2) and proportions of HSG types in Assiut (a) 1999:2005; (b) 2005:2010; (c) 2010:2015; (d) 2015:2020.
Remotesensing 12 03799 g009
Figure 10. (a) HSG types in Assiut between 1999 and 2005; (bg) Focus on HSG types between 1999 and 2005 for different regions in Assiut Governorate.
Remotesensing 12 03799 g010
Figure 11. (a) HSG types in Assiut between 2005 and 2010; (bg) Focus on HSG types between 2005 and 2010 for different regions in Assiut Governorate.
Remotesensing 12 03799 g011
Figure 12. (a) HSG types in Assiut between 2010 and 2015; (bg) Focus on HSG types between 2010 and 2015 for different regions in Assiut Governorate.
Remotesensing 12 03799 g012
Figure 13. (a) HSG types in Assiut between 2015 and 2020; (bg) Focus on HSG types between 2015 and 2020 for different regions in Assiut Governorate.
Remotesensing 12 03799 g013
Figure 14. Class metrics for the eight growth types between 1999 and 2020; (a) number of patches; (b) patch area; (c) largest patch index; (d) mean patch area.
Remotesensing 12 03799 g014
Table 1. Inputs used for assessing the second land-use development plan in Assiut.
NameSourceAcquisition DateTypeResolution (Meter)Purpose
Assiut built-upNARSS1999shapefile Identifying HSG types between 1999:2005
Landsat 7 imagesGLCF10 February 2005
and
28 March 2010
TIFF30Estimating the built-up area in 2005 and 2010
Landsat 8 imagesUSGS13 January 2015
and
27 January 2020
TIFF30Estimating the built-up area in 2015 and 2020
GHSLJRC2000TIFF30Training the built-up area estimation in 2005 and 2010
ALCESA2015/2016TIFF20Training the built-up area estimation in 2015 and 2020
Roads and water bodiesOSM shapefile Identifying edge-ribbon and linear branch
Table 2. MASADA 1.3 software parameters for extracting built-up area from Landsat imageries.
Parameter NameParameter Definition
rad_q_minlevThe minimum cut-off value for rescaling the radiometric bands before quantization
rad_q_maxlevThe maximum cut-off value for rescaling the radiometric bands before quantization
rad_qlevNumber of levels to reduce the radiometric data
Table 3. The optimal radiometric parameter used for extracting Assiut built-up area with its corresponding area and average support.
YearRad_qlevSmlAvgSuppRadTotal Area (km2)New Built Area (km2)Annual Growth Rate (%)
1999 * 85.5
2005 **640442.8143.057.511.0
2010 **20447.3180.937.95.3
2015 **275705.8233.552.67.3
2020 **130158.6270.036.55.1
* = Source: NARSS; ** Source = satellite data.
Table 4. The results of validating the Global Human Settlement Layer for the year 2000 by Assiut built-up layer in 1999.
Dataset NameTrue PositiveTrue NegativeFalse PositiveFalse NegativeAccuracy
(%)
True Positive Rate (Sensitivity)False Negative Rate
(1-Specificity)
GHSL_200047,0852,029,10990,32247,87393.80.4960.023
Table 5. Validation results for the classified data and the training sets.
Dataset NameTrue Positive True Negative False Positive False Negative Accuracy
(%)
True Positive Rate (Sensitivity)False Negative Rate (1-Specificity)
BU_20051646515496.20.8000.009
BU_2010244628697.20.8000.013
BU_2015294623698.20.8290.013
BU_2020314525697.80.8610.011
GHSL_20141646061895.20.4710.015
ALC19453151394.40.5900.038
Table 6. Mean expansion index (MEI), and area weighted mean expansion index (AWMEI) for HSG in Assiut in the four periods.
PeriodMEIAWMEI
1999:200511.118.0
2005:201032.635.4
2010:201530.232.5
2015:202043.944.2
Publisher’s Note: MDPI stays neutral with regard to jurisdictional claims in published maps and institutional affiliations.