Article

Storm Surge Hazard Assessment of the Levee of a Rapidly Developing City-Based on LiDAR and Numerical Models

North China Sea Marine Forecasting Center, Ministry of Natural Resources (MNR), Qingdao 266061, China
*
Author to whom correspondence should be addressed.
Remote Sens. 2020, 12(22), 3723; https://doi.org/10.3390/rs12223723
Submission received: 17 September 2020 / Revised: 9 November 2020 / Accepted: 10 November 2020 / Published: 12 November 2020
(This article belongs to the Special Issue Coastal Environments and Coastal Hazards)

Abstract

:
Rapidly developing cities could require an urgent hazard assessment to ensure the protection of their economy and population against natural disasters. However, these cities that have rapidly developed should have historical records of observations that are too short to provide sufficient data information for such an assessment. This study used ocean numerical models (i.e., Finite-Volume Community Ocean Model (FVCOM) and Parabolic Mild-Slope Wave Module (MIKE 21 PMS) to reconstruct data for a storm surge hazard assessment of the levee at Weifang (China). LiDAR (Light Detection and Ranging) data were also used to obtain 3D point cloud data and the structure of the levee. The designed levee height was calculated based on the simulations and 3D point cloud data, and the results were compared with measured heights to evaluate whether the levee is sufficiently high to satisfy the safety requirement. The findings of this work will enhance the marine disaster prevention capacity of the region and could help reduce economic losses associated with marine-related disasters. The results could also provide support for future work on disaster prevention in the field of coastal marine engineering.

Graphical Abstract

1. Introduction

A storm surge is the increased sea surface height that results from the movement of a tropical or extratropical cyclone toward a coastal area. Storm surges can be especially hazardous when coupled with astronomical high tides [1,2,3,4,5,6]. Storm surges are among the most disastrous marine/coastal hazards in the world, resulting in significant property damage and loss of life. The combination of a storm surge, the tide, and waves is capable of causing major flooding in coastal cities, severe erosion along beaches, and damage to marinas and ships in harbors [7,8,9,10].
A levee is an artificial embankment built to hold back water in estuaries and coastal areas to protect against high tides, storm surges, and wave action. Levees play an important and indispensable role in the protection of lives and property in coastal areas. Therefore, it is highly important to assess the storm surge hazard for levees, and to determine a reasonable levee elevation for the prevention and mitigation of such marine-related disasters in coastal areas. The method usually used to assess storm surge disaster hazard is based on regional disaster system theory [11,12,13,14,15]. The product (in this case, the maximum water level) is then used by government decision makers, insurance companies, and vulnerable communities [16,17,18,19,20,21,22].
In general, coastlines with a very wide and shallow continental shelf are most likely to be exposed to severe storm surges. Weifang is a rapidly developing Chinese city located on the coast of Laizhou Bay, which connects to the Bohai Sea. It is in one of the areas along China’s northern coast that suffers severe storm surges. Since 1949, the coastal areas of Weifang have experienced nearly 20 storm surge disasters related to severe typhoons or extratropical cyclones, which have caused huge economic losses. Historically, the most severe storm surge in this area caused a 3.58-m rise in the water level.
The coastal region of Weifang is protected by a 20-km-long levee, which was built in 2010. But in recent years, the population is increasing rapidly and the economic infrastructure is expanding greatly. Considering the threat posed by severe storm surges and the new observation in the recent years, it is important to reassess the hazard level and to verify whether the levee is sufficiently high to defend the socioeconomic interests of the city. To determine whether the levee is in danger, it is necessary to calculate the designed levee height and to compare it with measured values. If the designed levee height is higher than the measured values, the levee is in danger; otherwise, it may be considered safe. According to the “Code for design of levee project (GB 50286-2013),” the designed levee height is the sum of the designed tidal level, wave run-up, and security heightened value (safety margin). The security heightened values are listed in GB 50286-2013. Therefore, the main problem to be solved in a hazard assessment is how to best calculate the designed tidal level and the wave run-up.
Most tide stations around Weifang were built in recent years; therefore, they cannot provide sufficient continuous tide observations to meet the needs of a hazard assessment. According to GB 50286-2013, a storm surge hazard assessment generally requires no fewer than 20 years’ observational data. Consequently, in cases such as Weifang, it is necessary to find a way to determine the highest and lowest tidal levels that have ever occurred in history, which could then be used to calculate the water levels for different return periods.
One way to obtain a continuous multiyear water level sequence is to rebuild the observation based on statistical methods. If there is an observation station with long record close to the newly-built station, the data in recent years can be used to calculate the correlation between the two stations. Based on the correlation, the long-term observation can be converted from the old station to the newly build station. Nevertheless, this method requires that the two stations are quite close, otherwise the result is not reliable. However, the distance between Weifang and the closest station is over 100 km, which means that the statistical method cannot be used here.
Additionally, owing to greenhouse gas emissions and climate change, sea level is expected to rise in the future, which will increase the severity and frequency of storm surges [23,24,25,26]. Therefore, storm surge hazard assessment should consider the effects of future sea level rise and heighten the designed elevation for levees [27,28,29,30].
The object of this work was to assess the storm surge hazard of the levee of a rapidly developing city, Weifang. To overcome the lack of necessary data, this work used ocean numerical models to supplement the missing observations, which are used widely to study storm surges [31,32,33,34]. The numerical models, FVCOM and MIKE 21 PMS, were used to simulate historical year-by-year severe storm surge hazards and to extract water level values along the levee to obtain a continuous multiyear water level sequence. The water levels of different return periods were calculated based on these sequences and compared with the designed tidal levels, which made the storm surge hazard assessment possible. In addition to water level data, structural information on the levee was also required for the assessment. In this study, we used LiDAR to scan the Weifang levee section and to build 3D point cloud data. These data were used to calculate the slope of the levee. The designed levee height calculated based on the above data was compared with the measured values to assess the hazard. The assessment result will provide support of coastal marine engineering for future work on disaster prevention.

2. Data and Methods

2.1. Data

2.1.1. Meteorology and Tide Station Data

Meteorological and tide station data, which included wind, sea level pressure, tidal, and wave information, were obtained from observation stations in and around Weifang and buoys in the Laizhou Bay. The NCEP-CFSR (6-hourly, 0.3° horizontal resolution [35]) reanalysis data were also used as forcing for the ocean numerical model simulation.

2.1.2. Elevation and Three-Dimensional Data

The Weifang coastal protection levee, which is 19.50 km in length (Figure 1), is designed to defend the city against a 100-year storm surge. The average elevation of the levee is approximately 6.5 m, and the highest elevation is 7.5 m.
The coastal terrain around Weifang is high in the south and low in the north; the slope is in the range of 1/10000–1/5000. The highest elevation in the south is 6–7 m. There are tourist areas surrounded by the levee and residential areas on the south where over 100 thousand people live.
Thirteen points were selected along the Weifang levee for measurement of its elevation (Figure 1). The instrument used in this procedure was a STONES-S9 dual-frequency receiver. The accuracy specifications of STONES-S9 include 3 mm ± 1 ppm of static horizontal accuracy and 5 mm ± 1 ppm of static vertical accuracy. The measurements were based on the National Vertical Datum of 1985. The measurement procedure was performed three times at each point and the average was taken as the final measurement. The results of the measurement program are shown in Table 1.
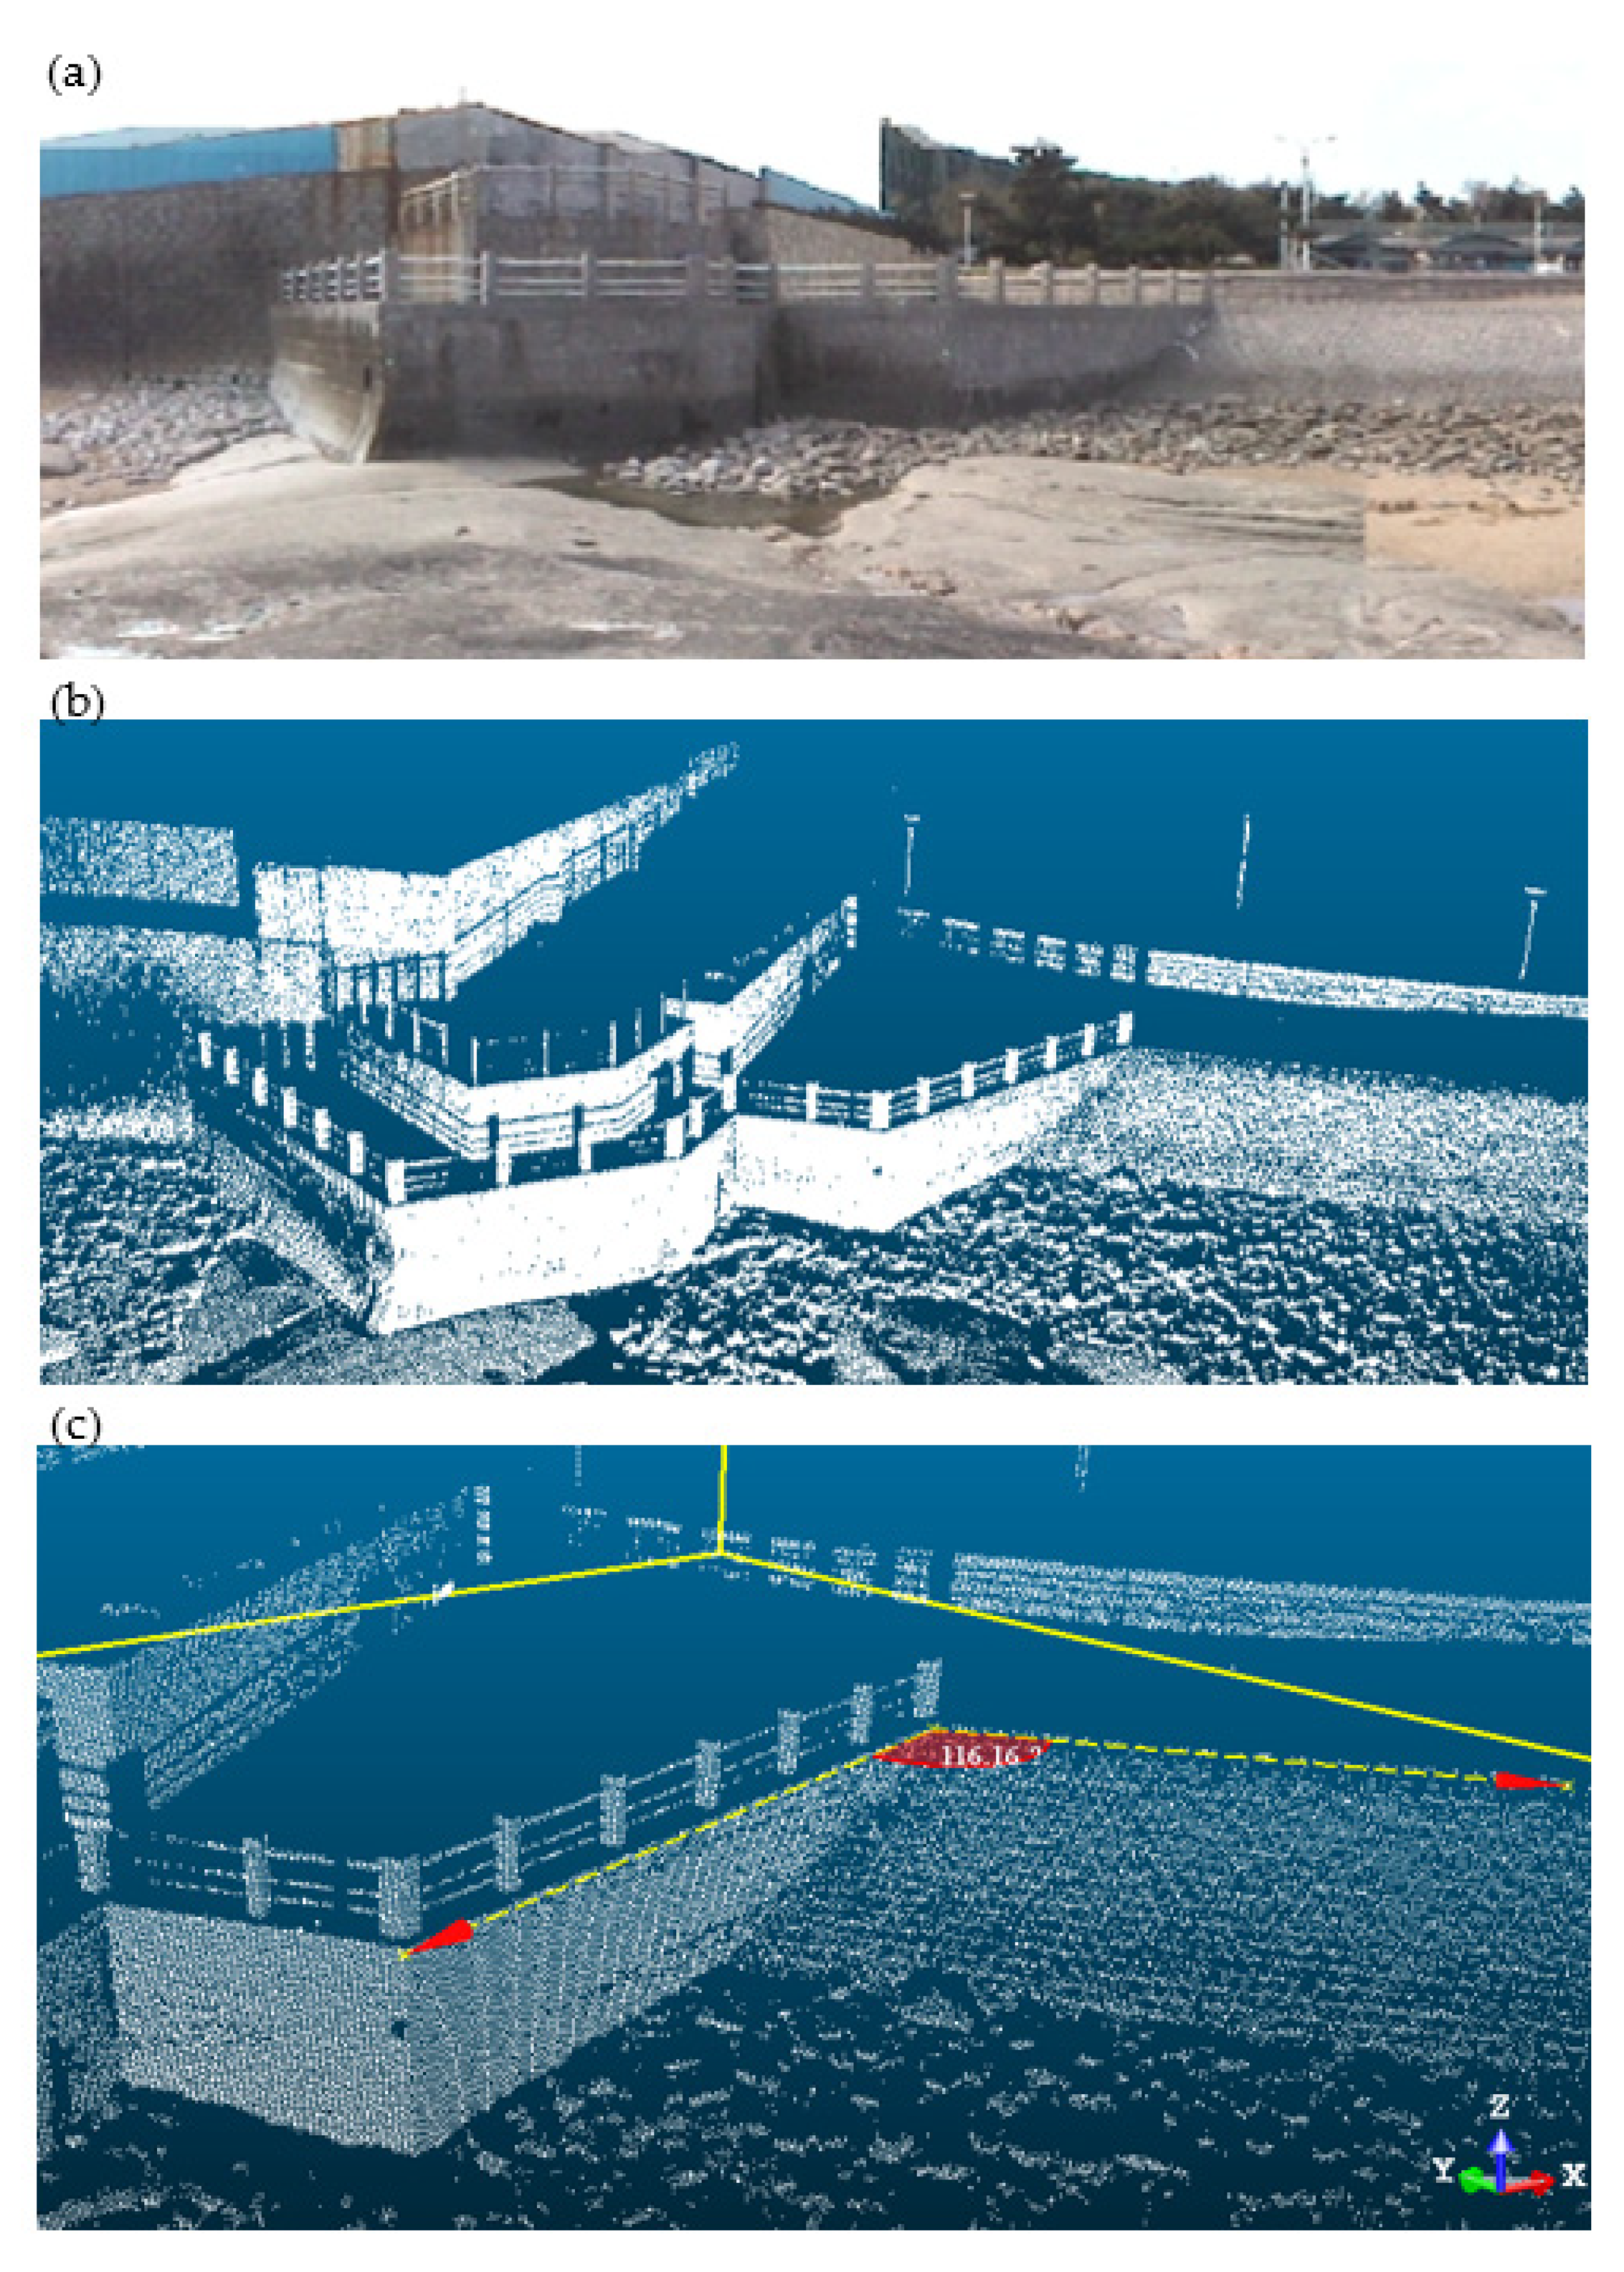
This study also used LiDAR (Trimble GX 200 3D laser scanner) in the central area to obtain photographs and a 3D point cloud of the levee section. The accuracy specifications of Trimble GX 200 include 2–300 m of distance range, ±12” of angle accuracy, ±4 mm of single point accuracy, and ±6 mm of point accuracy at 50 m. The dense point cloud data provided enhanced structural detail, e.g., the slope of the levee, which was used to calculate the wave run-up. Figure 2 shows the 3D point cloud data for Point 11 on the levee.

2.2. Numerical Ocean Models

2.2.1. FVCOM

Storm surges in this study were simulated by adopting the Finite-Volume Community Ocean Model (FVCOM) numerical model [36]. It uses a nonoverlapping unstructured triangular grid in the horizontal to resolve ocean dynamics in complex regions, which was considered highly suitable for the present study area with its irregular complex coastline [37,38,39,40,41,42]. The model was forced by winds, air pressure, and heat fluxes at the sea surface, tidal and nontidal sea levels, as well as temperature and salinity at the lateral open boundaries.
The governing equations consist of the following momentum, continuity, temperature, salinity, and density equations:
u t + u u x + v u y + w u z f v = 1 ρ 0 P x + z ( K m u z ) + F u
v t + u v x + v v y + w v z + f u = 1 ρ 0 P y + z ( K m v z ) + F v
P z = ρ g
u x + v y + w z = 0
θ t + u θ x + v θ y + w θ z = z ( K h θ z ) + F θ
s t + u s x + v s y + w s z = z ( K h s z ) + F s
ρ = ρ ( θ , s ) ,
where x , y , and z are the east, north, and vertical axes of the Cartesian coordinate; u , v , and w are the x , y , z velocity components; θ is the potential temperature; s is the salinity; ρ is the density; P is the pressure; f is the Coriolis parameter; g is the gravitational acceleration; K m is the vertical eddy viscosity coefficient; and K h is the thermal vertical eddy diffusion coefficient. Here, F u , F v , F θ and F s represent the horizontal momentum, thermal, and salt diffusion terms, respectively.
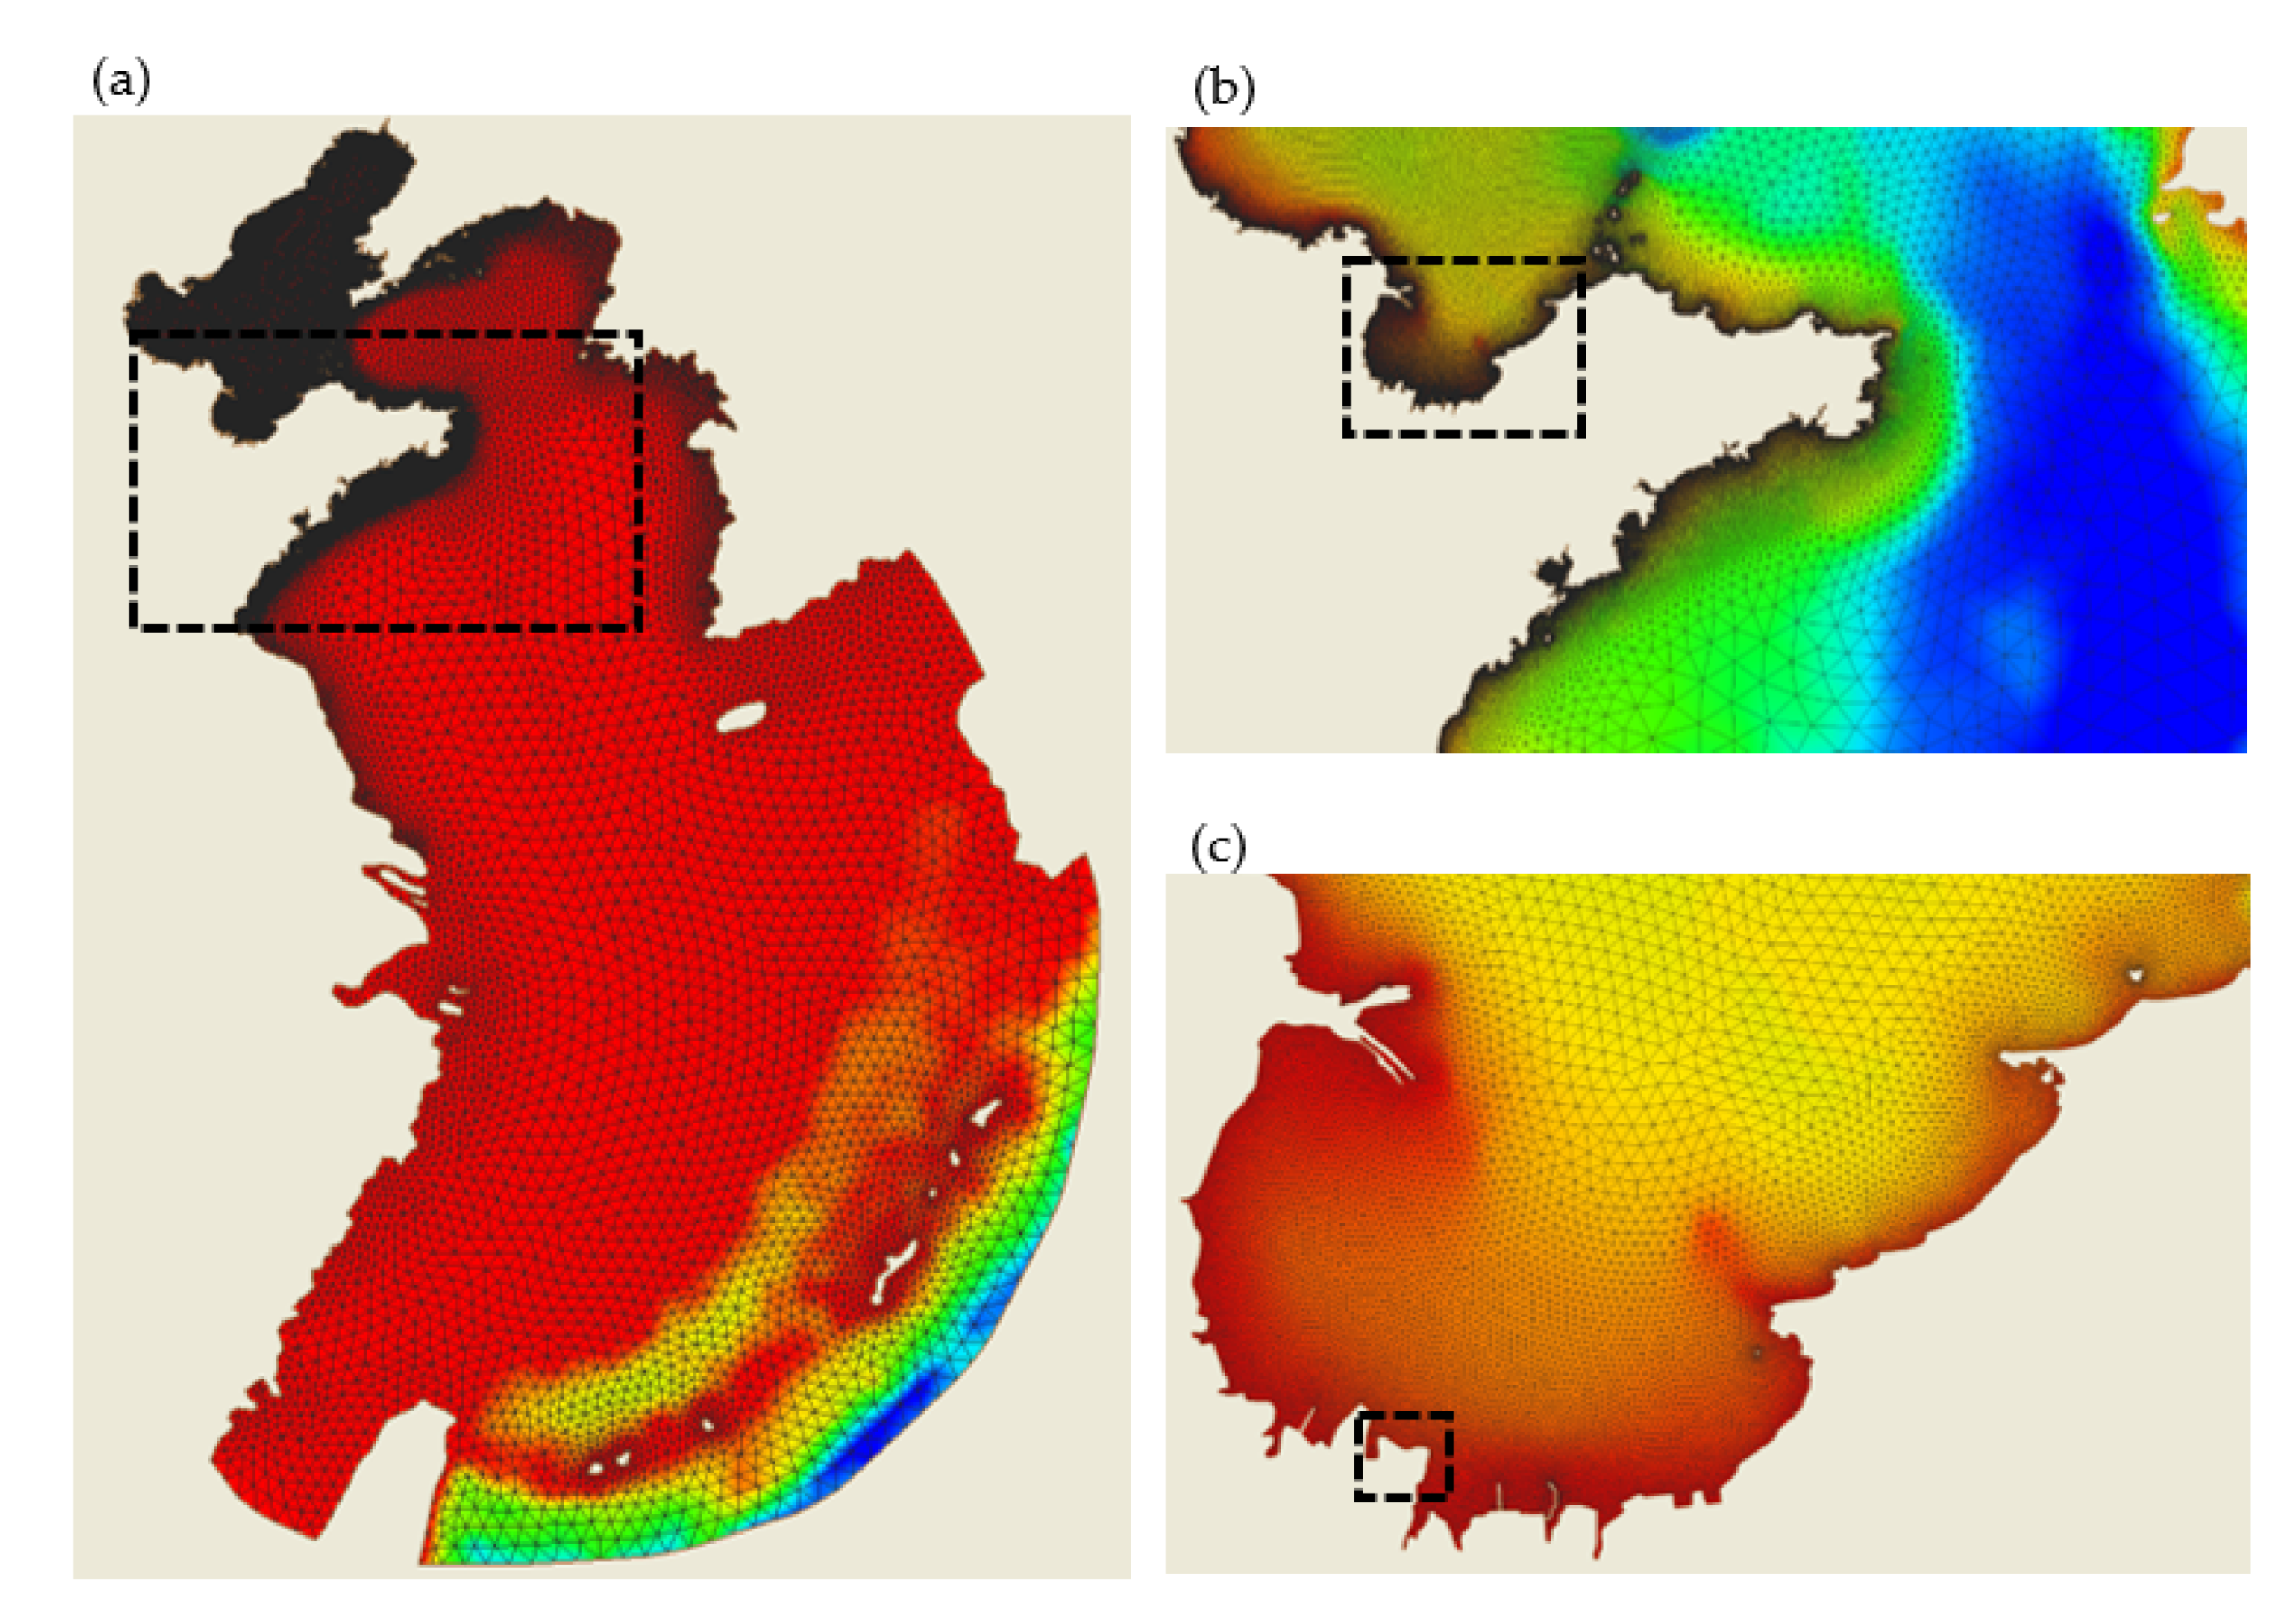
As a storm surge is a sea-wide forcing response, a storm surge along the Weifang coast is not only the response of the sea itself to the local pressure and wind fields but also the combination of seawater influx from the Yellow Sea and local water increase in the coastal area. Therefore, the study domain adopted covered the Bohai Sea, Yellow Sea, and East China Sea (Figure 3). The land boundaries were limited by the coastline and open boundaries were set along the open seas. The unstructured triangular grid of the computational domain consisted of 89,541 nodes and 168,373 elements. It had 30-m resolution for the coastal zone and 20-km resolution near the open sea boundaries. In addition, 10 uniform σ layers were specified in the vertical profiles. Temperature and salinity are estimated and specified to be constant at 18 °C and 35 psu, respectively. Storm surge in this model is only controlled by wind stress. The conditions applied to the open boundaries are a combination of free surface and close the wet and dry grid. The sea level and velocity are initialized with no perturbation and integrated for 24 h before the simulated storm surge occurs.

2.2.2. MIKE 21 PMS

The MIKE 21 PMS (Parabolic Mild-Slope Wave Module) is a linear refraction–diffraction wave model based on a parabolic approximation to the elliptic mild slope equation [43,44,45]. The model considers the effects of refraction and shoaling due to varying depth, diffraction along the perpendicular to the predominant wave direction, and energy dissipation due to bottom friction and wave breaking. The model also accounts for the effects of frequency and directional spreading using linear superposition. The elliptic mild-slope equation can be written as:
· ( C C g φ ) + ( k 2 C C g + i ω W ) φ = 0 ,
where is two-dimensional gradient operator, ( x , y ) ; C ( x , y ) is phase speed; C g ( x , y ) is group velocity; φ ( x , y ) is mean free surface velocity potential, related to the velocity potential φ as φ ( x , y , z , t ) = g ω φ ( x , y ) cosh k ( z + d ) cosh k d e i ω t ; z is water level elevation measured from mean water level upwards; d is water depth; k is wave number, 2 π / L ; W is dissipation term, E d i s s / E ; E d i s s is mean energy dissipation rate per unit time per unit area; E is mean energy per unit area; ω is circular frequency, 2 π f ; L is wave length; and f is frequency.
The basic output data from the model are integral wave parameters such as the root mean square wave height, peak wave period, and mean wave direction. Other output data that could be obtained from the model are radiation stresses and instantaneous surface elevations.
MIKE 21 PMS can be applied to the study of wave propagation in open coastal areas and for computing wave fields in coastal areas with structures (e.g., groynes and detached breakwaters) when backscatter (reflection into the incoming waves) can be neglected and diffraction is predominantly perpendicular to the main wave direction. In this study, MIKE 21 PMS was used to simulate how the wave field changes from the open sea to the Weifang levee, which provided the input variable for the wave run-up calculation.

2.3. Designed Levee Height

According to the “Code for design of levee project (GB 50286-2013)” and the sea level rise caused by climate change, the Weifang levee is designed to defend against a 100-year storm surge and the designed levee height is calculated as follows:
Z D = T + R + S + h ,
where Z D is the designed levee height, T is the designed tidal level for the 100-year period, R is wave run-up for the 50-year period, S is the security heightened value, and h is the predicted sea level rise. The security heightened value is 0.50 m for a 100-year storm surge and the sea level rise can be predicted based on other studies [29]. The main problem to resolve in this study was how to best calculate the designed tidal level and wave run-up with only limited observations and numerical model outputs.

3. Results

3.1. Storm Surge Simulation

3.1.1. Selected Storm Surge Cases

To obtain accurate annual maxima at each measuring point, the storm surge cases that could have caused severe storm surges within the area were first selected for the simulation. The data used for the selection comprised tidal level data and storm surge data recorded at adjacent long-term tide gauge stations. Overall, 166 storm surge cases during 1982–2015 were selected (Table 2) and simulated using FVCOM. According to “Code of Hydrology for Sea Harbour” (JTS 145-2-2013), The simulation results were used to calculate the designed tidal level (100-year recurrence period) with the Generalized Extreme Value Distribution (actually EV1 here) [46].

3.1.2. Validation of the Storm Surge Model

To validate the reliability of the numerical model, we compared the numerical results with observations from tide gauge stations. The Weifang station was built in 2003 and four typical storm surges are selected for discussion here. The first two cases were caused by Typhoon Winnie during 19–20 August 1997 and a strong cold front during 3–5 March 2007, when the Weifang station was not built. The third and fourth cases were caused by a strong cold front during 9–11 December 2010 and Typhoon Damrey during 2–4 August 2012, when the observation from Weifang can be used for comparison.
To evaluate the model solutions quantitatively, the root mean square deviation ( R M S D ) was calculated as follows:
R M S D = [ i = 1 n ( X m X o ) 2 / n ] 1 / 2 ,
where n is the number of the variable values, X m represents the model results, and X o represents the observed values.
Time series of the detided sea level from the four simulations are plotted in Figure 4. In comparison with the observations at the tide gauge stations, the model shows good simulation skill. During the third and fourth cases (Figure 4i–p), the model output of Weifang closely matches the magnitude and moment of the maximum detided sea level, and the RMSD value is lower than 35 cm. During the first and second cases (Figure 4a–h), the model lines also fit well with the observation for the surrounding stations (i.e., Longkou, Penglai, and Zhifudao), and the numerical model produced a reasonable simulation for Weifang. The maximum water level rise simulated at Weifang for the 1997 and 2007 storm surge events was 127 and 176 cm, respectively. The result shows that the model can be used for extending the database.

3.1.3. FVCOM Simulation

In this study, 166 storm surge cases were numerically simulated and astronomical tidal levels were predicted. The simulations were analyzed to obtain the highest water level values at each measuring point for each storm surge case. Finally, the maximum value for each year was selected among these maximum water level values (Table 3).

3.1.4. Results of Designed Tidal Level for the 100-Year Period

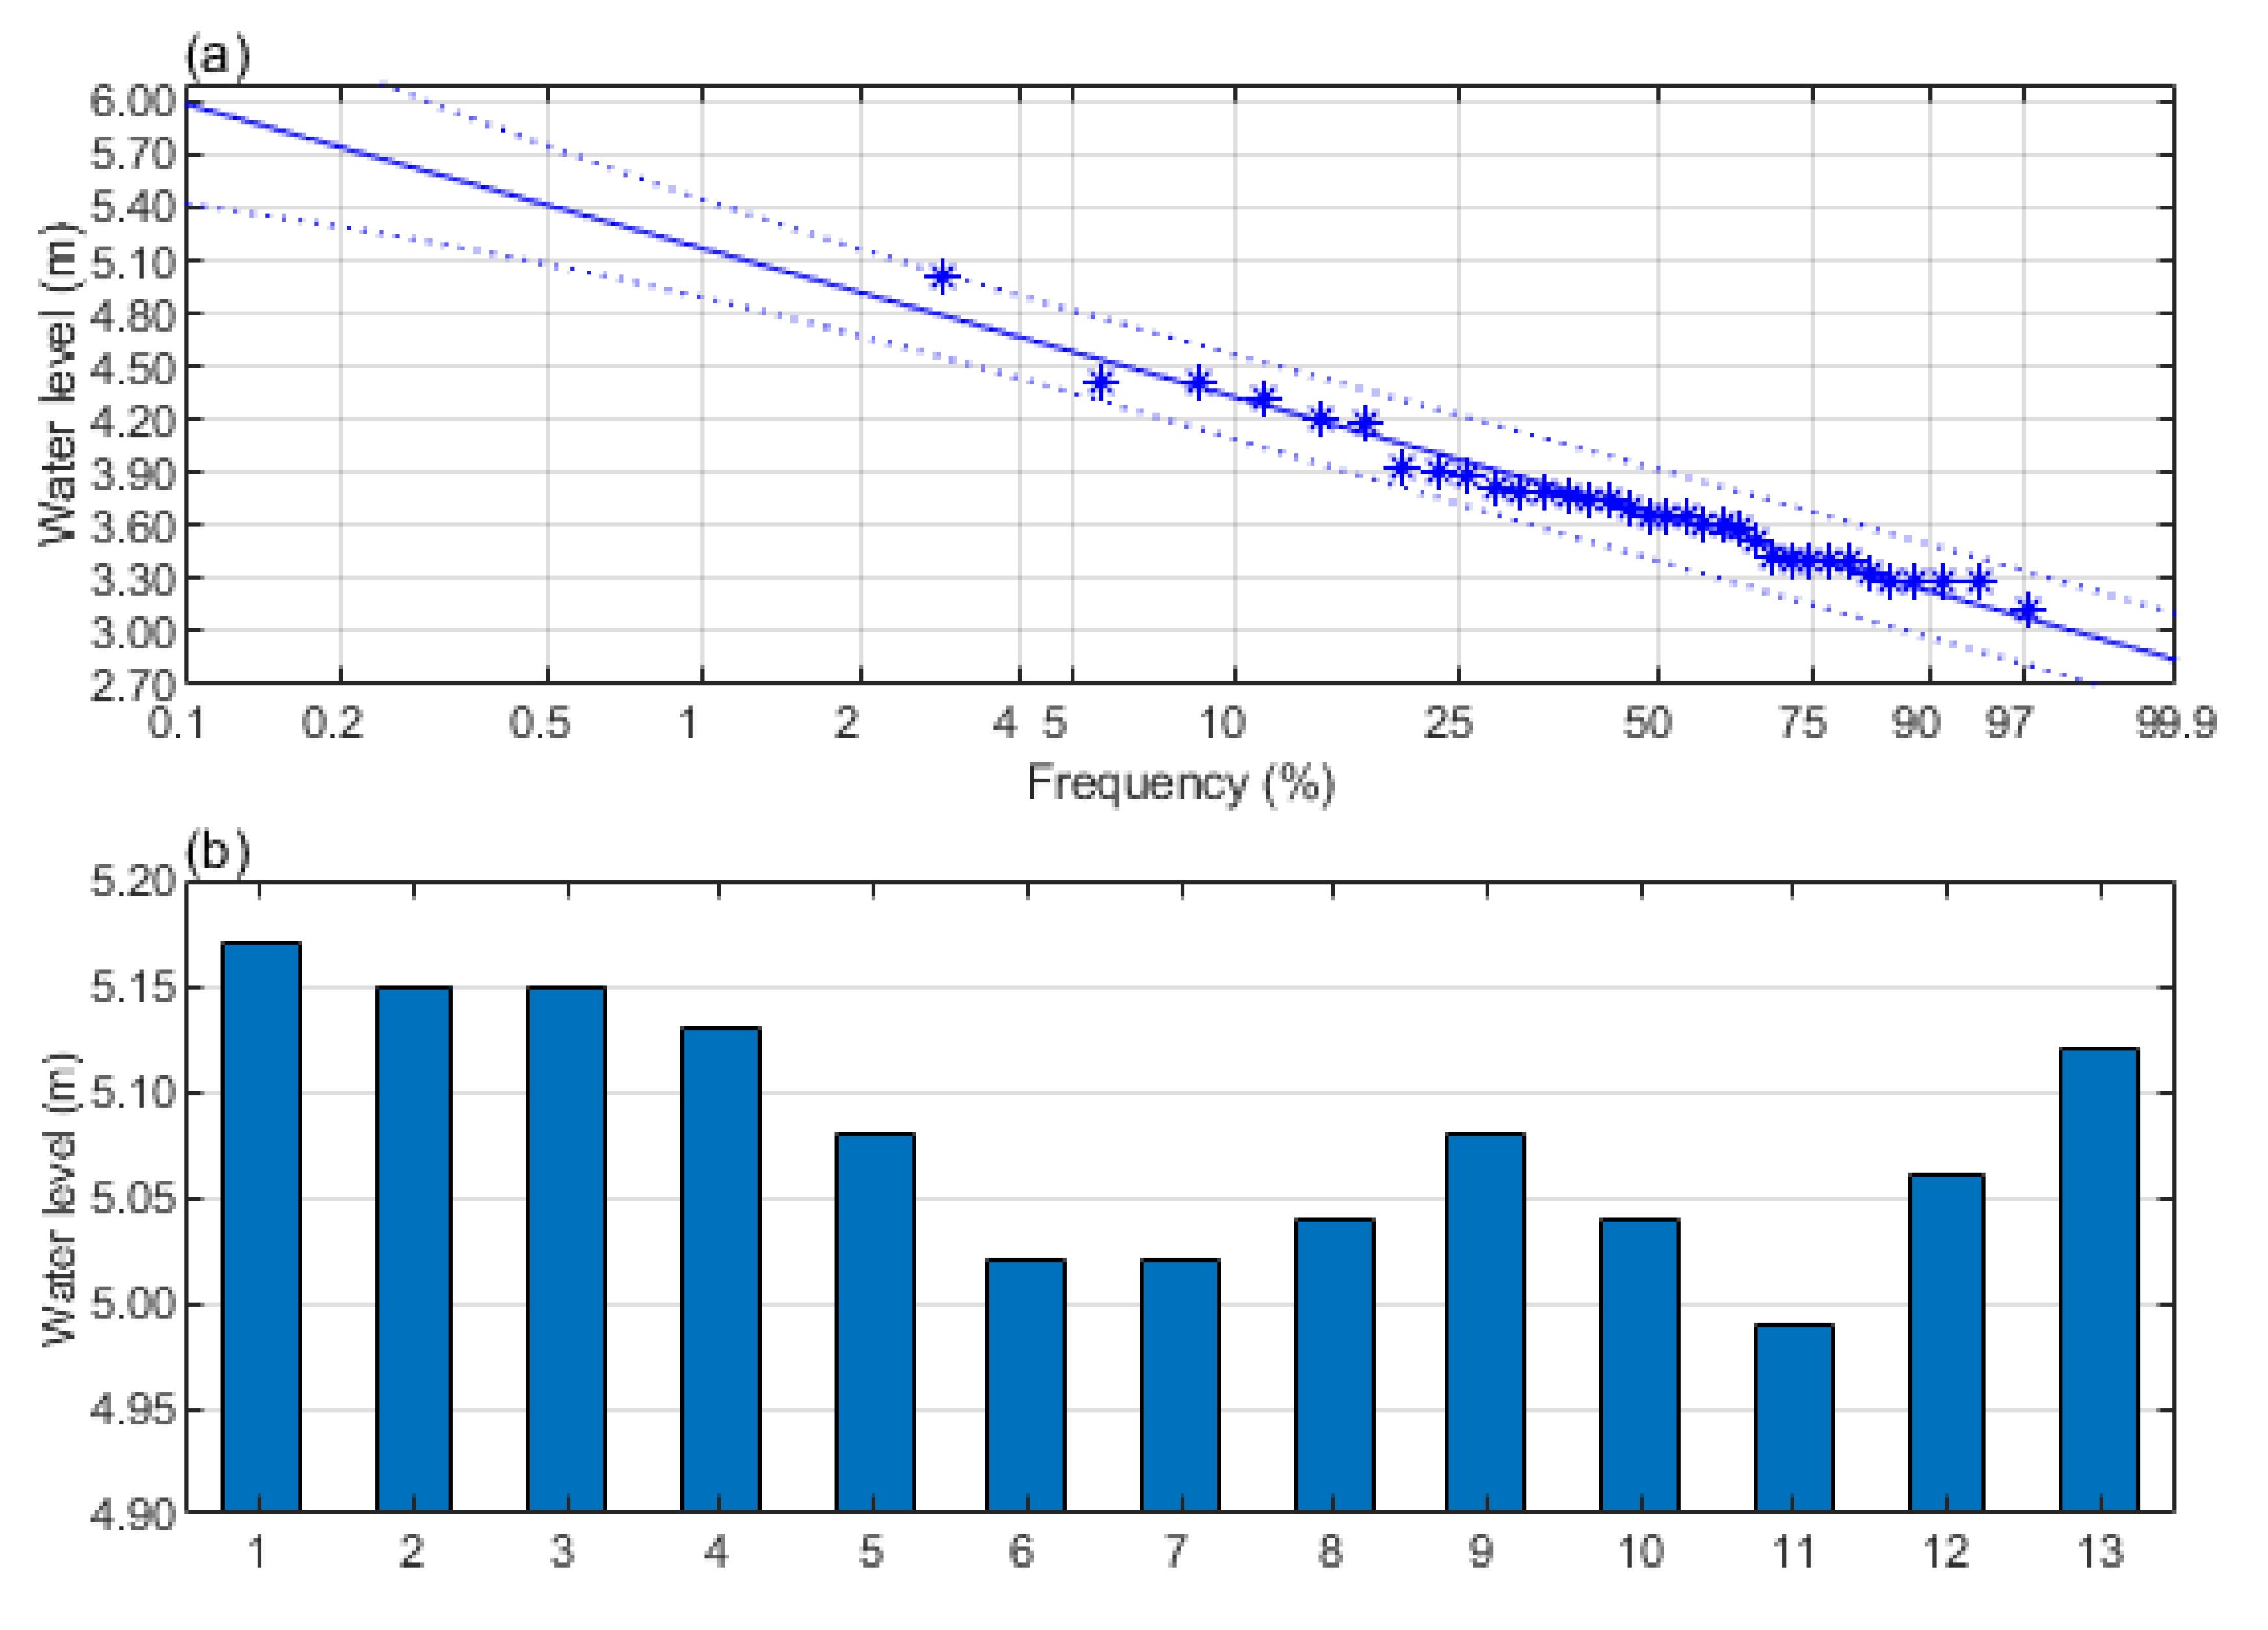
The maximum water levels during 1982–2015 are fitted with the EV1 distribution to calculate the water levels for different return periods. For each measuring point, the 34 maximum water levels during 1982–2015 were sorted, and a curve was fitted with the EV1 distribution. The scale and location parameters are shown in Table 4 and the fitting result of Point 1 is plotted as an example in Figure 5a. The 95% confidence intervals are also plotted to diagnose the fitting result. In Figure 5a, all the 34 maximum water levels during 1982–2015 are close to the fitted curve and plotted between the dashed lines of the 95% confidence intervals. The dot on the fitted curve at frequency = 1% shows the value of the tidal level for the 100-year period.
The results of the tidal level for the 100-year period for all 13 points are illustrated in Figure 5b. The tidal levels at the 13 points are reasonably close, i.e., the differences are less than 0.20 m. The highest tidal level is at Point 1, located at the west gulf of the levee. The lower tidal levels are found around Point 6 and Point 11, which are located at the northwestern and northeastern capes of the levee, respectively.

3.2. Wave Simulation

3.2.1. MIKE 21 PMS Simulation

This study used numerical simulations to hindcast the effective wave height in the Bohai Sea for the 34-year period of 1982–2015. The annual maxima of the effective wave height in the region were calculated and Pearson III was used to obtain the effective wave heights for different recurrence periods according to “Code of Hydrology for Sea Harbour” (JTS 145-2-2013). The effective wave heights were simulated for transfer to the Weifang levee using the MIKE 21 PMS model, which produced the values at the 13 measuring points.
The MIKE 21 PMS model was used to obtain wave heights for the 50-year period. Wave height observation is only available from the buoys in the Laizhou Bay, instead of the coastal areas, so there is no validation for wave simulation in this section. According to observational data from buoys in Laizhou Bay, the wave height for the 50-year period is 3.34 m in the open sea. Therefore, in the MIKE 21 PMS model, a 3.34-m wave was simulated to transfer from the open sea to the levee. A constant wave source is placed along the northern boundary of the simulation area. For the wave source, the wave height is 3.34 m, wave directions and wave period are N (8.20 s), NE (8.22 s), and NNE (9.27 s), respectively.
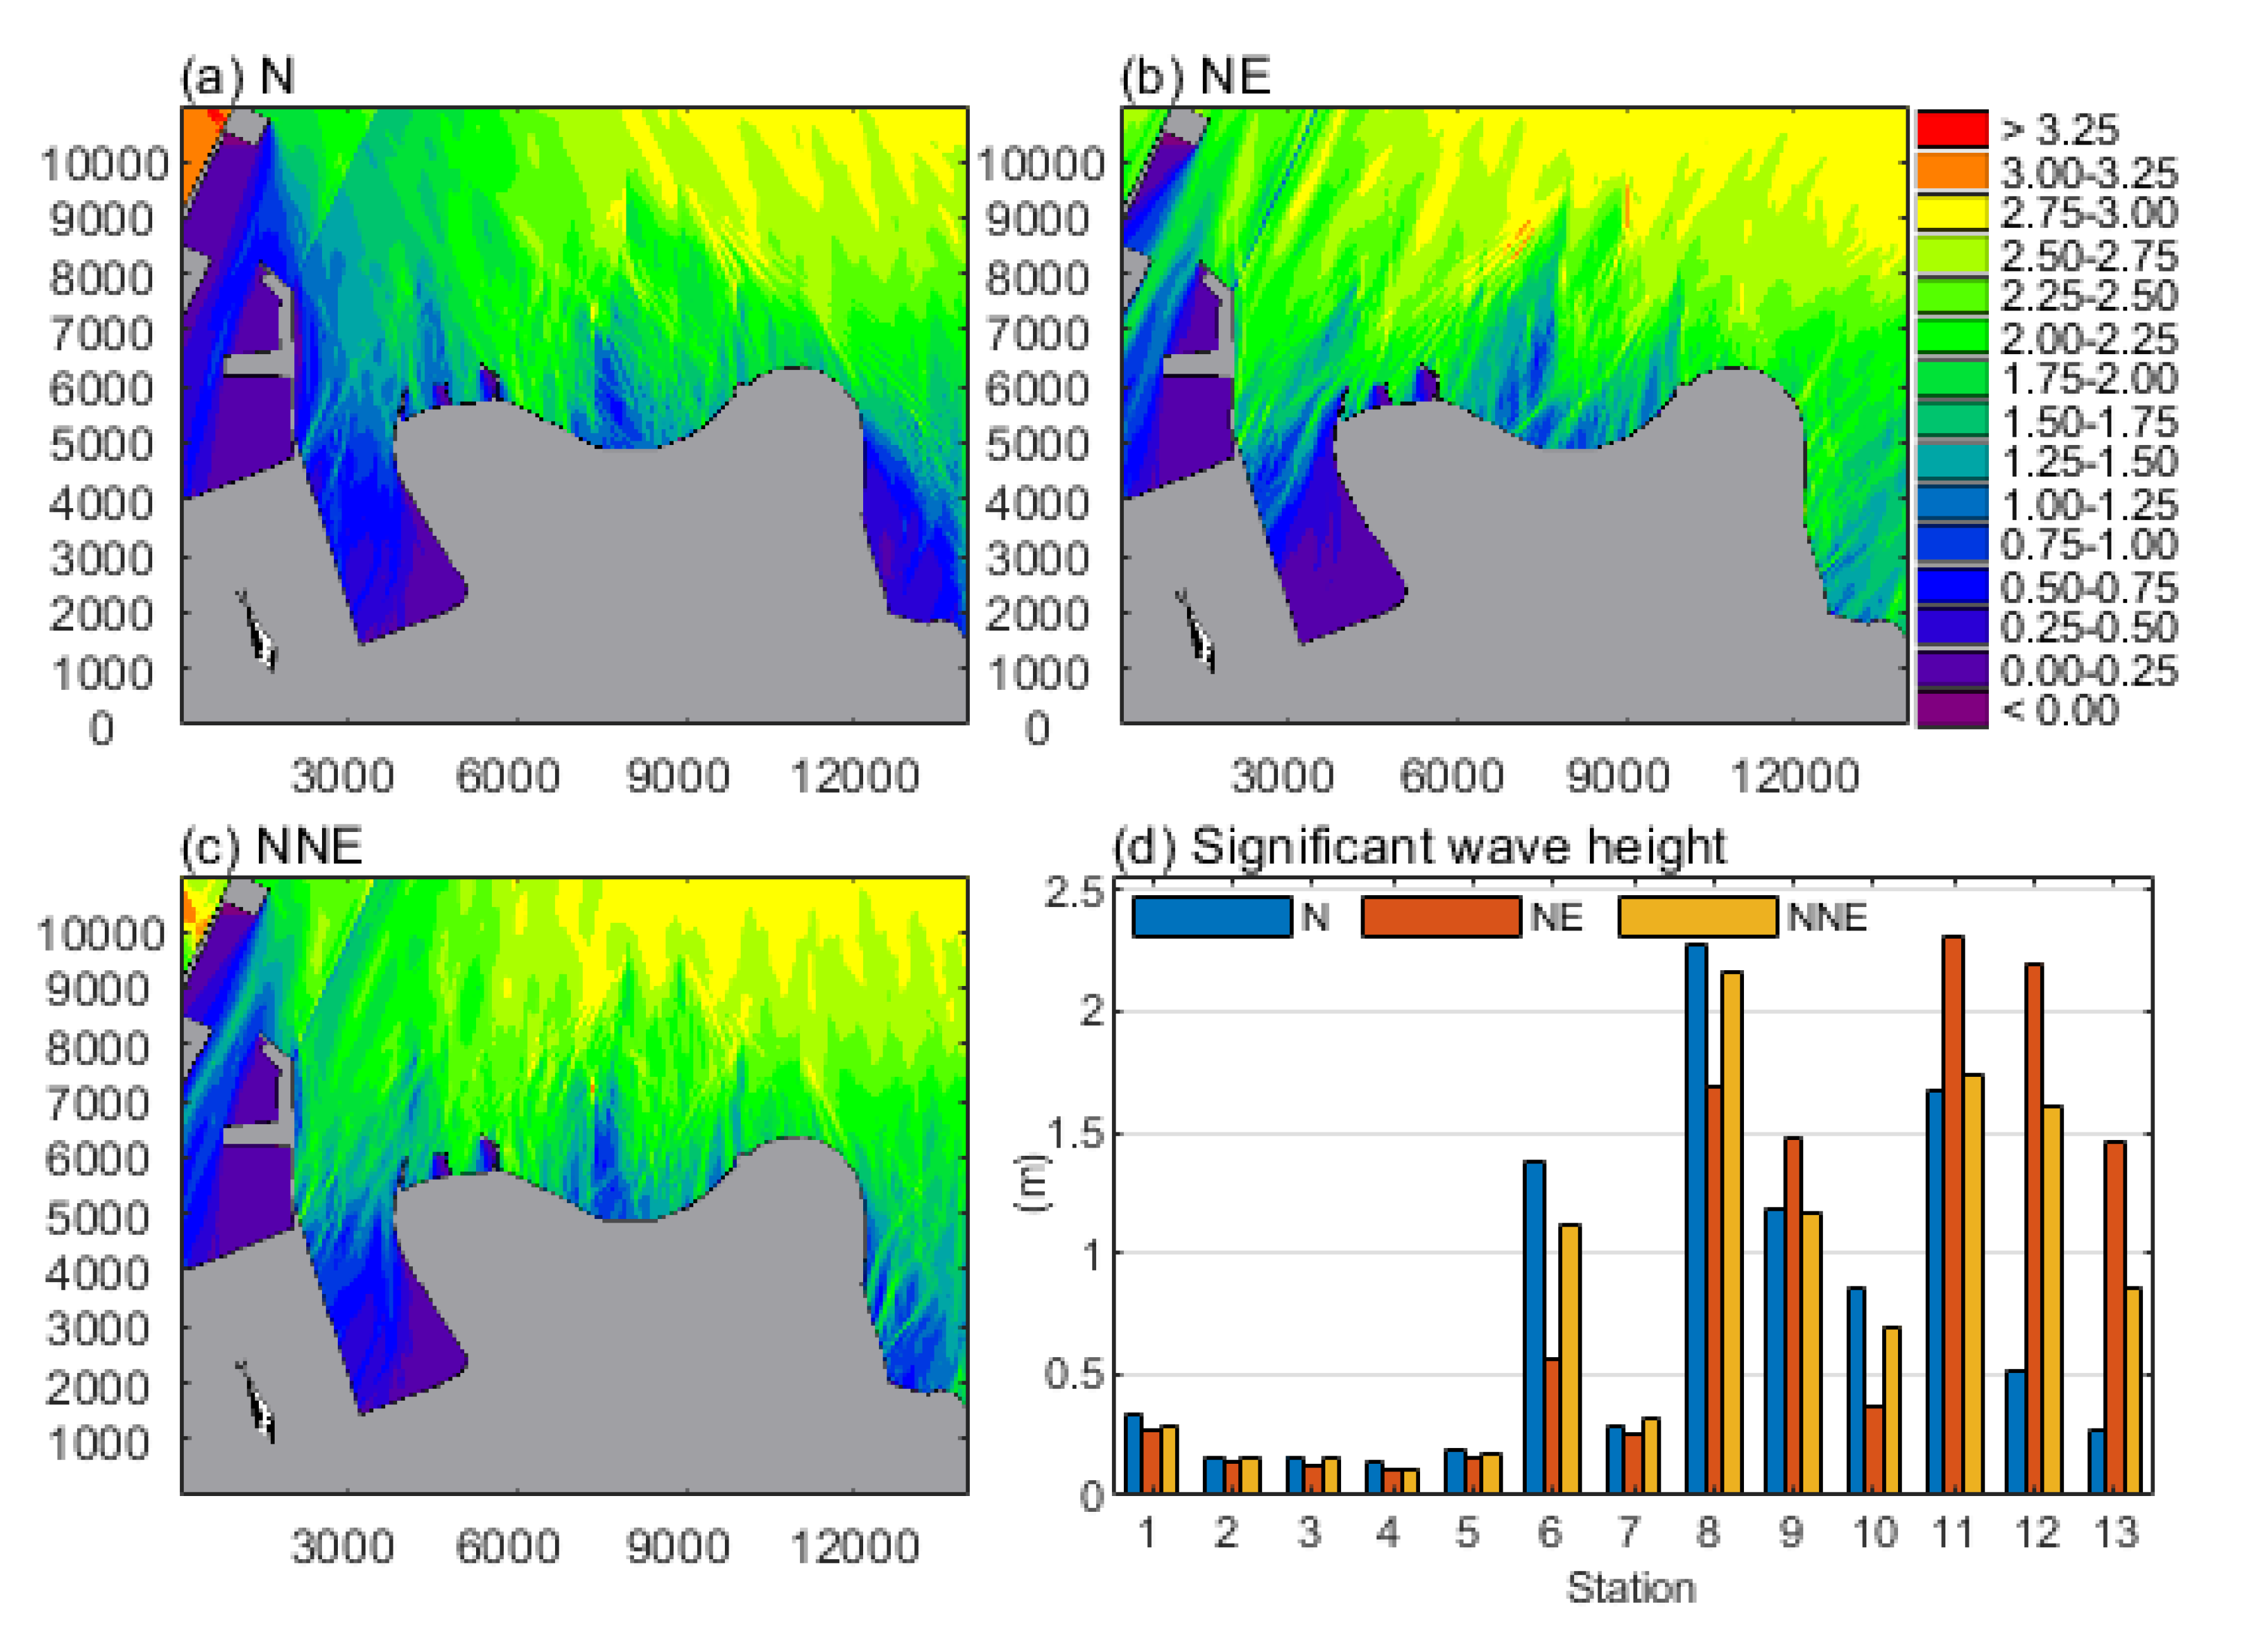
The horizontal resolution of the model was set to 5.0 m to meet the requirements of precision. The model is initialized with no wave perturbation and integrated for 12 h to get stable. The results are shown in Figure 6.
The patterns of wave transfer are shown in Figure 6a–c, and Figure 6d shows the significant wave height value at the 13 points. It is evident that the wave height is much lower from Point 1 to Point 5 because of blocking by the levee. The wave height increases between Point 6 and Point 13 because the waves transfer directly from the open sea to the levee and are converged at the capes. The maximum wave height is at Point 8 for waves from the N and NNE and at Point 11 for waves from the NE.

3.2.2. Results of Designed Wave Run-Up for the 50-Year Period

According to “Code for design of levee project (GB 50286-2013),” the wave run-up was calculated as:
R = K p K r 1 + m 2 H ¯ ,
where R is wave run-up; K p is an empirical coefficient defined as V ¯ / g d , where V ¯ is the averaged wind speed, g is acceleration of gravity, and d is water depth before the levee; K r is the roughness related to the building materials of the levee; m is the slope of the levee; and H ¯ is the vertical component of wave height toward the levee.
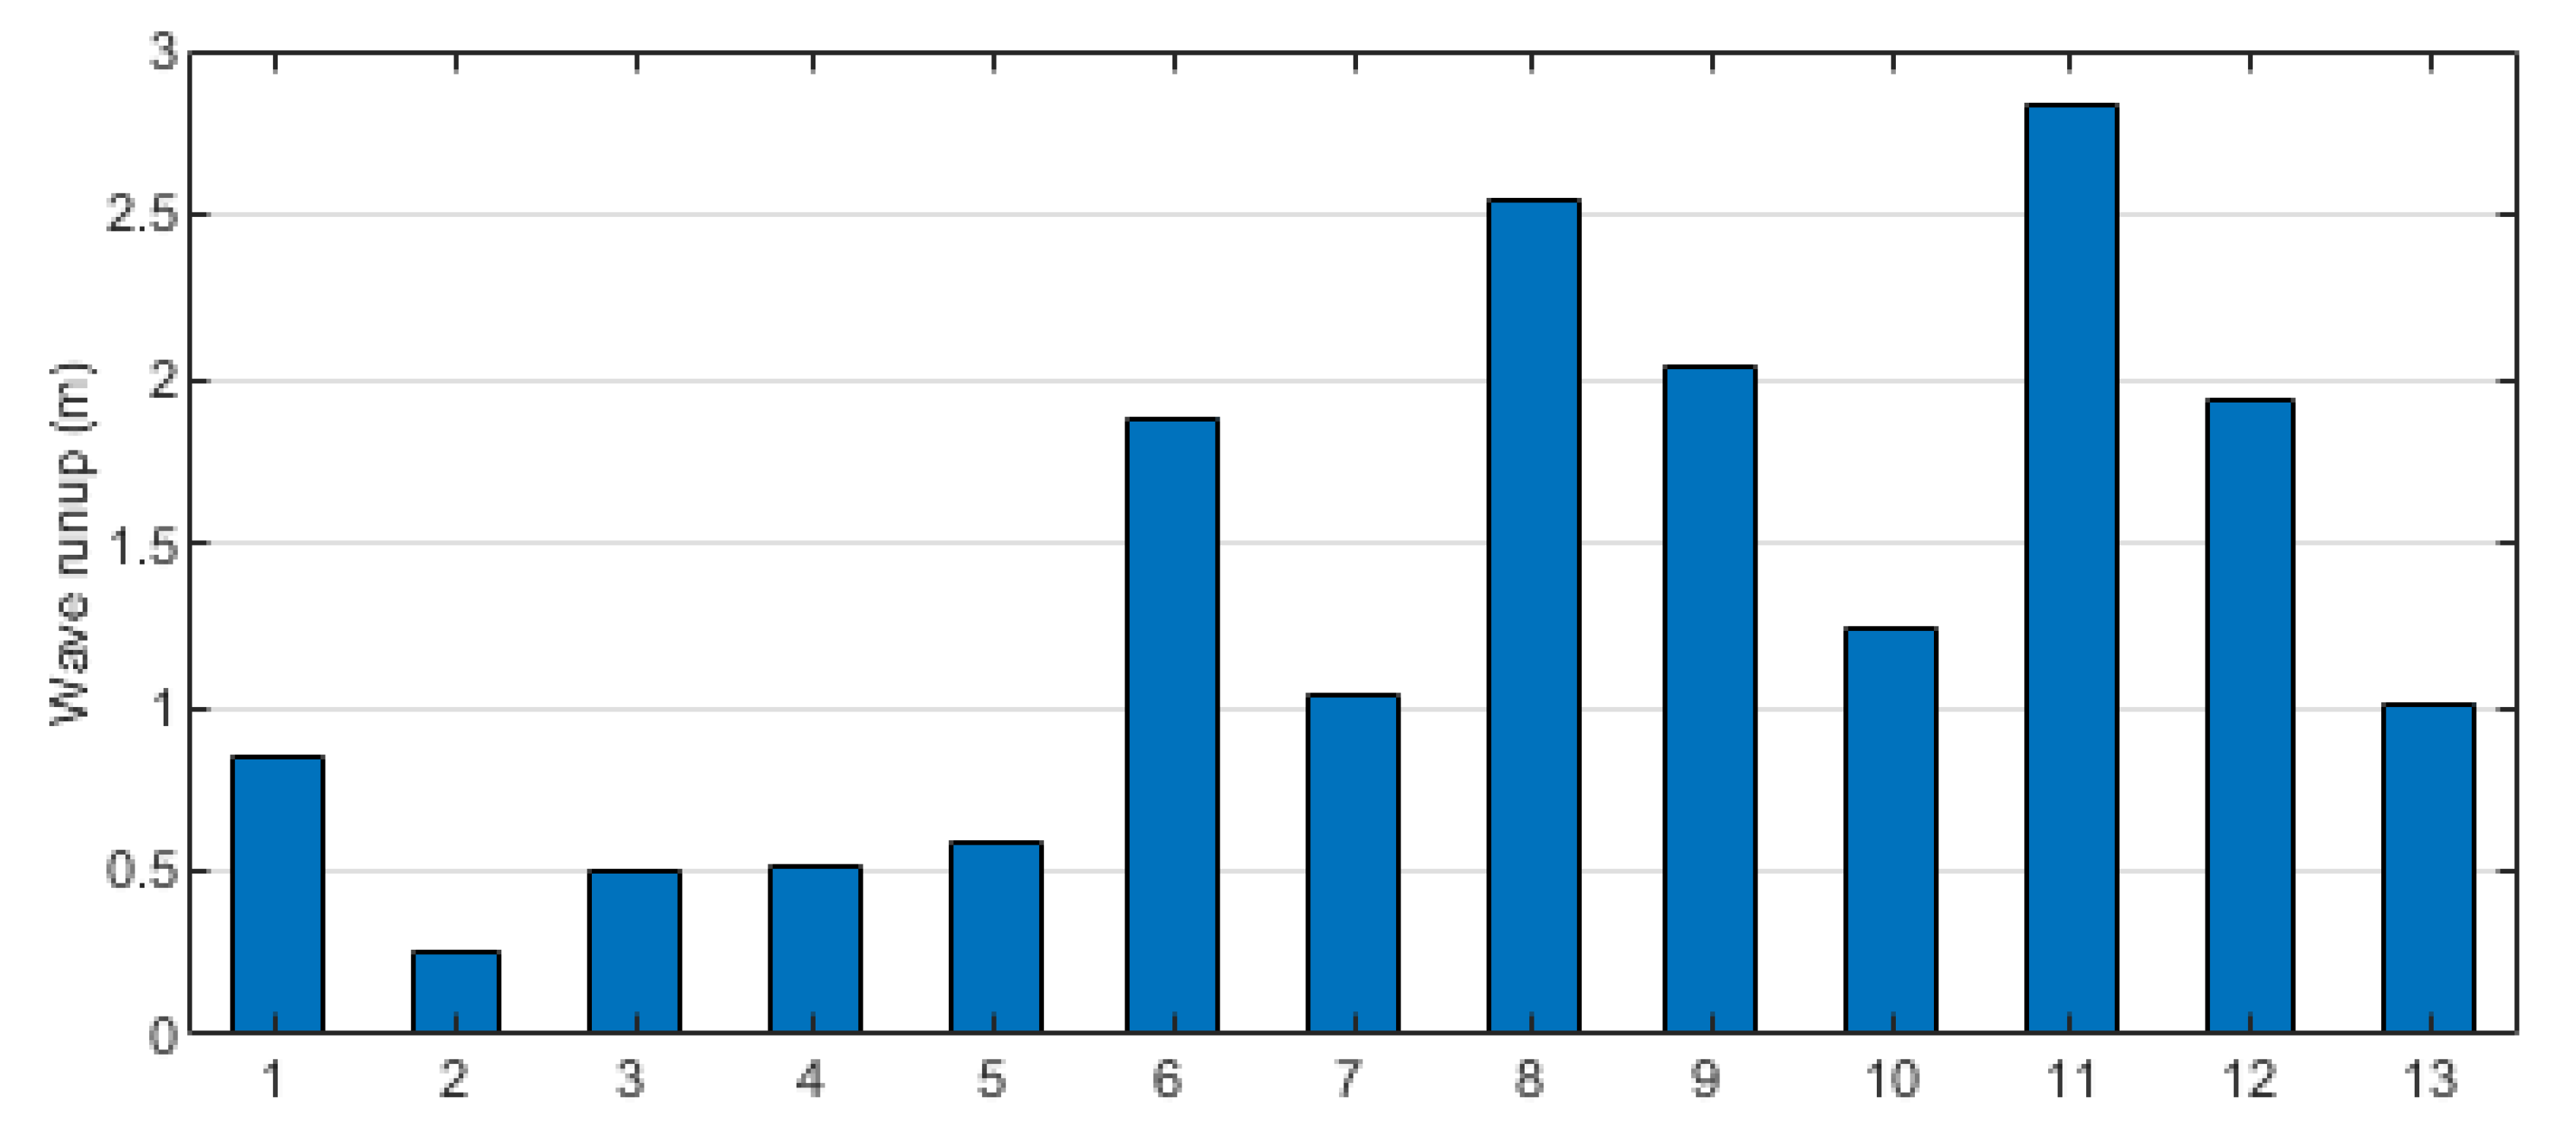
Based on Equation (11), wave run-up was calculated at the 13 measuring points using the wave heights simulated by the MIKE 21 PMS model and the slope from Section 2.1.2. Wave run-up in three directions was considered and the largest was selected as the final value. The results show that wave run-up has positive correlation with wave height along the levee (Figure 7). The highest wave run-up (2.83 m) is at the northeastern cape of the levee (Point 11), and the lowest wave run-up (0.25 m) is at the bottom of the gulf (Point 2).

3.3. Hazard Assessment of the Weifang Levee

The effects of climate change mean that sea level rise should be considered in a hazard assessment of the Weifang levee. Based on historical observations, the predicted sea level rise along the Weifang coast is listed in Table 5 [29]. As the Weifang levee is designed to defend against a 100-year storm surge, and the sea level rise was set at 0.30 m.
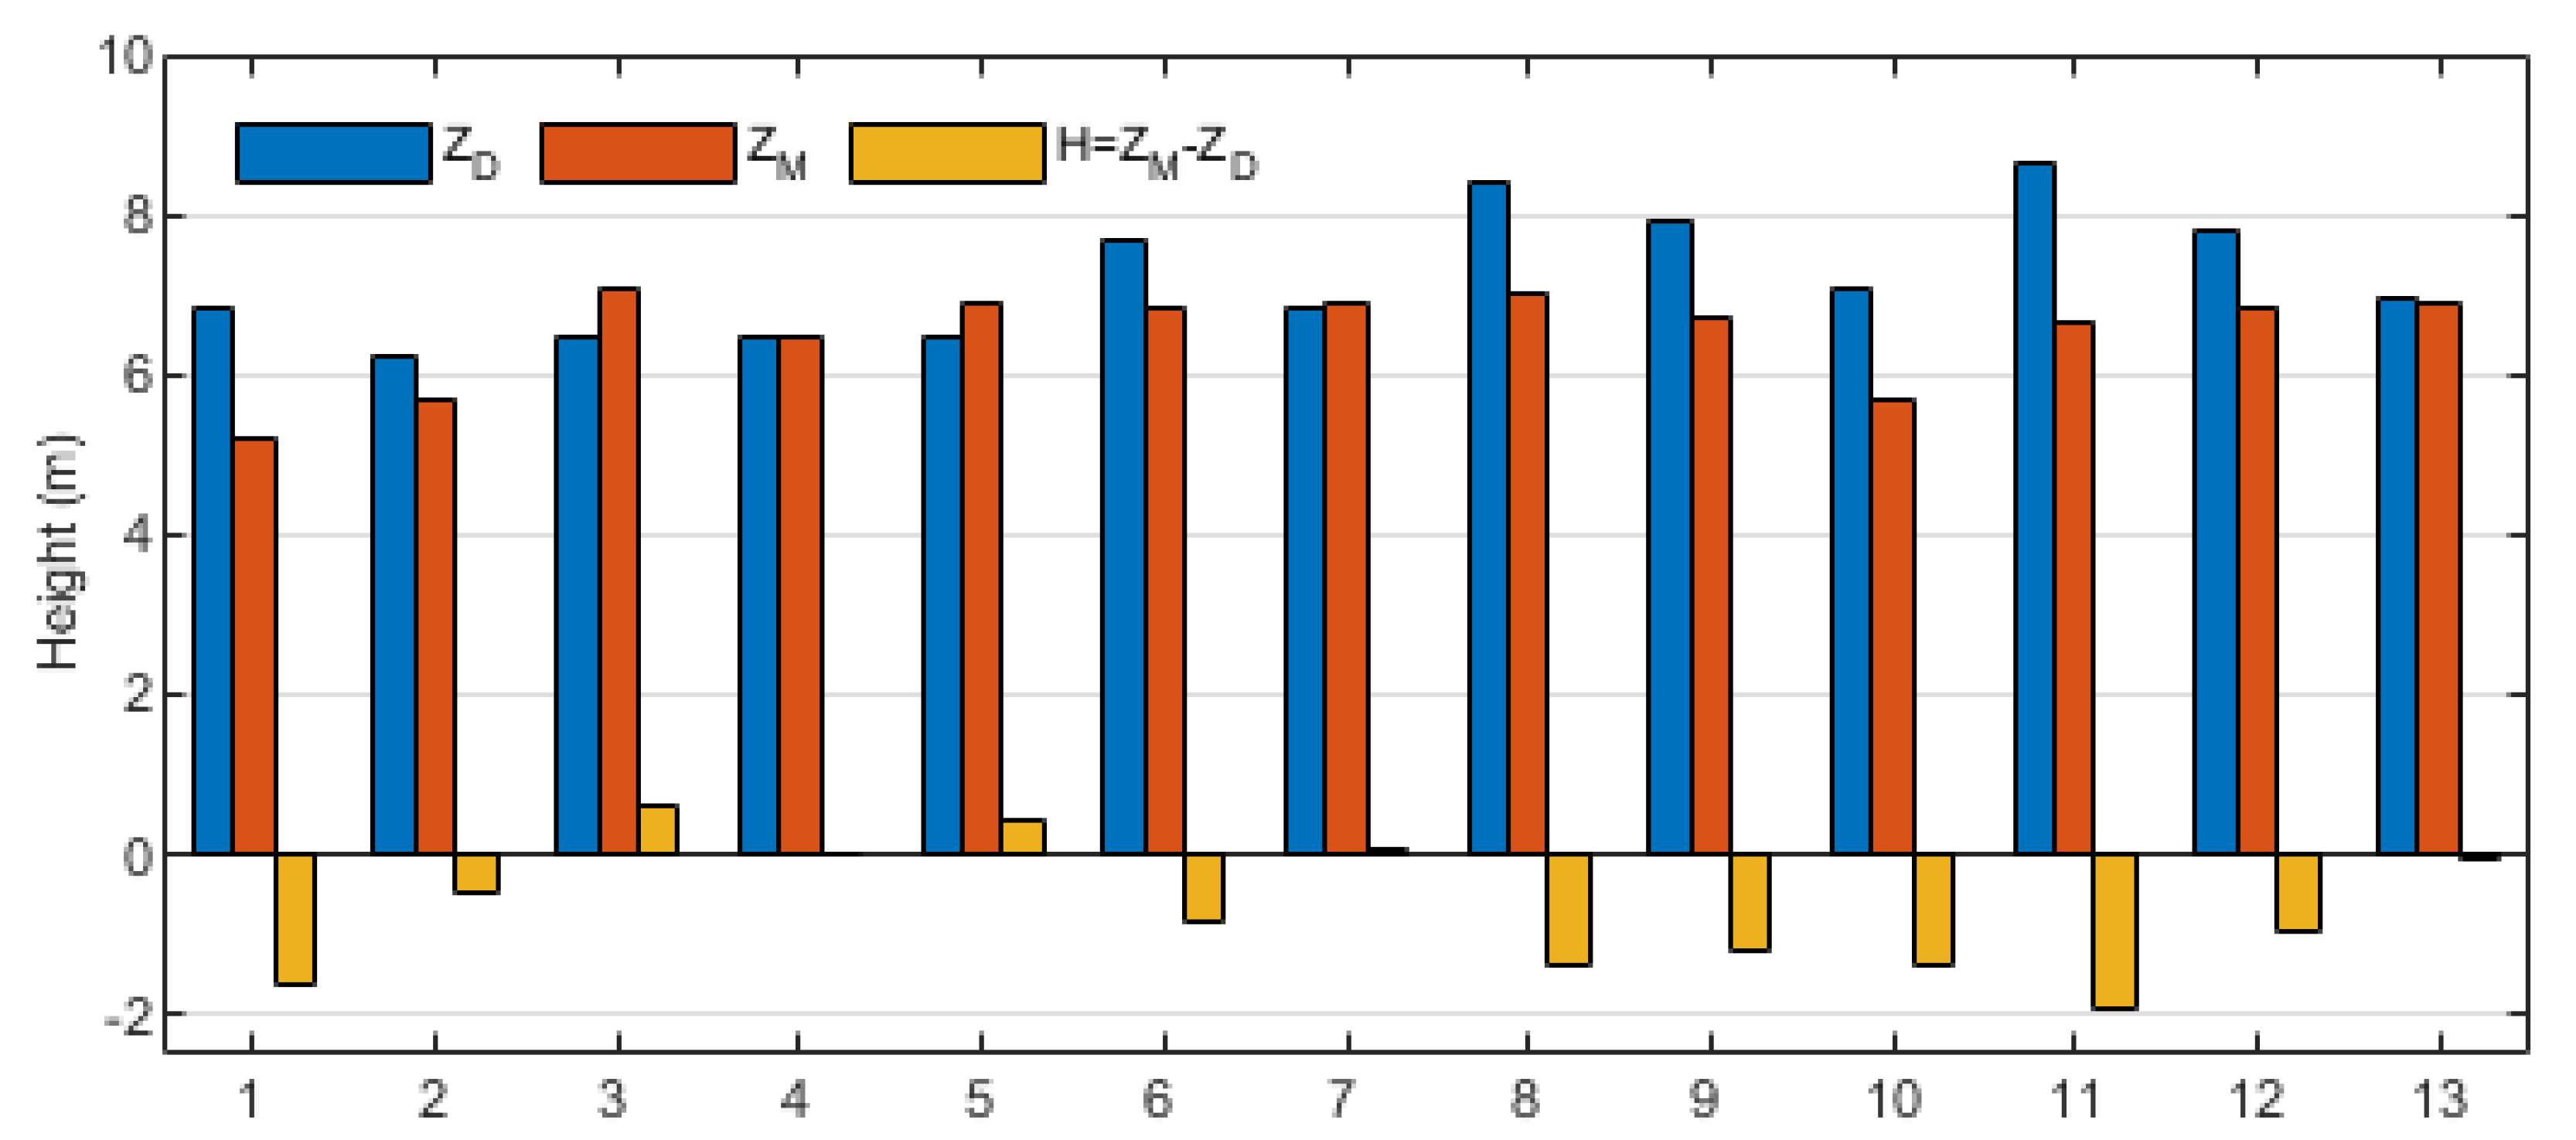
The designed levee height is the sum of the designed tidal level for the 100-year period, designed wave run-up for the 50-year period, security heightened value, and predicted sea level rise in 2110. The results of the designed levee height are shown in Table 6 and illustrated in Figure 8. The change in designed wave run-up is greater than the change in designed tidal level. Therefore, the distribution of the designed levee height is similar to that of wave run-up, and the maximum designed levee height is at Point 11.
The difference between the designed and measured levee height indicates the storm surge hazard. If the designed height is larger than the measured height, the levee is safe; otherwise, the levee is in danger from a 100-year storm surge. The orange bars in Figure 8 show that most parts of the levee (i.e., 9 of the 13 points) do not meet the requirements for storm surge control, and therefore, repair and strengthening of the levee are required.

4. Discussion

This study used LiDAR to obtain 3D point cloud data and the structure of the Weifang levee. Unlike the traditional point measurement method, ground-based LiDAR technology uses shape measurement to acquire a large amount of information about the measured target. The 3D point cloud meets the need for high-precision reverse engineering of 3D point data volumes. As a high-precision sensing technology, the scanning device can examine complex environments and sites and directly transfer various data of complex and irregular objects into a computer for rapid reconstruction of a 3D model of the scanned object. At the same time, the 3D LiDAR point cloud data contain not only spatial information about the target but also information about the target’s reflection intensity and color/grayscale information. Through postprocessing of 3D point cloud data, analysis, measurement, simulation, and other functions can be realized.
Hazard assessment to a levee posed by a storm surge requires long-term and high-resolution observations; however, the construction of suitable observation systems is always delayed relative to the expansion of rapidly developing cities. Furthermore, the rapidly increasing population and expanding economic infrastructure of rapidly developing cities highlight the necessity for hazard assessment in relation to urban planning. Numerical models are effective in addressing this need because they can provide high-quality data with limited observations. Therefore, the method used in this study could be adapted for use in other cities to resolve similar problems.
The designed levee height consists of four parts: tidal level, wave run-up, security heightened value, and sea level rise. The result shows that the tidal level has the largest weight and makes up averagely 71.4% of designed levee height. The tidal levels vary slightly between different measuring points and the difference between the highest and the lowest is only 0.18 m. So, the tidal level rise caused by storm surge is the major factor that should be considered when calculating the designed levee height. In addition, for every part of the coast, the levee should be built with similar height for defending the storm surge.
Although wave run-up makes up averagely only 17.4% of designed levee height, the values vary dramatically along the levee. The highest value is 2.83 m, while the lowest is only 0.25 m. Because the variation of wave run-up is much larger than that of tidal level rise, the designed levee height, as the sum of four parts, shows the similar distribution to that of wave run-up. Besides the flood caused by storm surge, coastal erosion caused by waves is also severe, and wave attenuators are needed for areas like the cape coast.
It is interesting that the lower tidal level is always coupled with the higher wave run-up, and the correlation coefficient between the two values is −0.75. The reason is that the wave refraction and water movement are reverse along the levee. For wave refraction, if waves encounter the gulf part, waves will start to refract around it, converging and focusing their energy at the center of the obstruction, which creates higher waves and wave run-up. Conversely, if waves encounter the cape part, waves start to bend outwards, diverging energy away from the levee and reducing the wave height and wave run-up. But it is contrary for the level rise by storm surge. Under the influence of wind stress, the water is transferred and moving from the cape part to the gulf part, which makes the water level higher at the gulf, while lower at the cape.
The hazard assessment method used in this paper only considers the levee height. The difference between the designed and measured levee heights demonstrates whether the levee faces the threat from storm surges. But other factors, e.g., construction materials, lifespan, and maintenance, also play a key role in defending storm surges, which are not mentioned above. So, the assessment in this paper can be considered as a primary work and should be done first. If the measured height of a levee is lower than the designed value, a severe storm surge will take torrents of water over the levee and into the urban area and cause huge loss.

5. Conclusions

The study assessed the hazard to the Weifang levee posed by storm surges. As Weifang is a rapidly developing city, it lacks records of long-term observations suitable for levee hazard assessment. Therefore, this study used numerical models to reconstruct relevant high-resolution data. LiDAR data is also used here to measure necessary 3D parameters of the levee. Storm surge tidal levels for the 100-year period and wave run-up for the 50-year period were calculated based on the results from numerical simulations using the FVCOM and MIKE 21 PMS ocean numerical models. The designed levee height is the sum of the storm surge tidal level, wave run-up, security heightened value, and predicted sea level rise in 2110. The difference between designed and measured levee height for the levee shows whether the levee is safe or not.
The results show that the storm surge tidal level for the 100-year period is high at the gulf of the levee and low at the cape, while the wave run-up for the 50-year period is opposite. The final designed levee height shows higher value on the northern part, the place directly suffering the wave transferred by the storm. In addition, the designed levee height is 1 m higher than the measured value, facing the greatest threat from storm surge and requiring urgent repair and strengthening.
The findings of this work will enhance the marine disaster prevention capacity of the region and could help reduce economic losses associated with marine-related disasters. The results could also provide support for future work on disaster prevention in the field of coastal marine engineering.

Author Contributions

Conceptualization, Q.L. and C.R.; methodology, J.G.; FVCOM simulation, J.L. and X.L.; MIKE 21 PMS simulation, Z.Y. and D.F.; data analysis, S.Z.; writing—original draft preparation, C.R.; writing—review and editing, Q.L. and C.R.; project administration, Q.L.; funding acquisition, Q.L. All authors have read and agreed to the published version of the manuscript.

Funding

This research was funded by the National Natural Science Foundation of China, grant number U1706216, the Shandong Natural Science Foundation Project, grant number ZR2019ZD12, and the Marine Science and Technology Project of North China Sea Branch of State Oceanic Administration, grant number 2018B05.

Conflicts of Interest

The authors declare no conflict of interest.

References

  1. Maspataud, A.; Ruz, M.-H.; Vanhée, S. Potential impacts of extreme storm surges on a low-lying densely populated coastline: The case of Dunkirk area, Northern France. Nat. Hazards 2013, 66, 1327–1343. [Google Scholar] [CrossRef]
  2. Olbert, A.I.; Nash, S.; Cunnane, C.; Hartnett, M. Tide–surge interactions and their effects on total sea levels in Irish coastal waters. Ocean Dyn. 2013, 63, 599–614. [Google Scholar] [CrossRef] [Green Version]
  3. Kerr, P.C.; Donahue, A.S.; Westerink, J.J.; Luettich, R.A.; Zheng, L.Y.; Weisberg, R.H.; Huang, Y.; Wang, H.V.; Teng, Y.; Forrest, D.R.; et al. US IOOS coastal and ocean modeling testbed: Inter-model evaluation of tides, waves, and hurricane surge in the Gulf of Mexico. J. Geophys. Res. Ocean. 2013, 118, 5129–5172. [Google Scholar] [CrossRef] [Green Version]
  4. Xia, M.; Xie, L.; Pietrafesa, L.J.; Peng, M. A numerical study of storm surge in the Cape Fear River estuary and adjacent coast. J. Coast. Res. 2008, 4, 159–167. [Google Scholar] [CrossRef]
  5. Feng, X.; Yin, B.; Yang, D. Development of an unstructured-grid wave-current coupled model and its application. Ocean Model. 2016, 104, 213–225. [Google Scholar] [CrossRef]
  6. Mao, M.; Xia, M. Dynamics of wave–current–surge interactions in Lake Michigan: A model comparison. Ocean Model. 2017, 110, 1–20. [Google Scholar] [CrossRef] [Green Version]
  7. Lin, N.; Emanuel, K.; Oppenheimer, M.; Vanmarcke, E. Physically based assessment of hurricane surge threat under climate change. Nat. Clim. Chang. 2012, 2, 462–467. [Google Scholar] [CrossRef] [Green Version]
  8. Haigh, I.D.; Wijeratne, E.M.S.; Macpherson, L.R. Estimating present day extreme water level exceedance probabilities around the coastline of Australia: Tides, extra-tropical storm surges and mean sea level. Clim. Dyn. 2014, 42, 121–138. [Google Scholar] [CrossRef]
  9. Storch, H.V.; Woth, K. Storm surges: Perspectives and options. Sustain. Sci. 2008, 3, 33–43. [Google Scholar] [CrossRef]
  10. Doocy, S.; Dick, A.; Daniels, A.; Kirsch, T.D. The human impact of tropical cyclones: A historical review of events 1980-2009 and systematic literature review. PLoS Curr. 2013, 5. [Google Scholar] [CrossRef]
  11. FEMA HAZUS. Multi-Hazard Loss Estimation Model Methodology—Flood Model; Federal Emergency Management Agency: Washington, WT, USA, 2010.
  12. Wood, R.M.; Drayton, M.; Berger, A.; Burgess, P.; Wright, T. Catastrophe loss modelling of storm-surge flood risk in eastern England. Philos. Trans. Math. Phys. Eng. Sci. 2005, 363, 1407–1422. [Google Scholar]
  13. Liu, Q.; Ruan, C.; Shan, Z.; Jian, L.; Lian, X. Risk assessment of storm surge disaster based on numerical models and remote sensing. Int. J. Appl. Earth Obs. Geoinf. 2018, 68, 20–30. [Google Scholar] [CrossRef]
  14. Wahl, T.; Mudersbach, C.; Jensen, J.; Rybski, D.; Haigh, I. Assessing the hydrodynamic boundary conditions for risk analyses in coastal areas: A stochastic storm surge model. Nat. Hazards Earth Syst. Sci. 2011, 11, 2925. [Google Scholar] [CrossRef]
  15. Bushra, N.; Trepanier, J.C.; Rohli, R.V. Joint probability risk modelling of storm surge and cyclone wind along the coast of Bay of Bengal using a statistical copula. Int. J. Climatol. 2019, 39, 4206–4217. [Google Scholar] [CrossRef]
  16. Glahn, B.; Taylor, A.; Kurkowski, N.; Shaffer, W.A. The role of the SLOSH model in National Weather Service storm surge forecasting. Natl. Weather Dig. 2009, 33, 3–14. [Google Scholar]
  17. Watson, C.C. The arbiter of storms: A high resolution, GIS based storm hazard model. Natl. Weather Dig. 1995, 20, 2–9. [Google Scholar]
  18. Zellou, B.; Rahali, H. Assessment of the joint impact of extreme rainfall and storm surge on the risk of flooding in a coastal area. J. Hydrol. 2019, 569, 647–665. [Google Scholar] [CrossRef]
  19. Scally, D.; Fes, A. Evaluation of storm surge risk: A case study from Rarotonga, Cook Islands. Int. J. Disaster Risk Reduct. 2014, 7, 9–27. [Google Scholar] [CrossRef]
  20. Bajo, M.; Zampato, L.; Umgiesser, G.; Cucco, A.; Canestrelli, P. A finite element operational model for storm surge prediction in Venice. Estuar. Coast. Shelf Sci. 2007, 75, 236–249. [Google Scholar] [CrossRef]
  21. Pasquali, D.; Risio, M.D.; De Girolamo, P. A simplified real time method to forecast semi-enclosed basins storm surge. Estuar. Coast. Shelf Sci. 2015, 165, 61–69. [Google Scholar] [CrossRef]
  22. Pasquali, D.; Bruno, M.F.; Celli, D.; Damiani, L.; Risio, M.D. A simplified hindcast method for the estimation of extreme storm surge events in semi-enclosed basins. Appl. Ocean Res. 2019, 85, 45–52. [Google Scholar] [CrossRef]
  23. Sahin, O.; Mohamed, S. Coastal vulnerability to sea-level rise: A spatial–temporal assessment framework. Nat. Hazards 2014, 70, 395–414. [Google Scholar] [CrossRef]
  24. Hallegatte, S.; Ranger, N.; Mestre, O.; Dumas, P.; Corfee-Morlot, J.; Herweijer, C.; Wood, R.M. Assessing climate change impacts, sea level rise and storm surge risk in port cities: A case study on Copenhagen. Clim. Chang. 2011, 104, 113–137. [Google Scholar] [CrossRef] [Green Version]
  25. Yan, X.J.; Li, Q.F.; Cai, T.; Ren, J.L.; Wan, S.C. Evaluation of urban flood control and disaster reduction capacity. J. Hohai Univ. 2012. [Google Scholar] [CrossRef]
  26. Choo, T.H.; Sim, S.Y.; Yang, D.U.; Park, S.J.; Kwak, K.S. A Study on Estimation of Design Tidal level Considering Sea Level Change in the Korean Peninsula. J. Korea Acad. Ind. Coop. Soc. 2016, 17, 464–473. [Google Scholar]
  27. Kang, J.W.; Moon, S.R.; Park, S.J.; Lee, K.H. Analyzing sea level rise and tide characteristics change driven by coastal construction at Mokpo Coastal Zone in Korea. Ocean Eng. 2009, 36, 415–425. [Google Scholar] [CrossRef]
  28. Pickering, M.D.; Wells, N.C.; Horsburgh, K.J.; Green, J.A.M. The impact of future sea-level rise on the European Shelf tides. Cont. Shelf Res. 2012, 35, 1–15. [Google Scholar] [CrossRef]
  29. Liu, Q.; Li, J.; Ruan, C.; Yin, Z.; Zhong, S. Risk assessment and zoning of sea level rise in Shandong Province. J. Oceanol. Limnol. 2019, 37, 2014–2024. [Google Scholar] [CrossRef]
  30. Church, J.A.; White, N.J. A 20th century acceleration in global sea-level rise. Geophys. Res. Lett. 2015, 33, 313–324. [Google Scholar] [CrossRef]
  31. Ferrarin, C.; Roland, A.; Bajo, M.; Umgiesser, G.; Cucco, A.; Davolio, S.; Buzzi, A.; Malguzzi, P.; Drofa, O. Tide-surge-wave modelling and forecasting in the Mediterranean Sea with focus on the Italian coast. Ocean Model. 2013, 61, 38–48. [Google Scholar] [CrossRef] [Green Version]
  32. Xie, D.-m.; Zou, Q.-p.; Cannon, J.W. Application of SWAN+ADCIRC to tide-surge and wave simulation in Gulf of Maine during Patriot's Day storm. Water Sci. Eng. 2016, 9, 33–41. [Google Scholar] [CrossRef] [Green Version]
  33. Moon, I.J.; Kwon, J.I.; Lee, J.C.; Shim, J.S.; Kwon, S.J. Effect of the surface wind stress parameterization on the storm surge modeling. Ocean Model. 2009, 29, 115–127. [Google Scholar] [CrossRef]
  34. Chu, D.; Zhang, J.; Wu, Y.; Jiao, X.; Qian, S. Sensitivities of modelling storm surge to bottom friction, wind drag coefficient, and meteorological product in the East China Sea. Estuar. Coast. Shelf Sci. 2019, 231, 106460. [Google Scholar] [CrossRef]
  35. Saha, S.; Moorthi, S.; Wu, X.; Wang, J.; Nadiga, S.; Tripp, P.; Behringer, D.; Hou, Y.-T.; Chuang, H.-Y.; Iredell, M.; et al. The NCEP Climate Forecast System Version 2. J. Clim. 2012, 27, 2185–2208. [Google Scholar] [CrossRef]
  36. Chen, C.; Liu, H.; Beardsley, R.C. An unstructured grid, finite-volume, three-dimensional, primitive equations ocean model: Application to coastal ocean and estuaries. J. Atmos. Ocean. Technol. 2003, 20, 159–186. [Google Scholar] [CrossRef]
  37. Ma, Z.; Han, G.; De Young, B. Oceanic responses to Hurricane Igor over the Grand Banks: A modeling study. J. Geophys. Res. Ocean. 2015, 120, 1276–1295. [Google Scholar] [CrossRef]
  38. Rego, J.L.; Li, C. Storm surge propagation in Galveston Bay during Hurricane Ike. J. Mar. Syst. 2010, 82, 265–279. [Google Scholar] [CrossRef]
  39. Resio, D.T.; Westerink, J.J. Modeling the physics of storm surges. Phys. Today 2008, 61, 33–38. [Google Scholar] [CrossRef] [Green Version]
  40. Weisberg, R.H.; Zheng, L. Circulation of Tampa Bay driven by buoyancy, tides, and winds, as simulated using a finite volume coastal ocean model. J. Geophys. Res. Ocean. 2006. [Google Scholar] [CrossRef] [Green Version]
  41. Han, G.; Ma, Z.; Deyoung, B.; Foreman, M.; Chen, N. Simulation of three-dimensional circulation and hydrography over the Grand Banks of Newfoundland. Ocean Model. 2011, 40, 199–210. [Google Scholar] [CrossRef]
  42. Li, J.; Hou, Y.; Mo, D.; Liu, Q.; Zhang, Y. Influence of Tropical Cyclone Intensity and Size on Storm Surge in the Northern East China Sea. Remote Sens. 2019, 11, 3033. [Google Scholar] [CrossRef] [Green Version]
  43. Chen, X.F.; Wang, G.X. MIKE 21 Software and its Application on the Offshore Reconstruction Engineering of Changxing Islands. J. Dalian Univ. 2007, 28, 93–98. [Google Scholar]
  44. Chu, Q.; Peng, D.; Zongxue, X.U.; Meng, D.; Zhen, T.; Jiang, Q. Risk analysis of Urban flooding by using MIKE 11 and MIKE 21. J. Beijing Norm. Univ. 2014, 5, 446–451. [Google Scholar]
  45. Warren, I.R.; Bach, H.K. MIKE 21: A modelling system for estuaries, coastal waters and seas. Environ. Softw. 1992, 7, 229–240. [Google Scholar] [CrossRef]
  46. Coles, S.; Bawa, J.; Trenner, L.; Dorazio, P. An Introduction to Statistical Modeling of Extreme Values; Springer: London, UK, 2001; pp. 54–69. [Google Scholar]
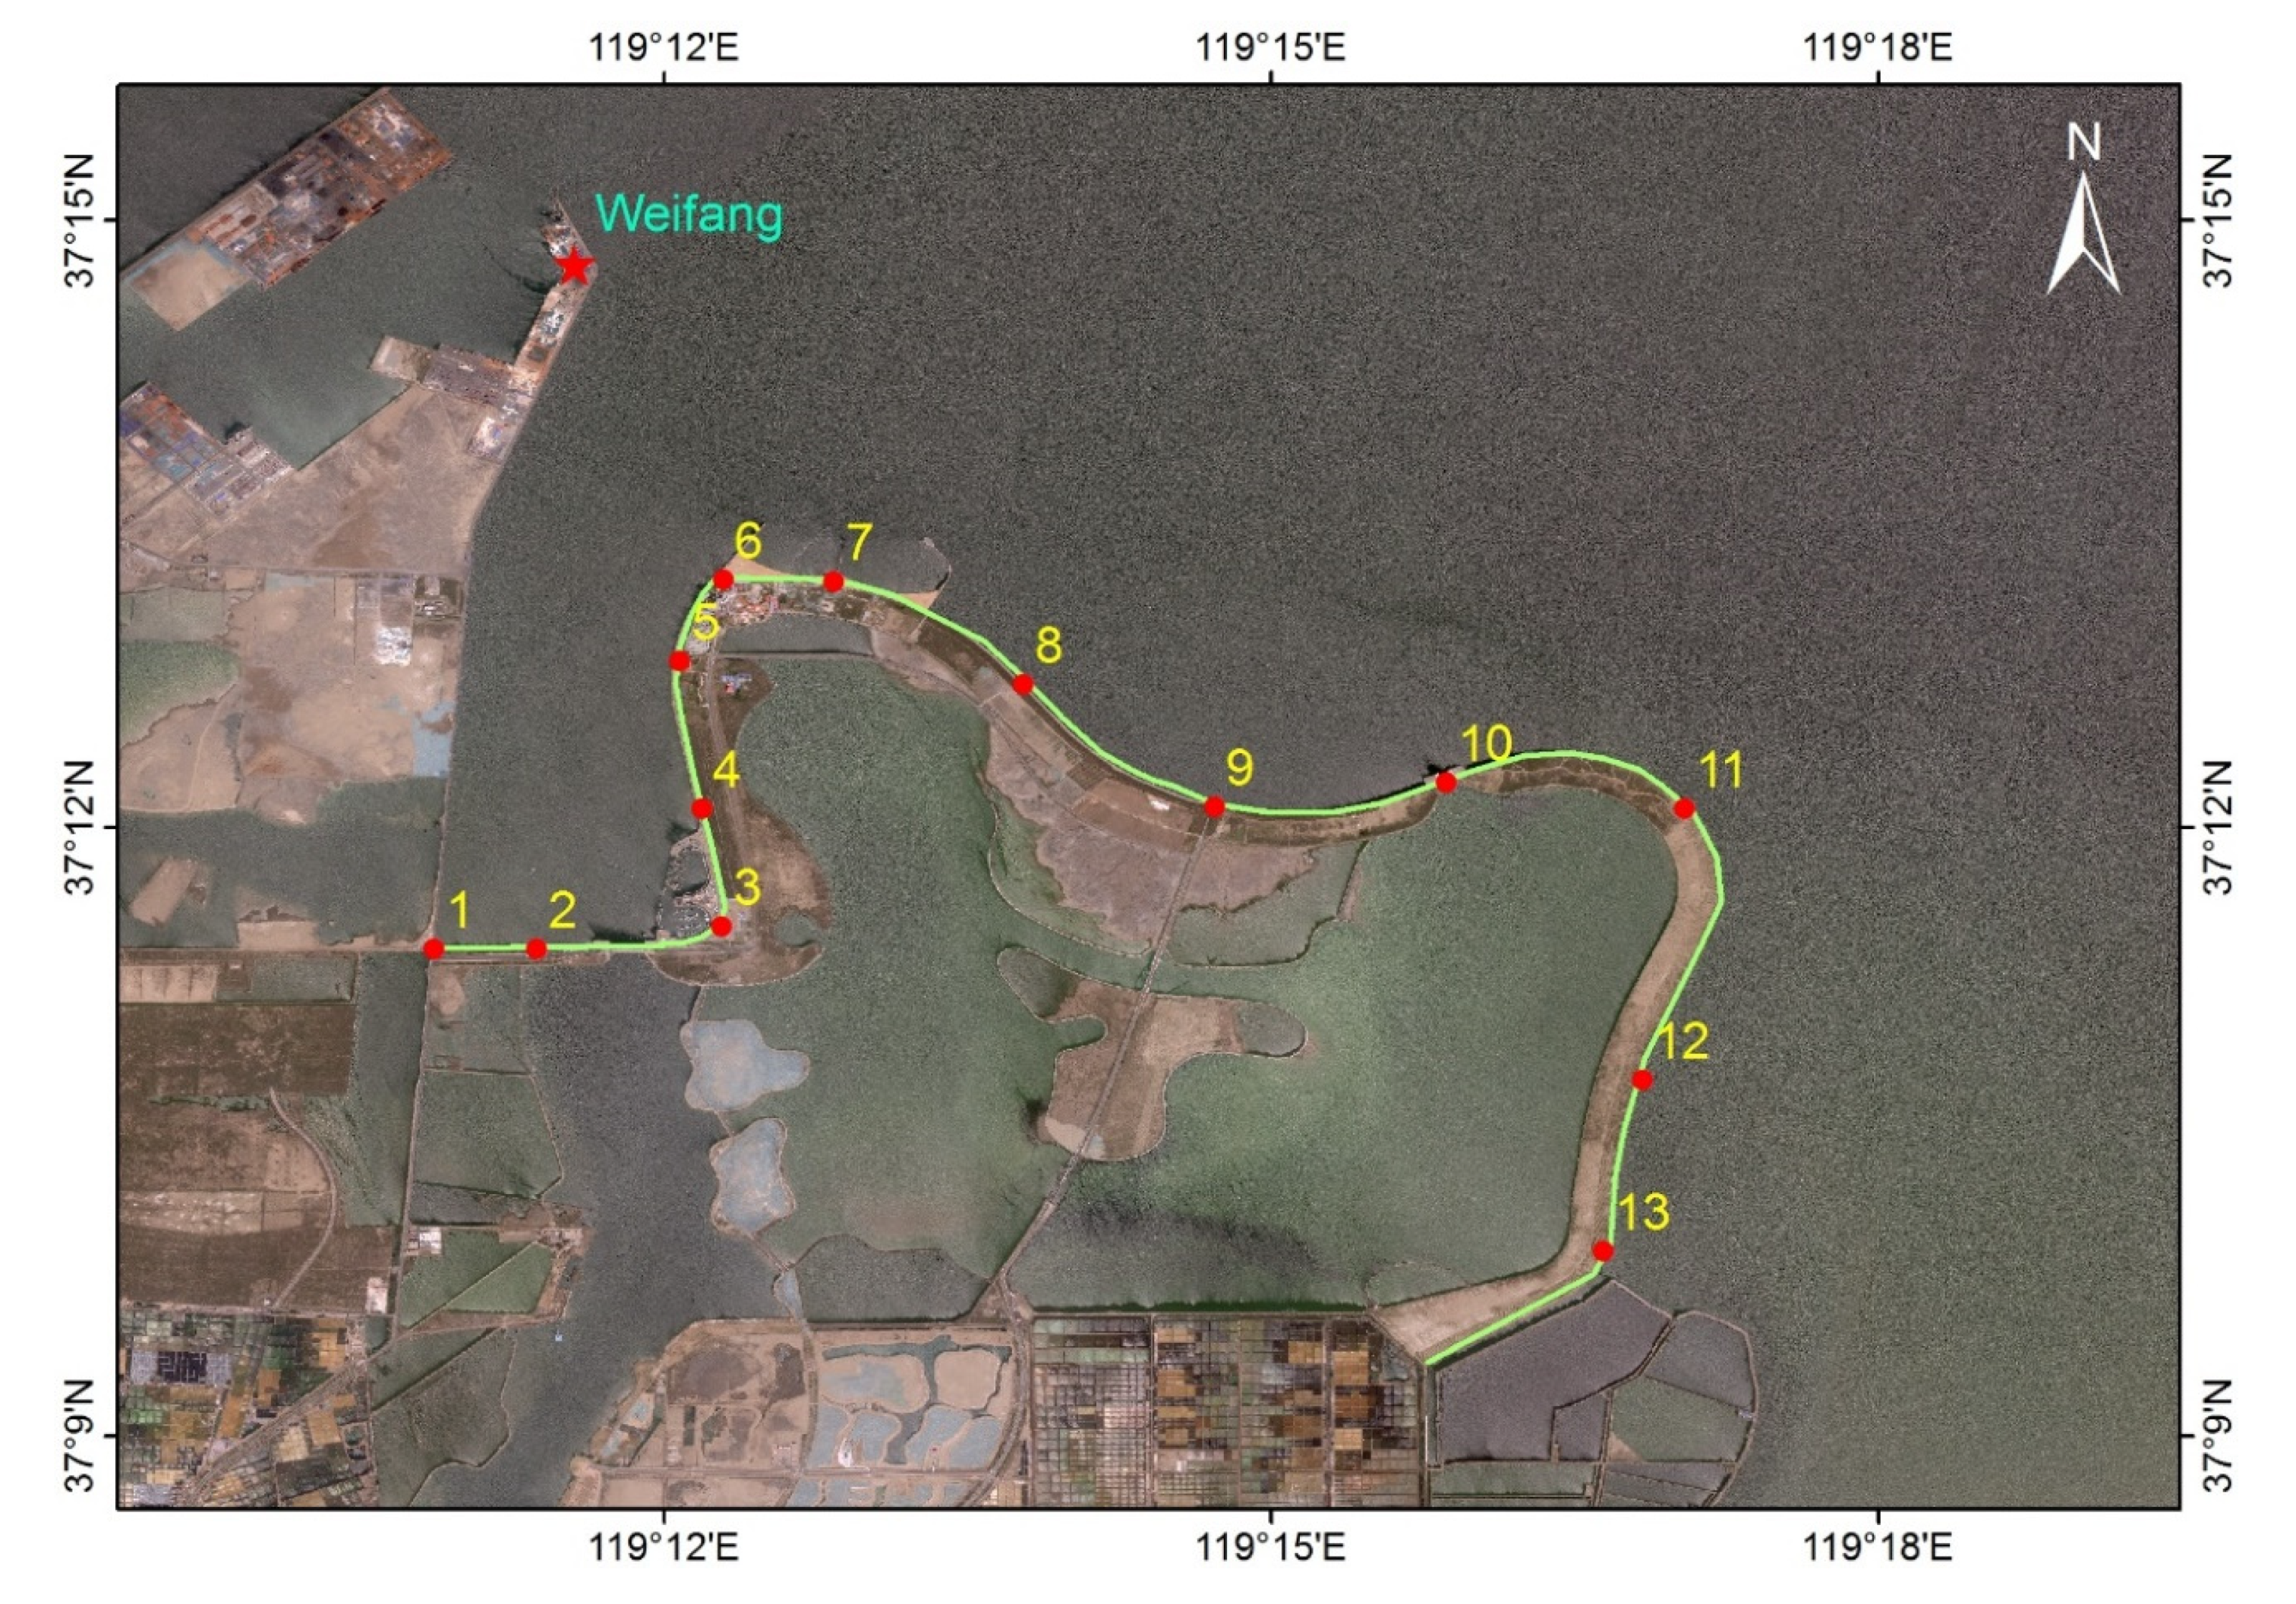
Figure 1. Weifang levee from above. The green line indicates the position of the levee. The red dots indicate the 13 measuring points. The red star in the upper-left corner indicates the position of the Weifang tidal gauge station.
Remotesensing 12 03723 g001
Figure 2. Point 11 on the Weifang levee: (a) photograph, (b) 3D point cloud data, and (c) measurement of levee angle using 3D point cloud data.
Remotesensing 12 03723 g002
Figure 3. Computational grids of (a) the entire study domain, (b) Shandong offshore area, and (c) Laizhou Bay.
Remotesensing 12 03723 g003
Figure 4. Detided water level from observations (blue) and model simulations (red): (ad) caused by Typhoon Winnie during 19–21 August 1997, (eh) caused by a strong cold front during 3–5 March 2007, (il) caused by a strong cold front during 9–11 December 2010, (mp) caused by Typhoon Damrey during 2–4 August 2012. The blue lines in (a) and (e) are not plotted because no observation is available for Weifang during that time.
Remotesensing 12 03723 g004
Figure 5. (a) Fitted lines of maximum tidal levels for Point 1 according to the EV1 distribution. Dashed lines indicate 95% confidence intervals. (b) Tidal levels for the 100-year period for all 13 points.
Remotesensing 12 03723 g005
Figure 6. (ac) Simulation of waves transferred from the open sea to the levee from three directions (N, NE, and NNE) in the MIKE 21 PMS model simulation and (d) significant wave height at the 13 measuring points along the levee.
Remotesensing 12 03723 g006
Figure 7. Wave run-up for the 50-year period at the 13 measuring points along the levee.
Remotesensing 12 03723 g007
Figure 8. Designed levee height (ZD, blue), measured levee height (ZM, red), and their difference (H, orange).
Remotesensing 12 03723 g008
Table 1. Location and elevation of each of the 13 measuring points on the Weifang levee.
IDLon (°E)Lat (°N)Elevation (m)
(Based on National Vertical Datum 1985)
1119°10′51.87″37°11′24.96″5.193
2119°11′44.63″37°11′25.24″6.066
3119°12′15.11″37°11′30.78″7.073
4119°12′11.06″37°11′58.26″6.454
5119°12′02.48″37°12′41.82″6.912
6119°12′15.50″37°13′14.50″6.910
7119°12′50.60″37°13′12.47″6.910
8119°13′37.19″37°12′51.38″6.992
9119°14′28.42″37°12′11.32″6.686
10119°15′50.18″37°12′15.18″5.057
11119°16′47.95″37°12′17.51″6.667
12119°16′58.26″37°11′07.58″6.847
13119°16′39.60″37°09′54.95″6.902
Table 2. The 166 selected storm surge cases in Weifang during 1982–2015.
YearTyphoon Storm Surge
(Year-Number)*
Extratropical Storm Surge
(Month-Day)*
19828211 82130111 1109
1983 0107 0316 0426 0629 0715
1984 0616 0828 1019 1204 1210
19858506 85091108 1121
1986 0103 1205 1214 1221
1987 0102 0112 0115 0827 0905 1014 1126
1988 0204 0730 0827
1989 0110 0303 0609 0803 1015 1031 1102
1990 0129 0324 0502 0822 0914 1008
199191120308 0322 1217
199292160507 1210
1993 0601 1106 1113 1115 1120
199494150116 0211
1995 0227 0414 1107
1996 0102 0727 0825 1111 1126
199797110105 1125 1206
1998 0319 0718 0725 0823 1115
199999110321 0412 0921 1114 1124
200000120328 0409
2001 0107 0314 0722 0801 0820 0821 0911 0922 1003 1213
20020209 02150106 0406 0625 0908
2003 0221 0302 0418 0828 1012 1027 1120
20040419 04210221 0828 1110 1206 1219
20050509 05150218 0824 1128 1203
2006 0113 0401 0905 1108 1113
200707130304 0812 1028
2008 0426 0818 0822 1221
2009 0213 0415 0722 1205
20101004 10090120 0720 1210 1213
20111105 11090227 0519 0802 0929 1118
20121210 12150402 1017 1110
201313120526 0922 1013
2014 1011 1025
2015 0207 0928 1104
* The labels of the storm surges reflect the typhoon number for typhoon storm surges and the occurrence date for extratropical storm surges. For example, 8211 in Row 2, Column 2 means that the typhoon caused a storm surge was the eleventh typhoon in the year of 1982; 0111 in Row 2, Column 3 means that the extratropical storm surge occurred on 11 January 1982.
Table 3. Maximum water levels for the 13 measuring points during 1982–2015 (unit: m).
Year12345678910111213Mean
19823.393.393.393.393.383.363.363.363.373.363.353.373.383.37
19833.413.403.403.403.393.373.373.373.383.373.363.383.393.38
19843.333.323.323.323.313.303.303.303.303.303.293.303.323.31
19853.523.513.513.513.493.483.483.483.493.483.463.483.503.49
19863.653.643.643.643.623.603.603.603.623.613.593.613.633.62
19874.334.324.324.314.284.244.244.254.274.254.224.264.304.28
19883.283.283.283.283.273.263.263.263.263.263.253.263.273.27
19893.283.283.283.283.273.263.263.263.263.263.253.263.273.27
19903.293.293.293.293.283.273.273.273.273.273.263.273.283.28
19913.393.393.393.393.383.363.363.363.373.363.353.373.383.37
19925.025.005.004.994.954.894.894.904.944.914.864.924.974.94
19933.763.753.753.753.733.713.713.713.723.713.693.723.743.73
19943.613.603.603.593.583.563.563.563.573.563.553.573.593.58
19953.133.123.123.123.123.113.113.113.113.113.103.113.123.11
19963.293.293.293.293.283.273.273.273.273.273.263.273.283.28
19973.903.893.893.883.863.833.833.843.853.843.813.843.873.86
19983.613.603.603.593.583.563.563.563.573.563.553.573.593.58
19993.753.743.743.743.723.693.693.703.713.703.683.713.733.72
20003.413.403.403.403.393.373.373.373.383.373.363.383.393.38
20013.663.663.663.653.633.613.613.623.633.623.603.623.643.63
20023.593.593.593.583.573.553.553.553.563.553.543.563.583.57
20034.414.404.404.394.354.314.314.324.354.324.294.334.374.35
20043.423.413.413.413.403.383.383.383.393.383.373.393.403.39
20053.793.793.793.783.763.743.743.743.763.743.723.753.773.76
20063.653.643.643.643.623.603.603.603.623.613.593.613.633.62
20074.184.174.174.174.144.104.104.114.134.114.084.124.164.13
20083.793.783.783.773.753.733.733.733.753.733.713.743.763.75
20093.883.873.873.873.853.823.823.823.843.823.803.833.863.84
20103.813.803.803.793.773.753.753.753.773.753.733.763.793.77
20113.743.743.743.733.713.693.693.693.713.693.673.703.723.71
20123.693.683.683.683.663.643.643.643.663.643.623.653.673.66
20133.933.923.923.923.903.873.873.873.893.873.853.883.913.89
20144.424.404.404.394.364.324.324.334.354.334.304.344.384.36
20154.214.204.204.194.164.124.124.134.154.134.104.144.184.16
Table 4. Mean, standard division, scale, and location parameters for the 13 measuring points.
12345678910111213
Mean (m)3.723.713.713.713.693.673.673.673.683.673.653.683.70
Std (m)0.3000.2980.2980.2960.2890.2820.2820.2840.2900.2840.2770.2860.294
Scale0.500.490.490.490.480.470.470.470.480.470.460.480.49
Location3.943.933.933.933.903.873.873.883.903.883.863.893.92
Table 5. Predicted sea level rise along the Weifang coast since the year of 2010 (unit: m).
2030 (20 Year)2060 (50 Year)2110 (100 Year)
0.06–0.070.15–0.170.30–0.33
Table 6. Values of designed tidal level for the 100-year period (T), designed wave run-up for the 50-year period (R), security heightened value (S), predicted sea level rise in 2110 (H), designed levee height (ZD), measured levee height (ZM), and their difference (H) (unit: m). H in bold indicates ZM is lower than ZD.
SpotTRShZDZMH
15.170.850.500.306.825.19−1.63
25.150.250.500.306.205.70−0.50
35.150.500.500.306.457.070.62
45.130.510.500.306.446.450.01
55.080.590.500.306.476.910.44
65.021.880.500.307.706.85−0.85
75.021.030.500.306.856.910.06
85.042.540.500.308.386.99−1.39
95.082.030.500.307.916.69−1.22
105.041.240.500.307.085.70−1.38
114.992.830.500.308.626.67−1.95
125.061.930.500.307.796.85−0.94
135.121.010.500.306.936.90−0.03
Publisher’s Note: MDPI stays neutral with regard to jurisdictional claims in published maps and institutional affiliations.