Article

Spatio-Temporal Evolution, Future Trend and Phenology Regularity of Net Primary Productivity of Forests in Northeast China

1
Key Laboratory of Soil and Water Conservation and Desertification Prevention, School of Soil and Water Conservation, Beijing Forestry University, Beijing 100083, China
2
Jiangsu Provincial Key Laboratory of Geographic Information Science and Technology, International Institute for Earth System Science, Nanjing University, Nanjing 210023, China
3
Institute of Geographic Sciences and Natural Resources Research, Chinese Academy of Sciences, Beijing 100101, China
4
Jilin Provincial Academy of Forestry Sciences, Changchun 130021, China
*
Author to whom correspondence should be addressed.
Remote Sens. 2020, 12(21), 3670; https://doi.org/10.3390/rs12213670
Submission received: 25 September 2020 / Revised: 1 November 2020 / Accepted: 5 November 2020 / Published: 9 November 2020
(This article belongs to the Special Issue Advanced Phenology, and Land Cover and Land Use Change Studies)

Abstract

:
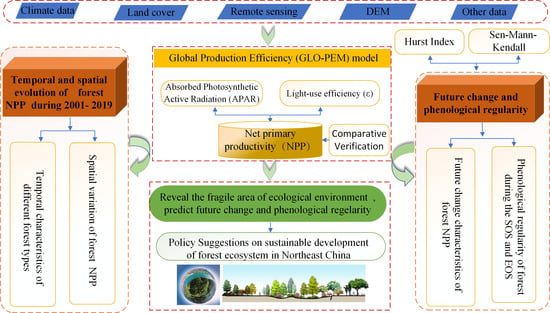
Net Primary Productivity (NPP) is one of the significant indicators to measure environmental changes; thus, the relevant study of NPP in Northeast China, Asia, is essential to climate changes and ecological sustainable development. Based on the Global Production Efficiency (GLO-PEM) model, this study firstly estimated the NPP in Northeast China, from 2001 to 2019, and then analyzed its spatio-temporal evolution, future changing trend and phenology regularity. Over the years, the NPP of different forests type in Northeast China showed a gradual increasing trend. Compared with other different time stages, the high-value NPP (700–1300 gC·m−2·a−1) in Changbai Mountain, from 2017 to 2019, is more widely distributed. For instance, the NPP has an increasing rate of 6.92% compared to the stage of 2011–2015. Additionally, there was a significant advance at the start of the vegetation growth season (SOS), and a lag at the end of the vegetation growth season (EOS), from 2001 to 2019. Thus, the whole growth period of forests in Northeast China became prolonged with the change of phenology. Moreover, analysis on the sustainability of NPP in the future indicates that the reverse direction feature of NPP change will be slightly stronger than the co-directional feature, meaning that about 30.68% of the study area will switch from improvement to degradation. To conclude, these above studies could provide an important reference for the sustainable development of forests in Northeast China.

Graphical Abstract

1. Introduction

In order to restore the fragile ecosystem, reduce environmental pollution, and reduce restrictions of natural resources on socioeconomic development, the 18th National Congress of the Communist Party of China proposed a strategic plan that actively promotes the construction of an ecological civilization by integrating ecological aspect into the entire process of economic, political, cultural and social construction. However, the realization of an ecological civilization is a complex and comprehensive project [1,2], which not only involves politics, economy, culture and pollution control and other aspects, but also is closely related to the sustainable development of forest ecosystem. In the past few decades, many scholars have demonstrated that the forest ecosystems in the middle and high latitudes of the Northern Hemisphere play an important role in the global carbon sink, using the matrix model [3] and TRIPLEX1.0 model [4], based on national forest resource inventories and Landsat time-series data, especially in North America and European [3,4,5,6]. However, as an important player in the harmony between human and nature, forest ecosystem in East Asia also plays an irreplaceable role in maintaining global biodiversity, regulating climate, conserving water, and providing biological resources and other economic goods [7,8,9,10]. With the acceleration of economic development and industrialization, the environmental pollution and ecological damage have become increasingly serious and even the stability of forest ecosystem has been severely damaged. Therefore, the sustainable development of forest ecosystem has gradually and globally become of concern [11,12,13].
As an important factor of forest ecosystem, vegetation Net Primary Productivity (NPP) is one of the indispensable core parameters for estimating terrestrial ecosystem function to explore the impact, response and countermeasures of global changes on ecosystem [14]. Moreover, the NPP, which is the main indicator of ecosystem ecological balance and ecosystem health, is closely related to major issues of concern such as carbon cycle and carbon disturbance, land use change, climate change and natural resource management. In addition, changes in regional phenology regularity, especially the data from the start of the vegetation growth season (SOS) and end of the vegetation growth season (EOS), not only influence terrestrial carbon and water cycle, but also exert significant impact to climate by regulating the land-atmosphere energy exchange [15,16]. Therefore, studies on how accurately simulate and predict the NPP and explore the phenology regularity in the regional scale ecosystem are of great significance [17,18]. In particular, they can provide an important basis for the dynamic carbon cycle in the atmosphere, the vegetation and soil continuum as well as the sustainable management of forest ecosystem [19,20,21].
In recent years, the rapid development of remote-sensing techniques has promoted its wide application in vegetation dynamic monitoring and prediction. Plenty of studies worldwide have conducted extensive studies on estimating forest biomass [22,23,24], the analysis on spatio-temporal distribution of NPP [25], the responses of NPP to climate changes in the past decades [26,27]. The Light Utilization Energy (LUE) models are commonly used to estimate and evaluate vegetation NPP on a regional or global scale. On the one hand, this kind of model simplifies the physiological and ecological process of vegetation, and the calculation is relatively simple. On the other hand, this model can be used to estimate the temporal and spatial variation of vegetation NPP on a large regional or global scale with high accuracy. These advantages promote the development and research of such models. Currently, there are four LUE models of NPP estimation models, such as the Vegetation Photosynthesis Model (VPM) [28,29], Carnegie–Ames–Stanford Approach (CASA) [30], Global Production Efficiency Model (GLO-PEM) [31] and Moderate Resolution Imaging Spectroradiometer (MODIS) GPP algorithm [32].
Among these LUE models, the CASA model has been widely used, whose principle of that is to estimate NPP by vegetation photosynthetic effective radiation and actual utilization of light energy. For example, Bao et al. [33] proposed an improved CASA model to achieve a comparable result of NPP with the results from the early CASA model and ground measured NPP. Matsushita et al. [26] analyzed quantitatively the NPP of different vegetation types on a monthly scale by inputting different climate datasets into the ecological process model, and then further explored the influence of different climate variables on NPP. Most of the abovementioned studies focused on the quantitative analysis and on the changes of the previous vegetation cover at inter-annual and monthly scales, lacking the analysis on a more accurate timescales, which was not conducive to obtain the information of phenology change. In addition, several recent studies have highlighted that there are many uncertainties and systematic errors when implementing all these models for estimating forest NPP in some specific ecological regions [34,35], only considering the effect of water stress in soil or air on vegetation. Zhang et al. [36] also found that the GLO-PEM performed better by comparing the four LUE models to estimate terrestrial gross primary production. The GLO-PEM developed by Prince and Goward [31] is driven by the variables derived almost entirely from satellite products (please see Section 3.2.1 for specific explanations). To sum up, the past studies most concentrate on the past analysis of NPP and comparison of different models to estimate NPP [35], not considering the phenology regularity of different crops and future sustainability analysis.
As a typical region in the Northeast Asia, the forest in Northeast China is not only a significant ecological barrier for urban agglomerations, but it is also the part of northeast forest belt of the national ecological pattern named “two screens and three belts” [37], as they accounted for over 30% of the total forest area in China. Although the Chinese government has implemented a series of ecological construction projects, such as “Returning Farmland to Forest” or “Grassland and Three North Revetment Forests”, several ecological and environmental issues still exist [38], such as the declining forest productivity and deteriorating water quality and so on. In order to better solve the above problems, this study takes Northeast China as an example to explore the ecological environment changes based on the past limitations. Our objectives were to do the following: (1) improve the inversion estimation of forest NPP on the timescale of eight days, by using the improved GLO-PEM and MODIS remote-sensing data; (2) further explore the phenology regularity and its sustainability trend in the future, combined with the evolution characteristics of its spatio-temporal pattern; and (3) reveal the ecological environment quality in the newest year, which is from 2016 to 2019, and its future challenge in Northeast China. Here ecological environment quality reflects the suitability of ecological environment for human survival and sustainable social and economic development at the ecosystem level. These will provide a reference for decision-making about the rational exploitation and utilization of regional forest resources, as well as the slowing down of the global warming trend and cleaner production energy for the surrounding area.

2. Study Area

In this work, Changbai Mountain and Zhangguangcai Mountain in Northeast China, which are located at the edge of the Eurasian continent, are selected as study areas (Figure 1). The whole area spans the warm temperate zone, the middle temperate zone and the cold temperate zone from south to north, respectively, with a typical temperate monsoon climate [39,40,41]. It is one of the coldest regions in China because of its relatively high latitude, and its annual average temperature is −7 to 3 °C, especially in Changbai Mountain. Moreover, its annual temperature difference is larger than the region with the same latitude. The latter is characterized by with high temperature and abundant precipitation during the same period, whereas the annual precipitation decrease as the distance to the shoreline in the southeast area increases [42]. Moreover, the whole study area is also an important forests production base in China, and it is dominated by cold temperate and temperate mountain coniferous forest, mixed forest of temperate coniferous and deciduous broadleaf and temperate deciduous broad-leaved forests in the south of Changbai Mountain. In the central area of Zhangguangcai Mountain, it mainly consists of temperate deciduous shrub, temperate deciduous broad-leaved forest, cold temperate and temperate mountain coniferous forest. In short, it has become an important area for the study of global changes and terrestrial ecosystems due to its typical variation of heat and humidity as well as its unique distribution pattern of vegetation [43,44].

3. Data and Methodology

3.1. Data Source and Processing

3.1.1. Modis Data

In this study, considering the difference of temporal and spatial resolution, we apply the NDVI data in our study that were derived from the MODND1D product (the temporal resolution is one day and the spatial resolution is 500 m) acquired by the Terra satellites in 2012, which is processed by daily MOD09GA (Collection 6 and the spatial resolution is 500 m) through splitting, cutting, projection conversion, unit conversion and other processes. The NDVI data (MODND1D product) from 2001 to 2019 were derived from the Geospatial Data Cloud website (http://www.gscloud.cn/). They were used to obtain the monthly maximum NDVI dataset, at a spatial resolution of 500 m, in the selected years. By contrast, the NDVI product MOD13A1 (Collection 6, the spatial resolution is 500 m), which is acquired by the Terra satellites, has a temporal of 16 days, and the Global MYD13A1 product is also provided every 16 days, at 500-m spatial resolution, as a gridded level-3 product in the Sinusoidal projection, which is acquired by the Aqua satellites (https://ladsweb.modaps.eosdis.nasa.gov/). In addition, this study used other MODIS products with a spatial resolution of 500 m and a time resolution of 8 days, such as fraction of absorbed photosynthetically active radiation (FPAR) from Terra Product (MOD15A2H) and surface reflectance data from Terra Product (MOD09A1). Moreover, surface reflectance data were used to calculate the Land Surface Water Index (LSWI) to require the limiting coefficient of water on photosynthesis of vegetation. These data were obtained from Nasa Earth Science Data (https://ladsweb.modaps.eosdis.nasa.gov/) and were spliced and projected using the MRT tool.
In order to verify the accuracy of GLO-PEM in simulating NPP, the NPP at the spatial resolution of 500 m in 2003 and in 2008 (MOD17A3HGF Version 6 product) was derived from the NASA website (https://cmr.earthdata.nasa.gov/). Here annual NPP is derived from the sum of all 8-day Net Photosynthesis (PSN) products ([MOD17A2H] (https://doi.org/10.5067/MODIS/MOD17A2H.006)) from the given year. The PSN value is the difference of the Gross Primary Productivity (GPP) and the Maintenance Respiration (MR).

3.1.2. Meteorological Data

Meteorological data, including daily mean temperature, sunshine time, solar radiation, etc., from 2001 to 2019, were acquired from the China Meteorological Administration (http://data.cma.cn/). In order to maintain a consistent resolution between meteorology data and remote-sensing data from space, the Anuspline interpolation method was used to interpolated point data into raster data with the same spatial resolution as NDVI, FPAR and other data based on 25 meteorological stations in Northeast China.

3.1.3. Land-Use and Land-Cover Data

Land-use and land-cover data, encompassing 2000, 2005, 2010 and 2015 in Heilongjiang and Jilin provinces, were provided by the Resources and Environmental Science Data Center of the Chinese Academy of sciences (http://www.resdc.cn/). These data were obtained based by manual visual interpretation, and they were classified in more than 43 categories. In this study, the land-use and land-cover data were regrouped into five categories, according to a new classification logic, resulting in (i) temperate coniferous forests, (ii) cold temperate and temperate mountain coniferous forests, (iii) temperate deciduous broad-leaved forest, (iv) mixed forest of temperate coniferous and deciduous broadleaf, and (v) temperate deciduous shrub.

3.2. Methodology

3.2.1. GLO-PEM

In this study, the Global Production Efficiency Model (GLO-PEM), which was based on light use efficiency, was applied to simulate the NPP of forests in Northeast China. This model fully considered the characteristics of plant growth and abiotic environmental factors that could regulate plant photosynthesis, such as temperature, soil and water conditions. The NPP estimated by the GLO-PEM (Figure 2) was mainly determined by considering the absorbed photosynthetic active radiation (APAR) and the light use efficiency (ε), using Equation (1) [36,45,46,47,48]:
NPP ( x ,   t )   =   APAR ( x ,   t )   ×   ε ( x ,   t )
where NPP(x, t) represents net primary productivity of pixel x at time t, APAR(x, t) refers to the absorbed photosynthetic active radiation of that and ε(x, t) indicates light use efficiency under the same conditions. The APAR mainly depends on the following two variables:
APAR ( x ,   t )   =   FPAR ( x ,   t )   ×   PAR ( x ,   t ) .  
where PAR(x, t) refers to photosynthetically active radiation of pixel x at time t, FPAR(x, t) is fraction of absorbed photosynthetically active radiation of that.
Photosynthetically Active Radiation (PAR)
In this study, PAR was estimated by considering the geographic location of typical sites in the study area, including longitude, latitude, elevation and the sunshine hours as the input data for the crop mode [36,49,50].
(1)
Solar radiation top of atmosphere (H0)
H 0   =   ( 1 / π )   ×   G SC   ×   E 0   ×   ( cos ϕ cos δ sin W S   +   ( π / 180 )   ×   sin Φ sin δ   ×   W S ) .  
where Gsc is the solar constant with value equal to 1367 W·m−2 that is equivalent to 118.108 MJ· m−2·d−1. E0 represents eccentricity correction factor of the earth’s orbit; Φ, δ, Ws indicate latitude, declination of the sun and time Angle, respectively.
(2)
Solar radiation in clear sky (HL)
According to existing studies [51], the transparency coefficient of total radiation in the atmosphere is usually about 0.8 under ideal conditions, i.e., clear sky, and it is different under specific environmental conditions.
H L   =   0 . 8   ×   H 0
(3)
Daily solar radiation (H)
H   =   H L   ×   ( a   +   b   ×   S / S L )
where H is the daily solar radiation; HL is solar radiation in clear sky; S and SL are sunshine hours and sunshine days, respectively; and a and b are empirical parameters generally obtained by regression simulation based on measured values of solar radiation. According to the average value of total daily solar radiation, the sunshine percentage and the solar radiation in clear sky in different regions of China. Podesta et al. [52] and Wu et al. [53] calculated that a was equal to 0.248, and b was equal to 0.752. PAR is calculated based on the daily solar radiation; the formula is expressed as Equation (6).
PAR   =   0 . 5   ×   H
Light-Use Efficiency (ε)
The light-use efficiency under realistic conditions (ε) refers to the light use efficiency under the stress of environmental driving factors such as temperature and vapor pressure, which can be extracted from meteorological indicators [28,29,30,45,46]. ε is calculated by using Equation (7):
ε ( x ,   t )   =   T ε 1 ( x ,   t )   ×   T ε 2 ( x ,   t )   ×   W ε ( x ,   t )   × ε *  
where T ε 1 ( x ,   t ) and T ε 2 ( x ,   t ) represent the stress coefficients of high temperature and low temperature on light utilization efficiency, respectively.   W ε ( x ,   t ) represents the influence coefficient of water on the utilization of light energy. ε* is the maximum light use efficiency under ideal conditions (please see References [28,29,30,45,46] for specific calculations).

3.2.2. Sen–Mann–Kendall Trend

In order to quantitatively study the variation trend of forests NPP, Sen–Mann–Kendall trend analysis was adopted in this study to comprehensively reflect the evolution characteristics of regional pattern of NPP during the period from 2001 to 2019 by exploring the spatial variation trend and variation slope of each grid [54,55]. The calculation formula is as follows:
Slope = n × i = 1 n i × NPP i i = 1 n i i = 1 n NPP i n × i = 1 n i 2 ( i = 1 n i ) 2
where Slope is the linear fitting slope of the equation, the positive and negative value of the slope represents the increase and decrease of forests NPP in Changbai Mountain area; NPPi is the total annual NPP in the i year; and N is the span of research period of 2001–2019.

3.2.3. Hurst Index

Hurst index can not only be used to describe the sustainability of the NPP in Northeast China but also predict the future development trend from time series. Therefore, this study attempts to explore the future ecological environment changes of forests in Northeast China by using Hurst index to provide reference for the sustainable management of forests in the future. Hurst index (H), which is based on the re-scale range (R/S) analysis, is an effective method to describe quantitatively the long-term dependence of time series information [56,57]. The following sequences are all established at any moment { i = 1 , 2 , ,   n }   after given time series variable of NPP. For any positive integer m, define the above time series. Here this study mainly predicts the future changes based on the NPP from 2001 to 2019, so n is 19.
Difference sequence:
Δ NPP i   =   NPP i     NPP i 1 .  
Mean sequence:
Δ NPP ( m )   ¯   =   1 m i   =   1 m Δ NPP i       m   =   1 , 2     n
Cumulative dispersion:
X ( t )   =   i   =   1 m ( Δ NPP i Δ NPP ( m ) ¯ )       1     t     m
Range:
R ( m ) = X ( t ) max X ( t ) min    m = 1 , 2 n
Standard deviation:
S ( m ) = [ 1 m i = 1 m ( Δ NPP i Δ NPP ( m ) ¯ ) 2 ] 1 2   m = 1     n
This formula R / S   =   R ( m ) / S ( m ) is defined based on computing R ( m ) . and R ( m ) . When R / S T H , Hurst phenomenon exists in the considered time series, and the representational significance of Hurst index is evident. When 0.5 < H < 1, the times series is persistent, meaning that the future trend is consistent with the past trend. The closer the value is to 1, the stronger the continuity will be. However, when 0 < H < 0.5, the time series has an anti-continuity, indicating that the future change trend is opposite to the past change trend. The closer the value is to 0, the stronger the anti-continuity is. When H = 0.5, the event sequence is a random sequence, and the future change trend is unpredictable [41].

4. Model Validation

As the GLO-PEM is a light use efficiency model, the estimation of NPP mainly depends on light use efficiency and photosynthetically active radiation. Therefore, this study applied the method of phased calculation and comparison for verification.

4.1. Comparisons of Solar Radiation and PAR Variation of Different Research Sites

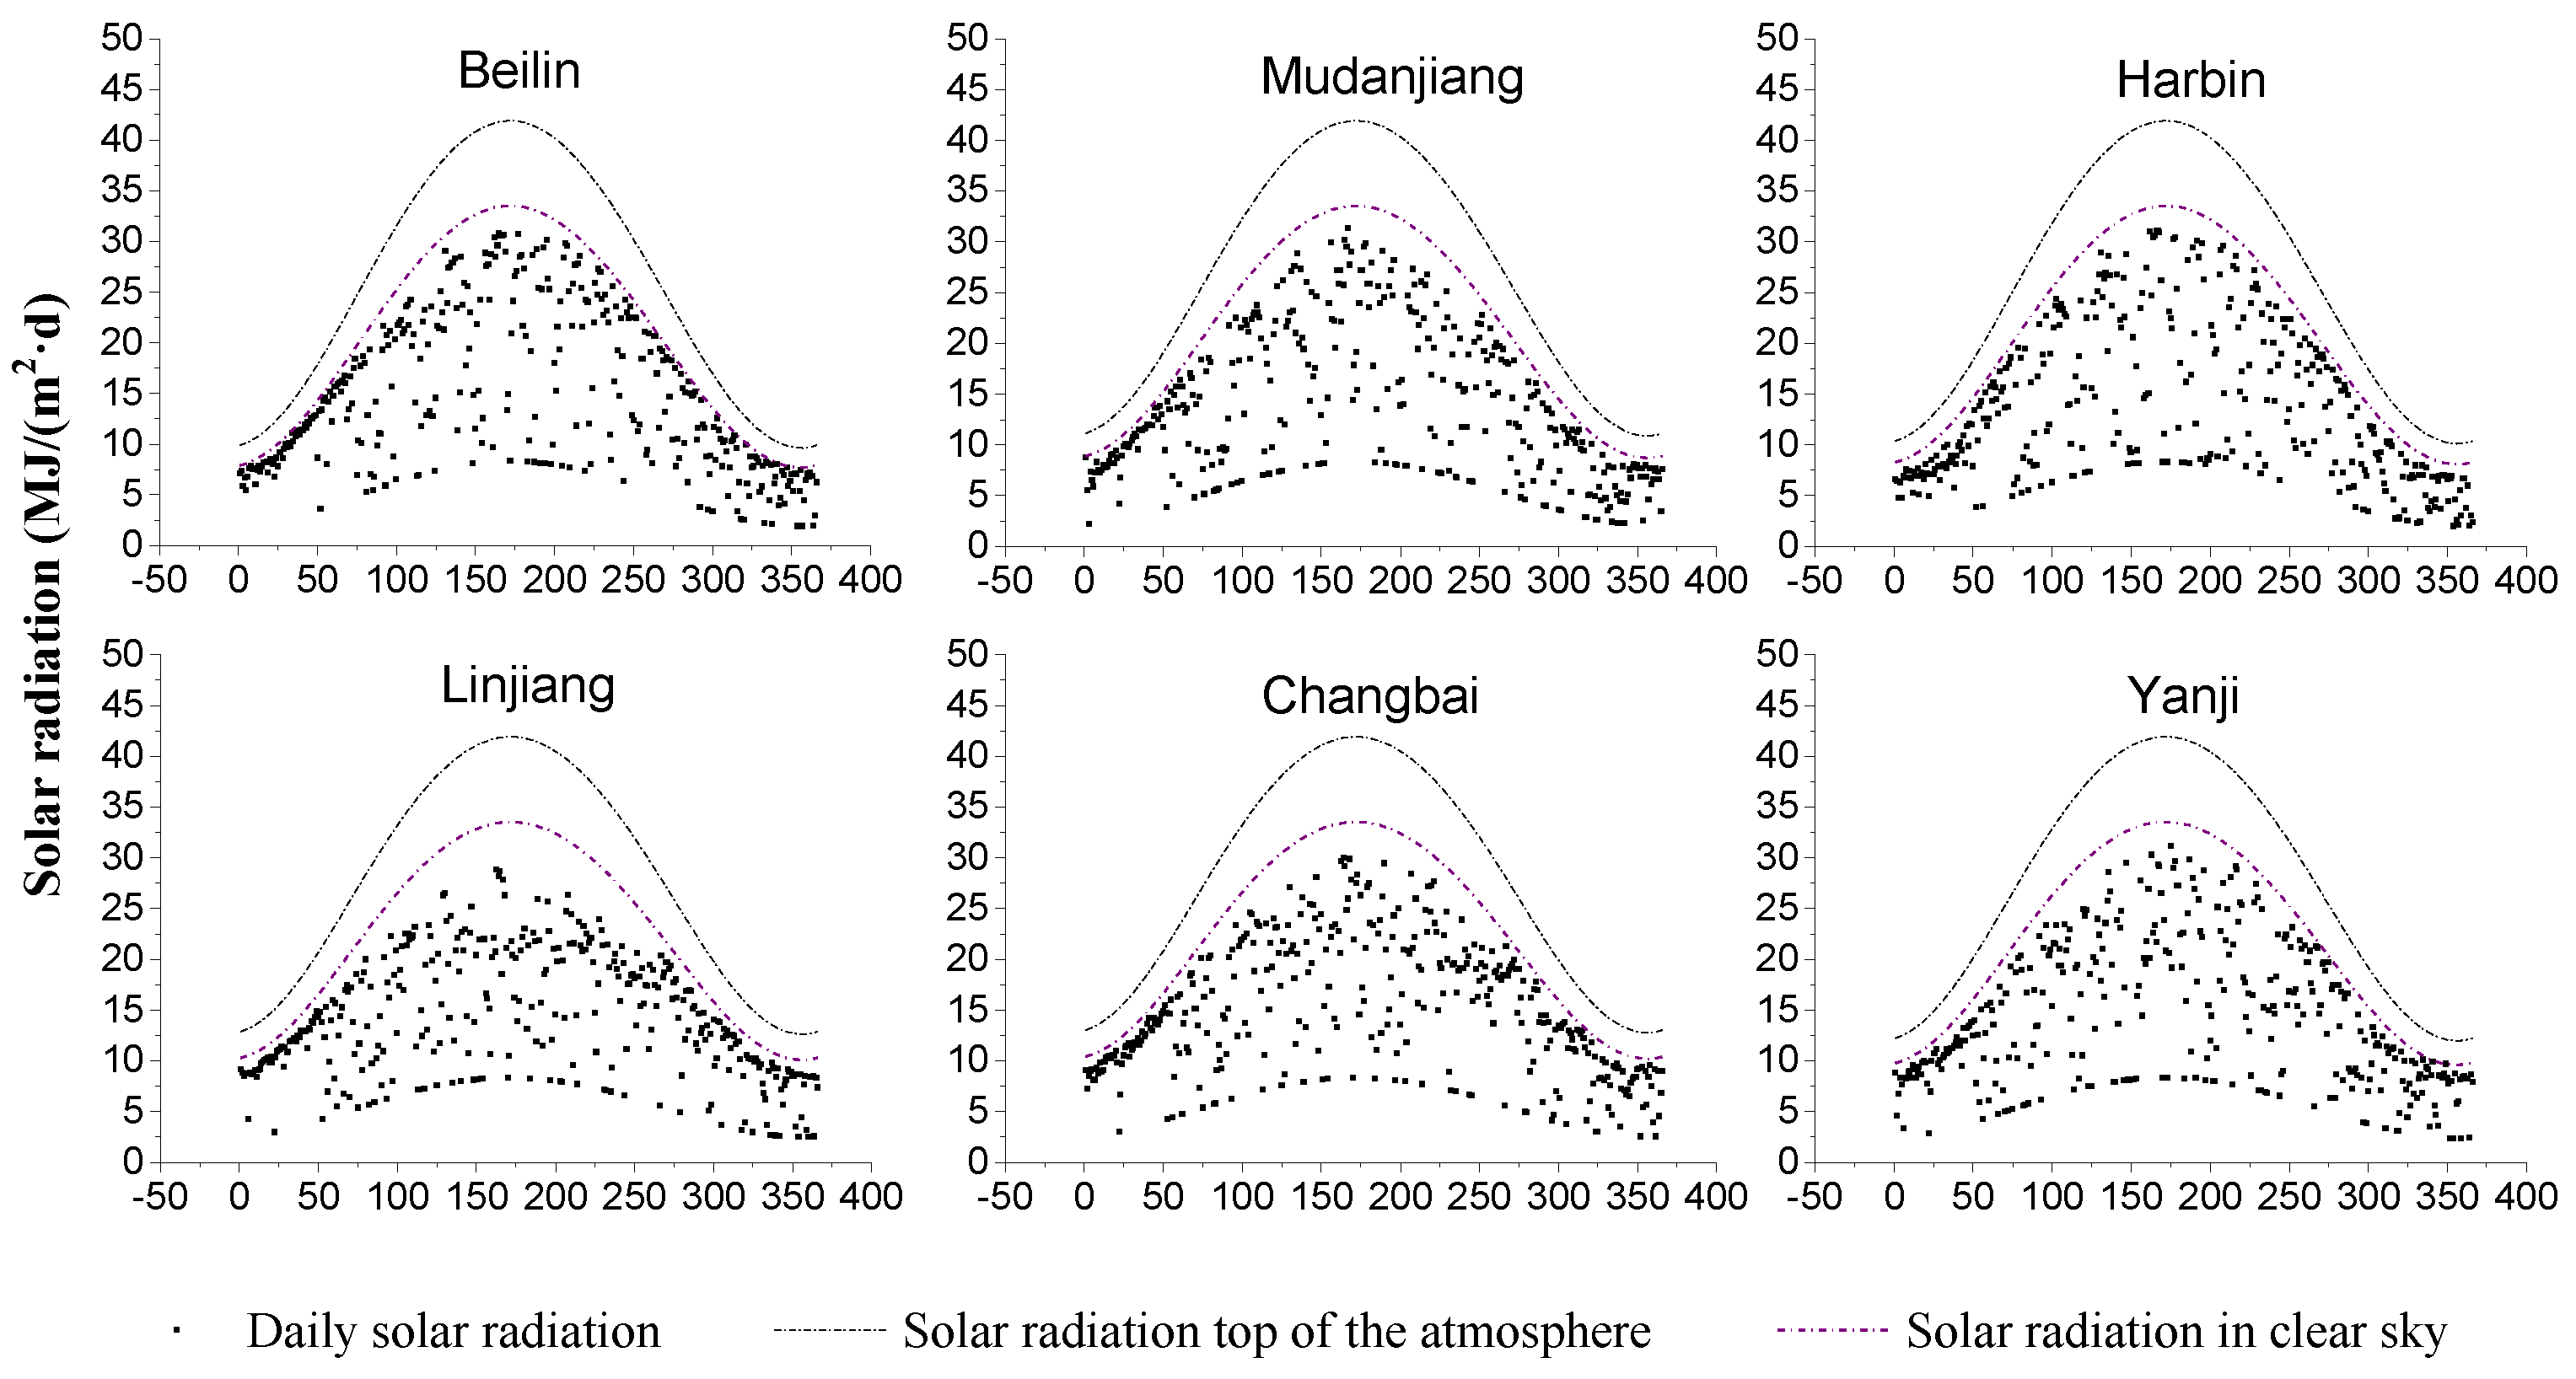
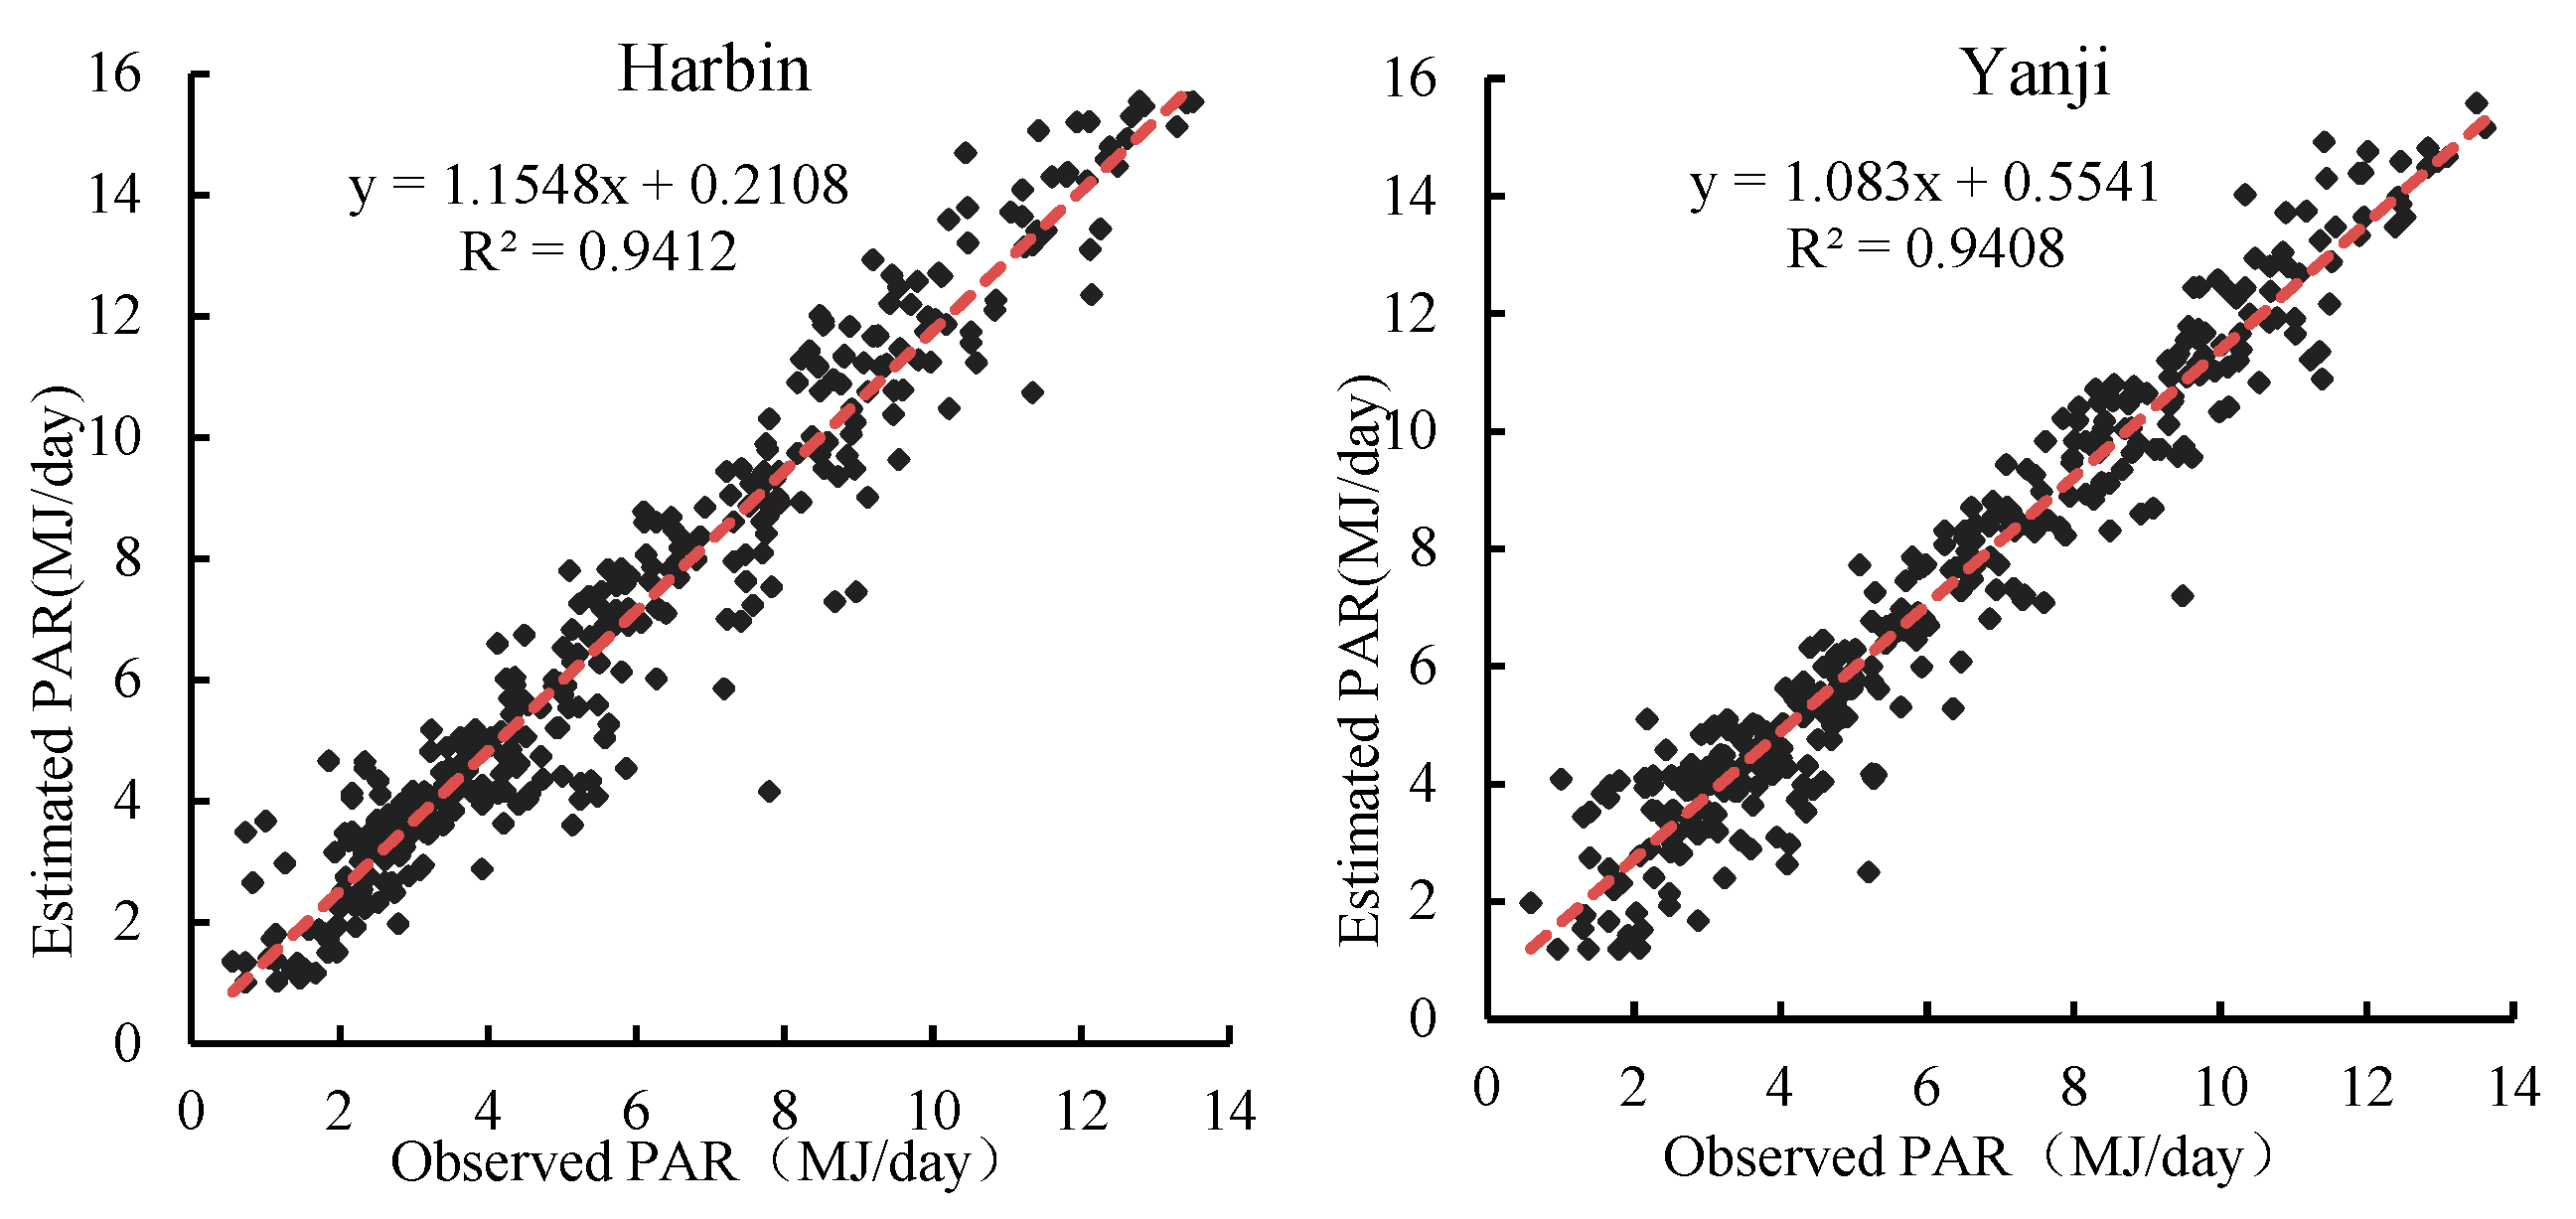
In this study, to evaluate the accuracy of the PAR, the estimated PAR was compared with the ground observation data obtained from meteorological radiation stations in 2008. Firstly, the solar radiation top of atmosphere, solar radiation in clear sky and daily solar radiation were estimated based on the model. As shown by the analysis on the solar radiation of six typical stations (Figure 3), it was evident that the distribution results of the stations basically conformed to the typical theoretical distribution model, and the simulated values of solar radiation in clear sky were consistent with the actual daily maximum values observed over many years. However, due to differences in atmospheric composition, cloud cover, atmospheric moisture content and atmospheric suspended matter content, the absorption and scattering of daily solar radiation top of the atmosphere were different, and this affected the total radiation reaching the ground. The correlation coefficient between the estimated PAR and the observed data surpassed 0.90 in Harbin and Yanji stations (Figure 4). The results indicated that the simulation accuracy of PAR generally met the requirements.

4.2. NPP Validation between Simulated NPP and MOD17 NPP

To further assess the model accuracy, this study also performed a comparative analysis on the estimated NPP based on GLO-PEM and MOD17 NPP products in 2003 and 2008 (Figure 5). The results indicated that the NPP values estimated by the model were generally consistent with the ones of MOD17 NPP, and the correlation coefficients at the pixel scale in 2003 and 2008 were 0.91 and 0.89, respectively. Therefore, the accuracy of NPP estimated by this model, which could represent the distribution of forests NPP of Northeast China, was relatively high.

5. Results

5.1. Spatio-Temporal Evolution of NPP in Northeast China

5.1.1. Variation Characteristics of Forests NPP from 2001 to 2019

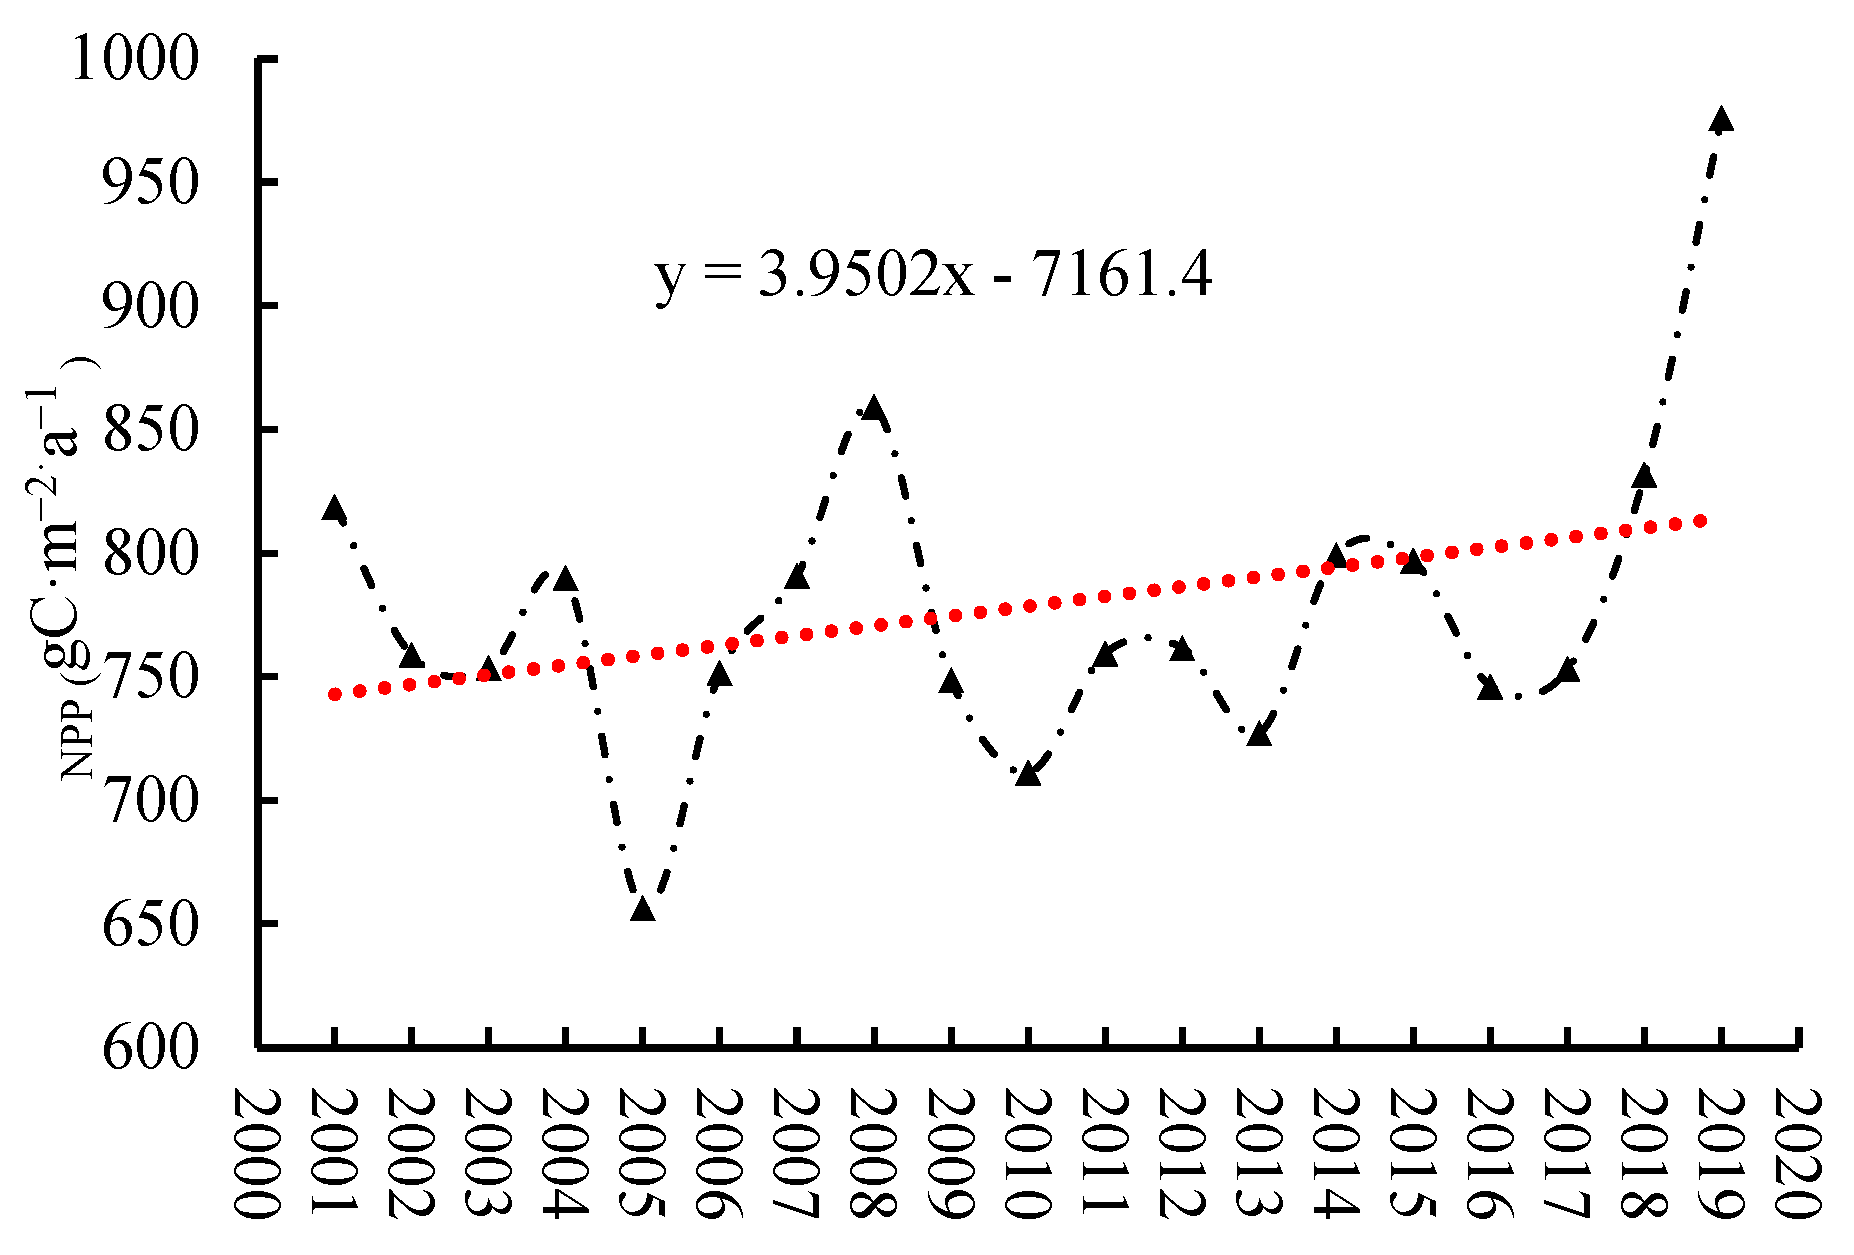
In order to reveal the evolution characteristics of NPP in northeast forests over time, this study selected the average NPP as an indicator of ecological environment quality from 2001 to 2019. Overall, this study found an increasing trend with an average increase of 3.95 gC·m−2·a−1 (Figure 6) in the analyzed years. Specifically, there was a downward trend from 2001 and 2005, with a decrease of 19.85%. Then, due to the large-scale implementation of natural forests protection and other ecological restoration projects in Northeast China, the ecological environment quality rapidly increased during the period of 2005–2008 and the NPP reached 859.16 gC·m−2·a−1 in 2008. However, the average NPP did not show a trend of continuous increase after 2008. Instead, it showed a severe decline with a reduction of −17.22% from 2008 to 2010, which may be related to large-scale drought events. Subsequently, the NPP gradually increased again from 2010 to 2015, mainly due to the climate and the national attention to the protection of natural forests. During the period of 2016 to 2019, the mean NPP had a slight drop in 2016, 2017. Subsequently, the mean NPP reached the maximum 976.17 gC·m−2·a−1 in 2019. It is likely to be affected by a range of climate changes, such as rising regional temperatures, permafrost degradation, shorter freezing–thawing times and so on [58,59,60].

5.1.2. Inter-Annual Variation of NPP of Different Forests Types

Next, this study estimated the NPP of different kinds of forests to reveal the variation characteristics of these forests. The average value of five forests NPP in Northeast China from 2001 to 2019 were ranked from high to low as follows: temperate coniferous forest > mixed forest of temperate coniferous forest and deciduous broad-leaved mixed forest > temperate deciduous broad-leaved forest > cold temperate and temperate mountain coniferous forest > temperate deciduous shrub. Compared with other four forests, the NPP of cold temperate and temperate mountain coniferous forest showed a higher increasing trend, with a rate of 8.89 gC·m−2·a−1. The reason is likely that global warming has become an unstoppable global climate problem in the last 20 years, leading to a significant increase in NPP [59]. Similarly, the NPP of other forest types all showed an increasing trend of different amplitude. The remaining forest types with different increasing rate from high to low is Mixed forest of temperate coniferous and deciduous broadleaf, temperate coniferous forests, temperate deciduous broadleaved forest and temperate deciduous shrub, whose rate is 8.08, 7.41, 6.34 and 6.05 gC·m−2·a−1, respectively.
From the NPP changes of different forests in different time periods (Figure 7), it was evident that the NPP of various forests showed a decreasing trend from 2001 to 2005, and then went up gradually and reached the highest point in 2007 and 2008. However, the NPP declined significantly again from 2009, mainly because of the severe summer drought. In recent years, that is from 2017 to 2019, the NPP of these forests increased significantly. Specifically, the temperate deciduous broad-leaved forest, which accounted for 49.14% of the study area, its average NPP reached 1067.91 gC·m−2·a−1. During the period of 2001 to 2019, there are two peaks for this forest type, which peaked at 942.75 gC·m−2·a−1 in 2008 and 2067.91 gC·m−2·a−1 in 2018, respectively. As for the cold and temperate mountain coniferous forest, mixed forest of temperate coniferous and deciduous broadleaf, their change trends of NPP were overall consistent with the one of temperate deciduous broad-leaved forest. Among them, the NPPs of the two types of forests decreased significantly during the period of 2004–2005 and 2008–2009. In the first stage, they varied from 803.66 gC·m−2·a−1 to 753.08 gC·m−2·a−1 and from 902.31 gC·m−2·a−1 to 769.40 gC·m−2·a−1, respectively. Next, the NPP in the second phrase declined more seriously than previously, with a rate of 18.32% and 16.06%, respectively. The highest NPP values reached 951.19 gC·m−2·a−1 and 1013.29 gC·m−2·a−1 in 2008, respectively. However, the NPP inter-annual changes in temperate deciduous shrub were relatively stable compared with the other types of forests.

5.1.3. Spatial Evolution of NPP, from 2001 to 2019, in Northeast China, in Different Periods

Based on the GLO-PEM, this study firstly estimated the NPP of Northeast China from 2001 to 2019, and then analyzed its spatio-temporal evaluation in different stages, namely the phases 2001–2005, 2006–2010, 2011–2015 and 2016–2019 (Figure 8). The dynamic evolution of NPP in the study area showed a clear spatial heterogeneity, with a decreasing trend from southeast to northwest. Overall, the average NPP of the study area was 778.54 gC·m−2·a−1 and the change of NPP in the high-value areas was from 700 to 1300 gC·m−2·a−1, with a small fluctuation every five years. The regions with high NPP were mainly located in the east of Changbai Mountain and the south of Zhangguangcai Mountain, which were mainly covered with deciduous broad-leaved forest, mixed forest of temperate coniferous and deciduous broad-leaved, as well as temperate deciduous shrub. Because this region has favorable hydrothermal conditions affected by the monsoon climate and it is located in the humid zone of the mid-temperate zone, thus resulting in better vegetation growth. For the early stage, the median-area NPP (700–900 gC·m−2·a−1) increased by 10.36% from the first stage (2001–2005) to the second stage (2006–2010), mainly in the northwest of Bin County in Zhangguangcai Mountain, the west of Wuchang City, Acheng City, Ningan City, Jilin City and the west of Shulan City. The reason is likely that the lower-value area (0–500 gC·m−2·a−1) gradually moved to the middle value area over time, only accounting for 9.05% of the study area during the period of 2006–2010. Compared with other different time stages, the high-value NPP (700–1300 gC·m−2·a−1) in Changbai Mountain from 2017 to 2019 occupied a larger area. For instance, the NPP had an increasing rate of 6.92% compared to the stage of 2011–2015. This indicated that the ecological environment in Changbai Mountains had recovered quickly due to the implementation of natural forest protection project in recent years.

5.2. Future Trend of Forests NPP in Northeast China

5.2.1. Analysis on Spatial Changing Trend of NPP, from 2001 to 2019, in Northeast China

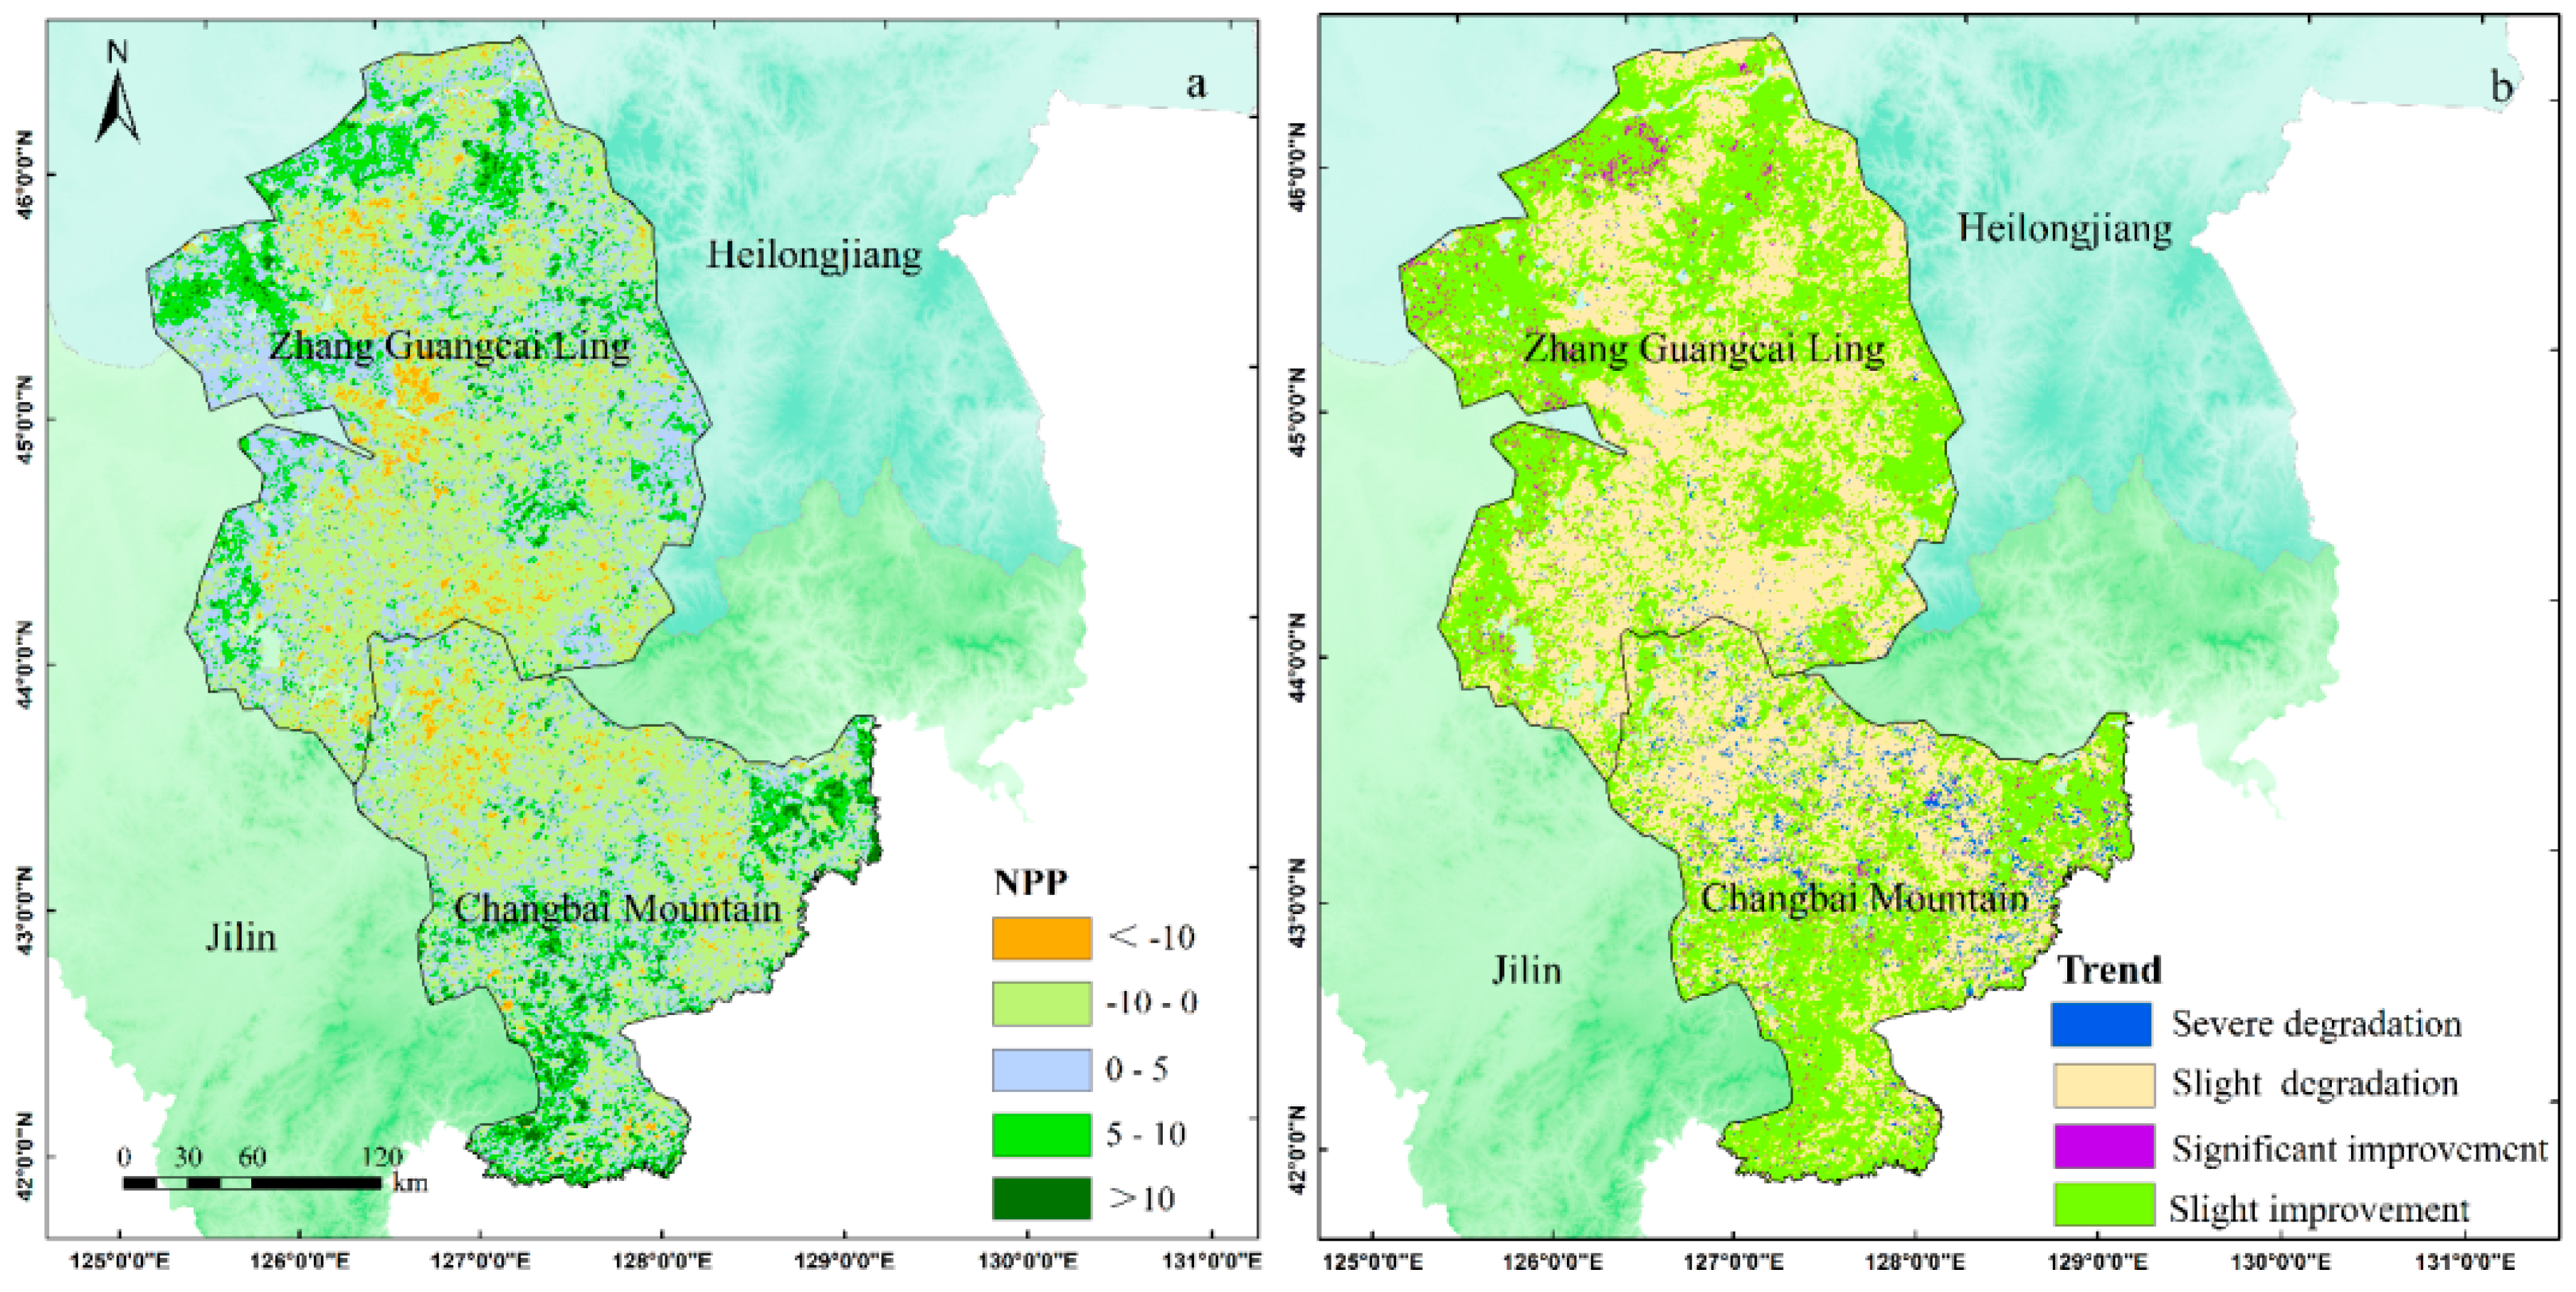
In order to explore the changing trend variation of NPP in Northeast China, this study estimated the Sen trend degree of NPP from 2001 to 2019 (z = 0.0990, slope = 0.2982). The overall NPP in the study area presented a not-significant increasing trend from 2001 to 2019, and the area with an increase and decrease trend accounted for 52.58% and 47.42%, respectively (Figure 9a). In terms of varying rates, the area with the NPP change rate between −10 and 0 gC·m−2·a−1 accounted for 44.36% of the whole area and it was mainly distributed in the south of Zhangguangcai Mountain and the north of Changbai Mountain. To a certain degree, the ecological environment in many regions showed a weak trend of decline. Additionally, there was a large proportion of the area with a change rate between 0–5 gC·m−2·a−1, mainly located in the western part of Wuchang City, the north of Yushu City, and the eastern part of Ningan City in Zhangguangcai Mountain. On the contrary, the regions with the change range of NPP between 5–10 gC·m−2·a−1 and over 10 gC·m−2·a−1 accounted for 14.37% and 2.19% of the whole area, respectively, and they mainly distributed around the edges of the study area within the spatial pattern of belts. The regions with a change rate under −10 gC·m−2·a−1 only made up 3.07% and they were mainly distributed in the central part of Wuchang City, the western part of Shangzhi City, the eastern part of Jiahe City and the western part of Dunhua City in the central part of Zhangguangcai Mountain. Thus, only few regions showed very serious ecological environment degradation.
In order to further determine whether the above regions showed a significant trend, we firstly performed the Mann–Kendall (M–K) test, and divided the significance test results into significant changes (Z > 1.96 or Z < −1.96) and insignificant changes (−1.96 ≤ Z ≤ 1.96) at 0.05 confidence level. Then, the NPP change trend at the pixel scale was calculated by superposing the changing trend results of Theil–Sen Median and significance results by M–K test, and by further dividing the results into four types (Figure 9b). The outcome demonstrated that the NPP change trend in most Northeast China was not significant from 2001 to 2019, and the areas with significant change only accounted for 3.99% of the whole study area. In terms of the upward trend, 50.78% of the areas showed a slight improvement, and only 1.79% showed a significant improvement. The areas with extremely significant improvement in ecological environment were mainly present in Bin County, the middle of Yanshou County, Acheng City, the west of Wuchang City, the east of Shuangcheng City, and distributed in the west of Shulan City in Zhangguangcai Mountain. The areas with slight improvements were mainly distributed in the periphery of the whole area. In terms of declining trend, 45.22% of the regions in Northeast China showed a slight degradation trend. They were mainly distributed in the south of Shulan City, east of Wuchang City, west of Dunhua City, Shangzhi City, and the intersections of Acheng City and Yanshou County in Zhangguangcai Mountain. The severely degraded areas accounted for only 2.20%, mainly distributed in the south of Longjing City, Helong City in the east of the Changbai Mountains, and the Jiahe City in the middle region.

5.2.2. Future Trend of NPP in Northeast China

In order to represent the change trend of ecological environment in the future, this study estimated the Hurst index of NPP in Northeast China in the past 19 years. The Hurst index in Northeast China will fluctuate between 0.17 and 0.93, and the average Hurst index will be 0.49 (Figure 10). The regions with Hurst index less than 0.50 will account for 55.79%, indicating that the area with a reverse-direction NPP change will be bigger than the one with a co-directional feature in Northeast China. Particularly, the pixel number of Hurst index between 0.40 and 0.60 will account for 73.98%, while the pixel number with an index lower than 0.40 and greater than 0.60 will account for 15.78% and 10.24%, respectively. This illustrates that the regions with strong reverse direction feature and strong co-directional feature in Northeast China will be relatively low abundant. The region with high Hurst index (0.60–0.93) will mainly distribute in the northern part of the mixed forest and of the coniferous and deciduous broad-leaved belt in the south of the temperate zone, whereas the region with a low value index (0.16–0.40) will mainly distribute in the northern part of Zhangguangcai Mountain and in the southern part of Changbai mountains.
To better reveal the future trend and sustainability of NPP in Northeast China, this study overlaid the current NPP change trend and Hurst index. About 30.68% of the study area is predicted to switch from improvement to degradation, especially in Yanshou County, Shangzhi City, Fangzheng County, Ningan City and Bin County in the north of Zhangguangcai Mountain, as well as in Fusong County and Changbai Korean Autonomous County in Changbai Mountain range. The areas with continuous improvement will account for 21.99% of the total area and they will mainly distribute in Shuangcheng and Acheng City in the north of Zhangguangcai Mountain and the south of Changbai Mountain. Moreover, about 25.11% of regions will exhibit a descending trend of the NPP that will be reversed in the future. These areas will be clustered in the west of Shangzhi City, the east of Acheng City and the north of Tonghe County in the northwest of Zhangguangcai Mountain, and in strips in Antu County of Changbai Mountain. However, the regions with a continuous degradation will account for 22.22% and they comprise Jiahe City and Dunhua City in the central part of Northeast China.

5.3. Phenology Regularity of Forests over Time in Northeast China

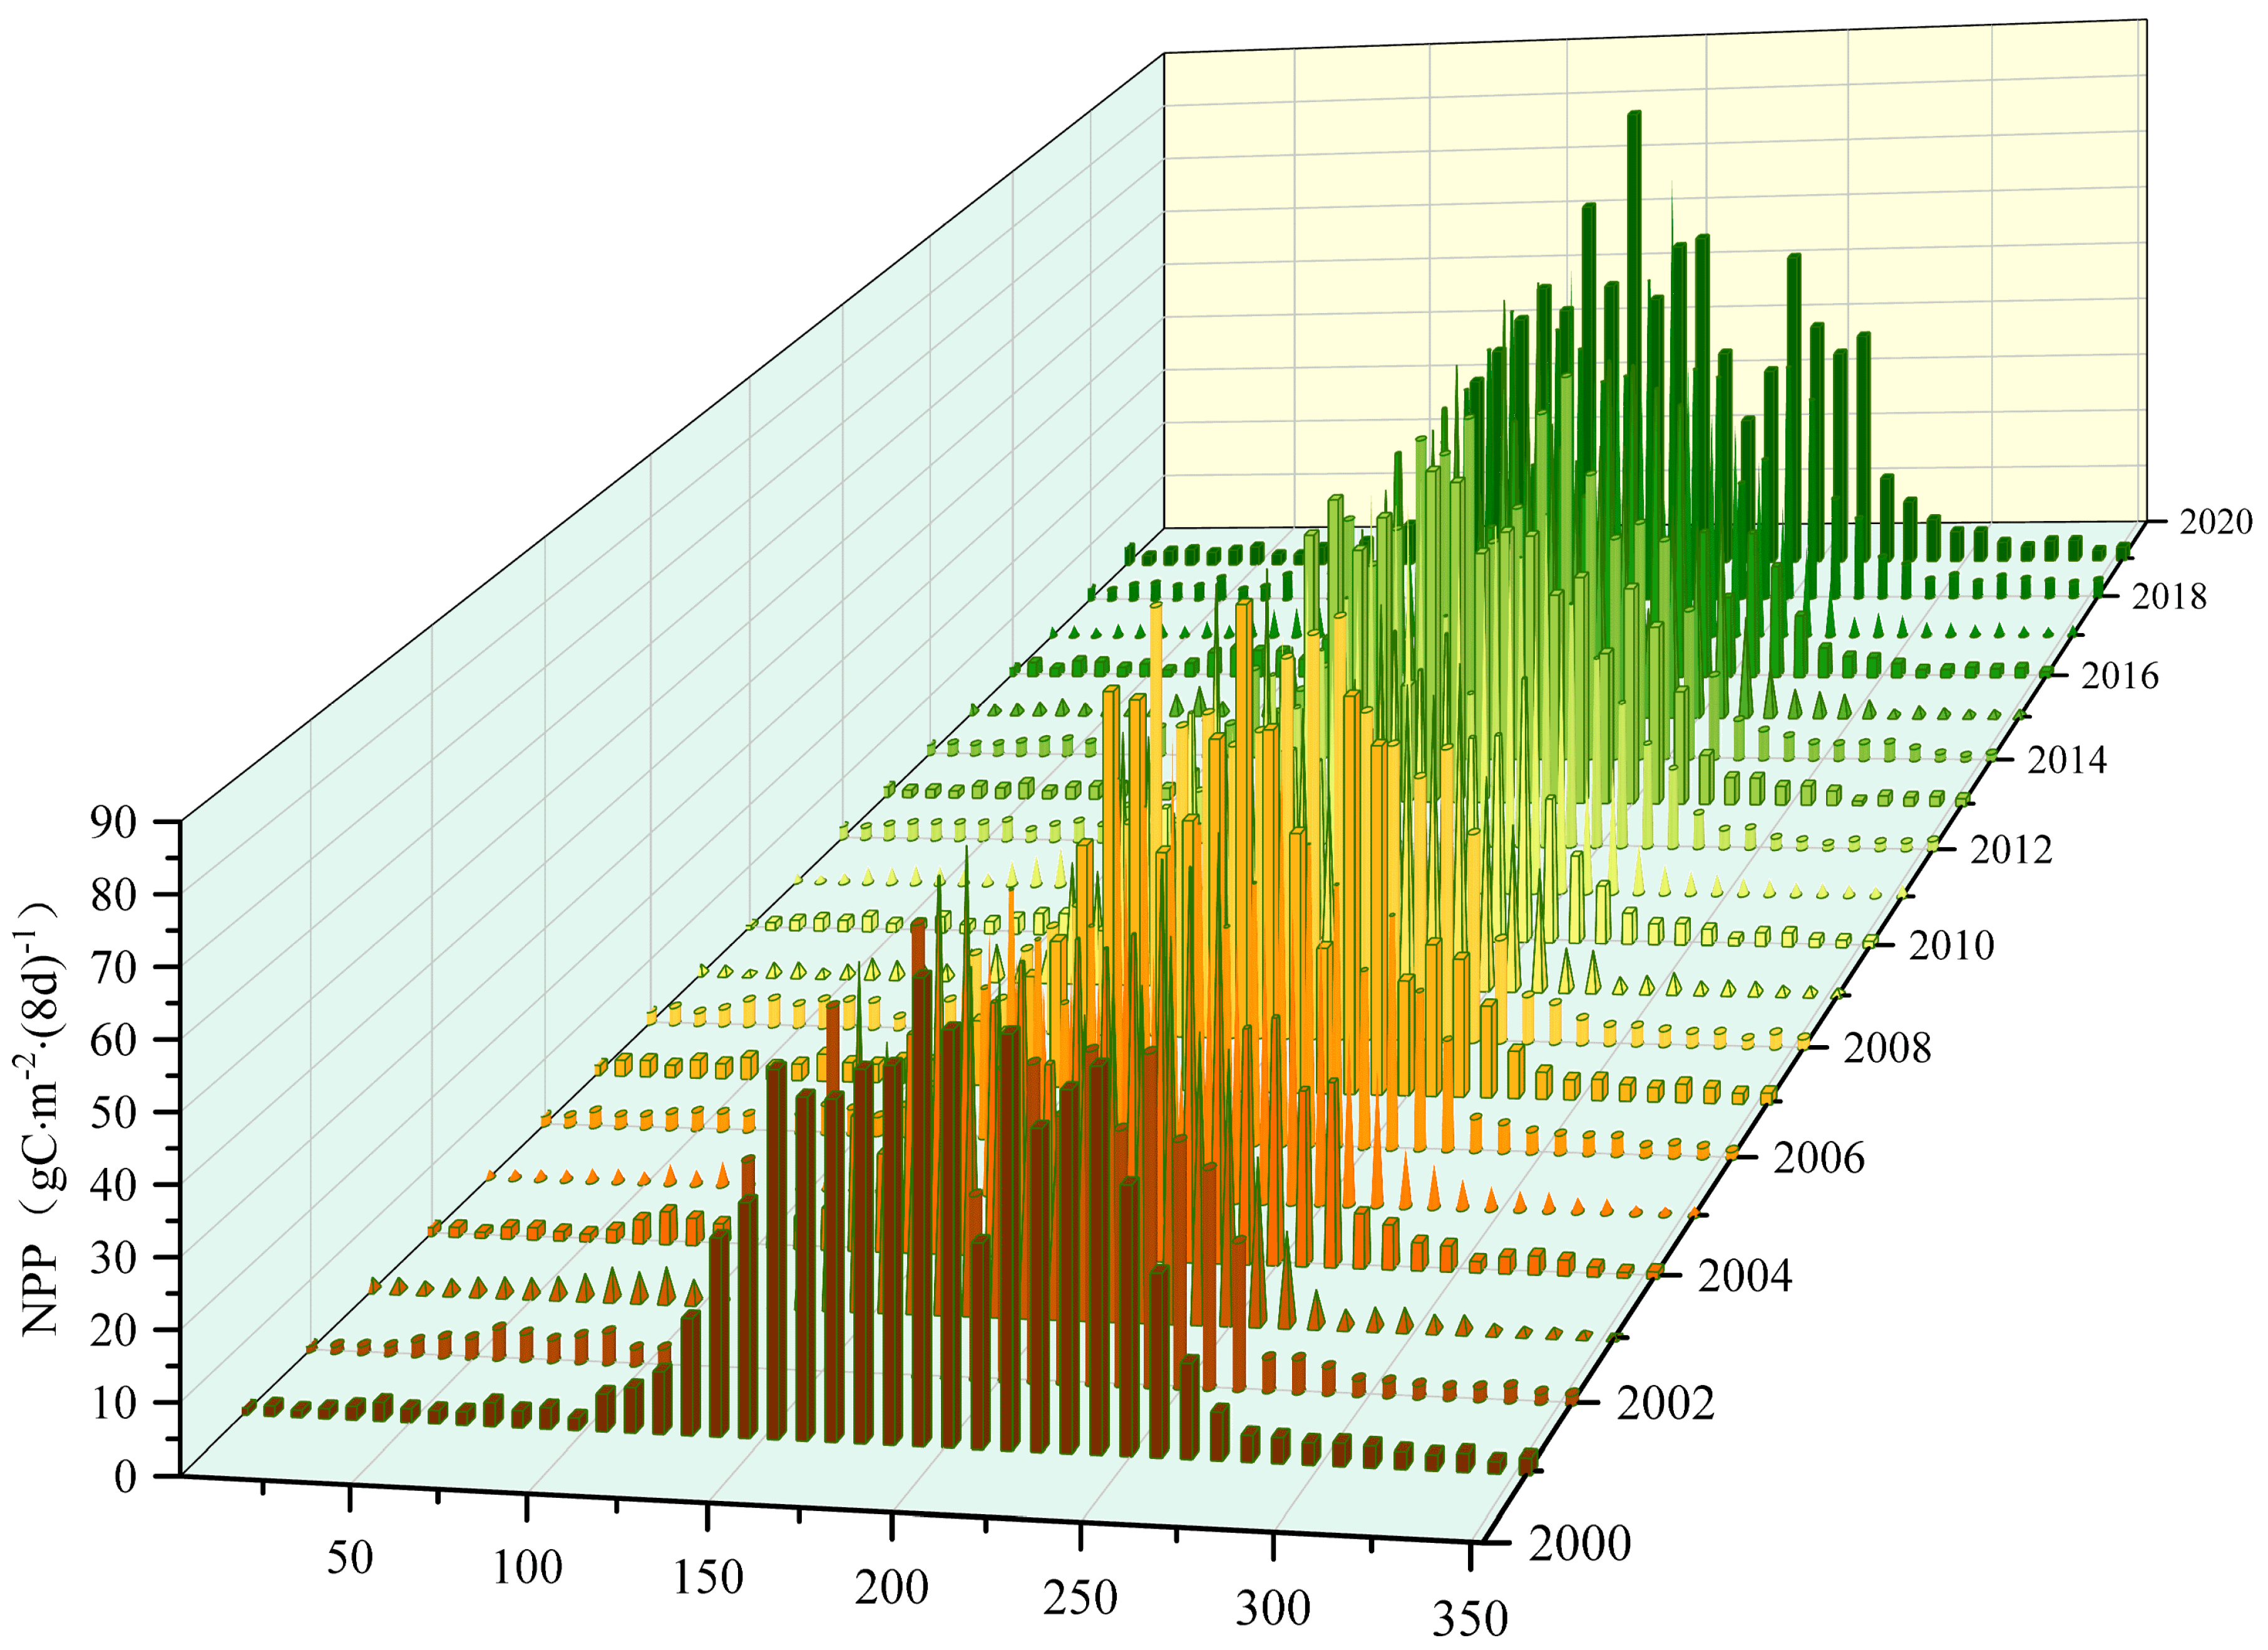
In this study, we mainly explored the changing trend of forest NPP every eight days, from 2001 to 2019, to reveal the phenology regularity in Northeast China (Figure 11). Specifically, the first NPP represents the average accumulated NPP from 2001 to 2019, from the first to the eight day. The results indicated that the period of NPP accumulation in northeast forests mainly ranged from the 145th to 257th days, i.e., from May to September, when good hydrothermal conditions were occurring. The total amount of NPP in this growth period accounted for 81.19% of the annual average. In addition, the inter-annual fluctuation range of NPP in forests during growing season was larger than the one during non-growing season. In terms of seasonal changes, the NPP in northeast forests accumulation mainly took place from the 161st to 241st days, during the summer time, where the cumulative amount of NPP was 489.13 gC·m−2·(8d)−1, accounting for 63.88% of the total annual NPP. In the spring (65th–153rd days), the cumulative amount of NPP was relatively high, accounting for 19.26% of the total annual NPP. However, as for the autumn (249th–329th days) and the winter (1st–57th and 337th–353rd days), their amounts of the accumulation NPP were 108.01 and 21.04 gC·m−2·(8d)−1, only accounted for 14.11% and 2.75%, respectively. During this period, the plant grew extremely slowly due to the influence of Mongolian high pressure and low temperature in the majority of the Northeast China areas.
According to the average NPP, every eight days, from 2001 to 2019, the phenomenon of phenology advance or lag occurred in all the vegetation growth seasons in different periods. During the period of 2001–2005, there was a remarkable increase of the growth of forests on the 105th–153rd days of 2004 and 2005. On the contrary, the growth season of forests in Northeast China advanced in 2007 and 2008. This was probably due to the extremely warm winter leading to the early increase of NPP during that period. Furthermore, the NPP growth in 2008 had an evident advance, up to 2.5 times the average on the 105th day. During the period of 2010–2015, a significant advance has occurred in the growth of forests. However, by the 153rd day, the NPP accumulation had a significant decrease from 55.80 to 22.97 gC·m−2·(8d)−1. From 2016 to 2019, due to the aggravation of global warming and the implementation of ecological engineering, the accumulation of forest NPP increased significantly from day 1 to day 353.

5.3.1. Phenology Regularity of Forest at the Start of the Vegetation Growth Season (SOS)

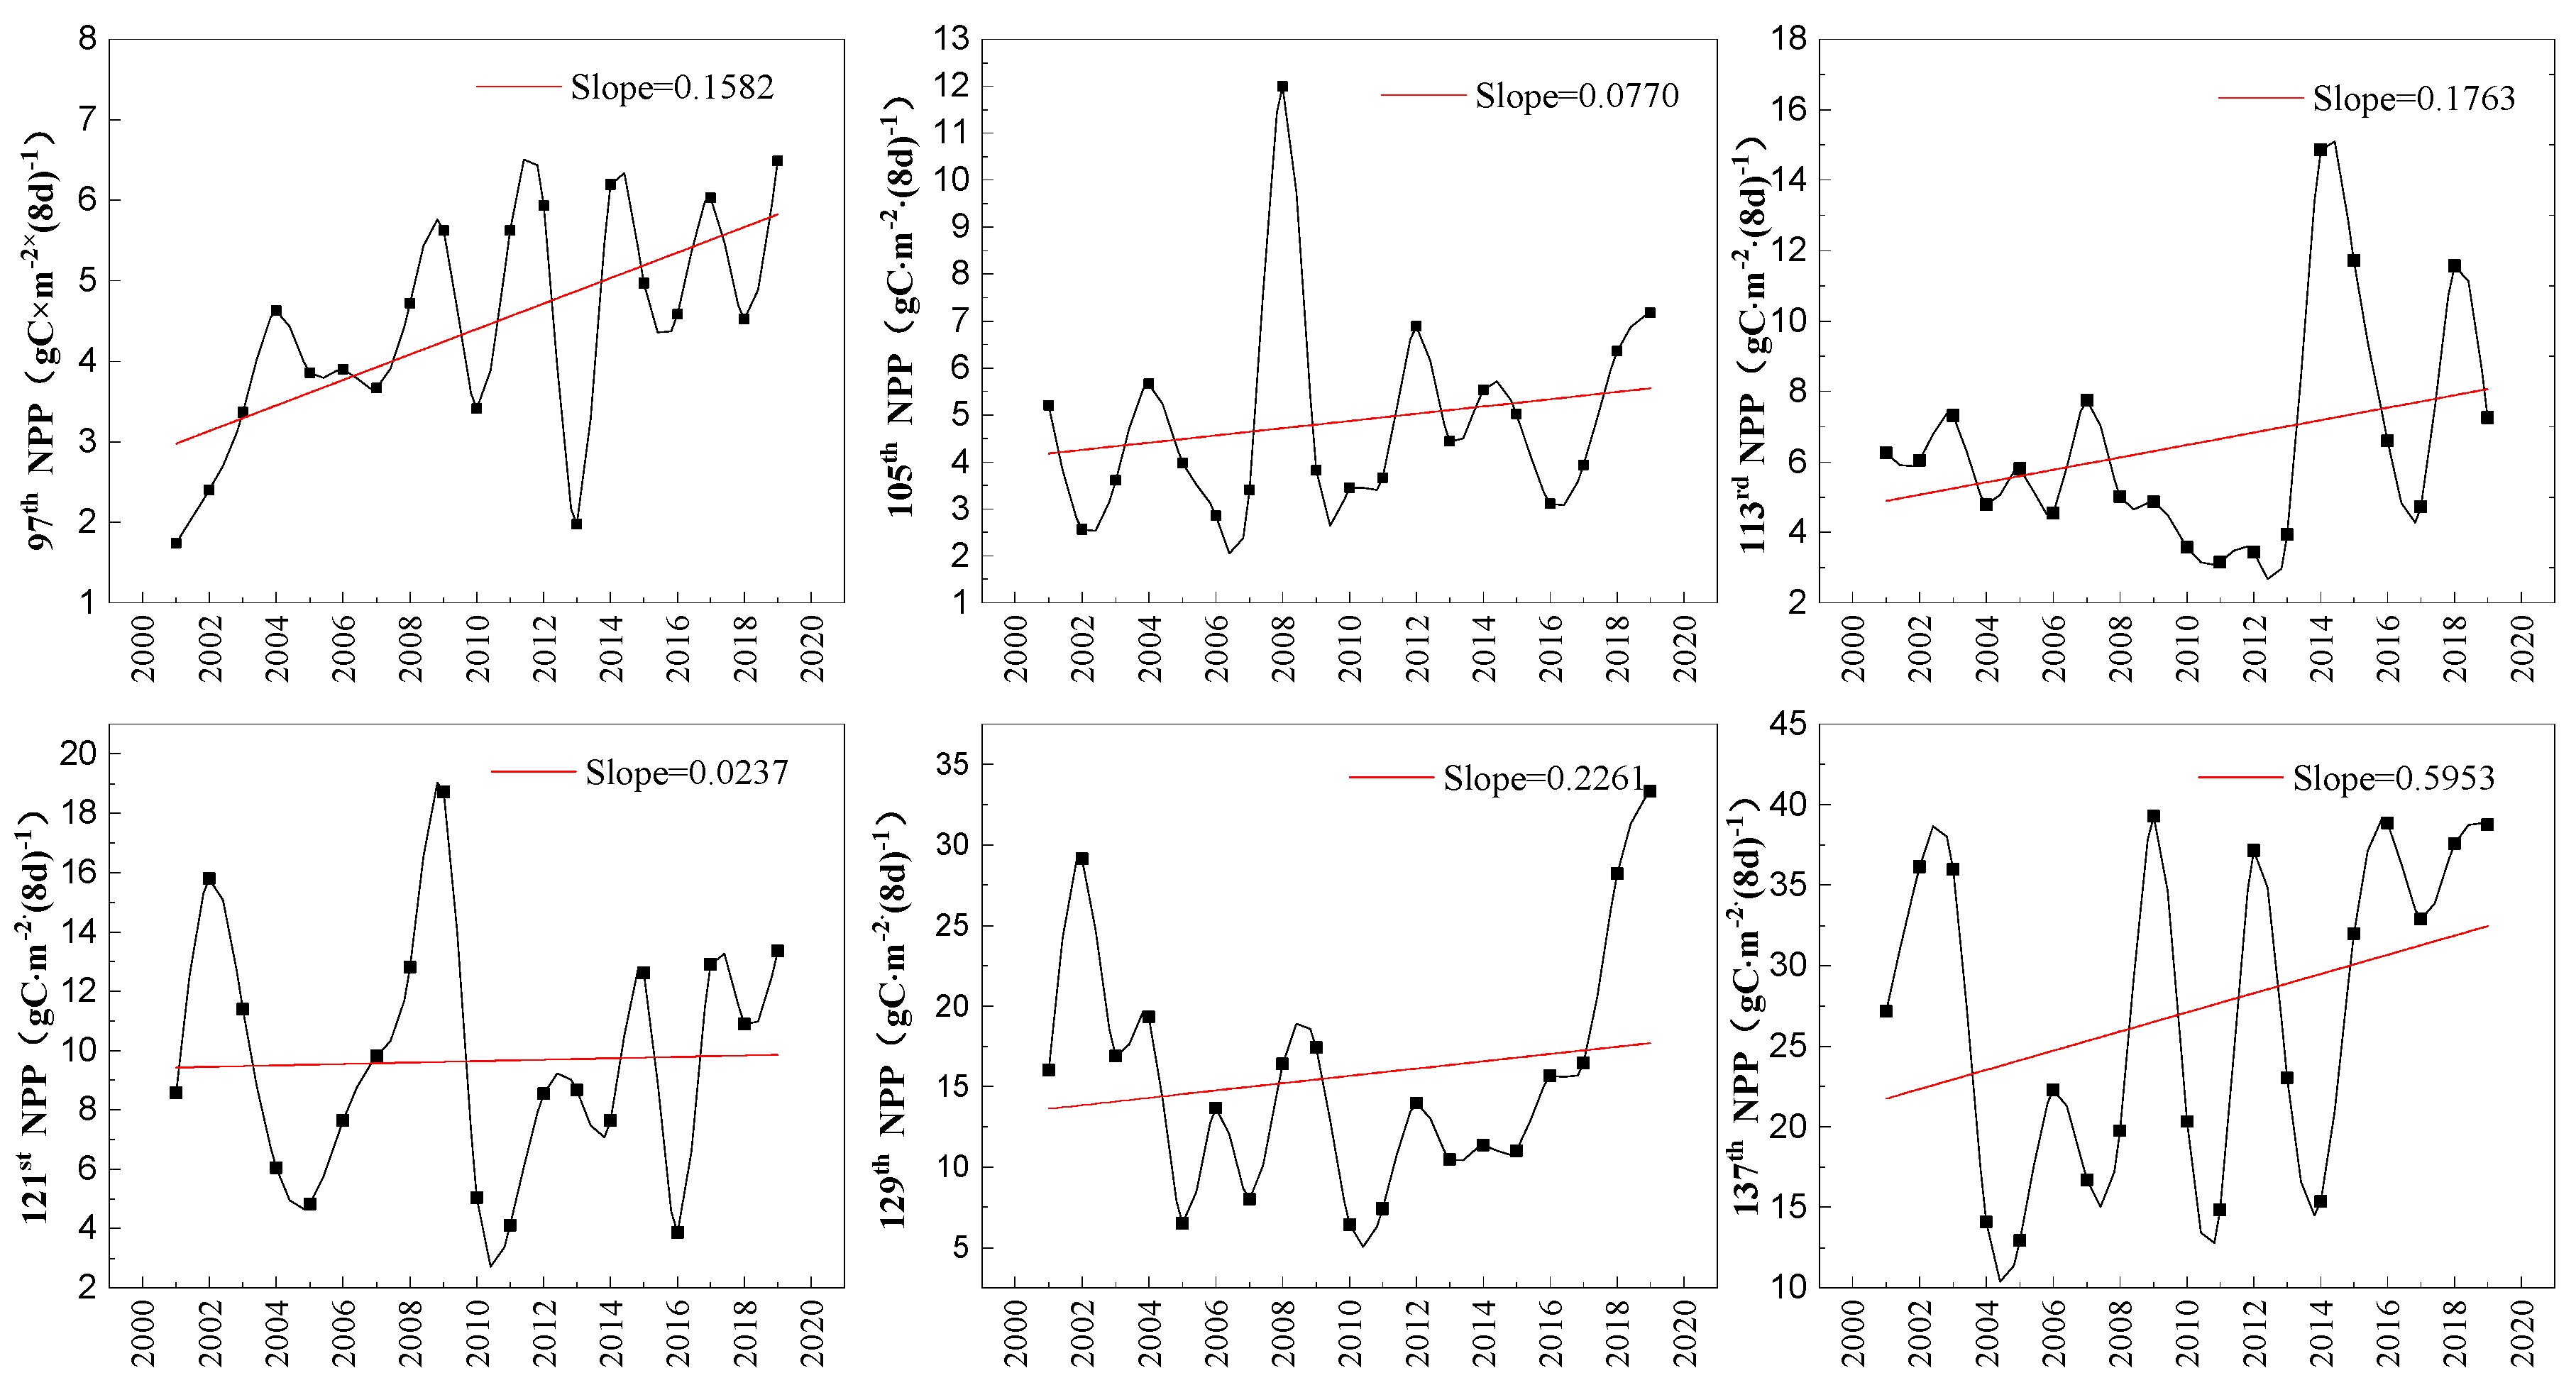
In order to reveal the phenological regularity of forest, this study intends to explore the changing trend of NPP every eight days in the initial growth period. According to the relevant research [61], the starting growth date of most forests in Changbai Mountain from 2001 to 2019 were mainly 97th days (representing the accumulated NPP of 97th–105th days) to 137th days (representing the accumulated NPP of 137th–145th days), that is, from mid-late April to early May (Figure 12). Firstly, what we need to explain is that 97th NPP represents the average accumulated NPP from day 97th to day 105th from 2001 to 2019. As can be seen Figure 12, the forests entered the rapid growth stage from the 97th day. Because of the rapid rise of the temperature, the NPP also increased significantly. From 2001 to 2019, the forest NPP all showed an apparent increasing trend, especially on the 129th and 137th days. On the whole, the starting date of growing season of forests in Changbai Mountain from 2001 to 2019 has been advanced.

5.3.2. Phenology Regularity of Forest at the End of the Vegetation Growth Season (EOS)

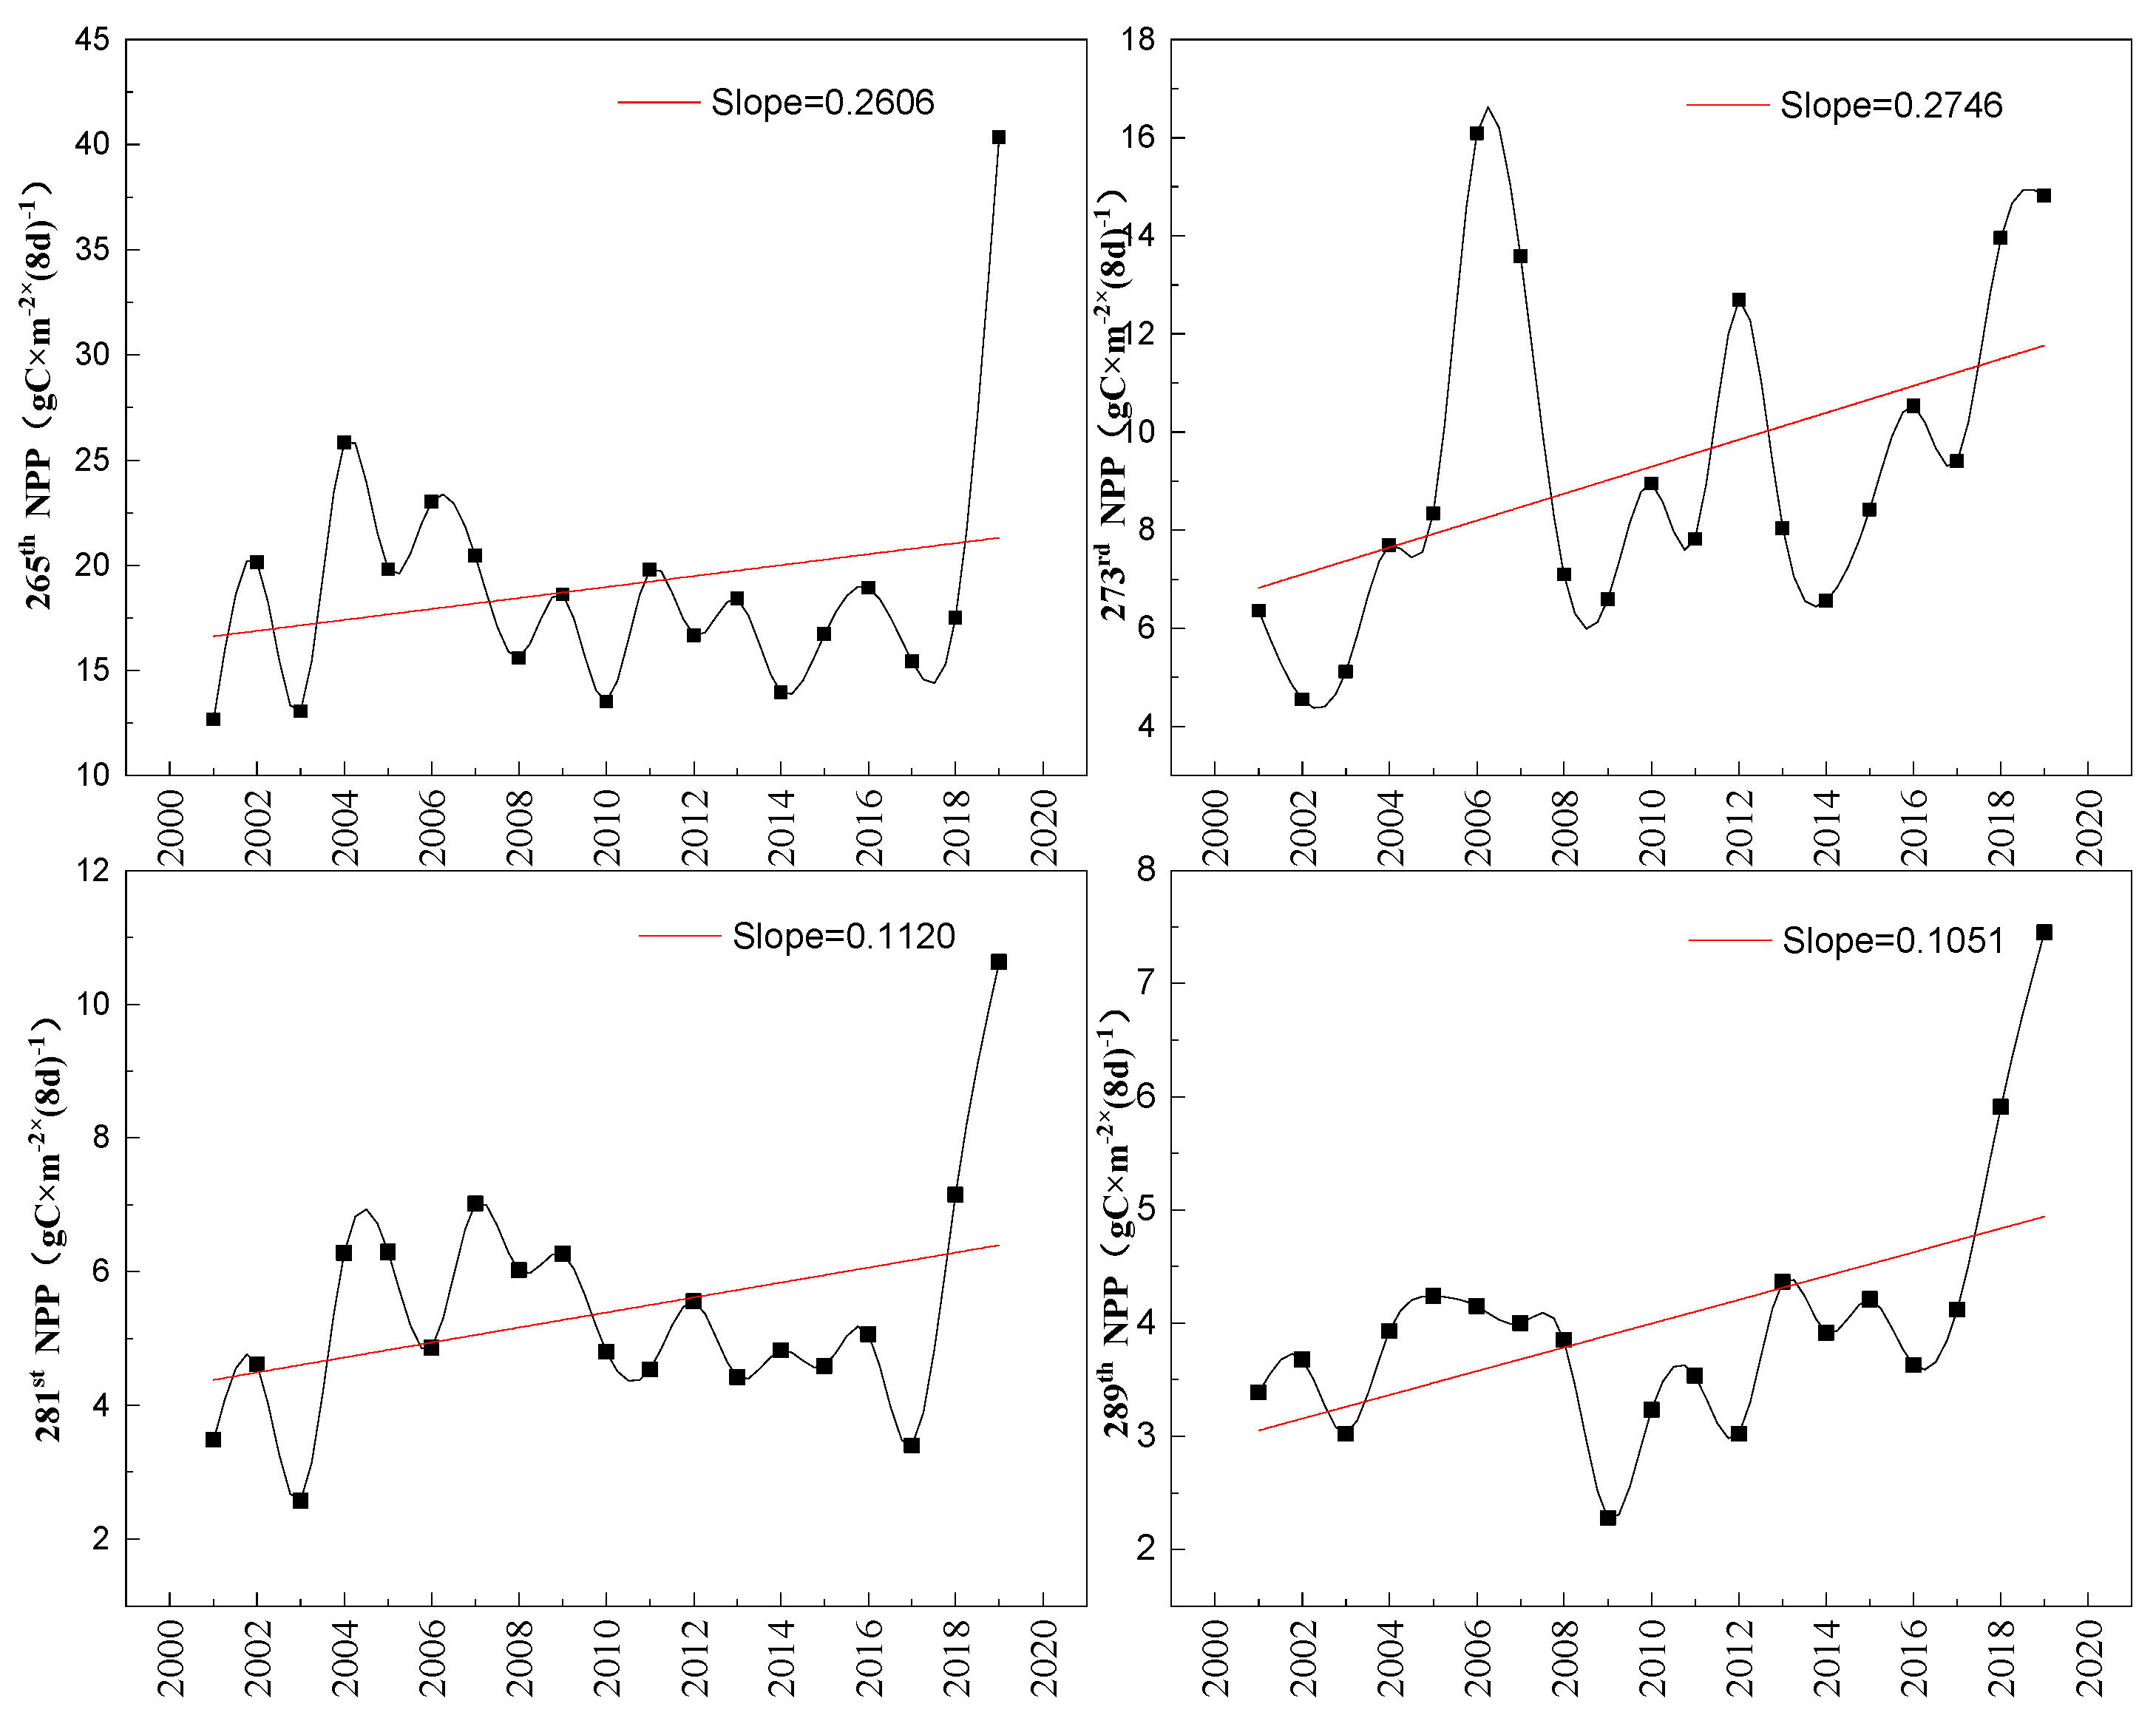
Since the Changbai Mountain, located in the high latitude area in the northeast, is influenced by climate changes, the ending date of forests is relatively late compared to most areas in China. The ending date of forests in Northeast China were concentrated on the 265th–289th days (Figure 13). It can be seen that the accumulated NPP in the ending date of forests growth all presented a slight increase, with an increasing of 0.26, 0.27, 0.11 and 0.11 gC·m−2·a−1, respectively. The above results showed that the phenological regularity of forest from 2001 to 2019 had an apparent lag in the ending date in Northeast China.

6. Discussion

6.1. Optimization about Station-Temporal Regularity Exploration

In recent 19 years, although natural forests protection and other ecological restoration projects had been largely implemented in Northeast China, the ecological environment did not all improved persistently during the whole study period. Hence, the construction and ecological restoration of forests in Northeast China still require continuous attention of the government. This study displayed that the NPP in Northeast China from 2001 to 2019 generally exhibited a slow rising trend with certain fluctuations, especially in the period of 2005–2008 and 2017–2019. Similarly, a latest study in Northeast China based on climate simulation scenarios of RCP 4.5 and RCP 8.5, shows an increase from 2011 to 2100, with corresponding reference years (1981–2010) under the future climate change due to the drastic climate change [60].
As for the inter-annual NPP changes of different forests types, on the whole, the NPP of all forest types all showed an increasing trend, especially cold temperate and temperate mountain coniferous forest and mixed forest of temperate coniferous and deciduous broadleaf. Lindholm et al. [61] also performed the NPP in China has a significant increase influenced by the temperature, precipitation and CO2 concentration. Moreover, there is a larger increase in NPP in broad-leaf and needle-leaf mixed forest in Northeast China [62]. During the period of 2001 to 2019, they experienced three major fluctuations indicating its poor stability. Two reasons may be accounted for this change. On the one hand, large-scale drought events had likely an influence on the NPP. On the other hand, this sensitive area was susceptible to human activities and the transformation of different land use types [4,37,63]. Therefore, the policy of under-forest economy, that is the government firstly could take some intercropping measures between forests in vertical structures, should be introduced in areas with a good forests ecological environment to promote the common development of under-forest economy and forest environment protection. In addition, the government should then establish ecological restoration and comprehensive treatment plan to enhance the ecological service function.

6.2. Summaries of and Sustainability Exploration of Forests and the Outlook for Future Ecological Environment

As a traditional forest region of China and an ecological barrier to revitalize the old industrial base, the decrease of forests NPP in Northeast China will seriously affect the ecological environment and national ecological security pattern [64]. According to our data, the NPP in Northeast China generally showed a minimal increase trend from 2001 to 2019. However, we also found that 47.42% of the area still exhibited a decreasing trend in this study. Notably, the ecological environment still showed a trend of continuous degradation in a large proportion of regions. Therefore, the management of the continuously degraded area should be accentuated in the future ecological environment construction of northeast forests, in order to achieve the sustainable development of forests ecosystem.
The study on the sustainability of NPP in Northeast China in the future indicates that the reverse direction feature of NPP change will be slightly stronger than the co-directional feature. It means that the degraded area will be slightly bigger than the improved areas. On the contrary, another study about Northeast China reported that the combined effects of climate change and CO2 fertilization on the increase of NPP were estimated to be 10%–20% for the 2030s and 28%–37% in the 2090s, using the improved TRIPLEX model [4]. Differences in the future prediction are mainly attributed to the following reasons. In this study, we focus on estimating NPP every eight days, using GLO-PEM and predicting the future ecological conditions using Hurst index [57,65,66] based on the estimated NPP from 2001 to 2019 instead of estimating the forest NPP in future different scenarios. However, Peng et al. [4] concentrated on estimating the NPP changes in 2030s to 2090s based on the reference baseline year (1999), using the TRIPLEX model, not considering the potential impacts of land-use changes.
In addition, about 30.68% of the study area will switch from improvement to degradation, especially in the Changbai Mountain. Since most of the areas in Yanshou County, Shangzhi City and Fangzheng County in this area are temperate broad-leaved forests, it is advisable to intercrop the cultivated vegetation and the shrubs with higher ecological benefits. In addition, a single forest type may lead to more frequent outbreaks of pests and diseases, which could destroy the forest health, and then seriously limit the sustainable improvement of forest in the future [67]. Hence, the government also should restore the local precious broad-leaved tree resources so as to increase the diversity of forests types. Remarkably, the regions with a trend of continuous degradation will also account for 22.22% of the total area. As the layout of the degraded area is relatively dispersed, natural environmental resources are extremely vulnerable to regional damage. Therefore, more attention should be paid to the pattern optimization of forests types in Northeast China, to improve the construction of ecological civilization.

6.3. Uncertainty Discussions for Phenology Regularity in Northeast China

Phenology, as a comprehensive indicator of climate and natural environment changes, has been widely used worldwide in many assessment projects about environmental change impact. In this study, we determined the SOS, that is to say, the date of green-up date, in the spring phenology, and EOS in the winter phenology of forests based on the statistics references of the NPP time series every eight days, from 2001 to 2019, in Northeast China. Our study found that the whole growth period of forest in Northeast China became extended with the change of phenology. Concretely, our results performed that there is an advanced SOS and a significant delayed EOS in forest ecosystem in Northeast China, from 2001 to 2019. In addition, other scholars have developed many phenology retrieving methods based on remoting-sensing data, such as machine learning and vegetation indices from time series based on software TIMESAT, but the strength and weakness between different retrieving methods are still unclear [68,69,70,71]. A latest study in Northeast China also found that there is an advanced at the start of the growing season (SOS) with in forest ecosystems based on statistics and analysis [72]. However, there are some uncertainties in exploring the phenological period. For example, this study only explored the EOS and SOS of forests roughly based on the eight-day NPP instead of some photo-temperature driven phenological model. Moreover, since we have not yet found the more precise way to study the growth period of each forest type in detail, this also creates uncertainty.
The study of phenology regularity not only improves the understanding of vegetation response to climate change, but also influences the forest construction [16,73,74]. Of course, there are some limitations in the exploration of vegetation phenology. Firstly, we did not explore the spatial phenology since we pay more attention to the analysis from multiple time series. In addition, we recommend that the multi-model retrieving methods based on satellite data should be compared to explore the vegetation phenology in the different ecosystems in the future. To conclude, to realize the sustainable development of forest ecosystem, it is suggested that the forest management plan should be scientifically formulated based on understanding and mastering the growth regularity and phenological periods of different forests in Northeast China.

6.4. Limitations in the NPP Estimation of GLO-PEM and Verification

In summary, this study revealed the phenological regularity by exploring the NPP trend every eight days in the early, middle and ending growth in Northeast China, from 2001 to 2019, based on the GLO-PEM. It could provide new useful knowledge for promoting symbiotic socioeconomic–ecological interactions and regional sustainable development. However, the used model showed few limitations that needed to be further addressed. Firstly, a certain error in the accuracy verification may occur, due to the limited amount of measured data in the northeast forest. However, the simulated results have been verified by using the other remoting-sensing data (MOD17 NPP) in 2003 and 2008, proving that the accuracy of our model is very high (please see Section 4.2 for specific validation). Furthermore, the scale difference between the remote-sensing data and the ground-measured data may also lead to some errors. There were also some uncertainties when running GLO-PEM, mainly considering the temperature, precipitation, land surface water index, different forest types and so on. In the future, the NPP precision could be well enhanced if more useful data were taken into the improved model, such as human distribution factor, CO2 concentration and other factors.

7. Conclusions

In this study, firstly, we applied the verified GLO-PEM to estimate the NPP every eight days, from 2001 to 2019, based on remote-sensing data and climate data. Studies showed that an increasing trend occurred with an average of 3.95 gC·m−2·a−1, especially during the period of 2016–2019. In addition, we explored the vegetation phenology, using the estimated NPP data from the time series at the early and ending date of the growth season. We found that there is a significant advance in SOS and a delayed EOS from 2001 to 2019, causing the prolong of the whole growing season of forests in Northeast China. The above studies have provided a basis for further phenology regularity. In future research, we also need to consider the driving mechanism of vegetation phenology and pay more attention to the inversing methods.
Finally, methods including Sen–Mann–Kendall trend and Hurst index were combined to explore the sustainability analysis and future ecological environment in Northeast China. Generally, more researchers explore the future ecological environment using different climate scenarios based on the older reference year. We proposed a different method to explore the NPP changes from the time series of 2001–2019 in the future. Studies demonstrated that the overall NPP presented a not-significant increasing trend from 2001 to 2019, but 47.42% of the area still exhibited a decreasing trend, mainly in the central part of Zhangguangcai Mountain and the northern part of Changbai Mountain. In the future, the regions with a reverse-direction NPP change will be bigger than the one with a co-directional feature in Northeast China. Moreover, the regions with a continuous degradation will account for 22.22%, which distributed in Jiahe City and Dunhua City in the central part of Northeast China. These conclusions could provide a strong potential template for tropical managers and sustainable management in Asia, even in the global climate change.

Author Contributions

Conceptualization, Q.J. and X.D.; Data curation, C.W. and K.L.; Formal analysis, C.W.; Funding acquisition, Z.Z.; Investigation, Z.Z.; Software, C.W. and K.L.; Supervision, Q.J. and X.D.; Writing—original draft, C.W.; Writing—review & editing, Q.J. and X.D. All authors have read and agreed to the published version of the manuscript.

Funding

This project was funded by the Key Project of National Key Research and Development Plan (No.2017YFC050400103), National Science and Technology Projects (No.2017ZX07101004 and No. 2017ZX07108002), the Major Research Plan of National Natural Science Foundation of China (No. 41901234 and No.51909052), the Fundamental Research Funds for the Central Universities (No. 2015ZCQSB03) and the Hebei Natural Science Foundation (No. D2015207002).

Acknowledgments

Data provision and support from projects of the National Natural Science Foundation of China (No.71225005) and the Exploratory Forefront Project for the Strategic Science Plan in IGSNRR, CAS are also appreciated. In addition, we gratefully acknowledge the financial support provided by the “Restoration and Reconstruction Technology and Demonstration project of typical Degraded Wetlands in Northeast China”, as well as the help from all the professors and master’s students of Beijing Forestry University.

Conflicts of Interest

The authors declare no conflict of interest.

References

  1. Hansen, M.H.; Li, H.; Svarverud, R. Ecological civilization: Interpreting the Chinese past, projecting the global future. Glob. Environ. Chang. 2018, 53, 195–203. [Google Scholar] [CrossRef]
  2. Zhang, M.; Liu, Y.; Wu, J.; Wang, T. Index system of urban resource and environment carrying capacity based on ecological civilization. Environ. Impact Assess. Rev. 2018, 68, 90–97. [Google Scholar] [CrossRef]
  3. Pacala, S.W.; Hurtt, G.C.; Baker, D.; Peylin, P.; Houghton, R.A.; Birdsey, R.A.; Heath, L.; Sundquist, E.T.; Stallard, R.F.; Ciais, P.; et al. Consistent Land- and Atmosphere-Based U.S. Carbon Sink Estimates. Science 2001, 292, 2316–2320. [Google Scholar] [CrossRef] [PubMed] [Green Version]
  4. Peng, C.; Zhou, X.; Zhao, S.; Wang, X.; Zhu, B.; Piao, S.; Fang, J. Quantifying the response of forest carbon balance to future climate change in Northeastern China: Model validation and prediction. Glob. Planet. Chang. 2009, 66, 179–194. [Google Scholar] [CrossRef]
  5. Schulze, E.D.; Heimann, M.; Harrison, S.; Holland, E.; Lloyd, J.; Prentice, I.C.; Schimel, D.S. Global Biogeochemical Cycles in the Climate System; Academic Press: Cambridge, MA, USA, 2001. [Google Scholar] [CrossRef]
  6. Alexandra, M.; Olschewski, R.; Unterberger, C.; Knoke, T. The valuation of forest ecosystem services as a tool for management planning–a choice experiment. J. Environ. Manag. 2020, 271, 111008. [Google Scholar]
  7. Choi, S.-D.; Lee, K.; Chang, Y.-S. Large rate of uptake of atmospheric carbon dioxide by planted forest biomass in Korea. Glob. Biogeochem. Cycles 2002, 16, 36-1–36-5. [Google Scholar] [CrossRef]
  8. Fang, J.Y.; Oikawa, T.; Kato, W.M.; Wang, Z. Biomass carbon accumulation by Japan’s forests from 1947 to 1995. Glob. Biogeochem. Cycles 2005, 19. [Google Scholar] [CrossRef]
  9. Griffiths, P.; Kuemmerle, T.; Baumann, M.; Radeloff, V.C.; Abrudan, I.V.; Lieskovský, J.; Munteanu, C.; Ostapowicz, K.; Hostert, P. Forest disturbances, forest recovery, and changes in forest types across the Carpathian ecoregion from 1985 to 2010 based on Landsat image composites. Remote Sens. Environ. 2014, 151, 72–88. [Google Scholar] [CrossRef]
  10. Hopkinson, C.; Chasmer, L.; Barr, A.; Kljun, N.; Black, T.A.; McCaughey, J. Monitoring boreal forest biomass and carbon storage change by integrating airborne laser scanning, biometry and eddy covariance data. Remote Sens. Environ. 2016, 181, 82–95. [Google Scholar] [CrossRef] [Green Version]
  11. Tan, L.M.; Arbabi, H.; Brockway, P.; Tingley, D.D.; Mayfield, M. An ecological-thermodynamic approach to urban metabolism: Measuring resource utilization with open system network effectiveness analysis. Appl. Energy 2019, 254, 254. [Google Scholar] [CrossRef]
  12. Baeza, S.; Paruelo, J.M. Spatial and temporal variation of human appropriation of net primary production in the Rio de la Plata grasslands. ISPRS J. Photogramm. Remote Sens. 2018, 145, 238–249. [Google Scholar] [CrossRef]
  13. Buchholz, T.; Keeton, W.S.; Gunn, J.S. Economics of integrated harvests with biomass for energy in non-industrial forests in the northeastern US forest. For. Policy Econ. 2019, 109, 102023. [Google Scholar] [CrossRef]
  14. Yan, Y.; Liu, X.; Wang, F.; Li, X.; Ou, J.; Wen, Y.; Liang, X. Assessing the impacts of urban sprawl on net primary productivity using fusion of Landsat and MODIS data. Sci. Total Environ. 2018, 1417–1429. [Google Scholar] [CrossRef] [PubMed]
  15. Miyazaki, S.; Ishikawa, M.; Baatarbileg, N.; Damdinsuren, S.; Ariuntuya, N.; Jambaljav, Y. Interannual and seasonal variations in energy and carbon exchanges over the larch forests on the permafrost in northeastern Mongolia. Polar Sci. 2014, 8, 166–182. [Google Scholar] [CrossRef] [Green Version]
  16. Yuan, M.; Zhao, L.; Lin, A.; Wang, L.; Li, Q.; She, D.; Qu, S. Impacts of preseason drought on vegetation spring phenology across the Northeast China Transect. Sci. Total Environ. 2020, 738, 140297. [Google Scholar] [CrossRef]
  17. Bandaru, V.; West, T.O.; Ricciuto, D.M.; Izaurralde, R.C. Estimating crop net primary production using national inventory data and MODIS-derived parameters. ISPRS J. Photogramm. Remote Sens. 2013, 80, 61–71. [Google Scholar] [CrossRef]
  18. Abdi, A.M.; Seaquist, J.; Tenenbaum, D.E.; Eklundh, L.; Ardö, J. The supply and demand of net primary production in the Sahel. Environ. Res. Lett. 2014, 9, 094003. [Google Scholar] [CrossRef]
  19. DeLucia, E.H.; Drake, J.E.; Thomas, R.B.; Gonzalez-Meler, M. Forest carbon use efficiency: Is respiration a constant fraction of gross primary production? Glob. Chang. Biol. 2007, 13, 1157–1167. [Google Scholar] [CrossRef] [Green Version]
  20. Chen, A.; Li, R.; Wang, H.; He, B. Quantitative assessment of human appropriation of aboveground net primary production in China. Ecol. Model. 2015, 312, 54–60. [Google Scholar] [CrossRef] [Green Version]
  21. Wang, G.; Guan, D.; Xiao, L.; Peart, M. Forest biomass-carbon variation affected by the climatic and topographic factors in Pearl River Delta, South China. J. Environ. Manag. 2019, 232, 781–788. [Google Scholar] [CrossRef]
  22. Forrester, D.I.; Tang, X. Analysing the spatial and temporal dynamics of species interactions in mixed-species forests and the effects of stand density using the 3-PG model. Ecol. Model. 2016, 319, 233–254. [Google Scholar] [CrossRef]
  23. Zhao, M.; Yang, J.; Zhao, N.; Liu, Y.; Wang, Y.; Wilson, J.P.; Yue, T. Estimation of China’s forest stand biomass carbon sequestration based on the continuous biomass expansion factor model and seven forest inventories from 1977 to 2013. For. Ecol. Manag. 2019, 448, 528–534. [Google Scholar] [CrossRef]
  24. Van Holsbeeck, S.; Srivastava, S.K. Feasibility of locating biomass-to-bioenergy conversion facilities using spatial information technologies: A case study on forest biomass in Queensland, Australia. Biomass Bioenergy 2020, 139, 105620. [Google Scholar] [CrossRef]
  25. Matsushita, B.; Xu, M.; Chen, J.; Kameyama, S.; Tamura, M. Estimation of regional net primary productivity (NPP) using a process-based ecosystem model: How important is the accuracy of climate data? Ecol. Model. 2004, 178, 371–388. [Google Scholar] [CrossRef]
  26. Gustavsson, L.; Haus, S.; Ortiz, C.A.; Sathre, R.; Le Truong, N. Climate effects of bioenergy from forest residues in comparison to fossil energy. Appl. Energy 2015, 138, 36–50. [Google Scholar] [CrossRef]
  27. Zhang, R.; Liang, T.; Guo, J.; Xie, H.; Feng, Q.; Aimaiti, Y. Grassland dynamics in response to climate change and human activities in Xinjiang from 2000 to 2014. Sci. Rep. 2018, 8, 1–11. [Google Scholar] [CrossRef]
  28. Xiao, X.; Hollinger, D.; Aber, J.; Goltz, M.; Davidson, E.A.; Zhang, Q.; Moore, B. Satellite-based modeling of gross primary production in an evergreen needleleaf forest. Remote Sens. Environ. 2004, 89, 519–534. [Google Scholar] [CrossRef]
  29. Xiao, X.; Zhang, Q.; Braswell, B.; Urbanski, S.; Boles, S.; Wofsy, S. Modeling gross primary production of temperate deciduous broadleaf forest using satellite images and climate data. Remote Sens. Environ. 2004, 91, 256–270. [Google Scholar] [CrossRef]
  30. Potter, C.; Randerson, J.T.; Field, C.B.; Matson, P.A.; Vitousek, P.M.; Mooney, H.A.; Klooster, S.A. Terrestrial ecosystem production: A process model based on global satellite and surface data. Glob. Biogeochem. Cycles 1993, 7, 811–841. [Google Scholar] [CrossRef]
  31. Prince, S.D.; Goward, S.N. Global Primary Production: A Remote Sensing Approach. J. Biogeogr. 1995, 22, 815. [Google Scholar] [CrossRef]
  32. Running, S.W.; Thornton, P.E.; Nemani, R.; Glassy, J.M. Global Terrestrial Gross and Net Primary Productivity from the Earth Observing System. Methods Ecosyst. Sci. 2000, 44–57. [Google Scholar] [CrossRef]
  33. Huang, C.-Y.; Asner, G.P.; Barger, N.N. Modeling regional variation in net primary production of pinyon–juniper ecosystems. Ecol. Model. 2012, 227, 82–92. [Google Scholar] [CrossRef]
  34. Li, J.; Cui, Y.; Liu, J.; Shi, W.; Qin, Y. Estimation and analysis of net primary productivity by integrating MODIS remote sensing data with a light use efficiency model. Ecol. Model. 2013, 252, 3–10. [Google Scholar] [CrossRef]
  35. Zhang, G.Q.; Zhu, J.J.; Li, R.P. Estimation of photosynthetically active radiation (par) using sunshine duration. Chin. J. Ecol. 2015, 34, 3560. [Google Scholar]
  36. Zhang, L.-X.; Zhou, D.-C.; Fan, J.-W.; Hu, Z.-M. Comparison of four light use efficiency models for estimating terrestrial gross primary production. Ecol. Model. 2015, 300, 30–39. [Google Scholar] [CrossRef] [Green Version]
  37. Che, T.; Dai, L.; Zheng, X.; Li, X.; Zhao, K. Estimation of snow depth from passive microwave brightness temperature data in forest regions of northeast China. Remote Sens. Environ. 2016, 183, 334–349. [Google Scholar] [CrossRef]
  38. Xiao, J.; Chevallier, F.; Gomez, C.; Guanter, L.; Hicke, J.A.; Huete, A.R.; Ichii, K.; Ni, W.; Pang, Y.; Rahman, A.F.; et al. Remote sensing of the terrestrial carbon cycle: A review of advances over 50 years. Remote Sens. Environ. 2019, 233, 111383. [Google Scholar] [CrossRef]
  39. White, K.; Pontius, J.; Schaberg, P.G. Remote sensing of spring phenology in northeastern forests: A comparison of methods, field metrics and sources of uncertainty. Remote Sens. Environ. 2014, 148, 97–107. [Google Scholar] [CrossRef]
  40. Song, K.; Ma, J.; Wen, Z.; Fang, C.; Shang, Y.; Zhao, Y.; Wang, M.; Du, J. Remote estimation of Kd (PAR) using MODIS and Landsat imagery for turbid inland waters in Northeast China. ISPRS J. Photogramm. Remote Sens. 2017, 123, 159–172. [Google Scholar] [CrossRef]
  41. Wang, Y.B.; Zhao, Y.H.; Han, L.; Ao, Y. Spatio temporal variation of vegetation net primary productivity and its driving factors from 2000 to 2015 in Qinling-Daba Mountains China. Chin. J. Appl. Ecol. 2018, 29, 2373–2381. [Google Scholar]
  42. Wang, X.Y.; Zhao, C.Y.; Jia, Q.Y. Impacts of climate change on forest ecosystems in Northeast China. Adv. Clim. Chang. Res. 2013, 4, 230–241. [Google Scholar]
  43. Shi, M.; Yin, R.; Lv, H. An empirical analysis of the driving forces of forest cover change in northeast China. For. Policy Econ. 2017, 78, 78–87. [Google Scholar] [CrossRef] [Green Version]
  44. Xu, X.; Yang, B.; Wang, H.; Cao, Y.; Li, K.; Gao, S. Temperature sensitivity of soil heterotrophic respiration is altered by carbon substrate along the development of Quercus Mongolica forest in northeast China. Appl. Soil Ecol. 2019, 133, 52–61. [Google Scholar] [CrossRef]
  45. Potter, C. Continental-scale comparisons of terrestrial carbon sinks estimated from satellite data and ecosystem modeling 1982–1998. Glob. Planet. Chang. 2003, 39, 201–213. [Google Scholar] [CrossRef]
  46. Potter, C.; Klooster, S.; Steinbach, M.; Tan, P.-N.; Kumar, V.; Shekhar, S.; De Carvalho, C.R. Understanding global teleconnections of climate to regional model estimates of Amazon ecosystem carbon fluxes. Glob. Chang. Biol. 2004, 10, 693–703. [Google Scholar] [CrossRef]
  47. Huang, N.; Niu, Z.; Wu, C.; Tappert, M.C. Modeling net primary production of a fast-growing forest using a light use efficiency model. Ecol. Model. 2010, 221, 2938–2948. [Google Scholar] [CrossRef]
  48. Yin, K.; Tian, Y.C.; Chao, Y.; Zhang, F. NPP spatial and temporal pattern of vegetation in Beijing and its factor explanation based on CASA model. Remote Sens. Land Resour. 2015, 27, 133–139. [Google Scholar]
  49. Kuchar, L.; Hunt, L.; Swanton, C. Estimation of Missing Solar Radiation Data for use in Agricultural Modelling. IFAC Proc. Vol. 1997, 30, 221–225. [Google Scholar] [CrossRef]
  50. Meenal, R.; Kumar, K.V. Estimation of global solar radiation using sunshine duration and temperature in Chennai. In Proceedings of the 2016 International Conference on Emerging Trends in Engineering, Technology and Science (ICETETS), Institute of Electrical and Electronics Engineers (IEEE), Pudukkottai, India, 24–26 February 2016; pp. 1–6. [Google Scholar]
  51. Tang, W.; Qin, J.; Yang, K.; Niu, X.; Min, M.; Liang, S. An efficient algorithm for calculating photosynthetically active radiation with MODIS products. Remote Sens. Environ. 2017, 194, 146–154. [Google Scholar] [CrossRef]
  52. Podestá, G.; Núñez, L.; Villanueva, C.A.; Skansi, M.A. Estimating daily solar radiation in the Argentine Pampas. Agric. For. Meteorol. 2004, 123, 41–53. [Google Scholar] [CrossRef]
  53. Wu, Z.; Du, H.; Zhao, N.; Li, M.; Meng, X.; Zong, S. Estimating daily global solar radiation during the growing season in Northeast China using the Ångström–Prescott model. Theor. Appl. Clim. 2011, 108, 495–503. [Google Scholar] [CrossRef]
  54. Da Silva, R.M.; Santos, C.A.G.; Moreira, M.; Corte-Real, J.; Silva, V.C.L.; Medeiros, I.C. Rainfall and river flow trends using Mann–Kendall and Sen’s slope estimator statistical tests in the Cobres River basin. Nat. Hazards 2015, 77, 1205–1221. [Google Scholar] [CrossRef]
  55. Aswad, F.K.; Yousif, A.A.; Ibrahim, S.A. Trend Analysis Using Mann-Kendall and Sen’s Slope Estimator Test for Annual and Monthly Rainfall for Sinjar District, Iraq. ICRIE Conf. 2020, 9, 30–36. [Google Scholar] [CrossRef]
  56. Wang, Y.; Zhou, G.; Jia, B. Modeling SOC and NPP responses of meadow steppe to different grazing intensities in Northeast China. Ecol. Model. 2008, 217, 72–78. [Google Scholar] [CrossRef]
  57. Ma, X.; Li, H.; Xiaoyan, M.; Hongguang, L. An Approach to Dynamic Asymptotic Estimation for Hurst Index of Network Traffic. Int. J. Commun. Netw. Syst. Sci. 2010, 3, 167–172. [Google Scholar] [CrossRef] [Green Version]
  58. Zhu, W.; Chen, Y.; Xu, D.; Li, J. Advances in terrestrial net primary productivity (npp) estimation models. Chin. J. Ecol. 2005, 24, 296–300. [Google Scholar]
  59. Wang, X.; Ouyang, S.; Sun, O.J.; Fang, J. Forest biomass patterns across northeast China are strongly shaped by forest height. For. Ecol. Manag. 2013, 293, 149–160. [Google Scholar] [CrossRef]
  60. Xie, Y.; Wang, H.; Lei, X. Simulation of climate change and thinning effects on productivity of Larix olgensis plantations in northeast China using 3-PGmix model. J. Environ. Manag. 2020, 261, 110249. [Google Scholar] [CrossRef]
  61. Lindholm, E.-L.; Berg, S.; Hansson, P.-A. Energy efficiency and the environmental impact of harvesting stumps and logging residues. Eur. J. For. Res. 2010, 129, 1223–1235. [Google Scholar] [CrossRef]
  62. Fang, J.Y.; Piao, S.L.; Field, C.; Pan, Y.; Guo, Q.; Zhou, L.; Peng, C.H.; Tao, S. Increasing net primary production in China from 1982 to 1999. Front. Ecol. Environ. 2003, 1, 293–297. [Google Scholar] [CrossRef]
  63. Ni, J.; Zhang, X.-S.; Scurlock, J.M. Synthesis and analysis of biomass and net primary productivity in Chinese forests. Ann. For. Sci. 2001, 58, 351–384. [Google Scholar] [CrossRef]
  64. Santi, E.; Paloscia, S.; Pettinato, S.; Fontanelli, G.; Mura, M.; Zolli, C.; Maselli, F.; Chiesi, M.; Bottai, L.; Chirici, G. The potential of multifrequency SAR images for estimating forest biomass in Mediterranean areas. Remote Sens. Environ. 2017, 200, 63–73. [Google Scholar] [CrossRef]
  65. Rehman, S. Study of Saudi Arabian climatic conditions using Hurst exponent and climatic predictability index. Chaos Solitons Fractals. 2009, 39, 499–509. [Google Scholar] [CrossRef]
  66. Garcin, M. Estimation of time-dependent Hurst exponents with variational smoothing and application to forecasting foreign exchange rates. Phys. A Stat. Mech. Appl. 2017, 483, 462–479. [Google Scholar] [CrossRef]
  67. Nguyen, M.D.; Ancev, T.; Randall, A. Forest governance and economic values of forest ecosystem services in Vietnam. Land Use Policy 2020, 97, 103297. [Google Scholar] [CrossRef]
  68. Wu, C.; Gonsamo, A.; Zhang, F.; Chen, J.M. The potential of the greenness and radiation (GR) model to interpret 8-day gross primary production of vegetation. ISPRS J. Photogramm. Remote Sens. 2014, 88, 69–79. [Google Scholar] [CrossRef]
  69. Gang, C.; Zhang, Y.; Wang, Z.; Chen, Y.; Yang, Y.; Li, J.; Cheng, J.; Qi, J.; Odeh, I. Modeling the dynamics of distribution, extent, and NPP of global terrestrial ecosystems in response to future climate change. Glob. Planet. Chang. 2017, 148, 153–165. [Google Scholar] [CrossRef]
  70. Berra, E.F.; Gaulton, R.; Barr, S. Assessing spring phenology of a temperate woodland: A multiscale comparison of ground, unmanned aerial vehicle and Landsat satellite observations. Remote Sens. Environ. 2019, 223, 229–242. [Google Scholar] [CrossRef]
  71. Xin, Q.; Li, J.; Li, Z.; Li, Y.; Zhou, X. Evaluations and comparisons of rule-based and machine-learning-based methods to retrieve satellite-based vegetation phenology using MODIS and USA National Phenology Network data. Int. J. Appl. Earth Obs. Geoinf. 2020, 93, 102189. [Google Scholar] [CrossRef]
  72. Siraj, M. Forest carbon stocks in woody plants of Chilimo-Gaji Forest, Ethiopia: Implications of managing forests for climate change mitigation. S. Afr. J. Bot. 2019, 127, 213–219. [Google Scholar] [CrossRef]
  73. Wang, C.; Jiang, Q.; Engel, B. Analysis on net primary productivity change of forests and its multi–level driving mechanism–A case study in Changbai Mountains in Northeast China. Techno. Forecast. Soc. Chang. 2020, 153, 11939. [Google Scholar] [CrossRef]
  74. Shen, X.; Liu, B.; Xue, Z.; Jiang, M.; Lu, X.; Zhang, Q. Spatiotemporal variation in vegetation spring phenology and its response to climate change in freshwater marshes of Northeast China. Sci. Total Environ. 2019, 666, 1169–1177. [Google Scholar] [CrossRef]
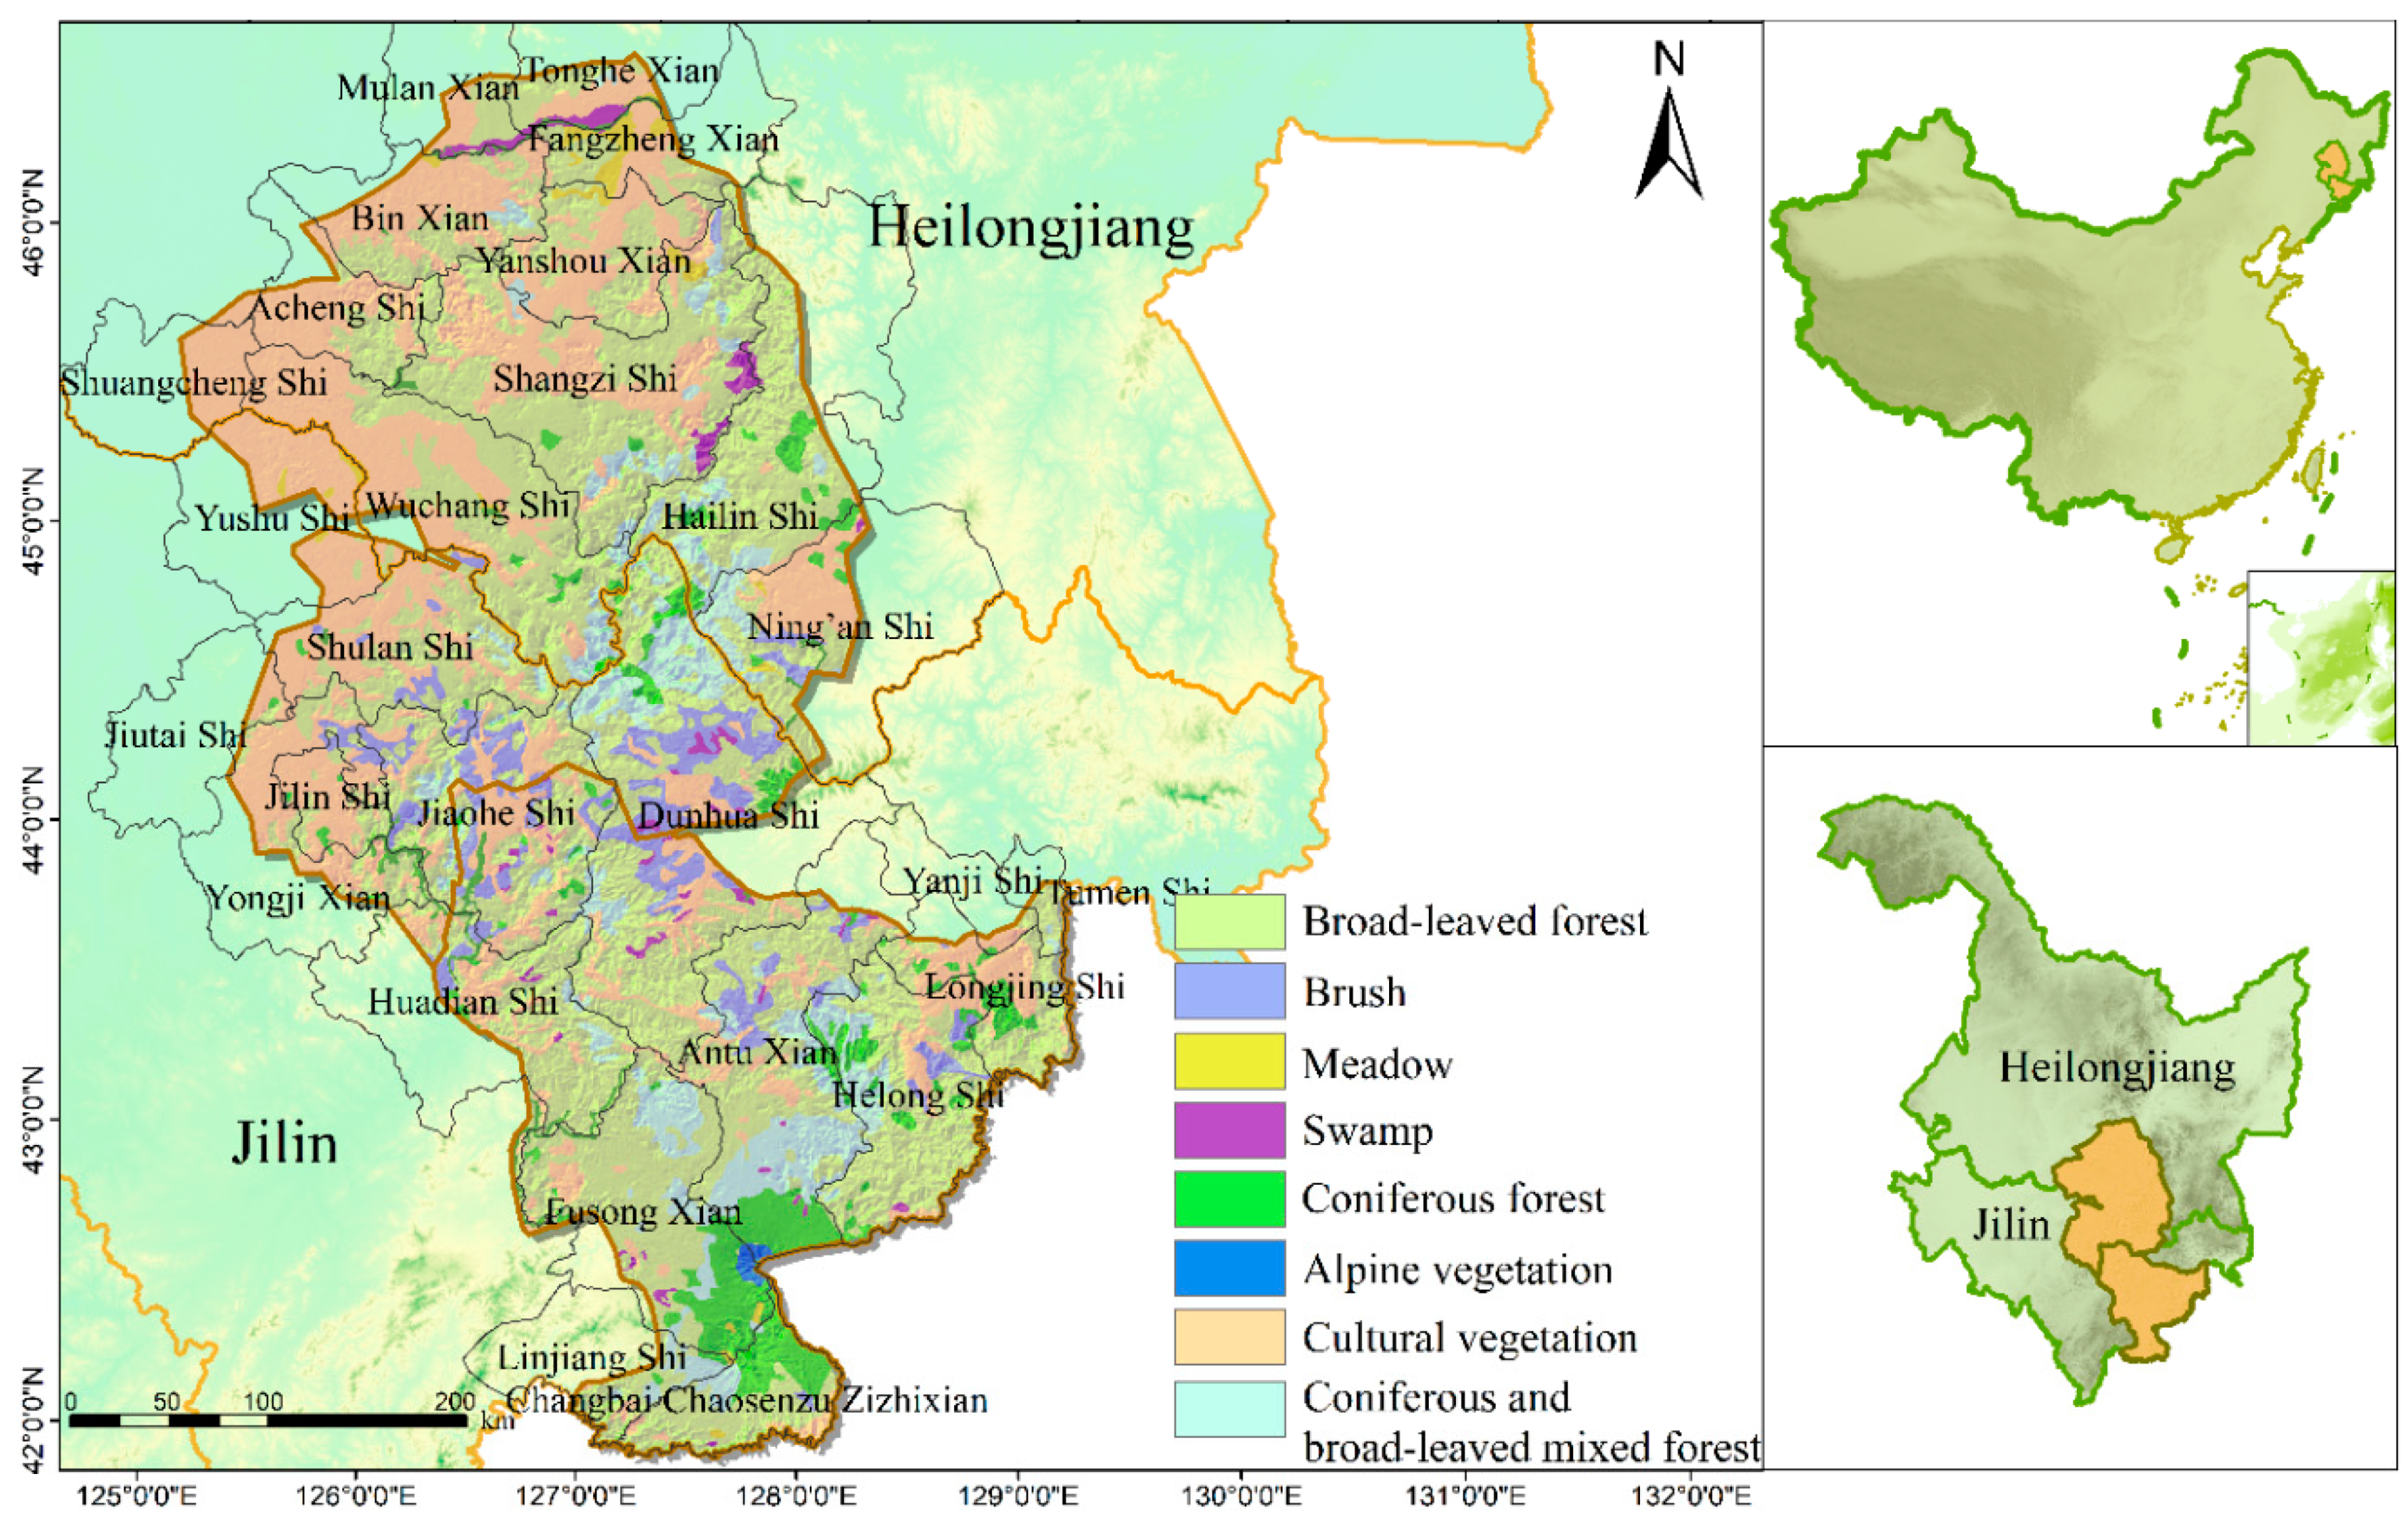
Figure 1. Location of the study area in Northeast China.
Remotesensing 12 03670 g001
Figure 2. Flowchart of the Global Production Efficiency Model (GLO-PEM) to estimate the Net Primary Productivity (NPP) in Northeast China.
Remotesensing 12 03670 g002
Figure 3. Variation of daily solar radiation, solar radiation top of atmosphere and solar radiation in clear sky, under different typical six stations, in 2008.
Remotesensing 12 03670 g003
Figure 4. Comparison of daily estimated photosynthetically active radiation (PAR) and observed PAR in Harbin and Yanji stations, in 2008.
Remotesensing 12 03670 g004
Figure 5. Comparison between simulated NPP and MOD17 NPP, based on different raster pixels, in 2003 and 2008.
Remotesensing 12 03670 g005
Figure 6. Inter-annual variation of NPP, from 2001 to 2019, in Northeast China.
Remotesensing 12 03670 g006
Figure 7. The inter-annual variation of different forest types in Northeast China, during the period of 2001–2019.
Remotesensing 12 03670 g007
Figure 8. Spatial distribution of NPP in Northeast China, during different periods.
Remotesensing 12 03670 g008
Figure 9. Changing trend of NPP (a) and its significance (b) in Northeast China, during 2001–2019.
Remotesensing 12 03670 g009
Figure 10. Hurst index and future trend of NPP in Northeast China, during 2001–2019.
Remotesensing 12 03670 g010
Figure 11. The changing trend of forests NPP, every eight days, from 2001 to 2019, in Northeast China.
Remotesensing 12 03670 g011
Figure 12. The variation characteristics of NPP with an eight-day cycle, in SOS, from 2001 to 2019.
Remotesensing 12 03670 g012
Figure 13. The inter-annual variation characteristics of NPP on daily accumulations, with an eight-day cycle at the end of the vegetation growth season (EOS), from 2001 to 2019.
Remotesensing 12 03670 g013
Publisher’s Note: MDPI stays neutral with regard to jurisdictional claims in published maps and institutional affiliations.