Letter

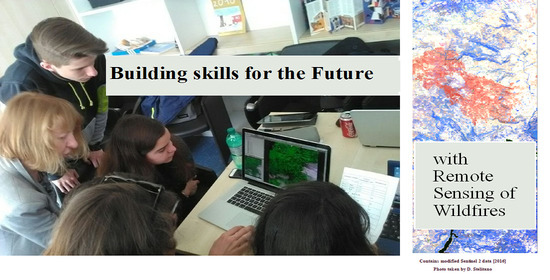
Building Skills for the Future: Teaching High School Students to Utilize Remote Sensing of Wildfires

1
Istituto Nazionale di Geofisica e Vulcanologia, Via di Vigna Murata 605, 00143 Rome, Italy
2
The University of Auckland, 74 Epsom Ave, Epsom, Auckland 1023, New Zealand
*
Author to whom correspondence should be addressed.
Remote Sens. 2020, 12(21), 3635; https://doi.org/10.3390/rs12213635
Submission received: 20 September 2020 / Revised: 21 October 2020 / Accepted: 3 November 2020 / Published: 5 November 2020
(This article belongs to the Collection Teaching and Learning in Remote Sensing)

Abstract

:
A substantial proportion of Italian students are unaware of the connection between what they learn at school and their work opportunities .This proportion would most likely increase if data were collected today, given the generation of a broad range of new jobs that has arisen due to advancements in technology. This gap between students’ understanding of what they learn at school and its application to the broader world—the society, the economy and the political sphere—suggests there needs to be a rethinking of how teaching and learning at school is conceived and positioned. To help students to approach ongoing social and economic transformations, the Italian Educational Ministry (MIUR) has endorsed a school–work interchange program which, aligned with the principle of open schools, aims to provide students with work experience. It is within the scope of this initiative that we have tested high school students with remote sensing (RS) from space projects. The experience-based approach aimed to verify students’ openness to the use of satellite data as a means to learn new interdisciplinary skills, to familiarize themselves with methodological knowledge and, finally, to inspire them when choosing a university or areas of future work. We engaged three cohorts, from 2017, 2018 and 2019, for a total of 40 h each year, including contact and non-contact time. The framework of each project was the same for the three cohorts and focused on the observation of Earth from space with a specific focus on wildfires. However, the initiative went beyond this, with diverse activities and tasks being assigned. This paper reports the pedagogical methods utilized with the three cohorts and how these methods were transformed and adapted in order to improve and enhance the learning outcomes. It also explores the outcomes for the students, teachers and family members, with respect to their learning and general appreciation.

Graphical Abstract

1. Introduction

In 2005, the Italian Ministry of Education, Research and Universities (MIUR) started a school–work interchange called Alternanza Scuola Lavoro (ASL) as a unique, compulsory program for Italian high school students [1,2]. The program was reformulated within Law 107 of 2015, known to the general public as The Good School (La Buona Scuola), and more recently reframed as Paths for Cross-skills and Orientation (Percorsi per le competenze trasversali e per l’orientamento, PCTO) [3].
While the aim of the program stays the same, with students meant to complete an internship (tirocinio) in one or more projects, the more practical aspects such as the number of hours that students have to allocate has changed from 200 h for the previous ASL [1,2] to between 90 to 200 h in the PCTO [3]. Vocational schools (Istituti Professionali) have consistently been shown to benefit more from the program compared to Licei (high school) as shown in the results of the ASL 2012/13 survey conducted by INDIRE [4]. However, the recent ASL report of the MIUR [5] shows that the period 2016–2017 reports an inversion in the figures, with 55% of the total national ASL programs being activated in Licei. The aim is to provide students with high-quality and up-to-date work/training experience opportunities co-sponsored by the schools with a range of corporate, small medium enterprise, and government institutions and to provide students with new skills and inspire diverse university or work choices. These bodies act as educational partners of the schools. The program engages students during the last three years (16–18 years old) of high school ideally in small groups (eight students). A tutor from the hosting institution is assigned to each group to lead and support the students during their experience. In 2015, the Istituto Nazionale di Geofisica e Vulcanologia (INGV) started to design and offer ASL programs to respond to the growing request by scientific high schools (Liceo Scientifico) to equip their students with “cultural and methodological tools for a thorough understanding of reality”, as stated in the Italian college educational plan.
This study reports the approach and the evolution of the methods we used to engage three cohorts of students (three case studies) in the Istituto Nazionale di Geofisica e Vulcanologia (INGV)’s projects focused on geophysics. The program topic was “Earth observation from space focused on wildfires” (Table 1), which is ideal for students interested in new technological tools and challenges in climate change and driven by curiosity to understand natural phenomena.
In a wider European context, it is important to mention the European Space Education Resource Office (ESERO) [6] which aims to enhance teaching and learning of STEM (Science, Technology, Engineering and Mathematics) subjects through space science. While the ESERO project focuses on training teachers and offering existing ESA/ESERO space-related STEM classroom resources, through the ASL program, we focus on the students, and by using remote sensing from space with a specific topic, such as wildfires, we help students to build a wide range of skills for the future and to stimulate their awareness on our changing Earth.
The experience consisted of 40 contact hours complemented by additional hours managed by the students to independently, or as a team, completing tasks such as image manipulation or creating presentations. A group size of between three and five students proved to be ideal to develop team-working skills, evenly distribute work and to enable students to take on a range of roles.
As well as providing skills for the workplace by working on specific “real-life” tasks, the study also aimed to test the college students’ receptivity and limits in using RS technology.

2. Materials and Methods

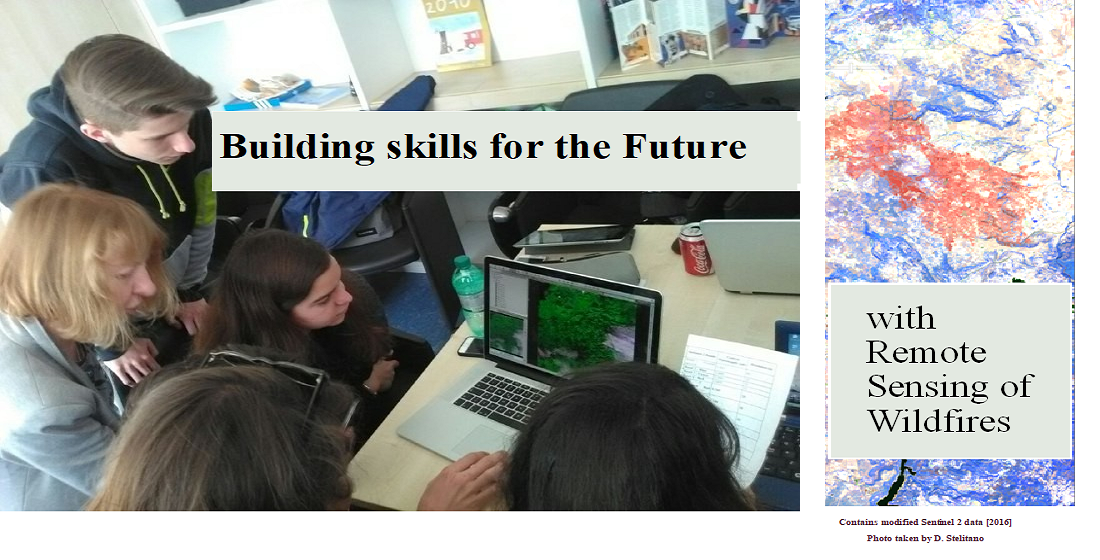
2.1. Scientific Topic and RS Technology

Wildfires were selected as the scientific topic of focus for a range of reasons. In fact, it represents an example of a natural phenomenon which is affected by, and affects, global warming [7]. Biomass burning is a major security hazard in numerous countries around the world, including Italy, and has an impact both globally and locally [7]. Locally, wildfires affect biodiversity loss, the economy and have a substantial social impact. A recent example of the devastating effects of wildfires is the Australian 2019–2020 fire season, which impacted both ecosystems and urban areas with the cities of Sydney, Canberra and Melbourne highly affected by smoke pollution [8]. At a global level, large wildfires disturb the biosphere and the atmosphere because of the products derived from the combustion of vegetation and organic soils, which are transferred directly into the troposphere [7,9] and thereby influence global warming; on the other hand, they also influence the fire regime in terms of the shift in frequency, intensity, size, pattern, season and severity of fires. As a consequence, new regions of Earth, such as the arctic, are becoming prone to wildfires. For example, Greenland experienced its first large wildfire in 2017 [10] and a second one in 2019 [11], while in other regions, for example in the Mediterranean, fire seasons are becoming extended [12] and the fires more intense.
In this global context, remote sensing from space plays an important role for monitoring wildfires [7,13] and assessing post-fire conditions [14]. Among a range of available satellite data that can be used to characterize wildfires, we chose the multispectral MDI sensor on board of the Sentinel 2 satellite from the Copernicus European project and the European Space Agency (ESA) [15]. It provides free images every 3–5 days with high performance in terms of spatial resolution (10 m–20 m–60 m) and a set of bands appropriate for fire detection, ideal to characterize burned areas and to implement the burn-scar perimeter delineation. Moreover, the ESA provides open source software (SNAP) [15] to manipulate and analyze Sentinel data. A webGIS, Google Earth and other software, such as Word, PowerPoint and Excel, were employed at different stages of satellite imagery analysis.

2.2. Training and Learning with Data

Beside specific software tools to help familiarize students with the RS experience, we needed a relatively simple pedagogy to integrate the training phase with the kind of approach commonly used in the research workplace. The method was inspired by the teaching-with-data approach as described by Nathan Grawe at Carleton College [16]. It is divided in five categories: (1) Watching; (2) Replication; (3) Guided Analysis; (4) Problem-Directed Discovery; (5) Open-ended discoveries. This approach matches very well with a research process through the provision of strong foundations for both active learning and work experience. For example, to understand how to look at optical satellite imagery and how the satellite looks at the Earth, knowledge of some physical concepts, such as the electromagnetic field, are required and students’ familiarity with them depended on the curriculum. In addition, the same imagery plays an important pedagogical role by stimulating observation and critical thinking and engaging both visual and inductive learners in the sense meant by Felder [17].

2.3. Training and Work-Related Activities

The objective of the program was to engage students interested in new RS technologies and to help them to gain new skills which would help them enter university or the workplace at the end of high school. The training/work experience (Table 2) was organized in five steps: (1) presentation of the module to the students, including an overview of the topics of the covered; (2) pre-requisite evaluation questionnaire; (3) theory and practice teaching; (4) data manipulation and interpretation; (5) reporting. The program was briefly introduced to the students by their teacher in the class. A presentation was later given at the INGV by the tutor to the group of students who chose the program for Cohort 3; a different scouting approach was used with students interested in the program coming from diverse classes of the school. The key educational/work lessons included: (1) to provide basic understanding of RS and terminology; (2) to understand which applications can be derived from Earth observation (EO), including wildfires; (3) to familiarize students with open source tools (i.e., the Sentinel Application Platform) and to learn how to use them effectively in the context of wildfires; (4) to integrate research and education through common and independent tasks that students were required to complete; (5) to offer an “open-ended” path, as the obtained results can be different from what was expected.
The program was designed to be highly interactive, using videos, questionnaires and media and learning through exploring specialized websites. During the first year, the RS lectures were provided mainly utilizing a traditional approach. In the following two years, the use of traditional lecturing was significantly reduced, which resulted in a more engaging training. In the practical component of the work experience, the students explored Sentinel 2 imagery and used SNAP tools to identify burn areas (Cohort 1) and delineate the perimeter (Cohort 2) of a certain number of wildfires that occurred in the Latium region, Italy. The third cohort had a different task. They had to verify the commission and omission error of an automated fire-detection WebGIS system developed by the National Institute of Industrial Science and Technology (AIST) in Japan using Sentinel 2 and Landsat 8 data in a selected number of regions in Italy.

3. Results

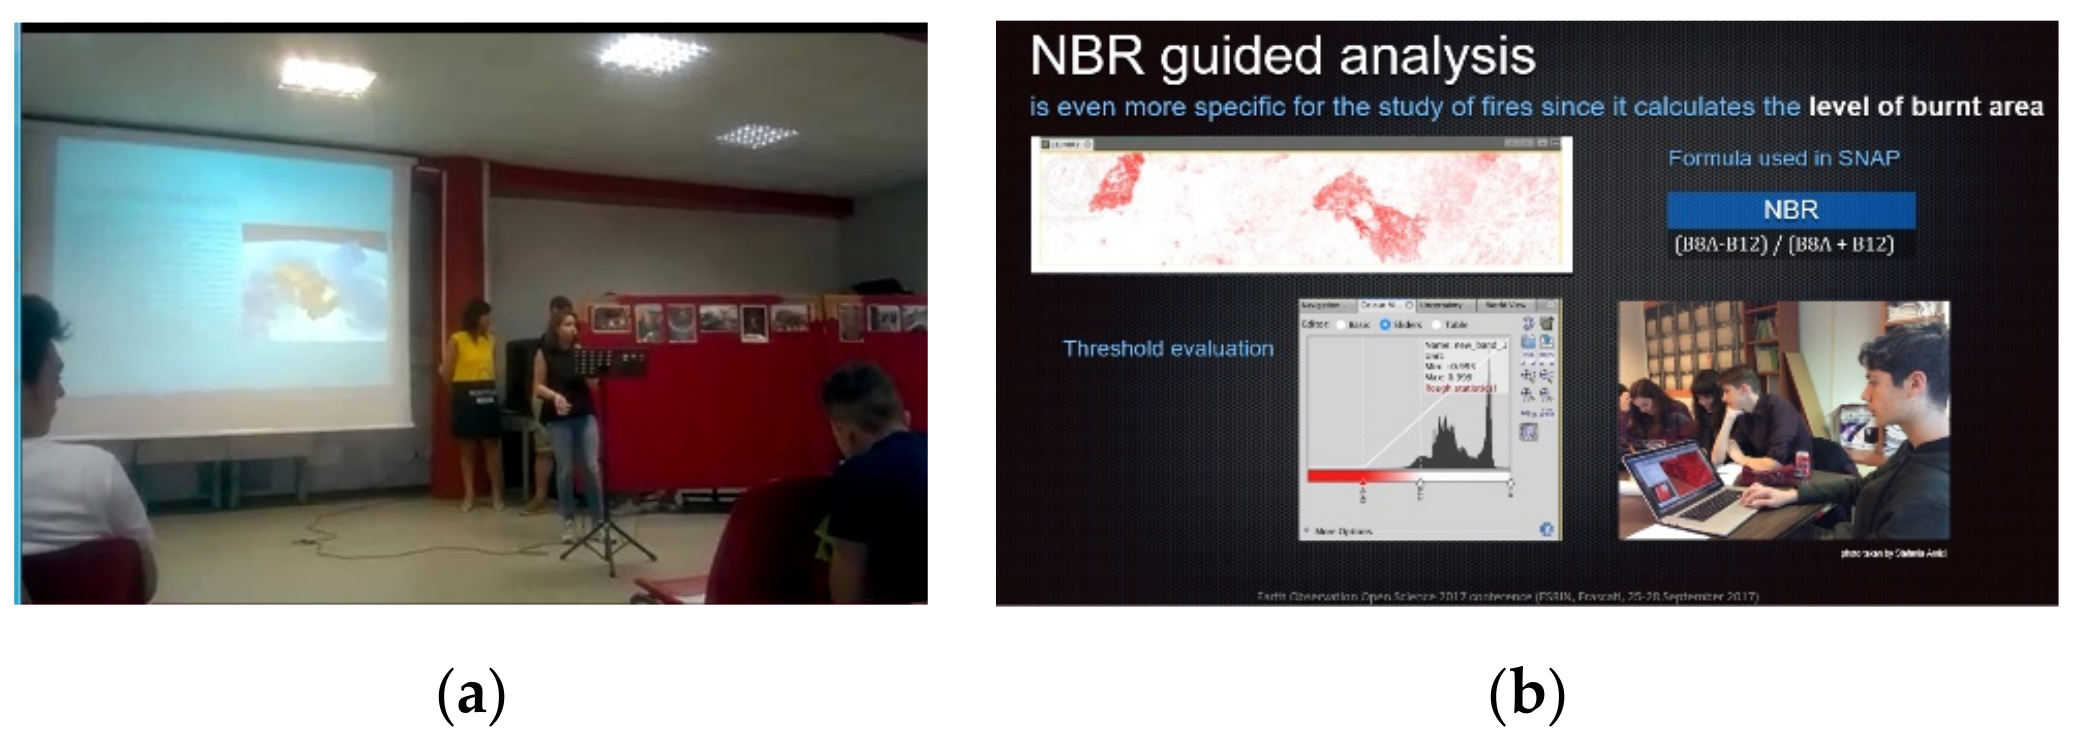
3.1. Project Outcome

Cohort 1 (2017) results. This cohort consisted of five students (three female and two male) aged between 17–18 years from the same 4th year class of Liceo Scientifico Cannizzaro, based in Rome, Italy. The assigned task consisted of the identification of wildfires occurring in the Sardinia region in 2016, for which limited information was available and which required manipulation of the Sentinel 2 data to produce a burned-area map. A range of SNAP functions, including open project and open Red Green Blue image windows, were used to visualize the satellite imagery. The Band Maths tool was utilized to implement the metrics (normalized difference vegetation index (NDVI) and normalized burn ratio (NBR)) and generate burned-area maps. The obtained results were reported in a collaborative PowerPoint presentation delivered at the students’ school (Figure 1a). The students successfully accomplished the assigned tasks with the guidance of a tutor. The experience was fruitfully presented at the Earth Observation Open Science conference (Figure 1b). For the students, it was an exceptional opportunity not only to co-author a poster but also to visit ESRIN, the Italian ESA headquarters.
Cohort 2 (2018) results. This cohort consisted of five students (three female and two male) aged between 17–18 years from the same 4th year class of Liceo Scientifico Cannizzaro, based in Rome, Italy. The students had to identify burned areas and delineate the perimeter using a pair of images: one image to use as a reference and the other showing the post-fire landscape. The area of interest was the Latium region in Italy (Figure 2a) which experiences open fires during the summer. The burn scars were identified by generating the NBR in SNAP. The perimeters were delineated by using Polyline drawing tool and saved as a shape file. The format was chosen to be easily imported in Google Earth (Figure 2b). An interesting result emerged for one student whose pair of images did not contain any burned area. This allowed him to understand that a “non-result” can provide useful insights and, eventually, it gave him an opportunity to test a “false signal”. The results were successfully delivered in a presentation.
Cohort 3 (2019) results. The group was composed of three 18-year-old female students from the last year (5th class) of Istituto San Giuseppe del Caburlotto high school in Rome, Italy. Their task was to check the fire detections displayed by a WebGIS System developed by AIST and verify the class attribution (validation). The system uses Sentinel 2 and Landsat 8 images and a neural network algorithm to detect hotspots and to categorize them (fire, volcano, oil platform, factory and false detection). To train the network, validation is essential. Besides consistent guidance, the students were provided with precise procedures to look at the images, to use ground truth and to verify that the category assigned by the algorithm was correctly (or incorrectly) labelled. The analysis of the data focused on the Latium, Marches, Umbria and Tuscany regions during the period of 1 January–31 July 2018 [19]. A list of commission errors produced by the system and their location has been released to improve machine learning performance over central Italy.

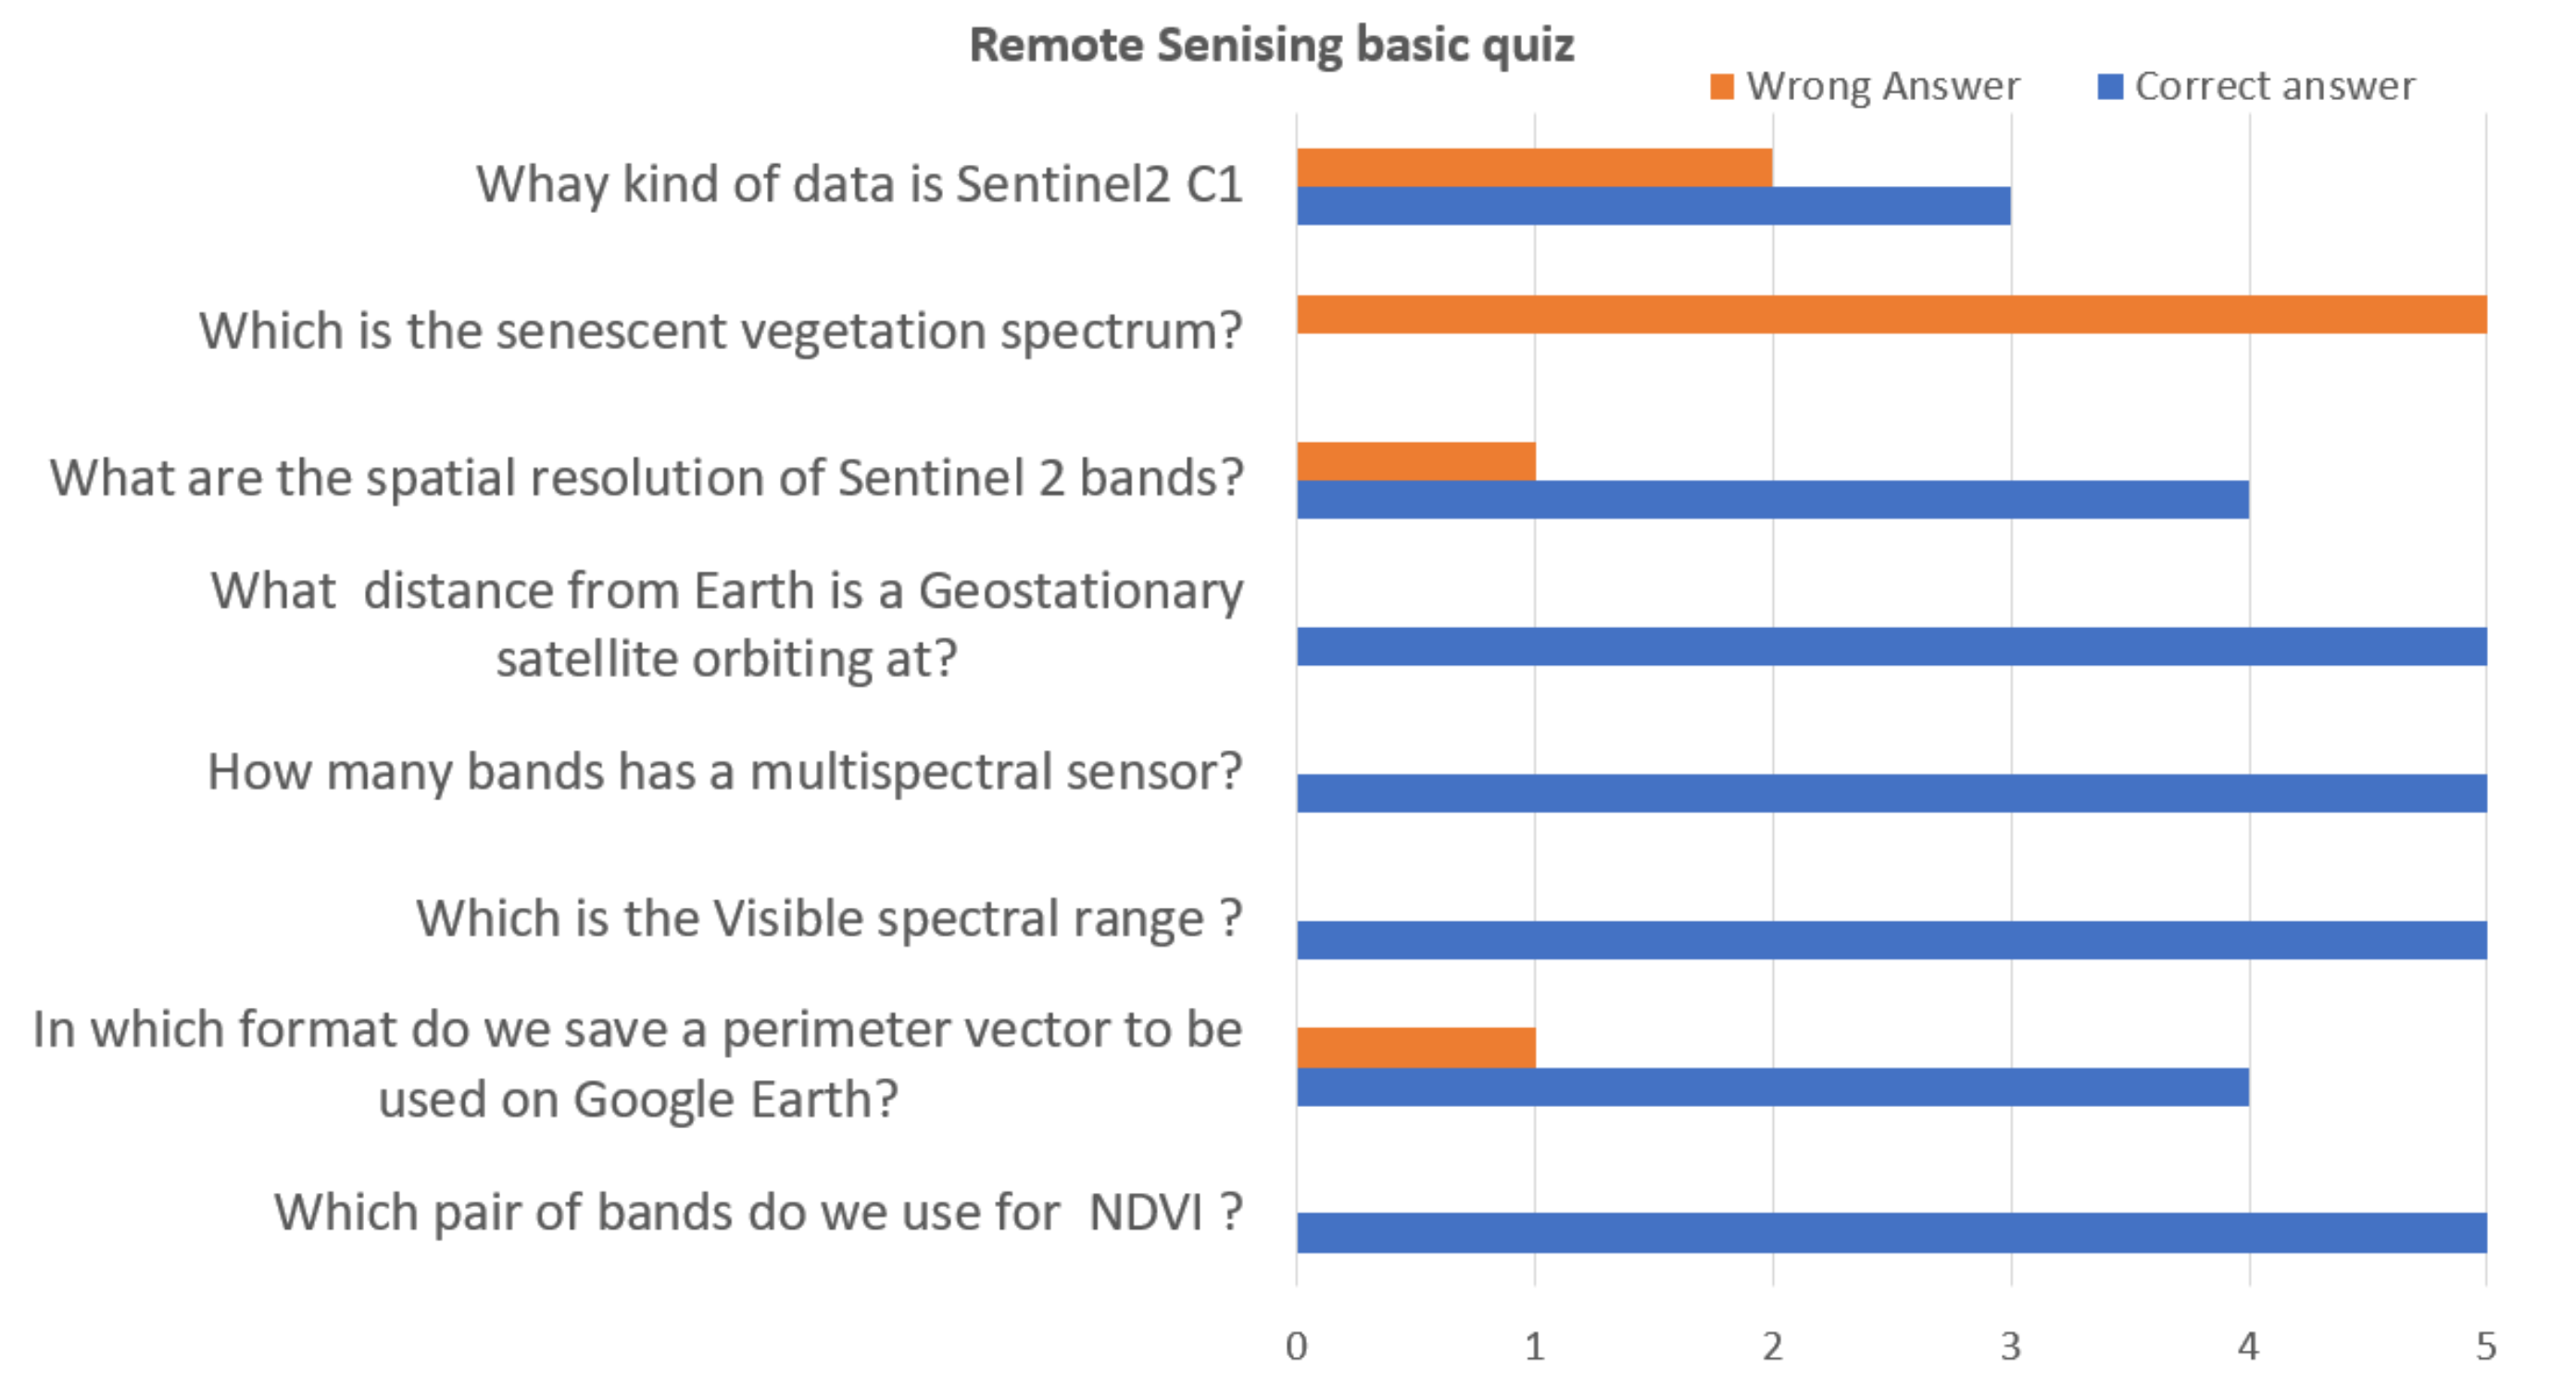
3.2. Educational and Work Related Learning Outcome

Teaching and learning new skills through EO optical data led to very positive outcomes in all the three groups. The assessment criteria were consistent with MIUR indication to measure key skills, such as team working, independent work and use of critical and analytical thinking. Moreover, the EO from space for wildfires proved to be an ideal program to enhance specific areas of development of mathematical and scientific logical competences. Contact hours focused on training and guiding the students through image manipulation and interpretation while non-contact hours focused on independent and cooperative group work to complete tasks and generate learning outcomes. Indirect (feedback) and direct (quizzes and questionnaires) methods were used to evaluate the results obtained by the three groups in terms of accomplishment of the assigned tasks and in gaining new skills.
Cohort 1 learning outcomes. A group leader was established and the approach was very collaborative. All group members attained a good evaluation in their abilities to gather information and to learn the skills to give a high-quality oral presentation at their school. Critical thinking was encouraged on diverse topics. For example, a leader realized that they had underestimated the challenge of the role. From the students’ perspective, besides having the work done, the most valuable aspects were learning new, complex topics, new technology, learning to write a scientific report and to respect deadlines, to work in groups, organize their work and respect the ideas of others.
Cohort 2 learning outcomes. The group leaders were capable of keeping everyone on track by using e-mails to ask the tutor for support and assessment on a consistent basis and worked with a high component of independent and collaborative bases. Development of students’ ability to use SNAP, Google Earth and PowerPoint was achieved. Beside the achievement of the assigned tasks, quizzing and questionnaires were used to check students’ learning attainment of the basic of remote sensing from space. Figure 3 shows the assessment outcomes. The students provided largely correct answers in all the topics which were relevant to their accomplished tasks. However, they experienced difficulties in more the complex concepts, such as hyperspectral data, and more technical questions related to the definition of a specific Sentinel product.
Cohort 3 learning outcomes. The third group was composed of three students. A group leader was not required as all students had a specific, independent task to accomplish. However, collaborative work was encouraged. Learning outcomes included the ability to visually interpret a satellite optical image, recognize diverse classes and evaluate commission errors made by the automatic detection system. Their ability to use Google Earth, Word, Excel and the WebGIS system was successfully gained.

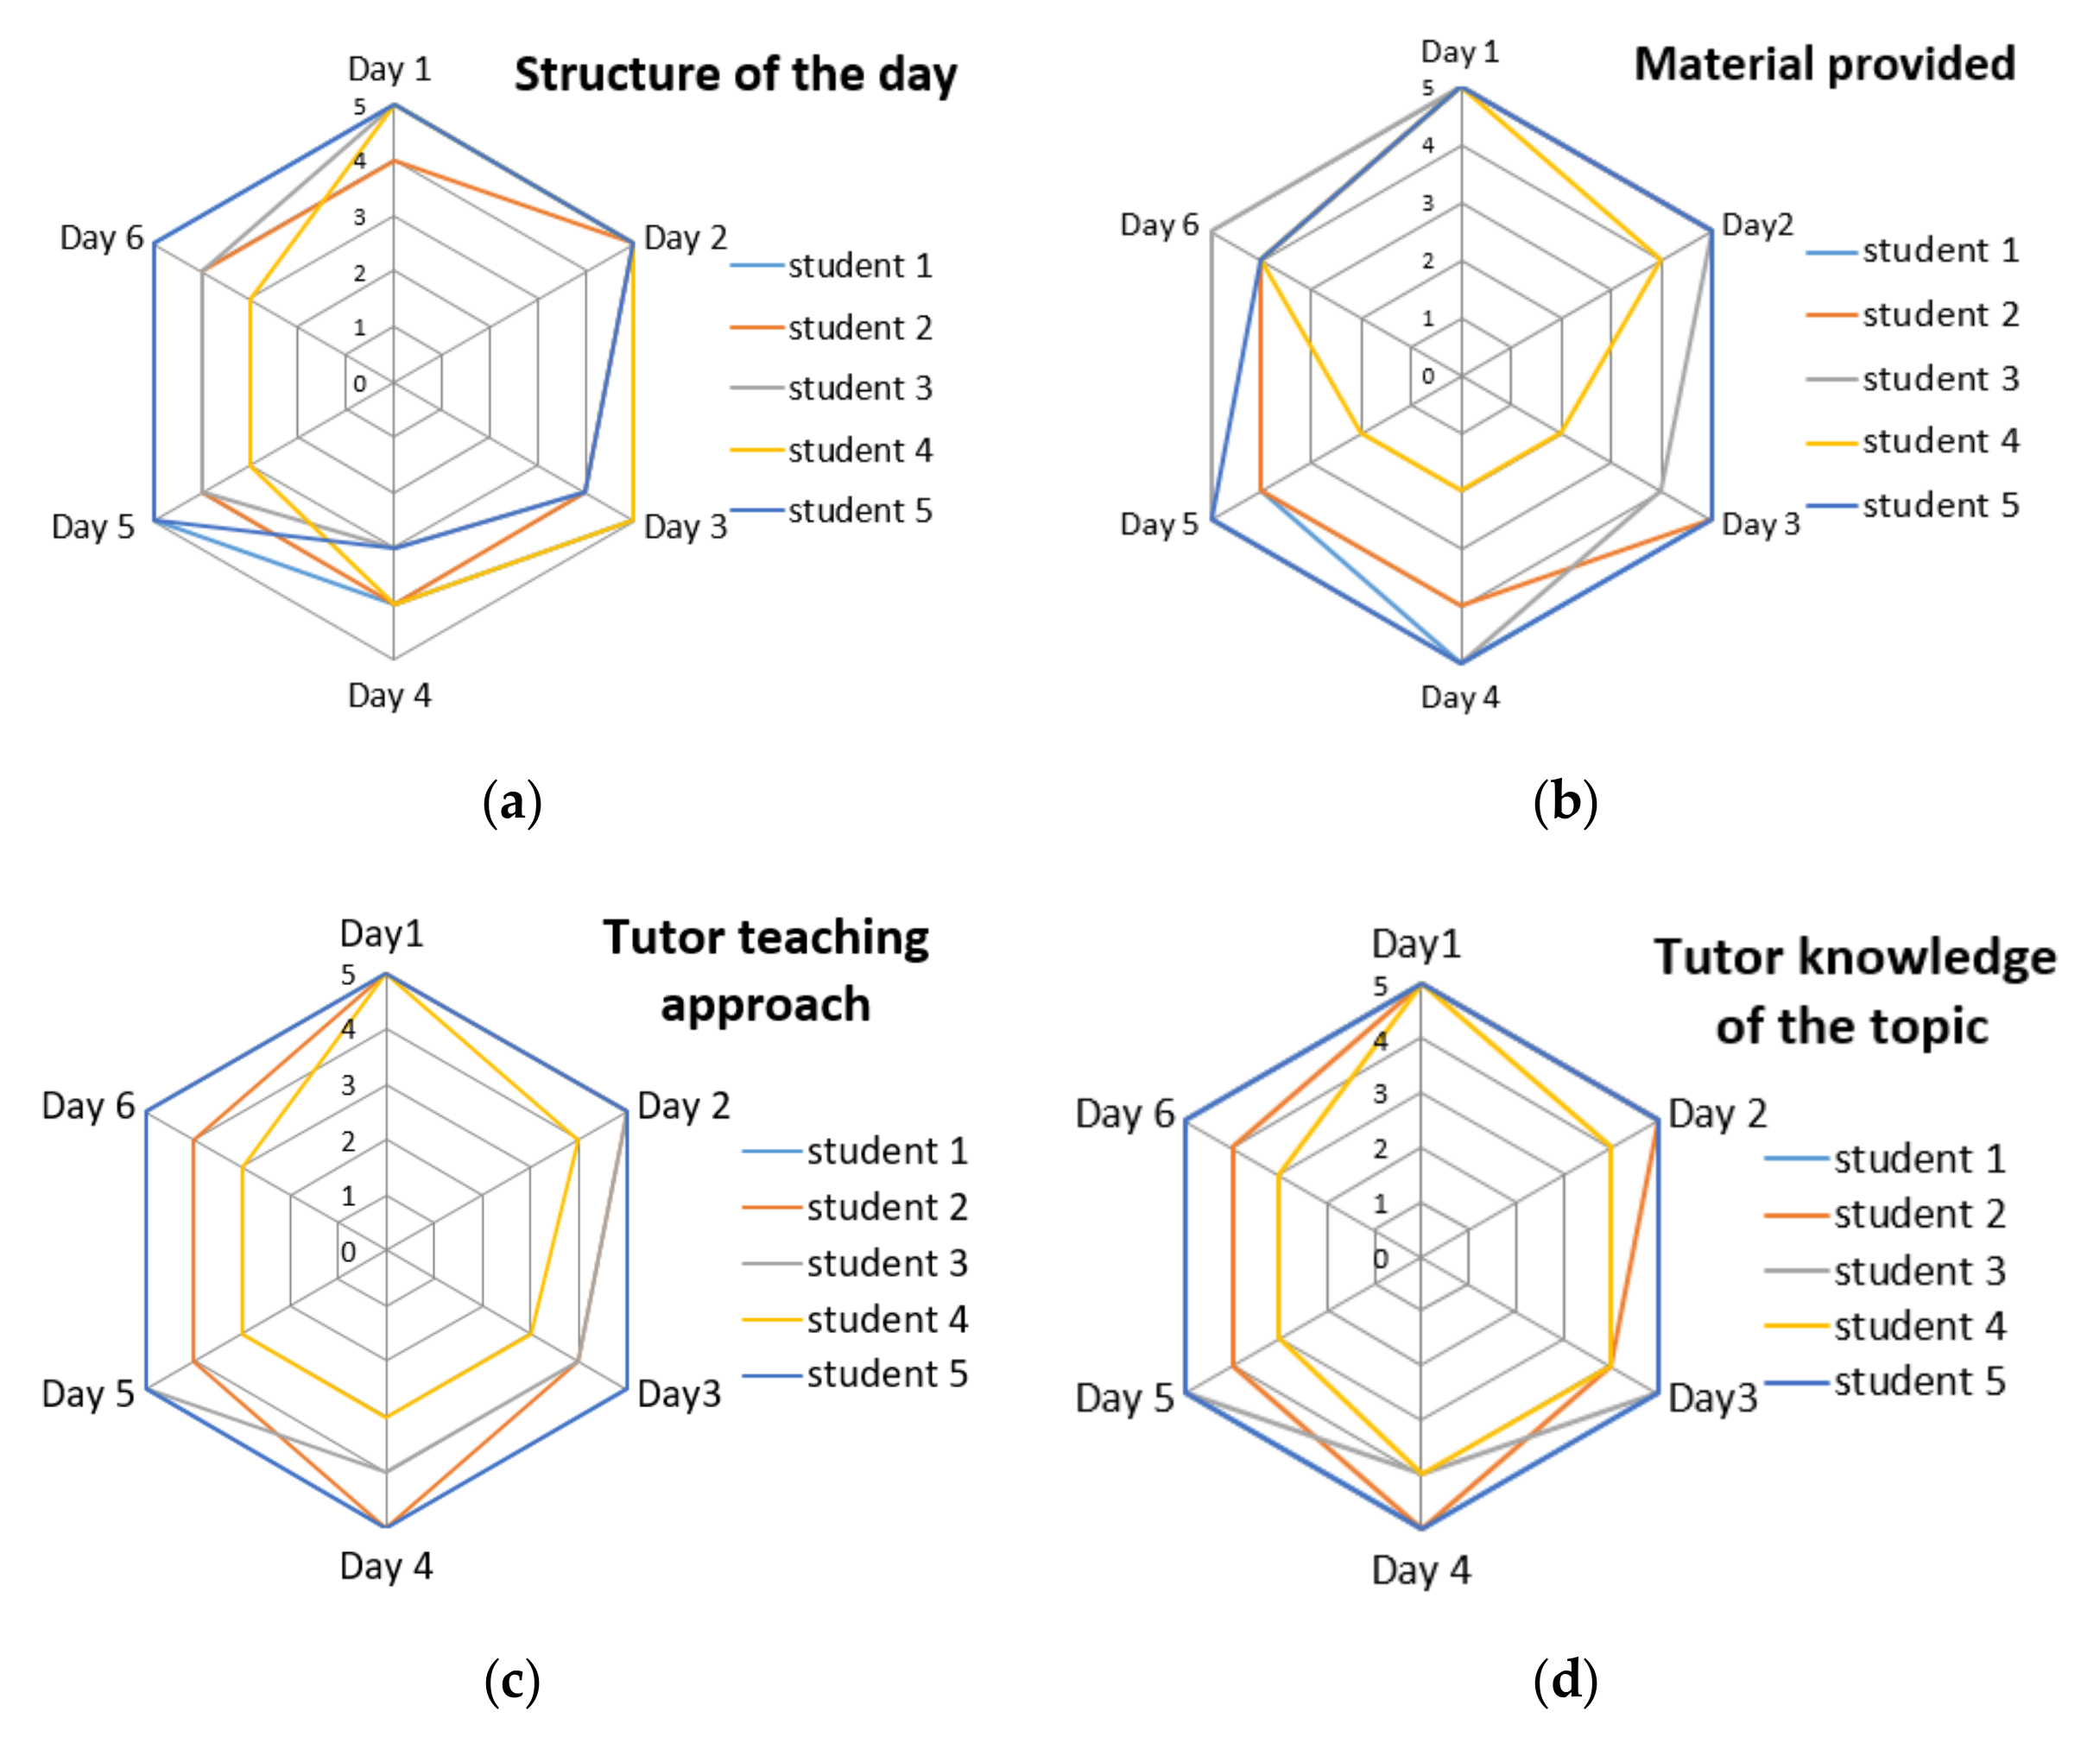
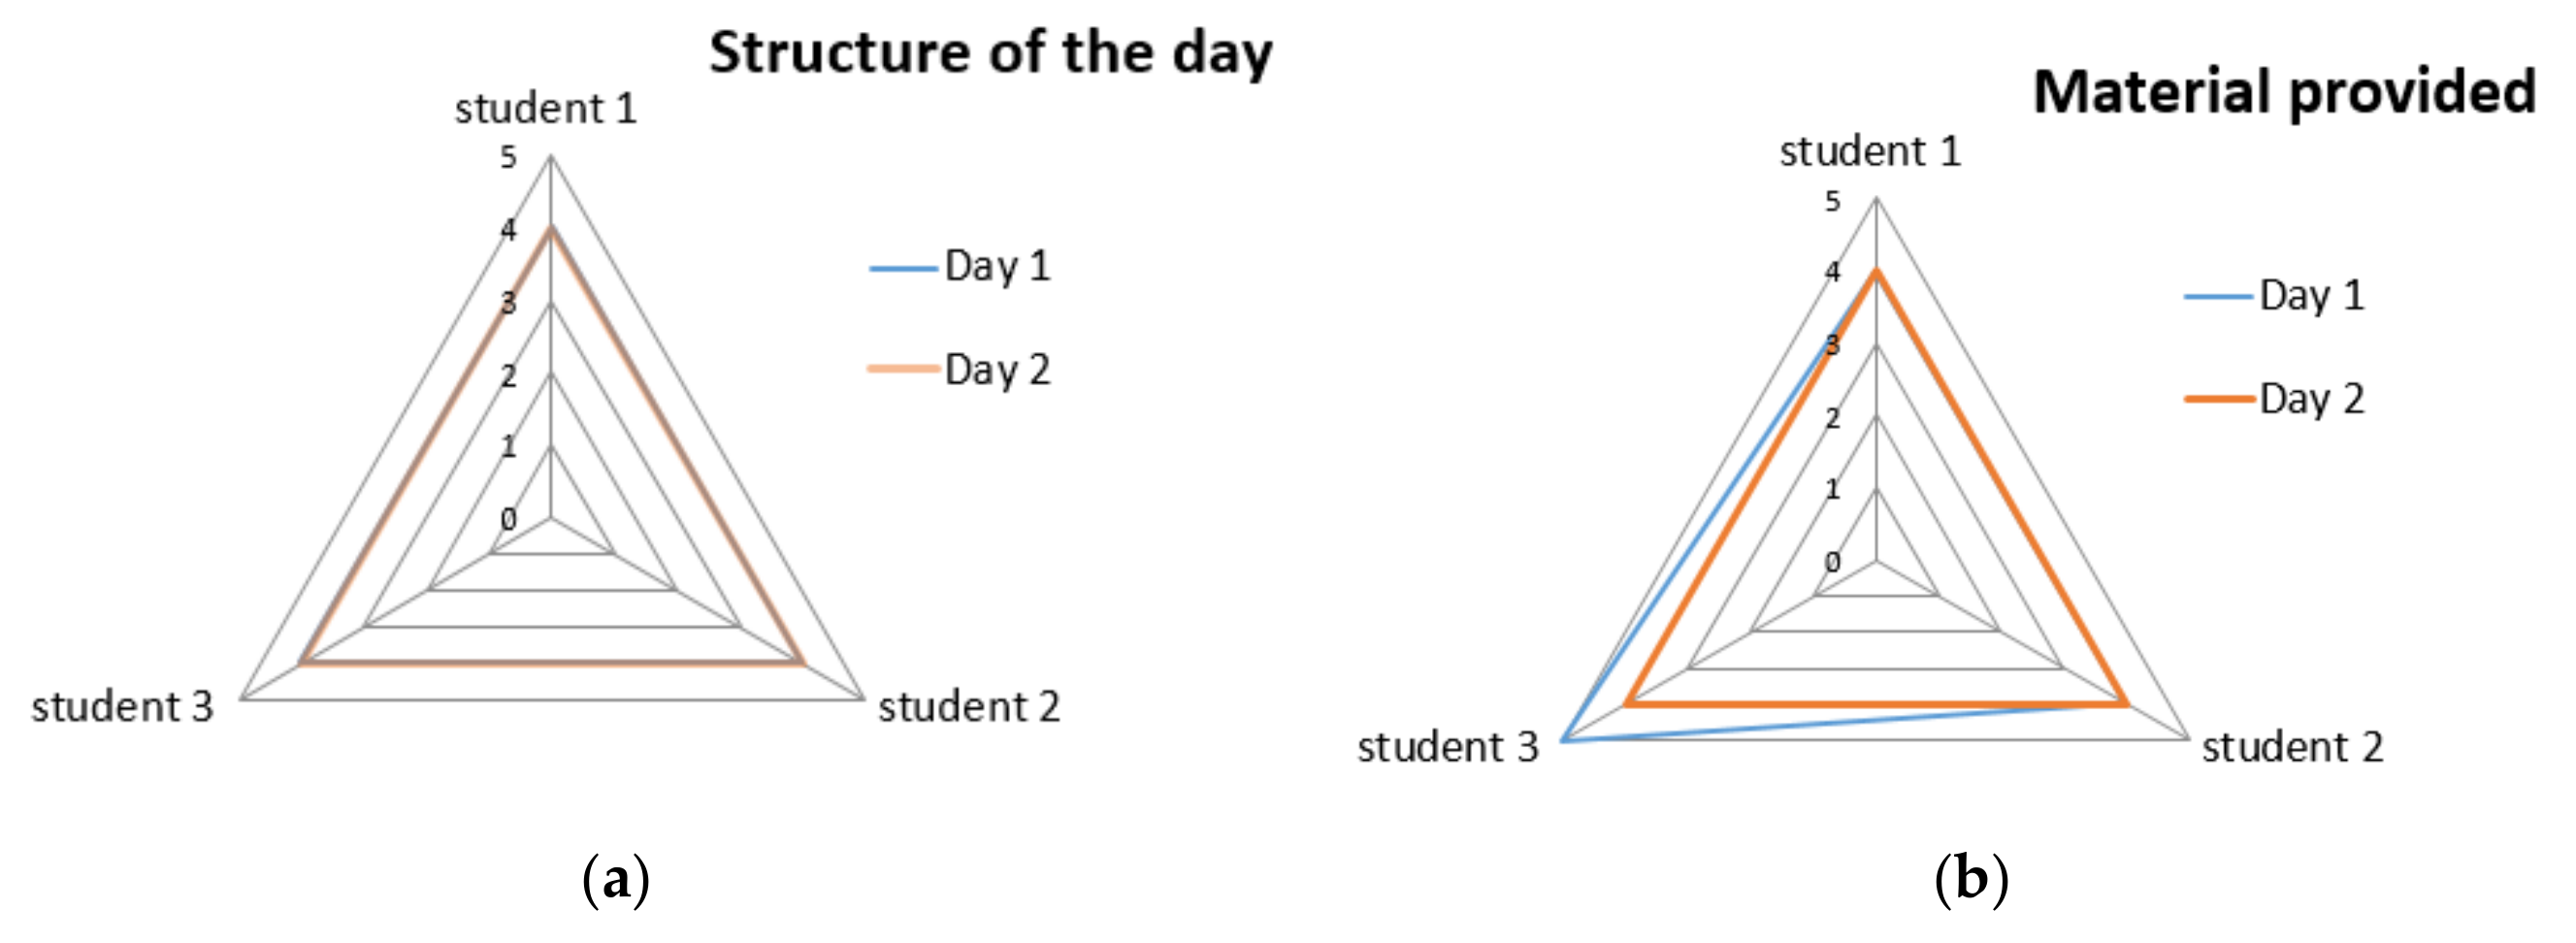
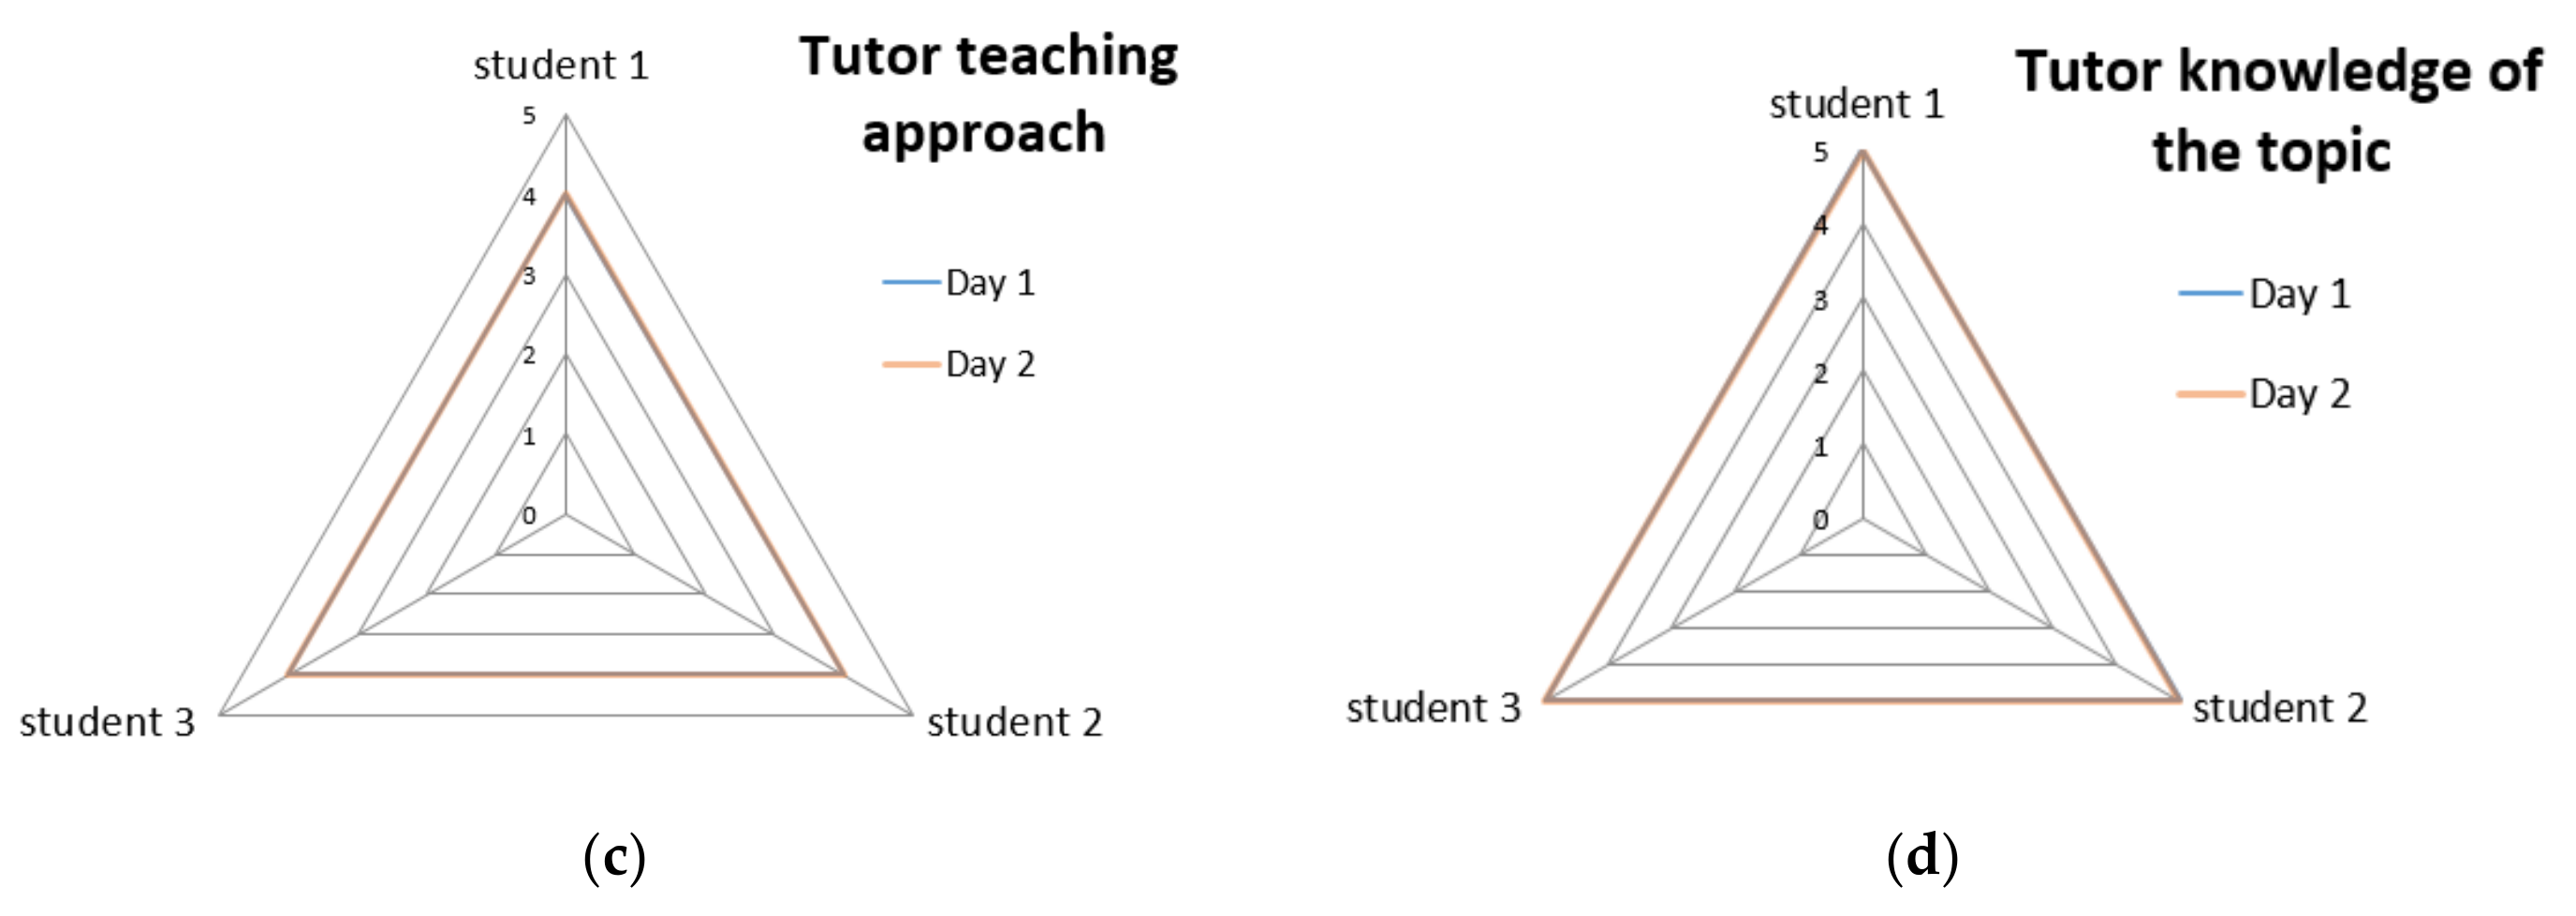
3.3. Students’ Perspective on the Training–Work Experience

An evaluation of the educational approach was developed through student feedback (Cohort 1) and questionnaires (Cohort 2 and Cohort 3).
Cohort 1 was asked about what they gained from this experience. They valued having gained the ability to learn and understand complex topics and techniques, team work, responsibility, time-keeping and having fun. One student valued the emotional aspects of the experience while another wished everyone had the opportunity to try it.
Cohort 2 and Cohort 3 were asked to answer a feedback survey at the end of the in-person training. The questionnaire was composed of four closed questions, modulated in five appreciation rankings, from poor (1) to excellent (5) (Figure 4), and five open questions. The first lessons were the most appreciated by the Cohort 2 students with respect to the latest, with the prevalent rank spanning between 4–5. One student showed consistently lower levels of satisfaction. Difficulties carrying out the work on a tablet while the others were using a laptop and a low attention level may have contributed to that.
The open questions aimed to provide extended insight into their learning and the quality of the training. For example, 100% of the students reported they had obtained what they were expecting and were happy with the training and did not suggest any changes. Over the six days, all the students were fully satisfied, declared they had obtained what they were expecting and found everything relevant for them. When questioned about listing the three more important learning outcomes, in their answers, they highlighted both the key learning of the day and soft skills.
Their suggestions for improving the experience were in regard to software issues (i.e., they complained about having to wait for the images to be saved). The feedback questionnaire for Cohort 3 is reported in Figure 5. The high ranking given for the closed questions has been confirmed in the open ones as well. Minor elements of dissatisfaction involved technical issues with the WebGIS system and logistics.

4. Conclusions

Teaching RS for wildfires within the ASL work-path resulted in a very positive experience for all three of the student groups. The teaching-through-data approach and utilization of RS for wildfire has been tested over three cohorts and the set-up was adapted according to feedback and group composition.
Since the first experience in 2017, the traditional lecturing approach was significantly reduced from 80% to just 20%. The lectures were organized into shorter presentations with an increased multimedia component and this resulted in better knowledge retention. The role of the tutor was essential in the practicals to provide didactic support, to help the students with the tools and to guide them in the analysis and interpretation of images.
Concerning RS, English language proficiency was a challenge for the first cohort when trying to make sense of specific terminology. To cope with this, a glossary was developed with the tutor’s help. With the other two groups, good English was made part of the selection requirements assessed through the pre-requisite questionnaire (Table 2) and both the glossary and critical use of Google Translator were adopted. Non-contact hours were self-managed by the students of all three cohorts by incorporating both a “cooperative base group” and independent work. The success of the activity was driven by providing the students with a clear goal, such as giving a presentation at school, attending a conference and delivering a specific task for a project.
All three cohorts developed high levels of competence and confidence in manipulating satellite imagery, as well as good analytical skills. Besides the technical skills, the RS for wildfires succeeded in fostering students’ leadership, teamwork, time-keeping, emotional intelligence and ability to hold each other accountable for their contributions, as well as the ability to deliver assigned tasks.
The evaluation of the training given by the students covered diverse aspects, including training structure and delivery style. Students’ comments revealed that their evaluation of the day was not limited to the quality of the training but was also influenced by technical and logistic issues, such as a change of room with weak internet connection, the crash of SNAP on their laptop or the slow performance of the tools being used.
Students’ appreciation of the overall structure and obtained results spanned between very good and excellent. One student of Cohort 2 was consistently less engaged, possibly due to diverse aspects, such as having to use his tablet for the practical work, having poor sustained focus and a resistance to collaborative work.
Key lessons learned for future projects included students having their own laptop to facilitate their work with the data, the need for good English knowledge and to be aware that 5th year students feel pressurized to get ready for their final exams and that this can influence their performance.
Remote sensing resulted in high potential impact in terms of work experience and education. Looking at Earth from space provided students a different perspective and gave them an understanding of the size of the impact of natural hazards, such as wildfires. In addition, it offered the opportunity to link concepts of math and physics that they had in their curriculum and make sense of them beyond the classroom context. In the future, we would like to engage students over a longer time period that connects them with remote sensing centers at universities.
Finally, we want to close with a student quote: “This experience within the INGV was unique and unforgettable thanks not only to my companions who worked with me but also thanks to the unique, welcoming and helpful tutors who followed us along the way. During this time, I learned many interesting things about many topics; Was the most interesting project regarding the job alternation school. I wish everyone to try it!”

Author Contributions

Conceptualization, methodology, formal analysis, investigation and writing—original draft preparation, S.A.; writing—review and editing and supervision, M.T. All authors have read and agreed to the published version of the manuscript.

Funding

This research received no external funding.

Acknowledgments

G. D’Addezio was responsible for coordinating the ASL–INGV programs. P. Vento and the students of Liceo Scientifico Cannizzaro in the person of F. Acocella, E. Alfano, G. Giorgetti, L. Laugeni, S. Sammiceli, S. Palmieri, G. Rocchi, E. Sbrenni, L. Serenellini and S. Zeppieri are thanked for choosing the EO project and for their efforts in learning and delivering the expected workload at their best. Thanks to Claudio Croce and the students S. Bellucci, G. Caschera and L. Lanfranconi of the Istituto San Giuseppe del Caburlotto. D. Stelitano is thanked as the co-tutor in the 2017 ASL module for help provided about satellite atmospheric correction problems and sharing his in-field experience. K. Soushi and R. Nakamura are responsible for the WebGIS Hotarea AIST project. The Copernicus EU program is thanked for providing free access both to Sentinel data and open-source SNAP. Google Earth is thanked as it was used to visualize burn-scar perimeters.

Conflicts of Interest

The authors declare no conflict of interest.

References

  1. Morselli, D.; Costa, M. Il Laboratorio Di The Laboratory of Crossing Borders in School-Work path interchange, Action Research, Evaluation and Educational Research and Social Studies on Policies and the World of Youth. RicercAzione 2014, 6, 193–209. Available online: https://www.academia.edu/24077351/Il_laboratorio_di_attraversamento_dei_confini_nellalternanza_scuola_lavoro_2014_ (accessed on 13 March 2020).
  2. School-work path interchange activity: Operative guide. 2015. Available online: http://www.istruzione.it/alternanza/allegati/NORMATIVA%20ASL/GUIDA%20OPERATIVA%20ASL_Versione%206.pdf (accessed on 10 May 2018).
  3. Guidelines for Paths for Cross-skills and Orientation. 2018. Available online: https://www.miur.gov.it/web/guest/-/linee-guida-dei-percorsi-per-le-competenze-trasversali-e-per-l-orientamento (accessed on 13 March 2020).
  4. School -work path interchange: Where are we? Esiti Monitoraggio Nazionale, a.sl 2012/2013, INDIRE. 2013. Available online: http://www.indire.it/lucabas/lkmw_file/scuolavoro2///Sintesi%20alternanza%202012_13_az.pdf (accessed on 10 May 2018).
  5. Focus School -work path interchange, Report 2016–2017, Fonte: Elaborazione su dati MIUR-Ufficio Statistica e Studi-Italian Minister of Education. Available online: https://www.cnos-scuola.it/sites/default/files/ASL_maggio%202018.pdf (accessed on 13 March 2020).
  6. ESERO. Available online: http://www.esa.int/Education/Teachers_Corner/European_Space_Education_Resource_Office (accessed on 10 September 2020).
  7. Wooster, M.J.; Roberts, G.; Smith, A.M.S.; Johnston, J.; Freeborn, P.; Amici, S.; Hudak, A.T. Thermal Infrared Remote Sensing; Springer: New York, NY, USA, 2013; Chapter 18; pp. 347–390. [Google Scholar]
  8. Center for Disaster Philanthropy. Available online: https://disasterphilanthropy.org/disaster/2019-australian-wildfires/ (accessed on 10 September 2020).
  9. Seiler, W.; Crutzen, P.J. Estimates of gross net fluxes of carbon between the biosphere and the atmosphere from biomas burning. Clim. Chang. 1980, 2, 207–247. [Google Scholar] [CrossRef]
  10. BBC News: “Unusual” Greenland Wildfires Linked to Peat. Available online: http://www.bbc.com/news/science-environment-40877099 (accessed on 10 September 2020).
  11. NASA-Earth Observatory. Available online: https://earthobservatory.nasa.gov/images/145302/another-fire-in-greenland#:~:text=Remote%20sensing%20scientists%20were%20surprised,morning%20of%20July%2010%2C%202019 (accessed on 10 September 2020).
  12. Amici, S. Blog Article. 27 March 2019. Available online: https://ingvambiente.com/2019/03/27/2019-un-inverno-di-fuoco/ (accessed on 10 September 2020).
  13. Justice, C.O.; Malingreau, J.P.; Setzer, A.W. Satellite remote sensing of fires: Potential and limitations. In Fire in the Environment: The ecological, Atmospheric, and Climatic Importance of Vegetation Fires; Crutzen, P.J., Goldammer, J.G., Eds.; John Wiley and Sons: New York, NY, USA, 1993; pp. 77–88. [Google Scholar]
  14. Chuvieco, E.; Mouillot, F.; van der Werf, G.R.; San Miguel, J.; Tanase, M.; Koutsias, N.; Garcia, M.; Yebra, M.; Padilla, M.; Gitas, I.; et al. Historical background and current developments for mapping burned area from satellite Earth observation. Remote. Sens. Environ. 2019, 225, 45–64. [Google Scholar] [CrossRef]
  15. ESA Sentinel 2 Mission. Available online:https://sentinel.esa.int/web/sentinel/missions/Sentinel2 (accessed on 10 September 2020).
  16. Grawe, N. Teaching with Data, Carleton College. Available online: www.carleton.edu/ (accessed on 10 May 2018).
  17. Felder, R.M. Reaching the Second Tier: Learning and Teaching Styles in College Science Education. J. Coll. Sci. Teach. 1993, 23, 286–290. [Google Scholar]
  18. Amici, S.; Stelitano, D.; D’Addezio, G.; Vento, P.; Acocella, F.; Giorgetti, G.; Rocchi, G.; Sbrenni, E.; Serenellini, L. “EO with Sentinel 2A: A school work path way experience”, (Poster). In Proceedings of the Earth Observation Open Science 2017 Conference ESRIN, Frascati, Italy, 25–28 September 2017; Available online: https://www.youtube.com/watch?v=3tT44bdvCO4 (accessed on 10 May 2018).
  19. Amici, S.; Kato, S.; Nakamura, R.; Miyamoto, H.; Oda, A.; Matsushita, H. Testing Japan hot spot system for High Temperature Events (HTE) in central Italy. In Proceedings of the 21st EGU General Assembly, Vienna, Austria, 7–12 April 2019. [Google Scholar]
Figure 1. (a) The cohort leader presenting the results; (b) the burned-area map of the fire that occurred in Sardinia, Italy, in August 2016 and the implementation of the thresholding approach to characterize it. The inset shows the students at work as presented in the Earth Observation Open Science conference [18].
Remotesensing 12 03635 g001
Figure 2. Burn scar perimeter delineation. (a) Location of few burned areas identified using Sentinel 2; (b) example of an extracted perimeter as reported in Google Earth by the students.
Remotesensing 12 03635 g002
Figure 3. Cohort 2 learning outcome assessment through multiple-choice quizzing.
Remotesensing 12 03635 g003
Figure 4. Cohort 2 didactic evaluation of contact training over six days, including training and guided activities. (a) Appreciation of the structure of the day. (b) Satisfaction about the tools and resources provided. (c) Appreciation of the teaching style. (d) Evaluation of the tutor’s ability to cover diverse topics and to answer questions.
Remotesensing 12 03635 g004
Figure 5. Cohort 3 didactic evaluation of contact training over three days including training and guided activities. (a) Appreciation of the structure of the day. (b) Satisfaction about the tools and resources provided. (c) Appreciation of the teaching style. (d) Evaluation of the tutor’s ability to cover diverse topics and to answer questions.
Remotesensing 12 03635 g005aRemotesensing 12 03635 g005b
Table 1. Diverse projects characteristics for the three cohorts.
ProjectCohort 1
(2017)
Cohort 2
(2018)
Cohort 3
(2019)
TitleEarth observation with satellite: the case of burned areasEarth observation with satellite: the fire perimeterEarth observation with satellite: validation of fire detection system
Pre-requisiteAbility to engage with new software, web basic, curiosityAbility to engage with new software, web basic, curiosityAccuracy, precision, ability to engage with new software, web basic
Timeline40 h in person + work from home
(March–May)
40 h in person + work from home
(Jan–May)
40 h in person + work from home
(Jan–March)
DeliverableBurn areasBurn perimeterFire classes validation
Class4th year4th year5th * year
No. of students553
Tutors211
* 5th class is the last year and the students have final exams.
Table 2. Summary of activities, the teaching and learning approach and how it has evolved in the three years.
ActivityCohort 1
(2017)
Cohort 2
(2018)
Cohort 3
(2019)
Aim
Module introduction talkYESYESNO 1Give an overview of expected work and outcome
Pre-requisite assessmentQuestionnaireQuestionnaireSet in advanceTo check good matching and level of technical preparation
Theory of remote sensing (lectures)50% traditional approach
50% interactive (videos, questioning, websites, etc.)
20% traditional approach
80% interactive (videos, questioning, websites, etc.)
and direct instruction
20% traditional approach
60% interactive
(videos, questioning, websites, etc.)
and direct instruction
20% mentoring
Providing the basic knowledge of RS, algorithms and technology to be used in the project
to understand the sensors and satellite technology
Active learningPracticals on
SNAP Toolbox functions
Additional self-learning with online tutorial
To give a presentation PowerPoint basics
Practicals on
SNAP Toolbox functions
Google Earth
To give a presentation PowerPoint basics
Practicals on
WebGIS interface,
Google Earth, Word,
Excel
To learn how to visualize and manipulate data
To understand what the imagery has to say
To learn to use the tools useful to accomplish the assigned tasks
Academic ethic and integrityLectures LecturesLecturesTo understand integrity, plagiarism copyright and credits, images
Guided analysisTo select the test case
To implement algorithms
To understand the data
To select the
data set
To implement algorithms
To understand the data
and the technical challenges
To understand images
To implement data validation criteria
To report the results
To support and mentor the students
Expected resultTo produce a burned-area map with the Sentinel 2
(NDVI 2 and NBR 3)
Compile and give a presentation atschool
To extract burn-scar perimeters
To present the result through Google Earth
Compile and give a presentation at school
To verify hot-spot categories
To report significant data in Excel and Word
High score in assessment criteria
Produce good-quality results
AssessmentTestimonials
MIUR criteria
Questionnaires
+ testimonials
MIUR criteria
Questionnaire
+ testimonial
MIUR criteria
High score in MIUR assessment
1 A scouting approach within the school was used in this case based on a set of pre-requisites. 2 Normalized Difference Vegetation Index [14]. 3 Normalized Burn Ratio [14].
Publisher’s Note: MDPI stays neutral with regard to jurisdictional claims in published maps and institutional affiliations.

