Abstract
Absorption of colored dissolved organic matter or detrital gelbstoff (aCDOM/ADG) and light attenuation coefficient (Kd490) parameters were studied at La Parguera Natural Reserve in southwestern Puerto Rico, before and following Hurricanes Irma (6–7 September) and María (20–21 September) in 2017. Water quality assessments involving Sentinel 3A ocean color products and field sample data was performed. The estimated mean of ADG in surface waters was calculated at >0.1 m−1 with a median of 0.05 m−1 and aCDOM443 ranged from 0.0023 to 0.1121 m−1 in field samples (n=21) in 2017. Mean ADG443 values increased from July to August at 0.167 to 0.353 m−1 in September–October over Turrumote reef (LP6) with a maximum value of 0.683 m−1. Values above 0.13 m−1 persisted at offshore waters off Guánica Bay and over coral reef areas at La Parguera for over four months. The ADG443 product presented values above the median and the second standard deviation of 0.0428 m−1 from September to October 2017 and from water sample measurement on 19 October 2017. Mean Kd490 values increased from 0.16 m−1 before hurricanes to 0.28 right after Hurricane Irma. The value remained high, at 0.34 m−1, until October 2017, a month after Hurricane María. Analysis of the Sentinel (S3) OLCI products showed a significant positive correlation (rs = 0.71, p = 0.0005) between Kd490_M07 and ADG_443, indicating the influence of ADG on light attenuation. These significant short-term changes could have ecological impacts on benthic habitats highly dependent on light penetration, such as coral reefs, in southwestern Puerto Rico.
1. Introduction
Hurricane María was recorded as the third costliest hurricane in USA history [1]. It is considered the most damaging atmospheric event to have impacted the island in the past 90 years. Hydrological data availability during the study period was limited; nevertheless, estimates suggest that the 24 h-rainfall intensity exceeded 100–250 year values [2]. Severe flooding affected most of the island, and river discharges were at record levels. Hurricane Irma brought maximum inundation levels of 30.48 to 60.96 cm above ground level along Puerto Rico (PR) coastal areas with an estimated storm surge at Magueyes Island, La Parguera (LP), of 0.17 cm and an estimated inundation of 21.33 cm. The total rainfall in the interior mountains was around 254–381 mm between September 5 and 7, 2017 [3].
For this study, we took advantage of the availability of remote sensing imagery such as Sentinel 3 (S3), which provided us with the capacity to monitor water quality parameters remotely and efficiently. Many studies have derived water quality parameters from ocean color radiometry during past decades [4,5,6]. The most critical water quality parameters that can be derived from satellite ocean color sensors are colored dissolved organic matter (CDOM), chlorophyll-a (Chl-a), the attenuation coefficient at 490 nm (Kd490), and total suspended matter (TSM). These factors have been historically monitored for water quality assessment and referenced as indicators of coastal and marine ecosystem health [4,7,8]. Chlorophyll (a proxy for phytoplankton abundance) [9] and turbidity (as well as CDOM) contribute to reducing light penetration in the water column [4,5], which has been associated with ecosystem changes, phytoplankton dynamics [9], and growth and distribution of seagrasses [4] and coral reef species [10]. These effects on light penetration and quality can be considered environmental stressors and a water pollutant [11]. Several studies have been conducted on coastal water quality following hurricane events using remote sensing techniques [4,5,12]. These have focused primarily on the continental estuarine and coastal habitats as well lacustrine [5,13,14,15,16,17], with a few studies available for the Caribbean Sea [18,19,20], where our study area, La Parguera Natural Reserve (LPNR), is located.
LPNR, in southwestern Puerto Rico, was designated to protect fragile tropical marine ecosystems, particularly coral reefs, which are experiencing accelerated degradation and mortality in this and many parts of the world [21]. We have witnessed unprecedented disappearance of coral cover due to coral diseases, bleaching and thermal stress, runoff, anthropogenic uses, and hurricanes [10,22,23]. La Parguera has one of the largest coral reef systems in Puerto Rico, with 10–14 coral species in 100 m2 located at a diverse bottom type; presenting one of the most diverse benthic habitats on the island, combining coral reefs, seagrasses, mangroves, sandy bottoms, among others [23]. LPNR supports a blue economy around the region with local fisheries, tourism, and recreation. Coral reefs reach their maximum development under oligotrophic conditions but can exist over a wide range of water types under variable coastal influences [10,24]. In coastal waters, light penetration can be subject to sudden changes when specific weather conditions occur. Corals can adapt to light changes compensating energetically and adjusting photosynthetic pigment composition, but this may come at the cost of reduced calcification rates and symbiont tissue habitat [25]. Sporadically, the stress related to water quality can be compounded with coral bleaching [25]. Chronic stress due to changes in water quality can lead to changes in the biodiversity of marine ecosystems [26,27].
CDOM is an optical parameter positively related to light absorption in surface waters [28,29,30,31]. The primary source of CDOM is terrestrial runoff, highly influenced by photodegradation [32,33,34]. CDOM absorption provides a biogeochemical proxy to estimate DOC from optical measurements [6,35,36] and can be used as a tracer of oceanic water masses [31]. CDOM absorption at 412 and 443 nm, while variable, formed a significant component of these wavebands of the total absorption field [37]. It is essential to consider that the absorption of CDOM in the blue-green region increases the uncertainty of Chl-a algorithms leading to over-estimate values [31]. In Puerto Rico, light absorption has been mainly associated with chlorophyll concentrations [10], but CDOM values have not been recorded or related to light availability. Kd490 is another important parameter for water quality since it provides a measure of turbidity related to the total organic and inorganic matter held in solution and suspension in the water column. It can be used to quantify light availability and sediment loading for benthic organisms (i.e., coral reefs and seagrasses) [20,38].
We used remote sensing to monitor water quality trends in the attenuation coefficient at 490 nm (Kd490) and the absorption of colored detrital, and dissolved material (ADG/aCDOM) parameters in waters off southwestern Puerto Rico. We analyzed the changes in Sentinel 3A (S3) products and complemented our records with surface water sample optical analysis to assess water quality in a natural reserve in southwestern Puerto Rico before and following Hurricanes Irma (6–7 September) and María (20–21 September) in 2017.
2. Materials and Methods
2.1. Study Site
The study area includes the region from Guánica Bay (GB) to La Parguera Natural Reserve (LPNR) in southwestern Puerto Rico. LPNR is located about 8 km west of GB and is known for its highly developed coral reefs and extensive seagrass habitats. The average annual water temperature in LPNR is 26.5–30 °C, and the salinity fluctuates from 31 to 36 PS [7].
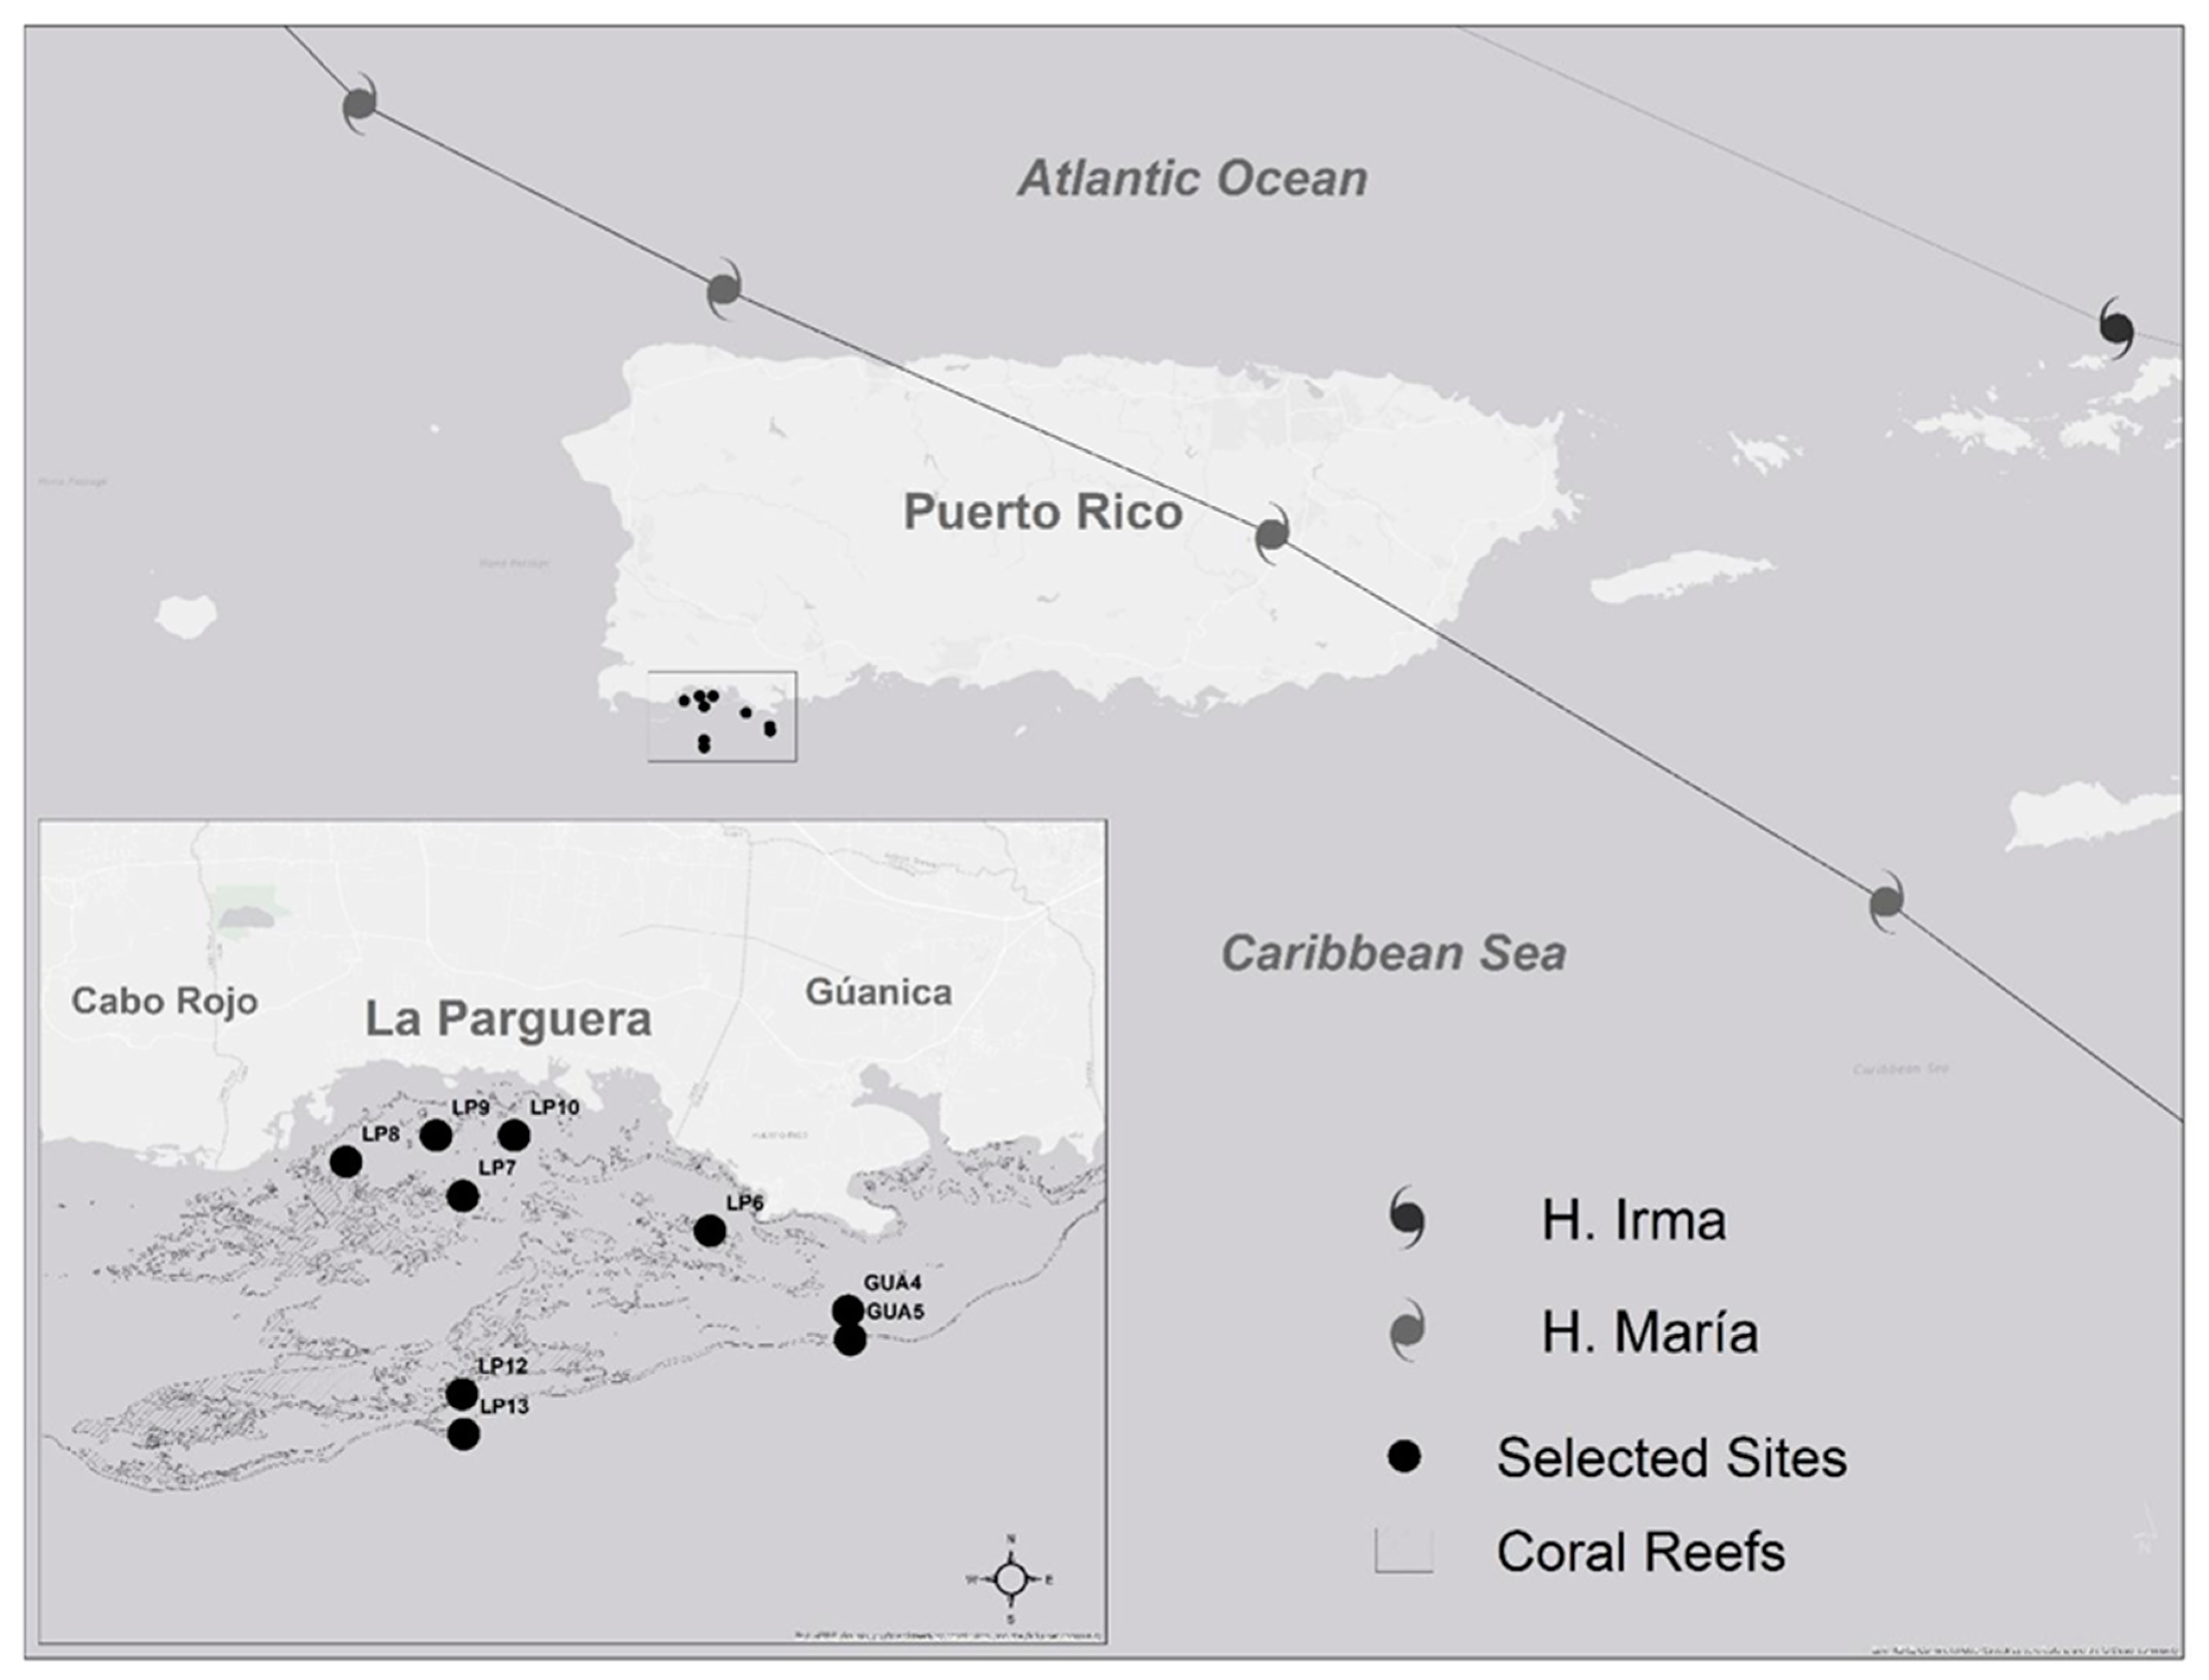
Coral reefs habitats are shown within the contour lines representing the study area as a region of interest (ROI) (Figure 1). These are delineated using live coral cover classification [39], while the perpendicular lines represent the limits of La Parguera Natural Reserve. The ROI was considered for statistical data analysis. Seven out of the thirteen stations are presented here. Stations GUA4, GUA5, LP12, and LP13 were located offshore and along the insular platform. While sites LP6, LP8, and LP10 were closer to the coast (Figure 1).
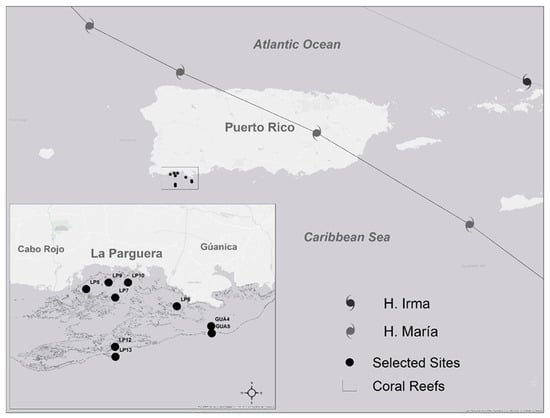
Figure 1.
Study area at southwestern Puerto Rico with Hurricanes Irma and María paths. Sampling sites and delimited areas represent submerged coral reef areas that support fisheries and economies around the region. Base map was from ESRI®.
2.2. Satellite Data
The Sentinel 3A (S3A) Ocean and Land Colour Instrument (OLCI) is a push-broom imaging spectrometer with 21 spectral bands in the range of 400–1020 nm [40]. It was launched in February 2016, followed by S3B, launched in March 2017. Their products have a full-spatial resolution of 300 meters and include water-leaving reflectance in 16 bands, algal pigment concentrations [41] and neural network algorithms [42], total suspended matter concentration (TSM), diffuse attenuation coefficient (Kd490_M07) Morel method [41], and absorption of colored detrital and dissolved organic matter (ADG_443_NN) GSM method [43,44]. The temporal resolution for OLCI is daily with an optimum orbit above the study area every two days.
We obtained the data from the EUMETSAT Copernicus data system. S3A/OLCI data were extracted from the pixel coinciding with our field water monitoring stations and pixels over the ROI (Figure 1). The Sentinel Application Platform (SNAP) tools, developed by the European Space Agency (ESA) for satellite product analysis, were used for obtaining OLCI Level 2 data products. Only Sentinel 3-A data were used in the study.
Water quality products (ADG and Kd490) were extracted from Sentinel 3 OLCI imagery dating from July to December 2017. A subset of three images (out of 20) was evaluated considering the region of interest (ROI). It included the following dates: 22 July, 11 September, and 8 October 2017. This subset was selected to reduce uncertainty due to the following factors: negative reflectance values from bands one to six, sunglint effect, cloud, or land adjacency effect, or products fail/flags. Imagery is visualized with a median (7 × 7) pixel value. The complete set of images was divided into five time-frames, summarizing four images in each period. The time frames included one period previous to the hurricane events, one period immediately after the event and three additional periods after the event to identify the long-term effect on light attenuation. Only the LP6 site data were used in the time frame to avoid negative values and other sensor issues previously mentioned.
2.3. Water Quality Measurements—Field and Laboratory Analysis
Water samples and optical data were collected in 2017. The number of sampling stations varied based on the sea state, environmental parameters, and imagery availability. Sampling was conducted monthly at three to 13 stations in southwestern Puerto Rico (Figure 1). The locations were selected based on depth, bottom type, and habitat in relation to coral reefs. Water samples were obtained from the first meter depth and analyzed in the laboratory for CDOM absorption (aCDOM).
2.3.1. aCDOM
Duplicate samples were collected at each station using gloves, avoiding any contamination with organic matter. They were stored in previously cleaned 250 mL amber glass bottles and transferred to 140 mL bottles after filtration. Sterile membrane filters (0.2 μm pore) were employed (Pall©). The filtration system was rinsed beforehand and between each filtration with a 50 mL portion of sample water and was then discarded [45]. Spectrophotometric analysis was carried out using a Shimadzu 1800-UV diode array instrument. Samples were analyzed in 10 cm path length quartz cells at 0.5 nm intervals over a wavelength range from 250 nm to 800 nm. Milli-Q water absorbance was subtracted from the sample data, and subsequently, the value at 700 nm was subtracted from the entire spectrum [46]. The absorbance values were converted to absorption coefficients, a (λ, m−1), and absorption coefficients at 443 nm (aCDOM443 m−1) were reported as quantitative aCDOM. The absorption coefficients an (m−1) were calculated using the following equation:
where A(ʎ) is the absorbance at a wavelength, and l is the optical path length of the cell in meters.
a = 2.303A(ʎ)/l
2.3.2. Satlantic HyperPro
The Satlantic profiling spectroradiometer measures in-water downwelling plane irradiance (Ed) and upwelling radiance (Lu) with 256 spectral bands for a full spectral range of 305–1100 nm [47]. A surface Ed radiometer measures downwelling irradiance above the water surface and is used to normalize the in-water data for fluctuations in the incident light field from passing clouds. The instrument derives spectral water column attenuation coefficients, including the Kd490 following Aurin and Petzold (1981) in the manufacturer manual [48]:
K(490) = 0.0833 (Lu(443)/Lu (550))−1.491 + 0.022
2.4. Statistical Analysis
The SNAP© Sentinel toolbox, pixel extraction, and histogram tools were used to obtain satellite data statistics. S3A data were divided into 5-time frames (July–September, September–October, October–November, November–December, and December 2017) to evaluate the mean and median differences over time. A Spearman correlation was applied to ADG443_NN satellite data, aCDOM field data and Kd490 for field and satellite data to understand the influence of ADG/aCDOM on light attenuation. The analysis was employed using Origin Pro 2016© software.
3. Results
3.1. Satellite Data (ADG443_NN) and In Situ Data (aCDOM443)
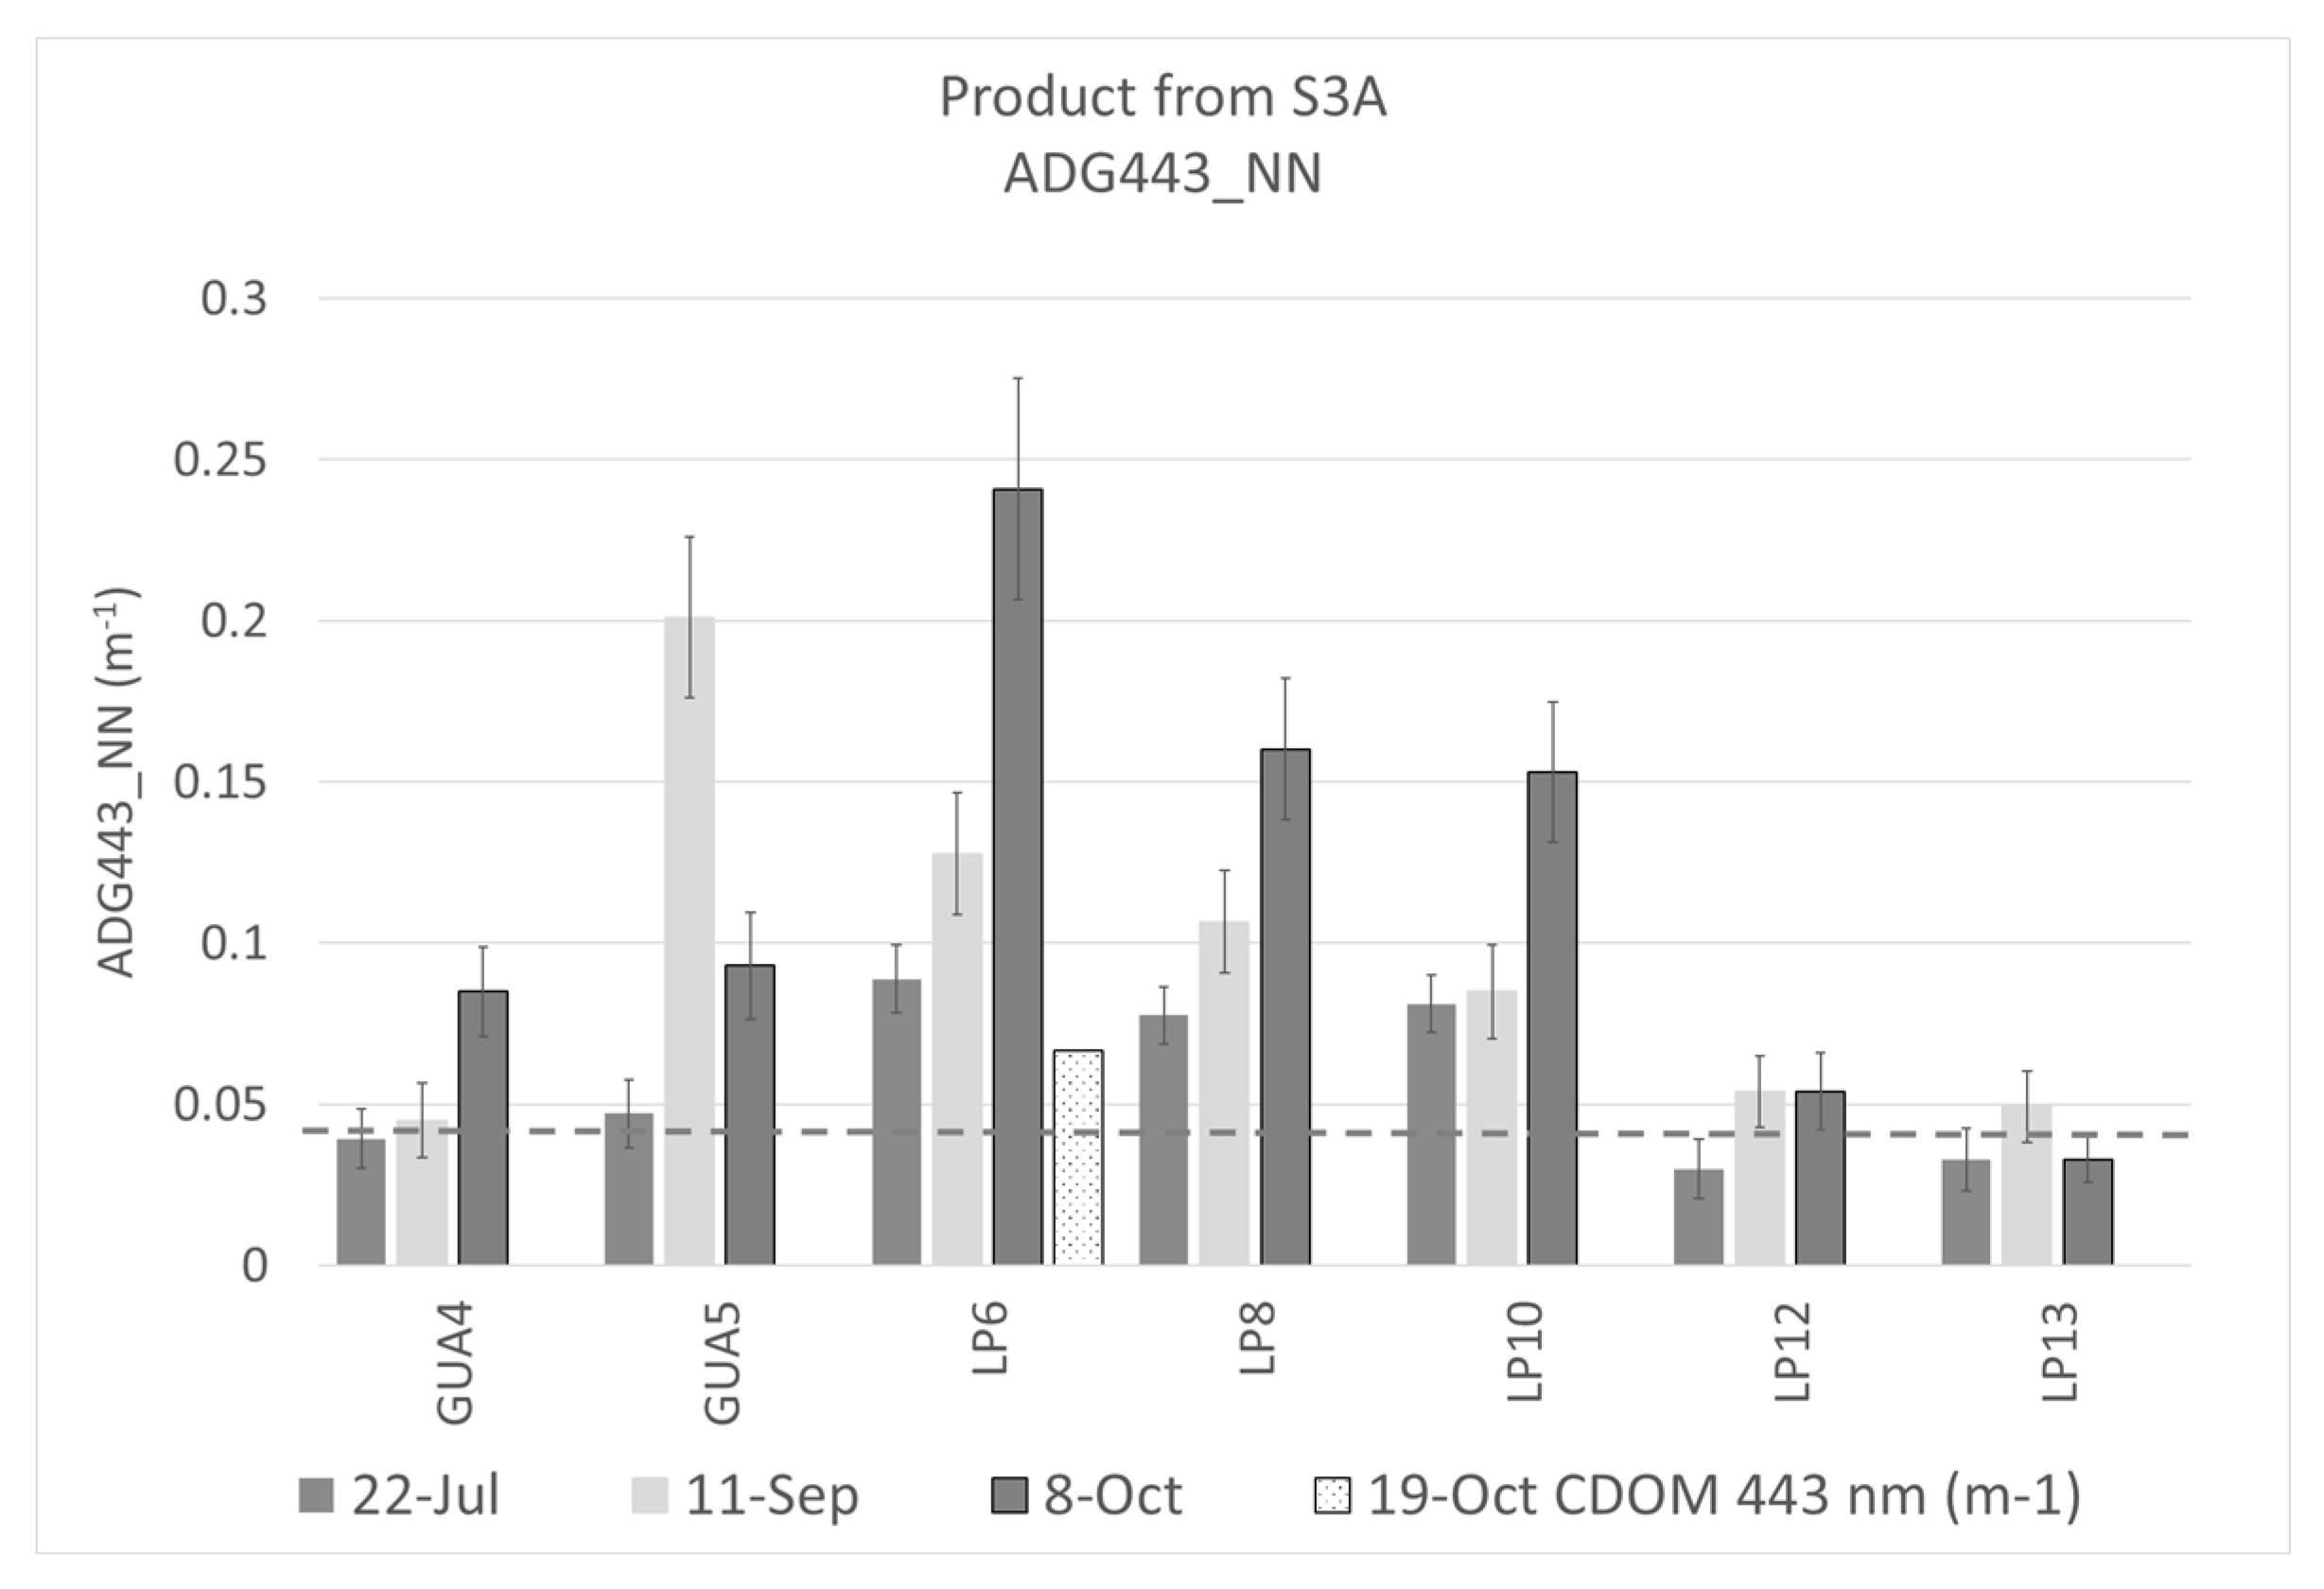
Results were based on in situ data for a year (2017) and the last six months (2017) data retrieved from satellite sensor S3A. Before the hurricane events, oligotrophic stations located at the shelf edge showed ADG443_NN values below 0.05 m−1; while values below 0.1 m−1 were associated with insular shelf sites. The value of the ADG443_NN was above the median of 0.0435 m−1 (prior to the events, over the ROI) for the entire sampling period. On September 11, four days after the first event, amounts above 0.1 m−1 were detected at GUA5, LP6, and LP8 for one month (Figure 2). The highest ADG values at offshore waters were detected on Sep 11, after the first hurricane (H. Irma) which was considered less severe because its eye did not make landfall. On the other hand, the effects of H. María on the values were evident on Oct 8th satellite data in most of our study area. It had a similar or lower effect on ADG (GUA5, LP12, and LP13) values at outer shelf waters but the sensor detected higher values at inner shelf waters.
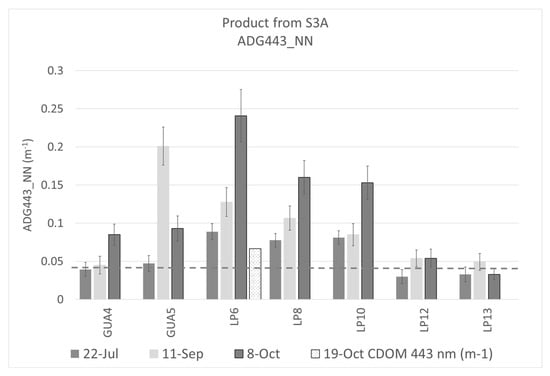
Figure 2.
ADG443_NN product from Sentinel 3A for 22 July, 11 September, and 8 October 2017; the figure includes the aCDOM at 443 nm field data on 19 October 2017, at LP6 sampling site. The dashed line represents the second standard deviation (2SD) for aCDOM443 field data.
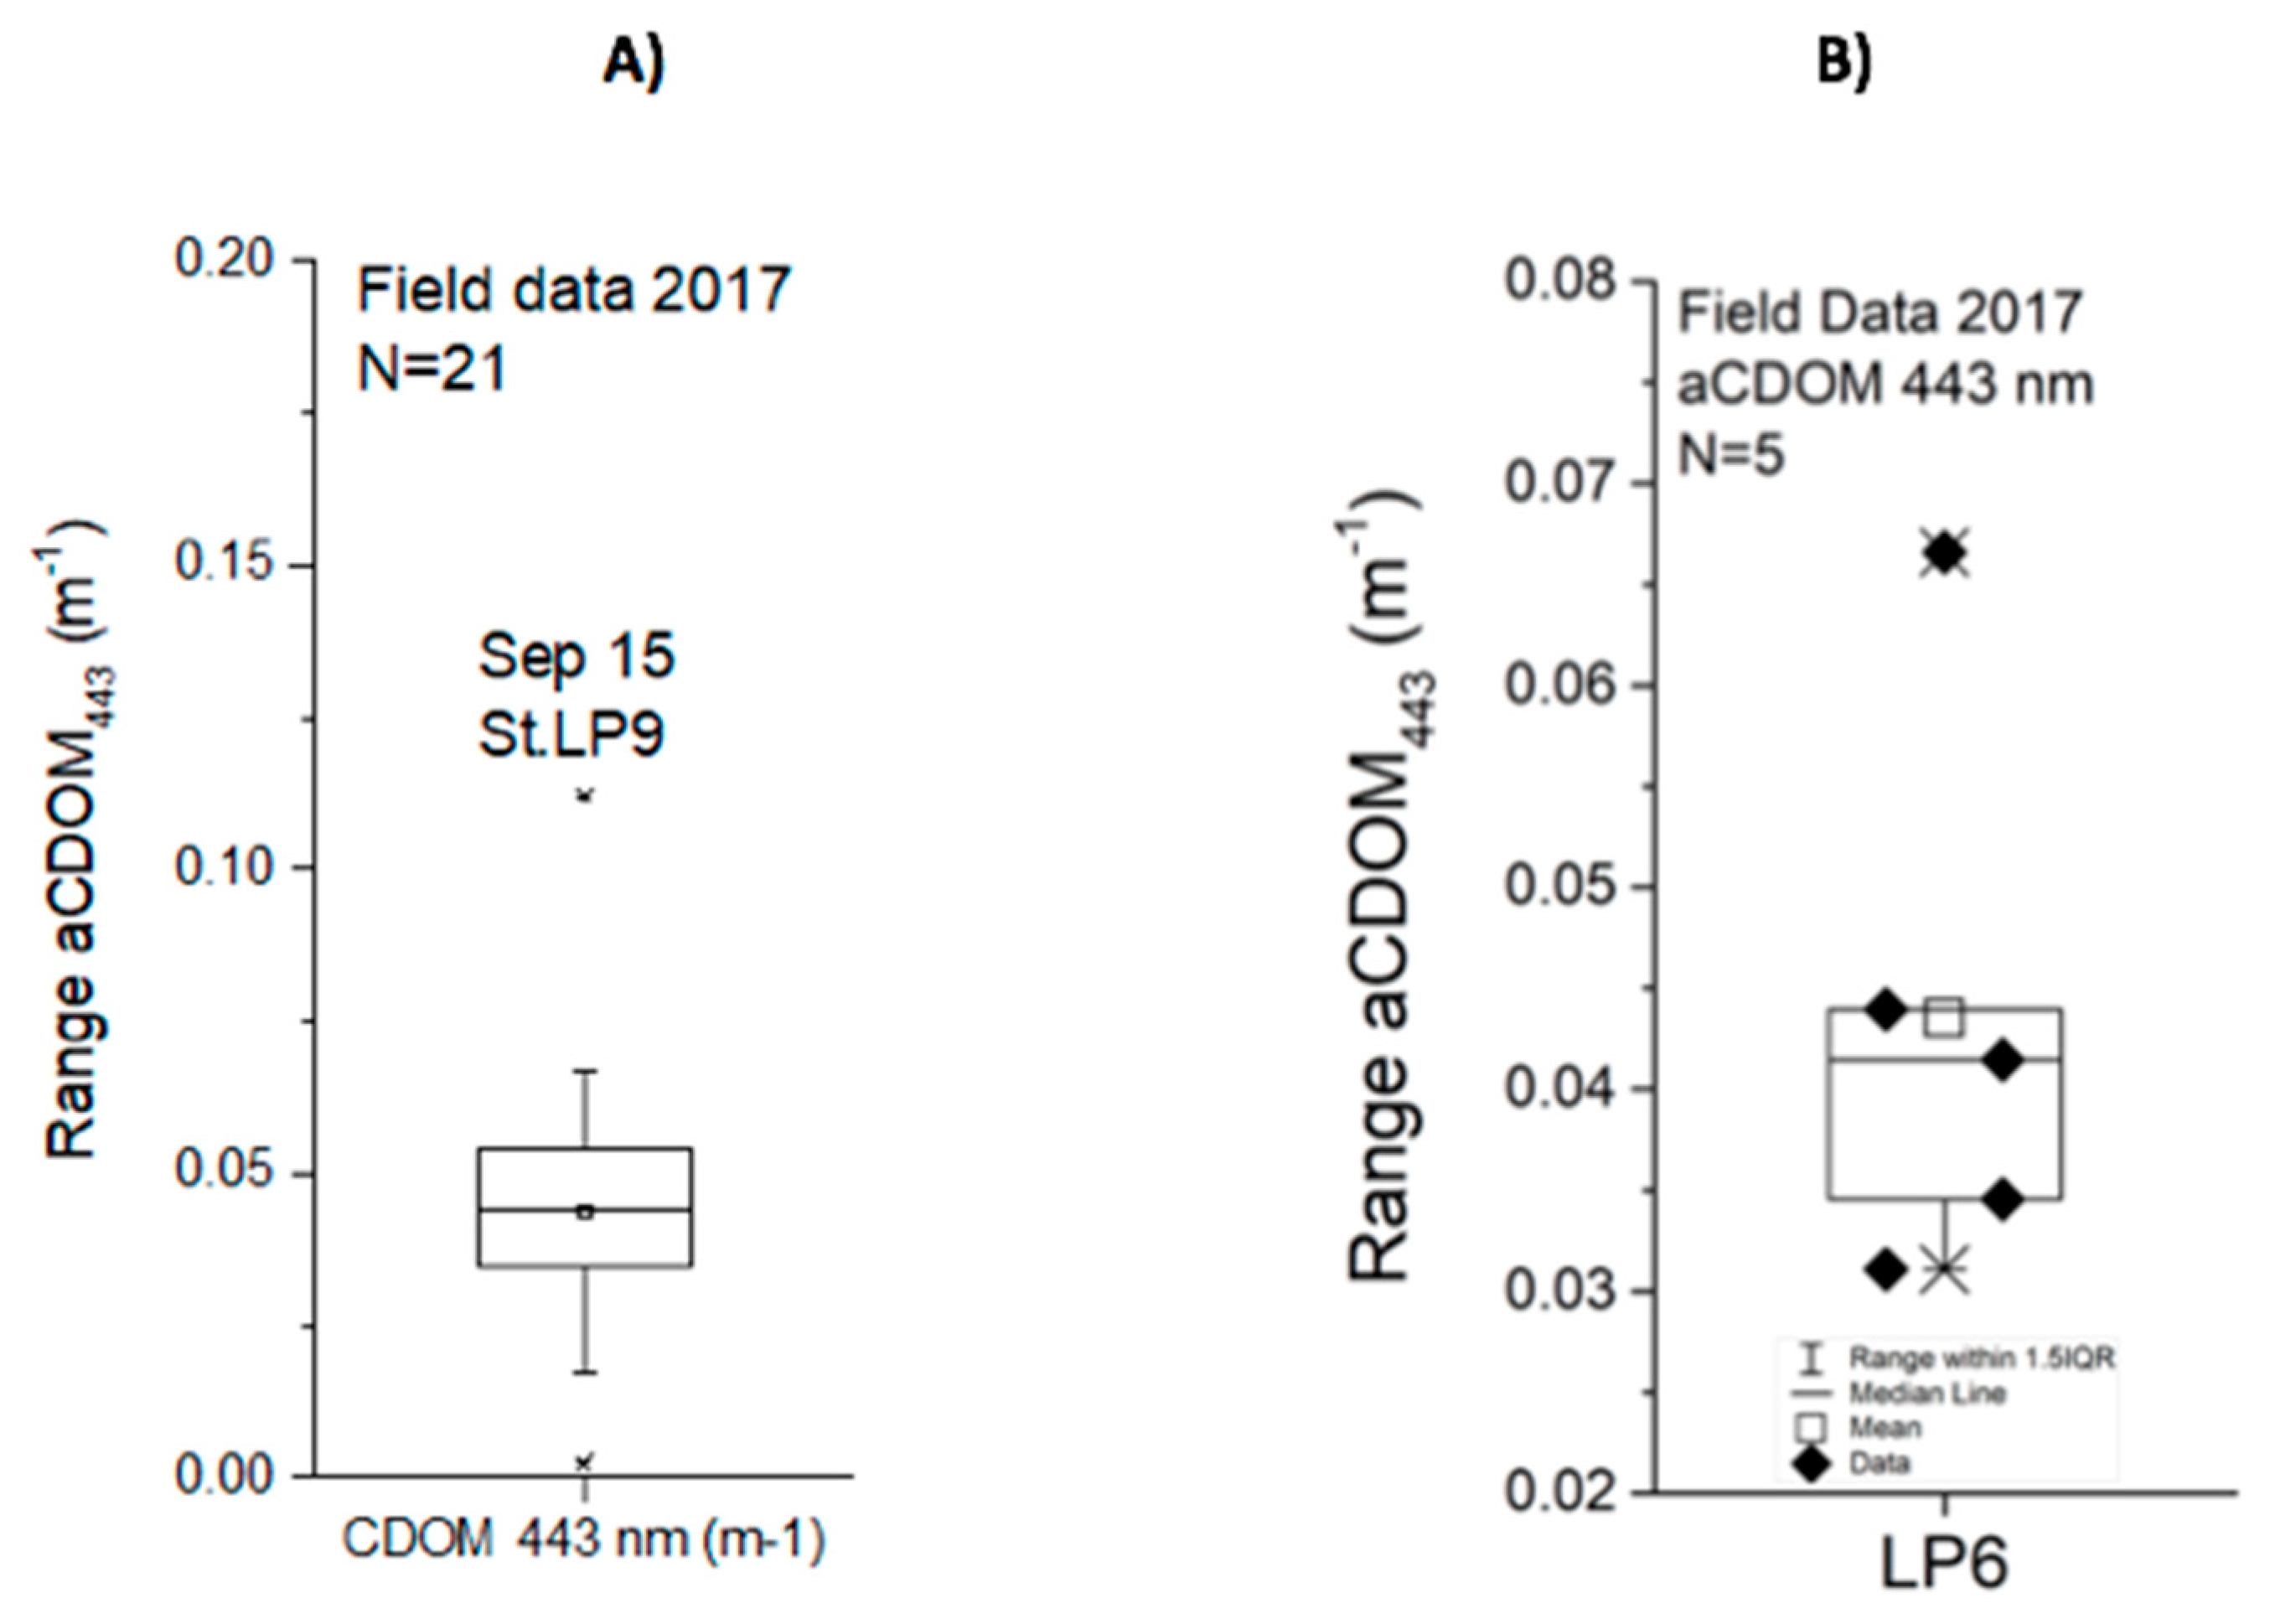
A view from in situ data showed the aCDOM443 ranging from 0.0023 to 0.1121 m−1 in field samples (N = 21) with a 2SD of 0.0428 m−1 in 2017 (Figure 3). Before the events, field values were below 0.043 m−1. An unusual value of 0.1121 m−1 was observed in the station LP9 on 15 September 2017 (Figure 3A). Another extreme value of 0.068 m−1 above the 2SD was present in the field data at the LP6 site (N = 5) during 19 October 2017 (Figure 3B). Station LP6 is located to the southwest of Guánica Bay. The extreme values belong to the sample size and should not be treated as outliers even though a Grubbs’ outlier test detect these as such. We can consider them as extreme values as a result of the events.
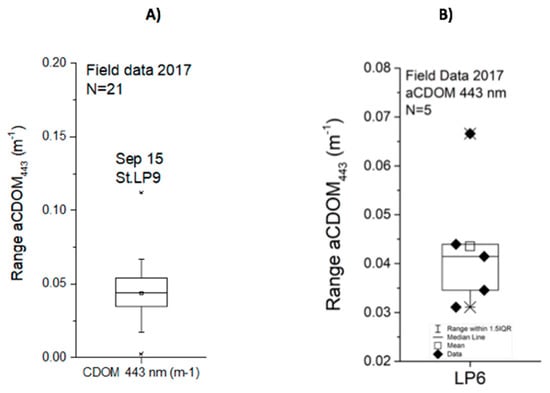
Figure 3.
Box plots for field data showing the median, mean and data including the extreme values (A) Summary of the absorption coefficient of colored dissolved organic matter (aCDOM) at 443 nm field data for the year 2017. (B) The absorption coefficient of colored dissolved organic matter (aCDOM) at 443 nm field data on station LP6, alias Turrumote II, for 2017.
S3A data were divided into five-time frames (July–September, September–October, October–November, November–December, and December 2017) to evaluate the mean and median differences (Table 1). The mean for ADG_443_NN was doubled in the second period from 0.1675 (pre hurricanes) to 0.3536 m−1 (September–October). The maximum value of 0.6834 m−1 was detected in the same period. The values extracted from S3A started in July with values above the maximum of field data for 2017. Values above 0.13 m−1 persisted until December, four months after the events. Moreover, the median showed the same tendency (>0.1 m−1) over four months. River discharges and coastal drainage persist several weeks after the events. No major events took place after September, which may indicate we are seeing the long term effect of the hurricanes in coastal water biogeochemistry.

Table 1.
Statistics for five time periods on ADG443_NN product from Sentinel 3A.
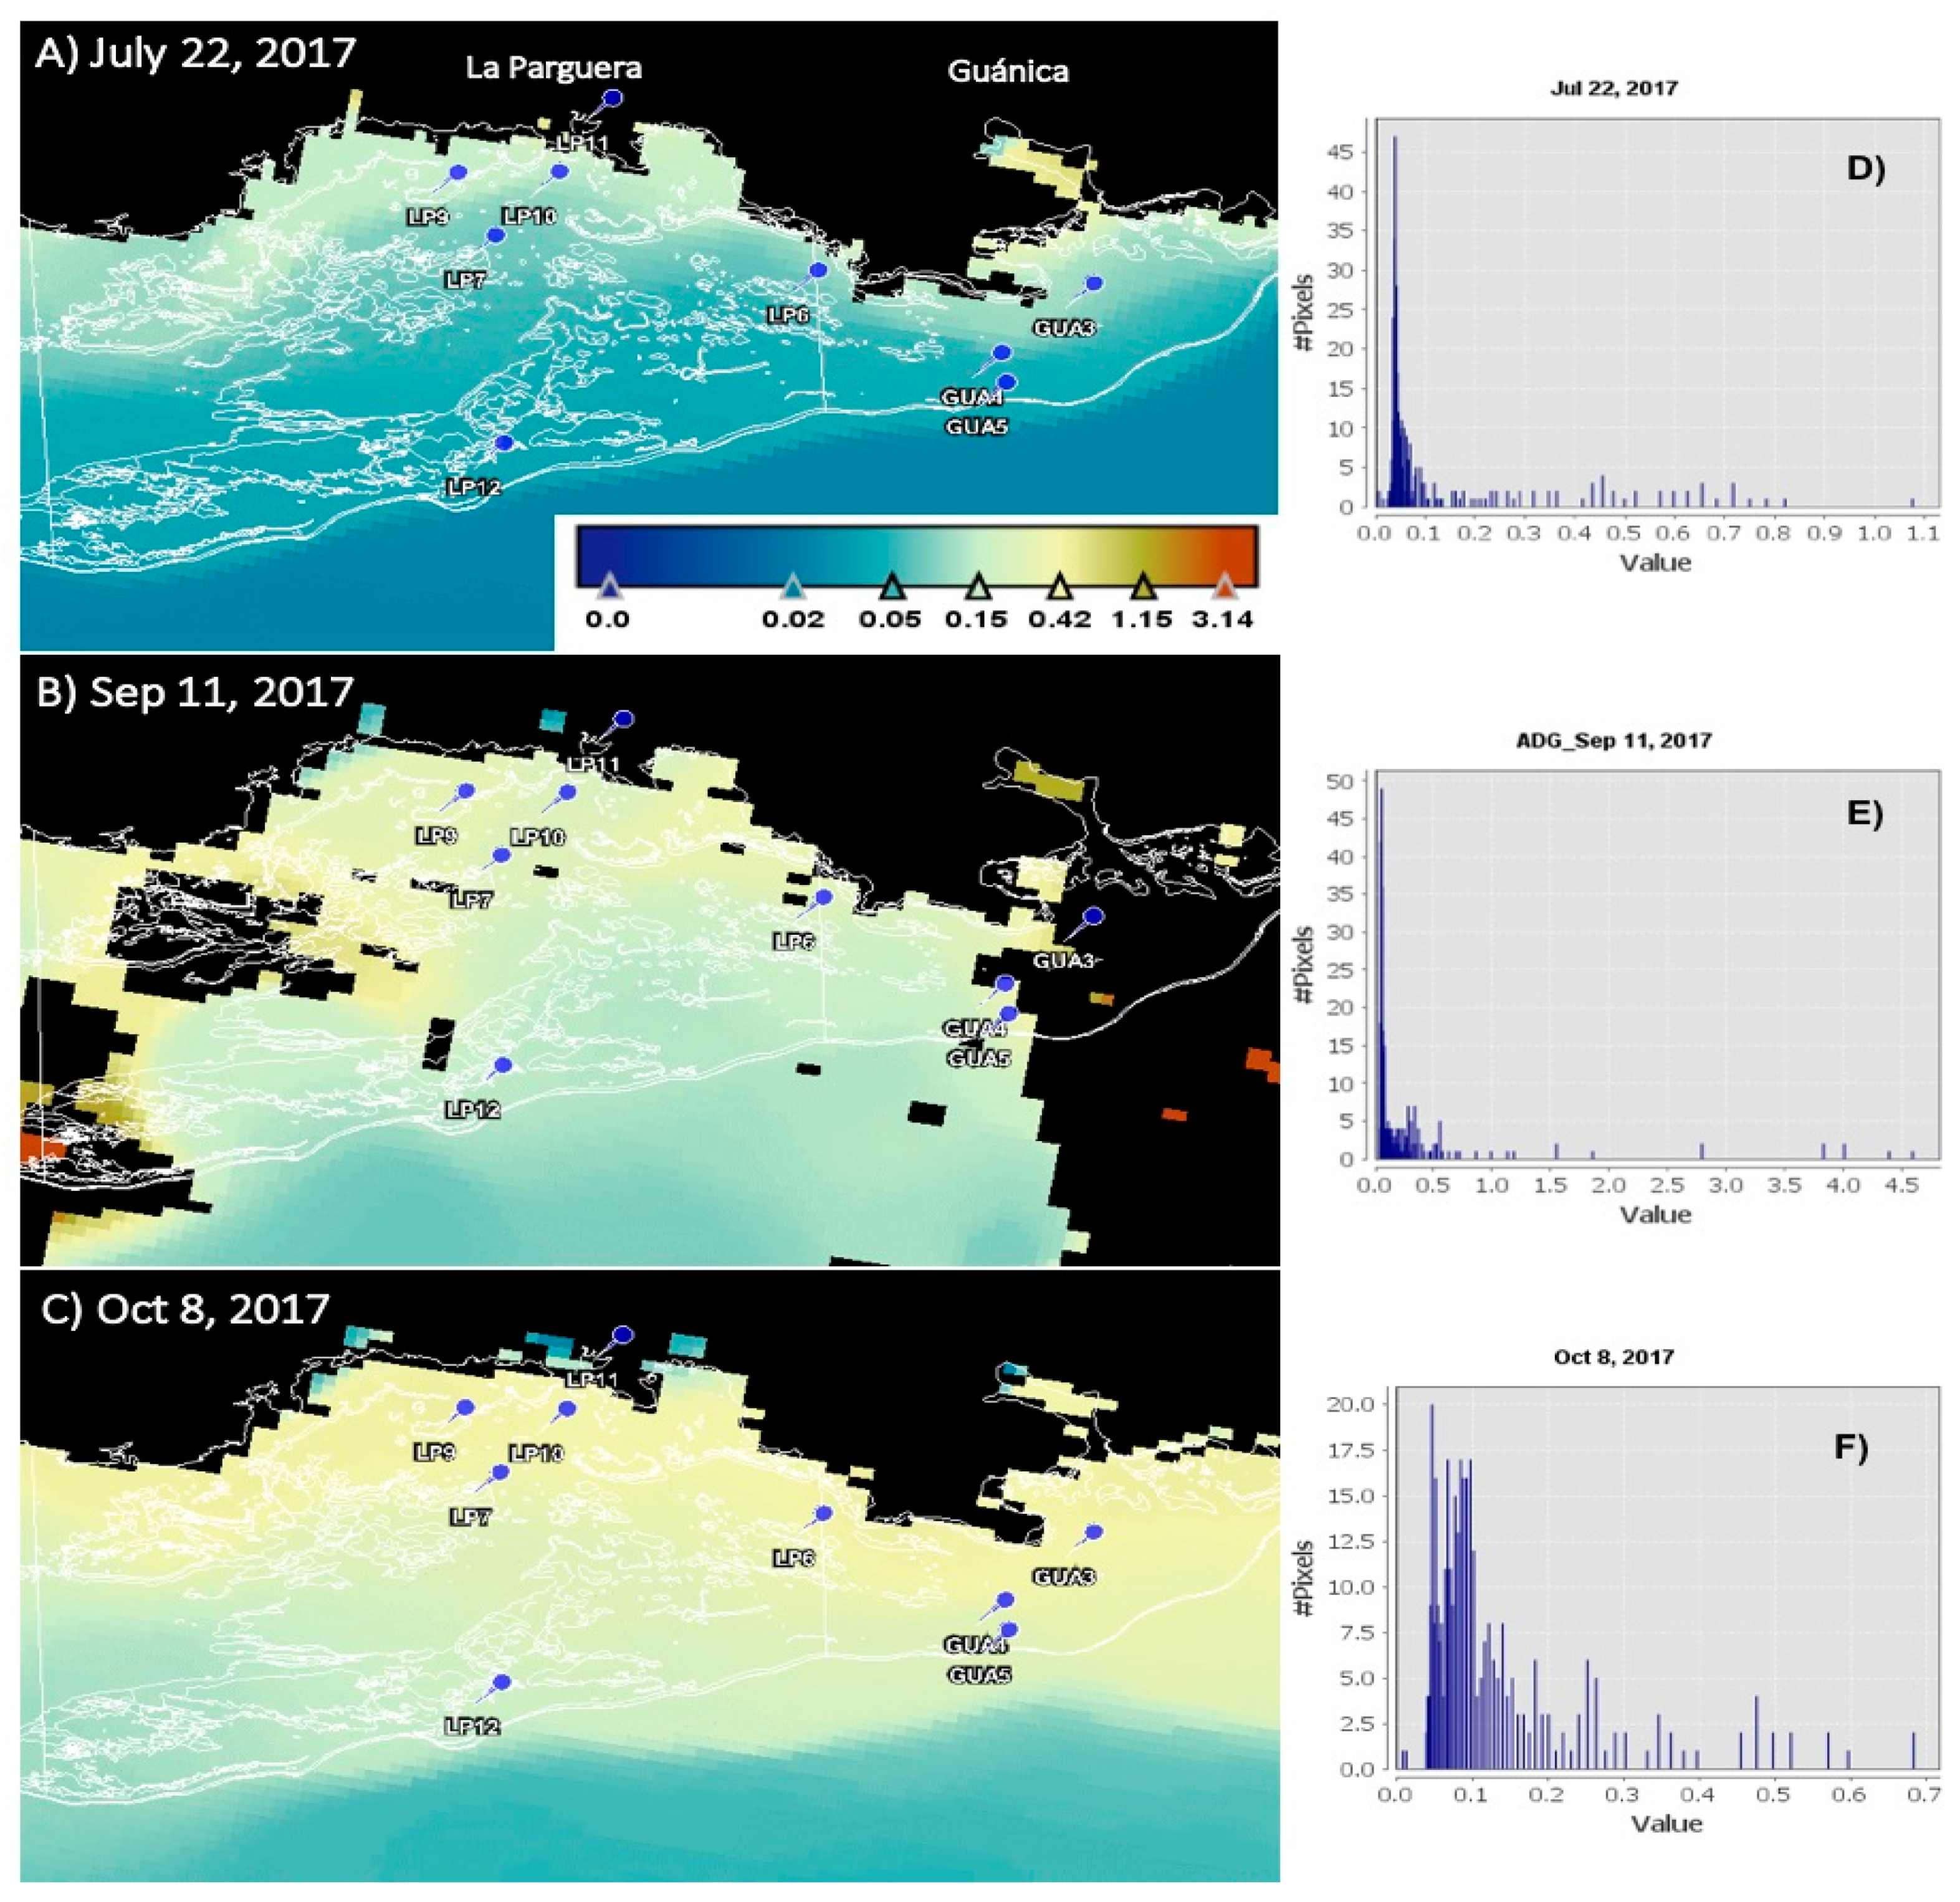
Satellite imagery show the absorption of dissolved organic matter over time. Figure 4 shows the S3A ADG443_NN product prior to (July 22), and following (September 11 and Oct. 8) the passage of hurricanes Irma and María over Puerto Rico. Contour lines represent coral reefs as the region of interest (ROI). The ROI was considered for graphs and statistics on Figure 4 and Table 2. The high values of ADG443_NN in Figure 4 correspond to pixels that cover mainly shallow areas and emergent reefs. However, the analysis only considered the extracted values in submerged areas. The histogram for July 22 shows around 46 pixels lower than 0.05 m−1 and more than 95 % of pixels with values < 0.1 m−1. The maximum value was 1.0 m−1 (Table 2). After the first hurricane event (Irma), an increase in the ADG443_NN values from Guánica Bay to La Parguera was observed (Figure 4) as expected after an event of such magnitude. Approximately, 12% of pixels in the selected area were considered in Table 2. The histogram shows an increment of pixels with values in the range of 0.1 to 0.5 m−1 (Figure 4) and shows pixels with up to 4.5 m−1. Table 2 shows the increase in the median ADG443_NN value over time from 0.04 to 0.08 m−1.
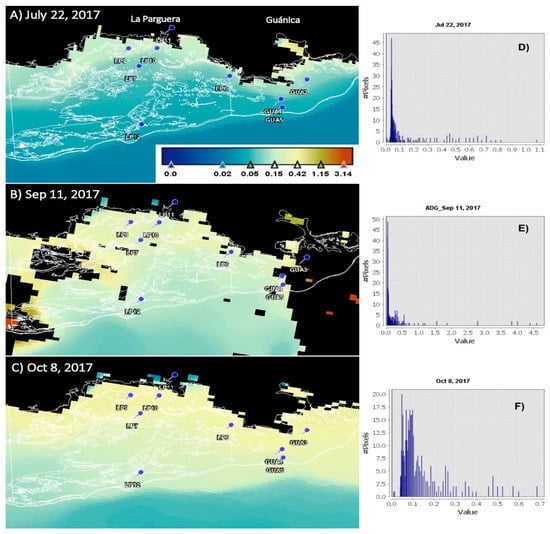
Figure 4.
Sentinel 3A ADG_443_NN product (median visualization). Contour lines represent coral reefs as the region of interest (ROI) while the perpendicular lines represent the limits of La Parguera Natural Reserve. Black areas represent land-mask and cloud-mask applied to the imagery (A) before the hurricanes on 22 Jul 2017 (B) 11 Sep 2017 after Hurricane Irma and (C) Oct 8, 2017 after two hurricane events (H. Irma and H. María); (D) Histograms for regions of interest representing ADG443_NN pixel values on 22 July 2017, (E) 11 September 2017 and (F) 8 October 2017.

Table 2.
Sentinel 3A Ocean and Land Colour Instrument (OLCI) data statistics for ADG443_NN product over (ROI) coral reef areas around Guánica to La Parguera Natural Reserve.
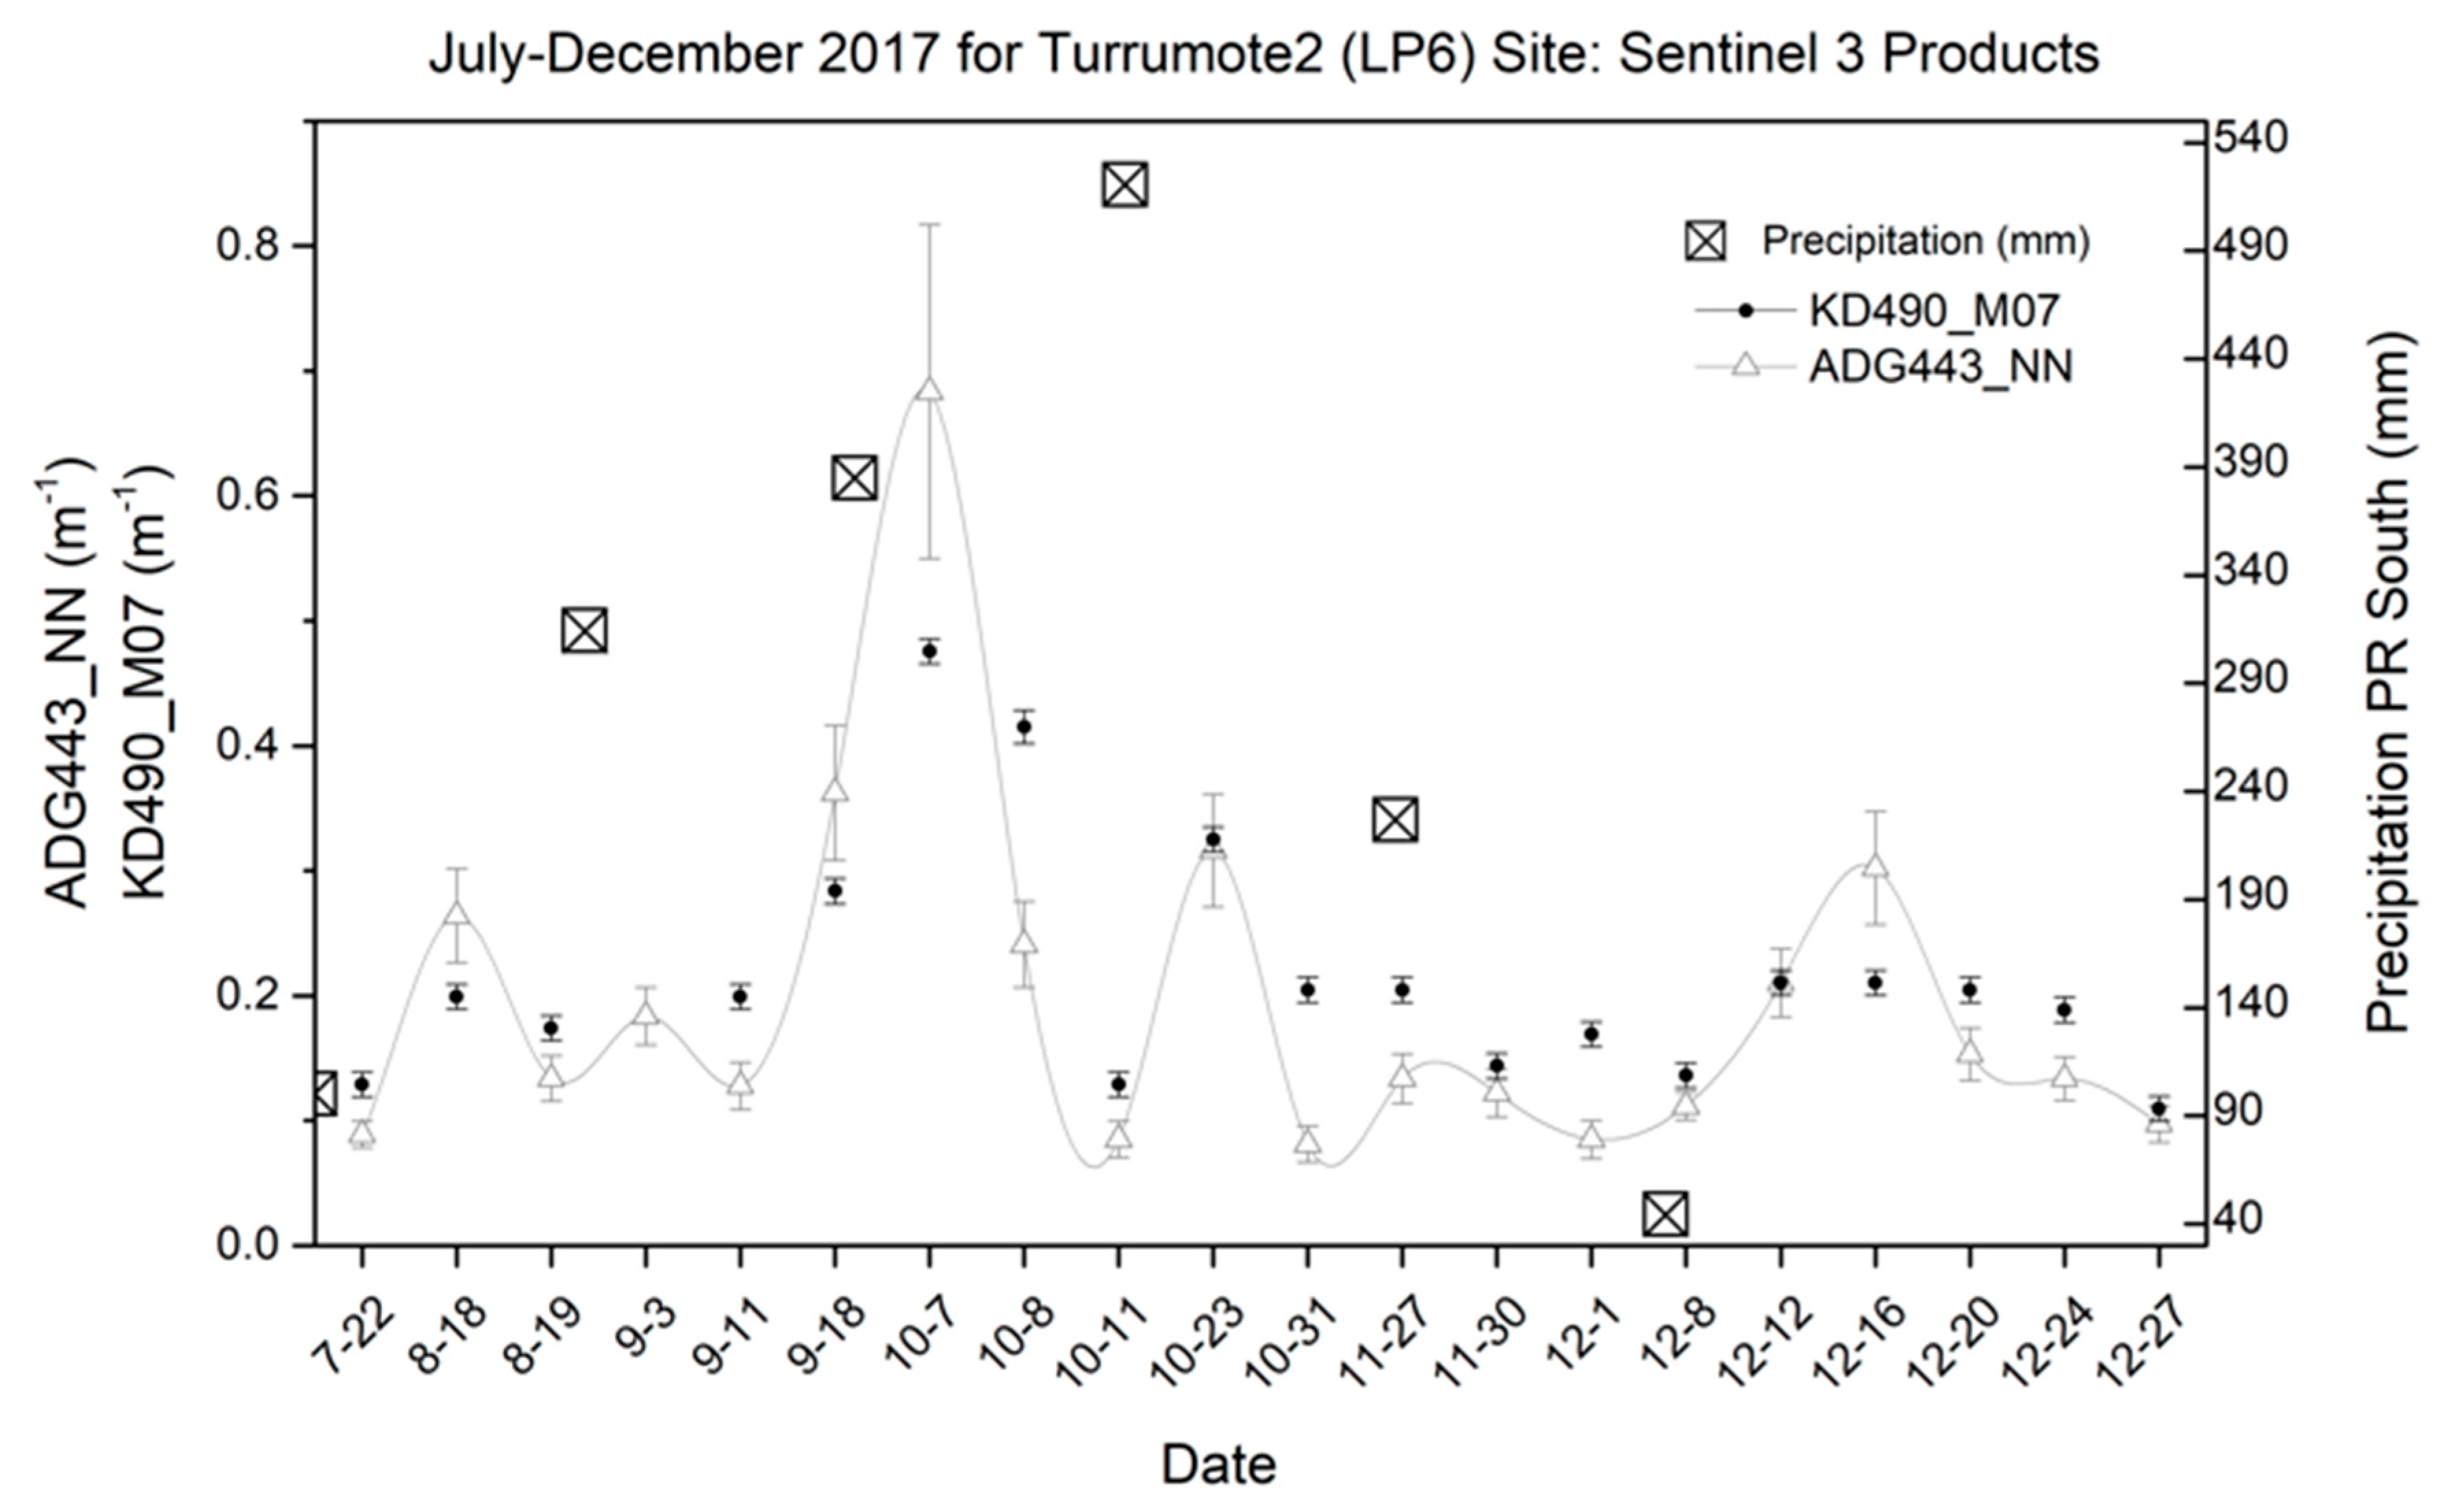
To visualize the effect on light attenuation, we chose sampling station (LP6), located between Guánica Bay and LPNR. It is near the coastline but, far enough to be outside the influence of land pixels. Taking a look on satellite data of this site, a spike value was observed on 7 October 2017, for both parameters ADG443_NN and Kd490, with high values on 18 August, 23 October, and 16 December 2017 (Figure 5). These values were concurrent with two heavy rain periods during the last six months of the year 2017. The image from October 8 showed the impact on water quality parameters three weeks after the events. All ADG443_NN values were over 0.04 m−1 for the entire sampling period.
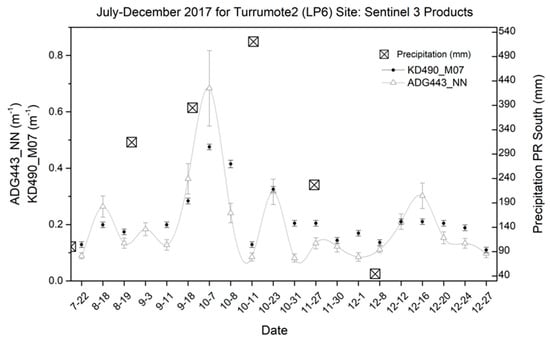
Figure 5.
S3A OLCI products from July to December 2017 showing the changes over time for station LP6 known as Turrumote II (located between Guánica Bay (GB) and La Parguera Natural Reserve (LPNR)) for ADG443_NN and Kd490_M07 and monthly precipitation at Guayanilla, Puerto Rico (PR) south station.
The S3A data for the last six months of 2017 shows an ADG mean value of 0.2 m−1 (sd = 0.14, n = 20) with a minimum of 0.08 m−1 on 31 October 2017, and a maximum of 0.68 m−1 on 7 October 2017. This maximum coincides with maximum Chl-a and Kd490 values while the minimum value was not coincident with the minimum of Kd490. From July to December the ADG mean exceeds the 0.0436 m−1 mean and 0.0437 median values found in field data for the year 2017. Considering LP6 field data, it presented 0.0249 m−1 as the second standard deviation with a mean of 0.0435 m−1 (N = 5) while satellite data showed a mean value of 0.2 m−1 (N = 20). The selected images (N = 3) in Figure 2 show 0.13 m−1 as a mean value which triplicates the field data mean of aCDOM443 (N = 21).
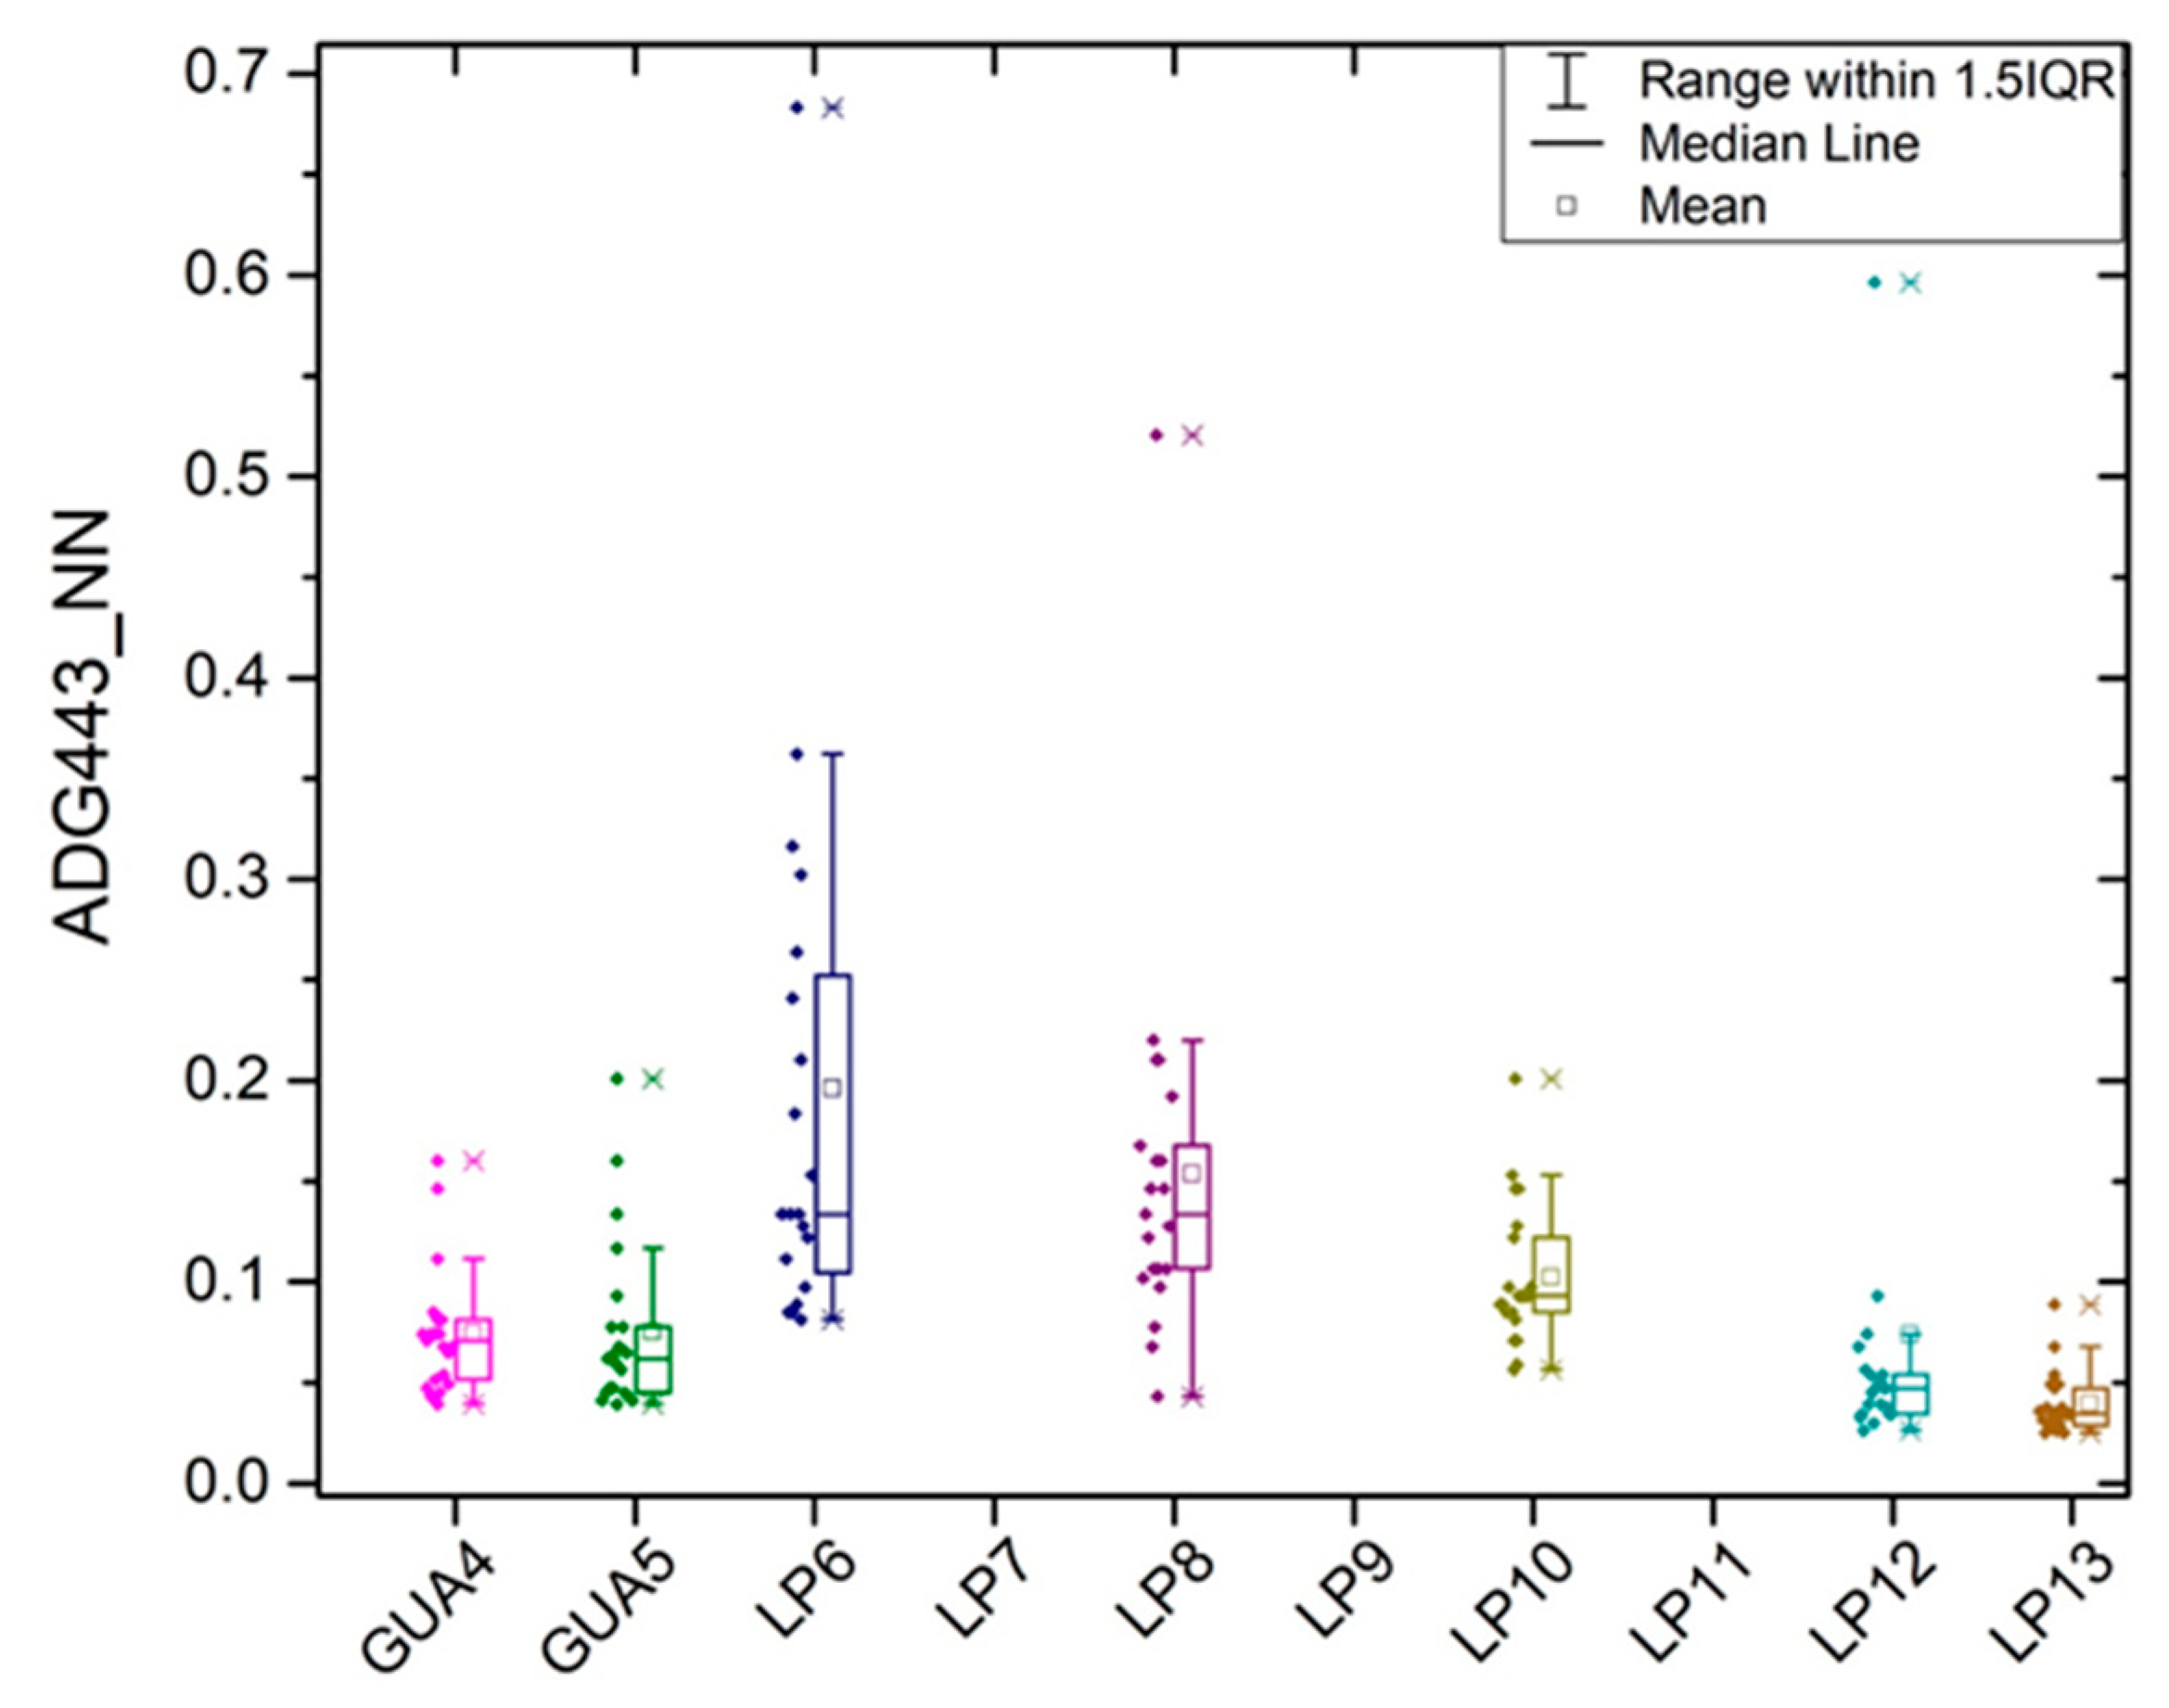
The highest ADG values among stations were found at station LP6 (mean = 0.1957 m−1) (Figure 6) which may imply influence of the freshwater plume emanating from Guánica Bay reaching the area. The second highest values were observed at LP8, also known as Laurel (mean = 0.1535 m−1) followed by LP10, out of the bioluminescent bay (mean = 0.1023 m−1). These two correspond to shallow inner coral reef areas. Stations GUA4 (mean = 0.0744 m−1) and GUA5 (mean = 0.0753 m−1) were located at the edge of the shelf close to Guánica Bay showing lower values than the inner shelf sites. Sites LP12 and LP13 were located above the border of the insular shelf and closer to La Parguera. These presented the lowest values 0.07342 and 0.0395 m−1 (N = 21), respectively.
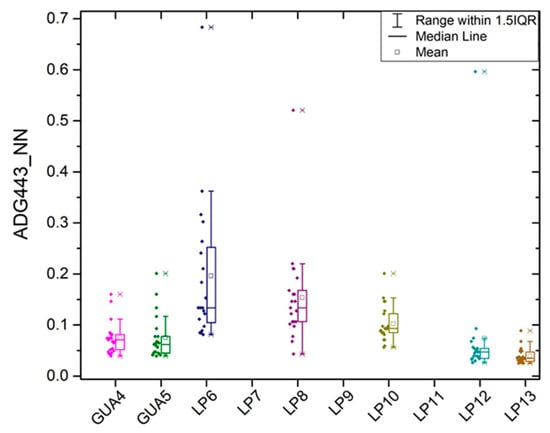
Figure 6.
S3A OLCI Product ADG_443_NN from Sentinel 3A (EUMETSAT-Copernicus data) from July to December 2017 at selected sampling sites in southwestern, PR. The graph shows the range per site, median line, mean, data points, and extreme values.
3.2. Kd490 and Correlation with ADG443/aCDOM443
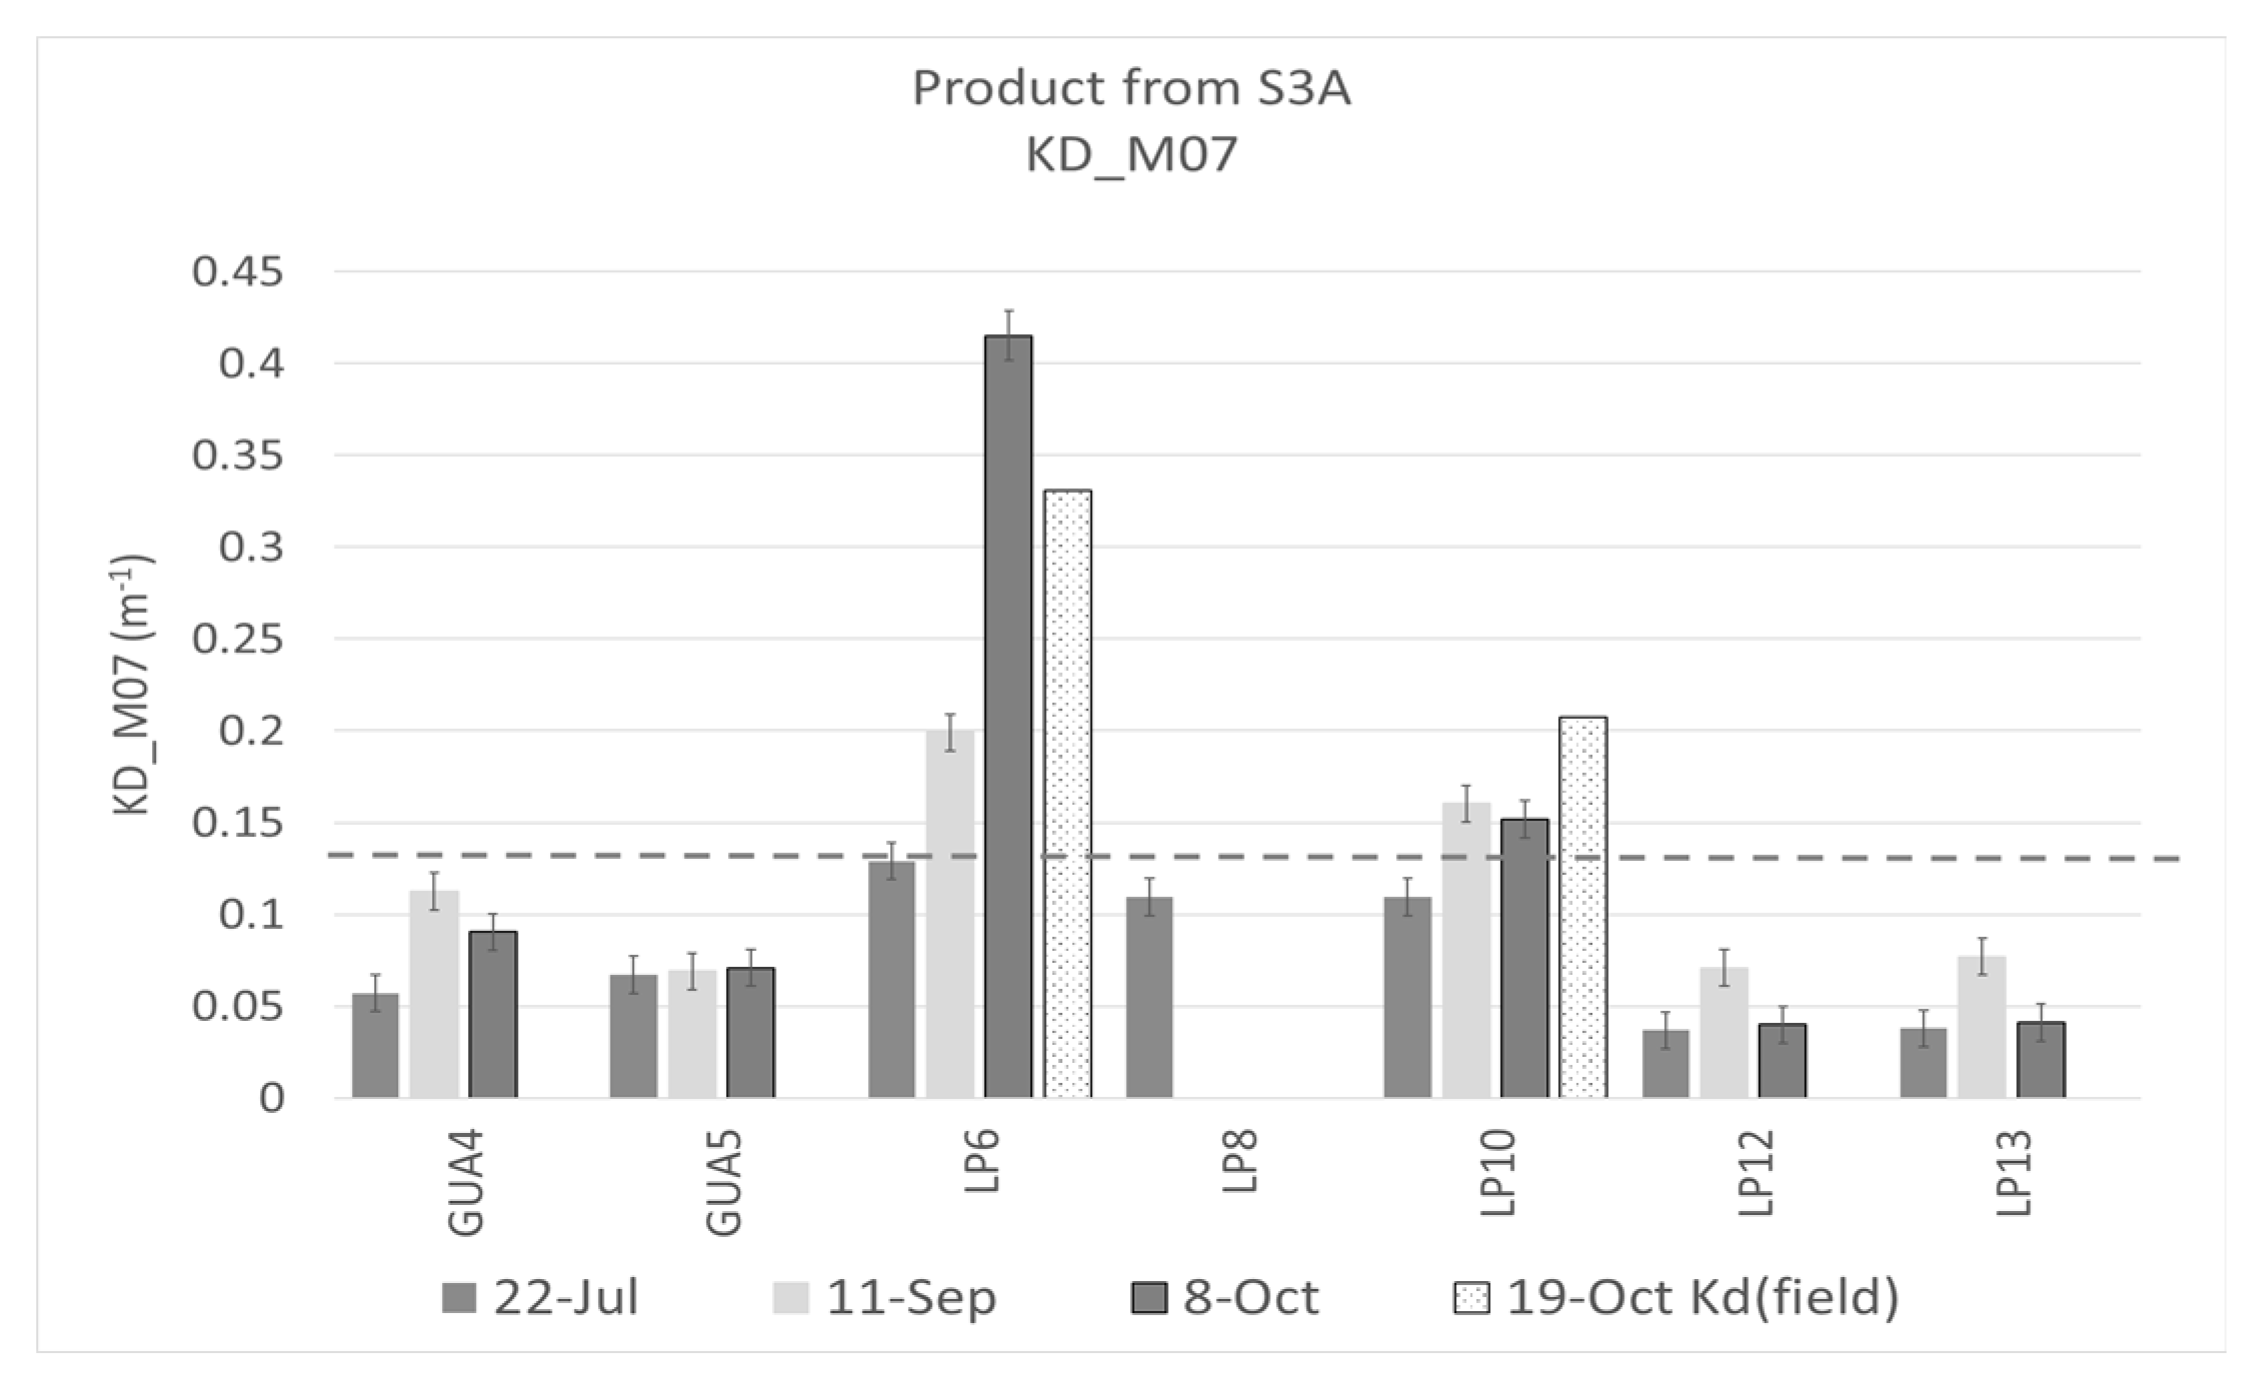
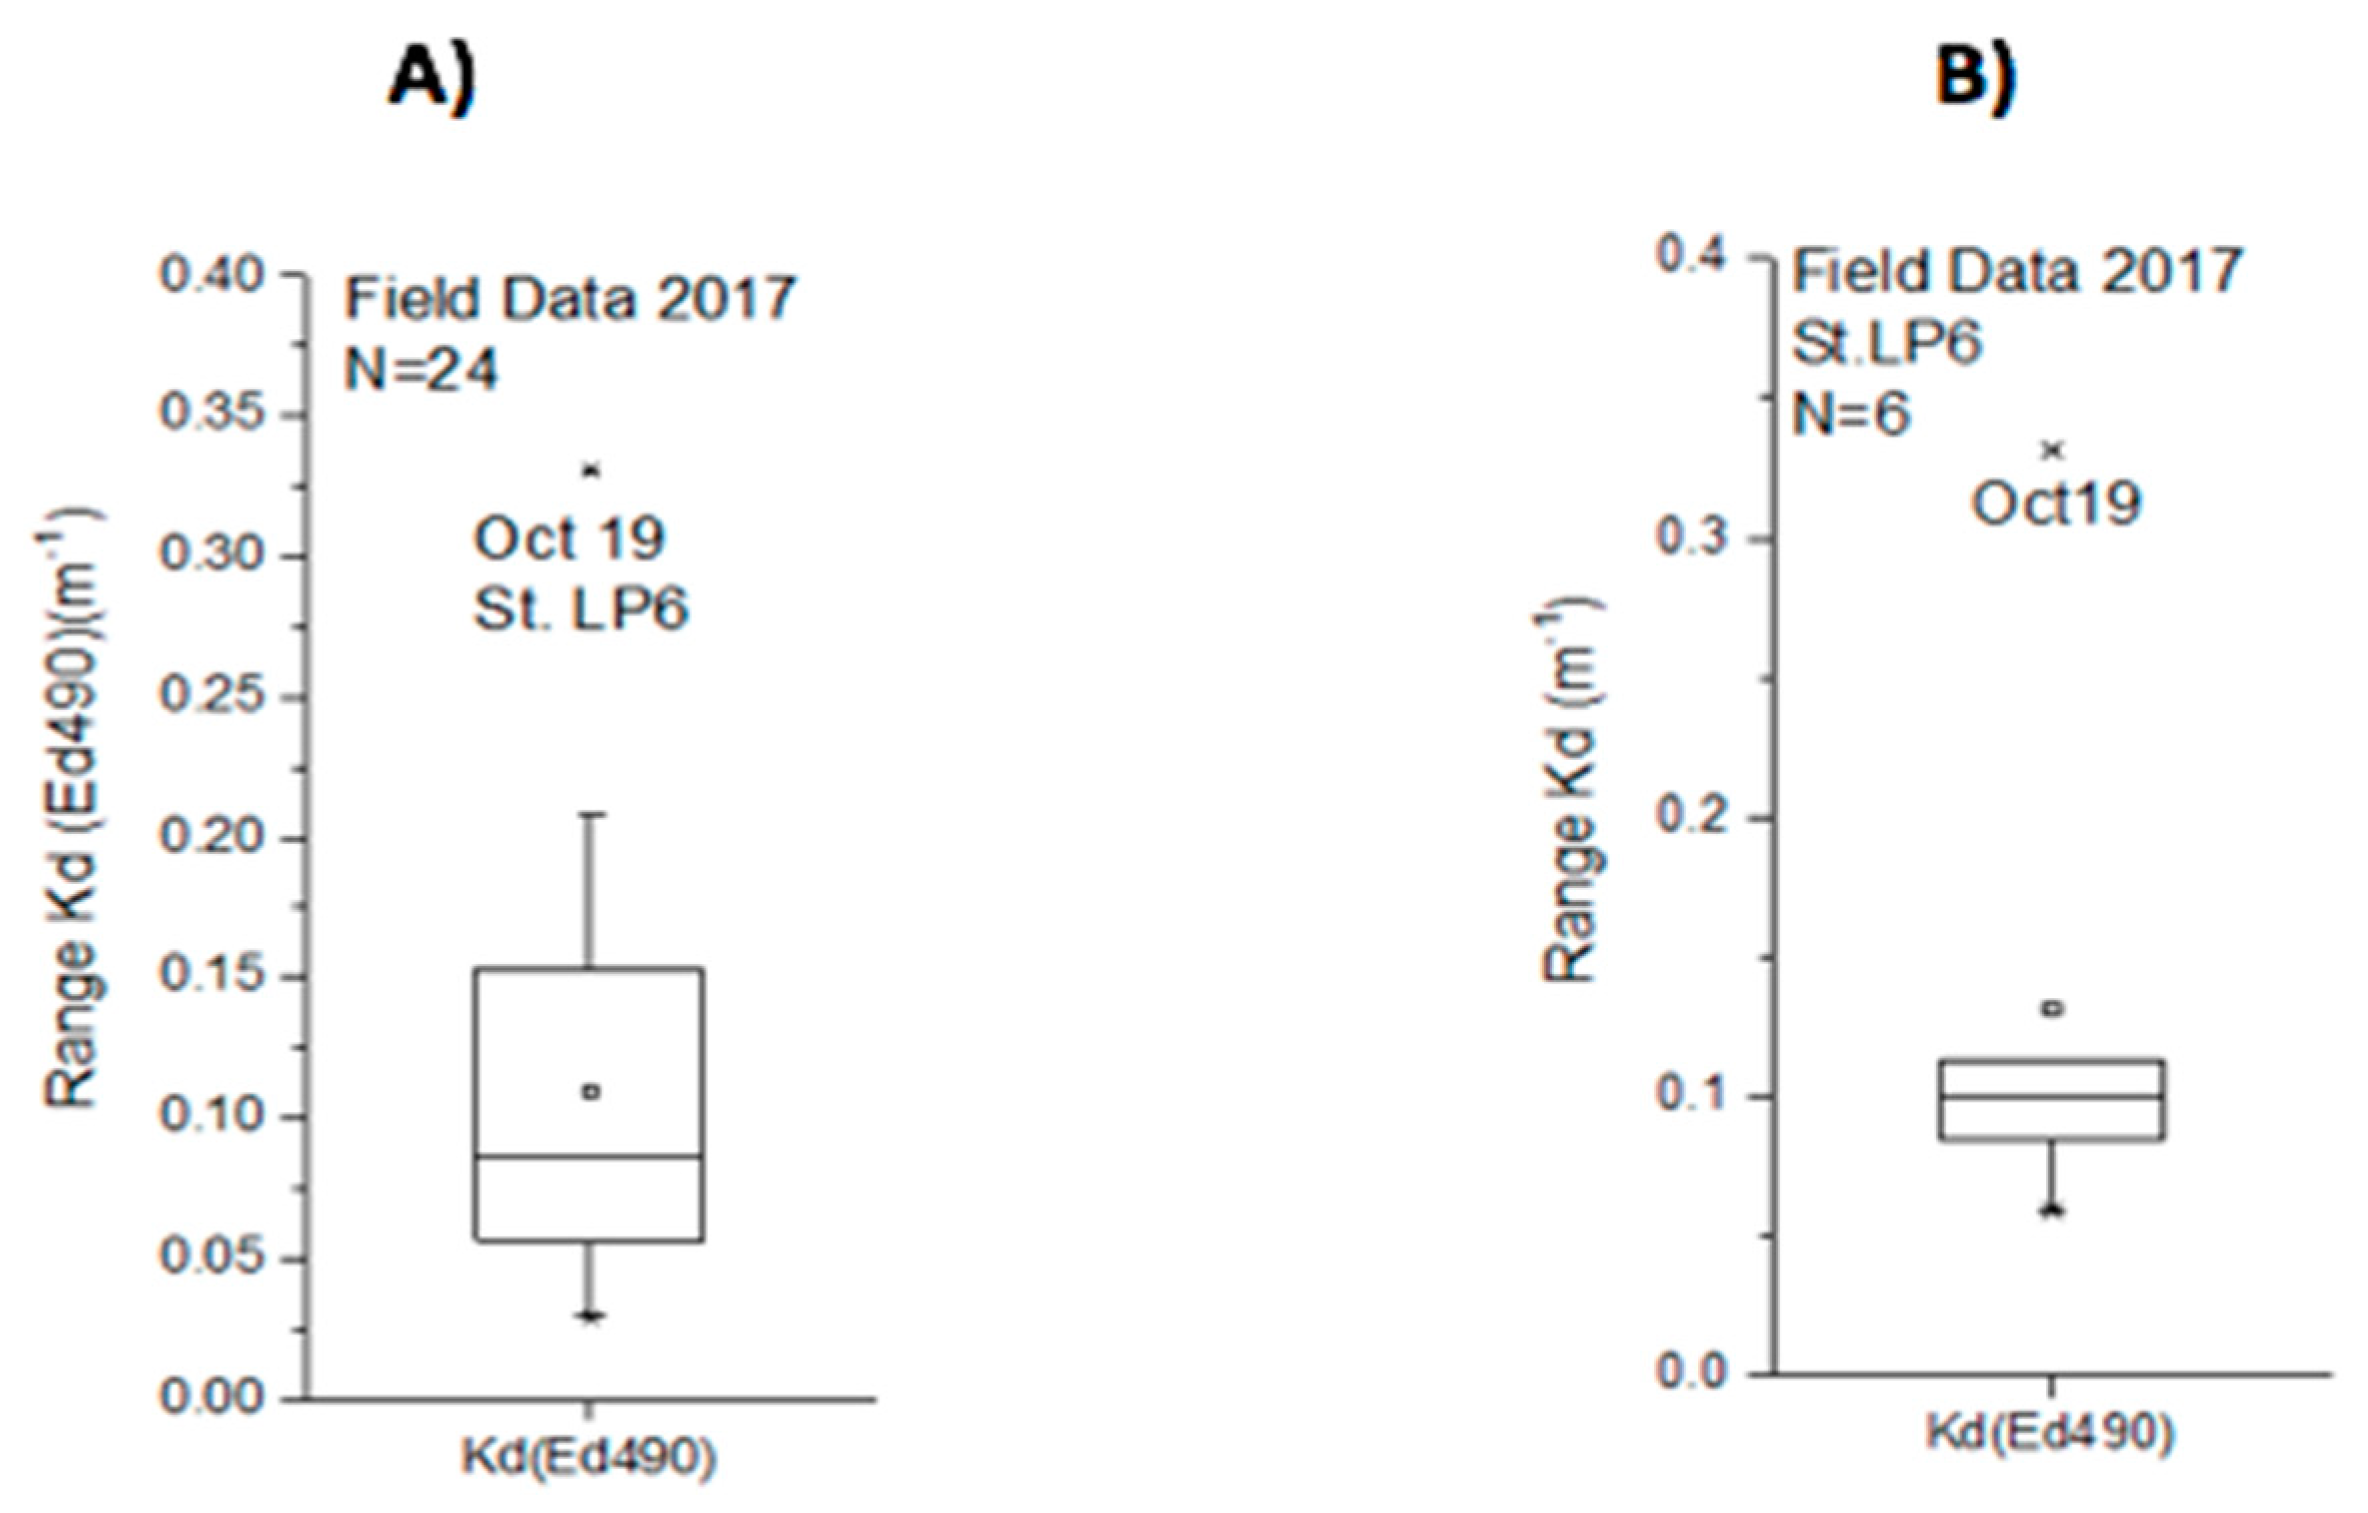
Values for diffuse attenuation coefficient (Kd490) share the ADG443_NN tendencies (Figure 5). Values for Kd490 extracted from S3A for station LP6 show a mean value of 0.22 m−1 (sd = 0.1, n = 19) from July to December. The minimum values were on 27 December 2017, and the maximum of 0.48 m−1 was detected on 7 October 2017, coincident with other parameters following the events. The stations closer to the shoreline LP6 and LP10 showed values above 0.14 m−1 in September and October 2017 (Figure 7). Kd490 median values from S3A varied from 0.15 to 0.34 m−1 for six months while the mean values ranged from 0.16 to 0.34 m−1 (Table 3). The highest mean value of 0.34 m−1 was observed in the period of Sep 11 to Oct 8; during that period, a maximum of 0.48 m−1 was detected. The maximum value of Kd490 derived from field data in 2017 was 0.33 m−1 on 19 October 2017, four weeks after the last hurricane (Figure 8A,B).
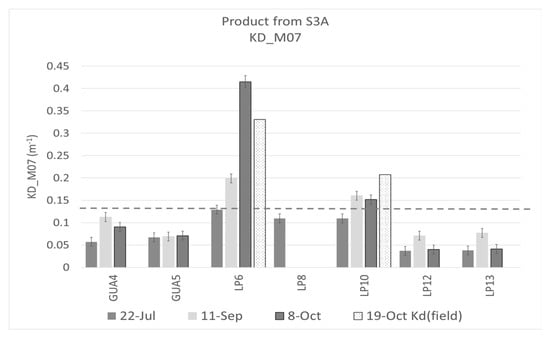
Figure 7.
Kd490 product from Sentinel 3A for 22 July, 11 September, and 8 October 2017. The figure includes the Kd490 nm field data on 19 October 2017 at LP6 sampling site. The dashed line represents the second standard deviation (2SD) for Kd490 field data.

Table 3.
Statistics for five time periods on Kd490 product from Sentinel 3A.
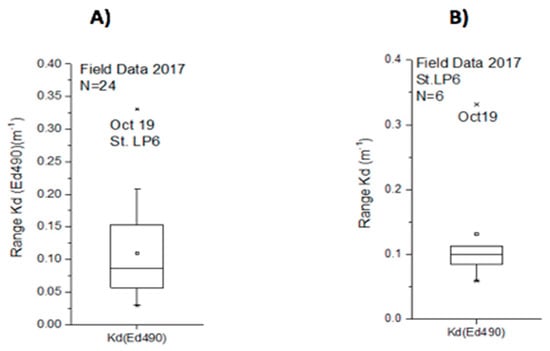
Figure 8.
Box plot for light attenuation coefficient (Kd490) at 490 nm field data, showing the value range, median line, mean, and the extreme values (A) for the year 2017 from GB to LPNR area and, (B) field data on station LP6 known as Turrumote II for 2017.
The attenuation coefficient showed a slight variation in outer shelf waters with a greater impact in inner shelf, specifically in LP6, alias Turrumote II (Figure 7). The cumulative effect of biogeochemical processes in production and degradation of organic matter is shown by this increment on October values. Kd490 values reach to the normal between October and November (Table 3).
The field data for 2017 (N = 21) show a high correlation between Kd490 and aCDOM443 absorption coefficients (rs = 0.79, p = 0.0003) and a lower but similar correlation between S3 OLCI products, (rs = 0.71, p = 0.0005). It cannot be interpreted as a sensor validation.
4. Discussion
Caribbean Sea water is mostly oligotrophic with a high light penetration in the water column, although it is seasonally influenced by the Orinoco and Amazon rivers from South America, seasonally [49,50,51]. Light penetration changes after hurricane events can affect seagrasses [11] and other light-dependent organisms like corals. Previous research shows that coral photo-physiology is altered by light availability [25,52]. García-Sais and collaborators (2017) studied Kd490 and Chl-a trends over individual coral reefs in Puerto Rico using L2 and L3 imagery from SeaWiFS and MODIS Aqua satellite data [10]. A recent publication based on VIIRS data described the tendencies of Kd490 and Chl-a parameters on water quality around PR using a value of 0.1 m−1 for Kd490 and 0.45 μg/L for Chl-a as a threshold value for coastal waters [20]. Despite the detrimental effects documented by several authors [26,53,54,55], an intermittent high turbidity over coral reefs can be photo-protective [10]. García-Sais and collaborators (2017) observed a negative correlation between Kd490 and the percent of coral cover which can be interpreted as a positive light shadow effect during sea surface temperature anomalies [10]. The severity of the damages can be highly influenced by the prevalence of adverse conditions during and after the events.
In 2017, the duration of the abnormal values (above 0.05 m−1) lasted four months as can be seen in Figure 5. Higher values are not necessarily coincident with the events but, rather these were detected two to three weeks later in October. The high number of landslides (>40,000) combined with runoff after hurricanes Irma and María over the Island were unprecedented [56] and washed sediments reached nearshore waters [19]. Miller (2019) documented elevated turbidity values nearshore until February 2018 related to inland hydrological disturbances caused by the hurricanes [19]. Gilbes and collaborators (2001) documented changes in Chl-a due to hurricane Georges up to two and a half weeks after the event [18]. Recently, Hernández and collaborators (2020) documented high Kd490 and Chl-a values from July to December 2017 all around Puerto Rico using VIIRS data; reporting Chl-a values above 0.45 µg/L in August and November 2017 [20]. These authors reported anomalous attenuation coefficient values for July 2017 (0.06 m−1) being persistently high until December. Chlorophyll-a is a parameter highly correlated with Kd490 on ocean color data [18,20]. It is important to highlight the oligotrophic water conditions on this study area, being influenced by Guánica Bay dynamics. The values considered in this area can be compared to coral reefs or benthic areas with low influence of rivers.
The aCDOM443 values above 0.05 m−1 are not typical for coral reef waters in Puerto Rico. CDOM values with means < 0.043 m−1 are the most common values over coral reefs and seagrass beds in the studied area. Otherwise, the values closer to 0.02 m−1 are found in offshore waters. An absorption coefficient higher than 0.1 m−1 is frequently found on coastal embayments like Guánica Bay or the Bioluminescent Bay surrounded by mangroves [57]. Anomalies like the ones measured in this study lasted for the entire study period.
In terms of attenuation coefficient (Kd490), values above 0.2 m−1 corresponded to coastal embayments while values from 0.1 to 0.2 were observed at shallow coral reef or seagrasses areas close to the coast (<1 mile) or closer to the coral cays [20]. The lower values (<0.1 m−1) were found at mid- and outer-shelf coral reef stations. A mean Kd490 value of 0.056 m−1 was documented (for 10 y data) in a coral reef site at Guánica by satellite data [10]. Their values are lower than the values reported here from July to December 2017 using OLCI data. A variant of Kd490 parameter, KdPAR, was measured in situ before and after hurricane events in St. John Island recording the lowest level of light in coral reef in the Caribbean after a hurricane event [58,59]. Certainly, these events had an unprecedent effect on light attenuation over sensitive benthic communities.
These data show the influence of ADG443_NN/aCDOM in light attenuation. However, in estuarine areas, a significant correlation between Kd490 and Chl-a was documented after a hurricane event [13,20]. The high anomalous values of ADG and Kd490 can be related to the unprecedented runoff produced by defoliation and landslides [19,56] followed by biogeochemical oceanographic processes over the coastal waters.
5. Conclusions
As expected from episodic events of this magnitude, significant water quality parameter changes occurred in southwestern Puerto Rico. Sentinel 3A OLCI data was used to extract information on ADG and Kd490 values. These data were compared with in situ data trends and correlated between them. The amount of data acquired during the study period (before N = 5, N = 16 after hurricanes) duplicates the quantity of data obtained from the field (N = 3 after the hurricane) in 2017. Although cloud cover in tropical islands can be high, remote sensing is an accessible and useful tool for short and long-term water quality studies.
Increasing values of satellite-derived water quality parameters were detected with S3 OLCI and field data in southwestern Puerto Rico. The anomalies were observed during the 9/11–10/8 period as expected and extended until December. The ADG values increased throughout all the coral reef zones. The estimated ADG mean in this zone was > 0.1 m−1 with a median of 0.05 m−1. The mean values of Kd490 increased from 0.16 m−1 before the hurricanes to 0.28 m−1 shortly after Hurricane Irma, and 0.34 m−1 in October 2017, a month after Hurricane María.
Satellite data are useful for water quality assessment in PR coastal waters with a judicious understanding of their uncertainties and limitations. On the other hand, we cannot conclude the performance of the sensor measurement on ADG443_NN or Kd490 products since we do not have enough in situ data from July to December 2017. Our results represent a pioneering effort in the establishment of tendencies for water quality studies in Puerto Rico. Usually, government agencies’ data are a single snapshot influencing the mean values that can be misinterpreted for the establishment of patterns on water quality. These gaps can be addressed with satellite data, as we showed throughout the manuscript. Remote sensing tools can help understand coastal and benthic habitat changes and biogeochemical processes in waters surrounding oceanic islands, especially after extreme weather events. Previous studies have mainly documented the importance of chlorophyll on light attenuation, but this study highlights the importance of detrital and gelbstoff matter on light attenuation coefficient. This is not only done as a historical perspective of the consequences of these events but as an analysis that could be integrated into future efforts aimed at describing the consequences of such events in benthic communities changes on the long run.
Author Contributions
S.O.-R. conducted and performed data processing and analysis; S.O.-R. and W.J.H. performed the experiments; S.M.W. contributed to data analysis; R.A.A. contributed to data collection; S.O.-R. wrote the manuscript, with all authors contributing to manuscript revisions; S.O.-R. and R.A.A. attracted funds for the project. All authors have read and agreed to the published version of the manuscript.
Funding
This study is supported and monitored by The National Oceanic and Atmospheric Administration—Cooperative Science Center for Earth System Sciences and Remote Sensing Technologies (NOAA-CESSRST) under the Cooperative Agreement Grant: NA16SEC4810008. The statements contained within the manuscript/research article are not the opinions of the funding agency or the U.S. government but reflect the author’s opinions.
Acknowledgments
The authors would like to thank Vice Admiral Conrad C. Lautenbacher Scholarship, The University of Puerto Rico and NOAA Office of Education, Educational Partnership Program with Minority-Serving Institutions (EPP/MSI) for full fellowship support for Suhey Ortiz-Rosa. S.O.R. thanks to Caribbean Coastal Ocean Observing System (CARICOOS) for lab equipment use; M. Solórzano, J. Corredor and J. Morell for comments and suggestions.
Conflicts of Interest
The authors declare no conflict of interest. The funders had no role in the design of the study; in the collection, analyses, or interpretation of data; in the writing of the manuscript, or in the decision to publish the results.
References
- Pasch, R.J.; Penny, A.B.; Berg, R. National Hurricane Center (NHC) Tropical Cyclone Report Hurricane María (AL152017) 2019. Available online: https://www.nhc.noaa.gov/data/tcr/AL152017_Maria.pdf (accessed on 2 October 2019).
- Ramos-Scharrón, C.E.; Arima, E. Hurricane María’s precipitation signature in Puerto Rico: A conceivable presage of rains to come. Sci. Rep. 2019, 9, 15612. [Google Scholar] [CrossRef] [PubMed]
- Cangialosi, J.P.; Latto, A.S.; Berg, R. National Hurricane Center (NHC) Tropical Cyclone Report Hurricane Irma (AL112017) 2018. Available online: https://www.nhc.noaa.gov/data/tcr/AL112017_Irma.pdf (accessed on 2 October 2019).
- Huang, W.; Mukherjee, D.; Chen, S. Assessment of Hurricane Ivan impact on chlorophyll-a in Pensacola Bay by MODIS 250 m remote sensing. Mar. Pollut. Bull. 2011, 62, 490–498. [Google Scholar] [CrossRef] [PubMed]
- Lohrenz, S.E.; Cai, W.J.; Chen, X.; Tuel, M. Satellite assessment of bio-optical properties of northern gulf of Mexico coastal waters following Hurricanes Katrina and Rita. Sensors (Basel Switzerland) 2008, 8, 4135–4150. [Google Scholar] [CrossRef] [PubMed]
- Werdell, P.; McKinna, L.; Boss, E.; Ackleson, S.; Craig, S.; Gregg, W.; Lee, Z.; Maritorena, S.; Roesler, C.; Rousseaux, C.; et al. An overview of approaches and challenges for retrieving marine inherent optical properties from ocean color remote sensing. Prog. Oceanogr. 2018, 160, 186–212. [Google Scholar] [CrossRef] [PubMed]
- Otero, E. Spatial and temporal patterns of water quality indicators in reef systems of southwestern Puerto Rico. Caribb. J. Sci. 2009, 45, 168–180. [Google Scholar] [CrossRef]
- Wild-Allen, K.; Skerratt, J.; Whitehead, J.; Rizwi, F.; Parslow, J. Mechanisms driving estuarine water quality: A 3D biogeochemical model for informed management. Estuar. Coast. Shelf Sci 2013, 135, 33–45. [Google Scholar] [CrossRef]
- Gilbes, F.; López, J.M.; Yoshioka, P.M. Spatial and temporal variations of phytoplankton chlorophyll a and suspended particulate matter in Mayagüez Bay, Puerto Rico. J. Plankton Res. 1996, 18, 29–43. [Google Scholar] [CrossRef]
- García-Sais, J.R.; Williams, S.M.; Amirrezvani, A. Mortality, recovery, and community shifts of scleractinian corals in Puerto Rico one decade after the 2005 regional bleaching event. PeerJ 2017, 5, e3611. [Google Scholar] [CrossRef]
- Wetz, M.S.; Yoskowitz, D.W. An ‘extreme’ future for estuaries? Effects of extreme climatic events on estuarine water quality and ecology. Mar. Pollut. Bull. 2013, 69, 7–18. [Google Scholar] [CrossRef]
- Shi, W.; Wang, M. Observations of a Hurricane Katrina-induced phytoplankton bloom in the Gulf of Mexico. Geophys. Res. Lett. 2007, 34, 11607. [Google Scholar] [CrossRef]
- Peierls, B.L.; Christian, R.R.; Paerl, H.W. Water quality and phytoplankton as indicators of hurricane impacts on a large estuarine ecosystem. Estuaries 2003, 26, 1329–1343. [Google Scholar] [CrossRef]
- D’Sa, E.J.; Joshi, I.; Liu, B. Galveston Bay and coastal ocean optical-geochemical response to Hurricane Harvey from VIIRS ocean color. Geophys. Res. Lett 2018, 45, 10579–10589. [Google Scholar] [CrossRef] [PubMed]
- Liu, B.; D’Sa, E.J.; Joshi, I.D. Floodwater impact on Galveston Bay phytoplankton taxonomy, pigment composition and photo-physiological state following Hurricane Harvey from field and ocean color (Sentinel-3A OLCI) observations. Biogeosciences 2019, 16, 1975–2001. [Google Scholar] [CrossRef]
- Wachnicka, A.; Browder, J.; Jackson, T.; Louda, W.; Kelble, C.; Abdelrahman, O.; Stabenau, E.; Avila, C. Hurricane Irma’s impact on water quality and phytoplankton communities in Biscayne Bay (Florida, USA). Estuaries Coasts 2020, 43, 1217–1234. [Google Scholar] [CrossRef]
- Schaeffer, B.A.; Myer, M.H. Resolvable estuaries for satellite derived water quality within the continental United States. Remote Sens. Lett. 2020, 11, 535–544. [Google Scholar] [CrossRef]
- Gilbes, F.; Armstrong, R.A.; Webb, R.M.; Müller-Karger, F.E. SeaWifs helps assess hurricane impact on phytoplankton in Caribbean Sea. EOS Trans. Am. Geophys. Union 2001, 82, 529–533. [Google Scholar] [CrossRef]
- Miller, P.W.; Kumar, A.; Mote, T.L.; Moraes, F.D.S.; Mishra, D.R. Persistent hydrological consequences of Hurricane María in Puerto Rico. Geophys. Res. Lett. 2019, 46, 1413–1422. [Google Scholar] [CrossRef]
- Hernández, W.J.; Ortiz-Rosa, S.; Armstrong, R.A.; Geiger, E.F.; Eakin, C.M.; Warner, R.A. Quantifying the effects of Hurricanes Irma and María on coastal water quality in Puerto Rico using moderate resolution satellite sensors. Remote Sens. 2020, 12, 964. [Google Scholar] [CrossRef]
- Eakin, C.M.; Morgan, J.A.; Heron, S.F.; Smith, T.B.; Liu, G.; Alvarez-Filip, L.; Baca, B.; Bartels, E.; Bastidas, C.; Bouchon, C.; et al. Caribbean corals in crisis: Record thermal stress, bleaching, and mortality in 2005. PLoS ONE 2010, 5, e13969. [Google Scholar] [CrossRef]
- Weil, E.; Croquer, A.; Urreiztieta, I. Temporal variability and impact of coral diseases and bleaching in La Parguera, Puerto Rico from 2003–2007. Caribb. J. Sci. 2009, 45, 221–246. [Google Scholar] [CrossRef]
- Pittman, S.J.; Hile, S.D.; Jeffrey, C.F.G.; Clark, R.; Woody, K.; Herlach, B.D.; Caldow, C.; Monaco, M.E.; Appeldoorn, R. Coral reef ecosystems of Reserva Natural La Parguera (Puerto Rico): Spatial and temporal patterns in fish and benthic communities (2001–2007). In NOAA Technical Memorandum NOS NCCOS 107; NOAA: Silver Spring, MD, USA, 2010; p. 202. [Google Scholar]
- Hedley, J.D.; Roelfsema, C.M.; Phinn, S.R.; Mumby, P.J. Environmental and sensor limitations in optical remote sensing of coral reefs: Implications for monitoring and sensor design. Remote Sens. 2012, 4, 271–302. [Google Scholar] [CrossRef]
- Cooper, T.; Fabricius, K.E. Coral-based indicators of changes in water quality on nearshore coral reefs of the Great Barrier Reef. In Unpublished Report to Marine and Tropical Sciences Research Facility; Reef and Rainforest Research Centre Limited: Cairns, Australia, 2007; p. 31. [Google Scholar]
- Rogers, C.S. Responses of coral reefs and reef organisms to sedimentation. Mar. Ecol. Prog. Ser. 1990, 62, 185–202. [Google Scholar] [CrossRef]
- Scheffer, M.; Carpenter, S.; Foley, J.A.; Folke, C.; Walker, B. Catastrophic shifts in ecosystems. Nature 2001, 413, 591–596. [Google Scholar] [CrossRef]
- Daniel, J. Chemical characterization and cycling of dissolved organic matter. In Biogeochemistry of Marine Dissolved Organic Matter, 2nd ed.; Dennis, A., Hansell, A., Carlson, C.A., Eds.; Academic Press: London, UK, 2015; Chapter 2; pp. 21–63. ISBN 9780124059405. [Google Scholar] [CrossRef]
- Slonecker, E.T.; Jones, D.K.; Pellerin, B.A. The new Landsat 8 potential for remote sensing of colored dissolved organic matter (CDOM). Mar. Pollut. Bull. 2016, 107, 518–527. [Google Scholar] [CrossRef]
- Wei, J.; Lee, Z.; Ondrusek, M.; Mannino, A.; Tzortziou, M.; Armstrong, R. Spectral slopes of the absorption coefficient of colored dissolved and detrital material inverted from UV-visible remote sensing reflectance. J. Geophys. Res. Oceans 2016, 121, 1953–1969. [Google Scholar] [CrossRef]
- Aurin, D.; Mannino, A.; Lary, D.J. Remote sensing of CDOM, CDOM spectral slope, and dissolved organic carbon in the global ocean. Appl. Sci. 2018, 8, 2687. [Google Scholar] [CrossRef]
- IOCCG Protocol Series. Inherent optical property measurements and protocols: Absorption coefficient. In IOCCG Ocean Optics and Biogeochemistry Protocols for Satellite Ocean Colour Sensor Validation; Neeley, A.R., Mannino, A., Eds.; IOCCG: Dartmouth, NS, Canada, 2018; Volume 1.0. [Google Scholar]
- Vodacek, A.; Blough, N.V.; DeGrandpre, M.D.; Peltzer, E.T.; Nelson, R.K. Seasonal variation of CDOM and DOC in the Middle Atlantic Bight: Terrestrial inputs and photooxidation. Limnol. Oceanog. 1997, 42, 674–686. [Google Scholar] [CrossRef]
- Zhang, Y.; Liu, M.; Qin, B.; Feng, S. Photochemical degradation of chromophoric-dissolved organic matter exposed to simulated UV-B and natural solar radiation. Hydrobiologia 2009, 627, 159–168. [Google Scholar] [CrossRef]
- Castillo, C.D.; Miller, R.L. On the use of ocean color remote sensing to measure the transport of dissolved organic carbon by the Mississippi River plume. Remote Sens. Environ. 2008, 112, 836–844. [Google Scholar] [CrossRef]
- Mannino, A.; Russ, M.E.; Hooker, S.B. Algorithm development and validation for satellite-derived distributions of DOC and CDOM in the U.S. Middle Atlantic Bight. J. Geophys. Res. 2008, 113, C07051. [Google Scholar] [CrossRef]
- D’Sa, E.J.; Miller, R.L. Bio-optical properties in waters influenced by the Mississippi River during low flow conditions. Remote Sens. Environ. 2003, 84, 538–549. [Google Scholar] [CrossRef]
- Kirk, J.T.O. Light and Photosynthesis in Aquatic Ecosystems; Cambridge University Press: Cambridge, UK, 2011. [Google Scholar]
- Bauer, L.J.; Edwards, K.; Roberson, K.K.W.; Kendall, M.S.; Tormey, S.; Battista, T.A. Shallow-Water Benthic Habitats of Southwest Puerto Rico; NOAA Technical Memorandum, NOAA NOS NCCOS 155: Silver Spring, MD, USA, 2012; p. 39. [Google Scholar]
- Bonekamp, H.; Montagner, F.; Santacesaria, V.; Nogueira, L.C.; Wannop, S.; Tomazic, I.; O’Carroll, A.; Kwiatkowska, E.; Scharroo, R.; Wilson, H. Core operational Sentinel-3 marine data product services as part of the Copernicus Space Component. Ocean Sci. 2016, 12, 787–795. [Google Scholar] [CrossRef]
- Morel, A.; Huot, Y.; Gentili, B.; Werdell, P.J.; Hooker, S.B.; Franz, B.A. Examining the consistency of products derived from various ocean color sensors in open ocean (Case 1) waters in the perspective of a multi-sensor approach. Remote Sens. Environ. 2007, 111, 69–88. [Google Scholar] [CrossRef]
- Doerffer, R.; Schiller, H. The MERIS Case 2 water algorithm. Int. J. Remote Sens. 2007, 28, 517–535. [Google Scholar] [CrossRef]
- Maritorena, S.; Siegel, D.A. Consistent merging of satellite ocean colour data sets using a bio-optical model. Remote Sens. Environ. 2005, 94, 429–440. [Google Scholar] [CrossRef]
- Maritorena, S.; D’Andon, O.H.F.; Mangin, A.; Siegel, D.A. Merged satellite ocean color data products using a bio-optical model: Characteristics, benefits and issues. Remote Sens. Environ. 2010, 114, 1791–1804. [Google Scholar] [CrossRef]
- Ciotti, A.M.; Bricaud, A. Retrievals of a size parameter for phytoplankton and spectral light absorption by colored detrital matter from water-leaving radiances at SeaWiFS channels in a continental shelf region off Brazil. Limnol. Oceanogr. Methods 2006, 4, 237–253. [Google Scholar] [CrossRef]
- Miller, R.L.; Belz, M.; Del Castillo, C.; Trzska, R. Determining CDOM absorption spectra in diverse coastal environments using a multiple pathlength, liquid core waveguide system. Cont. Shelf Res. 2002, 22, 1301–1310. [Google Scholar] [CrossRef]
- Ondrusek, M.E.; Stengel, E.; AmpoUo, M.; Goode, W.; Ladner, S.; Feinholz, M. Validation of ocean color sensors using a profiling hyperspectral radiometer. In Proceedings of the SPIE—The International Society for Optical Engineering, Baltimore, MD, USA, 23 May 2014; Volume 9111, p. 91110Y. [Google Scholar] [CrossRef]
- Austin, R.W.; Petzold, T.J. The determination of the diffuse attenuation coefficient of sea water using the coastal zone color scanner. In Oceanography from Space. Marine Science; Gower, J.F.R., Ed.; Springer: Boston, MA, USA, 1981; Volume 13. [Google Scholar] [CrossRef]
- Corredor, J.E.; Morell, J.M. Seasonal variation of physical and biogeochemical features in eastern Caribbean Surface water. J. Geophys. Res. 2001, 106, 4517–4525. [Google Scholar] [CrossRef]
- Gilbes, F.; Armstrong, R.A. Phytoplankton dynamics in the eastern Caribbean Sea as detected with space remote sensing. Int. J. Remote Sens. 2004, 25, 1449–1453. [Google Scholar] [CrossRef][Green Version]
- López, R.; López, J.M.; Morell, J.; Corredor, J.E.; Del Castillo, C.E. Influence of the Orinoco River on the primary production of eastern Caribbean surface waters. J. Geophys. Res. Oceans 2013, 118, 4617–4632. [Google Scholar] [CrossRef]
- Jones, R.; Giofre, N.; Luter, H.M.; Neoh, T.L.; Fisher, R.; Duckworth, A. Responses of corals to chronic turbidity. Sci. Rep. 2020, 10, 4762. [Google Scholar] [CrossRef] [PubMed]
- Ateweberhan, M.; Feary, D.A.; Keshavmurthy, S.; Chen, A.; Schleyer, M.H.; Sheppard, C.R. Climate change impacts on coral reefs: Synergies with local effects, possibilities for acclimation, and management implications. Mar. Pollut. Bull. 2013, 74, 526–539. [Google Scholar] [CrossRef]
- Bessell-Browne, P.; Negri, A.P.; Fisher, R.; Clode, P.L.; Duckworth, A.; Jones, R. Impacts of turbidity on corals: The relative importance of light limitation and suspended sediments. Mar. Pollut. Bull. 2017, 117, 161–170. [Google Scholar] [CrossRef] [PubMed]
- Fourney, F.; Figueiredo, J. Additive negative effects of anthropogenic sedimentation and warming on the survival of coral recruits. Sci. Rep. 2017, 7, 12380. [Google Scholar] [CrossRef]
- Bessette-Kirton, E.K.; Cerovski-Darriau, C.; Schulz, W.H.; Coe, J.A.; Kean, J.W.; Godt, J.W.; Thomas, M.A.; Hughes, K.S. Landslides triggered by Hurricane María: Assessment of an extreme event in Puerto Rico. GSA Today Geol. Soc. Am. 2019, 29, 4–10. [Google Scholar] [CrossRef]
- Ortiz-Rosa, S. Optical Properties and Photochemical Response of Colored Dissolved Organic Matter (CDOM) at Jobos Bay National Estuarine Research Reserve (JOBANERR), Puerto Rico. Master’s Thesis, Department of Marine Sciences, University of Puerto Rico, Mayagüez, Puerto Rico, 2010. [Google Scholar]
- Edmunds, P.J.; Tsounis, G.; Boulon, R.; Bramanti, L. Acute effects of back-to-back hurricanes on the underwater light regime of a coral reef. Short Article. Mar. Biol. 2019, 166, 20. [Google Scholar] [CrossRef]
- Edmunds, P.J.; Tsounis, G.; Boulon, R.; Bramanti, L. Long-term variation in light intensity on a coral reef. Coral Reefs 2018, 37, 955–965. [Google Scholar] [CrossRef]
Publisher’s Note: MDPI stays neutral with regard to jurisdictional claims in published maps and institutional affiliations. |
© 2020 by the authors. Licensee MDPI, Basel, Switzerland. This article is an open access article distributed under the terms and conditions of the Creative Commons Attribution (CC BY) license (http://creativecommons.org/licenses/by/4.0/).

