Article

Apple Tree Branch Information Extraction from Terrestrial Laser Scanning and Backpack-LiDAR

1
Key Laboratory of Quantitative Remote Sensing in Agriculture of Ministry of Agriculture, Beijing Research Center for Information Technology in Agriculture, Beijing 100097, China
2
College of Geomatics, Xi’an University of Science and Technology, Xi’an 710054, China
3
National Engineering Research Center for Information Technology in Agriculture, Beijing 100097, China
*
Author to whom correspondence should be addressed.
These authors contributed equally to the work.
Remote Sens. 2020, 12(21), 3592; https://doi.org/10.3390/rs12213592
Submission received: 14 September 2020 / Revised: 22 October 2020 / Accepted: 27 October 2020 / Published: 2 November 2020
(This article belongs to the Special Issue Remote Sensing and Decision Support for Precision Orchard Production)

Abstract

:
The branches of fruit trees provide support for the growth of leaves, buds, flowers, fruits, and other organs. The number and length of branches guarantee the normal growth, flowering, and fruiting of fruit trees and are thus important indicators of tree growth and yield. However, due to their low height and the high number of branches, the precise management of fruit trees lacks a theoretical basis and data support. In this paper, we introduce a method for extracting topological and structural information on fruit tree branches based on LiDAR (Light Detection and Ranging) point clouds and proved its feasibility for the study of fruit tree branches. The results show that based on Terrestrial Laser Scanning (TLS), the relative errors of branch length and number are 7.43% and 12% for first-order branches, and 16.75% and 9.67% for second-order branches. The accuracy of total branch information can reach 15.34% and 2.89%. We also evaluated the potential of backpack-LiDAR by comparing field measurements and quantitative structural models (QSMs) evaluations of 10 sample trees. This comparison shows that in addition to the first-order branch information, the information about other orders of branches is underestimated to varying degrees. The root means square error (RMSE) of the length and number of the first-order branches were 3.91 and 1.30 m, and the relative root means square error (NRMSE) was 14.62% and 11.96%, respectively. Our work represents the first automated classification of fruit tree branches, which can be used in support of precise fruit tree pruning, quantitative forecast of yield, evaluation of fruit tree growth, and the modern management of orchards.

Graphical Abstract

1. Introduction

Fruit tree branches support the growth of leaves, buds, flowers, fruits, and other organs. The appropriate number and length of branches are required to guarantee normal growth, flowering, and fruiting of fruit trees. Fruit tree branch information (branches topology, length, number, etc.) is an important indicator of tree growth and yield. Therefore, accurate extraction of fruit tree branch information is of great significance for orchard production.
Traditionally, tree branches are measured manually, which is slow, inaccurate, lacks a systematic description of branch configuration parameters, and can lead to tree damage. The application of LiDAR in forestry, especially backpack LiDAR and terrestrial laser scanning (TLS), which are high-precision three-dimensional laser point cloud active remote sensing platforms, provides an effective technical means for obtaining tree branch information. In recent years, there have been many studies on the acquisition of tree parameters based on three-dimensional laser point clouds, mainly focusing on single tree structures, single tree/population canopy parameters, and leaf distribution [1,2,3,4,5], but there has been little quantitative research on the extraction of tree branch information.
To extract tree branch information accurately from laser point cloud data, it is necessary to determine the branch topology and geometric structure of the tree, and carry out accurate modeling, so that branch information including the length and number of branches can be extracted. For tree topology reconstruction and branch information extraction, existing solutions can be divided into two categories: (i) point cloud segmentation and (ii) skeleton extraction. Based on the method of point cloud segmentation, the point cloud of a tree is divided into small clusters, and then these small clusters are programmatically connected to reconstruct the branch topology of the tree. Geometric elements such as cylinders and spheres are used to carry out three-dimensional reconstructions on the existing topological relations, and then tree structure parameters can be extracted, including branch length and number. Raumonen et al. [1] used the local method to segment the point cloud on the tree surface into small connected cover sets to identify the branches topology relationship, and use a cylinder to reconstruct the tree in three-dimensions, which can efficiently establish the topological relationship of tall trees and the acquisition of basic parameters. Yan et al. [6] extracted the topological structure of a tree based on the variational k-means clustering algorithm. Bucksch et al. [7] organized the input point cloud data according to the octree structure and reconstructed a tree based on the skeleton lines of trees generated from octree cells. Hackenberg et al. [8] developed a hierarchical cylindrical structure to describe the parent–child relationship between tree branches, which can effectively extract different tree components, such as branch topology, length, and number of branches. Unlike a point cloud segmentation, skeleton extraction directly obtains the skeleton lines from the original input point cloud, and then performs 3D reconstruction work. Scholars have carried out a lot of work in this area, such as the algorithm based on three-dimensional curve extraction proposed by Verroust et al. [9], the algorithm based on the distance minimum spanning tree (DMST) by Zhen et al. [10], the breadth-first search (BFS) method proposed by Li et al. [11], and the minimum spanning graph and optimization method proposed by Livny et al. [12]. To overcome the problems caused by point cloud quality, several approaches have been attempted, such as the central axis skeleton extraction [13], L1-median algorithm [14], generalized rotational symmetry axis (ROSA) [15], semi-automatic algorithm + prior knowledge [16], Dijkstra algorithm [17], among others. When studying the physical and chemical parameters of crops, skeleton extraction is still very important. For example, Wu et al. [18] successfully extracted the skeleton of corn through the Laplace algorithm.
In general, although some existing skeleton extraction methods do not require a high point cloud quality, most models only extract skeletons and do not make more in-depth research on tree parameter extraction. Quantitative structural models (QSM) is a typical method in point cloud segmentation and has great potential for obtaining tree structure parameters [2,19]. It can quantitatively describe the basic topology (branch structure), geometry, and volume properties of the tree. These attributes include the total number of branches and the branch order, the parent–child relationship and length of the branches, the volume and angle of a single branch, and the branch size distribution. Models such as SimpleTree [8], PypeTree [20], and TreeQSM [1] all belong to the category of QSM. Brede et al. [21] compared the potential of UAV-LiDAR (Unmanned Aerial Vehicle, UAV) and TLS using QSM for 3D reconstruction in forest volume estimation; TreeQSM has been used to estimate above-ground biomass (AGB) of different tree species [22]. QSM has also been used in tree species identification [23] and in forest radiation transmission simulation [5]. In addition, QSM also performed well in the extraction of structural parameters such as tree diameter at breast height [3] and crown width [4].
Among the three quantitative structural models (QSMs) mentioned above, PypeTree has high hardware requirements that are hard to meet in the field; SimpleTree is time-consuming and cannot obtain effective model results in a relatively short time; TreeQSM is mainly aimed at tall forest trees, but it is no application on fruit trees with thin, dense, and overlapping branches. Therefore, extracting branch information of fruit trees may require a higher-precision point cloud, which may make the use of TreeQSM a challenge. At the same time, the feasibility of using TreeQSM to extract branch information of fruit trees for different point cloud data such as TLS, backpack-LiDAR, and even UAV-LiDAR remains to be studied.
In this study, we adapted TreeQSM to extract branch information from Fuji apple trees. In our work, the QSM method is applied to the study of fruit tree structure for the first time, and the hierarchical automatic extraction of fruit tree branches is realized. The potential of Backpack-LiDAR data for accurate extraction of fruit tree branches was evaluated. It may be of great significance to the quantitative and accurate management of orchards in the future. The specific objectives were to: (i) clarify the feasibility of the TreeQSM model in extracting the topology, length, and quantity of branches for non-tall trees, that is, fruit trees with a tree height of 3–5 m; (ii) evaluate the influence of different carrying platforms (TLS and backpack-LiDAR) and different point cloud quality/point cloud density on the results of branch information extraction.

2. Materials and Methods

2.1. Study Area and Data Collection

Shandong′s climate is a warm temperate monsoon climate type with sufficient sunlight resources. It is one of the largest apple-producing areas in China. Our study site was at the BSD group Apple Base (BoShiDa, BSD, an agrochemical group), Guanli Town, Qixia City, Yantai City, Shandong Province, China (N37.186035° E120.701057°) (Figure 1A). Here, we selected a typical orchard of Fuji apple trees of 50 × 80 m, with an interval between individual fruit trees of about 3–5 m (Figure 1B). QSM is more sensitive to noise points, and a large number of leaf noise points appear in the data collected during the leaf-on period. Therefore, the data collection time for this study was the leaf-off period in December 2019. At this time, the leaves had completely fallen off and the fruit branches had not been pruned yet to avoid external factors causing errors in the experimental results. Data were acquired during windless and sunny weather to avoid noise caused by the shaking of branches during the collection process.
Experimental data were obtained with a backpack-LiDAR and TLS. We used the LiBackpack DG50 (STD 16E) (Figure 2A), with scanning accuracy of 5 cm, a maximum distance of laser scanning of 100 m, laser wavelength of 903 nm, scanning frequency of 600,000 pts/s, horizontal field of view of 0–360° and vertical field of view of −90–90°. In the process of data collection, a U-shaped path (Figure 1B) was used to avoid repeated data.
The TLS equipment model was the FARO Focuss 350 (version 2019.0.1.1653, FARO Technologies, Orlando, FL, USA) (Figure 2D), with a scanning distance of 4 m, scanning accuracy of 2 mm, resolution/quality 28.0 Mpts/3x, laser wavelength of 1550 nm, horizontal and vertical viewing angles of 0–360° and −60–90°, respectively, scan size of 8129 * 3413 Pt, point distance of 7.7 mm/10 m; the scan time per station was less than 2 min 54 s when collecting TLS point cloud data. Each tree was required to set up 4–6 stations; the data of each station were stitched to obtain an accurate single point cloud (Figure 2E).
We randomly selected ten fruit trees from the orchard and for each, we measured their branch information with a soft ruler (Table 1). At the same time, one tree randomly selected from 10 sample trees for TLS, is tree 6. (Figure 2F) (In situ measured branch information of tree 6 are shown-in Table 1). In the process of collecting information on the branches, we followed the criteria of grading collection, that is, we first determined the main trunk of the fruit tree, then identified the branches from the main trunk (first-order branches), and then the branches from the first-order branches (second-order branches), so on.

2.2. Point Cloud Data Processing Method

The grading processing of the branches classifies the branches according to the topological relationship between the reconstructed model and the real tree. The branches of the apple tree are characterized by many grades and serious crossover; the higher the grade, the thinner the branch diameter. When a LiDAR point cloud is used to extract the branch topology information of the branches, due to equipment accuracy and other reasons (such as serious crossover), the branches with high orders may not be well reconstructed. Therefore, in this study, we adopted the method of grading fruit tree branches. The grading of fruit tree branches has two main advantages: (i) to evaluate the applicability of TreeQSM for extracting information from low and complicated fruit branches; (ii) to evaluate the potential of extracting the grade of the branches from the backpack-LiDAR point cloud. In this study, due to the accuracy of the equipment and the characteristics of the fruit tree branches, the order of secondary branches was too high to be accurately reconstructed. Therefore, we evaluated the accuracy of the extraction of the first-order branches. If the first-order branches of the fruit tree were extracted with reliable accuracy, we assumed that it was feasible to use TreeQSM to extract the information of the fruit tree branch grades.
Point cloud filtering. The main purpose of this step is to filter outliers and noise out, because TreeQSM is highly sensitive to them. There are two choices for filtering: one is to use the filtering function in TreeQSM to input appropriate filtering parameters, and the other is to filter the noise with point cloud processing software, such as LiDAR360 (version v 4.1, GreenValley, BeiJing, China) or CloudCompare (Open Source Project, version v 2.6.1, www.cloudcompare.org).
Point cloud down-sampling. When the modeling process takes too long, perhaps due to a large amount of single tree point cloud data, or the accuracy of the required model does not need to be particularly high in actual operation, the point cloud can be down-sampled [24]. In this paper, we used the voxel method to down-sample the point cloud and the point cloud toolbox in MATLAB 2016a (Mathworks, Natick, Massachusetts, USA) to down-sample the TLS data. TLS data was down-sampled to 80%, 50%, 20%, 10%, 5%, 2.5%, and 1.25% to study the influence of different density point clouds on the prediction of apple fruit tree branches information extraction.

2.3. QSM and Optimization Method

2.3.1. TreeQSM

TreeQSM is based on point cloud segmentation. First, the point cloud of the tree was clustered, and the filtered point cloud was covered with cover sets matching the surface of the tree. The cover sets here refers to the patches connected to the surface of the tree. Next, the neighborhood relationship between each cluster was defined and the geometric characteristics between each cover set were characterized. The neighbor relationship was used to determine the connectivity attributes between each point cloud collection, and the geometric features were used to classify the point cloud of each branch and tree trunk. Next, the point clouds that do not belong to the tree, such as the ground point cloud, were deleted and each component (branch and its features) of the tree were defined to rebuild the tree. Then, the branches of the tree were split. Segmentation can be used to derive topological relations and information of the tree branches. In the segmentation process, the method of surface growth was used to identify bifurcations by checking the local connectivity. The next step was to approximate each segment as a cylinder with a different radius, length, and direction for reconstruction. To complete the cylinder model of the entire tree, the algorithm needs to find the gaps between the cylinders and fill them with additional cylinders. Finally, the statistics and other characteristics of the tree can be calculated based on the completed cylinder model.
There are five input parameters (PatchDiam1, PatchDiam2Min, PatchDiam2Max, Lcyl, and FilRad) in the TreeQSM algorithm, and the first three parameters define the size of set covers in the segmentation process, but the specific functions are different. PatchDiam1 is mainly used to filter noise points such as ground points, while the size of PatchDiam2Min and PatchDiam2Max determines the size of the fitting cylinder to a certain extent, especially at the bifurcation of the parent branch and the child branch; Lcyl defines the relative length of the fitting cylinder; FilRad represents the relative radius of isolated filtered points.

2.3.2. Sensitivity Analysis Method

This study evaluated the impact of the five input parameters in the TreeQSM algorithm on the extraction of the length and number of fruit tree branches and performed a sensitivity analysis on them.
Sensitivity analysis plays an important role in model development, calibration, uncertainty analysis, scenario analysis, and decision-making [25]. Sensitivity analysis can generally be divided into local and global. Local sensitivity analysis focuses on analyzing the influence of input factors on the local model and belongs to the one-factor-at-a-time (OAT) methods. That is, a single input parameter is usually changed, and other parameter inputs remain unchanged. This method requires a small number of calculations, but it is not suitable for nonlinear models. The global sensitivity analysis is mostly based on the Monte Carlo method. Global sensitivity analysis can be further subdivided into variance-based methods, such as the Sobol method [26] and the Fourier amplitude sensitivity test method (FAST) [27]; screening such as the Morris method [28]; regression-based, such as stepwise regression analysis [29] and response surface method.
The Sobol method is a global sensitivity analysis method based on variance. When analyzing the sensitivity of model results and input parameters, the interaction between parameters and model results is considered. Therefore, the first-order sensitivity index or total sensitivity index of the parameters obtained by the Sobol method can be used as a criterion for evaluating the influence of the parameter on the model output. In this paper, the Sobol method was used to evaluate the five input parameters of TreeQSM and the output branch information (length and number) was realized with the Simlab (https://ec.europa.eu/jrc/en/samo/simlab) software.

2.3.3. Parameter Optimization

Choosing the best or good parameters in the actual meaningful range depends more on the number of parameter inputs. To optimize the five input parameters, the following principles were adopted:
  • We defined a series of values for each input parameter, from which a set of optimal input parameters can be filtered for the following use:
    • PatchDiam1: take any fixed value between 5–15 cm;
    • PatchDiam2Min: within the range of 5–5 cm, take the value in 5 mm increments;
    • PatchDiam2Max: within the range of 3–5 cm, take the value in 1 cm increments;
    • Lcyl: 1, 2, 3, 4, 5, 6;
    • FilRad: Take 2.5 or 3.5.
Each group of different parameters was constructed 50 times. For the same parameter input combination, the seed points selected by the cover sets may be different during each modeling run, resulting in different model outputs.
We calculated the diameter of the trunk of the fruit tree or a certain segment of the trunk, performed the least square fitting according to the point cloud, and compared it with the estimated diameter of the cylinder that was reconstructed and fitted by TreeQSM at the corresponding position [30], and took this as one of the selection principles for the optimal parameter [5,31]:
d d i f f   =   min ( c l o u d d , m o d e l d ) max ( c l o u d d , m o d e l d ) ,
d d i f f < d d i f f m a x 0.95 .
2.
The sensitivity of five input parameters to branch information (length/number) was analyzed, and the sensitivity parameters for branch information extraction were determined.
3.
Regarding the values of the optimal parameters that have been screened out in step 1, combined with the parameters that are sensitive to branch information determined in step 2, we took the parameters that were not sensitive to branch information as fixed values, that is, the optimal value of the corresponding parameter selected in step 1. Then, we determined a larger value range and a smaller step size for the sensitive parameters, and further optimized them to determine the values of the sensitive parameters more in line with the fruit trees in this study.

2.4. Accuracy Evaluation Method

In this paper, the relative root means square error ( N R M S E ) and relative error δ were used as the main criteria for accuracy evaluation:
R M S E   =   1 n i   =   1 n ( x i f i ) 2 ,
N R M S E   =   R M S E x ¯ × 100 % ,
δ   =   | x i f i | x i ,
where x i is the measured value of the branch length/number of the i t h sample, x ¯ is the average of the measured branch length/number of each tree, and f i is the value of the branch length/number of the i t h tree calculated by the model using point cloud, and n is the number of the fruit trees in this study.

3. Results

3.1. Sensitivity Analysis of Parameters

The parameter sensitivity analysis of the Sobol method involves the estimation of mathematical expectations and the calculation of variance, which requires numerous model operations. The larger the basic sample of input parameters, the more obvious the sensitivity index. The five basic input parameters of the TreeQSM model were sampled within a meaningful value range (Figure 3) (variables PatchDiam1, PatchDiam2Min, PatchDiam2Max are abbreviated as PD1, PD2Min, PD2Max, the same below) to calculate the sensitivity of each parameter to branch information (length/number) under different samples. In this paper, when the sensitivity index of a parameter is greater than 0.5, that is to say, compared with the other four parameters, the contribution of PD2Min to the result is much greater than others. We expected that the parameter was sensitive to the output of the model. In addition, our sensitivity analysis was also carried out on the first-order branches of the fruit trees. When a certain parameter was sensitive to the extraction of first-order branch information, we assumed it was sensitive to the extraction of all branch information.
The first-order sensitivity and total sensitivity of each parameter to the length and number of fruit branches are shown in Figure 3; for branches length, the sensitivity of PD2Min was greater than 0.5 [32], which is the most sensitive to branch length; the other parameters were not sensitive to it (Figure 4A). The number of branches has the same sensitive parameters as the length of branches (Figure 4B). It shows that parameter PD2Min is the most sensitive to branch information. Our analysis is consistent with that described in [24], in which PatchDiam2Max, PatchDiam2Min, and Lcyl are the most meaningful parameters for the model, while PatchDiam1 and FilRad have little effect on the final model.
To eliminate the influence of parameter samples on the final sensitivity analysis, three different samples of 192, 384, and 768 were taken as controls (Figure 3). As the sample grows, the parameter PD2Min was still the most sensitive to the output result. But the larger the sample size, the higher the credibility of the sensitivity index.

3.2. The Feasibility of QSM for Applying to Apple Trees Based on TLS

Based on the TLS point cloud of tree 6, we evaluated the feasibility of the TreeQSM algorithm for extracting the information (length/number) of the fruit tree branches. Since the branches of fruit trees are more complicated than some forest tree species such as pine tree and cedar or crops such as corn, except for the first-order branches, their branches are severely intersected and have a thin radius, so they are prone to errors in the modeling process. In our study, although we have evaluated the accuracy of each order of branch reconstruction, considering the characteristics of the model reconstruction process and the lack of point clouds obtained from the fine-order branches, we assumed that when the information extraction of the first-order branches was reliable, it was feasible to use TreeQSM to extract information from the branches of low fruit trees.

3.2.1. Uncertainty Analysis of Parameter Based on TLS Data

Due to the randomness of the algorithm, there may be slight differences in the results of each model run, so we modeled the point cloud 50 times, and then averaged the corresponding branch information (retaining two decimal places) as the final result (Table 2). In addition, the model may extract the information of some branches whose orders were higher than the fourth-order branch. This information did not actually exist, so the information of these branches is not calculated and counted. When the parameter PD2Min was set to different values, the 3D model generated by TreeQSM is shown in Figure 5. We calculated the relative error of the first-order branch length when parameter PD2Min was set to different values. If the relative error reached the minimum, we assumed that parameter PD2Min had the optimal value.
As the value of PD2Min changed, the length of the first-order branches also changed. When PD2Min = 0.6 cm, the relative error took the minimum value, which was the optimal parameter value (Figure 5). On the other hand, we also visually inspected the reconstructed model. When PD2Min = 0.6 cm, the 3D model that is most consistent with the real tree was reconstructed (Figure 5B); when PD2Min was too small, the branches of the fruit tree were likely to be over-reconstructed, and some branches that were not part of the real tree were included (Figure 6C); if PD2Min was too large, many branch details were likely to be ignored (Figure 6D).

3.2.2. Accuracy Evaluation and Application to Apple Trees

The relative errors of the length and quantity of the first-order branches were 7.43% and 12.00%, respectively (Table 2). According to our settings, the extraction accuracy of the first-order branches’ information was reliable. Therefore, based on the TLS point cloud, the TreeQSM algorithm was able to extract the information on fruit tree branches. In addition, we calculated the accuracy of the second-order, third-order, and fourth-order branches lengths and the extraction accuracy of the total branch length and number (here, total (branch information) = First-Order + Second-Order + Third-Order + Fourth-Order). As the order of branches increased, the precision of branch length decreased, namely First-Order > Second-Order > Third-Order > Fourth-Order; the precision of the number of branches was Second-Order > First-Order > Third-Order > Fourth-Order; the relative errors of the second-order length/number and third-order length/number were 16.75%, 9.67% and 35.84%, 23.81%, respectively. The relative errors of total branches’ length/number were 15.34% and 2.89%.
Through the evaluation of the classification information of the fruit tree branches and the total branch information, the first-order and second-order branches information was extracted accurately, and their relative error was generally less than 15%, while for third-order and fourth-order branches the extraction accuracy was poor due to the sharp decrease in their radius and their sharp increase in number, as well as due to the scanning accuracy limitations of the equipment. Overall, the performance of TreeQSM was acceptable and accurately identified first-order, second-order, and total branch information.

3.3. Branch Information Extraction Based on Backpack-LiDAR

3.3.1. Uncertainty Analysis of Parameters Based on Backpack-LiDAR Data

We evaluated the root means square error (RMSE) and relative root means square error (NRMSE) of the first-order branch length for ten sampled trees, and determined the value of PD2Min that was most suitable for the backpack-LiDAR to extract information about fruit branches.
Compared with in situ measured branch information (Table 1), the first-order branch length error (RMSE/NRMSE) estimated by TreeQSM decreased with the decrease of PD2Min (Figure 7), until PD2Min decreased to 1.2 cm, RMSE reached the minimum; then, as PD2Min continued to decrease, the error increased again. Before our study, some scholars [22,33] calculated the AGB through TreeQSM and analyzed the uncertainty law of this parameter. In this study, we obtained the same parameter uncertainty law as previous studies by using the length of the fruit branches. Therefore, PD2Min = 1.2 cm was considered to be the best value and may be used for further modeling and analysis.

3.3.2. Accuracy Evaluation and Potential Analysis of Backpack-LiDAR Data for Apple Trees

By modeling the backpack-LiDAR point cloud data of ten randomly selected trees and extracting hierarchical branch information, we evaluated the potential for information extraction of hierarchical branches by using the TreeQSM algorithm based on the backpack-LiDAR platform for 3–5 m high apple trees. Similarly, after we obtained the best input parameters of TreeQSM for backpack-LiDAR, we used these parameters to model each tree 50 times and averaged the branch information of each order and the total branch information.
Figure 8 shows the relationship between the information of each graded branch extracted by the model and the in situ measured value. Through the comparison between the QSM value and the measured value, there is an obvious correlation between the length and number of first-order branches; the correlation between length and number of second-order and fourth-order branches is not as good as that of first-order branches, while that third-order and total branches are obviously underestimated.
The first-order branch length had R2 = 0.397, RMSE = 3.43 m, NRMSE = 14.62% (Figure 9A), while the linear relationship between the remaining graded length and the total branch length and the measured value was not significant, and their RMSE and NRMSE could not be evaluated. Similarly, for the number of branches, only the number of first-order branches has a certain linear relationship with the measured value, with R2 = 0.4351, RMSE = 1.30, NRMSE = 11.96% (Figure 9B), and there was almost no correlation between the number of other orders branches and the total number of branches.
In other words, the use of TreeQSM to extract fruit tree branch information has certain quality requirements for the point cloud used. The main trunk of the fruit tree is easy to identify, and a relatively complete first-order branch point cloud of the fruit tree can be obtained with the backpack-LiDAR; this means that the first-order branch can be reconstructed more completely, and the relative RMSE of the extracted branch information reaches 14.62% and 11.96%, which provides a reference value for evaluating the growth of apple trees and predicting their yield. The point cloud information of other branches obtained by the backpack-LiDAR cannot be used in the TreeQSM algorithm, so it is not feasible to extract the total branch information of each tree.

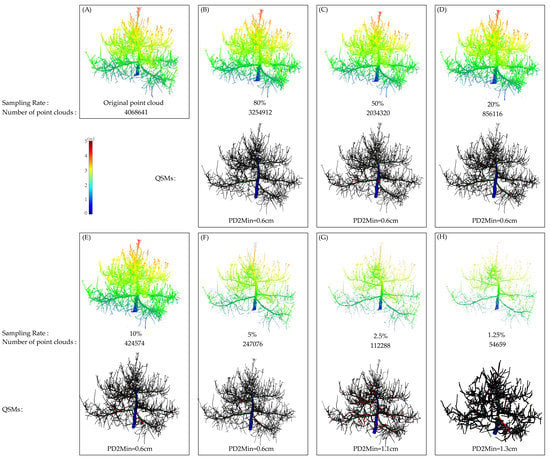
3.4. The Influence of Different Point Cloud Densities on Branch Extraction by QSM Based on TLS

Based on TLS, we have evaluated the feasibility of the TreeQSM algorithm for grading and extracting the information of apple branches, indicating that TLS can be used for extracting first-order, second-order, and total branches of apple trees. In this section, on this basis, we further explored the influence of different point cloud densities based on the extraction of apple tree branch information.
We down-sampled the TLS point cloud to 80%, 50%, 20%, 10%, 5%, 2.5%, and 1.25% of the number of points, and extracted their respective branch information from QSMs (Figure 10 and Table 3). When the sampling rate was 80%, 50%, 20%, 10%, and 5%, we obtained good accuracy in the branch extraction of fruit trees by adjusting parameter PD2Min to the best through the parameter optimization program, and both are 0.6 cm. The relative error of the length of their first, second, and third-order branches were about 10%, 20%, and 30%; the relative errors of the number of their first, second, and third-order branches were about 10%, 10%, and 20%. The total information is about 10%.
As the density of the point cloud decreased, the accuracy of branch information extraction also decreased, especially for first-order, second-order, and total branches (Figure 11). In the first-order branches and total branches information that this article focused on, the accuracy was still good when the sampling rate was 2.5%: the length and number of first-order branches were 9.66% and 17.86%, respectively; the relative accuracy of total branch length and number were 24.44% and 18.55%, respectively. But when the resampling rate was further reduced to 1.25%, the relative accuracy of the branches was unreliable (Figure 11).
Furthermore, with the reduction of the sampling rate, the greater the loss in the point cloud information was for the branches with the thinner radius, which leads to the QSMs not conforming to the real tree structure (Figure 10G,H). After modeling point clouds with different sampling rates, we found that a resampling rate of 5% can lead to the structure very close to the real tree yet (Figure 10F). If the point cloud is too large, the computational efficiency is reduced. Therefore, it is necessary to extract a large amount of branch information from fruit trees, and when the accuracy requirements are not strict, the point cloud can be appropriately down-sampled to improve work efficiency.

4. Discussion

4.1. The Necessity of Downsampling High-Density Point Clouds

We down-sampled the point cloud data of an apple tree in TLS. Through the modeling and accuracy analysis of different density point clouds, we can get some interesting conclusions. When using TLS to obtain data, a high-density point cloud can be obtained, especially at the bottom of a tree trunk where there is no branching or obstruction. However, with the increase of the point cloud density, the accuracy of the branch information extracted by QSMs can only be improved to a limit. The results are almost unchanged for the first-order, second-order, third-order, and the total branch information when the point cloud density is 5% higher than the original point cloud (Figure 11). Therefore, the increase in point cloud density cannot effectively improve the results, but only takes up more computing resources.

4.2. The Challenge of Extracting Fruit Tree Branch Information Using QSM

QSM was originally used to extract the structural information of tall trees, but here we applied it to fruit trees, with low height and more complex canopy structure, which introduces challenges in the choice of equipment, model availability, and control of external factors. First, there are great differences in the accuracy of LiDAR point cloud acquisitions based on different platforms. For example, the highest accuracy of the TLS used in this paper is 2 mm, which provides an advantage in obtaining complex and fine branches of fruit trees, while backpack-LiDAR can only obtain point cloud data of fruit tree trunks and first-class branches with a large diameter. Second, the initial seed points selected in TreeQSM reconstruction are random, and in the quantitative structure reconstruction, the segmentation error and geometric structure error caused by the cylinder and the real branch or leaf shape lead to additional deviations of the results [22]. Third, during data collection, due to unpredictable weather conditions such as wind, there may be a large number of noise points (especially in a large number of fine secondary branches in the crown), resulting in errors in the process of reconstruction.
QSM is often used to study the extraction of AGB or the angle and radius of first-order branches of trees for the automatic identification of tree species [23] and few studies on the relatively simple diameter at breast height of trees [34]. However, there are few studies on the fine structure of fruit trees and a few applications in agriculture. In our study, we used QSM to extract first-order, second-order, third-order, fourth-order, and total branch structure information of apple trees, indicating that QSM shows great potential in the extraction of fine branch information of fruit trees. Because the branch grade information of fruit trees is closely related to yield and growth, the work done in this paper can be of great help to modern orchard management, such as accurate prediction of orchard yield and automatic identification of fruit tree growth.

5. Conclusions

In this paper, the hierarchical branch information of Fuji apple trees with low height and complex branch distribution was studied for the first time based on lidar data, and a method of hierarchical extraction of branch information of fruit trees was introduced. We evaluated the feasibility of applying the TreeQSM algorithm to fruit tree branch extraction based on TLS data. The relative errors of the length and number of the first-order branches were 7.43% and 12%, respectively, the relative errors of the length and number of the second-order branches were 15.75% and 9.66%, and the accuracy of the total branch information reached 15.34% and 2.89%, indicating that the TreeQSM algorithm is acceptable for the extraction of apple trees branch information, and can obtain extremely high extraction accuracy with sufficiently accurate point clouds. We also analyzed the potential of the algorithm based on backpack-LiDAR by comparing in situ measured branch information of ten sample trees with QSMs estimates. This comparison showed that the information of other orders of branches was underestimated to varying degrees, except for the first-order branches, for which the RMSE of the length and number was 3.91 and 1.30 m, and the NRMSE was 14.62% and 11.96%, indicating that backpack-LiDAR has great potential for extracting the first-order branch information of fruit trees. Through the research of this paper, the length and number of fruit branches was accurately extracted from QSM, which may be helpful to the modern management of the orchard. In the future, we will forecast the output of fruit trees based on the branch length and number of fruit trees.

Author Contributions

Conceptualization, H.Y. and G.Y.; Data curation, C.Z., B.X., Y.Z., L.L., R.C. and Z.D.; Investigation, C.Z.; Supervision, Y.J., X.L., H.Y. and G.Y.; Visualization, C.Z.; Writing–original draft, C.Z.; Writing–review & editing, H.Y., G.Y. and C.Z. All authors have read and agreed to the published version of the manuscript.

Funding

This study was supported by the National Key Research and Development Program of China (2017YFE0122500 and 2016YFD0700303) and the Beijing Natural Science Foundation (6182011).

Conflicts of Interest

The authors declare no conflict of interest.

References

  1. Raumonen, P.; Kaasalainen, M.; Åkerblom, M.; Kaasalainen, S.; Kaartinen, H.; Vastaranta, M.; Holopainen, M.; Disney, M.; Lewis, P. Fast Automatic Precision Tree Models from Terrestrial Laser Scanner Data. Remote Sens. 2013, 5, 491–520. [Google Scholar] [CrossRef] [Green Version]
  2. Ye, N.; van Leeuwen, L.; Nyktas, P. Analysing the potential of UAV point cloud as input in quantitative structure modelling for assessment of woody biomass of single trees. Int. J. Appl. Earth Obs. Geoinf. 2019, 81, 47–57. [Google Scholar] [CrossRef]
  3. Dassot, M.; Fournier, M.; Deleuze, C. Assessing the scaling of the tree branch diameters frequency distribution with terrestrial laser scanning: Methodological framework and issues. Ann. For. Sci. 2019, 76, 66. [Google Scholar] [CrossRef]
  4. Fang, R.; Strimbu, B.M. Comparison of Mature Douglas-Firs’ Crown Structures Developed with Two Quantitative Structural Models Using TLS Point Clouds for Neighboring Trees in a Natural Regime Stand. Remote Sens. 2019, 11, 1661. [Google Scholar] [CrossRef] [Green Version]
  5. Calders, K.; Origo, N.; Burt, A.; Disney, M.; Nightingale, J.; Raumonen, P.; Åkerblom, M.; Malhi, Y.; Lewis, P. Realistic Forest Stand Reconstruction from Terrestrial LiDAR for Radiative Transfer Modelling. Remote Sens. 2018, 10, 933. [Google Scholar] [CrossRef] [Green Version]
  6. Yan, D.-M.; Wintz, J.; Mourrain, B.; Wang, W.; Boudon, F.; Godin, C. Efficient and robust reconstruction of botanical branching structure from laser scanned points. In Proceedings of the 2009 11th IEEE International Conference on Computer-Aided Design and Computer Graphics, Huangshan, China, 19–21 August 2009; pp. 572–575. [Google Scholar] [CrossRef] [Green Version]
  7. Bucksch, A.; Lindenbergh, R.; Menenti, M. SkelTre. Vis. Comput. 2010, 26, 1283–1300. [Google Scholar] [CrossRef] [Green Version]
  8. Hackenberg, J.; Spiecker, H.; Calders, K.; Disney, M.; Raumonen, P. SimpleTree—An Efficient Open Source Tool to Build Tree Models from TLS Clouds. Forests 2015, 6, 4245–4294. [Google Scholar] [CrossRef]
  9. Verroust, A.; Lazarus, F. Extracting skeletal curves from 3D scattered data. In Proceedings of the Shape Modeling International ’99. International Conference on Shape Modeling and Applications, Aizu-Wakamatsu, Japan, 1–4 March 1999; pp. 194–201. [Google Scholar]
  10. Zhen, W.; Liqiang, Z.; Tian, F.; Mathiopoulos, P.T.; Huamin, Q.; Dong, C.; Yuebin, W. A Structure-Aware Global Optimization Method for Reconstructing 3-D Tree Models from Terrestrial Laser Scanning Data. IEEE Trans. Geosci. Remote Sens. 2014, 52, 5653–5669. [Google Scholar] [CrossRef]
  11. Li, R.; Bu, G.; Wang, P. An Automatic Tree Skeleton Extracting Method Based on Point Cloud of Terrestrial Laser Scanner. Int. J. Opt. 2017, 2017, 5408503. [Google Scholar] [CrossRef] [Green Version]
  12. Livny, Y.; Yan, F.; Olson, M.; Chen, B.; Zhang, H.; El-Sana, J. Automatic reconstruction of tree skeletal structures from point clouds. In Proceedings of the ACM SIGGRAPH Asia 2010 papers on—SIGGRAPH ASIA ‘10, Seoul, Korea, 15–18 December 2010. [Google Scholar]
  13. Dey, T.K.; Sun, J. Defining and Computing Curve-skeletons with Medial. In Proceedings of the Symposium on Geometry Processing, Sardinia, Italy, 26–28 June 2006. [Google Scholar] [CrossRef]
  14. Huang, H.; Wu, S.; Cohen-Or, D.; Gong, M.; Zhang, H.; Li, G.; Chen, B. L1-Medial Skeleton of Point Cloud. ACM Trans. Graph. 2013. [Google Scholar] [CrossRef] [Green Version]
  15. Tagliasacchi, A.; Zhang, H.; Cohen-Or, D. Curve skeleton extraction from incomplete point cloud. ACM Trans. Graph. 2009, 28, 1–9. [Google Scholar] [CrossRef] [Green Version]
  16. Xu, H.; Gossett, N.; Chen, B. Knowledge and Heuristic Based Modeling of Laser-Scanned Trees. ACM Trans. Graph. 2007, 26, 19. [Google Scholar] [CrossRef]
  17. Du, S.; Lindenbergh, R.; Ledoux, H.; Stoter, J.; Nan, L. AdTree: Accurate, Detailed, and Automatic Modelling of Laser-Scanned Trees. Remote Sens. 2019, 11, 2074. [Google Scholar] [CrossRef] [Green Version]
  18. Wu, S.; Wen, W.; Xiao, B.; Guo, X.; Du, J.; Wang, C.; Wang, Y. An Accurate Skeleton Extraction Approach From 3D Point Clouds of Maize Plants. Front. Plant Sci. 2019, 10, 248. [Google Scholar] [CrossRef] [Green Version]
  19. Disney, M.I.; Boni Vicari, M.; Burt, A.; Calders, K.; Lewis, S.L.; Raumonen, P.; Wilkes, P. Weighing trees with lasers: Advances, challenges and opportunities. Interface Focus 2018, 8, 20170048. [Google Scholar] [CrossRef] [Green Version]
  20. Delagrange, S.; Jauvin, C.; Rochon, P. PypeTree: A tool for reconstructing tree perennial tissues from point clouds. Sensors 2014, 14, 4271–4289. [Google Scholar] [CrossRef] [Green Version]
  21. Brede, B.; Calders, K.; Lau, A.; Raumonen, P.; Bartholomeus, H.M.; Herold, M.; Kooistra, L. Non-destructive tree volume estimation through quantitative structure modelling: Comparing UAV laser scanning with terrestrial LIDAR. Remote Sens. Environ. 2019, 233, 111355. [Google Scholar] [CrossRef]
  22. Calders, K.; Newnham, G.; Burt, A.; Murphy, S.; Raumonen, P.; Herold, M.; Culvenor, D.; Avitabile, V.; Disney, M.; Armston, J.; et al. Nondestructive estimates of above-ground biomass using terrestrial laser scanning. Methods Ecol. Evol. 2014, 6, 198–208. [Google Scholar] [CrossRef]
  23. Åkerblom, M.; Raumonen, P.; Mäkipää, R.; Kaasalainen, M. Automatic tree species recognition with quantitative structure models. Remote Sens. Environ. 2017, 191, 1–12. [Google Scholar] [CrossRef]
  24. Raumonen, P. TreeQSM User’s Manual. 2019. Available online: https://github.com/InverseTampere/TreeQSM (accessed on 13 August 2020).
  25. Yang, J. Convergence and uncertainty analyses in Monte-Carlo based sensitivity analysis. Environ. Model. Softw. 2011, 26, 444–457. [Google Scholar] [CrossRef]
  26. Sobol’, I.M. On sensitivity estimation for nonlinear mathematical models. Mat. Modelirovanie 1990, 2, 112–118. [Google Scholar]
  27. Saltelli, A.; Tarantola, S.; Chan, K.P.-S. A Quantitative Model-Independent Method for Global Sensitivity Analysis of Model Outpu. Technometrics 1999, 41, 39–56. [Google Scholar] [CrossRef]
  28. Morris, M.D. Factorial Sampling Plans for Preliminary Computational Experiments. Technometrics 1991, 33, 161–174. [Google Scholar] [CrossRef]
  29. Helton, J.C. Uncertainty and sensitivity analysis techniques for use in performance assessment for radioactive waste disposal. Reliab. Eng. Syst. Saf. 1993, 42, 327–367. [Google Scholar] [CrossRef]
  30. Krishna Moorthy, S.M.; Raumonen, P.; Van den Bulcke, J.; Calders, K.; Verbeeck, H. Terrestrial laser scanning for non-destructive estimates of liana stem biomass. For. Ecol. Manag. 2020, 456, 117751. [Google Scholar] [CrossRef]
  31. Burt, A.P. New 3D Measurements of Forest Structure. Ph.D. Thesis, University College London, London, UK, 2017. [Google Scholar]
  32. Li, Z. Predicting Winter Wheat Yield and Quality by Integrating of Remote-Sensing Data and the weather forecast data into the DASSAT Model. Ph.D. Thesis, Zhejiang University, Hangzhou, China, 2016. [Google Scholar]
  33. Gonzalez de Tanago, J.; Lau, A.; Bartholomeus, H.; Herold, M.; Avitabile, V.; Raumonen, P.; Martius, C.; Goodman, R.C.; Disney, M.; Manuri, S.; et al. Estimation of above-ground biomass of large tropical trees with terrestrial LiDAR. Methods Ecol. Evol. 2017, 9, 223–234. [Google Scholar] [CrossRef] [Green Version]
  34. Marzulli, M.I.; Raumonen, P.; Greco, R.; Persia, M.; Tartarino, P. Estimating tree stem diameters and volume from smartphone photogrammetric point clouds. For. Int. J. For. Res. 2020, 93, 411–429. [Google Scholar] [CrossRef]
Figure 1. (A) Location of the orchard used in the study; (B) orchard boundary and backpack-LiDAR U-line data collection path and selected fruit tree samples.
Remotesensing 12 03592 g001
Figure 2. (A) Backpack-LiDAR; (B) point cloud of the whole orchard based on backpack-LiDAR; (C) point cloud of a single tree based on backpack-LiDAR; (D) terrestrial laser scanning (TLS); (E) point cloud stitching based on TLS; (F) point cloud of tree 6 based on TLS.
Remotesensing 12 03592 g002
Figure 3. Cobweb diagram of the value of parameters. The same broken line represents a group of parameter settings, and multiple colors represent multiple groups of parameters. This figure shows the process of parameter sampling for sensitivity analysis.
Remotesensing 12 03592 g003
Figure 4. Three different samples and their sensitivity index. (A) Branch length; (B) branch number.
Remotesensing 12 03592 g004
Figure 5. Uncertainty analysis of parameter PD2Min based on TLS. The best value of PD2Min is 0.6 cm for the TLS cloud point. PatchDiam1, PatchDiam2Min, and PatchDiam2Max are abbreviated as PD1, PD2Min, and PD2Max, respectively.
Remotesensing 12 03592 g005
Figure 6. Comparison of QSMs when the sensitive parameter PD2Min is set at different values. In this example, PD1 = 10 cm, PD2Max = 5 cm, Lycl = 3, FilRad = 3.5. (A) TLS point cloud of tree 6; (B) QSM when parameter PD2Min = 0.6 cm; (C) QSM when the parameter PD2Min = 0.3 cm; (D) QSM when the parameter PD2Min = 4 cm. The color of QSMs indicates the branch orders: Blue = trunk, Green = first-order branches, Red = second-order branches, etc.
Remotesensing 12 03592 g006
Figure 7. Uncertainty analysis of parameter PD2Min based on backpack-LiDAR. The best value of PD2Min is 1.2 cm for the backpack-LiDAR cloud point.
Remotesensing 12 03592 g007
Figure 8. Comparison of in situ measured branch information (length/number) with branch information from QSMs based on backpack-LiDAR. (A) Comparison of branch length and total length by branch grade; (B) comparison of branch number and total number by branch grade.
Remotesensing 12 03592 g008
Figure 9. Comparison of in situ measured branch information(length/number) of the first-order branch with first-order branch information from QSMs based on backpack-LiDAR. (A) Length; (B) number.
Remotesensing 12 03592 g009
Figure 10. The effect of point cloud sampling rate on the QSMs based on TLS; except for PD2Min, all other parameters are set to fixed values. (A) Original point cloud (number of points is 4,068,641); (B) when the sampling rate is 80%, the number of points is 3,254,912, PD2Min = 0.6 cm; (C) when the sampling rate is 50%, the number of points is 2,034,320, PD2Min = 0.6 cm; (D) when the sampling rate is 20%, the number of points is 856,116, PD2Min = 0.6 cm; (E) when the sampling rate is 10%, the number of points is 424,574, PD2Min = 0.6 cm; (F) when the sampling rate is 5%, the number of points is 247,076, PD2Min = 0.6 cm; (G) when the sampling rate is 2.5%, the number of points is 112,288, PD2Min = 1.1 cm; (H) when the sampling rate is 1.25%, the number of points is 54,659, PD2Min = 1.3 cm.
Remotesensing 12 03592 g010
Figure 11. Relative errors of a different number of point clouds. (A) Relative errors of branches length; (B) relative errors of branches number.
Remotesensing 12 03592 g011
Table 1. In situ measured branches information of sample fruit trees. (Length unit: m).
First-OrderSecond-OrderThird-OrderFourth-OrderTotal
TreesLengthNumberLengthNumberLengthNumberLengthNumberLengthNumber
117.3410109.24100210.6232776.0834413.28522
222.6612227.12316287.2275547.64167584.641250
321.041089.1875208.8430885.64144403.7537
422.3710256.93350259.4365515.3848554.111063
520.3911102.89140165.4638336.95149325.68683
630.4314250.58340288.1271029.8296595.951160
725.8511175.01247282.5472173.88262562.671267
825.679209.64313269.0566528.2788533.281078
921.169137.53214150.7536328.8481338.54668
1027.9813197.57391208.5662718.7963452.91094
Max30.4314256.93391288.1275585.64167595.951267
Min17.349102.8975150.7530815.3834338.54471
mean23.4910.9175.57248.6233.06551.444.13113.2476.48932.1
Table 2. In situ measured and quantitative structural models (QSMs) estimated branch information of tree 6 based on TLS. In represents in situ measured; Models represent estimated QSMs. The standard deviation of 50 attempts and relative error estimation of every order of branch information and total information. Std represents the standard deviation; R represents relative error. (unit of length: m).
-First-OrderSecond-OrderThird-OrderFourth-OrderTotal
-LengthNumberLengthNumberLengthNumberLengthNumberLengthNumber
In30.4314253.58340288.1271029.8296598.951160
Models32.6915.68211.11307.14184.87540.9662.87253.60507.071193.52
Std2.492.8111.2518.455.4125.047.5824.776.3447.66
R (%)7.4312.0016.759.6735.8423.81110.83164.1715.342.89
Table 3. The branch information for QSMs from down-sampling the point cloud. The TLS point cloud was down-sampled to 80%, 50%, 20%, 10%, 5%, 2.5%, and 1.25% of itself. (Length unit: m).
-First-OrderSecond-OrderThird-OrderFourth-OrderTotal
-LengthNumberLengthNumberLengthNumberLengthNumberLengthNumber
100%32.5615.27235.25314.47214.30574.1162.77216.15544.881149.17
80%32.4115.50234.69315.18208.69564.8163.86235.84543.151151.65
50%33.2315.48227.21310.83208.69536.4860.66229.10528.631150.60
20%33.4115.72222.47299.00192.93512.2754.62213.50527.791094.04
10%33.7216.10217.39300.97190.04487.1357.63193.72504.021047.48
5%32.6915.68211.11307.14184.87540.9662.87253.6507.071193.52
2.5%33.3716.5195.36273.12159.96424.6451.97181.92452.57944.82
1.25%14.025.4864.5967.54104.21167.587.12166.76334.63557.58
Publisher’s Note: MDPI stays neutral with regard to jurisdictional claims in published maps and institutional affiliations.

